are there measures to keep household debt from ... shedding debt until households and financial...
TRANSCRIPT

The IMF’s World Economic Outlook, Global Financial Stability Report, and Fiscal Monitor examine the legacy
of the crisis and how to secure stability and growth.
Read these essential IMF publications at www.elibrary.imf.org/page/fdip
Fiscal Monitor
World Economic and Financia l Surveys
I N T E R N A T I O N A L M O N E T A R Y F U N D
World Economic Outlook
World Economic and Financia l Surveys
I N T E R N A T I O N A L M O N E T A R Y F U N D
Global Financial Stability Report
World Economic and Financia l Surveys
I N T E R N A T I O N A L M O N E T A R Y F U N D
Staying the course to recovery
What drives commodity price shocks?
Can emerging economies continue their rapid growth?
Are there measures to keep household debt from constraining economic activity?What went wrong in the euro area?
How healthy are banks globally?
What’s the right mix between stimulus and fi scal consolidation?What’s the right mix between stimulus and fi scal consolidation?
Will the euro area crisis spill over to other areas?Will debt continue to rise?
How should we deal with the future costs of an aging population?
I N T E R N A T I O N A L M O N E T A R Y F U N D
IMFStayCourseAdF&D273x203bleedv3.indd 1 5/4/12 3:58 PM
FINANCE and DEVELOPMENT
I N T E R N A T I O N A L M O N E T A R Y F U N DI N T E R N A T I O N A L M O N E T A R Y F U N D
Tracking the global recovery
El-Erian on surpluses and deficits
Dirt on money laundering
June 2012 $8.00

Finance & Development A QUARTERLY PUBLICATION OF THE INTERNATIONAL MONETARY FUND June 2012 • Volume 49 • Number 2
FeaturesFive Years on 8 The Crisis and Beyond
Five years after the first rumblings in the U.S. mortgage market presaged the greatest global financial crisis since the 1930s, the global economy remains in distressJames L. Rowe, Jr.
10 Tracking the Global RecoveryMost emerging markets are doing fine, but most advanced economies are not and things seem unlikely to changeM. Ayhan Kose, Prakash Loungani, and Marco E. Terrones
14 Fixing the SystemAfter a burst of effort to reform financial regulation widely perceived as contributing to the global crisis, the pace has slowedLaura Kodres and Aditya Narain
17 Trade Policy: So Far So Good?There was no widespread resort to protectionism during the global crisis but there have been recent moves in that directionBernard Hoekman
20 Shedding DebtUntil households and financial institutions repair their balance sheets, recovery in many advanced economies will be haltingStijn Claessens
24 Bystanders at the CollapseEmerging markets and low-income countries weathered the global recession. Can they survive further shocks? Sarwat Jahan and Brad McDonald
27 Stable DisequilibriumPersistent, large payment surpluses and deficits threaten global long-term economic well-being and financial stabilityMohamed A. El-Erian
30 Commodities in BoomThe global economic crisis hurt commodity prices far less than in earlier recessions. The long-run outlook is murkier Thomas Helbling
also in this issue34 Going Green
Investment in environmentally friendly technologies is growing globallyLuc Eyraud and Benedict Clements
38 Dirty Money, Real PainMoney laundering harms innocent individuals but can also impose serious costs on national economiesPaul Ashin
subscribe online at www.imfbookstore.org/f&d
Finance & Development is published quarterly in English, Arabic, Chinese, French, Russian, and Spanish.English edition ISSN 0015-1947
eDitor-in-chieFJeremy Clift
managing eDitorMarina Primorac
senior eDitorsCamilla AndersenHyun-Sung KhangNatalie Ramírez-Djumena
online eDitorGlenn Gottselig
assistant eDitorsKhaled Abdel-KaderMaureen Burke
creative DirectorLuisa Menjivar
print/WeB proDuction specialistLijun Li
graphic artistSeemeen Hashem
social meDia managerSara Haddad
senior eDitorial assistantNiccole Braynen-Kimani
eDitorial assistantHarris Qureshi
aDvisors to the eDitorBas BakkerNicoletta BatiniHelge BergerTim CallenPaul CashinAdrienne CheastyAlfredo CuevasMarcello EstevãoDomenico Fanizza
© 2012 by the International Monetary Fund. All rights reserved. For permission to reproduce any F&D content, submit a request via online form (www.imf.org/external/terms.htm) or by e-mail to [email protected]. Permission for commercial purposes also available from the copyright clearance center (www.copyright.com) for a nominal fee.
Opinions expressed in articles and other materials are those of the authors; they do not necessarily reflect IMF policy.
subscriber services, changes of address, and advertising inquiriesIMF Publication ServicesFinance & DevelopmentPO Box 92780Washington, DC, 20090, USATelephone: (202) 623-7430Fax: (202) 623-7201E-mail: [email protected]
postmaster: send changes of address to Finance & Development, International Monetary Fund, PO Box 92780, Washington, DC, 20090, USA. Periodicals postage is paid at Washington, DC, and at additional mailing offices. The English edition is printed at Dartmouth Printing Company, Hanover, NH.
FD
James GordonThomas HelblingLaura KodresPaolo MauroGian Maria Milesi-FerrettiPaul MillsMartin MuhleisenUma RamakrishnanAbdelhak Senhadji
James L. Rowe, Jr. Simon Willson
Jacqueline DeslauriersLika Gueye
24
8
34

FROM THE eDitor
Finance & Development June 2012 1
FROM THE eDitor
42 Out of the ShadowsGovernments are wise to shrink their underground economy by improving institutions to build inclusive growthAnoop Singh, Sonali Jain-Chandra, and Adil Mohommad
48 More Jobs, Better JobsA rapid increase in south Asia’s labor force calls for cross-sectoral policy reforms to support continued growth of high-quality jobsKalpana Kochhar, Pradeep Mitra, and Reema Nayar
Departments2 letters to the editor4 people in economics Minder of the Gaps
Jeremy Clift profiles Laura D’Andrea Tyson, the first woman to head the U.S. Council of Economic Advisers
32 picture this Water for People
The global target for safe drinking water has been met but more than 780 million people still lack access to clean waterNatalie Ramírez-Djumena
46 Back to Basics What Are Money Markets?
They provide a means for lenders and borrowers
to satisfy their short-term financial needsRandall Dodd
52 straight talk Age of Austerity
Advanced economies face a harsh environment as they chart a course to balanced budgets and lower debtCarlo Cottarelli
54 Book reviews The Occupy Handbook, Janet Byrne (editor) End This Depression Now! Paul Krugman An Economist Gets Lunch, Tyler Cowen
57 Data spotlight G7 Borrowing from Abroad
As a share of GDP, the United Kingdom tops the listTamara Razin, Marcelo Dinenzon, and Martin McCanagha
Illustration: Cover, pp. 14, 20, 23, and 28, Seemeen Hashem/IMF; pp. 8–9, Lina Liberace.
Photography: p. 4, Richard Kalvar/Magnum Photos; p. 6, Joshua Roberts/AFP/Getty Images; p. 10, Dennis Frates/Aflo Relax/Corbis; p. 17, The Irish Image Collection/Design Pics/Corbis; p. 24, Sam Panthaky/AFP/Getty Images/ Newscom; p. 27, Pimco; p. 30, DPA/ZUMApress.com; p. 32, iStock; p. 33, Karen Kasmauski/Science Faction/Corbis; p. 34, Paul Souders/Corbis; p. 38, Thomas Peter/Reuters/Newscom; p. 43, Bishop Asare/EPA/Newscom; p. 48, Munir Uz Zaman/AFP/Getty Images; pp. 52, 54–56, Stephen Jaffe/IMF.
visit F&D ’s Facebook page: www.facebook.com/FinanceandDevelopment
read onl ine at www.imf.org/fandd
IT all began in the United States with dodgy mortgage-backed securities. From its first rumblings in mid-2007, it took a year for the global financial crisis to come to a head and for policymakers to truly realize what
they were facing. But when the U.S. government allowed the investment bank Lehman Brothers to go bankrupt on September 15, 2008, it created a tsunami, the repercussions of which we are still experiencing.
Five years after the start of what turned into the worst economic crisis since the Great Depression of the 1930s, the global economy remains in distress. Millions of people are out of work in parts of the world (especially young people, as we discussed in the March 2012 issue of F&D), imposing huge social strains on some countries.
This issue of F&D examines the world five years after the stirrings of the crisis. The evidence presents a complex and mixed picture for the future of the world economy.
The causes of the crisis were myriad and included inadequate financial regulation and balance sheets in disarray as financial institutions, households, and governments accumulated too much debt. Most of the excesses were confined to advanced economies, and only creative and massive policy interventions, especially in the United States, prevented a complete global
financial meltdown. Now, with the United States on the mend, the sovereign debt crisis in Europe continues to sap confidence.
Our collection of articles examines the crisis and beyond from different angles, including the steps being taken to fix the regulatory system and the impact on the innocent bystanders—the emerging markets and low-income coun-tries that weathered the global recession relatively well but are now vulnerable to further shocks. Mohamed El-Erian looks at the large global imbalances that remain in a danger-ous but stable (for now) disequilibrium.
In our “Straight Talk” column, Carlo Cottarelli advises a careful and nuanced approach to reining in debt that does not snuff out the growth needed to create jobs.
Also in this issue, we look at job creation in south Asia, access to safe drinking water, the growth of green investment, and the problems of money laundering and shadow econo-mies. We also profile Laura Tyson, the first woman to head the U.S. Council of Economic Advisers (under President Clinton), who stresses that, despite the drawbacks, greater global interdependence has brought huge benefits.
Jeremy CliftEditor-in-Chief
Five Years and counting . . .

2 Finance & Development June 2012
social spending in poor countriesWe read with great interest “Are the Critics Right?” (December 2011). The answer, it appears, is a resounding “no”: IMF programs do not hurt social spending in poor countries, but, rather, reinforce it by bolstering fiscal space. These find-ings echo those reported by the IEO [IMF Independent Evaluation Office] in their 2003 report on the same topic.
If correct, these findings are welcome news and sug-gest the IMF has learned from its prior mistakes. We state as much in a 2006 article published in International Organization that revisited the IEO report, and identified the 1997 Guidelines on Social Expenditures as a possible break-point in the effect of IMF programs (this claim is con-sistent with the IMF’s finding that “spending-to-GDP ratios have accelerated since 2000”). But you do not address our main finding: that IMF program effects differ by the recipient coun-try’s political regime type, and that the negative effect of IMF programs on social spending is particularly pronounced in developing democracies. Politics matters, and the IMF ignores this inexorable fact of social life to its own detriment.
Irfan NooruddinFellow, Woodrow Wilson International Center for Scholars,
Washington, D.C.
Joel W. SimmonsAssociate Professor, Department of Political Science,
The Ohio State University, Columbus, Ohio Assistant Professor, Department of Political Science,
University of Maryland, College Park, Maryland
letters TO THE EDITOR
The authors respond We agree with Professors Nooruddin and Simmons that politi-cal regimes can potentially affect social spending. Our results confirm that increases in social spending have been higher in low-income countries scoring higher on indices of democracy (see chart). At the same time, our results also indicate that increases in education and health spending as a share of GDP, as a share of government spending, and in real per capita terms have been higher in countries with IMF-supported programs.
We also assessed the effect of scores on democracy in our econometric model, using a formulation similar to that of the 2006 paper of Professors Nooruddin and Simmons that inter-acts the presence of an IMF program with an index score for democracy. The effect was statistically insignificant for educa-tion and health spending as a share of GDP and a share of gov-ernment spending, except for the effect on health as a share of GDP, where it was positive. Thus, our analysis does not suggest that IMF-supported programs lead to lower increases in spend-ing under democracies.
Masahiro Nozaki Benedict Clements
Sanjeev Gupta
Democracy countsCountries with an IMF-supported program that score high on democracy indices also tend to spend more on health and education, by several measures.
Source: IMF staff estimates.Note: The charts show the median annual change in education and health
spending during 1985–2009 and are based on the Polity IV scale of democratization which ranges from –10 to 10. Countries with values from –10 to –1 are classi�ed as low democracy and 0 to 10 as high democracy.
012345678
–10–505
101520
(median annual change, real per capita, percent)
(median annual change, real per capita, percent)
–0.10
–0.05
0
0.05
0.10
0.15
(median annual change, percent of GDP)
(median annual change, percent of GDP)
–0.20
–0.10
0
0.10
0.20
0.30
0.40
00.020.040.060.080.100.12
(median annual change, percent of total spending)
High democracy without program
Low democracy without program
High democracy with program Low democracy with program
(median annual change, percent of total spending)
HEALTH SPENDING
EDUCATION SPENDING
0.08 0.07 0.06 0.05 0.04 0.03 0.02 0.01
0–0.01
Finance & Development June 2012 3
a caution on credit ratingsPanayotis Gavras’s “Ratings Game” (March 2012) covers many inter-esting aspects, except for, unfor-tunately, what really constituted the fundamental mistake of Basel regulators when using the credit ratings when determining capital requirements for banks.
Banks already account for per-ceived risks, like those included in credit ratings, by means of the interest rates, the amounts exposed, and the other general terms. And so, when regulators set the capital requirements also based on the same perceptions, they are double-dipping into perceptions, causing what is offi-cially deemed as not risky to become even more attractive and what is officially deemed as risky to become even less attractive.
Any information, like risk-of-default information, becomes bad, even if it is perfect, if excessively considered.
The reason this has not been understood can perhaps be explained by the fact that almost everyone speaks about this crisis as a result of excessive risk-taking, even though the fact that all the problems are derived from excessive exposure to what was perceived as absolutely not risky—and that there is a lack of exposure to the officially “risky,” like to small busi-nesses and entrepreneurs—would indicate our being more in the presence of a regulatory-induced and perverse excessive risk-averseness.
When regulators decided to play the risk-managers for the world, they forgot or ignored the fact that all bank crises have always resulted from excessive exposures to what was consid-ered as safe, and never from excessive exposures to what ex ante was considered to be risky.
Per KurowskiFormer World Bank Executive Director (2002–04)
We welcome letters. Please send no more than 300 words to [email protected] or to the Editor-in-Chief, Finance & Development, International Monetary Fund, Washington, D.C., 20431, USA. Letters may be edited.
Dismal science?
Listen to our podcast interviews with top economic experts and decide: www.imf.org/podcasts
IMF

4 Finance & Development June 2012
LAURA TySON spends a lot of her time thinking about gaps and deficits—what’s not there, what’s missing: the jobs gap, the income gap, the education gap, the gender gap, and maybe the most disturbing
gap of all, the yawning U.S. fiscal deficit.She worries that the United States is losing its preemi-
nence, that the American dream of rising prosperity is get-ting tougher to realize.
“Even before the Great Recession, American workers and households were in trouble,” says Laura D’Andrea Tyson, professor of economics and business at the University of California, Berkeley, who has a number of firsts to her name. The first woman to chair the Council of Economic Advisers (under President Bill Clinton), she also was the first woman to head the London Business School, where she founded the school’s Center for Women in Business.
“The rate of job growth between 2000 and 2007 slowed to only half its level in the three previous decades. Productivity growth was strong, but far outpaced wage growth, and work-ers’ real hourly compensation declined, on average, hurting even those with a university education,” she says during an interval between teaching MBA students.
Tyson believes that protests against rising income inequality in the United States—where the top 1 percent of society are hugely wealthy compared with the bottom 99 percent—represent the new cause of our times. “It’s a
generational issue now for people from their mid-20s to mid-30s. They’re in that world, just like I was in the anti–Vietnam War movement.”
The protests that began as demonstrations against Wall Street bailouts and corruption have spiraled into “occupy” movements around the world, particularly in advanced economies.
Breaking glass ceilingsAn architect of Clinton’s domestic and international eco-nomic policy agenda during his first term, Tyson was the highest-ranking woman in the Clinton White House when she succeeded Robert Rubin as director of the National Economic Council from February 1995 to December 1996.
Clinton was attracted to Tyson’s advocacy of “aggressive unilateralism” on trade, which he found to be realistic and pragmatic. Her book Who’s Bashing Whom? Trade Conflict in High-Technology Industries, published in 1992, set the tone for how Clinton would negotiate with the Japanese on protectionist trade issues.
The problem, at the time, was the dramatic challenge Japan and Europe posed to the United States, particularly in high-tech manufacturing and exports.
Rejecting unfettered free trade, Tyson proposed expand-ing market access through tough negotiations on tariffs and barriers to trade, backed by a credible threat of retaliation against those who closed their markets to U.S. imports.
people IN ECONOMICS
minderof thegaps
Jeremy Clift profiles laura tyson, the first woman to head the U.S. Council of Economic Advisers
Tyson speaking at a gender symposium in Davos, Switzerland.

Finance & Development June 2012 5
applied economicsPresident Clinton, in his autobiography, My Life, says he chose Tyson as chair of the Council of Economic Advisers because she impressed him with her knowledge of technol-ogy, manufacturing, and trade, “the microeconomic issues I felt had been too long ignored in the making of national economic policy.”
Although she later won their respect, her appointment pro-voked an uproar among mainstream economists who openly challenged her credentials and analytical skills. “While econ-omists are often the butt of jokes, it’s rare for one to be the target of a public mugging by other economists,” noted the magazine Businessweek in February 1993.
But in some respects her combination of economic analy-sis with pointed and calculated political strategy was ahead of the times. Now at the Haas School of Business at Berkeley, Tyson still thrives on the cut and thrust of economic debate and political dissent, writing regular blogs and articles for magazines and newspapers, including the New York Times Economix blog and the Financial Times A-List.
“I teach a course on doing business in emerging markets,” says Tyson, who is married to screen writer Erik Tarloff, author of the novel Face-Time as well as episodes of the hit TV series M*A*S*H. He currently writes a blog for the Atlantic magazine. “I tell the class it’s half about strategy—I’m not a strategist, but I’ve been around; I’m on boards and I’ve run business schools, and I understand strategy—and half about economics.”
skepticism about marketsObviously the profession has moved on, but what academic economists were upset about, Businessweek said, was “that she is far more open than most economists to the idea of gov-ernment action.”
“We must not be hoodwinked by the soothing notion that, in the absence of U.S. intervention, the fate of America’s high-technology industries will be determined by market forces,” Tyson wrote in Who’s Bashing Whom? The magazine noted, “This skepticism about the invisible hand’s wisdom makes her persona non grata in a profession where belief in markets is imbibed with mother’s milk.”
Economist James Galbraith came to her defense. Writing in the liberal monthly magazine American Prospect in March 1993, he said she was careful and precise, and neither “polemical nor trendy.” The threat, he said, was to “profes-sional economists whose totemization of the market has pro-vided them with a ready-made policy platform. What will these people do, if their all-purpose formulas are no longer sufficient? Maybe the old boys really are threatened by this appointment.” (See Box 1.)
Worried about competitionIn her study of trade and employment with Berkeley profes-sor John Zysman, Tyson examined the causes of the 1980s decline in manufacturing employment in the United States and the general deterioration in the country’s international
competitive position, looking into the employment effects of trade in four industries—apparel, automobiles, semicon-ductors, and telecommunications equipment. Regularly cited factors such as the rising value of the dollar, protectionism, and slow growth in foreign markets were important. But she found that other factors, including the government’s adher-ence to a free trade policy when others played by a different set of rules, were relatively more significant.
“She persuaded Clinton and his economic advisers to embrace a variant of managed trade—trade agreements that established desired outcomes of trade rather than leaving the results to the free flow of goods—when seeking to promote the development and expansion of high-tech industries. This pol-icy was instrumental,” say James and Julianne Cicarelli in their book Distinguished Women Economists, “in the veritable explo-sion in the volume of international trade that took place in the late 1990s, propelling the U.S. economy into an unprecedented boom that can only be described as the perfect expansion.”
changing actorsToday, the actors may have changed, but many of the wor-ries are similar. Tyson is still concerned about faltering U.S. economic performance. But today the apprehension is more about China and other dynamic emerging markets, although Tyson is quick to point out that Clinton never faced anything
Box 1
economics: changing the paradigmThe global economic crisis has undermined economists’ belief in the infallibility of markets.
“The fundamental mistake was believing that individual rational actors would essentially discipline themselves,” says Tyson, reflecting on the global economic crisis during a visit to New york. “Now first of all, I said ‘rational,’ and we have all this evidence accumulating that individual actors are not always rational, and the economic models didn’t take account of that.
“And then the models basically said when you put all these individual decisions together, it will add up to some-thing that makes sense. But what you can see is if individu-als are behaving irrationally—then you add herd instincts to that—the system can actually go quite off the rails. And it went off the rails.
“Now economists realize that the efficiency of markets is questionable. We’ll look seriously at behavioral, predictable errors that people make. We will put more regulation in place because actually we don’t believe anymore that people will get it right themselves. They will respond to the rules and, therefore, we’d better think about what the rules are.
“So I think there really has been a significant shift in terms of thinking about market failure. Why do we assume that markets have complete information? They mostly don’t have, or if they have complete information, it’s overlooked by actors who aren’t paying attention. For either reason, we have to assume they can really end up in not optimal out-comes. So that’s a big, big change. I think it’s a huge change.”

6 Finance & Development June 2012
like the economic slowdown that confronts President Barack Obama. “The magnitude of the problem is very, very differ-ent and the [U.S.] political climate now is also worse.”
The world has become much more connected and interde-pendent, so that problems in one part of the world are now much more likely to affect other parts. “By most measures of interdependence, probably by all measures that you could come up with, the world is more interdependent,” she says.
“And that, to my mind, does mean that there is a need for more coordination, understanding and coordination, of finan-cial market policy and capital flows. We have a much more complex global finance system, and we haven’t figured out appropriately how to regulate it,” says Tyson, currently a senior advisor at the McKinsey Global Institute, Credit Suisse Research Institute, and The Rock Creek Group investment firm.
good mentorsTyson’s father was a second-generation Italian-American who fought in World War II. He was very goal oriented and pushed his children to achieve. Born in Bayonne, New Jersey, in 1947, Tyson graduated from Smith—a private women’s col-lege—summa cum laude and earned her Ph.D. in economics at the Massachusetts Institute of Technology in 1974, where she was mentored by Evsey Domar, a Russian-born economist who developed an important growth model and who kindled in Tyson an interest in Soviet-style command economies. Consulting for a period for the World Bank, she worked on the socialist economies of eastern Europe, partnering briefly with well-known Hungarian economist Béla Balassa, as well as with development economist Irma Adelman, at that time one of the highest-ranking women at the Bank. She taught economics at Princeton for three years, then shifted in 1978 to Berkeley, where she has been off and on since.
Her parents had advised her to study business. But “I was
one of these instant converts to economics after taking one course. I always saw it as a great tool for doing public policy, so I just stuck with it. And I think I made the right decision. I still like economics.”
One of the authors of the annual Global Gender Gap report, produced by the World Economic Forum, Tyson sees women making progress around the world—but slowly, and still lagging especially in political representation (see Box 2).
Her links to the Clintons and advocacy for women made her a natural supporter of Senator Hillary Clinton in her 2008 bid to win the Democratic nomination for president. She became a late convert to Obama’s cause after Clinton dropped out of the race that June.
Vocal in President Obama’s defense, she is also a member of his nonpartisan Council on Jobs and Competitiveness, which is chaired by General Electric CEO Jeffrey Immelt. The daunting goal of the council is to find new ways to pro-
Box 2
slow progress for womenThe Global Gender Gap report is an attempt to measure how women are doing around the world.
“We look at 135 countries in terms of political representation gaps; economic opportunity gaps; access to education or educa-tional performance gaps; and health care gaps,” says Tyson, who has promoted “affirmative search” as a way of advancing quali-fied women. “Since we started measuring in 2006, most coun-tries have made progress, particularly in education and health care. It’s in economic opportunities and political representation that women lag most. Around the world, women hold fewer than 20 percent of all national decision-making positions.”
“Our aim is to focus on whether the gap between women and men . . . has declined, rather than whether women are ‘win-ning’ the ‘battle of the sexes,’ ” says the report, coauthored with Ricardo Hausmann, director of the Center for International Development at Harvard University.
Stressing that the work is comparative rather than pre-scriptive, she says that the report has moved toward analyz-
ing best practices, for example how governments have tried to improve political representation or how companies have improved recruitment and retention of women. Tyson has a lot of experience and ideas in this field. She is on the boards of several companies, and in 2003 she was tapped by the British government to figure out how to improve diversity in corporate boardrooms.
She singles out the World Bank 2012 World Development Report on gender equality as particularly helpful at pulling together research on how gender affects development.
“One of the things I learned from this very sensible report is the extent to which access to credit for women is impor-tant,” she says. “We know that there’s a small-business problem in access to credit in general across societies at very different development levels, whether you’re a developed society or not. Then there are reasons why it turns out to be even worse for women, even harder for a small business that’s headed by a woman.”
U.S. President Bill Clinton after announcing Tyson will chair the National Economic Council.

Finance & Development June 2012 7
mote growth by investing in American business to encour-age hiring, to educate and train workers to compete globally, and to attract jobs and businesses to the United States.
Job polarizationGlobal interdependence, competition, and technological change, says Tyson—who was part of Obama’s Economic Recovery Advisory Board set up after the global economic crisis to help generate ideas and analysis to revive the U.S. economy—have led to the polarization of job opportunities in many advanced economies, with employment growth in high-wage professional, technical, and managerial occupations, as well as in low-wage food-service, personal-care, and protec-tive-service occupations.
By contrast, employment in middle-skill white-collar and blue-collar occupations fell, particularly in manufacturing. Hard-pressed American households cut way back on sav-ing, borrowed against their home equity, and increased their debt to maintain consumption. This in turn contributed to the housing and credit bubbles that burst in 2008, requiring painful deleveraging ever since.
She believes the United States is underinvesting in three major areas that help a country create and retain high-wage jobs: skills and training of the workforce, infrastructure, and research and development.
She points to recent studies by Michael Spence and Sandile Hlatshwayo and by David Autor about how tech-nological change and globalization are hollowing out job opportunities and depressing wage growth in the middle of the skill and occupational distributions, although she argues that it’s a dynamic process, with wages rising in countries that were once seen as attractive. “China may start to lose jobs to other countries.”
Global competition has bred rising income inequality in the United States, says Tyson, who serves on the boards of Morgan Stanley, AT&T, Silver Spring Networks, and CBRE Group, Inc. Three forces, she says, are behind the U.S. labor market’s adverse structural changes:• skill-biased technological change, which has automated
routine work while boosting demand for highly educated workers with at least a college degree;• global competition and the integration of labor markets
through trade and outsourcing, which have eliminated jobs and depressed wages; and• America’s declining competitiveness as an attractive
place to locate production and employment.The polarization of employment opportunities is also
happening elsewhere. But some countries, such as Germany, are doing something about it, while the United States is becoming a less attractive place to locate production and employment, according to a recent McKinsey study. One reason for the U.S. relative decline is the weaknesses of its education system, says Tyson, who is also on the boards of MIT and the Peterson Institute of International Economics. The United States, she says, has very uneven education attainment levels that are related to family income: children from poorer families find it difficult to go to college. In
addition, even as the education system is producing work-ers whose skills do not match those required for high-qual-ity jobs, immigration restrictions make it difficult to attract and retain foreign talent.
What to doThe United States has made several attempts to work out a response.
In its influential 2005 report, “Rising Above the Gathering Storm,” the National Academies warned that the U.S. com-petitive position in innovation was eroding and called for significant increases in government investment in research and development, education, and infrastructure to reverse this trend. Other countries took note, even borrowing ideas from the report, but in a sobering follow-up document, the National Academies concluded that the U.S. competitive position has continued to decline.
The widening U.S. fiscal deficit, coupled with the retirement of the baby boom generation, which puts extra pressure on pensions and health care, adds new complex-ity to tackling all these gaps at once and calls for some difficult choices.
“The challenge is daunting and inescapable,” says Tyson. “A plan to reduce the long-run deficit must be crafted both to address the growth deficit and to reverse the nation’s competitive decline at the same time. We must invest more in the foundations of innovation even as we spend less on most other government programs.”
But despite the drawbacks, the greater interdependence brings huge benefits overall, she argues.
“The world has had dramatic success in eradicating global poverty—there’s still a long way to go, but a lot of progress: dramatic success in technological breakthroughs; dramatic success in building a middle class for the world economy.
“All those things are great and that’s part of the interde-pendence, but the interdependence does mean that insta-bility in one place can move quickly to another place. The contagion effect is real, engulfing the world, and the prob-lem can happen very quickly. So that suggests the need for increased multilateral coordination.” ■Jeremy Clift is Editor-in-Chief of Finance & Development magazine.
References:Cicarelli, James, and Julianne Cicarelli, 2003, Distinguished Women
Economists (Westport, Connecticut: Praeger Publishers).Clinton, Bill, 2004, My Life (New York: Alfred Knopf Publishers).MySpace Journal, 2010, Interview with Laura Tyson. www.myspace.
com/video/vid/102580084#pm_cmp=vid_OEV_P_PTyson, Laura, 1992, Who’s Bashing Whom? Trade Conflict in
High-Technology Industries (Washington: Institute for International Economics).
———, W. Dickens, and John Zysman, eds., 1988, The Dynamics of Trade and Employment (Ballinger).
World Economic Forum, Global Gender Gap. www.weforum.org/issues/global-gender-gap

Five years after the first rumblings in the u.s. mortgage market presaged the greatest global financial crisis since the 1930s, the global economy remains in distress
8 Finance & Development June 2012
The and
Beyondcrisis

THE causes of the Great Recession were myriad and included inadequate financial regulation and balance sheets in disarray as financial institutions, households, and
governments accumulated too much debt. Most of the excesses were confined to advanced economies, and only creative and massive policy interventions, especially in the United States, prevented a complete global financial meltdown.
But recessions with their roots in financial crises are deeper, and recovery is slower and more tepid, than those not caused by financial collapse. Five years later, recovery in the United States is still weak and in Europe, where sovereign debt problems afflict several countries, a new slowdown threatens.
The Great Depression of the 1930s was wors-ened by widespread protectionism, as countries sought to shield domestic markets from imports but only succeeded in making things worse for all. This time, the Group of 20 advanced and emerg-ing market economies warned of such dangers and much overt protectionism was averted. But more subtle protectionism reared up in 2009 when global trade collapsed, subsided in 2010 as recov-ery began, but appears to be picking up again.
Unlike in earlier global downturns, emerging market and low-income economies were hurt less
and recovered sooner than their advanced coun-terparts in North America and Europe. Their good fortune was due in part to strong economic policies before the recession that prepared many to fight the downturns. It was also thanks to luck—commodity prices on which many rely remained relatively higher than in earlier recessions, these economies are less tied to their advanced coun-terparts than before, and their less-sophisticated financial systems had little of the high-risk debt that caused advanced financial markets to seize. But emerging and low-income economies may be less well prepared to deal with any new crises.
And risks abound. Rising oil and other com-modity prices threaten to make a recovery harder to sustain. Progress in reforming financial regula-tion is falling prey to resistance and inertia. And the global economic imbalances endure as some countries run large and persistent balance of pay-ments surpluses and others have big deficits.
This issue of F&D examines the world five years after the stirrings of the crisis. The evidence pres-ents a complex and mixed picture for the future of the world economy. ■
James L. Rowe, Jr. Finance & Development
Finance & Development June 2012 9

10 Finance & Development June 2012
THE world has experienced four global recessions since World War II—1975, 1982, 1991, and 2009. These were years in which the global
citizen’s average income fell—in the jargon of economists, world per capita gross domestic product (GDP) declined—and there was a broad decline in var-ious other measures of global economic activity. Each reces-sion led to fears of economic apocalypse, but each time the global economy recovered in a year or two.
The global recession of 2009, which followed a finan-cial market crisis caused by the failure of the investment banking firm Lehman Brothers the year before, was the deep-est of the four recessions and the most synchronized across countries. Some worried that the world would relive the Great Depression of the 1930s. Luckily, and through
often aggressive and unconventional policy actions, that did not come to pass. Since 2010, the global economy has been on a path of recovery, albeit a fragile one.
How different is the current global recov-ery from the earlier ones in the post–World
Source: IMF staff estimates.Note: Measured yearly, with zero denoting the trough of the recession.
–2 –1 0 1 2 3 4
Forecast
95
100
105
110
115
Current recovery Average of previous recoveries
Kose, Revised 4/17/12
Chart 1
On track In terms of global GDP per capita, recovery from the most recent downturn is proceeding faster than after the three previous recessions.(real GDP per capita indexed to 100 at the trough, weighted by purchasing power parity)
Tracking the Global
RecoveryM. Ayhan Kose, Prakash Loungani, and Marco E. Terrones
most emerging markets are doing fine, but most advanced economies are not and things seem unlikely to change

Finance & Development June 2012 11
War II period? How do prospects differ between advanced and emerging economies? And what are the risks to the global recovery?
on a slow track While arriving at a definition of a global recession takes some work (see box), defining a global recovery is easier. It is sim-ply the period of increasing economic activity that follows a global recession.
The slow path of economic recovery since 2010 has been quite similar to the path, on average, in the aftermath of the three other global recessions (see Chart 1). In fact, if the projections of average global income—world per capita real GDP—are realized, recovery from the Great Recession, as it is often called, will have been faster than after the three previ-ous global recessions.
But the path of global income masks a very critical differ-ence between advanced economies and emerging economies. The recovery in advanced economies has been very slug-gish compared with past recoveries (see Chart 2, left panel). Average income in some of these economies has not yet rebounded to its pre-recession level and is not forecast to do so even by 2014.
The weakness in income growth is reflected, on the spend-ing side, in both consumption and investment. Consumption has been held back as households return to safer debt-to-income levels (“deleverage”), and investment in structures has been weak in the aftermath of the housing boom in many advanced economies.
a faster paceIn sharp contrast to developments in advanced economies, average incomes in emerging economies are generally back on the fast track they were on before the Great Recession (see Chart 2, right panel). Income growth in these economies has already outpaced the growth seen during previous global recoveries, and is projected to continue to do so in coming
years. The robust growth is widely shared among emerging economies. Notable exceptions are the emerging European economies, which are on a recovery track similar to that in advanced economies.
World trade collapsed dramatically during the global recession of 2009 and was one of the reasons the recession evoked fears of another Great Depression and a resort to protectionist measures by governments seeking to shield domestic industries from foreign competition. But world trade has rebounded, and again the pace is quicker in the emerging economies than in advanced ones (see Chart 3). Vertical specialization, in which a number of coun-tries are involved in the production process of individual goods, may have restricted the use of traditional protec-tionist measures (see “Trade Policy: So Far So Good?” in this issue).
Equity markets have performed better on average during this recovery than in previous ones. This may be because corporations are increasingly operating globally. And global
M. Ayhan Kose, Prakash Loungani, and Marco E. Terrones
Kose, Revised 4/17/12
Chart 2
Two-speed rebound The recovery in advanced economies has been far more sluggish (left panel) than in emerging economies (right panel).(real GDP per capita indexed to 100 at the trough, weighted by purchasing power parity)
Source: IMF staff estimates.Note: Measured yearly, with zero denoting the trough of the recession.
–2 –1 0 1 2 3 4 –2 –1 0 1 2 3 4
Current recovery
95
100
105
110
115
90
100
110
120
130Advanced economies Emerging economies
Average of previous recoveries
Forecast
Forecast
global recessions and recoveries“We live in a global world” is one of the clichés of our time—the phrase gets more than 700,000 hits in a Google search. Surprisingly, though, there is no commonly accepted definition of a global recession to tell us when our economic world as a whole is off track. The definition of a global recession used here is as follows: a period of decline in world real per capita real GDP, accompanied by a broad decline in various other measures of global activity (such as industrial production, trade, capital flows, oil consumption, unemployment). These criteria pick out four global reces-sions in the post–World War II period: 1975, 1982, 1991, and 2009 (Kose, Loungani, and Terrones, 2009). Once these dates are established, the definition of a global recovery is easy: it is simply the period of increasing global activity fol-lowing a global recession.
Kose, Revised 4/18/12
Source: IMF staff estimates.Note: Measured yearly, with zero denoting the trough of the recession.
–2 –1 0 1 2 3 4 –2 –1 0 1 2 3 4
Advanced economies
Current recovery Average of previous recoveries
Chart 3
Trade returns International trade volume, which plummeted at the height of the recession, has rebounded—more in emerging economies (right panel) than in advanced economies (left panel).(trade volume indexed to 100 at the trough, trade weighted)
Forecast
Forecast
80
90
100
110
120
130
140
150
160
80
90
100
110
120
130
140Emerging economies

12 Finance & Development June 2012
activity as a whole—thanks to emerging market economies—has recovered better than after previous recessions.
Waiting for the jobs trainChanges in unemployment generally lag changes in income. At the onset of a recession, as demand falls, com-panies cut back on overtime and make other adjustments before they let go of workers. As the recovery begins, com-panies generally wait to see whether it is durable before hiring workers again.
Despite this lag, over the course of a year, changes in incomes and unemployment tend to move together very closely. This relationship—known as Okun’s Law after it was described in an article written 50 years ago by the economist Arthur Okun (1962)—held up well during the global recession of 2009.
Over the course of the recession, the unemployment rate increased in advanced economies by about 2 percentage points between 2006 and 2009. Consistent with the weak income growth in these economies, unemployment has fallen very slowly during the recovery. Even by 2014, the unemploy-ment rate in advanced economies is forecast to fall by less than 0.5 percentage points, that is, by less than a quarter of the increase during the recession (see Chart 4). In emerging econ-omies, in contrast, unemployment rates on average barely budged during the recession and are forecast to fall by 2014.
Among the advanced economies, the increase in unem-ployment varied a lot country by country during the reces-sion. Three factors account for this variation: the extent of growth (or lack thereof) in incomes, structural bottlenecks, and the impact of macroeconomic and labor market policies. Structural factors may have played a supporting role in some
countries, particularly where the collapse of the housing sec-tor was a major reason for the drop in output. And the role of policies, particularly labor market policies such as work-sharing, could be important in some specific cases, such as in explaining why Germany had a decline in unemployment. In Germany, employers receive subsidies to encourage them to retain workers but reduce their working hours and wages.
However, it was the growth factor that was by far the most important. Chart 5 shows that Spain, Ireland, Portugal, and the United States experienced the largest increases in the unemployment rate between 2007 and 2011. In Australia, Switzerland, Austria, Belgium, and Germany, however, unemployment barely increased—or even fell—over those years. These differences across coun-tries in their unemployment experience can be explained almost perfectly by the changes in income growth in those countries. In other words, Okun’s Law holds quite well (Ball, Leigh, and Loungani, forthcoming). This predomi-nant role of income growth in driving the labor market
explains why unemployment declines are expected to be rather slow in advanced economies.
is it ’92 all over again? Although the world economy has recovered and another Great Depression has been staved off, the recovery remains subject to risks. Financial turmoil in Europe is an obvious risk.
In this respect, the current recession and recovery in advanced economies share some features with the recession
and recovery in 1991–92. Both recessions are associated with a bust in credit and housing markets in key advanced econo-mies. In 1991, there were busts in credit and asset markets in the United States, the United Kingdom, Japan, and the Scandinavian countries. The recent recession was associated with severe problems in credit and housing markets in the United States and a number of other advanced economies, including Ireland, Spain, and the United Kingdom.
The path of income growth in advanced economies since 2010 is remarkably similar to that of the 1992 recovery. Both recoveries were slowed partly by challenges in Europe. The earlier recovery episode was shaped by downturns in many European economies during the 1992–93 crisis in the European Exchange Rate Mechanism, a precursor to the euro. Interest rates had to be raised during that period to defend the exchange rate arrangement, and several advanced European economies were forced to reduce their large fis-cal deficits. This suppressed economic activity and further depressed credit and housing markets in the region.
Sources: IMF, World Economic Outlook, April 2012; and IMF staff estimates.Note: Data for 2012–14 are forecasts.
Advanced economies Emerging economies–1.0
–0.5
0.0
0.5
1.0
1.5
2.0
2.52006–092009–14
Kose, Revised 4/17/12
Chart 4
In search of jobsThe unemployment rate rose dramatically in advanced economies and recovery is likely to continue to be slow. The rate fell in emerging economies.(change in unemployment rate, 2006–14)
Although the world economy has recovered and another Great Depression has been staved off, the recovery remains subject to risks.

Finance & Development June 2012 13
Currently, high risk premiums on sovereign debt are inflicting similar or even worse damage to fiscal balances and growth. In both cases, the lack of a timely, credible, and coordinated policy strategy heightened the financial tur-moil. There has been slow growth in domestic consumption and investment driven by the legacy of the financial crisis—households and companies with high levels of debt have scaled back their activities to reach safer levels of debt (see “Shedding Debt” in this issue).
Will oil shocks derail the recovery?Another risk to the global recovery comes from oil shocks—possible disruptions in oil supplies and the associated spikes in oil prices. These developments played a role in the global recession of 1975.
Since that time, oil-importing countries have taken numerous steps to reduce their vulnerability to oil shocks. They have increased the number of sources from which they import oil, making them less vulnerable to disrup-tions from any one source, and have used other sources such as natural gas and renewables—for example, solar and wind—to substitute for oil. In both advanced and emerging economies, there have been increases in energy efficiency; the amount of energy needed to generate a dol-lar of income has fallen steadily. And central banks have become much better at establishing an anchor for inflation expectations by communicating that oil price increases do not alter longer-run inflation prospects. Hence the public in many countries is much less fearful that oil prices will have inflationary consequences than was the case in the past. Increased oil prices no longer feed a wage-price spi-ral, as they did in the 1970s.
Nevertheless, while countries have built up some abil-ity to withstand oil shocks, they remain vulnerable to severe supply disruptions or to the uncertainty induced by extreme oil price volatility. Estimates suggest that a 60 per-
cent increase in the price of oil could reduce U.S. incomes by nearly 2 percent over a two-year period, with somewhat larger effects in Europe, Japan, and emerging economies in Asia (see Chart 6).
Fear of stallingThe ongoing global recovery is similar in various dimen-sions to previous episodes, but it also exhibits some sig-nificant differences. The divergence of fortunes of advanced and emerging market economies has been one of the most surprising outcomes of the current global recovery. Emerging markets have enjoyed their strongest rebound in activity and become the engine of world growth during this recovery. In contrast, the current recovery is predicted to be the weakest one of the postwar era for the advanced econo-mies. The trajectory of recovery in advanced economies has exhibited some parallels with that of the recovery in 1992: both the current and 1992 recoveries were hampered by the financial market problems in advanced European economies. Failure to resolve these problems can stall the recovery and make already tepid job prospects in advanced economies worse. The threat of oil shocks looms as another risk factor for global economic prospects. ■M. Ayhan Kose is Assistant to the Director, Prakash Loungani is an Advisor, and Marco E. Terrones is Assistant to the Direc-tor, all in the IMF’s Research Department.
References:Ball, Laurence, Daniel Leigh, and Prakash Loungani, forthcoming,
“Okun’s Law: Fit at 50?” IMF Working Paper (Washington: International Monetary Fund).
Kose, M. Ayhan, Prakash Loungani, and Marco E. Terrones, 2009, “Out of the Ballpark,” Finance & Development, Vol. 46, No. 2, pp. 25–28.
Okun, Arthur M., 1962, ‘‘Potential GNP: Its Measurement and Significance,” Proceedings of the Business and Economic Statistics Section of the American Statistical Association, pp. 89–104.
Kose, Revised 4/18/12
Source: Ball, Leigh, and Loungani (forthcoming).
Change in unemployment rate, 2007–11Expected change in unemployment rate from real GDP change
–4–202468
10121416
Spain
Irelan
d
Portu
gal
United
State
s
Denmark
New Ze
aland
United
King
dom
Italy
Cana
da
Swed
enFra
nce
Finlan
d
Netherl
andsJap
an
Norway
Austr
alia
Belgi
um
German
y
Switze
rlandAu
stria
Chart 5
Joined at the hipThe change in real (after in�ation) GDP explains nearly all of the change in the unemployment rate in advanced economies between 2007 and 2011.(percent)
Kose Revised 4/17/12Chart 6
Source: IMF staff estimates.
United States Euro area Japan Emerging Asia–2.5
–2.0
–1.5
–1.0
–0.5
0
Chart 6
Oil threatens recoveryA 60 percent increase in oil prices will seriously hurt economic output across the globe. (percent change in real GDP two years after price increase)

14 Finance & Development June 2012
after a burst of effort to reform financial regulation widely perceived as contributing to the global crisis, the pace has slowed
Laura Kodres and
Aditya Narain
WEAK financial regulation in advanced economies—regulation that was poorly designed, impractical, and
inconsistent across institutions and market segments, not to mention country by coun-try—was a significant contributor to the worst global economic crisis since the Great Depression.
Regulation was also perceived as too lax, with government authorities catering too much to the private sector in order to reduce costly adherence to rules. It is no surprise, then, that beginning in 2009, the policy agenda of the leaders of the Group of 20 (G20) advanced and emerging mar-ket economies has focused on financial regulation reform to help address the kind of systemwide risk and spillovers to other institutions, countries, and the real econ-omy that the crisis revealed.
There has been significant change since 2009 as a result of pressure on the multi-national Financial Stability Board to better coordinate global financial regulation as well as some regulatory revamping in the United States and Europe.
But five years after the first signs of the crisis occurred in the U.S. mortgage mar-ket, there is a sense that the initial burst of regulatory reform has slowed, partly because of the reformers’ fatigue and growing indif-ference among a citizenry more concerned about the economic aftereffects of sluggish growth and high unemployment than finan-cial regulation. The global financial industry has resisted too, aligning its position with studies that emphasize the cost of overregula-tion and the risk of unintended consequences of regulatory change. National authorities are under siege from their financial institutions, which are worried about the domestic effects of measures in other countries. Policymakers worry about a reversal of the gains from finan-cial globalization driven by some instances of divergent national implementation of the reform agenda. Against this backdrop, this article will take a look at what has been achieved and what remains to be tackled.
progressMuch has been achieved so far. With the leaders of the G20 taking a direct interest in financial reform during this crisis, there is
FiXingthesYstem
Finance & Development June 2012 15
an impetus for regulation as never before. The international architecture has been strengthened through an empowered Financial Stability Board with a mandate to coordinate the world’s regulatory response. The rules of the game have been so thoroughly rewritten that the current reform might well be termed “reregulation.”
A major achievement is the Basel III agreement to strengthen both the quality and quantity of capital. This agreement also introduces internationally agreed liquidity requirements (cash and securities that can be quickly and easily sold for cash). When fully implemented at the end of 2017, banks will have larger buffers to meet sudden stresses of the kind experienced in 2008, when lending between
banks virtually stopped and funding costs went through the roof. The new capital surcharge on so-called globally sys-temically important financial institutions is a nascent inter-national response to the risks of interconnectedness—that is, the effects that one institution may have on others due to their tangle of linked financial relationships and positions.
The notion in the U.S. Dodd-Frank Act that banks “too important to fail” should plan for their own demise is a sign that their internal complexity and the associated second-ary effects from interconnectedness are being taken seri-ously. These plans—the financial institution equivalent of a living will—aim to ensure that a failed institution can wind down its operations without disrupting the financial system. Progress has also been achieved in what was once considered the last frontier: international standards for resolution frame-works that make it easier to shut down financial institutions operating in more than one country.
heart of the crisisReregulation is also taking direct aim at certain types of activities that were at the heart of the crisis.
The so-called shadow banking system—where financial institutions perform activities generally associated with bank-ing but outside the bank regulatory system—is now center stage in a review of activities and institutions that may need to be within the purview of regulation—known as the regula-tory perimeter. Much of the activity at the heart of the global crisis occurred between the shadow system and the more formal banking system. U.S. broker-dealers, bank-sponsored special investment vehicles and conduits, money market mutual funds, hedge funds, and an assortment of financial institutions interacted to spawn a growing systemic mismatch between longer-term assets and the short-term liabilities that funded them. Some of the institutions had an unhealthy dependence on shorter-term deposit-like instruments that are traded in money markets rather than on traditional deposits. (See “What Are Money Markets?” in this issue of F&D.)
The shadow system was a large contributor to both the supply and demand for exotic and risky securitized prod-ucts, which triggered the financial meltdown in the United States. Securitizers pool loans (for example, mortgages, credit card balances, auto loans) that back securities sold to inves-tors. The principal and interest payments on the loans are used to pay the owners of the securities—usually in a tranche arrangement that gives different classes of investors differ-ent priority when it comes to payment. Low interest rates spurred investors to reach for the small additional yield these securities provided.
Regulations to make securitization safer have tackled many of its detected flaws. For example, originators must
now hold more of the products (or have “skin in the game”), which forces them to examine more carefully the underlying loans’ riskiness. New international accounting rules limit the ability of financial institutions to hold securitized assets in off-balance-sheet entities where insufficient capital could be held against them. The Dodd-Frank Act requires originators to be more transparent about the assets these products con-tain. Regulations now in effect in the United States and the European Union require credit rating agencies to pay more careful attention to how the products are rated.
Other forms of shadow banking are also under scrutiny by the Financial Stability Board and elsewhere to see whether they present the same potential for leverage and other risks that could harm the financial system.
one step removedEven bank activities that were one step removed from the crisis—for example, trading securities for themselves (not for customers) and bank-sponsored hedge funds—are viewed as too risky for those receiving government (that is, taxpayer) support as a backstop. The so-called Volcker rule in the United States and the Vickers report in the United Kingdom advocate separation of traditional consumer banking activi-ties—collecting deposits and making loans—from riskier banking activities that might put a bank at risk for taxpayer support. Most of the affected banks have pushed back, since these initiatives, if fully implemented, would likely lower shareholder returns.
While most regulations aim at ensuring the health of insti-tutions, others address dysfunction in the financial market overall. These include efforts to move settlement of deriva-tives contracts bilaterally traded over the counter to central counterparties (CCPs). When enough such contracts are settled within a CCP, rather than directly between the two trading parties, risk is lowered because the central counter-party can offset multiple contracts’ cash flows to buyers and sellers. Of course, if multiple CCPs crop up (as is happen-
National authorities are under siege from their financial institutions, which are worried about the domestic effects of measures in other countries.

16 Finance & Development June 2012
ing) the multilateral netting benefits are lower and more resources are needed to ensure the safety of this key piece of the financial infrastructure.
The repurchase (repo) market—where institutions sell securities they own to obtain short-term funds with a promise to buy them back in the near future—is also receiv-ing attention. If such funding mechanisms suddenly dry up or become prohibitively expensive, some institutions that rely on them can suffer a debilitating shortage of needed cash. Collection and publication of information about the cost of repos (the haircuts applied to the face value of the underlying collateral) and the types of acceptable collateral should help ground the market. Despite much attention to the repo market, recent working groups (such as one coor-dinated by the Bank for International Settlements and the New york Federal Reserve Bank) have been unable to push reforms forward.
Progress has also been made in addressing systemic risk through macroprudential policies, which recognize that keeping individual financial institutions healthy is not enough to guarantee the soundness of the overall system. (See “Protecting the Whole” in the March 2012 issue of F&D.) More holistic macroprudential approaches deal with some of the underlying phenomena that cause credit and leverage to amplify the ups and downs of the business cycle. They also identify the interconnectedness of institutions and markets to explain why a problem in one institution or market can quickly affect others. Early efforts to address the more systemic problems include the Basel III countercycli-cal capital buffer—which requires institutions to increase their capital in good times to enable them to better handle bad times—and the more recently agreed capital surcharge on globally systemically important financial institutions.
more to doWhile much thought has been given to what to do, the fin-ish line remains some distance away. Indeed, some areas, such as the meshing of transatlantic accounting stan-dards into one global standard, have been slow to change. Furthermore, three years after the leaders of the world com-mitted to the reform agenda, countries have yet to begin implementation of some of its key elements—such as poli-cies to deal with systemic liquidity risk.
To some extent this is by design, because implementation was to be phased in to mitigate the impact on both industry and the overall economy. Still, lagged implementation means that the world remains exposed to a replay of the same risks that froze the financial markets only three years ago.
In addition, reforms face two key hurdles—pushback against what has already been agreed and inadequate implementation.
Pushback against agreed reforms initially came from the financial industry as the first phase of the crisis ebbed, but now some national authorities are resisting as they strug-gle to cope with slow recovery during the second phase of the crisis. The enhanced capital and liquidity require-
ments accepted by a committee of regulators from around the globe—Basel III—have yet to kick in, though some minor improvements have been established as Basel 2.5. Nonetheless, the Basel III rules are being blamed for the ongoing bank deleveraging (shedding of assets) and slow-down in credit growth. Finger pointing across countries has also begun, alleging that some have engaged in com-petitive manipulation—for example by failing to adhere to agreed timelines.
The result of inadequate implementation can be seen in several areas. Provision of the resources needed to strengthen the supervision of proper regulation enforce-ment has received little attention. Regulatory arbitrage—investors’ exploitation of different prices in different markets resulting from different rules or regulations—is rearing its head. Attention has only just begun to identify ways that supervisory capacity in general and its autonomy, mandate, resources, authority, and techniques in particu-lar can be beefed up to ensure even implementation across institutions, markets, and countries. Still, supervisory autonomy is unlikely to obtain the status of central bank independence anytime soon, and supervisors will continue to face both industry lobbies and government pressure as they struggle to influence the incentives faced by institu-tions too important to fail—which show little inclination to reduce their size or scope.
Difficult pathRegulatory reform efforts may have slowed, but there has
been progress. The relatively low-hanging fruit has been picked, and the harder, more exacting, job of addressing tougher problems lies ahead. On the still-to-do list are• identifying and building tools—still in the early stages
of development—to mitigate systemic risk;• improving the ability of the authorities to deal with the
aftermath if the tools designed to prevent systemic events fail; and• providing a framework for financial intermediation
(the transfer of savings to investments) to assist in strong and stable economic growth, without overly prescriptive regulation.
Continued financial distress in some parts of the world, notably Europe, is hindering progress, particularly because of additional problems that affect reform of the regulatory regime when a sovereign government’s ability to backstop the financial system is potentially compromised.
Nevertheless, forward momentum cannot be lost, because failing to address the most difficult questions will undoubtedly affect future global financial stability. Clarity about the end point is necessary to build confidence about the future—confidence that is sorely lacking in the current environment. ■Laura Kodres is Assistant Director and Aditya Narain is a Division Chief in the IMF’s Monetary and Capital Markets Department.

Finance & Development June 2012 17
THE sharp collapse in international trade between the second quar-ter of 2008 and the third quarter of 2009 was the steepest decline
ever recorded, even sharper than during the Great Depression of the 1930s. But unlike in the Great Depression, during the 2008 global economic crisis and its recessionary aftermath there was no widespread resort to protection-ism by countries seeking to shield their indus-tries at the expense of their neighbors.
Instead, monetary and fiscal stimulus programs—including support for specific industries such as automobile manufactur-ing—helped demand recover and led global trade to bounce back rapidly (see Chart 1). Chief among the factors that help explain both the depth of the collapse in trade and the rapid recovery are the international supply chains—which link many countries together in the production process and have been supported by the steady liberalization of trade in the past few decades. The emergence of a multipolar world economy, with demand in major emerging markets, especially China, helped revive trade.
But even if the overall level of protection did not increase substantially during 2008–11,
many measures were imposed that discrimi-nate against foreign suppliers, and there is evidence that protectionist pressures are growing, in part in response to appreciating real exchange rates in commodity-exporting nations and concerns regarding the impact of monetary expansion by advanced economies.
active use of trade policyDeveloping economies, especially larger emerging markets, were among the most active users of trade policy. According to monitoring reports issued by the World Trade Organization (WTO), 1,243 trade measures were imposed between the onset of the crisis in late 2008 and the end of the fourth quarter of 2011. About three-quarters of these restricted trade, while one-quarter reduced the level of import protection. The Global Trade Alert (GTA), a network of think tanks and institutes that collect information on trade measures, covers a larger spectrum of actions that may affect trade and reports 1,593 actions between November 2008 and November 2011, of which 1,187 discrimi-nated against foreign suppliers and 406 were liberalizing. Policies were not monitored comprehensively prior to 2008, making it
there was no widespread resort to protectionism during the global crisis but there have been recent moves in that direction
trade policySo Far SogooD?Bernard Hoekman
Finance & Development June 2012 17

18 Finance & Development June 2012
impossible to say to what extent these measures constitute an overall increase in trade policy activism.
The number of new protectionist actions peaked in the first quarter of 2009 and bottomed in the third quarter of 2010. However, recent GTA data suggest that protectionist measures are increasing again; protectionist actions in the third quarter of 2011 alone were as high as in the worst peri-ods of 2009 (Evenett, 2011).
The Group of 20 (G20) advanced and emerging econo-mies account for most of the trade measures, most of which did not involve tariffs, imposed since 2008. There has been no significant increase in the overall use of tariffs or tempo-rary trade barriers, such as antidumping measures, aimed at assisting local firms injured by import competition (Bown, 2011). Such measures affected only about 2 percent of world trade (Kee, Neagu, and Nicita, 2010; WTO, 2011). The trend of gradual tariff liberalization observed since the mid-1990s has not been affected (see Chart 2).
Although the overall incidence of tariff measures has been limited, many countries have used nontariff measures, such as restrictive import licensing and local content requirements, that may have a greater impact. Henn and McDonald (2011) conclude that trade flows affected by restrictions decreased by between 5 and 8 percent relative to trade flows of the same product among partners unaffected by protectionist mea-sures. At the same time, many countries undertook liberal-izing trade policies and general fiscal and monetary stimulus measures that helped generate demand for imports.
changes in responsesCountries can be grouped into trade policy activists and those that refrained from using trade policies. Active users—includ-ing such major countries as Brazil, China, and India—tend to pursue a mix of trade-restricting and trade-liberalizing actions. This helps explain why there was no significant over-all net increase in levels of border protection and only a small overall impact on global trade. Instead of traditional trade pol-icy instruments, major advanced economies such as those in the European Union and the United States relied much more
on providing financial support to domestic industries. Because such support targets domestic firms, it can have a protection-ist effect. The size of the associated distortions to international competition is not known, however. The extent of such sup-port measures is much smaller today than it was immediately following the onset of the global economic crisis.
Production of manufactured goods is increasingly orga-nized through global chains, with goods processed (value added) in multiple countries that are part of the chain. Plants in each country specialize in a specific process that culmi-nates in a final product. This overall process, often called ver-tical specialization, means that a significant share of the price of an export likely reflects the value of a product’s imported inputs. For the world as a whole, the import content of exports has been estimated to be about 30 percent (Daudin, Rifflart, and Schweisguth, 2011).
Gawande, Hoekman, and Cui (2011) show that the inten-sity of vertical specialization helps explain the stable or declining tariffs in 2009:• Higher tariffs are a tax on downstream processing parts
of the chain, so importing governments have an incentive to keep tariffs low.• Trading partners want countries producing the inputs
they use to keep trade costs low—including through low or zero tariffs. This benefits the exporting countries that are further down the chain and those that produce the inputs through higher overall exports (sales of the final product). • Countries that are members of deep free trade agree-
ments—such as Mexico (the North American Free Trade Agreement) and Turkey (a customs union with the European Union)—or that have bound their tariffs in the WTO, such as China, were much more constrained in their use of tariffs than were other countries.
These findings do not mean that governments do not face pressure to assist domestic firms and industries. What they do
Hoekman, Revised 4/18/12
Chart 1
Bounce back Global trade collapsed in late 2008, but rebounded quickly and has held its own since late 2009.(goods, export volume, quarter-to-quarter percent change, seasonally adjusted)
Source: Datt, Hoekman, and Malouche (2011).
2008 2009 2010 2011–15
–10
–5
0
5
10
15
High-income countriesLow-income countriesMiddle-income countries
Hoekman, Revised 4/19/12
Chart 2
Lower levies There has been no overall increase in tariffs (taxes on imports) during the global economic crisis. (percent)
Sources: World Bank, World Integrated Trade Solution database; and Organization for Economic Cooperation and Development.
Note: Tariff data are missing for Russia, 1998–2000; Saudi Arabia, 1996–98, 2010; India, 2010; European Union, 2010; South Africa, 1998.
1996 98 2000 02 04 06 08 1002468
101214161820
Average G20 tariffAverage tariff of G20 in manufacturingAverage tariff of G20 high-income countries
Average tariff of G20 in agricultureAverage tariff of G20 middle-
income countries

Finance & Development June 2012 19
mean is that incentives to use traditional trade policies such as tariffs differ across countries and regions. Some parts of the world—Europe, North America, and much of east Asia—are so interconnected and integrated that trade policy no longer is a very useful tool to assist domestic industries, even in the face of a massive external demand shock. This also explains the widespread use of financial support measures in the European Union and United States. But other regions—parts of Latin America and sub-Saharan Africa—are much less integrated
into international value chains, so their governments may support the use of trade policy instruments to shelter domes-tic industries from foreign competition.
cloudy horizonThere are two clouds on the trade policy horizon. The first is the increasing use of measures to protect manufacturing activities in countries such as Brazil that are less integrated into global value chains and that have experienced appre-ciating real exchange rates. The second is the increasing prevalence of measures to restrict the exports of agricul-tural products and natural resources—which hurts trading partners. In both cases governments tend to use nontariff measures—such as subsidies, import and export bans, dis-criminatory public procurement policies, and increased licensing or product inspection requirements—which are generally less transparent than tariffs and often generate greater distortions.
WTO and GTA data suggest that a little less than half of all nontariff measures imposed since 2008 are quantitative. About one-third have been imposed on exports (WTO, 2011). The objective of such measures is generally to lower domestic prices to the benefit of households (in the case of food products) and local industries that process the materi-als. China, for example, has imposed restrictions on exports of certain minerals and raw materials.
The number of “buy national” measures (including local content and national preference incentives) increased signifi-cantly in 2011, especially in emerging market G20 members. Russia, for example, has imposed import quotas and local content requirements on food items and automobiles. Brazil increased taxes on motor vehicles with less than 65 percent local content that do not originate in Mercosur (Brazil’s com-mon market with Argentina, Paraguay, and Uruguay). Brazil also recently renegotiated a trade agreement with Mexico to impose a quota on the value of permitted exports of cars to Brazil for a three-year period and has indicated that it may raise tariffs on selected products. Argentina has increased the use of nonautomatic import licensing, a process under which import approvals are discretionary. (WTO rules require a
decision within 60 days.) Argentina also introduced refer-ence prices for many imported products and now conditions import authorization for some goods on offsetting exports. Indonesia also introduced nonautomatic licensing require-ments for imports of household appliances, textiles, footwear, and certain food products, some of which may be imported only through designated seaports.
The recent trend is worrisome. Protectionist measures divert attention from the underlying local cost factors that
make it difficult for industries to compete, and prevent rather than support vertical specialization, which has proven to be a driver of growth in east Asia, eastern Europe, and Mexico. Although the pressures generating protectionist actions in a number of emerging markets are in part the result of mac-roeconomic policies implemented by other countries, raising the level of trade protection will hurt both the countries that impose the measures and their trading partners, reducing growth prospects overall at a time when the world economy needs to generate and sustain higher growth. ■Bernard Hoekman is Director of the International Trade Department at the World Bank.
This article draws on “Taking Stock of Trade Protectionism Since 2008,” by Mohini Datt, Bernard Hoekman, and Mariem Malouche, published by the World Bank in the December 2011 issue of Economic Premise.
References:Bown, Chad, ed., 2011, The Great Recession and Import Protection:
The Role of Temporary Trade Barriers (Washington: Center for Economic Policy Research and World Bank). See also www.voxeu.org/index.php?q=node/6914
Daudin, Guillaume, Christine Rifflart, and Danielle Schweisguth, 2011, “Who Produces for Whom in the World Economy?” Canadian Journal of Economics, Vol. 44, No. 4, pp. 1403–37.
Evenett, Simon, 2011, Resolve Falters as Global Prospects Weaken: The 9th GTA Report (London: Center for Economic Policy Research).
Gawande, Kishore, Bernard Hoekman, and Yue Cui, 2011, “Determinants of Trade Policy Responses to the 2008 Financial Crisis,” Policy Research Working Paper 5862 (Washington: World Bank).
Henn, Christian, and Brad McDonald, 2011, “Protectionist Responses to the Crisis: Damage Observed in Product-Level Trade,” IMF Working Paper 11/139 (Washington: International Monetary Fund).
Kee, Hiau Looi, Cristina Neagu, and Alessandro Nicita, 2010, “Is protectionism on the Rise? Assessing National Trade Policies during the Crisis of 2008,” Policy Research Working Paper 5274 (Washington: World Bank).
World Trade Organization (WTO), 2011, Report on G-20 Trade Measures (Geneva).
Production of manufactured goods is increasingly organized through global chains, with goods processed (value added) in multiple countries.

20 Finance & Development June 2012
GOING down a mountain is usu-ally easier than going up. But finance seems to work differently from the law of gravity. Reducing
debt, that is, “deleveraging,” has proven to be a much harder slog than the climb up the debt mountain. This is why balance sheet recessions, like the one many advanced economies recently suffered, are much worse than recessions in which balance sheets are not overloaded with unsustainable debts (see “Tracking the Global Recovery” in this issue of F&D).
Until financial institutions, households, and governments in advanced economies return their balance sheets to sustainable lev-els of assets and debt, recovery from the worst
global economic downturn since the Great Depression of the 1930s will be retarded.
At issue is why deleveraging is so hard, what governments can do to help, how far the world has come in shedding debt, and what policies for the future are best.
origins of the crisis Most financial crises involve too much bor-rowing. Who does the excess borrowing, though, varies. In the past, it was often gov-ernments or corporations that borrowed too much. Before the recent crisis, it was finan-cial institutions and households in advanced economies, as well as some governments, that took on too much debt.
Financial corporations in some key advanced economies registered the sharpest increase in debt. Before the crisis, their bal-ance sheets multiplied relative to the total
size of their underlying economies (see Chart 1, top panel). The debt-to-equity ratio (leverage) of finan-cial institutions also often rose
Shedding
until households and financial institutions repair their balance sheets, recovery in many advanced economies will be halting
Stijn Claessens
DEBT
20 Finance & Development June 2012

Finance & Development June 2012 21
sharply (see Chart 1, bottom panel). Notable examples were some of the large U.S. investment banks and European uni-versal banks that saw their leverage increase to 30 times equity, many times higher than in earlier periods.
Households registered large increases in debt too, often driven by borrowing for housing and consumption. Chart 2 (top panel) shows that almost all advanced economies expe-rienced a sharp rise in household debt-to-disposable-income ratios in the years before the crisis. But because of concurrent booms in both house and stock prices, the borrowing did not translate into measured increases in aggregate balance sheet leverage; household debt relative to assets held broadly stable (Chart 2, bottom panel). But that seemingly auspicious mea-sure masked the growing exposure of households to a sharp fall in asset prices, especially house prices. And, importantly, it also masked the wide distribution of exposures among households. Because those with positive asset positions tend to be net savers and those with negative asset positions tend to spend relatively more, deleveraging occurs more often among those more likely to consume and has a dispropor-tionate effect on aggregate demand.
In contrast to some previous crises, leverage (debt to equity) in the nonfinancial corporate sector did not increase much and in some countries even declined compared with earlier periods (Chart 3). Corporations generally maintained conservative balance sheets and often actually increased their cash positions, which made their net debt—liabilities minus financial assets—decline.
Why is deleveraging so hard?When the crisis hit and asset prices declined, net worth fell sharply. Households and financial institutions were forced to lower their indebtedness. This downward path was harder than the way up because it takes time to shed debt and not everyone can, or should, do it at the same time.
That deleveraging takes time is best seen from the perspec-tive of a household. It can take several years to save enough money to make the down payment for a first house. But once they own a house, households can borrow multiples of their income. In good times, households can benefit from rising house prices and experience an even sharper increase in net worth. But a house price decline can make the loan exceed
Classens, 4/19/12
Chart 1
Piling on debt As a percent of GDP, debt on �nancial institutions’ books in many advanced economies grew dramatically.(debt as percent of home country GDP)
Leverage (the ratio of �nancial assets to equity) rose sharply as well.(ratio of �nancial assets to equity)
Source: IMF staff calculations.
United States
Japan
Germany
France
Italy
United Kingdom
Canada
Belgium
Netherlands
Sweden
Switzerland
Euro area
0 100 200 300 400 500 600 700 800 900 1000
United StatesJapan
GermanyFrance
ItalyUnited Kingdom
CanadaBelgium
NetherlandsSweden
SwitzerlandEuro area
0 5 10 15 20 25 30 35
Preboom level, 2000Precrisis level, 20072011, Q3
Preboom level, 2000Precrisis level, 20072011, Q3
Classens, 4/19/12
Chart 2
Consumers gorge Households registered large increases in debt relative to their disposable income, driven by borrowing for houses and consumption.(household debt as percent of disposable income)
But because of the housing and stock price booms, household net worth remained high until the crisis when prices fell, net worth tumbled, and debt grew.(debt as percent of household net worth)
United StatesJapan
GermanyFrance
ItalyUnited Kingdom
CanadaBelgium
NetherlandsSweden
SwitzerlandEuro area
0 50 100 150 200 250 300 350
Source: IMF staff calculations.Note: Data on ratio of debt to net worth are unavailable for Belgium.
United StatesJapan
GermanyFrance
ItalyUnited Kingdom
CanadaNetherlands
SwedenSwitzerland
Euro area
0 5 10 15 20 25 30 35 40
Preboom level, 2000Precrisis level, 20072011, Q3
Preboom level, 2000Precrisis level, 20072011, Q3
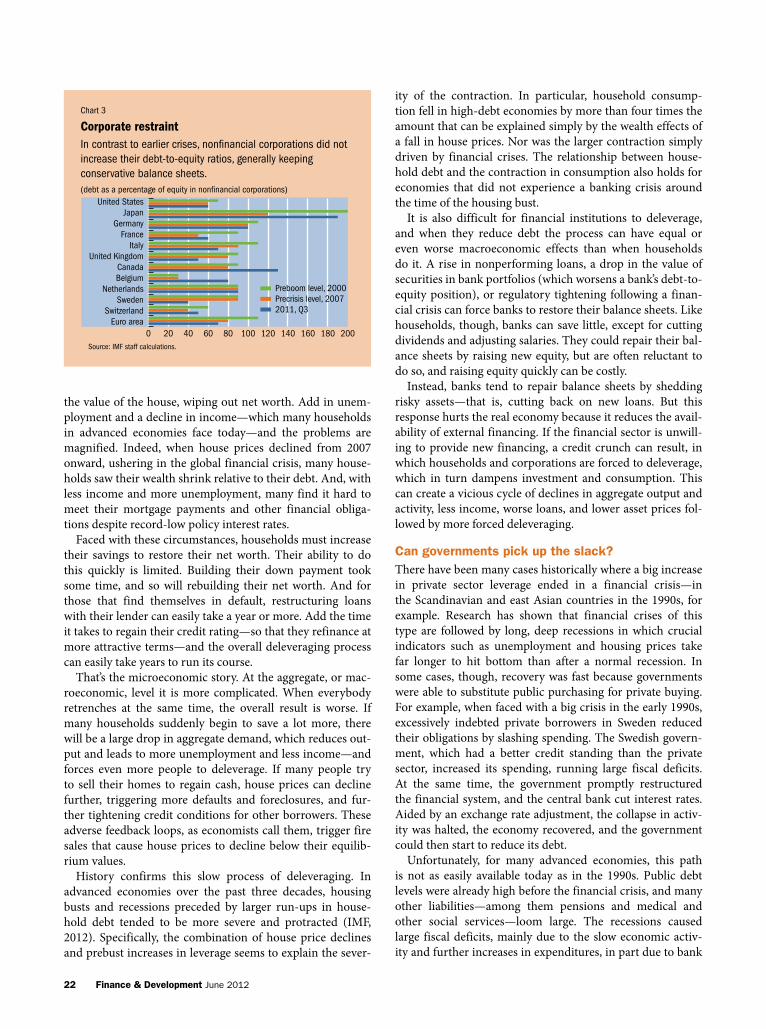
22 Finance & Development June 2012
the value of the house, wiping out net worth. Add in unem-ployment and a decline in income—which many households in advanced economies face today—and the problems are magnified. Indeed, when house prices declined from 2007 onward, ushering in the global financial crisis, many house-holds saw their wealth shrink relative to their debt. And, with less income and more unemployment, many find it hard to meet their mortgage payments and other financial obliga-tions despite record-low policy interest rates.
Faced with these circumstances, households must increase their savings to restore their net worth. Their ability to do this quickly is limited. Building their down payment took some time, and so will rebuilding their net worth. And for those that find themselves in default, restructuring loans with their lender can easily take a year or more. Add the time it takes to regain their credit rating—so that they refinance at more attractive terms—and the overall deleveraging process can easily take years to run its course.
That’s the microeconomic story. At the aggregate, or mac-roeconomic, level it is more complicated. When everybody retrenches at the same time, the overall result is worse. If many households suddenly begin to save a lot more, there will be a large drop in aggregate demand, which reduces out-put and leads to more unemployment and less income—and forces even more people to deleverage. If many people try to sell their homes to regain cash, house prices can decline further, triggering more defaults and foreclosures, and fur-ther tightening credit conditions for other borrowers. These adverse feedback loops, as economists call them, trigger fire sales that cause house prices to decline below their equilib-rium values.
History confirms this slow process of deleveraging. In advanced economies over the past three decades, housing busts and recessions preceded by larger run-ups in house-hold debt tended to be more severe and protracted (IMF, 2012). Specifically, the combination of house price declines and prebust increases in leverage seems to explain the sever-
ity of the contraction. In particular, household consump-tion fell in high-debt economies by more than four times the amount that can be explained simply by the wealth effects of a fall in house prices. Nor was the larger contraction simply driven by financial crises. The relationship between house-hold debt and the contraction in consumption also holds for economies that did not experience a banking crisis around the time of the housing bust.
It is also difficult for financial institutions to deleverage, and when they reduce debt the process can have equal or even worse macroeconomic effects than when households do it. A rise in nonperforming loans, a drop in the value of securities in bank portfolios (which worsens a bank’s debt-to-equity position), or regulatory tightening following a finan-cial crisis can force banks to restore their balance sheets. Like households, though, banks can save little, except for cutting dividends and adjusting salaries. They could repair their bal-ance sheets by raising new equity, but are often reluctant to do so, and raising equity quickly can be costly.
Instead, banks tend to repair balance sheets by shedding risky assets—that is, cutting back on new loans. But this response hurts the real economy because it reduces the avail-ability of external financing. If the financial sector is unwill-ing to provide new financing, a credit crunch can result, in which households and corporations are forced to deleverage, which in turn dampens investment and consumption. This can create a vicious cycle of declines in aggregate output and activity, less income, worse loans, and lower asset prices fol-lowed by more forced deleveraging.
can governments pick up the slack?There have been many cases historically where a big increase in private sector leverage ended in a financial crisis—in the Scandinavian and east Asian countries in the 1990s, for example. Research has shown that financial crises of this type are followed by long, deep recessions in which crucial indicators such as unemployment and housing prices take far longer to hit bottom than after a normal recession. In some cases, though, recovery was fast because governments were able to substitute public purchasing for private buying. For example, when faced with a big crisis in the early 1990s, excessively indebted private borrowers in Sweden reduced their obligations by slashing spending. The Swedish govern-ment, which had a better credit standing than the private sector, increased its spending, running large fiscal deficits. At the same time, the government promptly restructured the financial system, and the central bank cut interest rates. Aided by an exchange rate adjustment, the collapse in activ-ity was halted, the economy recovered, and the government could then start to reduce its debt.
Unfortunately, for many advanced economies, this path is not as easily available today as in the 1990s. Public debt levels were already high before the financial crisis, and many other liabilities—among them pensions and medical and other social services—loom large. The recessions caused large fiscal deficits, mainly due to the slow economic activ-ity and further increases in expenditures, in part due to bank
Classens, 4/19/12
Chart 3
Corporate restraintIn contrast to earlier crises, non�nancial corporations did not increase their debt-to-equity ratios, generally keeping conservative balance sheets.(debt as a percentage of equity in non�nancial corporations)
United StatesJapan
GermanyFrance
ItalyUnited Kingdom
CanadaBelgium
NetherlandsSweden
SwitzerlandEuro area
0 20 40 60 80 100 120 140 160 180 200
Preboom level, 2000Precrisis level, 20072011, Q3
Source: IMF staff calculations.

Finance & Development June 2012 23
recapitalization as governments poured funds into banks and other financial institutions to keep them afloat. As a result, many countries’ creditworthiness is being questioned and many governments cannot easily increase spending to pro-tect the economy from the forced private retrenchment. This has been especially true for countries on the periphery of the euro area, where governments have had to retrench.
Still, governments can play important roles. Household debt restructuring programs such as those in the United States in the 1930s and in Iceland today can help. The U.S. government took over about one in five mortgages, extended maturities and lowered interest rates, and in a number of
cases wrote off principal, thereby significantly reducing debt repayment burdens and the number of household defaults and foreclosures. Such policies can help avert self-reinforcing cycles of household defaults, additional house price declines, and increased contractions in output.
Where are we today? Progress in deleveraging now varies by specific sectors of the economy and by country. Charts 1, 2, and 3 also provide a snapshot of the household and financial and corporate sector debt situation as of the third quarter of 2011. A simple com-parison of current debt and leverage ratios with their pre-boom (year 2000) levels suggests that households have a long way to go to repair their balance sheets. The financial sector also needs to reduce its debt-to-GDP ratio and liabilities-to-equity ratio by quite a bit. Corporate sectors are generally in better shape.
Some countries are a little further ahead in this process. In Germany, household debt to income has already declined. In the United States, the ratio has also fallen from its peak, although largely due to defaults that wiped out debts. In the United Kingdom, there has been some reduction in house-hold debt to income since the crisis, although the level remains high. In most other countries, though, household debt has yet to return to its precrisis level or even to stop increasing. For example, household leverage continues to rise in France and the Netherlands, in part because house prices have declined.
In general, there has been less progress in deleveraging in the financial sectors. While the United States and Germany have been successful in lowering the debt-to-GDP ratio in the financial sector, it still has not returned to precrisis lev-els. In countries such as Canada, France, Italy, and the United Kingdom, the financial sector has not yet deleveraged, and either the debt-to-GDP or debt-to-equity ratio—or both—is still quite high.
While in most countries, nonfinancial corporations did not increase their leverage, in some—notably Japan and Canada—the nonfinancial sector remains heavily indebted.
policies can make a differenceIt will take a long time to repair balance sheets. Although pri-vate sector repair is progressing, it is far from over. And many governments have fiscal problems so large that they cannot fill the demand gap caused by the deleveraging.
In some respects, though, this slow progress is good news. As discussed above, deleveraging too quickly, especially by financial institutions, can worsen overall economic perfor-
mance by reducing aggregate demand and activity. In some countries, there are encouraging signs of repair being made without adverse macroeconomic consequences. The chal-lenge for all countries is to repair balance sheets at the right speed: not too fast, not too slow.
Policies can make a difference. Standard recommen-dations for an orderly global deleveraging include the following elements: • Policymakers must carefully coordinate financial,
macroeconomic, and structural policies to ensure that the financial system is in a good position to support the economy. • As a complement to bank capital and provisioning
increases under way (see “Fixing the System,” in this issue of F&D), it is essential to make further progress on bank restructuring and resolution, backed by official support if necessary. The authorities should ensure that banks exercise appropriate restraint on dividend payments and remunera-tion to preserve capital buffers that can absorb losses.• Household mortgage debt burdens in some countries
must be made sustainable through programs to facilitate principal write-downs.• The road toward fiscal consolidation in many countries,
must be mapped out to ensure or restore solvency in the eyes of financial markets, but the debt reduction path should not hamper the short-run recovery. • To prevent adverse spillovers, policymakers must coor-
dinate their activities and must avoid excessively favoring their own economic and financial systems. ■Stijn Claessens is Assistant Director of the IMF’s Research Department.Reference:
International Monetary Fund (IMF), 2012, “Dealing with Household Debt,” World Economic Outlook, Chapter 3 (Washington, April).
Only the United States and Germany have been successful in lowering the debt-to-GDP ratio in the financial sector.

24 Finance & Development June 2012
EMERGING market and low-income economies had unprecedented strong economic performance in the period before the global financial crisis. The ex-perience varied across countries, but from 2003 to
2007, annual inflation-adjusted GDP growth in both groups of countries averaged 7 to 8 percent—well above rates of the 1990s. Inflation was successfully reduced to single digits. These economic achievements owe much to persistent structural reforms that made economies more competitive and resilient and to improved fiscal and monetary policies. This sustained economic growth also translated into lower poverty rates—a key target of the Millennium Development Goals set by the United Nations in 2000 (IMF and World Bank, various years).
Because many emerging markets and low-income coun-tries were in strong economic shape, they were able to take steps to counter the global recession that began in 2008 as a direct aftermath of the financial crisis in advanced economies. These innocent bystanders, if you will, were able to shake off the recession far faster than advanced economies. Moreover, many benefited from a quick recovery in commodity prices.
But would these bystanders do as well in the event of another global downturn or other serious economic shock? That could depend on how well they prepare.
caught in a broadside The global economic and financial crisis originated in the advanced economies, but emerging market and low-income countries were, for a time, caught in its broadside (see Chart 1 and table). Their rates of growth fell, although the slowdown was less pronounced in the low-income coun-tries. The turmoil of the global crisis was transmitted to emerging market and low-income countries through several major channels: demand for their exports dropped, foreign exchange markets grew more volatile, trade finance and other forms of credit tightened, and
foreign direct investment slowed. And the global gloom and uncertainty cast a chill over domestic investment as well. All this came on the heels of the 2007–08 surge in food and fuel prices, which—except for commodity exporters—had begun to weaken trade balances and official reserves positions and necessitated increased social spending.
Stronger policies before the crisis made the difference in recovery. Low to moderate inflation, comfortable international reserves, strengthened fiscal accounts, and reduced debt pro-vided the “policy space” that many countries needed to under-take active policies to combat the recession.
Although monetary authorities in many emerging markets and low-income countries at first tightened policies to bol-ster confidence and contain the impact of the financial cri-sis, as the risk that the financial crisis would spill over to the real economy became more palpable, central banks cut inter-est rates and allowed greater exchange rate flexibility. Nearly three-quarters of emerging markets and more than half of low-income countries loosened both monetary and fiscal conditions in 2009.
emerging markets and low-income countries weathered the global recession. can they survive further shocks?
Sarwat Jahan and Brad McDonald
Assembly line in Sanand, India, for the Tata Nano, dubbed the “world’s cheapest car.”
Bystanders at the
24 Finance & Development June 2012
COLLAPSE

Finance & Development June 2012 25
The change in fiscal conditions was especially sharp, with the median fiscal deficits among emerging market and low-income countries expanding by about 3 percent of GDP (see Chart 2). To a large degree this reflects the effects of “auto-matic stabilizers” such as weaker revenues (taxes fall when output declines). Had fiscal positions been weaker and debt levels higher—as in the past—governments would have had to increase taxes or reduce spending—or both. In addition to let-ting automatic stabilizers function, those with bigger buffers responded actively with more spending.
unprecedented responseFor the low-income countries, the fiscal policy response was unprecedented. They did not enter the crisis from as strong a macroeconomic position as the emerging markets, but they were in much better shape than during previous cri-ses. Official reserves in the typical low-income country were about double their level at the start of earlier crises. And infla-tion rates, fiscal deficits, current account deficits, and external debt levels stood at about half of where they were at the start of earlier crises (IMF, 2010a).
During earlier crises, such as in 1982 and 1991, low-income countries had to cut their fiscal deficits. In 2009, the typical low-income country increased its fiscal deficit by 2.7 per-cent of GDP. Real (inflation-adjusted) spending rose 7 per-cent. More than half of the financing needs resulting from the higher fiscal deficits were met from domestic sources; however, the IMF and other external creditors stepped in to provide large amounts of concessional (below market interest rates) and other financing.
The impact of the performance of advanced economies on other countries was demonstrated again in 2010 and 2011. The global recovery in 2010 magnified the effect of the coun-tercyclical policies, with most low-income countries and espe-cially emerging markets rebounding sharply. Capital flowed again and credit growth rose, and many emerging markets experienced large increases in industrial production. Inflation
became a rising concern in emerging markets and some low-income countries, especially when the recovery began to boost global commodity prices. But again in 2011, financial turmoil and the economic slowdown spilled over to emerging markets and low-income countries—underscoring that while their interdependence may have weakened somewhat, their robust growth and rapid development still depend on strong growth in the advanced economies (Canuto and Leipziger, 2012).
risks and mitigating measuresDespite weathering the crisis well, emerging markets and low-income countries must be prepared to deal with further vola-tility in the global economy. As of early 2012, it appears that the euro area may enter a mild recession, and other advanced economies could experience weak and bumpy growth. Adverse spillovers from advanced economies to emerging market economies can cause continued moderation in emerg-ing market growth. Other risks that loom globally include an adverse oil supply shock or reduced growth potential among
the emerging markets them-selves, which would also affect low-income countries because of the increased economic ties between the two groups of
countries. Growth in most low-income countries may have rebounded, but they remain vulnerable, especially to com-modity price swings and other global price shocks. Both emerging economies and low-income countries must follow prudent policies to ensure their resilience.
Paramount for emerging economies is steady navigation toward a soft landing as domestic growth moderates amid volatility in capital flows, potential credit booms, and a pos-sible deteriorating external environment. Circumstances dif-fer across these countries: In those with diminishing inflation pressure (such as most of Latin America), monetary policies can be eased to address downside risks and, where necessary, should be complemented with enhanced financial supervi-sion to guard against overheating in sectors such as real estate. Where inflation pressure is easing, fiscal positions are sound, Jahan, 4/18/12
Chart 1
Hit hard Emerging market countries were hit harder than low-income countries during the global crisis because of their closer links to advanced economies.(percent change per capita GDP growth for median country)
Source: IMF and World Bank, Global Monitoring Report, April 2012.
2007 08 09 10 11 12 proj.–5–4–3–2–10123456
Low-income countries
Advanced economies
Emerging markets
Stronger policies before the crisis made the difference.
Varied impactThe median emerging and advanced economies suffered similar output and stock market declines during the global crisis, but the variance was wider among emerging markets.
Output collapse Emerging markets Advanced economies
Median –4.9 –4.5
25th percentile –8.4 –6.6
75th percentile –2.0 –2.9
Stock market collapse
Median –57.1 –55.4
25th percentile –72.0 –64.1
75th percentile –45.2 –49.0
Source: IMF (2010b).Note: The output collapse is measured as the percent change of GDP from peak to trough.
The stock market collapse is measured as the percent change of domestic equity prices from peak to trough.

26 Finance & Development June 2012
and there are significant external surpluses, there is space for increased expenditure—including, in some cases, social spending (IMF, 2012a). In other economies, notably in the Middle East and North Africa, a key issue is how to promote strong, sustained, and inclusive growth, with enough private sector jobs to absorb a fast-growing labor force, and develop strong institutions that ensure good governance. Where pol-icy space is more limited, for example by inflation pressures, a more cautious stance toward policy easing is needed.
Low-income countries face a difficult policy balancing act. In most low-income countries macroeconomic policy buffers are weaker than in 2008. Fiscal deficits and debt are higher than before the crisis, indicating that the countries will be less able to pursue a countercyclical fiscal response to mitigate adverse effects of another shock. Since 2009, current account deficits (net of foreign direct investment) and fiscal deficits have widened, and stocks of foreign reserves (rela-tive to imports) have declined. Until buffers such as these are rebuilt, low-income countries will be less well positioned to cope with further external shocks (IMF, 2010a and 2011a). If foreign aid is reduced because of budget issues in advanced economies, low-income countries become even more vulner-able. Low-income countries will have to gradually reduce def-icits and debt while gradually building up foreign exchange reserves. But at the same time, these countries face acute spending needs for growth-enhancing investments and for social spending.
Resources used to rebuild buffers cannot be used for invest-ments to promote future growth or to meet immediate devel-opment needs. But there are ways that low-income countries can deal with this trade-off—such as by strengthening domes-tic revenues and improving their systems for managing public spending. Low-income countries can put in place more flex-ible and robust social safety nets so that if a shock hits, trans-fers can be channeled promptly and more cost-effectively to vulnerable groups. Over the longer term, low-income coun-
tries can pursue reforms to encourage domestic saving and deepen their financial systems. Increases in both the volume and quality of public infrastructure investment are needed, as are investments in human capital through effective health and education policies (IMF, 2012b).
In addition, countries can begin to use financial markets to hedge against risk. Low-income countries can increase their use of market hedging products, such as disaster insurance and debt instruments with shock-contingent repayment terms that can soften the impact of those shocks (IMF, 2011b). ■Sarwat Jahan is an Economist and Brad McDonald is a Deputy Unit Chief in the IMF’s Strategy, Policy, and Review Department.
References:Canuto, Otaviano, and Danny Leipziger, 2012, “Ascent after Decline:
Challenges of Growth,” PREM Economic Premise, No. 75 (Washington: World Bank).
International Monetary Fund (IMF), 2010a, “Emerging from the Global Crisis: Macroeconomic Challenges Facing Low-Income Countries” (Washington).
———, 2010b, “How Did Emerging Markets Cope in the Crisis?” (Washington).
———, 2011a, “Managing Global Growth Risks and Commodity Price Shocks—Vulnerabilities and Policy Challenges for Low-Income Countries,” IMF Policy Paper (Washington).
———, 2011b, “Managing Volatility in Low-Income Countries—The Role and Potential for Contingent Financial Instruments,” IMF Policy Paper (Washington).
———, 2012a, “Global Economic Prospects and Policy Changes,” prepared by IMF staff for Meeting of G20 Finance Ministers and Central Bank Governors, February 25–26.
———, 2012b, “Low-income Countries Remain Vulnerable in Global Downturns,” IMF Survey, January 10.
———, and World Bank, various years, Global Monitoring Report (Washington).
Jahan, 4/18/12
Chart 2
In recovery On a variety of measures the economies of both low-income countries and emerging markets have improved since the recession, but low-income countries are especially vulnerable to a new downturn.
Source: IMF, World Economic Outlook, April 2012.Note: FDI is foreign direct investment.
Emerging market Low-income countries countries
2007 08 09 10 11 12
Current account balance net of FDI
(median, percent of GDP)Of�cial reserves
(months of imports)Public debt
(median, percent of GDP)Fiscal de�cit
(median, percent of GDP)
2007 08 09 10 11 12
Low-income countries
Emerging market countries
20072008
20092010
2011
–5
–4
–3
–2
–1
0
Emerging market countries
Low-income countries
Median
75th percentile
25thpercentile
2007 10 2007 100
2
4
6
8
10
25
30
35
40
45
50
–5
–4
–3
–2
–1
0
1
2
3
4
Low-income countries
Emerging market countries

Finance & Development June 2012 27
GLOBAL imbalances have shrunk somewhat in recent years, mainly because of the global downturn rather than deliberate
policy actions. But the imbalances remain stubbornly high and there is a growing risk that, as before the global financial crisis, the world may be lulled into harmful inaction.
In the run-up to the Great Recession, such imbalances were acknowledged widely but not subject to any sustained pol-icy corrections. The IMF did convene con-sultations involving countries ringing up large and persistent balance of payments deficits, such as the United States, and those accumulating significant surpluses, such as China and major oil producers. But these consultations did not get very far.
In the meantime, too many people fell into the trap of citing “special reasons” for why historically unsustainable imbal-ances could in fact be sustained. Instead, the imbalances ended up adding fuel to the global economic crisis.
Once again, there is a growing risk that the world will fail to tackle the imbalances—this time not just because of complacency but also because of the inabil-ity of economists and policymakers to converge on a common analysis. Without a common analysis it is difficult to forge effective policy agreements and a proper sense of shared responsibility between sur-plus and deficit economies.
There will eventually come a point when deficit nations will find it difficult to con-tinue to spend massively more than they take in. Meanwhile, surplus countries will find that their persistent surpluses under-mine future growth. For both sides, the imbalances will become unsustainable,
with potentially serious disruption to the global economy.
slow recoveryThe world has yet to recover properly from the global financial crisis that erupted in 2008. Advanced economies are still try-ing to overcome sluggish growth, insuf-ficient job creation, and rising inequality in income and wealth. Geopolitical risks, including those that push oil prices higher, have increased. And too many U.S. and European politicians dither and bicker rather than devise solutions to the structural impediments that undermine employment and growth.
Emerging economies continue to out-pace their advanced counterparts, but their growth is slowing. The problems in advanced economies are a factor, but so is the difficulty of navigating the policy challenges of what Nobel Prize winner Michael Spence calls the “middle-income transition”—when a country’s production costs rise to levels that make it harder to compete with low-income countries but its institutional capacity does not yet allow it to break into advanced economy territory.
It is in this global economic scenario that the rate of adjustment in current account imbalances that started after the global financial crisis has not been sustained (see chart), and the composition of the imbal-ances looks worrisomely similar to what it was before the crisis.
The adjustment that occurred happened for negative rather than positive reasons. It reflected the impact of the Great Recession on demand in advanced economies, with trade deficits in countries such as the United States declining as unemployment
Mohamed A. El-Erian
persistent, large payment surpluses and deficits threaten global long-term economic well-being and financial stability
STABLEDISEQUILIBRIUM
point OF VIEW

28 Finance & Development June 2012
rose to unusually high and persistent levels. The adjust-ment was later partially reversed as these economies began to recover—not on the back of sustained reforms but in large part due to massive liquidity injections by central banks and a once-and-for-all decline in the household saving rate.
The United States still accounts for a significant chunk of the underlying deficits—one-third today compared with one-half before the crisis. On the other side, just five countries account for half of the global surplus, similar to the precrisis situation.
In the most delicate and systemic of all bilateral imbal-ances—the China-U.S. trade balance—deterioration has continued, with the imbalance now greater than it was on average during 2006–08. Meanwhile, the major imbal-ance between Germany and countries on the periphery of Europe continues to serve as a complicating factor in an already complex and perplexing regional debt crisis.
explaining imbalancesThe persistence of imbalances has come with little reso-lution in the related academic debate over their causes, their significance, and what can or should be done to remedy them. If anything, economists seem more at odds than ever.
Without a common analysis, it should come as no surprise that policy initiatives have also disappointed.
In country after country, domestic considerations have trumped global concerns. The glory days of interna-tional policy coordination that culminated in the highly successful April 2009 London Summit of the Group of 20 advanced and emerging economies (G20) have given way to rather bland meetings. And because the Mutual Assessment Program the G20 asked the IMF to oversee is still evolving, policy-driven progress on resolving the global imbalances has been limited.
Academic explanations tend to stress different factors for both the emergence of persistent global imbalances and the failure to address them. This adds to the prob-lems of policymakers who already confront imperfect tools and reduced flexibility after what was, by any stan-dard, an unusually aggressive use of fiscal and monetary measures to avert a global depression.
Some experts argue that the global imbalances are the outcome of macroeconomic policy choices. Others high-light the structural role of national savings and the ease with which surplus funds can be invested across national borders. Then there are those who view the imbalances as a reflection of the increasingly outdated structure of the international monetary system.
No single explanation dominates the literature and attains a critical level of consensus, which is more a reflection of the confusing times than a failure of the eco-nomics profession.
Imbalances persist
The narrowing of global balance of payments imbalances did not continue after the Great Recession.
(global current account imbalances, percent of world GDP)
Source: IMF, World Economic Outlook (2012).Note: The global statistical discrepancy is not shown.
-3.5
-2.5
-1.5
-0.5
0.5
1.5
2.5
3.5
2002 2003
2004 2005
2006 2007 2008
2009 2010 2011 2012
proj.
Other advanced economies with surplus
United States
Other advanced economies with de�cit
Low-income countries with surplus Emerging market countries with de�cit
Low-income countries with de�citEmerging market countries with surplus
Finance & Development June 2012 29
The global economy today is in the midst of secular and structural realignments at the national, regional, and international levels as relative dominance and dynamism shift from the older advanced economies to emerging market economies. These realignments are occurring during a period that includes a highly unusual economic downturn that spawned a degree of policy experimenta-tion in advanced economies trying to shake the recession that not long ago would have been deemed unthink-able. These developments also explain why markets have tended to fluctuate violently—as investors alternate from being risk friendly to risk averse.
the outlookGiven these conditions, the best that we can expect from surplus and deficit economies in the months ahead is policy tinkering rather than major and sustained policy initiatives.
The U.S. economy will continue to heal gradually but is unlikely to see the set of structural reforms required to break out into vigorous and sustained growth. In Europe, the talk will be of reform, but financing issues will con-tinue to dominate. And in emerging market countries,
hesitancy about the uncertain global environment will preclude any major attempt to realign policies to favor both consumers and producers.
Unless there is an economic catastrophe, it is difficult to envision much change in either the level or composi-tion of global imbalances in the short term. The most likely baseline is one in which the world experiences more of the same.
This short-term outlook is far from comforting. Indeed, where most academics do not differ is in their concern that persistent imbalances expose the global economy to sudden stops in investment flows, as happened in the fourth quarter of 2008. At that time funds ceased flow-ing to emerging markets and sought safe havens like U.S. government securities, which is what happened more recently in Europe.
The extreme worries relate to currency fragmenta-tion in Europe and worsening funding conditions for the United States. Both of these low-probability “tail events” entail catastrophic disruptions, with virtually no coun-try in the world immune to negative spillover effects.
Economists also point to mounting risks of currency wars and protectionism (a concern expressed on many occa-sions by Brazilian Finance Minister Guido Mantega).
The global imbalances are best characterized as being in a “stable disequilibrium.” They can persist for a while. But if they do, the global economy will continue to travel far-ther afield from the equilibrium associated with high global growth, sustainable job creation, and financial soundness.
two pathsThere are two ways to resolve the inherent—and ulti-mately unsustainable—contradiction of a stable disequi-librium over the medium term.
The unpleasant resolution involves the advanced econ-omies tipping once again into recession. This could occur from another flare-up in Europe’s debt crisis, a further spike in the price of oil due to geopolitical disruptions, or a market accident due to still-excessive leverage in certain institutions and market segments. The policy responses would inevitably be less effective now that central bank balance sheets have ballooned to 20 to 30 percent of GDP in the major advanced economies while deficits and debt remain high.
The better resolution is one in which policymakers are proactive and preemptive. Such a resolution would likely have three facets: a simultaneous attack on both short- and long-term policy challenges; a series of midcourse corrections as more information about the effects of those policy changes becomes available; and a high degree of international coordination with the IMF playing a more effective and assertive role as conductor, information clearinghouse, and trusted advisor.
In this scenario the United States regains competi-tiveness and growth, Europe reforms itself into a more robust and harmonious economic union, and systemically important emerging markets encourage their growing middle class to consume as well as produce. All of these developments would have to take place simultaneously and would require the IMF to act as an effective and cred-ible coordinator.
We should not underestimate the potential upside of such a comprehensive policy evolution. In addition to lifting impediments that have repeatedly undermined the global economy and exposed it to financial crises, such changes would have the added advantage of entic-ing the substantial private capital that is now standing on the sidelines. Such an influx of capital would be a further shot in the arm for investment, production, employment, trade, and more equal income distributions.
The well-being of millions of people around the world depends on the international community stepping up to this difficult challenge. ■Mohamed A. El-Erian is Chief Executive and Co-Chief Investment Officer of the global investment firm Pimco, which manages $1.8 trillion in assets.
The best that we can expect from surplus and deficit economies in the months ahead is policy tinkering rather than major and sustained policy initiatives.

30 Finance & Development June 2012
Soaring commodity prices were a hallmark of the global economic boom from 2003 to mid-2008 (see Chart 1). When the global financial crisis erupted and the great recession set in, prices crashed and the end
of the commodity boom seemed imminent. instead, commod-ity prices rebounded in the early stages of the recovery, and by the end of 2010, prices of many commodities were close to or above precrisis peaks. Except for oil, whose price is affected by increased geopolitical supply risks, commodities lost some of their luster when global economic activity slowed in 2011.
recent price weakness may simply reflect the dire state of the global economy, but it also raises the question of whether it is time to reevaluate prospects for commodity markets. Price projections are of little help. They often fail to antici-pate either the direction or persistence of price changes. This article considers commodity market developments since the global financial crisis in light of recent research on the ori-gins of commodity price booms, which emphasizes the inter-action of demand and supply shocks and low inventories as the main forces behind booms (Carter and Smith, 2011). at issue is whether and—if so—how, the global financial crisis has changed those interactions.
Demand factorson the demand side, an unexpected, persistent acceleration in economic growth in emerging and developing economies was a major force behind the commodity price boom of the early 2000s. This growth acceleration in economies where activity generally relies more heavily on commodities than in advanced economies boosted global commodity demand even as it waned in advanced economies. The average growth rates in global demand for many commodities were substantially higher during the past decade than during the 1980s or 1990s.
The global financial crisis and the great recession only dented the growth performance of emerging and developing economies, whose real gDP and industrial activity quickly recovered to precrisis trends as advanced economies lan-guished. Stimulative macroeconomic policies hastened recov-ery in emerging market and developing economies, especially in China, where strong stimulus policies further fueled the commodity-intensive investment that spurred much of the recovery in commodity markets. The buoyant recovery in emerging markets was behind the rapid return to demand for commodities as early as mid-2009. Prices rebounded.
global demand for base metals, for example, surpassed precri-sis peaks during the first quarter of 2010 (see Chart 2). Similarly, global oil demand increased by some 3¼ percent in 2010, a rate close to the previous peak in demand growth in 2004.
These developments suggest that the global financial crisis has not fundamentally changed the demand picture in com-modity markets. Per capita income in key emerging econo-mies remains at levels where commodity demand increases as income rises. Demand in these countries is driven by long-term, structural factors in addition to the business cycle, which explains the unusual length of the current commodity boom (radetzki, 2006).
Supply responseon the supply side, there is an important distinction between supply shocks—unexpected disruptions to commodity pro-duction—and the supply response to increased demand.
Supply shocks were important in some recent price surges, especially for major grains in 2010 and 2006–07. The food price surge in the second half of 2010, for example, was triggered by weather-related supply disruptions—drought and wildfires in russia, Ukraine, and Kazakhstan and, later, floods in asia.
The global price response to a supply disruption depends not only on how much production declines but on the size of
Helbling, Revised 4/19/12
Chart 1
A wild rideCommodity prices rose steadily through the 2000s until the global economic crisis, plunged sharply, then recovered.(2008:Q2 = 100, constant U.S. dollars)
Sources: IMF, Primary Commodity Price System database; and Haver Analytics.
CRB Spot Commodity Price Index IMF Nonfuel Primary Commodity Price IndexIMF Energy Commodity Price Index
0
20
40
60
80
100
120
140
160
180
1980
1982
1984
1986
1988
1990
1992
1994
1996
1998
2000
2002
2004
2006
2008
2010
2012
Thomas Helbling
The global economic crisis hurt commodity prices far less than in earlier recessions. The long-run outlook is murkier
Commodities BOOMin

Finance & Development June 2012 31
inventories that can act as buffers. The interaction between low initial stocks and supply disruptions over the past decade has been an important factor in large food price surges. The lower the stocks relative to consumption, the more reluctant inventory holders are to sell at any price. The stocks of food relative to consumption decreased substantially over the past decade. inventories at the time of the 2008 food price peaks were at lows comparable to those during the 1973–74 com-modity and food price boom. Favorable harvests in late 2008, 2009, and 2011 replenished stocks somewhat, but continued robust demand has hindered rebuilding of inventories and stocks remain relatively low. Because the availability and cost of credit affect the cost of maintaining inventory, it would be reasonable to attribute some of the cause of the low food inventory level to the financial crisis. But there is little evi-dence to support that. in fact, inventories were low when the
crisis erupted. Moreover, financial conditions do not appear to have hindered inventory accumulation of base metals or crude oil. For those cyclical commodities, inventories started rising sharply when the great recession set in as demand declined faster than supply and spot prices fell. But that changed quickly once stimulative measures took hold and market participants seemed willing to absorb the excess supply.
another factor behind high commodity prices, before and after the crisis, has been the slow response of produc-ers to the unexpected increase in commodity demand. The high cost of developing related deposits and reservoirs also contributed. Mining and hydrocarbon investment has been booming—largely free of the credit and financing constraints that affected many potential borrowers. However, new capac-ity has been slow to come onstream, a reflection of both the increased lag between exploration and development of new
production capacity in mining and hydrocarbons and struc-tural impediments, such as policies in some countries that restrict exploration and investment.
Supply responses are most acute in the crude oil sector, just as they were during the global economic boom of the mid-2000s. Capacity has expanded slowly, because new fields and enhanced recovery barely offset the decline in produc-tion of major oil fields developed between the 1950s and the 1970s. High-cost projects have been the primary source of additional supply. The surge in the production of harder-to-extract oil in the United States shows that technological advances can still produce new sources of supply. But such sources are small overall and unlikely to increase global oil supply capacity in the next few years.
The renaissance in the commodity sector after the listless 1980s and 1990s was not halted by the global financial crisis, the great recession, or the ensuing bumpy recovery. Two key factors behind the revival—higher growth in emerging and developing economies and supply constraints—have endured.
New forcesBut this does not mean that the patterns of the commodity renaissance will remain the same. other forces are at work. The sources of growth in emerging and developing economies are changing. in China, for example, the government’s latest five-year plan strives to move the economy from investment- to consumption-driven growth. This would likely change the nature of China’s commodity demand. in particular, as construction’s share of economic activity declines, demand growth is likely to slow for commodities used in construction. at the same time, the global economy is adjusting to high commodity prices. innovation and the drive to find lower-cost substitutes will eventually lower demand and increase supply. Mothballed oil fields, for example, have been revived, as high prices make production profitable again. Low natural gas prices in the United States (from the shale gas revolution) will almost surely spur greater use of that fuel, potentially even in vehicles powered by natural gas. Still, adjustment to high prices is gradual and unlikely to drive down commodity prices quickly.
The fundamentals seem intact, but the global growth outlook is still uncertain—and not just because of relatively weak prospects and the unusually high vulnerability of advanced economies. For sure, these risks have put a damper on the external demand outlook for emerging economies. But growth in these economies is also subject to domestic capacity constraints and, in some cases, rapid if not exuber-ant credit growth. ■Thomas Helbling is a Division Chief in the IMF’s Research Department.
References:Carter, Colin A., and Aaron Smith, 2011, “Commodity Booms and
Busts,” annual review of resource Economics, Vol. 3, No. 1, pp. 87–118. Radetzki, Marian, 2006, “The Anatomy of Three Commodity Booms,”
resources Policy, Vol. 31, No. 1, pp. 56–64. Sources: International Energy Agency, and World Bureau of Metal Statistics.
2005 2006 2007 2008 2009 2010 2011 20120.6
0.8
1.0
1.2
AluminumCopperCrude oil
Chart 2
Fast comeback Demand for base metals and oil rebounded shortly after the global recession’s worst days began in late 2008.(consumption of commodity, 2008:Q2 = 1)
The global economy is adjusting to high commodity prices.

32 Finance & Development June 2012
Water for PeoplePICTURE THIS
Picture This, 4/9/12
The MDG drinking water target has been met.(water coverage, percent)
1990 1995 2000 2005 2010 2015 Proj.
0
20
40
60
80
100
Improved water sources Unimproved water sources MDG water target (88 percent)
Note: The drinking water target excludes direct measurement of drinking water quality. The mea-sure used for MDG monitoring is “the use of an improved water source.” This proxy indicator may not conform to the recommended methods in the WHO report Guidelines for Drinking-Water Quality (2011).
The global target for safe drinking water has been met but more than 780 million people still lack access to clean water
SinCE 1990, more than 2 billion people have gained access to improved water sources, such as piped connections and protected wells, ac-cording to a joint report by the United nations
Children’s Fund (UniCEF) and the World Health organization (WHo). almost 6.1 billion people—or 89 percent of the world’s population—used safe drinking water in 2010. That beats the 88 percent tar-get for access to safe drinking water in 2015 set by the Un Millennium Development goals (MDgs).
89%OF THE WORLD’S
POPULATION USED SAFE DRINKING WATER IN 2010
Most of the improvement in drinking water coverage came from the use of piped connections and other improved sources.(water coverage, percent)
Surface water
Unimproved water sources
Other improved water sources
Piped on premises
1990 2010
6
18
31
45
38
35
54
32 Finance & Development June 2012
Mixed progressThese global figures mask huge differences among regions and countries. only 61 percent of the people in sub-Saharan africa have access to improved drinking water sources, com-pared with 90 percent or more in Latin america and the Caribbean, northern africa, and large parts of asia. More than 40 percent of all people who lack access to safe drinking water live in sub-Saharan africa. only 19 out of 50 countries in that region are on track to meet the target by 2015.

Finance & Development June 2012 33
Picture This, 4/9/12
But the MDG sanitation target may fall short.(sanitation coverage, percent)
1990 1995 2000 2005 2010 2015 Proj.
0
20
40
60
80
100
Improved sanitation sources Unimproved sanitation sources MDG sanitation target (75 percent)
Prepared by Natalie Ramírez-Djumena. Text and charts based on Progress on Drinking Water and Sanitation, published by UNICEF and the WHO in 2012. The report is available at www.who.int/publications/en/
PEOPLE STILL HAVE NO ACCESS TO SAFE
DRINKING WATER
780MILLION
63%OF THE WORLD’S POPULATION HAD ACCESS TO SANITATION
FACILITIES IN 2010
Sub-Saharan Africa and the Pacific are not on track to meet the MDG drinking water target.(progress toward the MDG drinking water target, 2010)
Women carrying water in Niger.
On track
Progress but insufficient
Not on track
No data
Finance & Development June 2012 33
Toward universal accessThe UniCEF-WHo report shows why the job is far from finished. More than 780 million people still have no access to safe drinking water, and the world is unlikely to meet the MDg target for access to sanitation facilities. Continued efforts are needed to reduce urban-rural disparities and inequities associ-ated with poverty, dramatically increase coverage in sub-Saharan africa and the Pacific, promote global monitoring of drinking water quality, bring sanitation on track, and expand the MDg target toward universal coverage. ■
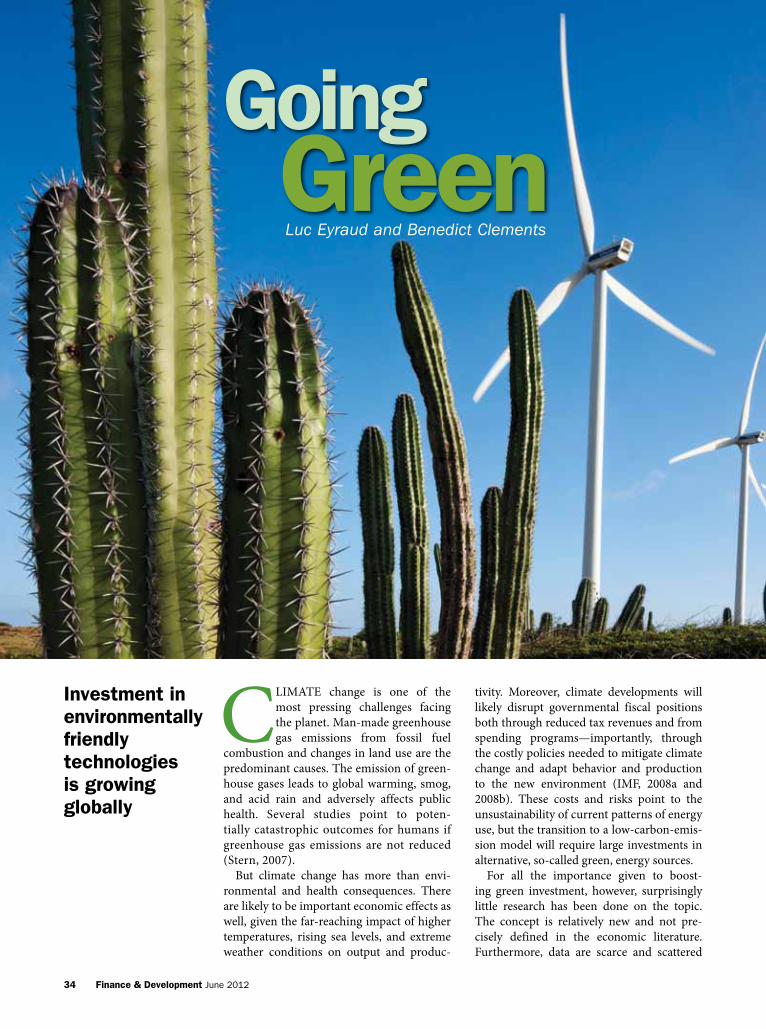
34 Finance & Development June 2012
CLiMaTE change is one of the most pressing challenges facing the planet. Man-made greenhouse gas emissions from fossil fuel
combustion and changes in land use are the predominant causes. The emission of green-house gases leads to global warming, smog, and acid rain and adversely affects public health. Several studies point to poten-tially catastrophic outcomes for humans if greenhouse gas emissions are not reduced (Stern, 2007).
But climate change has more than envi-ronmental and health consequences. There are likely to be important economic effects as well, given the far-reaching impact of higher temperatures, rising sea levels, and extreme weather conditions on output and produc-
tivity. Moreover, climate developments will likely disrupt governmental fiscal positions both through reduced tax revenues and from spending programs—importantly, through the costly policies needed to mitigate climate change and adapt behavior and production to the new environment (iMF, 2008a and 2008b). These costs and risks point to the unsustainability of current patterns of energy use, but the transition to a low-carbon-emis-sion model will require large investments in alternative, so-called green, energy sources.
For all the importance given to boost-ing green investment, however, surprisingly little research has been done on the topic. The concept is relatively new and not pre-cisely defined in the economic literature. Furthermore, data are scarce and scattered
Investment in environmentally friendly technologies is growing globally
Going Green
Luc Eyraud and Benedict Clements

Finance & Development June 2012 35
among various sources. We try to fill this gap by proposing a definition of green investment and analyzing its trends and macroeconomic determinants over the past decade in advanced and emerging economies. The results provide pow-erful insights for policymakers seeking to move toward a more green economy.
Investing greenThere is no standard definition of green investment. We define it as the investment necessary to reduce greenhouse gas and air pollutant emissions significantly. There are sev-eral ways to reduce gas emissions, and thus green investment may take various forms:• Investments that make energy generation less
polluting. green investment involves shifting energy sup-ply from fossil fuels to less-polluting alternatives—either as sources of electricity generation (such as wind, solar, nuclear, hydropower) or as direct sources of energy (for example, a biofuel such as ethanol made from corn or sugarcane). The green investment concept extends not only to emerging envi-ronmental technologies, such as wind and solar photovoltaic power, but to more established technologies like nuclear and hydropower. To retain a simple distinction between energy from fossil fuels and energy from low-emission alternatives, our green investment concept includes investment in nuclear power. Some have argued that because it produces radioac-tive waste, nuclear power should be excluded from any green spending concept. However, we include it because our defini-tion is based on the impact of the investment on gas emissions. Biofuels are also part of our definition of green investment. Despite their debatable impact on carbon emissions, they are a renewable energy source and thus are considered green in our analysis.• Investments that reduce energy consumption. green
investment also includes technologies that reduce the amount of energy required to provide goods and services, which increases energy efficiency. in the electricity sector, there is room to improve efficiency in power generation (by moving to supercritical coal-fired plants, which are highly efficient electricity plants that burn less coal) and in trans-mission and distribution (by using more efficient grids, for instance). There is also potential for efficiency gains in trans-portation—by using more fuel-efficient and hybrid cars and by increasing use of mass transit. in industrial equipment, efficiency gains can be achieved through energy-saving appliances and improved waste management. in construc-tion, efficiency can be enhanced through improved insula-tion and cooling systems.
From brown to green energy sourcesgreen technologies (nuclear and renewable, such as solar, wind, and hydropower) already play an important role in electricity production. in 2008, about one-third of global electricity was generated from nuclear and renewable sources and two-thirds from conventional, or brown, sources such as coal, gas, and oil (see Chart 1, left). These shares have been relatively stable over time. However, since the second half of the 1990s, green energy
generation has shifted from hydro and nuclear power to other renewables. These other renewable technologies have signifi-cantly contributed to the buildup of electric capacity in recent years. For instance, they accounted for about one-third of the capacity increase in 2009 (see Chart 1, right).
over the past decade, many public programs have been put in place—mostly in the advanced and emerging economies that are members of the organization for Economic Cooperation and Development—to encourage the production or consump-tion of renewable energy. The number of countries with some type of policy target or support policy almost doubled in recent years—from 55 in early 2005 to more than 100 by early 2010.
Support plans generally have three main goals: reduce car-bon emissions and prevent climate change; improve energy security by diversifying the energy mix; and foster growth by promoting competitiveness, job creation, and innovation in new industries.
The most common forms of support policies for renewable electricity generation are feed-in tariffs (adopted by 50 coun-tries and 25 states or provinces as of early 2010) and renew-able portfolio standards (found in 10 countries and 46 states or provinces). Feed-in tariffs mandate that utility companies pay prices to green electricity producers that reflect the cost of the technology, which can be above the cost of conven-tional electricity generation. renewable portfolio standards require electricity companies to rely on renewables for some fraction of their energy sources.
Estimating the cost of public programs is tricky. They include not only direct payments but also tax breaks, loan guarantees, and quotas. Published estimates suggest that worldwide public programs cost between $40 billion and
Eyraud, revised 4/18/12
Chart 1
Greening up Conventional energy sources account for most global electricity generation, but renewable sources make up a larger share of new capacity.
Sources: U.S. Energy Information Administration and Bloomberg New Energy Finance.Note: Conventional sources are mainly coal, oil, and gas. Renewable sources include wind,
solar, hydropower, and nuclear, although nuclear capacity is not included in the new capacity chart (right) because it was stable in 2009.
Fossil fuelHydro
Large hydro
Nuclear
Nonhydro renewables
Other renewablesConventional
28
83
5012,872
3,119
535
2,602
Electricity generation (2008) New electric capacity (2009) (billions of kilowatt hours) (gigawatts)
There is also potential for efficiency gains in transportation.
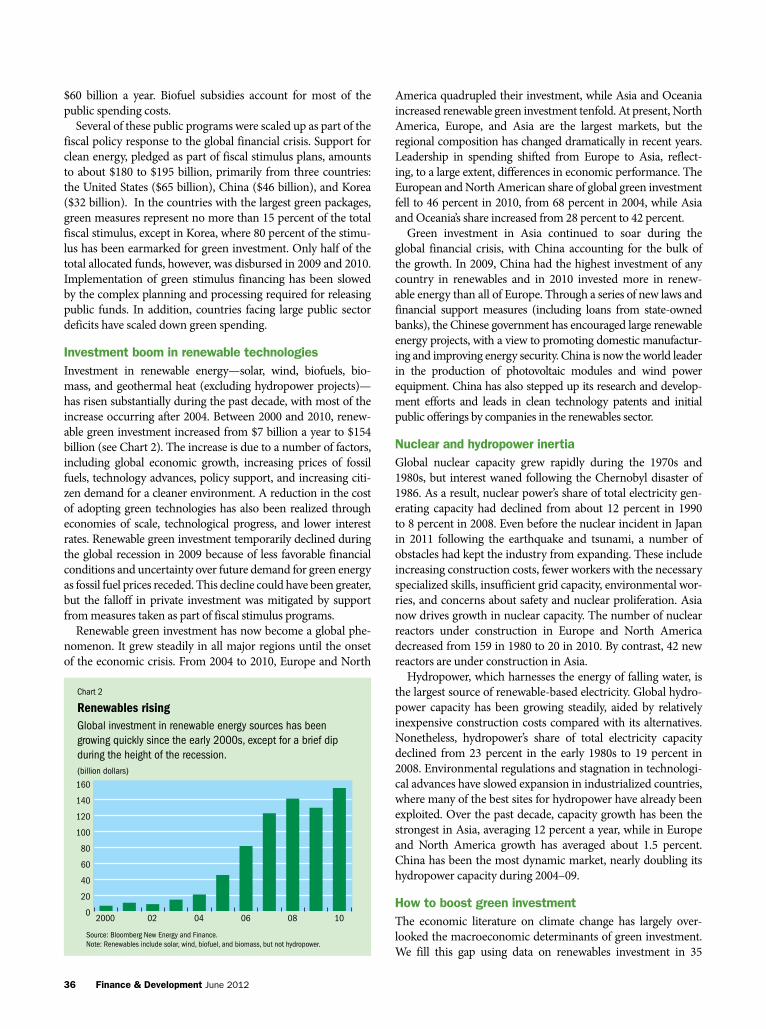
36 Finance & Development June 2012
$60 billion a year. Biofuel subsidies account for most of the public spending costs.
Several of these public programs were scaled up as part of the fiscal policy response to the global financial crisis. Support for clean energy, pledged as part of fiscal stimulus plans, amounts to about $180 to $195 billion, primarily from three countries: the United States ($65 billion), China ($46 billion), and Korea ($32 billion). in the countries with the largest green packages, green measures represent no more than 15 percent of the total fiscal stimulus, except in Korea, where 80 percent of the stimu-lus has been earmarked for green investment. only half of the total allocated funds, however, was disbursed in 2009 and 2010. implementation of green stimulus financing has been slowed by the complex planning and processing required for releasing public funds. in addition, countries facing large public sector deficits have scaled down green spending.
Investment boom in renewable technologiesinvestment in renewable energy—solar, wind, biofuels, bio-mass, and geothermal heat (excluding hydropower projects)—has risen substantially during the past decade, with most of the increase occurring after 2004. Between 2000 and 2010, renew-able green investment increased from $7 billion a year to $154 billion (see Chart 2). The increase is due to a number of factors, including global economic growth, increasing prices of fossil fuels, technology advances, policy support, and increasing citi-zen demand for a cleaner environment. a reduction in the cost of adopting green technologies has also been realized through economies of scale, technological progress, and lower interest rates. renewable green investment temporarily declined during the global recession in 2009 because of less favorable financial conditions and uncertainty over future demand for green energy as fossil fuel prices receded. This decline could have been greater, but the falloff in private investment was mitigated by support from measures taken as part of fiscal stimulus programs.
renewable green investment has now become a global phe-nomenon. it grew steadily in all major regions until the onset of the economic crisis. From 2004 to 2010, Europe and north
america quadrupled their investment, while asia and oceania increased renewable green investment tenfold. at present, north america, Europe, and asia are the largest markets, but the regional composition has changed dramatically in recent years. Leadership in spending shifted from Europe to asia, reflect-ing, to a large extent, differences in economic performance. The European and north american share of global green investment fell to 46 percent in 2010, from 68 percent in 2004, while asia and oceania’s share increased from 28 percent to 42 percent.
green investment in asia continued to soar during the global financial crisis, with China accounting for the bulk of the growth. in 2009, China had the highest investment of any country in renewables and in 2010 invested more in renew-able energy than all of Europe. Through a series of new laws and financial support measures (including loans from state-owned banks), the Chinese government has encouraged large renewable energy projects, with a view to promoting domestic manufactur-ing and improving energy security. China is now the world leader in the production of photovoltaic modules and wind power equipment. China has also stepped up its research and develop-ment efforts and leads in clean technology patents and initial public offerings by companies in the renewables sector.
Nuclear and hydropower inertia global nuclear capacity grew rapidly during the 1970s and 1980s, but interest waned following the Chernobyl disaster of 1986. as a result, nuclear power’s share of total electricity gen-erating capacity had declined from about 12 percent in 1990 to 8 percent in 2008. Even before the nuclear incident in Japan in 2011 following the earthquake and tsunami, a number of obstacles had kept the industry from expanding. These include increasing construction costs, fewer workers with the necessary specialized skills, insufficient grid capacity, environmental wor-ries, and concerns about safety and nuclear proliferation. asia now drives growth in nuclear capacity. The number of nuclear reactors under construction in Europe and north america decreased from 159 in 1980 to 20 in 2010. By contrast, 42 new reactors are under construction in asia.
Hydropower, which harnesses the energy of falling water, is the largest source of renewable-based electricity. global hydro-power capacity has been growing steadily, aided by relatively inexpensive construction costs compared with its alternatives. nonetheless, hydropower’s share of total electricity capacity declined from 23 percent in the early 1980s to 19 percent in 2008. Environmental regulations and stagnation in technologi-cal advances have slowed expansion in industrialized countries, where many of the best sites for hydropower have already been exploited. over the past decade, capacity growth has been the strongest in asia, averaging 12 percent a year, while in Europe and north america growth has averaged about 1.5 percent. China has been the most dynamic market, nearly doubling its hydropower capacity during 2004–09.
How to boost green investmentThe economic literature on climate change has largely over-looked the macroeconomic determinants of green investment. We fill this gap using data on renewables investment in 35
Eyraud, corrected 4/11/12
Chart 2
Renewables rising Global investment in renewable energy sources has been growing quickly since the early 2000s, except for a brief dip during the height of the recession.(billion dollars)
Source: Bloomberg New Energy and Finance.Note: Renewables include solar, wind, biofuel, and biomass, but not hydropower.
2000 02 04 06 08 100
20
40
60
80
100
120
140
160

Finance & Development June 2012 37
advanced and emerging economies during 2004–10 (Eyraud and others, 2011). almost all green investment in the world takes place in these 35 countries.
We adopted a statistical approach to identify the main fac-tors affecting green investment and assess their relative impact. We tested the significance of a large set of macroeconomic vari-ables, and five stood out as statistically significant in determin-ing the level of green investment: real gross domestic product (gDP), the long-term real interest rate, the relative price of international crude oil, a variable representing the adoption of feed-in tariffs, and a variable measuring whether a country has a carbon pricing mechanism (carbon tax or cap-and-trade). These are some of our findings:• Higher levels of GDP tend to boost investment in green
technologies. Economic activity raises the demand for energy and investment in the energy sector. in addition, at higher levels of development, structural change toward information-intensive industries and services, international relocation of
manufacturing industries, increased environmental awareness, and better enforcement of environmental regulations result in larger environmental expenditures and a gradual decline in environmental degradation. We find that an additional 1 per-centage point of gDP growth should raise green investment growth by about 4 percentage points in the long run, other fac-tors being equal. • The cost of capital—proxied by the long-term real
interest rate—has a negative impact on green investment. The estimated effect is quite large: green investment declines by about 10 percent when the real interest rate increases by 1 percentage point. research on general business investment finds that investment is relatively insensitive to interest rates. But green investment seems to be very responsive to inter-est rate movements. This result, which is well documented in descriptive studies, is not surprising given that renewable projects use a lot more capital than labor and rely mostly on external financing. • Oil prices also have a positive and large impact on green
investment. indeed, higher fuel prices increase the return on green investment by lowering the cost of the electricity pro-duced from renewables relative to that generated through fos-sil fuel combustion. We estimate that green investment grows by an additional percentage point when there is a 1 percentage point difference between increases in crude oil prices and econ-omy-wide inflation.• Renewable portfolio standards and biofuel mandates
do not seem to affect green investment. in the case of bio-fuel mandates, this is probably related to the fact that invest-
ment in biofuel has declined significantly since 2007 due to high feedstock prices and overcapacity. in contrast, feed-in tariffs have a strong effect. This result supports the view that feed-in tariffs are one of the most important instruments sup-porting the expansion of renewables. Based on our estimation, green investment should be two to three times larger in coun-tries adopting feed-in tariffs, other factors being equal. The effect of carbon pricing plans (in the form of an environmental tax levied on the carbon content of fuels, for instance) is also significant in almost all specifications.
overall, our results show that green investment can be powerfully influenced by public policies. interest rates and macroeconomic factors such as economic growth mat-ter, but so do energy policies. green investment increases when its cost, relative to traditional fossil fuel technolo-gies, is reduced by higher oil prices. it can be powerfully influenced by public policies. Specific public interventions to support green investment can also be useful. The sta-tistical results suggest that feed-in tariffs and carbon pric-ing mechanisms tend to support green investment. Many policies, however, do not seem to be effective, including support for biofuels. This adds to concerns regarding the effectiveness of biofuel subsidies and their adverse effects on the food supply (iMF, 2008c).
Where does it go?green investment has become a global phenomenon and a key driver of the energy sector. at the same time, the regional composition has changed dramatically in recent years. asia, led by China, is increasingly important. China became the country with the highest investment in renew-ables in 2009 and has invested more in renewable energy than Europe as a whole in 2010. our results also under-score that there is much countries can do to catalyze green investment. in particular, providing the right incentives for investments in alternatives—including the appropriate pricing of fossil fuel products and carbon emissions—will be key for moving toward a more green economy. ■Luc Eyraud is an Economist and Benedict Clements is a Divi-sion Chief, both in the IMF’s Fiscal Affairs Department.
References:Eyraud, Luc, Abdoul Wane, Changchang Zhang, and Benedict
Clements, 2011, “Who’s Going Green and Why? Trends and Determinants of Green Investment,” IMF Working Paper 11/296 (Washington: International Monetary Fund).
International Monetary Fund (IMF), 2008a, “Climate Change and the Global Economy,” World Economic outlook, Chapter 4 (Washington, April).
———, 2008b, “The Fiscal Implications of Climate Change” (Washington, March). www.imf.org/external/np/pp/eng/2008/022208.pdf
———, 2008c, “Fuel and Food Price Subsidies—Issues and Reform Options” (Washington, September). www.imf.org/external/np/pp/eng/2008/090808a.pdf
Stern, Nicholas, 2007, The Economics of Climate Change: The Stern review (London: Cambridge University Press).
Green investment has become a global phenomenon and a key driver of the energy sector.

38 Finance & Development June 2012
CarTonS of cash in the Kabul airport, a strategically placed tell-er’s window just before immigra-tion in antigua, and some lines
of code in accounting software in a bank in the Dominican republic—seemingly unre-lated phenomena, but all part of the global problem of money laundering. and all are linked to financial sector failures that led to real economic hardship for law-abiding citizens in the countries involved.
Money laundering is the process that transforms illegal inputs into supposedly legitimate outputs. Proceeds gained by crimes such as fraud, theft, and drug traf-ficking are made to look as if they were the fruits of honest hard labor—transformed, for instance, into legitimate-looking bank accounts, real estate, or luxury goods. This allows criminals to prosper from their crimes and live their lives without look-ing like criminals. Moreover, they can use these laundered proceeds to expand their
criminal enterprises, thereby increas-ing their wealth and power, including the power to corrupt and buy protection from the political and law enforcement establishment.
if there were no fraud, no tax crime, no insider trading, no drug trafficking, no cor-ruption, or indeed no proceeds-generating crime at all, there would be no money laun-dering. The close relationship between the criminal act that gives rise to proceeds and the laundering of these proceeds makes it very difficult to separate the act of money laundering from the underlying crime, although the two are treated legally as sepa-rate acts. Money laundering is an essential component of any profit-making crime, because without the laundering, crime really doesn’t “pay.”
When the underlying—or “predicate”—crime is something like drug trafficking, everyone understands the social costs, which are huge and visible. But the social and eco-
Money laundering harms innocent individuals but can also impose serious costs on national economies
Paul Ashin
Real PainDirty Money,
Money concealed in pastries seized by German customs officials during an anti–money laundering operation.

Finance & Development June 2012 39
nomic costs of white-collar crimes like embezzlement, tax evasion, insider trading, and bank fraud, while less obvious, can be massive as well.
Scary stories For example, in august 2010, when the afghan government intervened to replace the management of the country’s larg-est private bank, Kabul Bank, anxious depositors withdrew more than $200 million in deposits, in a bank run that threat-ened the country’s precarious financial and political stability. The bank, with the largest branch network in the country, was used to pay the security forces and other government workers, which made the threat of its collapse a matter of state concern.
Behind these events was a history of interest-free loans to bank insiders and politically connected parties, their subse-quent illegal investments in foreign real estate, and mysteri-ous planeloads of cash jetting from Kabul to Dubai—money laundering at 30,000 feet. a later investigation indicated that over $900 million—or more than 5 percent of the impov-
erished country’s gDP and 50 percent of its government’s budget—had been diverted from the bank. as of october 2011, more than a year after the government seized control of Kabul Bank, officials had recovered only a small portion of the missing money, and nobody has yet been criminally con-victed. To date, afghanistan’s central bank has spent almost $1 billion to bail out the banking sector, a huge cost for a country so poor.
The story in antigua and Barbuda was different, but the consequences for that small island economy were also dire. U.S. fraudster allen Stanford chose the island as the base for his massive Ponzi scheme, which marketed “high-yield” cer-tificates of deposit on his antigua-based bank to credulous investors in Miami and elsewhere (see “Perils of Ponzis” in the March 2010 issue of F&D). The purported high yields, of course, were not the result of some mystical market-beating investment that no other bank knew about.
rather, the income from later investors went into paying returns to the earlier ones—except for the $1.6 billion that was diverted to support Stanford’s lavish lifestyle, includ-ing a special “Baby Mama Trust” in the Cook islands for the mother of two of his children. in the meantime, while cor-rupting officials along the way, Stanford and his associates were laundering money by moving millions of dollars of fraudulently obtained investors’ funds from and among bank accounts outside the United States to various bank accounts in the United States.
and the teller’s window? Just a convenience for couriers from Miami with cash or checks to deposit who didn’t want their comings and goings registered in the country’s immi-
gration system. They could just get off the plane, make a deposit, and then go back to the transit lounge and wait for their return flight.
When the whole scheme came tumbling down in 2009, as Ponzi schemes eventually do, it took with it Stanford’s bank—and most of the rest of the antiguan economy, which was enmeshed in the growth of what had become the island’s biggest employer. That year, antigua’s gDP shrunk by 9.6 percent; the Central Bank of antigua came under the control of the regional central bank, from which it required a loan of 3 percent of the country’s gDP. Ultimately antigua needed a $118 million program supported by the iMF. in March 2012, Stanford was convicted of defrauding 30,000 investors in 113 countries.
in the Dominican republic, insiders at Banco intercontinental, the second-largest private bank in the country, set up an elaborate scheme to loot the bank’s assets. They loaned money to themselves and secured loans from third parties with bank funds while concealing these nonperforming assets in a parallel set of books.
Every day for 14 years, an automated accounting pro-gram “balanced” the bank’s books by transferring real assets and liabilities between the two systems to make the “above-ground” bank look solvent. For example, the non-performing related-party loans were eliminated from the bank’s formal asset accounts along with a group of balanc-ing liabilities—say, a randomly selected group of long-term certificates of deposit that would not be missed. The next day, the program dumped those real liabilities back into the bank’s books and selected another group that balanced the concealed bad assets.
When the fraud finally came to light in 2003, “BaninTEr” (as the bank was known) and two related commercial banks were bailed out by the government at a cost of 21 percent of the country’s gDP. The social and economic costs exceeded the direct cost of the bailouts; a rapid depreciation of the peso by approximately 65 percent led to very high inflation and a serious erosion of real incomes. approximately 1.5 mil-lion Dominicans (about 16 percent of the population) fell below the poverty line in the aftermath of the banking crisis, 670,000 of whom fell into extreme poverty.
These stories, of course, do not exhaust the catalog of techniques that criminals use to conceal the origins of their wealth. Making cash deposits of the proceeds of crime is a basic money laundering technique. in countries like the United States, where banks are required to report cash deposits and withdrawals over $10,000, criminals often try to structure their deposits into many smaller amounts. Multiple intermediaries carrying this out at multiple banks came to be known as “smurfing,” because the frenetic activ-
Money laundering is an essential component of any profit-making crime, because without the laundering, crime really doesn’t “pay.”

40 Finance & Development June 2012
ity of the faceless couriers reminded investigators of the char-acters in the eponymous popular cartoon series. and just as the little blue characters from the cartoon have moved from television, to computer games, and now to the movie screen, the term remains alive in the anti–money laundering world.
Highly sophisticated money laundering schemes often involve creating intricate layers of fictitious companies in multiple jurisdictions to conceal the actual criminal who owns and controls the assets. it is not unheard of for a money launderer to set up a trust in one jurisdiction whose sole pur-pose is to be the owner of shares in a holding company in an
offshore center, with “subsidiaries” in third, fourth, and fifth countries whose only business is to open bank accounts the original party can then utilize anonymously. Such nontrans-parent offshore corporate entities were a centerpiece of the massive fraud committed by managers at the U.S. corpora-tion Enron, who were indicted for money laundering as well as for the predicate fraud they committed.
Hitting the economyThe foregoing examples show how financial crimes such as corruption, tax crimes, financial fraud, and insider dealing—all predicate crimes to money laundering—can contribute to economic problems. The impact is felt especially in relatively small financial sectors, as illustrated by the Stanford case, where U.S.-based fraud roiled a small island economy.
Failure to effectively deal with money laundering or ter-rorism financing threats may hinder a country’s access to
the global financial system. For example, the execution of wire transfers to and from countries identified as having weak anti–money laundering regimes will take more time because financial institutions scrutinize such transactions more closely. and when large amounts of criminal proceeds or “hot money” flow into and out of financial institutions the effects can be felt throughout the entire financial system.
anti–money laundering controls can therefore be seen as part of the toolbox both to prevent and to repress these phe-nomena. They contribute to boosting public confidence in times of economic hardship. Effective application of anti–
money laundering tools—including knowing who really owns and controls bank accounts and freezing and seizing the proceeds of crime when criminals are apprehended and convicted—prevents criminals from profiting from their offenses at the expense of the general public and of the economy as a whole.
Ultimately, because money laundering–related behav-ior threatens the soundness of countries’ economies and is a severe impediment to growth, there is no real financial stabil-ity without proper financial integrity—that is, a financial mar-ket free from financial abuse, including money laundering.
anti–money laundering controls, when effectively imple-mented, mitigate the adverse effects of criminal economic activity and promote integrity and stability in financial markets. The international standards in this area were set by the Financial action Task Force (FaTF)—an intergov-ernmental body that develops and promotes policies to
Going topicalThe iMF’s engagement in anti–money laundering and counter-ing the financing of terrorism dates from early 2001. During the past 11 years, the iMF’s efforts in this area helped shape interna-tional policies in the field and included more than 70 assessments, including those of germany, Denmark, and the netherlands, and many technical assistance and research projects.
The iMF has broad experience in conducting surveillance over members’ financial and economic systems, which has provided a firm base for evaluating countries’ compliance with international standards for anti–money laundering and coun-tering the financing of terrorism, and in developing programs to help countries address identified shortcomings. issues related to anti–money laundering and countering the financ-ing of terrorism are being increasingly integrated into the core work of the iMF. Most recently, the iMF Board decided that money laundering, terrorism financing, and their related predicate crimes should be discussed by the iMF staff in con-junction with surveillance of members’ economic systems, if
these issues threaten to undermine the stability of a member’s domestic financial system or otherwise contribute to disrup-tive exchange rate movements.
in 2009, the iMF launched a donor-supported trust fund—the first in a series of topical trust funds—to finance technical assis-tance on anti–money laundering and countering the financing of terrorism. Canada, France, Japan, Korea, Kuwait, Luxembourg, the netherlands, norway, Qatar, Saudi arabia, Switzerland, and the United Kingdom have committed to collectively providing $29.2 million over five years for the financing of the topical trust fund to contribute to strengthening global anti–money launder-ing and countering the financing of terrorism regimes, using the iMF’s proven expertise and infrastructure.
Three years after the launch of the topical trust fund, 53 projects have been approved in 29 countries, and 7 regional workshops have taken place. The topical trust fund will continue to support technical assistance projects on anti–money launder-ing and countering the financing of terrorism around the world.
Money laundering–related behavior threatens the soundness of countries’ economies and is a severe impediment to growth.
Finance & Development June 2012 41
fight money laundering, terrorism financing, and the pro-liferation of weapons of mass destruction. The FaTF’s rec-ommendations address a broad range of issues, including the regulation of services provided by financial institutions and nonfinancial businesses and professions, cross-border movement of currency, transparency of legal entities, sub-stantive and procedural criminal law, institutional capacity, sanctions, and domestic and international cooperation.
on the preventive side, these measures include require-ments to determine whether a customer is acting on behalf of another person; to understand the ownership and con-trol of legal persons; to perform enhanced due diligence for higher-risk categories of customers, business relationships, and transactions; and to carry out other customer due dili-gence and record-keeping measures.
on the enforcement side, anti–money laundering mea-sures enable the authorities not only to bring perpetrators to justice (with generally higher penalties when underly-ing crimes are combined with money laundering) but also, importantly, to deprive them of the assets they have illegally obtained. This reduces the incentive to engage in profit-generating crimes and makes it harder for criminal organi-zations to accumulate dangerous levels of wealth.
Complex webThe global financial system is increasingly interconnected. Money can be transferred through a dozen jurisdictions in a matter of minutes. But financial globalization brings risks as well as such obvious benefits as improvement in the allocation of resources, increased access to capital, greater diversification of risk, and generally enhanced welfare.
Money launderers exploit the complexity and the inter-connectedness of the global financial system as well as dif-ferences between national anti–money laundering laws and systems. They are especially attracted to jurisdictions with weak or ineffective controls where they can move their funds or create corporate vehicles more easily with-out detection. They are able to stay several steps ahead of the bank regulators and the law enforcement authorities, who often have difficulty implementing rapid international cooperation. Moreover, as the examples above show, prob-lems in one country can quickly spread to other countries in the region or in other parts of the world. ■Paul Ashin is a Senior Financial Sector Expert in the IMF’s Legal Department.

42 Finance & Development June 2012
THE global surge in public protests against bad governance and lack of inclusive growth is a timely reminder of the importance of
developing strong institutions and enlarging the formal economy to encourage economic growth and access to opportunity.
Too often, poorly run institutions and excessive regulation force workers and small businesses into the informal sec-tor—the so-called shadow or underground economy—where legal goods and services are produced but are deliberately concealed from the authorities to avoid taxes, labor standards, or other legal requirements.
our research confirms that businesses faced with onerous regulation, inconsis-tent legal enforcement, and corruption have an incentive to hide their activities in the underground economy. We find that insti-tutions are a more important determinant of the size of the underground economy than high tax rates, inflation, or income levels.
as Daron acemoglu and James robinson argue in Why Nations Fail, the main dif-ference between rich and poor countries is their man-made political and economic institutions, not their culture or geogra-phy. The book’s compelling narrative shows that nations prosper when they put in place inclusive and pro-growth institutions and they fail when their institutions benefit the interests of a narrow elite instead of creat-ing economic benefits and political power that are widely shared.
Pluses and minuses Large underground economies pose mul-tiple problems for policymaking. Weak institutions and a large informal sector can
interact in a vicious cycle to further under-mine the quality of institutions that govern and encourage economic activity—the rule of law, absence of corruption, and minimi-zation of unnecessary regulatory burden.
Moreover, large informal economies render official statistics unreliable and incomplete, complicating informed policy-making. and limited participation in the formal economy implies that the benefits of a formal economy—such as property rights protection, access to credit markets, and adequate labor standards—may not be widely accessible. That in turn discourages economic growth and denies economic opportunities to many.
on a more positive note, the informal sec-tor has an important role to play, especially in developing economies, where it may be viewed as the nursery of future economic growth in the formal economy. it serves as an impor-tant buffer against economic uncertainty and underdevelopment in the formal sector by providing livelihood to large segments of the population. indeed, informal economies are much larger in poor and emerging countries than in richer countries.
But firms operating in the informal sector face a variety of constraints that make it difficult for them to do business and grow. These could be infrastructure related, such as access to electricity, land, and water; institutional, which we explore in our research; or related to access to new technologies, financial intermediation, and other benefits associated with participa-tion in the formal economy. For example, unlike in countries with mature property rights systems where capital can be lever-aged extensively for productive activity, in poor countries it is often very difficult to
Governments are wise to shrink their underground economy by improving institutions to build inclusive growth
Anoop Singh, Sonali
Jain-Chandra, and
Adil Mohommad

Finance & Development June 2012 43
establish clear rights to property in the first place, let alone enjoy its benefits, such as the capacity for leveraging one’s savings and protection of formal ownership.
in our research, we explore the relationship between institutional quality and the extent of informality and find, perhaps unsurprisingly, that institutional weaknesses such as excessive regulation and weak rule of law tend to be associated with larger informal economies.
Developing institutions“institutions” is a broad term that covers the nexus of rules that govern social interactions. We refer to formal institu-tions that govern and influence economic activity, focusing
more on the rule of law, absence of corruption, and minimi-zation of unnecessary regulatory burden, which effectively serve to encourage and protect economic activity.
The challenges of developing strong institutions and enlarging the formal economy are interlinked. Strengthening institutions requires the ability to enforce rules and protect rights while preserving economic incen-tives. a state must have ample resources and capacity if it is to improve institutional quality.
But an economy beset by a large informal sector may not have enough resources to implement the improvements in institutional capacity that are needed to reduce the scope of informal activity. if the government tries to raise resources through higher taxation, that may cause the informal econ-omy to grow as firms seek to avoid higher taxes, and erode state capacity even further. That sets off a vicious cycle that may prolong the “bad equilibrium” of weak institutions and limited formal sector development.
How deep? Estimating the size of the informal economy is difficult, given that the very purpose of operating underground is often to avoid detection, and countries may lack the capacity to monitor underground activity. although there are no direct measures of the size and composition of the underground economy, a number of indirect methods exist, including extrapolating from the excess demand for cash, unaccounted-for consumption of electricity, or labor market trends. These indirect approaches to measuring
the size of the shadow economy suggest it is sizable in many coun-tries (see map).
Estimates for 2006 find that the shadow economy in most advanced economies ranges from 14 to 16 percent of gDP, and 32–35 per-cent of gDP in emerging econo-mies (Schneider, Buehn, and Montenegro, 2010). Underground economies are much larger in Latin america, Central america, and africa—often more than 40 percent of gDP—while in the Middle East and developing asia they range between 25 and 35 percent of gDP. Shadow economies remain sizable, but they have shrunk over time.
The extent of informality may also vary by sector within coun-tries, depending on the nature of the activity. For example, the ser-vices sector, such as petty/street retail and household services, and subsistence farming may be entirely informal, requiring little capital and/or low skill levels. Labor-intensive manufacturing
Helping outThe iMF has been involved in supporting the development of economic institutions in the context of providing both surveillance advice and technical assistance to its mem-bers. The iMF has been at the forefront of the reform of the financial regulatory and supervisory frameworks in the aftermath of the global financial crisis. and to directly com-bat the problem of the underground economy, the iMF has been supporting members with technical assistance on poli-cies for combating money laundering and the financing of terrorism, and on larger governance and institutional issues when large underground sectors are thought to have macro-economic implications.
Roadside cobbler in Harare, Zimbabwe.

44 Finance & Development June 2012
firms may be highly informal. and activities requiring high levels of skill and capital take place primarily in the formal sector.
Taxing times There is considerable debate on how an increase in taxa-tion affects underground economic activity.
on the one hand, more burdensome tax regimes (includ-ing high tax rates and administration) may entice firms to move underground to evade taxes and boost profits. Estimates show that if the tax burden as perceived by firms
becomes more onerous, the size of the shadow economy rises by 11.7 percentage points (Johnson, Kaufmann, and Zoido-Lobaton, 1998).
in contrast, higher taxes may also be associated with a smaller underground economy, as the former may lead to stronger revenues and better public goods provision, including a more robust legal environment, thereby encouraging firms to operate in the official sector.
an alternative view is that political, economic, and social institutions are the main drivers of underground economic activity. indeed, regulatory burden, more corruption, and a weaker legal environment are all correlated with a larger unofficial economy. regulatory burden includes costs related to complying with license restrictions and leads to increased
costs for firms, which may encourage a move to the shadow economy. a 1 percentage point increase in the regulation burden (as measured by the Heritage Foundation index) is associated with a 12 percent increase in the size of the under-ground economy (Friedman and others, 2000).
Cumbersome labor market restrictions often lead to an increase in the amount of informal employment and thereby feed the underground economy. The international Labor organization estimates that more than 70 percent of work-ers in developing countries are outside the official economy, even though the underground economy makes up a much lower share, at about 35 percent of gDP.
overly stringent labor market regulations have the unin-tended consequence of encouraging informal labor arrange-ments because they raise the cost of hiring for firms. restrictions on hiring and firing intended to protect workers have instead discouraged firms from hiring in the formal labor market, because compliance tends to be expensive and cumber-some. instead, firms hire informal workers, pay them under the table and avoid providing health insurance and other benefits.
another drawback of operating in the informal sector is the lack of access that firms and individuals have to the for-mal financial sector. in many developing countries, less than half the population has an account with a financial institu-tion, and in some countries fewer than one in five households do. This lack of access to finance traps firms in low-produc-tivity operations and perpetuates inequality as they rely on their own, often limited, resources to start businesses.
Quantifying the theoryour research based on data for nearly 100 countries finds that: • Better institutions are associated with a significantly
smaller shadow economy. if overall institutional qual-
50–60 +
40–50
30–40
20–30
10–20
0–10
No data
Casting a long shadow The underground economy has a signi�cant presence in much of the world.(percent of GDP, 2006)
Institutions are the most important determinant of the size of the underground economy.
Source: Schneider, Buehn, and Montenegro (2010).Note: The boundaries, colors, denominations and any other information shown on this map do not imply, on the part of the IMF, any judgment on the legal status of any territory, or any endorsement or
acceptance of such boundaries.

Finance & Development June 2012 45
ity improves by 1 standard deviation, the shadow economy shrinks by almost 11 percentage points. Furthermore, a simi-lar improvement in the rule of law is associated with an 8 per-centage point reduction in the share of the shadow economy. • Institutions are the most important determinant of
the size of the underground economy. once we control for institutions, other factors, such as tax rates, inflation, and per capita income are no longer statistically significant. it is not higher taxes themselves that increase the shadow economy but rather weak institutions and rule of law. Businesses have an incentive to go underground not to avoid high taxes but to avoid regulations and the adminis-trative burden they impose.• Countries with more corruption tend to have larger
underground economies. a relatively small increase in cor-ruption leads to a much larger increase in the size of the shadow economy.
Taking action The underground economy is a significant part of many countries’ economies and represents a vital growth opportu-nity, especially for developing countries. Due to the variety of problems facing informal economic activity, persistent large informal sectors can lead to low productivity and low growth in the sectors in which they prevail, necessitating policies to remedy the problem. Maximizing inclusive growth requires an understanding of the incentives motivating underground activity, to bring as many people as possible into the formal economy. The literature offers some ideas on how the infor-mal sector can be unshackled, and integrated into the formal sector. For example, governments that wish to shrink the shadow economy could focus on strengthening the rule of law, creating access to the formal economy, and strictly en-forcing only the minimum necessary regulations.
a key enabling condition for private sector activity to flourish is a well-functioning property rights system. Firms in the formal economy that enjoy these rights and protec-tions can leverage assets into working capital and grow their
businesses. De Soto (2000) argues that recognizing the assets of the informal sector as property might help convert these assets into capital that can be used for investment. in general, institutional reform should include measures to ease regula-tory burdens where possible and strengthen the rule of law to effectively enforce the minimum necessary set of regulations. Country-specific and sector-specific circumstances will of course guide the precise path and desirable sequencing of policy measures, which will vary considerably.
given this central role of institutions in discouraging the growth of underground economies and catalyzing long-term economic growth, institutional development must take cen-ter stage. in addition to developing a strong legal and judicial framework as the basis for good institutions, it is also impor-tant to give priority to the establishment and strengthen-ing of economic institutions, which in turn have a powerful impact on macroeconomic stability, access to and security of property rights, and free trade. ■Anoop Singh is the Director of the IMF’s Asia and Pacific Department. Sonali Jain-Chandra is a Senior Economist, and Adil Mohommad is an Economist, also in that department.
References:Acemoglu, Daron, and James A. Robinson, 2012, Why nations Fail:
origins of Power, Prosperity, and Poverty (New York: Crown Publishing).De Soto, Hernando, 2000, The Mystery of Capital: Why Capitalism
Triumphs in the West and Fails Everywhere Else (New York: Basic Books).Friedman, E, S. Johnson, D. Kaufmann, and P. Zoido-Lobaton, 2000,
“Dodging the Grabbing Hand: the Determinants of Unofficial Activity in 69 Countries,” Journal of Public Economics, Vol. 76, pp. 459–93.
Johnson, S., D. Kaufmann, and P. Zoido-Lobaton, 1998, “Regulatory Discretion and the Unofficial Economy,” american Economic review, Vol. 88 (May), pp. 387–92.
Schneider, F, A. Buehn, and C. Montenegro, 2010, “New Estimates for the Shadow Economies All Over the World,” international Economic Journal, Vol. 24, No. 4, pp. 443–61.
Like what you’re reading?
Then like us on Facebook!www.facebook/financeanddevelopment

46 Finance & Development June 2012
UnTiL problems surfaced during the global finan-cial crisis, money markets were often taken for granted as plain-vanilla, low-volatility segments of the financial system.
For the most part, money markets provide those with funds—banks, money managers, and retail investors—a means for safe, liquid, short-term investments, and they offer borrow-ers—banks, broker-dealers, hedge funds, and nonfinancial corporations—access to low-cost funds. The term money mar-ket is an umbrella that covers several market types, which vary according to the needs of the lenders and borrowers.
one consequence of the financial crisis has been to focus attention on the differences among various segments of money markets, because some proved to be fragile, whereas others exhibited a good deal of resilience.
For the short term These markets are described as “money markets” because the assets that are bought and sold are short term—with maturities ranging from a day to a year—and normally are easily convertible into cash. Money markets include markets for such instruments as bank accounts, including term cer-tificates of deposit; interbank loans (loans between banks); money market mutual funds; commercial paper; Treasury bills; and securities lending and repurchase agreements (repos). These markets comprise a large share of the financial system—in the United States, accounting for about one-third of all credit, according to the Federal reserve Board’s Flow of Funds Survey.
These money market instruments, many of them secu-rities, differ in how they are traded and are treated under financial regulatory laws as well as in how much a lender relies on the value of underlying collateral, rather than on an assessment of the borrower.
The most familiar money market instruments are bank deposits, which are not considered securities, even though certificates of deposit are sometimes traded like securities. Depositors, who are lending money to the bank, look to the institution’s creditworthiness, as well as to any government programs that insure bank deposits.
interbank loans are not secured by collateral, so a lender looks exclusively to a borrower’s creditworthiness to assess
repayment probabilities. The most closely watched interbank market is in England, where the London interbank offered rate (LiBor) is determined daily and represents the average price at which major banks are willing to lend to each other. That market did not prove to be a reliable source of fund-ing during the crisis. LiBor rates rose sharply in compari-son to other money market rates once the creditworthiness of banks was called into question. Moreover, lending volume decreased significantly as banks struggled to fund their exist-ing assets and were less interested in new lending. Emergency lending by central banks helped make up for the contraction of this funding source. recent investigations by regulatory authorities have also called into question the integrity of the pricing process by which LiBor is determined.
Commercial paper is a promissory note (an unsecured debt) issued by highly rated banks and some large nonfinan-cial corporations. Because the instrument is unsecured (no more than a promise to pay, hence the name), investors look solely to the creditworthiness of the issuer for repayment of their savings. Commercial paper is issued and traded like a security. But because it is short term by nature and not pur-chased by retail investors, it is exempt from most securities laws. in the United States, for example, commercial paper is issued in maturities of 1 to 270 days, and in denomina-tions that are deemed too large for retail investors (typically $1 million, but sometimes as small as $10,000).
The safest investmentTreasury bills, which are issued by the government, are secu-rities with maturities of less than a year. U.S. Treasury bills, sold at a discount from face value and actively bought and sold after they are issued, are the safest instrument in which to place short-term savings. The markets are deep and liquid, and trading is covered by securities laws. U.S. Treasury bills are not only savings instruments; they can be used to settle transactions. Treasury bills, which are issued electronically, can be sent through the payments system as readily as money.
repos are an important large, but more complicated, seg-ment of money markets. repos offer competitive interest rates for borrowing and lending on a short-term basis—usu-ally no more than two weeks and often overnight. a borrower sells a security it owns for cash and agrees to buy it back from
What Are Money Markets?They provide a means for lenders and borrowers to satisfy their short-term financial needs
Randall Dodd
BACK TO BASICS
46 Finance & Development June 2012

Finance & Development June 2012 47
the purchaser (who is in effect a lender) at a specified date and at a price that reflects the interest charge for borrowing over the period. The security at the heart of the transaction serves as collateral for the lender.
Besides making possible secure short-term borrowing and lending in money markets, repo and other securities lending markets are critical to short-selling—when a trader agrees to sell a security he or she does not own. To come up with such a security, the short-seller must borrow it or purchase it tem-
porarily through a repo transaction. When it is time to return the security to the lender, the short-seller again must buy or borrow it. if the price has fallen, the short-seller makes money on the transaction.
Money market mutual funds (MMMFs) are securities offered by companies that invest in other money market instru-ments—such as commercial paper, certificates of deposit, Treasury bills, and repos. Money market mutual funds are reg-ulated as investment companies in the United States and in the European Union. They offer low-risk return on a short-term investment to retail and institutional investors as well as corpo-rations. a typical MMMF invests in liquid, short-term, highly rated instruments. although the price is not fixed or guaran-teed, the fund is managed so that the price is constant—or in securities parlance, maintains a stable net asset value, usually $1 a share. (This is in contrast to other mutual funds that invest in stocks or bonds and whose per share value changes daily.) if the value of the underlying MMMF assets rises above $1 a share, the difference is paid as interest. Until the global crisis, a money market fund with a net value of less than $1 a share—or breaking the buck, as it is called—was almost unheard of. The few times it happened, the fund’s investment managers used their own resources to keep the price at $1 a share.
But during the financial crisis, money market funds were threatened by losses on commercial paper and later on notes issued by Lehman Brothers (the broker-dealer that went bankrupt in September 2008). Because MMMFs are impor-tant players in other crucial money markets, the U.S. gov-ernment acted to prevent a panic that might have caused the credit contraction to spread. The U.S. Treasury guaranteed principal and the Federal reserve created a special lending facility for commercial paper to help MMMFs stave off a run by investors.
Dysfunctional marketsThere are some other sectors of the money market that are not so plain and simple. These include asset-backed com-mercial paper (aBCP) and certain triparty repo transactions.
a firm with hard-to-sell (illiquid) financial assets, such as loans, mortgages, or receivables, might use aBCP to borrow
at a lower cost or to move these assets off its balance sheet. it creates a special purpose entity that purchases the illiquid assets from the firm and finances the purchase by issuing aBCP, which—unlike normal commercial paper—is secured or “backed” by the underlying assets. This type of commer-cial paper can obtain a high credit rating if the assets are rated highly and if the special facility has adequate capital and lines of credit. The capital is intended to cover unexpected losses on the assets, and the lines of credit take into account the dif-
ficulty of selling the underlying assets to meet cash needs.Some parts of the aBCP market had problems during the
crisis. Standard commercial paper issuers—almost exclusively large nonfinancial corporations and banks—file quarterly financial statements that enabled investors to easily assess their credit condition. The credit risk on aBCP depended on, among other things, how the special purpose entity was set up, its credit enhancements, its liquidity backstop, and the value of the underlying assets—all likely to be less transparent and more complex than that of the straightforward commercial paper. in the United States, the aBCP market shrunk by 38 percent from august to november 2008.
That hit the MMMF market, which holds more than one-third of outstanding commercial paper. When investors began to withdraw funds from MMMFs, the funds pivoted sharply away from aBCP and into government and agency securities.
The triparty repo market proved to be much less reliable than the ordinary repo market for Treasury and agency securities. The triparty repo market is organized around one or two clearing banks that hold the collateral and trans-fer ownership from borrower to lender and back again when the loan is repaid.
The triparty repo market was roiled by the collapse of markets for privately issued securities backed by mort-gages. These securities made up a large share of the collat-eral in the triparty repo market. once the market value and the credit ratings of these securities fell and the trading in these securities dried up, the triparty market suffered from both the higher haircuts (the percentage by which a lender reduces the value of a security for collateral purposes) needed to offset the volatility in the securitized debt market and the difficulty of pricing collateral that no longer had a market price.
Together the crises in the aBCP and triparty repo markets spread funding problems to banks, securities firms, and hedge funds that had used these money markets to fund investments. Today those markets have shrunk dramatically. ■Randall Dodd is a Financial Economist at the U.S. Treasury Department.
Finance & Development June 2012 47
During the financial crisis, money market funds were threatened by losses on commercial paper and later on notes issued by Lehman Brothers.

48 Finance & Development June 2012
SoUTH asia has added nearly 10 mil-lion people a year to its labor force for the past decade, while increasing wages and reducing poverty. Both the
quantity and quality of jobs have improved. But the employment challenge for the next two decades is more difficult than in the two preceding ones.
South asia—the islamic republic of afghanistan, Bangladesh, Bhutan, india, Maldives, nepal, Pakistan, and Sri Lanka—will account for 40 percent of the growth in the world’s working-age (15–64) popula-tion until 2050. The region’s employment policies are therefore of global importance. South asia needs to add new jobs, and bet-ter jobs—jobs that increase real wages and reduce poverty.
Track recordEmployment growth in south asia has broadly paralleled growth in the working-
age population. indeed, the ranking of five large countries in the region in descending order of employment growth—Pakistan, nepal, Bangladesh, india, and Sri Lanka—coincides with their ranking by growth of the working-age population.
not only have jobs increased in num-bers, but their quality has improved as well. The two criteria used to assess job qual-ity are poverty among the self-employed (employers, independent workers, and unpaid family workers) and real wages for wage workers. Wage workers include casual laborers—who are paid on a daily, irregular, or piece-rate basis—and regu-lar wage or salary earners, who receive a regular payment from a job in the public or private sector and usually earn leave and supplementary benefits. Poverty in south asia has declined among the self-employed (see Chart 1). at the same time, real wages have increased for casual wage workers and
A rapid increase in south Asia’s labor force calls for cross-sectoral policy reforms to support continued growth of high-quality jobs
Man working at the Western Marine shipyard in Chittagong, Bangladesh.
More Jobs, BetterJOBSKalpana Kochhar, Pradeep Mitra, and Reema Nayar

Finance & Development June 2012 49
regular wage earners. Poverty rates have fallen for wage workers as well.
The composition of the labor force among these three broad employment types has shown little change over time, however (see Chart 2). Self-employed people comprise the largest share, reflecting the predominance of agriculture in much of the region. Casual laborers are next. although pov-erty has fallen for each employment type, it is persistently highest for casual laborers and lowest for regular wage or salary workers.
Thus, improvements in job quality have occurred pre-dominantly within each broad employment type rather than through movement across types. But there is movement at the level of individual workers. in rural Bangladesh, india, and nepal, for example, education facilitates a transition from agriculture to better jobs in industry and services in the nonfarm economy, whereas a lack of education makes a move from the nonfarm economy to agriculture more likely. indeed, in rural india, for example, workers with lower lev-els of education are about three times as likely to lose non-farm jobs as they are to secure them.
improvements in job quality are primarily due to growth in gDP, with variations across countries. growth has broadly increased in Bangladesh, india, and Sri Lanka over the past several decades. While growth in Pakistan has trended downward in recent decades, it has been volatile, with a sharp upswing between the 1990s and the 2000s. Job quality in slow-growing nepal has improved due to massive outmigration of labor from the country, which pushed real wages higher for those remaining, while a flood of workers’ remittances—estimated at a quarter of gDP—accounted for half of the decline in the poverty rate.
Much of the growth in gDP per worker in south asia that underlies these favorable developments is due more to rapid growth in total factor productivity—a combination of changes in the efficiency with which inputs are used and changes in technology—than to growth in physical capital per worker and education. Looking ahead, while growth in total factor productivity will continue to play a major role, higher rates of physical and human capital accumulation will be necessary to absorb new entrants into the labor force.
Steep climb aheadabsorbing south asia’s growing labor force will require adding 12 million jobs every year between 2010 and 2030. and if rates of female participation in the labor markets of the region’s three largest countries (Bangladesh, india, Pakistan)—currently among the low-est in the developing world—increase as they have in some east asian coun-tries, that figure rises to nearly 15 mil-lion jobs, the equivalent of adding the
population of Jakarta every year. These additions would be 20 to 50 percent higher than the annual increase between 1990 and 2010.
These entrants into the labor force could be absorbed in jobs producing progressively lower output per worker in low- and lower-middle-income countries, where the absence of safety nets precludes open unemployment. other things being equal, the more new entrants, the lower the output per worker of the additional jobs created to absorb them.
But the region’s employment challenge is to create jobs at higher levels of output per worker. This calls for accelerated movement of labor out of agriculture and into industry and services, where output per worker is higher—as was the case in east asia during its years of high growth—as well as moving labor from lower-productivity to higher-productiv-ity firms within industry and services.
While continued high growth is desirable, it cannot nec-essarily be relied on to meet this employment challenge. international experience suggests that it is a lot harder to sustain high growth than ignite it. Structural reforms will thus be necessary on both the demand and supply sides of the labor market.
Population growth will swell the numbers entering the labor force. But the age composition of that growth has the potential to mitigate the employment challenge. The “demo-graphic transition”—the period during which the number of working-age people grows more rapidly than that of their dependents—can provide a tailwind in support of policy reform for the next two to three decades in much of south asia. The resources saved as a result of fewer dependents provide a “demographic dividend.” This dividend can be used for the high-priority physical and human capital investments necessary to create better jobs. But harnessing the dividend requires a business environment conducive to factor accumulation so that the potential savings can be turned into actual investments. Because it takes time for policies to have an impact and the demographic window
0
10
20
30
40
50
60
70
80
Kochhar, 4/19/12
Chart 1
Less poverty Poverty is declining overall but is persistently the highest among casual workers. (percent of workers in households below the poverty line, by employment status)
Source: World Bank (2012).
0
10
20
30
40
50
60
70
80
0
10
20
30
40
50
60
70
80
2000 2005 2010 1995 2003 1983 1993 1999 2004
Bangladesh India Nepal
All regular wage salaried All self-employed All casual labor All workers

50 Finance & Development June 2012
is expected to close around 2040 for most of south asia, giving way to old-age dependency, strengthening policy reforms is particularly urgent.
Constraints on job growthask managers of south asian urban formal sector firms that have created jobs to list the top three constraints on their ability to operate and grow. Despite the diversity of the region, they will answer, “electricity, corruption, and political instability.” The constraints are typically more severe for a firm that has expanded employment—which puts more demands on, for example, the electricity supply, roads, the judiciary, and other dimensions of the business environment—than for a firm that has not increased hiring (see Chart 3).
Electricity constraints in some south asian countries, such as afghanistan, Bangladesh, and nepal, are higher than those faced by similar firms (in size, sector, location, nature of ownership, and degree of international engagement) in
countries with similar income levels elsewhere in the devel-oping world. During 2000–10, virtually 100 percent of firms in these countries experienced power outages every month. Companies cope by using generators to mitigate the effects of uncertain power supply—a costly solution that is more common in south asia than in countries with similar income levels elsewhere. Electricity access is also among the top constraints reported by rural industry and service firms in Bangladesh, Pakistan, and Sri Lanka and by urban informal sector firms in india.
another constraint ranked high by firms is corruption in dealings between firms and the government. Bribes and the amount of time managers must spend with officials from the public utilities or tax administration raise the cost of doing business. Political instability, particularly in coun-tries in conflict or during and after conflict is another con-straint on firm operations.
addressing problems in the power sector is a clear prior-ity. reforms require public and private investment—which is ongoing—to reduce the large gap between demand and supply, together with tariff adjustments, improved tariff collection, and enhanced capacity and regulatory agency independence to improve the financial and commercial viability of the power utilities. improvements in the gover-nance of the utilities are equally important.
Early intervention another priority for all south asian countries is to improve the quality of learning at all levels of education and impart
the analytical and behavioral skills that employers demand of graduates—which they currently lack. But the greatest human capital investment payoffs may well come from interventions before children begin formal schooling.
South asia has the world’s highest rates of malnutrition for children under age five—even higher than in sub-Saharan africa (see Chart 4)—and some of the highest levels of ane-mia and iodine deficiency. and there is considerable evi-dence, including from south asia, that improved nutrition enhances lifetime learning and labor market productivity.
income growth alone will not pre-vent malnutrition. Early childhood interventions must address nutri-tion, hygiene, early cognitive stim-ulation, and effective preschool programs for the disadvantaged if irreversible cognitive impairment is to be prevented.
although there are some prom-ising pilot early childhood inter-vention programs, there are very few large-scale programs in south asia. Establishing these programs would improve the prospects for children’s success in school and, eventually, in the labor market.
Hiring and firingEmployers in formal sector manu-facturing in india are much more
Kochhar, 4/19/12
Chart 2
Same old story There has been little movement of workers between broad job categories over time.(percent of total workers ages 15–64, by employment type)
Source: World Bank (2012).Note: Regular wage salaried refers to all wage workers in Sri Lanka, because data do not identify casual wage workers separately.
Bangladesh India Nepal Pakistan Sri Lanka
0
20
40
60
80
100
Casual labor Self-employed Regular wage salaried
2000 2005 1983 1993 1999 2004 2009 1995 2003 1999 2008 2000 2008
There is considerable evidence, including from south Asia, that improved nutrition enhances lifetime learning and labor market productivity.

Finance & Development June 2012 51
likely to adjust their workforce by creating and eliminating jobs for nonpermanent contract workers than for regular wage and salary earners. indeed, the sum of job creation rates (jobs created during a year divided by average employment during the year) and job destruction rates (jobs lost during a year divided by average employment during the year) for con-tract workers in large manufacturing firms in india is twice as high as for regular workers. This is partly due to labor regulations, which managers in india and their counter-parts in nepal and Sri Lanka report as a significantly more severe constraint on the operation and growth of their busi-ness than do similar firms (in terms of size, sector, location, nature of ownership, and degree of international engage-ment) in countries with comparable per capita incomes.
The high cost of dismissing regular workers is, in effect, a tax on hiring them. reforms to encourage job creation in the formal economy should lower these costs, which protect only a minority of workers. Such reforms should go hand in hand with those that help all work-ers—in both the formal and informal sectors—adjust to labor market shocks and improve their future earning potential. reforms include income support in the event of unemployment complemented by active labor market programs, including cost-effective training and employ-ment services. Building incrementally on existing pro-grams, especially for the informal sector, is likely the best way to proceed.
Investing in jobsSouth asia has created many jobs, including higher-quality ones. it is the quality of jobs that is more important, because
the quantity has grown broadly in line with the working-age population.
South asia’s employment challenge—absorbing a labor force that could be 20 to 50 percent bigger in the next 20 years than in the previous 20 and doing so with rising lev-els of output per worker—requires moving workers more rapidly, both from farms to industry and services and from lower- into higher-productivity jobs within industry and services. This calls for investment in physical capi-tal: in electricity, for example, where an unreliable power supply hinders the growth of job-creating firms. But it also demands investment in human capital. Equipping a worker to move out of agriculture requires education and acquisition of skills demanded by employers.
Such investment depends on wide-ranging policy changes to facilitate investment in electricity, increase the reach and quality of education, and reduce the cost of hiring and firing workers. The conditions these reforms foster are important for job creation anywhere. But they are even more urgent in south asia. The demographic transition may provide a favorable tailwind, but it won’t blow forever, and policies take time to bear fruit. ■Kalpana Kochhar is Chief Economist, and Reema Nayar is a Lead Economist, both in the South Asia Region of the World Bank. Pradeep Mitra, a former Chief Economist in the Europe and Central Asia Region, is a consultant in the South Asia Region of the World Bank.
This article is based on the 2012 World Bank report More and Better Jobs in South asia, prepared under the direction of Reema Nayar.
Kochhar, 4/27/12
Chart 3
Limiting factors The top constraints on growth for south Asian �rms with similar characteristics across countries—“benchmark �rms”—in the urban formal sector are political instability, access to electricity, and corruption. They are more severe for job-creating �rms.(index, 0–4 )
Source: World Bank (2012).
0 0.5 1.0 1.5 2.0 2.5 3.0
Political instabilityAccess to electricity
CorruptionTax administration
Government policy uncertaintyMacro instability
CompetitionCrime, theft, disorder
Access to landCustoms
Inadequate educated laborLabor regulations
TransportationBusiness licensing
CourtsTelecommunications
Severity of constraint(0 = no obstacle; 4 = very severe obstacle)
Benchmark �rmExpanding �rm
Kochhar, 4/19/12
Chart 4
Nourish childrenThe biggest payoffs may well come from addressing poor nutrition in early childhood; south Asia has the weakest indicators in the world.
(percent of children under age �ve)
Source: World Bank (2012).Note: LAC = Latin America and the Caribbean; EAP = east Asia and Paci�c; MENA = Middle East and
North Africa; SSA = sub-Saharan Africa; SAR = south Asia.
Sri La
nka
Maldive
s
Bhuta
n
Pakis
tan
Bang
lades
hInd
iaNep
al
Afgha
nistan LA
CEA
PMEN
AWorl
dSS
ASA
R0
10
20
30
40
50
60Low height for ageUnderweightLow weight for height

52 Finance & Development June 2012
aUSTEriTY has become one of the buzzwords of the decade. governments the world over seem to have accepted it as a mat-
ter of course. it is held up proudly by some, embraced reluctantly by others.
Yet the debate surrounding austerity con-tinues. in one corner are those who push for more deficit-cutting measures, while in the other sit those who believe that it is time for governments to suspend their efforts to reduce deficits now, given the weak global economy.
one way to enlighten this debate is to focus on the current state of the world economy, rather than on how economies operate in nor-mal circumstances. With an eye on the pres-ent, it is clear that a pragmatic approach—a steady pace of adjustment within a clear medium-term framework—is the best course of action.
Picture the captain of a ship, whose cargo must be brought safely and quickly to its destination. The move to austerity, like the captain’s conduct, must be guided by a clear plan, and keep a steady course in sometimes stormy waters.
Steady as she goesWhat is the current climate—the special cir-cumstances that characterize the global eco-nomic picture right now—and what does it imply for fiscal policy management? i will focus on advanced economies, because this is where fiscal imbalances are larger and the debate is more heated.
advanced economies are recovering from the largest economic shock since the great Depression. governments attempted to stimu-late economic growth by increasing their fiscal deficits, which was for the most part successful, but now there is a need to scale back deficits to get their fiscal houses in order. Yet in most advanced economies, unemployment remains high and output far below potential. in these
circumstances, the changes in economic out-put brought about by reducing the government deficit—the so-called fiscal multiplier—are larger than those traditionally discussed in economic literature. Traditional estimates of fiscal multipliers often ignore whether an economy is growing rapidly, faltering badly, or is somewhere in between. This is because when output is near or above capacity, a deficit reduction is more likely to lower inflation and less likely to lower output. So estimates of the fiscal multiplier that include periods when an economy is booming lead to underestimation of the magnitude of the multipliers. it is like trying to assess the effectiveness of an umbrella by looking at how much it protects you from rain even on days when the sun is shining. Umbrellas are helpful when it rains; when the sun is shining they are not very useful. and you really can’t assess their true effectiveness over an average of rainy and sunny days.
in addition, multipliers tend to be particu-larly high during the current phase because interest rates are already at record lows and so fiscal tightening cannot be offset by mon-etary relaxation.
Vagaries of the marketsSome might argue that a fiscal contraction that has an expansionary effect on the econ-omy is at least a possibility in countries where spreads are high; that is, where governments now must borrow at high interest rates and where austerity measures could trigger a return to market confidence. The reasoning is that such action will inspire markets’ con-fidence in governments and in their ability to manage their deficit and debt. Easing mar-kets’ concerns should lead to lower borrow-ing costs for governments, which may spread to the rest of the economy.
But a confidence-inspired decline in inter-est rates on government debt—something that very well might accompany fiscal tight-
Age of AusterityAdvanced economies face a harsh environment as they chart a course to balanced budgets and lower debt
Carlo Cottarelli
Carlo Cottarelli is Director of the IMF’s Fiscal Affairs Department.
STRAIGHT TALK

Finance & Development June 2012 53
ening in more normal times—could be impeded by markets’ current focus on short-term developments.
if the market sentiment is that fiscal tightening will slow growth in the short term, spreads will not decline because of the fear that sluggish growth will depress tax revenues and discourage governments from sustaining fiscal adjust-ment over time. This problem is exacerbated by the danger that—when a country’s public debt is high compared with its overall output—fiscal tightening might drive up the pub-lic debt–to-gDP ratio in the short run. This scenario, again, assumes that output slows when fiscal policy is tightened.
So two self-fulfilling prophecies are possible: • if markets anticipate that tightening will not slow
growth, spreads could fall and growth could indeed be sus-tained despite fiscal tightening. • if markets anticipate that tightening will slow growth,
spreads could rise and growth would suffer as deficits are cut. The recent downgrade of some European countries’ credit
rating by Standard & Poor’s, which cited the negative impact of fiscal tightening on growth, suggests that market behavior will lead to the latter, less appealing, outcome.
it’s safe to say that sizable fiscal tightening will have a con-tractionary effect on the economy, a problem that will be magnified by simultaneous fiscal policy tightening by most advanced economies. it would help to spread out the adjust-ment, postponing some of it until output has recovered and the credit channel is stronger.
Some argue that the fiscal multiplier would be small or even negative (a fiscal contraction leading to an output expansion) if fiscal tightening is implemented through cuts in government spending rather than by raising taxes. But i disagree. The factors that support the recovery of private sec-tor demand—namely, monetary policy expansion, a lower-ing of the exchange rate, a decline in spreads—will suffer no less from spending cuts than from revenue increases. i would agree that, for most advanced economies, spending cuts are preferable to tax hikes. But this is for structural reasons—not because one approach costs significantly less over the short term. Potential growth in countries where tax rates are already high, as in most European countries, would suffer in the long run from further increases.
On the movealtogether, one can conclude that fiscal tightening is likely to impact negatively on output in the short run. This implies that countries where economic activity is already weak would benefit from a more gradual pace of fiscal adjustment. it would help to spread out the adjustment, postponing some of it until output has recovered. So, if moving too quickly with fiscal adjustment involves output costs, why move at all? Why is it appropriate to start tightening fiscal policy now rather than just postponing it until times are better? The answer is obvious for countries that are already under market pressure. given the difficulty of borrowing at sustainable interest rates, how-ever, these countries’ fiscal adjustments will have to be front loaded: most of the deficit reduction must take place sooner rather than later.
What about other economies? They definitely have more room to maneuver fiscally and could have a more moderate pace of adjustment. But even for them, barring a major deceleration in economic activity, postponing the adjustment altogether—or even implementing an expansionary fiscal policy—would be too risky in the current circumstances for three reasons:• Public debt hasn’t been this high since World War
ii. High public debt levels are hard to sustain, but—more important—when public debt is high even small increases in interest rates can derail public finances. Under these condi-tions, deferring austerity measures is riskier.• Market preoccupation with short-term developments
makes it more difficult to trade medium-term fiscal tighten-ing for short-term fiscal expansion—for example, reforms in pension and health care spending that would reduce medium-term deficits and allow increased spending in the
near term. Spreads do not seem to take into account dif-ferences in long-term social spending, which suggests that future reforms will buy little credit from markets today.• The greek debt restructuring has shattered the assump-
tion widely held throughout the post–World War ii period that debt restructuring does not happen in advanced econo-mies. So markets are more nervous about fiscal developments than ever before.
Risk managementThe relative importance of these three factors varies across countries. But the main message is that postponing fiscal adjustment until better times is now more difficult than in the past. Credibility seems to require a down payment in the form of some nontrivial fiscal tightening. a gradual approach would avoid the risk of having to tighten too rapidly later should markets start having doubts about credibility. Moreover, some of the costs related to fiscal adjustment dis-cussed above—for example, a possible rise in spreads when fiscal policy is tightened as growth slows—are more likely to occur with large cuts to deficits than with moderate ones.
The last thing the world economy needs in this uncertain environment is a knee-jerk fiscal policy reaction. Thus, for countries that are not under market pressure, proceeding at a steady speed—with some consideration for cyclical develop-ments, particularly by allowing fiscal multipliers to operate fully—with a clear sense of direction and with a mix of aus-terity measures that takes into account long-term efficiency goals is the right thing to do. ■
The Greek debt restructuring has shattered the assumption . . . that debt restructuring does not happen in advanced economies.

BOOK REVIEWS
54 Finance & Development June 2012
Waiting to Be Heard
Janet Byrne (editor)
The Occupy Handbook
Back Bay Books, New York, 2012, 256 pp., $15.99 (paper).
“This is a demand to be heard. it’s a demand to have a voice. People feel voiceless.
They want a voice and participation, a renewed sense of self-determination,” says activist Jon Friesen of occupy Wall Street. David graeber, the anthropologist who championed the consensus-driven general assembly that became the hallmark of occupy Wall Street, calls it a fundamentally anarchist movement whose mes-sage is “that the american political order is absolutely and irredeemably corrupt, that both parties have been bought and sold by the wealthiest 1 percent of the population, and that if we are to live in any sort of genuinely democratic society, we’re going to have to start from scratch.”
Friesen’s and graeber’s words are recorded in The Occupy Handbook, a collection of 56 essays that analyzes where the occupy movement came from, where it is today, and what it might accomplish. For better or for worse, the voices of the actual occupiers are far outnumbered by those of their analysts, interpreters, and well-wishers.
occupy Wall Street serves as a jumping-off point for accounts of the financial crisis. Economists Carmen reinhart and Kenneth rogoff pro-vide a summary of their research on financial crises; former iMF chief economist raghuram rajan argues that inequality encouraged the U.S. government to support easy credit; journalist Bethany McLean, known for her work on the Enron scandal, reminds us that the housing bubble was driven by cash-out refinancing, not home purchases; while Financial Times writer gillian Tett identi-fies social silence—that which is accepted without discussion—as a weakness of today’s complex finan-cial sector. These are useful insights, but they do not go to the heart of the occupy phenomenon.
Warren Buffett famously noted that it is only when the tide goes out that you learn who’s been swim-ming naked. one might add: it’s only when the tide goes out that you learn who can’t afford clothes. The financial crisis exposed the deeper problem of inequality that has been growing for decades. as economist Emmanuel Saez reminds us (draw-ing on research with fellow French academic Thomas Piketty), the top 1 percent have captured half of all income growth in the United States since the 1970s.
The recent crisis only deepened the insecurity that ordinary fami-lies had been living with for years. The government’s generous support for large banks, contrasted with its apparent inability to help homeown-ers facing foreclosure at the hands of those same banks, only strengthened the belief that Washington is in the pocket of large corporations and the rich. This mix of economic des-peration and political powerlessness fueled the occupy movement, which author and attorney Scott Turow describes as “a lament” about widen-ing income inequality in the United States “brought about, in part, by a government that seems to favor dis-proportionately wealthy interests.”
inequality is the fundamental motivation for the movement:
inequality of incomes, certainly, but also inequality of opportunity and inequality of power. its famous slo-gan, “We are the 99 percent,” high-lights the widening chasm between the superrich, who combine lives of unfathomable luxury with the stag-gering political power made possible by unlimited contributions to super political action committees, and everyone else, struggling to provide a decent life for their children.
So what is the solution? The Occupy Handbook proposes many, of which i will note three. one, sug-gested by economist Peter Diamond and Saez and endorsed by editor Janet Byrne, is much higher tax rates on the very rich. But that raises the question, “How, with today’s Congress and today’s republican Party (most of which has pledged not to raise tax rates), could that possibly happen?” Which brings us to the second solution, favored by former public official robert reich, Turow, and others: get money out of politics, through a constitutional amendment, if necessary. While this may also seem unlikely, it is a plau-sible point of agreement for people across the political spectrum.
For Friesen and graeber, however, this is mere fiddling. according to graeber, occupy Wall Street rejects existing political institutions and the existing legal order; in their place, it embodies “consensus-based direct democracy.” Political scientist James Miller, who has studied popular activist movements, questions what that would look like on a large scale. We should at least remember, how-ever, that it was activists like Friesen and graeber—not academics, jour-nalists, or politicians—who made occupy Wall Street a worldwide phenomenon.
James Kwak Associate Professor
University of Connecticut School of Law
Coauthor, White House Burning: The Founding Fathers, our national Debt,
and Why it Matters to You

BOOK REVIEWS
Letting Reason Prevail
Paul Krugman
End This Depression Now!W.W. Norton & Company, New York, 2012, 272 pp., $24.95 (cloth).
in this very readable book, Paul Krugman outlines arguments that will be familiar to the readers of
his New York Times column. The book reads like an extended blog aimed at a nontechnical audience, and includes references to the academic literature but no footnotes or endnotes. it is in the best tradition of polemic writing.
Krugman starts with the human devastation brought on by high and prolonged U.S. unemployment as a result of the financial crisis and subsequent policy reaction. not only has society forgone considerable output that could have improved lives, but the current high unem-ployment is a human and social evil that ought to be at the center of policymakers’ attention.
The book’s analysis is squarely in the mainstream of macroeconom-ics, which quite clearly establishes that government action can affect the level of demand in the economy. Krugman has the courage of his con-victions when he argues that the gov-ernment (and the Federal reserve) not only can—but should—provide the stimulus necessary to offset the weakness in private demand.
He firmly refutes the myriad falla-cies that have dominated the politi-cal debate (not only in america) on
macroeconomic policies: that policies must be directed at long-term goals rather than short-run concerns; that unemployment has a structural com-ponent that demand-management policies do not address; that anything the government does to influence demand will be offset by private sec-tor action; that the crisis was caused by government interference in mar-kets and the operations of U.S. mort-gage giants Fannie Mae and Freddie Mac; that the nervous bond markets call for immediate action on the defi-cit; and that the main criterion for policy action should be whether it restores business confidence.
Krugman’s prescription for guid-ing the economy out of the worst depression since the 1930s is very similar to that of the iMF: while fis-cal consolidation is needed—and in some countries urgently so—where possible the stress should be on cred-ible medium-term fiscal reforms, and immediate consolidation should be moderated to support growth. Both Krugman and the iMF recog-nize the need for unconventional
monetary policy, and he stands with iMF Economic Counsellor olivier Blanchard in suggesting a somewhat higher inflation target in the current circumstances. Even if he is more outspoken in his own recommenda-tions, Krugman recognizes that the iMF holds fast to the accumulated findings of macroeconomics.
But if the analysis is so firmly supported by the logic of macroeco-nomic reasoning, why does it meet with such resistance in the sphere of practical politics? Here Krugman is more cautious. While he is ruthless in deploying economic arguments to refute the assertions of those oppos-ing an activist economic policy, he says relatively little about why reason does not prevail. This may
be because he considers his best con-tribution to be his use of technical, economic arguments.
The nearest Krugman comes to investigating these failures is when he recalls late Polish macroeconomist Michal Kalecki’s comments on the business community’s opposition to Keynes’s findings: if government spending can influence the level of employment, business confidence is no longer the be-all and end-all of economic policy, and this means the business and financial elite don’t have that much influence.
Public interest economists have been quick to generate models in which the staffs of public institutions distort policy by promoting plans that are in the institutions’ own interest. But the problem of interest in the economic policy debate seems much more insidious than the relatively transparent functioning of public institutions. institutions such as the iMF and the Federal reserve come out looking intellectually robust; the problem is weak scrutiny of the influence of the rich and the financial
and business elite in the discussion. The increasing importance of private funding in academia and the growth of well-financed think tanks associ-ated with particular agendas have strengthened the headwinds facing reasoned debate.
Krugman’s book shows that we are not helpless before the forces of the market and that millions need not be doomed to lengthy, soul-destroying periods of unemployment. a hundred years of macroeconomics has given us the tools to tackle the problem: all we need is the political will to do so.
Mark AllenIMF Senior Resident Representative
for Central and Eastern Europe
Finance & Development June 2012 55
We are not helpless before the forces of the market. Millions need not be doomed to lengthy, soul-destroying periods of unemployment.

BOOK REVIEWS
56 Finance & Development June 2012
BOOK REVIEWS
Food for Thought
Tyler Cowen
An Economist Gets Lunch
New Rules for Everyday FoodiesDutton, New York, 2012, 385 pp., $26.95 (cloth).
read this book and you could start eating better without spending a fortune. it will be
good for you and for the world. all you need to do is think like . . . an economist.
Economics, according to author Tyler Cowen, will break the mental chains that “food snobs” are trying to shackle you with and will lift the veil of ignorance. But wait! Cowen’s trea-tise is not just about food. Broader issues are at stake and, if he is right, you could help start a revolution.
it may be counterintuitive that economics—the “dismal science”—can produce a staunch foodie, “an aficionado of food and drink,” as Wikipedia has it. Cowen makes just that point through an accessible and humorous battery of economic concepts. Yes, you can eat better and more cheaply without relying on self-pronounced food experts.
He may even persuade you to change your whole approach to food and come around to his view that “a bad or mediocre meal is more than just an unpleasant taste, it is an unnecessary negation of life’s plea-sures . . . a wasted chance to refine our tastes, learn about the world, and share a rewarding experience.” He
invites you to make your life “richer in discovery, especially when it comes to the very human, very basic, and very primeval pleasures of food.”
Cowen reaches back to the histori-cal roots of economics, to Thomas Malthus and adam Smith, and argues his point through more than a dozen economic concepts, from produc-tion functions to metarationality, and draws on fields of study as diverse as statistics and psychology.
His economic approach to good food applies the following principle: “Food is a product of economic sup-ply and demand, so try to figure out where the supplies are fresh, the sup-pliers are creative, and the demand-ers are informed.” He attempts to use a genuinely scientific method to better understand how food markets work and to turn that information to useful purpose.
Maxims are one his favorite didac-tic instruments. “When donkey carts are common and women carry bas-kets on their heads, eat your fish right by the ocean or lake,” Cowen advises.
The well-known economist uses cross-country examples to test his
hypotheses. Food experiences are drawn from all over the world, although the lion’s share are from asia, north and South america, and Europe. But lest he be accused of stereotyping, he includes Chinese food in Tanzania and fish and chips in new Zealand.
arguably, few authors would have the courage to conclude that “Pakistani food in the United States is better than indian food in the United States” or that “most people don’t like Korean food.” But Cowen’s strong opinions and political incor-rectness are refreshing and, whether you agree or not, his arguments are clear and constructive. incidentally, “the way into Korean food is through the vegetables.”
Cowen doesn’t stop at geography,
but spices up his book with snippets of history. His study of the north american food supply chain is a key element of the book. The historical references are drawn largely from the americas, and—apart from a look at the aztecs and the origins of corn—are from the modern era. This is a regrettable contrast to the wonderful, sweeping epic Salt: A World History by Mark Kurlansky.
But this book goes beyond advice on where to get a decent meal. it touches on serious topics such as the poor quality of food, rising food prices, and lack of access to good food, whose dire societal consequences include obesity, malnutrition, food riots, and even famine. The author reminds us of the marginally decreas-ing benefits of the green revolution and of the need for a new revolution in support of better eating. He staunchly favors capitalism and sees merit in agribusiness and genetically modified organisms as a way to solve food sup-ply and quality problems. His views about obesity—that the condition is a conscious choice by the sufferer—are surely controversial. Yet we can all
probably agree that economists can and should be part of the movement to support better eating.
Cowen’s style may occasionally be acerbic (i recommend the parts criticizing the “green” movement), but there is an intrinsic humanity to his message that “one of the most rewarding experiences is to take the food knowledge you have acquired, and bring people into your homes for sharing.”
So, foodies of the world, unite! You have nothing to lose except that really bad, overpriced fried chicken you had for lunch.
Amadou SyDeputy Division Chief
IMF Monetary and Capital Markets Department
It may be counterintuitive that economics—the “dismal science”—can produce a staunch foodie.

DATA SPOTLIGHT
THE UniTED STaTES has the most external debt of the world’s richest countries (the group of Seven major in-
dustrial countries, or g7), but as a share of gDP, the United Kingdom tops the list. The gross external debt (that held by for-eigners) of the United Kingdom exceeded four times its gDP in 2011, mainly because of its role as an active financial center. France, germany, and italy all had ratios over 100 percent.
The U.S. external debt—$15 trillion in 2011—was equal to its gDP. That number has risen significantly over the past five years (from $11 trillion in 2006), in part to finance a high fiscal deficit.
But gross external debt, by itself, does not give a full picture of a country’s financial circumstances. The level of external debt may change due to a reallocation of existing liabilities from domestic to foreign residents. also, an important factor in a country’s ability to withstand adverse shocks is the level of its external assets. international financial centers like the United Kingdom have high levels of both external debt and external assets.
To assess a country’s financial strength, one must look at a country’s international investment position (iiP). The net
iiP—the difference between external assets and external liabil-ities—shows net borrowing from (or net lending to) the rest of the world. The ratios of total external assets and liabilities in the g7 countries paint a significantly different picture of exter-nal positions. in 2010, Japan and germany were net creditors, whereas the other five g7 countries were net borrowers.
as for the composition of external debt in 2011, the largest share in France, germany, Japan, and the United Kingdom was owed by banks. in the United States and Canada, the largest share was “other sectors” (mainly nonbank financial corporations and nonfinancial corporations), followed by general government debt. Between 2006 and 2011, the share of general government external debt increased in every g7 country except italy. This increase was partly due to the financial crisis, which resulted in increased borrowing for social spending and reduced business borrowing and spend-ing. The decline in italy’s share was due to an increase in bor-rowing by its monetary authorities under the currency swap lines established with the European Central Bank to address its liquidity needs.
Finance & Development June 2012 57
G7 Borrowing from AbroadAs a share of GDP, the United Kingdom tops the list
About the databaseThe data are drawn from the joint iMF–World Bank Quarterly External Debt Statistics (QEDS) database. The QEDS database provides detailed data on gross external debt for 109 economies, of which 67 subscribe to the Special Data Dissemination Standard. The QEDS database is avail-able at www.worldbank.org/qeds
The United States has the most external debt among the G7.(gross external debt, trillion dollars, end of period)
Data, 4/26/12
2006 07 08 09 10 11
United States
United Kingdom
0
2
4
6
8
10
12
14
16
France
Italy
Canada
Japan
Germany
G7 external debt and IIP ratios paint different pictures.(percent of GDP, end-2011)
Data, 4/26/12
Gross external debt Net international investment position
–50
050
100150200250300350400450
Note: IIP liabilities include external debt liabilities and external liabilities in the form of equity and �nancial derivatives. IIP ratios for France and the United States are for 2010.
Much of the debt is owed by banks.(gross external debt, percent of total, end of period)
Data, 4/26/12
Intercompany lendingOther sectors
BanksMonetary authorities
General government
2006
2011
2006
2011
2006
2011
2006
2011
2006
2011
2006
2011
2006
2011
0
20
40
60
80
100 Canada France Germany Italy Japan
UnitedKingdom
UnitedStates
Prepared by Tamara Razin, Marcelo Dinenzon, and Martin McCanagha of the IMF’s Statistics Department.

The IMF’s World Economic Outlook, Global Financial Stability Report, and Fiscal Monitor examine the legacy
of the crisis and how to secure stability and growth.
Read these essential IMF publications at www.elibrary.imf.org/page/fdip
Fiscal Monitor
World Economic and Financia l Surveys
I N T E R N A T I O N A L M O N E T A R Y F U N D
World Economic Outlook
World Economic and Financia l Surveys
I N T E R N A T I O N A L M O N E T A R Y F U N D
Global Financial Stability Report
World Economic and Financia l Surveys
I N T E R N A T I O N A L M O N E T A R Y F U N D
Staying the course to recovery
What drives commodity price shocks?
Can emerging economies continue their rapid growth?
Are there measures to keep household debt from constraining economic activity?What went wrong in the euro area?
How healthy are banks globally?
What’s the right mix between stimulus and fi scal consolidation?What’s the right mix between stimulus and fi scal consolidation?
Will the euro area crisis spill over to other areas?Will debt continue to rise?
How should we deal with the future costs of an aging population?
I N T E R N A T I O N A L M O N E T A R Y F U N D
IMFStayCourseAdF&D273x203bleedv3.indd 1 5/4/12 3:58 PM
Finance & Development, June 2012 $8.00