april 30, 2009 consolidated financial results for the ... · [this is an english translation...
TRANSCRIPT

[This is an English translation prepared for convenience only. Should there be any inconsistency between the translation and the official Japanese text, the latter shall prevail.]
April 30, 2009 Consolidated Financial Results
for the Fiscal Year Ended March 31, 2009 Name of the Listed Company: JAPAN TOBACCO INC. (Stock Code: 2914) Listed Stock Exchanges: Tokyo, Osaka, Nagoya, Sapporo and Fukuoka Stock Exchanges URL: http://www.jti.co.jp/ Representative: Hiroshi Kimura, President,
Chief Executive Officer and Representative Director Contact: Masakazu Shimizu,
Executive Vice President, Chief Communications Officer Telephone: +81-3-3582-3111 Scheduled date of Annual General Meeting of Shareholders: June 23, 2009 Scheduled date to file Securities Report: June 23, 2009 Scheduled starting date of the dividend payments: June 24, 2009
(Millions of yen with fractional amounts discarded, unless otherwise noted.) 1. Consolidated financial results for the fiscal year ended March 31, 2009 (from April 1,
2008 to March 31, 2009) (1) Consolidated operating results (Percentages indicate year-on-year changes.)
Net sales Operating income Ordinary income Net income
Year ended Millions of yen % Millions of yen % Millions of yen % Millions of yen %March 31, 2009 6,832,307 6.6 363,806 (15.5) 307,586 (15.2) 123,400 (48.3)March 31, 2008 6,409,726 34.4 430,553 29.7 362,681 16.2 238,702 13.3
Net income per share
Diluted net income per share Return on equity Ordinary income on
total assets Operating income
on net sales
Year ended Yen Yen % % %March 31, 2009 12,880.90 12,879.77 6.8 6.9 5.3March 31, 2008 24,916.51 24,916.26 11.8 8.6 6.7
Reference: Equity in earnings of affiliates: the fiscal year ended March 31, 2009: ¥2,369 million; the fiscal year ended March 31, 2008: ¥1,773 million
(2) Consolidated financial position Total assets Net assets Equity ratio Net assets per share
As of Millions of yen Millions of yen % Yen
March 31, 2009 3,879,803 1,624,288 40.0 162,087.74March 31, 2008 5,087,214 2,154,629 40.8 216,707.27
Reference: Equity: As of March 31, 2009: ¥1,552,813 million; As of March 31, 2008: ¥2,076,072 million
(3) Consolidated cash flows
Net cash provided by (used in) operating
activities
Net cash provided by (used in) investment
activities
Net cash provided by (used in) financing
activities
Cash and cash equivalents at end of
period Year ended Millions of yen Millions of yen Millions of yen Millions of yen
March 31, 2009 275,271 (65,008) (217,470) 167,257March 31, 2008 145,030 (1,668,634) 519,000 215,008
– 1 –

2. Cash dividends Cash dividends per share
Record date First quarter
Second quarter
Third quarter
Fiscal year-end Annual
Total amount of dividends
(annual) Payout ratio
(consolidated) Dividends on
net assets (consolidated)
Yen Yen Yen Yen Yen Millions of yen % %Year ended March 31, 2008 - 2,200.00 - 2,600.00 4,800.00 45,984 19.3 2.3
Year ended March 31, 2009 - 2,600.00 - 2,800.00 5,400.00 51,732 41.9 2.9
Year ending March 31, 2010 (Forecast) - 2,800.00 - 2,800.00 5,600.00 53.6
3. Consolidated earnings forecasts for the fiscal year ending March 31, 2010 (from April
1, 2009 to March 31, 2010) (Percentages indicate year-on-year changes.)
Net sales Operating income Ordinary income Net income Net income per share
Millions of yen %
Millions of yen %
Millions of yen %
Millions of yen % Yen
Six months ending September 30, 2009 - - - - - - - - -
Year ending March 31, 2010 6,000,000 (12.2) 244,000 (32.9) 227,000 (26.2) 100,000 (19.0) 10,438.33
Note: Consolidated earnings forecasts for the six months of the fiscal year ending March 31, 2010 is not computed, thus there is no applicable figures.
4. Others (1) Changes in significant subsidiaries during the period (changes in specified subsidiaries resulting in
change in scope of consolidation): None
(2) Changes in accounting policies, procedures, and methods of presentation for preparing the quarterly consolidated financial statements (changes described in the section of Changes in significant preparation policy of consolidated financial statements”) a. Changes due to revisions to accounting standards and other regulations: Applicable b. Changes due to other reasons: Applicable
Note: For more details, please refer to the section of “(5) Significant preparation policy of consolidated financial statements” on page 14.
(3) Number of issued shares (common stock) a. Total number of issued shares at the end of the period (including treasury shares)
As of March 31, 2009 10,000,000 shares As of March 31, 2008 10,000,000 shares
b. Number of treasury shares at the end of the period As of March 31, 2009 419,920 shares As of March 31, 2008 419,920 shares
Note: Please refer to the section of “Per share information” on page 20 for the number of shares used as a basis of calculation for the consolidated net income per share.
– 2 –

(Reference) Summary of non-consolidated results
1. Non-consolidated financial results for the fiscal year ended March 31, 2009 (from April 1, 2008 to March 31, 2009)
(1) Non-Consolidated operating results (Percentages indicate year-on-year changes.)
Net sales Operating income Ordinary income Net income
Year ended Millions of yen % Millions of yen % Millions of yen % Millions of yen %March 31, 2009 2,173,552 (5.6) 167,687 (11.1) 160,200 (9.9) 89,637 (31.7)March 31, 2008 2,302,704 (1.2) 188,608 (10.8) 177,757 (6.3) 131,145 (1.0)
Net income per share Diluted net income per share
Year ended Yen YenMarch 31, 2009 9,356.60 9,355.78March 31, 2008 13,689.35 13,689.21
(2) Non-consolidated financial position Total assets Net assets Equity ratio Net assets per share
As of Millions of yen Millions of yen % Yen
March 31, 2009 2,857,330 1,845,443 64.6 192,595.36March 31, 2008 2,902,509 1,816,727 62.6 189,616.56
Reference: Equity: As of March 31, 2009: ¥1,845,078 million; As of March 31, 2008: ¥1,816,541 million
* Proper use of earnings forecasts, and other special matters The forward-looking statements, including earnings forecasts, contained in these materials are based on information currently available to the Company and on certain assumptions deemed to be reasonable. Actual business and other results may differ substantially due to various factors. Please refer to “Caution concerning forward-looking statements” on page 4 for the suppositions that form the assumptions for business results and cautions concerning the use of business results forecasts.
– 3 –

– 4 –
(Caution concerning forward-looking statements)
This material contains forward-looking statements about our industry, business, plans and objectives financial conditions and results of operations based on current expectations, assumptions, estimates and projections. These statements reflect future expectations, identify strategies, discuss market trends, contain projections of operational results and financial conditions, and state other forward-looking information.
These forward-looking statements are subject to various known and unknown risks, uncertainties and other factors that could cause our actual results to differ from those suggested by any forward-looking statement. We assume no duty or obligation to update any forward-looking statement or to advise of any change in the assumptions and factors on which they are based. Risks, uncertainties or other factors that could cause actual results to differ materially from those expressed in any forward looking statement include, without limitation:
(1) health concerns related to the use of tobacco products; (2) legal or regulatory developments and changes; including, without limitation on sales, marketing
and use of tobacco products, governmental investigations and privately imposed smoking restrictions;
(3) litigation in Japan and elsewhere; (4) our ability to further diversify our business beyond the tobacco industry; (5) our ability to successfully expand internationally and make investments outside Japan; (6) competition and changing consumer preferences; (7) the impact of any acquisitions or similar transactions; (8) local and global economic conditions; and (9) fluctuations in foreign exchange rates and the costs of raw materials.

Consolidated financial statements (1) Consolidated balance sheets
(Millions of yen)
As of March 31, 2008 As of March 31, 2009
Assets Current assets
Cash and deposits 213,885 164,957 Notes and accounts receivable-trade 325,075 290,068 Short-term investment securities 4,952 4,910 Merchandise and finished goods 138,870 122,970 Semi-finished goods 120,527 119,290 Work in process 7,938 6,561 Raw materials and supplies 226,735 215,334 Deferred tax assets 32,008 29,675 Other 169,205 145,076 Allowance for doubtful accounts (4,504) (3,162)Total current assets 1,234,695 1,095,682
Noncurrent assets Property, plant and equipment
Buildings and structures 679,899 621,469 Accumulated depreciation (398,157) (386,615)Buildings and structures, net 281,742 234,853
Machinery, equipment and vehicles 704,663 642,148 Accumulated depreciation (485,689) (453,155)Machinery, equipment and vehicles, net 218,973 188,993
Tools, furniture and fixtures 220,932 165,434 Accumulated depreciation (147,817) (103,012)Tools, furniture and fixtures, net 73,114 62,422
Land 157,380 147,219 Construction in progress 32,120 35,253 Total property, plant and equipment 763,332 668,742
Intangible assets Goodwill 2,106,887 1,453,961 Right of trademark 613,496 347,372 Other 39,023 30,509 Total intangible assets 2,759,407 1,831,843
Investments and other assets Investment securities 132,173 90,230 Long-term loans receivable 4,409 9,190 Deferred tax assets 110,708 128,786 Other 112,743 97,022 Allowance for doubtful accounts (30,075) (41,695)Allowance for loss on investments (180) - Total investments and other assets 329,778 283,534
Total noncurrent assets 3,852,518 2,784,121 Total assets 5,087,214 3,879,803
– 5 –

(Millions of yen)
As of March 31, 2008 As of March 31, 2009
Liabilities Current liabilities
Notes and accounts payable-trade 175,369 158,544 Short-term loans payable 269,034 113,231 Current portion of bonds 73,054 190,363 Current portion of long-term loans payable 6,668 26,380 Lease obligations 1,340 5,512 Accounts payable-other 79,014 62,824 National tobacco excise taxes payable 200,875 172,986 National tobacco special excise taxes payable 10,898 10,470
Local tobacco excise taxes payable 88,839 85,541 Income taxes payable 71,693 51,777 Accrued consumption taxes 62,654 43,847 Deferred tax liabilities 6,547 2,915 Provision 41,481 39,172 Other 196,924 129,835 Total current liabilities 1,284,396 1,093,403
Noncurrent liabilities Bonds payable 643,631 349,794 Long-term loans payable 396,907 299,563 Lease obligations 1,111 11,234 Deferred tax liabilities 174,395 110,389 Provision for retirement benefits 283,387 259,145 Provision for directors' retirement benefits 743 623 Provision for loss on guarantees 257 695 Other 147,754 130,665 Total noncurrent liabilities 1,648,188 1,162,111
Total liabilities 2,932,584 2,255,514 Net assets
Shareholders' equity Capital stock 100,000 100,000 Capital surplus 736,400 736,400 Retained earnings 1,344,490 1,224,989 Treasury stock (74,578) (74,578)Total shareholders' equity 2,106,311 1,986,810
Valuation and translation adjustments Valuation difference on available-for-sale securities 21,338 8,437
Deferred gains or losses on hedges 219 92 Pension liability adjustment of foreign consolidated subsidiaries (10,711) (18,965)
Foreign currency translation adjustment (41,085) (423,561)Total valuation and translation adjustments (30,238) (433,997)
Subscription rights to shares 185 364 Minority interests 78,370 71,109 Total net assets 2,154,629 1,624,288
Total liabilities and net assets 5,087,214 3,879,803
– 6 –
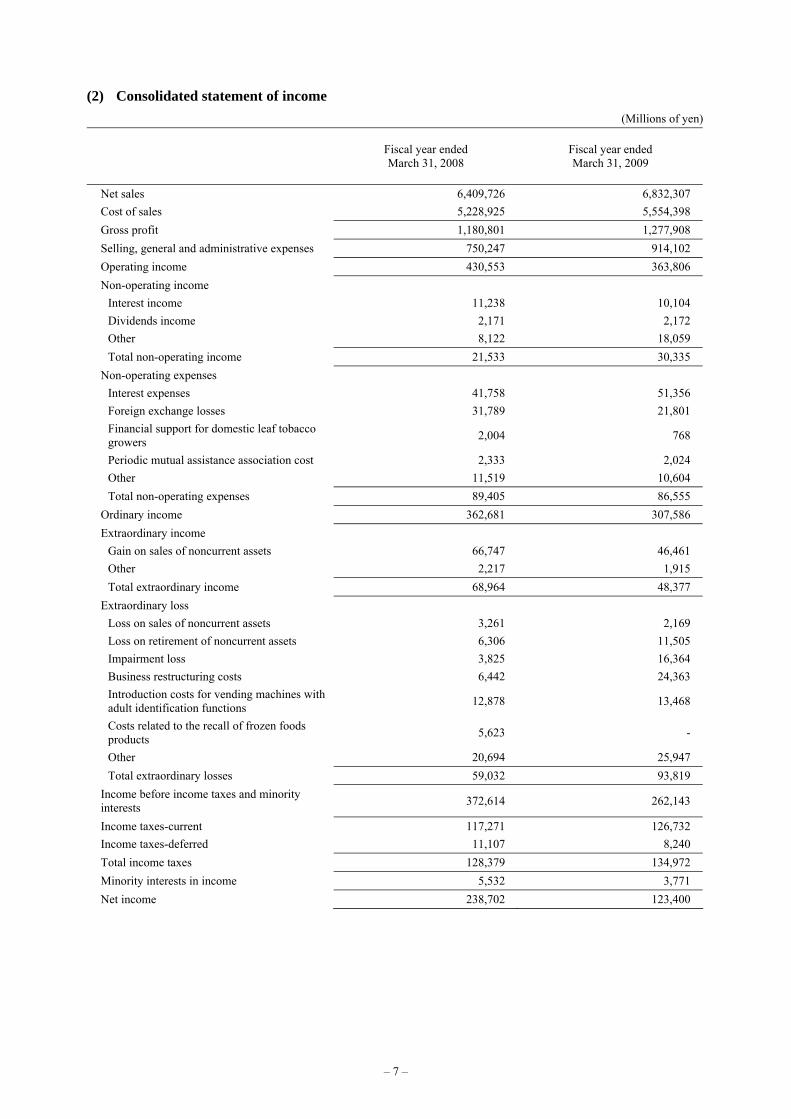
(2) Consolidated statement of income (Millions of yen)
Fiscal year ended March 31, 2008
Fiscal year ended March 31, 2009
Net sales 6,409,726 6,832,307 Cost of sales 5,228,925 5,554,398 Gross profit 1,180,801 1,277,908 Selling, general and administrative expenses 750,247 914,102 Operating income 430,553 363,806 Non-operating income
Interest income 11,238 10,104 Dividends income 2,171 2,172 Other 8,122 18,059 Total non-operating income 21,533 30,335
Non-operating expenses Interest expenses 41,758 51,356 Foreign exchange losses 31,789 21,801 Financial support for domestic leaf tobacco growers 2,004 768
Periodic mutual assistance association cost 2,333 2,024 Other 11,519 10,604 Total non-operating expenses 89,405 86,555
Ordinary income 362,681 307,586 Extraordinary income
Gain on sales of noncurrent assets 66,747 46,461 Other 2,217 1,915 Total extraordinary income 68,964 48,377
Extraordinary loss Loss on sales of noncurrent assets 3,261 2,169 Loss on retirement of noncurrent assets 6,306 11,505 Impairment loss 3,825 16,364 Business restructuring costs 6,442 24,363 Introduction costs for vending machines with adult identification functions 12,878 13,468
Costs related to the recall of frozen foods products 5,623 -
Other 20,694 25,947 Total extraordinary losses 59,032 93,819
Income before income taxes and minority interests 372,614 262,143
Income taxes-current 117,271 126,732 Income taxes-deferred 11,107 8,240 Total income taxes 128,379 134,972 Minority interests in income 5,532 3,771 Net income 238,702 123,400
– 7 –

(3) Consolidated statements of changes in net assets (Millions of yen)
Fiscal year ended March 31, 2008
Fiscal year ended March 31, 2009
Shareholders' equity Capital stock
Balance at the end of previous period 100,000 100,000 Balance at the end of current period 100,000 100,000
Capital surplus Balance at the end of previous period 736,400 736,400 Balance at the end of current period 736,400 736,400
Retained earnings Balance at the end of previous period 1,158,337 1,344,490 Effect of changes in accounting policies applied to foreign subsidiaries - (193,658)
Changes of items during the period Changes of retained earnings due to the new accounting standard adopted by foreign consolidated subsidiaries applying U.S.GAAP
(10,548) -
Dividends from surplus (42,152) (49,816)Net income 238,702 123,400 Change of scope of consolidation - 47 Change of scope of equity method 151 525 Total changes of items during the period 186,152 74,157
Balance at the end of current period 1,344,490 1,224,989 Treasury stock
Balance at the end of previous period (74,578) (74,578)Balance at the end of current period (74,578) (74,578)
Total shareholders' equity Balance at the end of previous period 1,920,159 2,106,311 Effect of changes in accounting policies applied to foreign subsidiaries - (193,658)
Changes of items during the period Changes of retained earnings due to the new accounting standard adopted by foreign consolidated subsidiaries applying U.S.GAAP
(10,548) -
Dividends from surplus (42,152) (49,816)Net income 238,702 123,400 Change of scope of consolidation - 47 Change of scope of equity method 151 525 Total changes of items during the period 186,152 74,157
Balance at the end of current period 2,106,311 1,986,810
– 8 –

(Millions of yen)
Fiscal year ended March 31, 2008
Fiscal year ended March 31, 2009
Valuation and translation adjustments Valuation difference on available-for-sale securities
Balance at the end of previous period 33,329 21,338 Changes of items during the period
Net changes of items other than shareholders' equity (11,990) (12,901)
Balance at the end of current period 21,338 8,437 Deferred gains or losses on hedges
Balance at the end of previous period 14,580 219 Changes of items during the period
Net changes of items other than shareholders' equity (14,360) (127)
Balance at the end of current period 219 92 Pension liability adjustment of foreign consolidated subsidiaries
Balance at the end of previous period (15,560) (10,711)Pension liability adjustment of foreign consolidated subsidiaries
Net changes of items other than shareholders' equity 4,848 (8,254)
Balance at the end of current period (10,711) (18,965)Foreign currency translation adjustment
Balance at the end of previous period 7,745 (41,085)Changes of items during the period
Net changes of items other than shareholders' equity (48,831) (382,475)
Balance at the end of current period (41,085) (423,561)Total valuation and translation adjustments
Balance at the end of previous period 40,094 (30,238)Changes of items during the period
Net changes of items other than shareholders' equity (70,333) (403,758)
Balance at the end of current period (30,238) (433,997)Subscription rights to shares
Balance at the end of previous period - 185 Changes of items during the period
Net changes of items other than shareholders' equity 185 179
Balance at the end of current period 185 364 Minority interests
Balance at the end of previous period 64,362 78,370 Changes of items during the period
Net changes of items other than shareholders' equity 14,008 (7,260)
Balance at the end of current period 78,370 71,109
– 9 –

(Millions of yen)
Fiscal year ended March 31, 2008
Fiscal year ended March 31, 2009
Total net assets Balance at the end of previous period 2,024,615 2,154,629 Effect of changes in accounting policies applied to foreign subsidiaries - (193,658)
Changes of items during the period Changes of retained earnings due to the new accounting standard adopted by foreign consolidated subsidiaries applying U.S.GAAP
(10,548) -
Dividends from surplus (42,152) (49,816)Net income 238,702 123,400 Change of scope of consolidation - 47 Change of scope of equity method 151 525 Net changes of items other than shareholders' equity (56,139) (410,839)
Total changes of items during the period 130,013 (336,682)Balance at the end of current period 2,154,629 1,624,288
– 10 –

Marginal notes for consolidated statements of changes in net assets Notes: 1. “Pension liability adjustment of foreign consolidated subsidiaries” in valuation and translation adjustments was
unfunded liabilities recorded by foreign consolidated subsidiaries that adopt U.S.GAAP. 2. Effective from January 1, 2007, the Accounting for Uncertainty in Income Taxes (FASB Interpretation No. 48,
Financial Accounting Standards Board) was applied to foreign consolidated subsidiaries that adopt U.S.GAAP. Accordingly, the impacts that arose due to the application in the previous fiscal year (the fiscal year in which the new standard was adopted for the first time) were recorded as changes of retained earnings.
– 11 –

(4) Consolidated statement of cash flows (Millions of yen)
Fiscal year ended March 31, 2008
Fiscal year ended March 31, 2009
Net cash provided by (used in) operating activities
Income before income taxes and minority interests 372,614 262,143
Depreciation and amortization 167,658 176,899 Impairment loss 3,825 16,364 Loss (gain) on sales and retirement of noncurrent assets (60,768) (41,499)
Amortization of goodwill 3,883 105,470 Loss (gain) on valuation of investment securities 11,154 7,062
Increase (decrease) in provision for retirement benefits (4,932) (13,159)
Interest and dividends income (13,410) (12,276)Interest expenses 41,758 51,356 Decrease (increase) in notes and accounts receivable-trade 47,484 (43,141)
Decrease (increase) in inventories 27,114 (47,632)Increase (decrease) in notes and accounts payable-trade (16,650) 2,698
Increase (decrease) in accounts payable-other (39,955) (7,939)Increase (decrease) in tobacco excise taxes payable (213,133) 28,981
Other, net (31,029) (55,237)Subtotal 295,612 430,091 Interest and dividends income received 18,226 15,551 Interest expenses paid (36,083) (55,957)Income taxes paid (132,724) (114,414)Net cash provided by (used in) operating activities 145,030 275,271
Net cash provided by (used in) investing activities
Purchase of short-term investment securities (2,353) (1,360)Proceeds from sales and redemption of securities 4,224 1,861
Purchase of property, plant and equipment (124,832) (112,408)Proceeds from sales of property, plant and equipment 83,335 55,255
Purchase of intangible assets (6,830) (6,948)Purchase of investment securities (22,562) - Purchase of investments in subsidiaries resulting in change in scope of consolidation (1,608,080) (3,060)
Proceeds from sales of investments in subsidiaries resulting in change in scope of consolidation
1,449 450
Other, net 7,015 1,202 Net cash provided by (used in) investing activities (1,668,634) (65,008)
– 12 –

(Millions of yen)
Fiscal year ended March 31, 2008
Fiscal year ended March 31, 2009
Net cash provided by (used in) financing activities
Net increase (decrease) in short-term loans payable 136,063 (125,182)
Proceeds from long-term loans payable 378,862 94,130
Repayment of long-term loans payable (90,198) (54,662)
Proceeds from issuance of bonds 149,723 -
Redemption of bonds (10,000) (70,810)
Cash dividends paid (42,152) (49,752)
Cash dividends paid to minority shareholders (2,889) (3,539)
Repayments of finance lease obligations - (6,606)
Other, net (407) (1,046)Net cash provided by (used in) financing activities 519,000 (217,470)
Effect of exchange rate change on cash and cash equivalents 40,090 (39,590)
Net increase (decrease) in cash and cash equivalents (964,513) (46,797)
Cash and cash equivalents at beginning of period 1,179,522 215,008
Decrease in cash and cash equivalents resulting from exclusion of subsidiaries from consolidation
- (953)
Cash and cash equivalents at end of period 215,008 167,257
– 13 –

(5) Significant preparation policy of consolidated financial statements
Matters related to the scope of consolidation
Number of consolidated subsidiaries: 274 companies Major consolidated subsidiaries: TS Network Co., Ltd., Japan Filter Technology, Ltd., JT International S.A., Gallaher Ltd., Torii Pharmaceutical Co., Ltd., Katokichi Co., Ltd., Japan Beverage Inc., JT Real Estate Inc., JT Financial Service Corporation. In addition, a total of 17 companies, including JT BEVERAGE INC. and Fuji Foods Corporation, were included in the scope of consolidation from the current fiscal year. A total of 38 companies, including JT Dining Service Inc., were excluded from the scope of consolidation due to the mergers with other consolidated subsidiaries or other reasons. A total of three companies, including Hans Continental Smallgoods Pty. Ltd., were excluded from the scope of consolidation as JT lost its controlling interests in those companies with commencements of procedures for business liquidation, etc. with a view to dissolutions. Former subsidiary Advance Support Co., Ltd. was accounted for by the equity method due to the decrease of JT’s voting rights as a result of sales of investments in the company. Respective amounts in aggregate of total assets, net sales, net income and retained earnings of non-consolidated subsidiaries do not have a material impact on the consolidated financial statements. For this reason, these companies are excluded from the scope of consolidation. Changes in accounting policies
(Practical Solution on Unification of Accounting Policies Applied to Foreign Subsidiaries for Consolidated Financial Statements) Effective from April 1, 2008, JT applied the “Practical Solution on Unification of Accounting Policies Applied to Foreign Subsidiaries for Consolidated Financial Statements” (ASBJ PITF No. 18, May 17, 2006), and adjusted necessary items in the consolidation process. As a result of this change, operating income, ordinary income and income before income taxes and minority interests for the current fiscal year decreased by ¥ 94,235 million respectively, and as of April 1, 2008, retained earnings decreased by ¥193,658 million as JT amortized goodwill posted at consolidated foreign subsidiaries. Also, income before income taxes and minority interests for the current fiscal year decreased by ¥911 million respectively, as JT posted the retrospective adjustment in the consolidated financial statement of income. The adjustment was caused by an accounting policy change in foreign subsidiaries as a result of a change of U.S. GAAP. The effects on segment information are described at relevant portion. (Accounting Standard for Lease Transactions and related regulations) The accounting treatment before the change for finance lease transactions not involving the transfer of ownership followed the same method as the accounting treatment for operating lease transactions. However, effective from April 1, 2008, JT applied the “Accounting Standard for Lease Transactions” (ASBJ Statement No. 13 [Business Accounting Council Committee No. 1, June 17, 1993; revised March 30, 2007]) and the “Guidance on Accounting Standard for Lease Transactions” (ASBJ Guidance No. 16 [The Japanese Institute of Certified Public Accountants (JICPA) Accounting Standard Committee, January 18, 1994; revised March 30, 2007]), and the accounting treatment as the acquisition of an asset and the incurrence of an obligation by the lessee and as a sale by the lessor. Also, the accounting treatment for finance lease transactions not involving the transfer of ownership commenced before the previous fiscal year involves recording lease assets as if acquired at the beginning of the fiscal year, where the present value of future minimum lease payments as of the end of the previous fiscal year (after deducting the interest amount) is the acquisition cost. The impact of this change on operating income, ordinary income and income before income taxes and minority interests is immaterial.
– 14 –

Additional information
(Changes in useful lives of property, plant and equipment) The useful lives of property, plant and equipment with respect to JT and its domestic consolidated subsidiaries was changed as a result of the use review of these assets in conjunction with the revision of the Corporate Tax Act. As an example, the useful lives of tobacco manufacturing facilities, which are JT’s main machinery and equipment, was changed from 8 years to 10 years. The impact of this change on operating income, ordinary income and income before income taxes and minority interests is immaterial. Furthermore, details other than those described above are omitted as there have been no other material changes since JT’s latest Securities Report (submitted June 24, 2008).
– 15 –

(6) Notes to consolidated financial statements
(Segment information)
a. Operations by industry segment
Fiscal year ended March 31, 2008 (From April 1, 2007 to March 31, 2008) (Millions of yen)
Domestic tobacco
International tobacco Pharmaceuticals Foods Others Total Elimination
and corporate Consolidated
total I. Net sales and operating
income (loss)
Net sales (1) Sales to customers 3,362,397 2,639,968 49,063 336,420 21,876 6,409,726 - 6,409,726(2) Intersegment sales or
transfers 48,980 35,341 - 115 22,331 106,768 (106,768) -
Total 3,411,378 2,675,309 49,063 336,535 44,207 6,516,495 (106,768) 6,409,726
Operating expenses 3,189,030 2,469,949 58,707 335,868 33,759 6,087,316 (108,143) 5,979,173
Operating income (loss) 222,347 205,359 (9,643) 666 10,448 429,179 1,374 430,553II. Assets, depreciation and
amortization other than goodwill, impairment loss and capital expenditures
Assets 847,123 3,804,413 111,422 353,283 90,000 5,206,242 (119,028) 5,087,214Depreciation and amortization other than goodwill
83,290 65,397 3,374 4,891 11,606 168,559 (900) 167,658
Impairment loss 344 345 - 380 - 1,069 2,755 3,825Capital expenditures 57,201 48,430 4,257 6,033 14,792 130,715 (1,160) 129,554
Fiscal year ended March 31, 2009 (From April 1, 2008 to March 31, 2009) (Millions of yen)
Domestic tobacco
International tobacco Pharmaceuticals Foods Others Total Elimination
and corporate Consolidated
total I. Net sales and operating
income (loss)
Net sales (1) Sales to customers 3,200,493 3,118,318 56,757 435,966 20,770 6,832,307 - 6,832,307(2) Intersegment sales or
transfers 48,389 40,631 - 132 12,043 101,197 (101,197) -
Total 3,248,883 3,158,949 56,757 436,099 32,814 6,933,505 (101,197) 6,832,307
Operating expenses 3,060,625 2,984,177 55,737 447,550 23,119 6,571,210 (102,709) 6,468,501
Operating income (loss) 188,258 174,772 1,020 (11,450) 9,694 362,294 1,511 363,806II. Assets, depreciation and
amortization other than goodwill, impairment loss and capital expenditures
Assets 788,672 2,700,098 111,518 332,669 87,433 4,020,393 (140,590) 3,879,803Depreciation and amortization other than goodwill
82,933 68,960 3,870 18,293 3,455 177,512 (612) 176,899
Impairment loss - - - 3,829 - 3,829 12,534 16,364Capital expenditures 46,506 59,776 3,425 23,201 1,128 134,037 234 134,272
Notes: 1. Operations by industry segment are categorized based on types of products, characteristics and markets. 2. Main products or services under each category are as follows:
a. Domestic tobacco: Tobacco products (These include tobacco products sold at duty-free shops in Japan, as well as at markets in China, Hong Kong and Macau, markets that are under the control of our China Division.)
b. International tobacco: Tobacco products elsewhere c. Pharmaceuticals: Prescription drugs d. Foods: Beverages and processed foods e. Others: Rent of real estate, leasing, engineering and others
– 16 –

3. The amounts of unallocated assets included in “Elimination and corporate” on the “Assets” row are as follows. Major components are the surplus funds (cash and deposits, and short-term investment securities), the long-term investment funds (part of investment securities), the assets pertaining to basic research and the land not used for businesses. (Fiscal year ended March 31, 2008) ¥99,421 million (Fiscal year ended March 31, 2009) ¥96,835 million
4. The following table shows amortization of goodwill amounts by industry segment which are included in operating expenses for the fiscal year ended March 31, 2008 and fiscal year ended March 31, 2009.
(Millions of yen)
Domestic tobacco
International tobacco Pharmaceuticals Foods Others Consolidated
total Fiscal year ended March 31, 2008 1,088 - - 2,794 - 3,883
Fiscal year ended March 31, 2009 1,088 94,235 - 10,187 - 105,511
5. The domestic tobacco segment includes the sales by TS Network Co., Ltd., JT’s consolidated subsidiary. TS Network
Co., Ltd. distributes domestic tobacco products and sells imported tobacco products by wholesale. Net sales of imported tobacco products via TS Network Co., Ltd. were as follows. (Fiscal year ended March 31, 2008) ¥1,193,178 million (Fiscal year ended March 31, 2009) ¥1,135,319 million
6. With respect to the international tobacco segment, as the closing date of the accounting period of international consolidated subsidiaries including JT International S.A., the core company of this segment, is set on December 31, operating results from January 1, 2007 to December 31, 2007 have been included in the fiscal year ended March 31, 2008 and those from January 1, 2008 to December 31, 2008 have been included in the fiscal year ended March 31, 2009.
7. Changes in accounting policies (Fiscal year ended March 31, 2009) Practical solution on unification of accounting policies applied to foreign subsidiaries for consolidated financial statements Effective from April 1, 2008, JT applied the “Practical Solution on Unification of Accounting Policies Applied to Foreign Subsidiaries for Consolidated Financial Statements” (ASBJ PITF No. 18, May 17, 2006) as described in “(5) Significant preparation policy of consolidated financial statements” of “Consolidated financial statements.” As a result of this change, the operating income for the international tobacco segment for the current fiscal year decreased by ¥94,235 million as compared to the case where the previous method was adopted.
– 17 –

b. Operations by geographical segment
Fiscal year ended March 31, 2008 (From April 1, 2007 to March 31, 2008) (Millions of yen)
Japan Western Europe Others Total Elimination and corporate Consolidated
I. Net sales and operating income (loss)
Net sales
(1) Sales to customers 3,711,762 1,678,769 1,019,194 6,409,726 - 6,409,726
(2) Intersegment sales or transfers 52,308 181,062 29,211 262,582 (262,582) -
Total 3,764,071 1,859,832 1,048,405 6,672,309 (262,582) 6,409,726
Operating expenses 3,541,731 1,803,896 897,007 6,242,635 (263,462) 5,979,173
Operating income 222,339 55,936 151,398 429,674 879 430,553
II. Assets 1,160,749 3,436,184 420,169 5,017,103 70,110 5,087,214
Fiscal year ended March 31, 2009 (From April 1, 2008 to March 31, 2009) (Millions of yen)
Japan Western Europe Others Total Elimination and corporate Consolidated
I. Net sales and operating income (loss)
Net sales
(1) Sales to customers 3,672,003 2,038,028 1,122,275 6,832,307 - 6,832,307
(2) Intersegment sales or transfers 53,334 223,871 39,185 316,391 (316,391) -
Total 3,725,338 2,261,900 1,161,461 7,148,699 (316,391) 6,832,307
Operating expenses 3,538,898 2,286,087 961,828 6,786,815 (318,314) 6,468,501
Operating income (loss) 186,439 (24,187) 199,632 361,883 1,922 363,806
II. Assets 1,083,961 2,378,679 351,079 3,813,720 66,082 3,879,803
Notes: 1. Geographical segments are categorized based on geographical proximity. 2. Countries or regions belonging to the segments other than Japan
a. Western Europe: Switzerland, United Kingdom, Germany b. Others: Canada, Russia, Malaysia
3. The amount and details of unallocated assets included in “Elimination and corporate” on the “Assets” row is same as “Note 3.” of “a. Operations by industry segment.”
4. Changes in accounting policies (Fiscal year ended March 31, 2009) Practical Solution on Unification of Accounting Policies Applied to Foreign Subsidiaries for Consolidated Financial Statements Effective from April 1, 2008, JT applied the “Practical Solution on Unification of Accounting Policies Applied to Foreign Subsidiaries for Consolidated Financial Statements” (ASBJ PITF No. 18, May 17, 2006) as described in “(5) Significant preparation policy of consolidated financial statements” of “Consolidated financial statements.” As a result of this change, the operating income for the Western Europe segment for the current fiscal year decreased by ¥94,235 million as compared to the case where the previous method was adopted. Furthermore, the following table shows amortization of goodwill amounts by geographical segment which are included in operating expenses for the fiscal year ended March 31, 2009.
(Millions of yen)
Japan Western Europe Others Consolidated
total Fiscal year ended March 31, 2009 11,276 94,235 - 105,511
– 18 –

c. Overseas sales
Fiscal year ended March 31, 2008 (From April 1, 2007 to March 31, 2008) Western Europe Others Total
I. Overseas sales (Millions of yen) 1,634,920 1,070,540 2,705,461
II. Consolidated sales (Millions of yen) 6,409,726
III. Percentage of overseas sales (%) 25.5 16.7 42.2
Fiscal year ended March 31, 2009 (From April 1, 2008 to March 31, 2009) Western Europe Others Total
I. Overseas sales (Millions of yen) 2,002,738 1,177,113 3,179,852
II. Consolidated sales (Millions of yen) 6,832,307
III. Percentage of overseas sales (%) 29.3 17.2 46.5
Notes: 1. Overseas sales figures consist of sales of JT and its consolidated subsidiaries in countries or regions outside Japan. 2. Geographical segments are categorized based on geographical proximity. 3. Countries or regions belonging to the segments
a. Western Europe: Switzerland, United Kingdom, Germany b. Others: Canada, Russia, Malaysia
– 19 –

(Per share information)
Fiscal year ended March 31, 2008 Fiscal year ended March 31, 2009
Net assets per share ¥216,707.27 Net assets per share ¥162,087.74
Net income per share ¥24,916.51 Net income per share ¥12,880.90
Diluted net income per share ¥24,916.26 Diluted net income per share ¥12,879.77
Note: Reconciliation of the differences between basic and diluted net income per share is as follows:
Fiscal year ended March 31, 2008
Fiscal year ended March 31, 2009
Net income per share Net income (Millions of yen) 238,702 123,400
Amounts not available to common shareholders (Millions of yen) - -
Net income available to common shareholders (Millions of yen) 238,702 123,400
Average number of common shares during the period (Thousands of shares) 9,580 9,580
Diluted net income per share Dilutive effects (Millions of yen) - -
Number of increased common shares (Thousands of shares) 0 0
(Subscription rights to shares included (Thousands of shares)) (0) (0)
Dilutive shares which are not included in the calculation of diluted net income per share as they have no dilutive effects - -
(Omission of disclosure) Notes relating to lease transactions, related party transactions, income taxes, derivatives, retirement benefits, stock option and business combinations are omitted considering their minor significance on the Financial Results report.
– 20 –

– 21 –
(Additional information)
1. In July 2004, ZAO JTI Marketing and Sales (“M&S Corp.”), a Russian consolidated subsidiary, received an assessment from the Moscow tax authorities in which it was ordered to pay approximately 2.4 billion rubles (approximately ¥6.9 billion) for the period from January to December 2000. The amount includes unpaid taxes (VAT, etc.), interest and additional taxes.
Believing that the assessment by the Moscow tax authorities was based upon a misinterpretation of facts, M&S Corp. filed a lawsuit with the Moscow Arbitration Court seeking to invalidate the assessment. Although the court of first instance, the Court of Appeals and the Court of Cassation dismissed M&S Corp.’s argument, the Russian Federation Higher Arbitration Court reversed the lower courts’ judgments and remanded the case to the court of first instance in April 2006. In October 2007, the court of first instance rendered judgment upholding M&S Corp.’s argument and invalidated the tax assessment, and both the Court of Appeals and the Court of Cassation dismissed the appeal by the tax authorities and upheld M&S Corp.’s argument in February and May 2008, respectively. In October of that year, Russian Federation Higher Arbitration Court refused to take the appeal by the tax authorities and the case is now closed.
2. On July 11, 2008, the Office of Fair Trading (OFT), the UK competition authority, announced that Gallaher Group Ltd. (former Gallaher Group Plc) and Gallaher Ltd. (together, hereinafter, “Gallaher”), JT’s tobacco subsidiaries in the United Kingdom, have concluded an early resolution agreement with the OFT. Gallaher has agreed to pay a fine for anti-competitive business practices relating to the retail pricing of tobacco products in the UK market during the period prior to JT’s acquisition of Gallaher.
In August 2003, the OFT notified Gallaher of an inquiry into vertical agreements between manufacturers and retailers in the UK cigarette, tobacco and tobacco-related markets. Since that time Gallaher has been fully cooperating with the OFT regarding the investigation. Regarding this matter, the OFT issued a statement of objections on April 25, 2008. Following a careful and comprehensive review of the document, the JT Group decided to conclude an early resolution agreement with the OFT, which JT believes best serves the interests of all parties involved.
A certain amount, based on the company’s assumptions about the fine, has been booked as noncurrent liabilities in the purchase price allocation related to JT’s acquisition of Gallaher Group Plc (now Gallaher Group Ltd.). In the Balance Sheet for the current fiscal year, the amount is included in current liabilities and noncurrent liabilities. This agreement requires us the cooperation with the OFT regarding the investigation. The fine of approximately ₤93 million (approximately ¥13.0 billion) to Gallaher is scheduled to be finally decided after such investigation has been completed. In cases where the payment amount is decided as the fine amount specified in this agreement, the difference between such fine and the liability already posted, approximately ₤71 million (approximately ¥10.0 billion), will be recorded as extraordinary income.
While the agreement reached with the OFT relates only to Gallaher’s past business activities prior to JT’s acquisition of the Gallaher group of companies, JT considers that compliance with all applicable laws in each market in which it operates is of the utmost importance. JT will continue to enhance efforts to ensure compliance of the whole group of companies.
(Important subsequent events)
JT’s board of directors decided on April 30, 2009 that the company would close three cigarette factories in Japan. The Morioka factory and the Yonago factory will cease to manufacture at the end of March 31, 2010, and the Odawara factory cease to manufacture at the end of March 31, 2011.
The impact of the initiative on the company’s financial position has not yet been established.