convenience translation of condensed … · the condensed interim consolidated financial statements...
TRANSCRIPT
CONVENIENCE TRANSLATION OF CONDENSED CONSOLIDATED FINANCIAL STATEMENTS ORIGINALLY ISSUED IN TURKISH TÜRKİYE PETROL RAFİNERİLERİ A.Ş. 1 JANUARY - 31 DECEMBER 2017 CONDENSED CONSOLIDATED FINANCIAL STATEMENTS

TÜRKİYE PETROL RAFİNERİLERİ A.Ş.
TABLE OF CONTENTS PAGE
CONSOLIDATED STATEMENTS OF FINANCIAL POSITION ......................................................... 1
CONSOLIDATED STATEMENTS OF PROFIT OR LOSS
AND OTHER COMPREHENSIVE INCOME .......................................................................................... 2
CONSOLIDATED STATEMENTS OF CHANGES IN EQUITY .......................................................... 3
CONSOLIDATED STATEMENTS OF CASH FLOWS .......................................................................... 4
NOTES TO THE CONDENSED CONSOLIDATED FINANCIAL STATEMENTS............................ 5 - 50 NOTE 1 ORGANIZATION OF THE GROUP AND NATURE OF OPERATIONS ................................................. 5-6
NOTE 2 BASIS OF PRESENTATION OF CONSOLIDATED FINANCIAL STATEMENTS................................. 7-12
NOTE 3 BUSINESS COMBINATIONS ..................................................................................................................... 12
NOTE 4 CASH AND CASH EQUIVALENTS........................................................................................................... 13
NOTE 5 FINANCIAL LIABILITIES .......................................................................................................................... 14-17
NOTE 6 TRADE RECEIVABLES AND PAYABLES ............................................................................................... 17-19
NOTE 7 OTHER RECEIVABLES AND PAYABLES ............................................................................................... 19
NOTE 8 INVENTORIES ............................................................................................................................................ 19-20
NOTE 9 FINANCIAL INVESTMENTS ..................................................................................................................... 20
NOTE 10 INVESTMENTS ACCOUNTED FOR USING EQUITY METHOD........................................................... 20-21
NOTE 11 INVESTMENT PROPERTY ........................................................................................................................ 21
NOTE 12 PROPERTY, PLANT AND EQUIPMENT ................................................................................................. 22
NOTE 13 INTANGIBLE ASSETS .............................................................................................................................. 23
NOTE 14 PREPAID EXPENSES .................................................................................................................................. 24
NOTE 15 OTHER ASSETS AND LIABILITIES ......................................................................................................... 24-26
NOTE 16 DEFERRED INCOME .................................................................................................................................. 26
NOTE 17 PROVISIONS ............................................................................................................................................... 26-29
NOTE 18 LIABILITIES FOR EMPLOYEE BENEFITS .............................................................................................. 29
NOTE 19 OTHER PAYABLES .................................................................................................................................... 29
NOTE 20 DERIVATIVE INSTRUMENTS .................................................................................................................. 30-31
NOTE 21 GOVERNMENT GRANTS .......................................................................................................................... 31-32
NOTE 22 COMMITMENTS AND CONTINGENT ASSETS AND LIABILITIES ..................................................... 33-34
NOTE 23 EQUITY ........................................................................................................................................................ 34-36
NOTE 24 SALES AND COST OF SALES ................................................................................................................... 36
NOTE 25 GENERAL ADMINISTRATIVE EXPENSES MARKETING,
SELLING AND DISTRIBUTION EXPENSES,
RESEARCH AND DEVELOPMENT EXPENSES ...................................................................................... 37
NOTE 26 OPERATING INCOME/(EXPENSES) ........................................................................................................ 38
NOTE 27 INCOME FROM INVESTMENT ACTIVITIES .......................................................................................... 38
NOTE 28 FINANCIAL INCOME/(EXPENSES) ......................................................................................................... 39
NOTE 29 TAX ASSETS AND LIABILITIES .............................................................................................................. 39-41
NOTE 30 EARNINGS PER SHARE ............................................................................................................................ 41
NOTE 31 RELATED PARTY TRANSACTIONS ........................................................................................................ 41-44
NOTE 32 FINANCIAL INSTRUMENTS AND FINANCIAL RISK MANAGEMENT ............................................. 44-49
NOTE 33 SUBSEQUENT EVENTS ............................................................................................................................. 50
TÜRKİYE PETROL RAFİNERİLERİ A.Ş.
CONSOLIDATED STATEMENT OF
FINANCIAL POSITION AS AT 31 DECEMBER 2017 (Amounts expressed in thousands of Turkish Lira (“TRY”) unless otherwise indicated.)
1
Audited Audited Notes 31 December 2017 31 December 2016
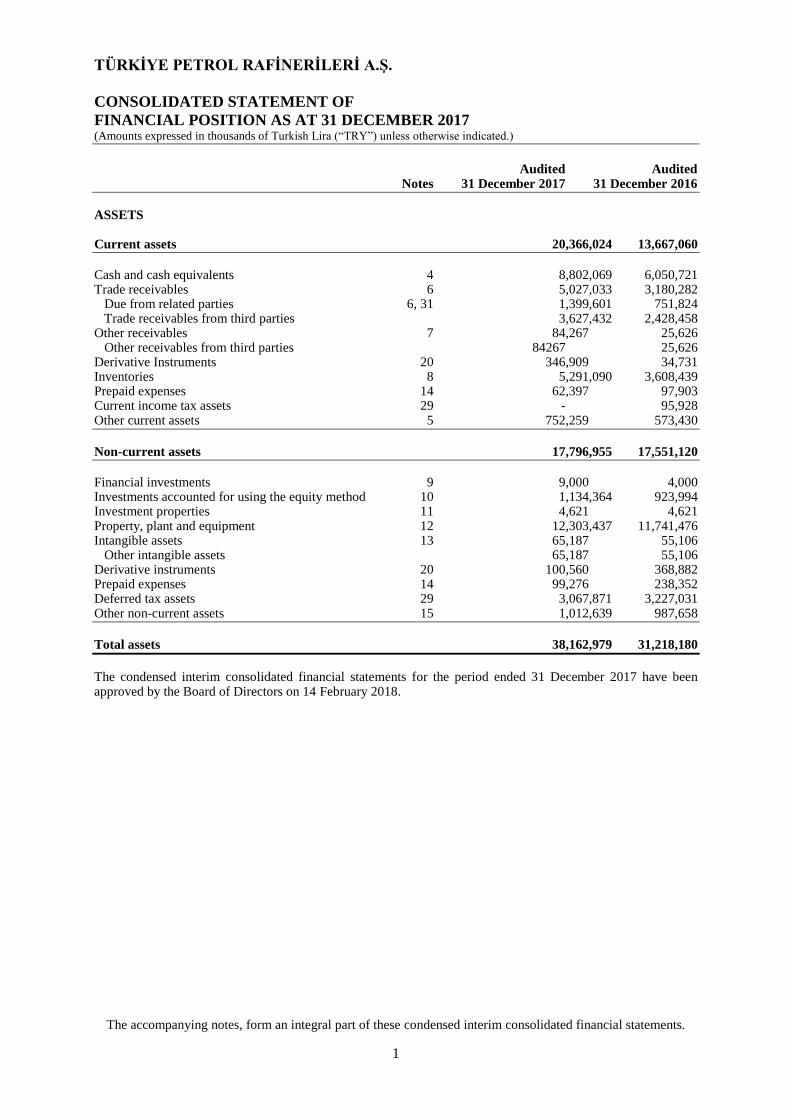
ASSETS Current assets 20,366,024 13,667,060
Cash and cash equivalents 4 8,802,069 6,050,721 Trade receivables 6 5,027,033 3,180,282 Due from related parties 6, 31 1,399,601 751,824 Trade receivables from third parties 3,627,432 2,428,458 Other receivables 7 84,267 25,626 Other receivables from third parties 84267 25,626 Derivative Instruments 20 346,909 34,731 Inventories 8 5,291,090 3,608,439 Prepaid expenses 14 62,397 97,903 Current income tax assets 29 - 95,928 Other current assets 5 752,259 573,430
Non-current assets 17,796,955 17,551,120
Financial investments 9 9,000 4,000 Investments accounted for using the equity method 10 1,134,364 923,994 Investment properties 11 4,621 4,621 Property, plant and equipment 12 12,303,437 11,741,476 Intangible assets 13 65,187 55,106 Other intangible assets 65,187 55,106 Derivative instruments 20 100,560 368,882 Prepaid expenses 14 99,276 238,352 Deferred tax assets 29 3,067,871 3,227,031 Other non-current assets 15 1,012,639 987,658
Total assets 38,162,979 31,218,180
The condensed interim consolidated financial statements for the period ended 31 December 2017 have been approved by the Board of Directors on 14 February 2018.
The accompanying notes, form an integral part of these condensed interim consolidated financial statements.

TÜRKİYE PETROL RAFİNERİLERİ A.Ş.
CONSOLIDATED STATEMENT OF
FINANCIAL POSITION AS AT 31 DECEMBER 2017 (Amounts expressed in thousands of Turkish Lira (“TRY”) unless otherwise indicated.)
2
Audited Audited Notes 31 December 2017 31 December 2016
LIABILITIES
Current liabilities 17,675,669 12,660,262
Short-term financial liabilities 5 340,875 385,524 Current portion of long term financial liabilities 5 4,932,839 1,572,434 Trade payables 6 8,213,166 6,987,843 Due to related parties 6, 31 115,456 88,017 Trade payables, third parties 8,097,710 6,899,826 Liabilities for employee benefits 18 119,833 92,442 Other payables 19 36,797 27,953 Due to related parties 19, 31 23,463 18,546 Other payables to third parties 13,334 9,407 Derivative instruments 20 177,137 29,454 Deferred income 16 20,428 15,417 Current income tax liabilities 29 21,296 141,217 Provisions 17 89,924 65,056 Provisions for employee benefits 12,629 13,571 Other provisions 77,295 51,485 Other current liabilities 15 3,723,374 3,342,922
Non-current liabilities 10,009,649 10,390,885
Long-term financial liabilities 5 9,777,270 10,176,307 Provisions 17 223,734 207,415 Provisions for employee benefits 223,734 207,415 Deferred income 16 4,112 3,992 Derivative Instruments 20 3,364 1,782 Other non-current liabilities 15 1,169 1,389
Non-current liabilities 27,685,318 10,390,885
Equity 10,477,661 8,167,033
Share capital 23 250,419 250,419 Adjustment to share capital 23 1,344,243 1,344,243 Share premiums/discounts - 172 Accumulated other comprehensive income/(expense) not to be reclassified to profit or loss (3,361) (7,986) Gains/ losses on revaluation and remeasurement (2,211) (6,124) Actuarial gain/(loss) arising from defined benefit plans (2,211) (6,124) Share of other comprehensive income of investments accounted for using equity method that will not be reclassified to profit or loss (1,150) (1,862) Accumulated other comprehensive income/(expense) to be reclassified to profit or loss (960,973) (986,870) Hedging gains/(losses) (1,141,847) (1,132,725) Share of other comprehensive income of investments accounted for using equity method that will be reclassified to profit or loss 180,874 145,855 Restricted reserves 23 279,668 331,337 Retained earnings 5,651,805 5,363,804 Net income 3,811,546 1,793,267
Total equity attributable to equity holders of the parent 10,373,347 8,088,386
Non-controlling interests 104,314 78,647
Total equity and liabilities 38,162,979 31,218,180
The accompanying notes, form an integral part of these condensed interim consolidated financial statements.


TÜRKİYE PETROL RAFİNERİLERİ A.Ş.
CONSOLIDATED STATEMENT OF
FINANCIAL POSITION AS AT 31 DECEMBER 2017 (Amounts expressed in thousands of Turkish Lira (“TRY”) unless otherwise indicated.)
2
Audited Audited 1 January - 1 January - Notes 31 December 2017 31 December 2016
Revenue 24 53,948,110 34,854,851 Cost of sales 24 (47,734,212) (31,205,624)
Gross profit 6,213,898 3,649,227
General administrative expenses 25 (865,401) (748,280) Marketing, selling and distribution expenses 25 (268,889) (221,602) Research and development expenses 25 (15,950) (25,565) Other operating income 26 261,261 184,751 Other operating expenses 26 (467,460) (481,242)
Operating profit/(loss) 4,857,459 2,357,289
Income from investment activities 27 - 161 Expense from investment activities 27 (10,199) - Income/(loss) from investments accounted by equity method 10 244,639 158,750
Operating profit before financial income/(expense) 5,091,899 2,516,200
Financial income 28 1,162,799 1,344,302 Financial expense(-) 28 (1,780,660) (1,916,480)
Profit before tax from continued operations 4,474,038 1,944,022
Tax income/(expense) (633,482) (131,232) Taxes on income (-) (464,902) (91,633) Deferred tax income/ (expense) 29 (168,580) (39,599)
Net income from continued operations 3,840,556 1,812,790
Other comprehensive income: Items not to be reclassified to profit or loss 4,668 (4,364) Actuarial gain/(loss) arising from defined benefit plans 4,941 (4,180) Share of other comprehensive income accounted for investment using equity method that will be not reclassified to profit or loss 712 (1,011) Actuarial gain/(loss) arising from defined benefit plans accounted for investment using equity method 712 (1,011) Tax effect of other comprehensive income/(loss) not to be reclassified to profit or loss (985) 827 Deferred tax income/(expense) (985) 827
Items to be reclassified to profit or loss 22,511 (580,386) Share of other comprehensive income accounted for investment using equity method that will be reclassified to profit or loss 35,019 46,038 Actuarial gain/(loss) of revaluation or classification of investments using equity method 32,218 40,402 Gain/(loss) from translation of foreign currency of investments using equity method 2,801 5,636 Income/(expense) relating to avoidance of risk of cash flow (22,913) (777,964) Income/(loss) of avoidance of risk cash flow (22,913) (777,964) Tax effect of other comprehensive income/(loss) to be reclassified to profit or loss 10,405 151,540
Deferred tax income/(expense) 10,405 151,540
Other comprehensive income/(expense) 27,179 (584,750)
Total comprehensive income 3,867,735 1,228,040
The accompanying notes, form an integral part of these condensed interim consolidated financial statements


TÜRKİYE PETROL RAFİNERİLERİ A.Ş.
CONSOLIDATED STATEMENT OF PROFIT OR LOSS AND OTHER
COMPREHENSIVE INCOME FOR THEPERIOD ENDED 31 DECEMBER 2017 (Amounts expressed in thousands of Turkish Lira (“TRY”) unless otherwise indicated.)
2
Audited Audited 1 January - 1 January - Notes 31 December 2017 31 December 2016
Distribution of income for the period: Non-controlling interests 29,010 19,523 Attributable to equity holders of the parent 3,811,546 1,793,267
Distribution of total comprehensive income Non-controlling interests 25,667 15,307 Attributable to equity holders of the parent 3,842,068 1,212,664
Earnings (loss) per share from continued operations Earnings per share with nominal value Kr1 each (Kr) 15.22 7.16
The accompanying notes, form an integral part of these condensed interim consolidated financial statements.

TÜRKİYE PETROL RAFİNERİLERİ A.Ş.
CONSOLIDATED STATEMENT OF CHANGES IN EQUITY PERIOD ENDED 31 DECEMBER 2017 (Amounts expressed in thousands of Turkish Lira (“TRY”), unless otherwise indicated)
3
Accumulated other Accumulated other
Comprehensive comprehensive
income/(expense)not to be income/(expense) to be
reclassified to profit or loss reclassified to profit or loss Retained earnings
Gains/(losses) on
revaluation and Hedge gains/
remeasurement (losses)
Share of other
comprehensive income of
Actuarial gains/ investments accounted Equity
Adjustment Share (losses) arising Cashflow Currency using equity method Net holders Non-
Share to share premiums from defined hedge translation which will be Restricted Retained Income/ of the controlling Total
capital capital (discounts) benefit plans gains/(losses) differences to profit loss reserves earnings expense parent interest equity
1 January
2016 250,419 1,344,243 172 (2,771) (851) (510,448) 99,817 163,401 4,410,959 2,550,168 8,305,109 63,340 8
,368,449
Adjustments to previous
period effects - - - - - - - - 198,338 - 198,338 - 198,338 Transfers - - - - - - - 167,936 2,382,232 (2,550,168) - - -
Dividends paid - - - - - - - - (1,627,725) - (1,627,725) - (1,627,725)
- Net profit for period - - - - - - - - - 1,793,267 1,793,267 19,523 1,812,790 - Other comprehensive income - - - (3,353) (1,011) (622,277) 46,038 - - - (580,603) (4,216) (584,819)
Total comprehensive income - - - (3,353) (1,011) (622,277) 46,038 - - 1,793,267 1,212,664 15,307 1,227,971
31 December 2016 250,419 1,344,243 172 (6,124) (1,862) (1,132,725) 145,855 331,337 5,363,804 1,793,267 8,088,386 78,647 8,167,033
1 January
2017 250,419 1,344,243 172 (6,124) (1,862) (1,132,725) 145,855 331,337 5,363,804 1,793,267 8,088,386 78,647 8,167,033
Transfers - - - - - - - - 1,793,267 (1,793,267) - - - Dividends paid - - (172) - - - - (51,669) (1,505,266) - (1,557,107) - (1,557,107)
- Net profit for period - - - - - - - - - 3,811,546 3,811,546 29,010 3,840,556
- Other comprehensive income - - - 3,913 712 (9,122) 35,019 - - - 30,522 (3,343) 27,179
Total comprehensive income - - - 3,913 712 (9,122) 35,019 - - 3,811,546 3,842,068- 25,667 3,867,735
31 December 2017 250,419 1,344,243 - (2,211) (1,150) (1,141,847) 180,874 279,668 5,651,805 3,811,546 10,373,347 104,314 10,477,661
The accompanying notes, form an integral part of these condensed interim consolidated financial statements.

TÜRKİYE PETROL RAFİNERİLERİ A.Ş.
CONSOLIDATED STATEMENT OF CASH FLOWS
FOR THE PERIOD ENDED 31 DECEMBER 2017 (Amounts expressed in thousands of Turkish Lira (“TRY”), unless otherwise indicated)
4
Audited Audited
1 January - 1 January -
Notes 31 December 2017 31 December 2016
Cash flows from operating activities 3,327,294 4,882,222
Profit/(loss) 3,840,556 1,812,790
Adjustment for reconciliation of profit/(loss) 2,191,943 1,462,081
Adjustment for depreciation and amortisation expense 12, 13 573,640 541,003
Adjustments for stock impairment(cancelation) 1,246 (102,114)
Adjustments for stock impairment 8 1,246 (102,114)
- Adjustment for provisions 17 110,198 57,558
- Adjustment for interest (income) and expense 28 160,195 382,692
- Adjustment for unrealized foreign currency translation differences 28 (461,105) (709,477)
- Adjustment for fair value (gain) or loss 317,194 151,281
- Adjustment for income of investments accounted
by equity method 10
(244,639) (158,750)
- Adjustment for tax expenses(income) 633,482 131,232
- Adjustment for (gain)/loss on sales of
property, plant and equipment 27
10,199 (161)
- Adjustment for other items related with cash flow of investment
or financial activities 28
1,033,591 1,148,940
- Other adjustments for reconciliation of profit/(loss) 57,942 19,877
Changes in working capital
(2,152,135) 1,551,930
Adjustment for decrease/(increase) in trade receivables (1,873,499) (638,101)
Adjustment for decrease/(increase) in other receivables related with operations (148,602) 177,405
Adjustment for decrease/(increase) derivative assets (43,856) (134,741)
Adjustment for decrease/(increase) in inventories (1,683,897) (1,404,164)
Adjustment for increase/(decrease) in trade payables (1,222,948) 3,136,433
Adjustment for increase/(decrease) in other payables related with operations 225,506 451,485
Adjustment for decrease/(increase) derivative liabilities 149,265 (36,387)
Cash flows from operating activities 3,880,364 4,826,801
Tax returns/(payments) (488,895) (136,717)
Other cash inflow/(outflow) (64,175) 192,138
Cash flows from investing activities
(1,030,148) (841,751)
Cash outflows in subsidiaries regarding additional share purchases (5,000) -
Cash inflows from the sales of property, plant and equipment and intangible assets 4,802 1,650
Cash outflows from the purchase of property, plant and equipment and intangible assets (1,099,950) (885,401)
Dividends received 10 70,000 42,000
Cash flows from financing activities
(187,918) (1,926,714)
Cash inflows from financial liabilities 5 43,859,854 36,558,822
Cash outflows from financial liabilities 5 (42,051,025) (36,319,660)
Cash inflows from derivative instruments 180,446 93,297
Cash outflows from derivative instruments (503,357) (241,989)
Dividends paid (1,557,107) (1,627,725)
Interest paid (673,139) (687,398)
Interest received 556,410 297,939
Net increase/(decrease) in cash and cash equivalents before the effect of foreign currency
translation differences
2,109,228 2,113,757
Impact of foreign currency translation differences on cash and cash equivalents
461,105 709,477
Net increase/(decrease) in cash and cash equivalents
2,570,333 2,823,234
Cash and cash equivalents at beginning of period 4
5,022,402 2,199,168
Cash and cash equivalents at end of period 4
7,592,735 5,022,402
The accompanying notes, form an integral part of these condensed interim consolidated financial statements.

TÜRKİYE PETROL RAFİNERİLERİ A.Ş.
NOTES TO THE CONDENSED INTERIM CONSOLIDATED FINANCIAL
STATEMENTS FOR PERIOD ENDED 31 DECEMBER 2017 (Amounts expressed in thousands of Turkish Lira (“TRY”) unless otherwise indicated.)
5
1. Organization and nature of operations of the Group
Türkiye Petrol Rafinerileri A.Ş. (“Tüpraş” or the “Company”) was established on 16 November 1983. The
Company is mainly engaged in the following fields:
To provide and refine crude oil, to import and export petroleum products when necessary, and to establish
and operate domestic and foreign refineries for this purpose,
To establish and operate factories and facilities in petrochemical and other related industries,
To provide the necessary raw and supplementary materials and process, produce or trade these materials in
order to obtain petrochemical and other related products,
To package the products produced during various phases of production and to establish a packaging industry
for this purpose, to evaluate and/or to sell waste, by products and substandard products, to establish and
operate the necessary facilities for the destruction of the waste products,
To establish and operate facilities and plants related with all kinds of energy and energy related industries
within the framework of the laws and regulations. To obtain, use and trade all kinds of equipment, materials
and chemical substances for this purpose,
To purchase, sell, import, export, store, market all kinds of petroleum products, LPG and natural gas, to
establish marketing and distributing companies or similar partnerships with legal entities or real persons or
to acquire, transfer or sell the shares of partnerships, when necessary.
The main operations of Tüpraş and its subsidiaries (collectively referred as “the Group”) are in Turkey and the
Group’s business segment has been identified as refining.
The Company is registered at the Capital Markets Board (“CMB”) of Turkey and its shares have been quoted at
Borsa İstanbul A.Ş. (“BIST”) (previously known as Istanbul Stock Exchange (“ISE”)) since 1991. As at
31 December 2017, the shares quoted on the BIST are 49% of the total shares. As of 30 June 2017, the principal
shareholders and their respective shareholdings in the Company are as follows (Note 23):
%
Enerji Yatırımları A.Ş. 51.00
Publicly held 49.00
100.00
Parent of the Company is controlled by Koç Holding A.Ş., Koç Family and the companies owned by Koç Family.

TÜRKİYE PETROL RAFİNERİLERİ A.Ş.
NOTES TO THE CONDENSED INTERIM CONSOLIDATED FINANCIAL
STATEMENTS FOR PERIOD ENDED 31 DECEMBER 2017 (Amounts expressed in thousands of Turkish Lira (“TRY”) unless otherwise indicated.)
6
1. Organization and nature of operations of the Group (Continued)
The nature of the business of the subsidiaries and joint ventures of the Group is as follows:
Subsidiaries Country of
incorporation Nature of business
Ditaş Deniz İşletmeciliği ve Tankerciliği A.Ş. (“Ditaş”) Turkey Crude oil and petroleum products transportation
Üsküdar Tankercilik A.Ş. (“Üsküdar”) Turkey Crude oil and petroleum products transportation
T Damla Denizcilik A.Ş. (“Damla”) Turkey Crude oil and petroleum products transportation
Kadıköy Tankercilik A.Ş. (“Kadıköy”) Turkey Crude oil and petroleum products transportation
Beykoz Tankercilik A.Ş. (“Beykoz”) Turkey Crude oil and petroleum products transportation Sarıyer Tankercilik A.Ş. (“Sarıyer”) Turkey Crude oil and petroleum products transportation
Kartal Tankercilik A.Ş. (“Kartal”) Turkey Crude oil and petroleum products transportation
Maltepe Tankercilik A.Ş. (“Maltepe”) Turkey Crude oil and petroleum products transportation Salacak Tankercilik A.Ş. (“Salacak”) Turkey Crude oil and petroleum products transportation
Karşıyaka Tankercilik A.Ş. (“Karşıyaka”) Turkey Crude oil and petroleum products transportation
Bakırköy Tankercilik A.Ş. (“Bakırköy”) Turkey Crude oil and petroleum products transportation Karaköy Tankercilik A.Ş. (“Karaköy”) Turkey Crude oil and petroleum products transportation
Çengelköy Tankercilik A.Ş. (“Çengelköy”) Turkey Crude oil and petroleum products transportation
Pendik Tankercilik A.Ş. (“Pendik”) Turkey Crude oil and petroleum products transportation Tuzla Tankercilik A.Ş. (“Tuzla”) Turkey Crude oil and petroleum products transportation
Körfez Ulaştırma A.Ş. (“Körfez”) (*) Turkey Air carriage and transportation
(*) Körfez, a subsidiary of the Group, has not been included in the scope of consolidation in the condensed interim
consolidated financial statements for the period ended 30 June 2017 on the grounds of materiality of its stand-alone
and total financial statements as to amount and composition, and accounted for as financial asset available-for-sale. As
of 31 December 2017 total assets of Körfez is TRY11,921 thousand and net period loss of Körfez is TRY4,743
thousand.
Country of Joint ventures incorporation Nature of business OPET Petrolcülük A.Ş. (“Opet”) Turkey Petroleum products retail distribution
THY Opet Havacılık Yakıtları A.Ş. Turkey Jet fuel supply services
Opet International Limited United
Kingdom
Petroleum products trading
Opet Trade B.V. Netherlands Petroleum products trading Tasfiye halinde Opet Trade Singapore (*) Singapore Petroleum products trading Opet Fuchs Madeni Yağ San. ve Tic. A.Ş. Turkey Lube oil trading
Op Ay Akaryakıt Ticaret Ltd. Şti. Turkey Petroleum products trading Akdeniz Akaryakıt Depolama Nakliyat ve Tic. A.Ş. Turkey Petroleum products trading
Nemrut Liman ve Boru İşl. Nak. İç ve Dış Tic. Ltd. Şti. Turkey Marine services
Opet Aygaz Gayrimenkul A.Ş. Turkey Real estate
(*) The company discontinued its activities as of 15 July 2015.
The total number of employees of the Group as at 31 December 2017 is 5,499 (31 December 2016: 5,296).
The address of the registered office of the Company is as follows:
Türkiye Petrol Rafinerileri A.Ş.
Güney Mahallesi
Petrol Caddesi No:25 41790
Körfez, Kocaeli

TÜRKİYE PETROL RAFİNERİLERİ A.Ş.
NOTES TO THE CONDENSED INTERIM CONSOLIDATED FINANCIAL
STATEMENTS FOR PERIOD ENDED 31 DECEMBER 2017 (Amounts expressed in thousands of Turkish Lira (“TRY”) unless otherwise indicated.)
7
2. Basis of presentation of consolidated financial statements
2.1. Basis of presentation
2.1.1 Financial reporting standards
The condensed interim consolidated financial statements and disclosures have been prepared in accordance with the
communiqué numbered II-14,1 “Communiqué on the Principles of Financial Reporting In Capital Markets” (the
Communiqué) announced by the Capital Markets Board (“CMB”) on 13 June 2013 which is published on Official
Gazette numbered 28676. In accordance with article 5th of the Communique, companies should apply Turkish
Accounting Standards/Turkish Financial Reporting Standards and interpretations regarding these standards as
published by the Public Oversight Accounting and Auditing Standards Authority of Turkey (“POA”).
With the decision taken on 17 March 2005, the CMB announced that, effective from 1 January 2005, the application
of inflation accounting is no longer required for listed companies in Turkey. The Group’s financial statements have
been prepared in accordance with this decision.
In accordance with the Turkish Accounting Standard No: 34 Interim Financial Reporting”, entities are allowed to
prepare a complete or condensed set of interim financial statements. In this respect, the Group has preferred to prepare
condensed consolidated financial statements in the interim periods. Accordingly, these interim condensed
consolidated financial statements should be read in conjunction with the annual consolidated financial statements for
the year ended 31 December 2016.
The Group and the group companies established in Turkey maintain their books of account and prepare their statutory
financial statements (“Statutory Financial Statements”) in accordance with rules and principles published by POA,
the Turkish Commercial Code (“TCC”), tax legislation and the Uniform Chart of Accounts issued by the Ministry of
Finance. These consolidated financial statements have been prepared under the historical cost convention except for
available for sale financial assets and derivative instruments that are carried at fair value. These consolidated financial
statements are based on the statutory records with the required adjustments and reclassifications reflected for the
purpose of fair presentation in accordance with the Turkish Financial Reporting Standards.
Functional and presentation currency
Items included in the financial statements of each of the Group’s entities are measured using the currency of the
primary economic environment in which the entity operates (‘the functional currency’). The interim condensed
consolidated financial statements are presented in TRY, which is the functional currency of Tüpraş and the
presentation currency of the Group.
2.1.2 Amendments in Turkish Financial Reporting Standards (TFRS)
The new standards, amendments and interpretations
The accounting policies adopted in preparation of the interim condensed consolidated financial statements as at
30 December 2017 are consistent with those of the previous financial year, except for the adoption of new and
amended TFRS and IFRIC interpretations effective as of 1 January 2018. The effects of these standards and
interpretations on the Group’s financial position and performance have been disclosed in the related paragraphs.

TÜRKİYE PETROL RAFİNERİLERİ A.Ş.
NOTES TO THE CONDENSED INTERIM CONSOLIDATED FINANCIAL
STATEMENTS FOR PERIOD ENDED 31 DECEMBER 2017 (Amounts expressed in thousands of Turkish Lira (“TRY”) unless otherwise indicated.)
8
2. Basis of presentation of consolidated financial statements (Continued)
2.1. Basis of presentation (Continued)
2.1.2 Amendments in Turkish Financial Reporting Standards (TFRS) (Continued)
a) Standards, amendments and interpretations applicable as at 30 June 2017
• Amendments to TAS 7 ‘Statement of cash flows’ on disclosure initiative, effective from annual periods
beginning on or after 1 January 2017. These amendments introduce an additional disclosure that will enable
users of financial statements to evaluate changes in liabilities arising from financing activities. The
amendment is part of the TASB’s Disclosure Initiative, which continues to explore how financial statement
disclosure can be improved.
• Amendments TAS 12 ‘Income Taxes’, effective from annual periods beginning on or after
1 January 2017. The amendments on the recognition of deferred tax assets for unrealised losses clarify how
to account for deferred tax assets related to debt instruements measured at fair value.
• Annual improvements 2014-2016;
TFRS 12, ’Disclosure of interests in other entities’ regarding clarification of the scope of the standard.
These amendments should be applied retrospectively for annual periods beginning on or after 1 January
2017.
b) Standards, amendments and interpretations applicable as at 30 June 2017
• Amendments to TFRS 2, ‘Share based payments’ on clarifying how to account for certain types of share-
based payment transactions, effective from annual periods beginning on or after 1 January 2018. This
amendment clarifies the measurement basis for cash-settled, share-based payments and the accounting for
modifications that change an award from cash-settled to equity-settled. It also introduces an exception to
the principles in TFRS 2 that will require an award to be treated as if it was wholly equity-settled, where
an employer is obliged to withhold an amount for the employee’s tax obligation associated with a share-
based payment and pay that amount to the tax authority.
• TFRS 9 ‘Financial instruments’, effective from annual periods beginning on or after 1 January 2018. This
standard replaces the guidance in TAS 39. It includes requirements on the classification and measurement
of financial assets and liabilities; it also includes an expected credit losses model that replaces the current
incurred loss impairment model.
• TFRS 15 ‘Revenue from contracts with customers’, effective from annual periods beginning on or after
1 January 2018. TFRS 15, ‘Revenue from contracts with customers’ is a converged standard from the TASB
and FASB on revenue recognition. The standard will improve the financial reporting of revenue and
improve comparability of the top line in financial statements globally.
• Amendment to TFRS 15, ‘Revenue from contracts with customers’, effective from annual periods begining
on or after 1 January 2018. These amendments comprise clarifications of the guidance on identifying
performance obligations, accounting for licences of intellectual property and the principal versus agent
assessment (gross versus net revenue presentation). New and amended illustrative examples have been
added for each of those areas of guidance. The TASB has also included additional practical expedients
related to transition to the new revenue standard.

TÜRKİYE PETROL RAFİNERİLERİ A.Ş.
NOTES TO THE CONDENSED INTERIM CONSOLIDATED FINANCIAL
STATEMENTS FOR PERIOD ENDED 31 DECEMBER 2017 (Amounts expressed in thousands of Turkish Lira (“TRY”) unless otherwise indicated.)
9
2. Basis of presentation of consolidated financial statements (Continued)
2.1. Basis of presentation (Continued)
2.1.2 Amendments in Turkish Financial Reporting Standards (TFRS) (Continued)
• TFRS 16 ‘Leases’, effective from annual periods beginning on or after 1 January 2019 with earlier
application permitted if TFRS 15, ‘Revenue from Contracts with Customers’, is also applied. This standard
replaces the current guidance in TAS 17 and is a far-reaching change in accounting by lessees in particular.
Under TAS 17, lessees were required to make a distinction between a finance lease (on balance sheet) and
an operating lease (off balance sheet). TFRS 16 now requires lessees to recognise a lease liability reflecting
future lease payments and a ‘right-of-use asset’ for virtually all lease contracts. The TASB has included an
optional exemption for certain short-term leases and leases of low-value assets; however, this exemption
can only be applied by lessees. For lessors, the accounting stays almost the same. However, as the TASB
has updated the guidance on the definition of a lease (as well as the guidance on the combination and
separation of contracts), lessors will also be affected by the new standard. At the very least, the new
accounting model for lessees is expected to impact negotiations between lessors and lessees. Under TFRS
16, a contract is, or contains, a lease if the contract conveys the right to control the use of an identified asset
for a period of time in exchange for consideration.
• Amendments to TFRS 4, ‘Insurance contracts’ regarding the implementation of TFRS 9, ‘Financial
Instruments’, effective from annual periods beginning on or after 1 January 2018. These amendments
introduce two approaches: an overlay approach and a deferral approach. The amended standard will:
• give all companies that issue insurance contracts the option to recognise in other comprehensive income,
rather than profit or loss, the volatility that could arise when TFRS 9 is applied before the new insurance
contracts standard is issued; and
• give companies whose activities are predominantly connected with insurance an optional temporary
exemption from applying TFRS 9 until 2021. The entities that defer the application of TFRS 9 will continue
to apply the existing financial instruments standard— TAS 39.
• Amendment to TAS 40, Investment property’ relating to transfers of investment property, effective from
annual periods beginning on or after 1 January 2018. These amendments clarify that to transfer to, or from,
investment properties there must be a change in use. To conclude if a property has changed use there should
be an assessment of whether the property meets the definition. This change must be supported by evidence.
• Annual improvements 2014–2016;
TFRS 1,’ First-time adoption of TFRS’, regarding the deletion of short-term exemptions for first-time
adopters regarding TFRS 7, TAS 19, and TFRS 10 effective 1 January 2018.
TAS 28,’Investments in associates and joint ventures’ regarding measuring an associate or joint venture at
fair value effective 1 January 2018.
• IFRIC 22, ‘Foreign currency transactions and advance consideration’, effective from annual periods
beginning on or after 1 January 2018. This IFRIC addresses foreign currency transactions or parts of
transactions where there is consideration that is denominated or priced in a foreign currency. The
interpretation provides guidance for when a single payment/receipt is made as well as for situations where
multiple payments/receipts are made. The guidance aims to reduce diversity in practice.
• TFRS 17, ‘Insurance contracts’, effective from annual periods beginning on or after 1 January 2021. This
standard replaces TFRS 4, which currently permits a wide variety of practices in accounting for insurance
contracts. TFRS 17 will fundamentally change the accounting by all entities that issue insurance contracts
and investment contracts with discretionary participation features.

TÜRKİYE PETROL RAFİNERİLERİ A.Ş.
NOTES TO THE CONDENSED INTERIM CONSOLIDATED FINANCIAL
STATEMENTS FOR PERIOD ENDED 31 DECEMBER 2017 (Amounts expressed in thousands of Turkish Lira (“TRY”) unless otherwise indicated.)
10
2. Basis of presentation of consolidated financial statements (Continued)
2.1. Basis of presentation (Continued)
2.1.2 Amendments in Turkish Financial Reporting Standards (TFRS) (Continued)
• The possible effects regarding the amendments in TFRS 15, TFRS 9, TFRS 16 on the consolidated financial statements has been evaluated by the Group management. According to the evaluations made throughout the period, considering agreements made with customers and related costs, it is anticipated that subjects such as sales guarantees, combined goods and services sales to be assessed under TFRS 15, will not have a significant impact on the consolidated financial statements of the Group. The Group management will reevaluate the effects of TFRS 15 considering possible future developments. According to TFRS 16, total amount of leased assets under operational lease is determined as of the balance sheet date and the evaluation of assets planned to be acquired in the future by operational lease has been performed. TFRS 9 includes requirements for measurment and classification of financial assets and liabilities, and also involves expected credit risk model, which will replace impairment loss model. As of 30 June 2017, considering the insignificant amount of doubtful receivables in the total amount of trade receivables, it is predicted that the expected credit risk model will not have any significant effect on the consolidated financial statements of the Group. Evaluations of the Group management are ongoing regarding the possible effects of these new standards.
2.1.3 Financial statements of joint ventures operating in foreign countries
Financial statements of joint ventures operating in foreign countries are prepared according to the legislation of the country in which they operate, and adjusted to the Turkish Financial Reporting Standards to reflect the proper presentation and content. Foreign joint ventures’ assets and liabilities are translated into TRY with the foreign exchange rate at the balance sheet date. Exchange differences arising from the retranslation of the opening net assets of foreign undertakings and differences between the average and balance sheet date rates are included in the “Income/(loss) from translation of foreign currency of investments using equity method” under the other comprehensive income statement and shareholders’ equity.
2.1.4 Principles of consolidation
a) The condensed consolidated financial statements for the interim period ended 30 June 2017 have been prepared in accordance with principles stated on the consolidated financial statements for the year ended 31 December 2016 and include financial statements of Tüpraş, and its Subsidiaries.
b) At 30 June 2017, there are no changes in voting rights or proportion of effective interest on subsidiaries and joint ventures that are subject to consolidation from the information stated on consolidated financial statements for the year ended 31 December 2016.
30 June 2017 31 December 2016
Direct and indirect voting rights possessed by the
Company (%)
Proportion of effective
interest (%)
Direct and indirect voting rights possessed by the
Company (%)
Proportion of effective
interest (%) Subsidiary Ditaş 79.98 79.98 79.98 79.98 Üsküdar 79.98 79.98 79.98 79.98 Damla 79.98 79.98 79.98 79.98 Beykoz 79.98 79.98 79.98 79.98 Kadıköy 79.98 79.98 79.98 79.98 Sarıyer 79.98 79.98 79.98 79.98 Kartal 79.98 79.98 79.98 79.98 Maltepe 79.98 79.98 79.98 79.98 Salacak 79.98 79.98 79.98 79.98 Karşıyaka 79.98 79.98 79.98 79.98 Bakırköy 79.98 79.98 79.98 79.98 Karaköy 79.98 79.98 79.98 79.98 Çengelköy 79.98 79.98 79.98 79.98 Pendik 79.98 79.98 79.98 79.98 Tuzla 79.98 79.98 79.98 79.98
The statement of financial position and statement of comprehensive income of the subsidiaries are consolidated on a line-by-line basis and the carrying value of the investment held by the Company is eliminated against the related equity. Intercompany transactions and balances between the Company and its subsidiary are eliminated on consolidation. The cost of and the dividends arising from, shares held by the Company in its subsidiary are eliminated from equity and income for the year, respectively.
TÜRKİYE PETROL RAFİNERİLERİ A.Ş.
NOTES TO THE CONDENSED INTERIM CONSOLIDATED FINANCIAL
STATEMENTS FOR PERIOD ENDED 31 DECEMBER 2017 (Amounts expressed in thousands of Turkish Lira (“TRY”) unless otherwise indicated.)
11
2. Basis of presentation of consolidated financial statements (Continued)
2.1. Basis of presentation (Continued)
2.1.4 Principles of consolidation (Continued)
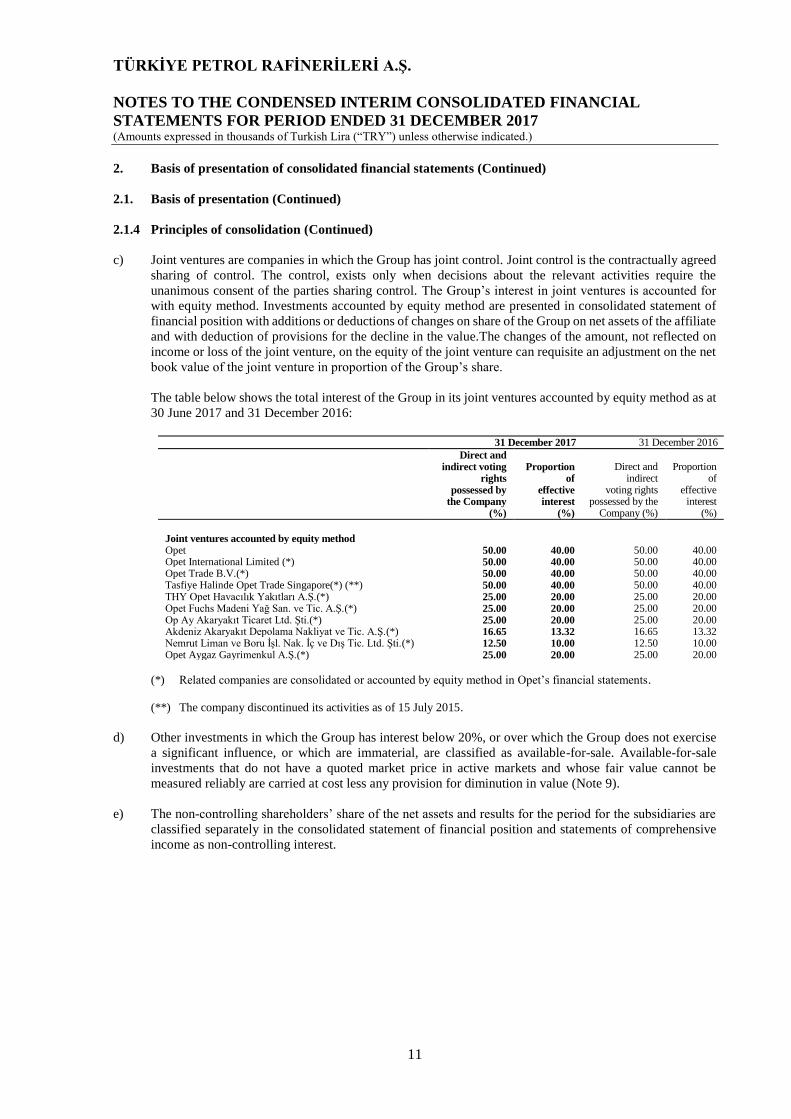
c) Joint ventures are companies in which the Group has joint control. Joint control is the contractually agreed
sharing of control. The control, exists only when decisions about the relevant activities require the
unanimous consent of the parties sharing control. The Group’s interest in joint ventures is accounted for
with equity method. Investments accounted by equity method are presented in consolidated statement of
financial position with additions or deductions of changes on share of the Group on net assets of the affiliate
and with deduction of provisions for the decline in the value.The changes of the amount, not reflected on
income or loss of the joint venture, on the equity of the joint venture can requisite an adjustment on the net
book value of the joint venture in proportion of the Group’s share.
The table below shows the total interest of the Group in its joint ventures accounted by equity method as at
30 June 2017 and 31 December 2016:
31 December 2017 31 December 2016
Direct and indirect voting
rights possessed by
the Company (%)
Proportion of
effective interest
(%)
Direct and indirect
voting rights possessed by the
Company (%)
Proportion of
effective interest
(%)
Joint ventures accounted by equity method Opet 50.00 40.00 50.00 40.00 Opet International Limited (*) 50.00 40.00 50.00 40.00 Opet Trade B.V.(*) 50.00 40.00 50.00 40.00 Tasfiye Halinde Opet Trade Singapore(*) (**) 50.00 40.00 50.00 40.00 THY Opet Havacılık Yakıtları A.Ş.(*) 25.00 20.00 25.00 20.00 Opet Fuchs Madeni Yağ San. ve Tic. A.Ş.(*) 25.00 20.00 25.00 20.00 Op Ay Akaryakıt Ticaret Ltd. Şti.(*) 25.00 20.00 25.00 20.00 Akdeniz Akaryakıt Depolama Nakliyat ve Tic. A.Ş.(*) 16.65 13.32 16.65 13.32 Nemrut Liman ve Boru İşl. Nak. İç ve Dış Tic. Ltd. Şti.(*) 12.50 10.00 12.50 10.00 Opet Aygaz Gayrimenkul A.Ş.(*) 25.00 20.00 25.00 20.00
(*) Related companies are consolidated or accounted by equity method in Opet’s financial statements.
(**) The company discontinued its activities as of 15 July 2015.
d) Other investments in which the Group has interest below 20%, or over which the Group does not exercise
a significant influence, or which are immaterial, are classified as available-for-sale. Available-for-sale
investments that do not have a quoted market price in active markets and whose fair value cannot be
measured reliably are carried at cost less any provision for diminution in value (Note 9).
e) The non-controlling shareholders’ share of the net assets and results for the period for the subsidiaries are
classified separately in the consolidated statement of financial position and statements of comprehensive
income as non-controlling interest.

TÜRKİYE PETROL RAFİNERİLERİ A.Ş.
NOTES TO THE CONDENSED INTERIM CONSOLIDATED FINANCIAL
STATEMENTS FOR PERIOD ENDED 31 DECEMBER 2017 (Amounts expressed in thousands of Turkish Lira (“TRY”) unless otherwise indicated.)
12
2. Basis of presentation of consolidated financial statements (Continued)
2.2. Changes in accounting policies
2.2.1 Comparative information
In order to allow for the determination of the financial situation and performance trends, the Group’s consolidated
financial statements have been presented comparatively with the previous year.
The Group presented the consolidated statement of financial position as of 30 June 2017 comparatively with the
consolidated statement of financial position as of 31 December 2016. Also the consolidated statement of profit or
loss and other comprehensive income, consolidated statement of cash flows and consolidated statement of changes
in equity for the interim period ended 30 June 2017 are presented comparatively with the consolidated financial
statements for the interim period ended 30 June 2016.
2.2.2 Offsetting
Financial assets and liabilities are offset and the net amount is reported in the balance sheet when there is a legally
enforceable right to offset the recognised amounts and there is an intention to settle on a net basis or realise the
asset and settle the liability simultaneously.
2.2.3 Seasonality of operations
There is no seasonality effect depending on the dynamics of petroleum sector that the Group operates in which
could affect the financial statements.
2.3. Summary of significant accounting policies
Condensed consolidated financial statements for the period ended 30 June 2017, have been prepared in compliance
with TAS 34, the TFRS standard on interim financial reporting. Furthermore, condensed consolidated financial
statements as of 30 June 2017 have been prepared applying accounting policies which are consistent with the
accounting policies used for the preparation of consolidated financial statements for the year ended 31 December
2016. Thus, these condensed consolidated financial statements must be evaluated together with the consolidated
financial statements for the year ended 31 December 2016.
3. Business Combinations
No business combinations occurred during the period 31 December 2017.

TÜRKİYE PETROL RAFİNERİLERİ A.Ş.
NOTES TO THE CONDENSED INTERIM CONSOLIDATED FINANCIAL
STATEMENTS FOR PERIOD ENDED 31 DECEMBER 2017 (Amounts expressed in thousands of Turkish Lira (“TRY”) unless otherwise indicated.)
13
NOTE 4 - CASH AND CASH EQUIVALENTS
31 December 2017 31 December 2016
Cash at banks Revenue share (blocked) 1,198,211 1,002,012 Time deposits 7,568,764 5,016,257 Demand deposits 23,971 6,145
Time deposit interest accruals 11,123 26,307
Total 8,802,069 6,050,721
Revenue Share (blocked)
As required by the Petroleum Market License Regulation, the revenue share collected from the customers by the Group is held at banks and considered as blocked deposit in the Company’s books. The revenue share was invested as demand deposits with overnight interest rate as at 31 December 2017 and 31 December 2016 (Note 15).
Time deposits and other cash and cash equivalents
As at 31 December 2017 and 31 December 2016, the maturity and the currency information of the time deposits, is as follows:
Effective rate of Less than 1-3 31 December 2017 interest (%) 1 month months Total
TRY 13.94 74,655 1,917 76,572 USD 4.37 6,944,727 17,917 6,962,644 EUR 2.13 499,531 29,463 528,994 GBP 1.40 554 - 554
Time deposit 7,519,467 49,297 7,568,764
Effective rate of Less than 1-3 31 December 2016 interest (%) 1 month months Total
TRY 11.40 945,212 - 945,212 USD 3.63 2,884,335 181,826 3,066,161 EUR 1.98 1,003,834 557 1,004,391 GBP 1.30 493 - 493
Time deposit 4,833,874 182,383 5,016,257
Cash and cash equivalents included in the consolidated statements of cash flows for the periods ended 31 December 2017 and 31 December 2016 are as follows:
31 December 2017 31 December 2016
Cash and cash equivalents 8,802,069 6,050,721 Blocked deposits (Revenue share) (1,198,211) (1,002,012) Less: Time deposit interest accruals (11,123) (26,307)
7,592,735 5,022,402
TÜRKİYE PETROL RAFİNERİLERİ A.Ş.
NOTES TO THE CONDENSED INTERIM CONSOLIDATED FINANCIAL
STATEMENTS FOR PERIOD ENDED 31 DECEMBER 2017 (Amounts expressed in thousands of Turkish Lira (“TRY”) unless otherwise indicated.)
14
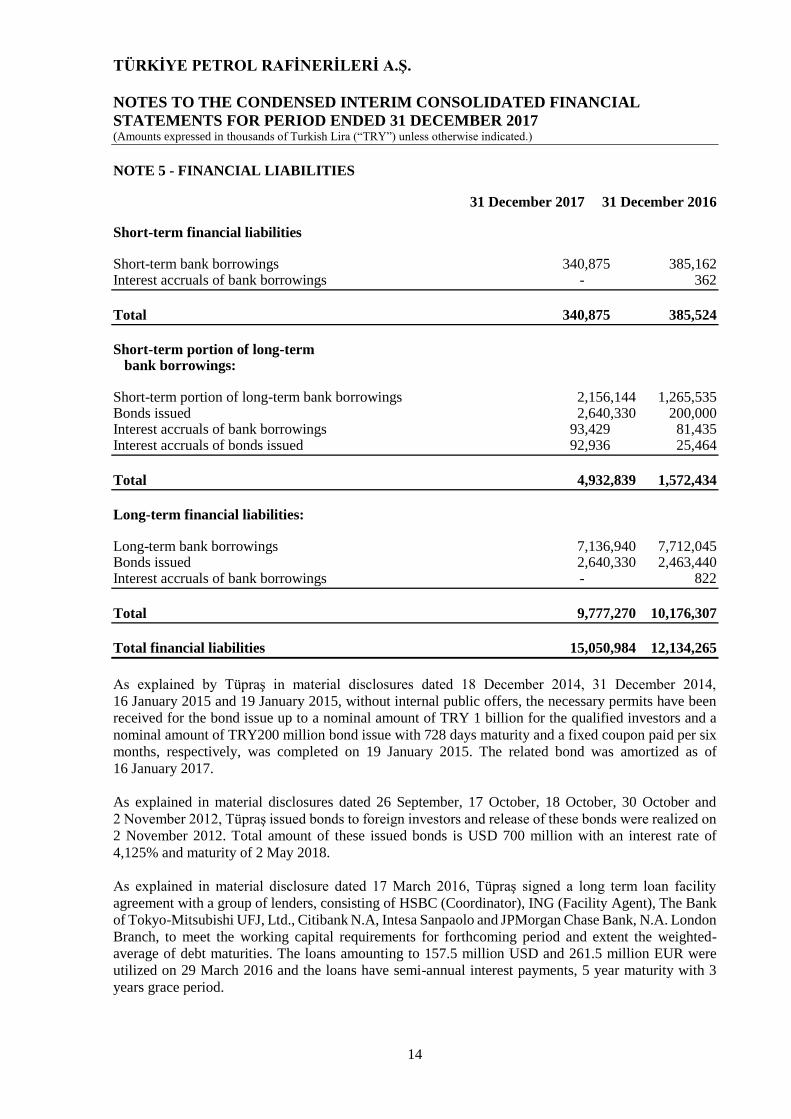
NOTE 5 - FINANCIAL LIABILITIES 31 December 2017 31 December 2016 Short-term financial liabilities Short-term bank borrowings 340,875 385,162 Interest accruals of bank borrowings - 362
Total 340,875 385,524
Short-term portion of long-term bank borrowings: Short-term portion of long-term bank borrowings 2,156,144 1,265,535 Bonds issued 2,640,330 200,000 Interest accruals of bank borrowings 93,429 81,435 Interest accruals of bonds issued 92,936 25,464
Total 4,932,839 1,572,434
Long-term financial liabilities: Long-term bank borrowings 7,136,940 7,712,045 Bonds issued 2,640,330 2,463,440 Interest accruals of bank borrowings - 822
Total 9,777,270 10,176,307
Total financial liabilities 15,050,984 12,134,265
As explained by Tüpraş in material disclosures dated 18 December 2014, 31 December 2014,
16 January 2015 and 19 January 2015, without internal public offers, the necessary permits have been
received for the bond issue up to a nominal amount of TRY 1 billion for the qualified investors and a
nominal amount of TRY200 million bond issue with 728 days maturity and a fixed coupon paid per six
months, respectively, was completed on 19 January 2015. The related bond was amortized as of
16 January 2017.
As explained in material disclosures dated 26 September, 17 October, 18 October, 30 October and
2 November 2012, Tüpraş issued bonds to foreign investors and release of these bonds were realized on
2 November 2012. Total amount of these issued bonds is USD 700 million with an interest rate of
4,125% and maturity of 2 May 2018.
As explained in material disclosure dated 17 March 2016, Tüpraş signed a long term loan facility
agreement with a group of lenders, consisting of HSBC (Coordinator), ING (Facility Agent), The Bank
of Tokyo-Mitsubishi UFJ, Ltd., Citibank N.A, Intesa Sanpaolo and JPMorgan Chase Bank, N.A. London
Branch, to meet the working capital requirements for forthcoming period and extent the weighted-
average of debt maturities. The loans amounting to 157.5 million USD and 261.5 million EUR were
utilized on 29 March 2016 and the loans have semi-annual interest payments, 5 year maturity with 3
years grace period.

TÜRKİYE PETROL RAFİNERİLERİ A.Ş.
NOTES TO THE CONDENSED INTERIM CONSOLIDATED FINANCIAL
STATEMENTS FOR PERIOD ENDED 31 DECEMBER 2017 (Amounts expressed in thousands of Turkish Lira (“TRY”) unless otherwise indicated.)
15
NOTE 5 - FINANCIAL LIABILITIES (Continued)
In 2011, Tüpraş has signed three loan agreements in order to finance Residuum Upgrading Project
(“RUP”) and further to the agreements the loans amounting to USD1,998 million were utilized between
2011 and 2015 for credit insurance payments and capital expenditures. According to financing package
loan was insured by SACE and CESCE have 12 years to maturity also there will be no principal and
interest payment in first 4 years. The third loan has 7 years to maturity and there will be no principal
payment in the first four years. The repayment of the loans has started in 2015 and as at 31 December
2017 the outstanding amount of the loans is USD1,239 million
(31 December 2016: USD1,555 million)
Foreign currency balances and effective interest rates for the short and long-term financial liabilities as
at 31 December 2017 and 31 December 2016 are as follows:
31 December 2017 Efffective interest Original Thousand
Short-term financial liabilities:
USD borrowing 1.45 3,500,000 13,202
TRY borrowings (*) - 327,673,483 327,673
Interest accruals -
Total short-term financial liabilities 340,875
Short-term portion of long-term
financial liabilities:
USD borrowings 3.58 316,227,073 1,192,776
USD bonds issued 4.17 700,000,000 2,640,330
EUR borrowings 3.26 9,220,636 41,636
TRY borrowings 12.48 921,732,026 921,732
4,796,474
Interest accruals 136,365
Total short-term portion of long-term
financial liabilities 4,932,839
Long-term financial liabilities:
USD
borrowings 3.38 1,460,677,340 5,509
,529
USD bonds issued 4.55 700,000,000 2,640,330
EUR borrowings 2.06 291,146,521 1,314,672
TRY borrowings 13.43 312,738,562 312,739
9,777,270
Interest accruals -
Total long-term financial liabilities 9,777,270

TÜRKİYE PETROL RAFİNERİLERİ A.Ş.
NOTES TO THE CONDENSED INTERIM CONSOLIDATED FINANCIAL
STATEMENTS FOR PERIOD ENDED 31 DECEMBER 2017 (Amounts expressed in thousands of Turkish Lira (“TRY”) unless otherwise indicated.)
16
(*) Banks provide interest-free loans to the Group for the payment of SCT, Customs and Social Security
debts amounting to TRY327,673 thousand as of 31 December 2017 (31 December 2016:
TRY190,645 thousand).
TÜRKİYE PETROL RAFİNERİLERİ A.Ş.
NOTES TO THE CONDENSED INTERIM CONSOLIDATED FINANCIAL
STATEMENTS FOR PERIOD ENDED 31 DECEMBER 2017 (Amounts expressed in thousands of Turkish Lira (“TRY”) unless otherwise indicated.)
17
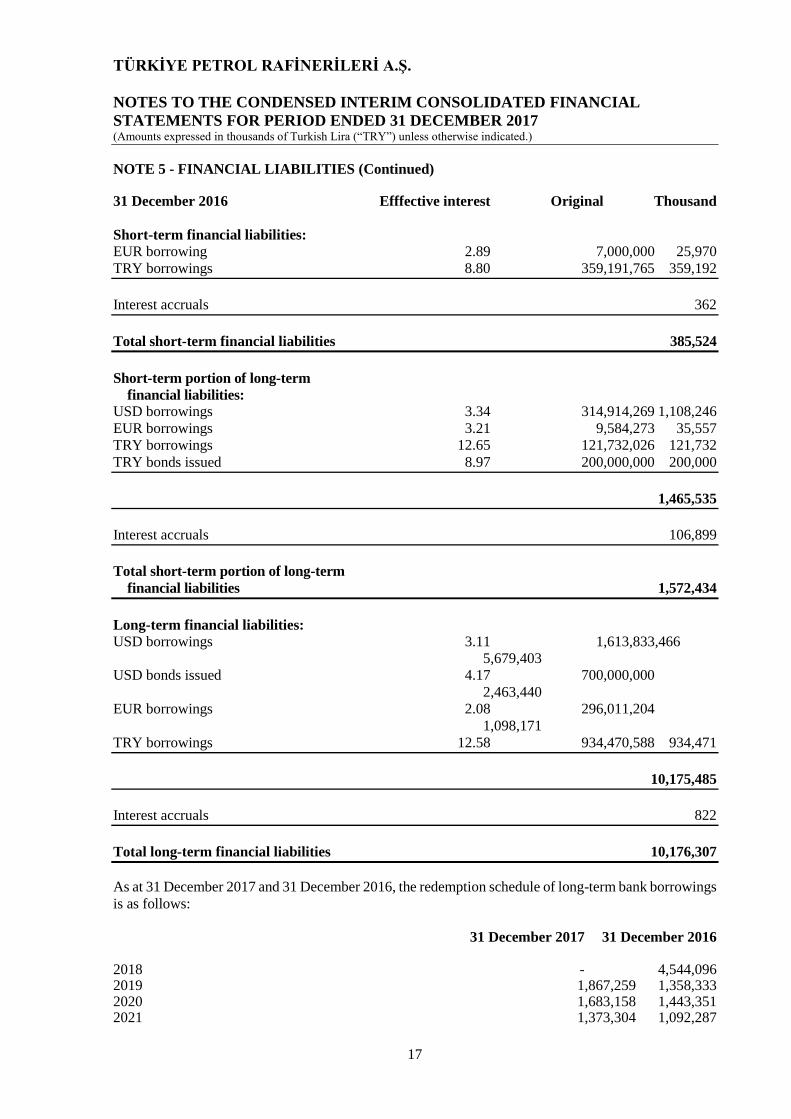
NOTE 5 - FINANCIAL LIABILITIES (Continued)
31 December 2016 Efffective interest Original Thousand
Short-term financial liabilities:
EUR borrowing 2.89 7,000,000 25,970
TRY borrowings 8.80 359,191,765 359,192
Interest accruals 362
Total short-term financial liabilities 385,524
Short-term portion of long-term
financial liabilities:
USD borrowings 3.34 314,914,269 1,108,246
EUR borrowings 3.21 9,584,273 35,557
TRY borrowings 12.65 121,732,026 121,732
TRY bonds issued 8.97 200,000,000 200,000
1,465,535
Interest accruals 106,899
Total short-term portion of long-term
financial liabilities 1,572,434
Long-term financial liabilities:
USD borrowings 3.11 1,613,833,466
5,679,403
USD bonds issued 4.17 700,000,000
2,463,440
EUR borrowings 2.08 296,011,204
1,098,171
TRY borrowings 12.58 934,470,588 934,471
10,175,485
Interest accruals 822
Total long-term financial liabilities 10,176,307
As at 31 December 2017 and 31 December 2016, the redemption schedule of long-term bank borrowings
is as follows:
31 December 2017 31 December 2016 2018 - 4,544,096 2019 1,867,259 1,358,333 2020 1,683,158 1,443,351 2021 1,373,304 1,092,287

TÜRKİYE PETROL RAFİNERİLERİ A.Ş.
NOTES TO THE CONDENSED INTERIM CONSOLIDATED FINANCIAL
STATEMENTS FOR PERIOD ENDED 31 DECEMBER 2017 (Amounts expressed in thousands of Turkish Lira (“TRY”) unless otherwise indicated.)
18
2022 and after 4,853,549 1,738,240
9,777,270 10,176,307

TÜRKİYE PETROL RAFİNERİLERİ A.Ş.
NOTES TO THE CONDENSED INTERIM CONSOLIDATED FINANCIAL
STATEMENTS FOR PERIOD ENDED 31 DECEMBER 2017 (Amounts expressed in thousands of Turkish Lira (“TRY”) unless otherwise indicated.)
19
NOTE 5 - FINANCIAL LIABILITIES (Continued) The movement of borrowings as of 31 December 2017 and 31 December 2016 is as follows: 2017 2016 1 January 12,134,265 9,919,420 New financial borrowings 43,859,854 36,558,822 Principal payments (42,051,025) (36,319,660) Changes in interest accruals 28,282 14,807 Changes in foreign exchange rates 1,079,608 1,960,876
31 December 15,050,984 12,134,265
The redemption schedule of borrowings according to their contractual repricing dates is as follows:
31 December 2017 31 December 2016
1-90 days 3,294,726 2,779,361 91-365 days 7,784,235 4,780,459 1-5 years 1,162,249 4,264,306 Over 5 years 2,809,774 310,139
15,050,984 12,134,265
NOTE 6 - TRADE RECEIVABLES AND PAYABLES
Short-term trade receivables: 31 December 2017 31 December 2016 Trade receivables 3,658,736 2,433,602 Due from related parties (Note 31) 1,399,601 751,824 Doubtful trade receivables 3,184 2,676 Other trade receivables 16 9 Less: Unearned credit finance income (31,320) (5,153) Less: Provision for doubtful receivables (3,184) (2,676)
Total short-term trade receivables (net) 5,027,033 3,180,282
Tüpraş discounts the domestic receivables by using domestic government bonds and foreign receivables
by using six months libor rates.
As at 31 December 2017, Tüpraş has offsetted TRY860,788 thousand (31 December 2016: TRY
1,625,766 thousand) from trade receivables that are collected from factoring companies as part of the
irrevocable factoring.

TÜRKİYE PETROL RAFİNERİLERİ A.Ş.
NOTES TO THE CONDENSED INTERIM CONSOLIDATED FINANCIAL
STATEMENTS FOR PERIOD ENDED 31 DECEMBER 2017 (Amounts expressed in thousands of Turkish Lira (“TRY”) unless otherwise indicated.)
20
NOTE 6 - TRADE RECEIVABLES AND PAYABLES (Continued) The credit quality of trade receivables that are neither past due nor impaired The Group categorizes the details of credit quality of trade receivables that are neither past due nor impaired or receivables whose conditions are renegotiated under four groups. The details of credit quality of such trade receivables as at 31 December 2017 and 31 December 2016 are as follows 31 December 2017 31 December 2016 Group 1 8,505 1,783 Group 2 762,329 3,063 Group 3 4,152,610 2,070,505 Group 4 65,184 1,040,014
Total short-term trade receivables (net) 4,988,628 3,115,365
Group 1 - New customers (less than three months) Group 2 - State owned enterprises Group 3 - Existing customers with no payment defaults in previous periods (have been customers by more than three months) Group 4 - Customers with previous record of collection delays but from which all receivables due are collected (Excluding Group 1 and 2) Aging analysis for trade receivables that are past due but not impaired Aging of overdue receivables that are past due but not impaired as at 31 December 2017 and 31 December 2016 is as follows: 31 December 2017 31 December 2016 Up to 3 months 37,224 62,386 3 to 12 months 1,181 2,531
Total short-term trade receivables (net) 38,405 64,917
The Group has guarantees received amounting to TRY28,587 (31 December 2016: TRY51,479) for trade receivables overdue but not impaired. Major part of receivables without guarantees are from government entities which regularly made sales, any collection risk is not projected. Movement of the provision for doubtful receivables for the years ended 31 December 2016 and 2017 is as follows: 2017 2016 1 January 2,676 2,593 Charge for the period 581 98 Payments during the period (73) (15)
31 December 3,184 2,676

TÜRKİYE PETROL RAFİNERİLERİ A.Ş.
NOTES TO THE CONDENSED INTERIM CONSOLIDATED FINANCIAL
STATEMENTS FOR PERIOD ENDED 31 DECEMBER 2017 (Amounts expressed in thousands of Turkish Lira (“TRY”) unless otherwise indicated.)
21
NOTE 6 - TRADE RECEIVABLES AND PAYABLES (Continued)
Short-term trade payables:
31 December 2017 31 December 2016
Trade payables 8,106,081 6,910,572 Due to related parties (Note 31) 115,456 88,017 Less: Unrealised credit finance charges trade payables (8,371) (10,746)
8,213,166 6,987,843
NOTE 7 - OTHER RECEIVABLES AND PAYABLES Other short-term receivables:
31 December 2017 31 December 2016
Advances and guarantees given 66,887 10,280 Receivable from personnel 9,141 7,723 Receivable from insurance recoveries 8,239 7,623 Other doubtful receivables 360 304 Less: Provision for other doubtful receivables (360) (304)
84,267 25,626
NOTE 8 - INVENTORIES
31 December 2017 31 December 2016
Raw materials and supplies 1,901,787 1,084,842 Work-in-progress 1,278,257 795,792 Finished goods 1,401,057 919,756 Trade goods 195,767 50,669 Goods in transit 487,155 743,851 Other 28,313 13,529
5,292,336 3,608,439
Provision for doubtful receivables (1,246) -
5,291,090 3,608,439
2017 2016 1 January - 102,114 Charge for the period 1,246 - Cancellations within the period - (102,114)
31 December 1,246 -

TÜRKİYE PETROL RAFİNERİLERİ A.Ş.
NOTES TO THE CONDENSED INTERIM CONSOLIDATED FINANCIAL
STATEMENTS FOR PERIOD ENDED 31 DECEMBER 2017 (Amounts expressed in thousands of Turkish Lira (“TRY”) unless otherwise indicated.)
22
NOTE 9 - FINANCIAL INVESTMENTS
Financial investments available-for-sale
31 December 2017 31 December 2016 Participation Participation Amount share (%) Amount share (%) Amount
Körfez Ulaştırma A.Ş. 100.00 9,000 100.00 4,000
9,000 4,000
NOTE 10 - INVESTMENTS ACCOUNTED FOR USING THE EQUITY METHOD
31 December 2017 31 December 2016 Participation Participation Amount share (%) Amount share (%) Amount
OPET Petrolcülük A.Ş. 40.00 1,134,364 40.00 923,994
1,134,364 923,994
The goodwill amounting to TRY189,073 thousand arising from the purchase of Opet shares on
28 December 2006 were classified on the investments accounted for using the equity method in the
financial statements.
The movement in the investments accounted for using the equity method during the period ended
31 December 2017 and 2016 is as follows:
2017 2016
1 January 923,994 762,217
Investments accounted for using the equity method; Shares in current year profit 244,639 158,750 Dividend payment (70,000) (42,000) Defined benefit plans remeasurement gains/(losses) 712 (1,011) Other comprehensive income accounted for investment using equity method that will be reclassified to profit or loss
32,218 40,402 Currency translation differences 2,801 5,636
31 December 1,134,364 923,994
Consolidated summary financial statements of investments accounted for using the equity method
(before Group’s effective interest) are as follows:
31 December 2017 31 December 2016
Current assets 3,783,607 3,039,266 Non-current assets 2,662,261 2,301,201
Total assets 6,445,868 5,340,467
Short term liabilities 2,724,380 2,399,461 Long term liabilities 1,358,260 1,103,703 Equity 2,363,228 1,837,303

TÜRKİYE PETROL RAFİNERİLERİ A.Ş.
NOTES TO THE CONDENSED INTERIM CONSOLIDATED FINANCIAL
STATEMENTS FOR PERIOD ENDED 31 DECEMBER 2017 (Amounts expressed in thousands of Turkish Lira (“TRY”) unless otherwise indicated.)
23
Total liabilities 6,445,868 5,340,467
TÜRKİYE PETROL RAFİNERİLERİ A.Ş.
NOTES TO THE CONDENSED INTERIM CONSOLIDATED FINANCIAL
STATEMENTS FOR PERIOD ENDED 31 DECEMBER 2017 (Amounts expressed in thousands of Turkish Lira (“TRY”) unless otherwise indicated.)
24
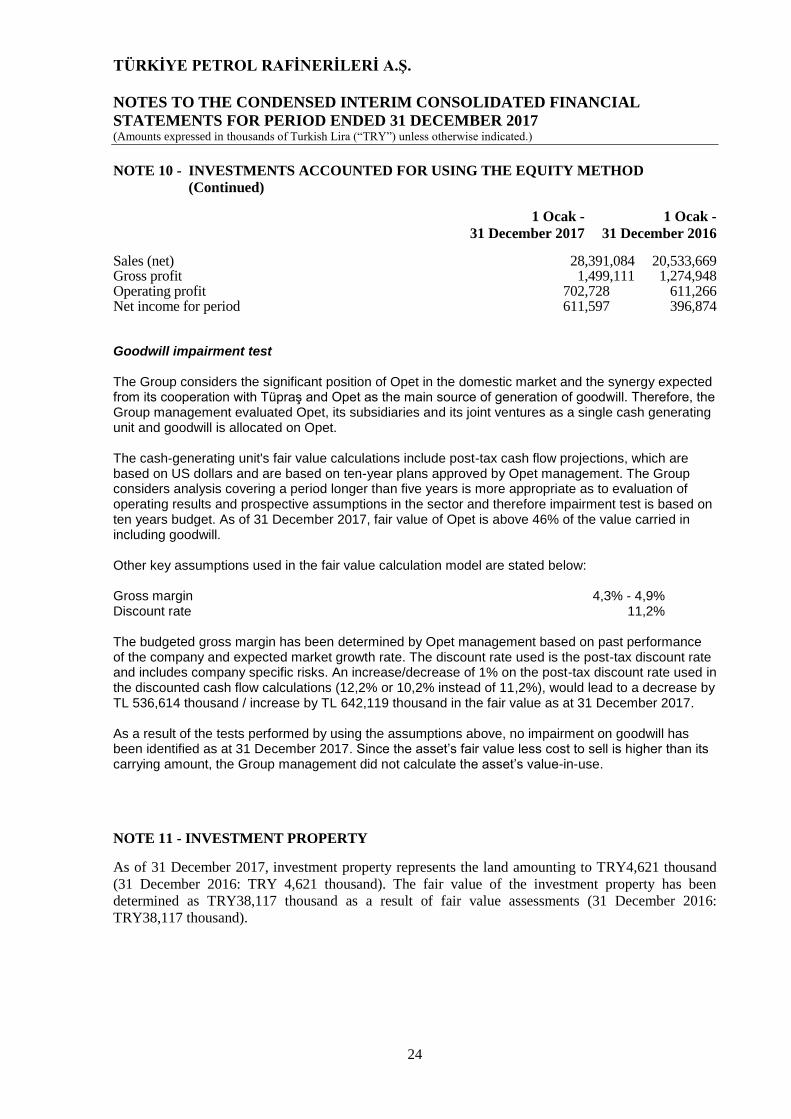
NOTE 10 - INVESTMENTS ACCOUNTED FOR USING THE EQUITY METHOD
(Continued)
1 Ocak - 1 Ocak -
31 December 2017 31 December 2016
Sales (net) 28,391,084 20,533,669 Gross profit 1,499,111 1,274,948 Operating profit 702,728 611,266 Net income for period 611,597 396,874
Goodwill impairment test The Group considers the significant position of Opet in the domestic market and the synergy expected from its cooperation with Tüpraş and Opet as the main source of generation of goodwill. Therefore, the Group management evaluated Opet, its subsidiaries and its joint ventures as a single cash generating unit and goodwill is allocated on Opet. The cash-generating unit's fair value calculations include post-tax cash flow projections, which are based on US dollars and are based on ten-year plans approved by Opet management. The Group considers analysis covering a period longer than five years is more appropriate as to evaluation of operating results and prospective assumptions in the sector and therefore impairment test is based on ten years budget. As of 31 December 2017, fair value of Opet is above 46% of the value carried in including goodwill. Other key assumptions used in the fair value calculation model are stated below: Gross margin 4,3% - 4,9% Discount rate 11,2% The budgeted gross margin has been determined by Opet management based on past performance of the company and expected market growth rate. The discount rate used is the post-tax discount rate and includes company specific risks. An increase/decrease of 1% on the post-tax discount rate used in the discounted cash flow calculations (12,2% or 10,2% instead of 11,2%), would lead to a decrease by TL 536,614 thousand / increase by TL 642,119 thousand in the fair value as at 31 December 2017. As a result of the tests performed by using the assumptions above, no impairment on goodwill has been identified as at 31 December 2017. Since the asset’s fair value less cost to sell is higher than its carrying amount, the Group management did not calculate the asset’s value-in-use.
NOTE 11 - INVESTMENT PROPERTY
As of 31 December 2017, investment property represents the land amounting to TRY4,621 thousand
(31 December 2016: TRY 4,621 thousand). The fair value of the investment property has been
determined as TRY38,117 thousand as a result of fair value assessments (31 December 2016:
TRY38,117 thousand).
TÜRKİYE PETROL RAFİNERİLERİ A.Ş.
NOTES TO THE CONDENSED INTERIM CONSOLIDATED FINANCIAL
STATEMENTS FOR PERIOD ENDED 31 DECEMBER 2017 (Amounts expressed in thousands of Turkish Lira (“TRY”) unless otherwise indicated.)
25
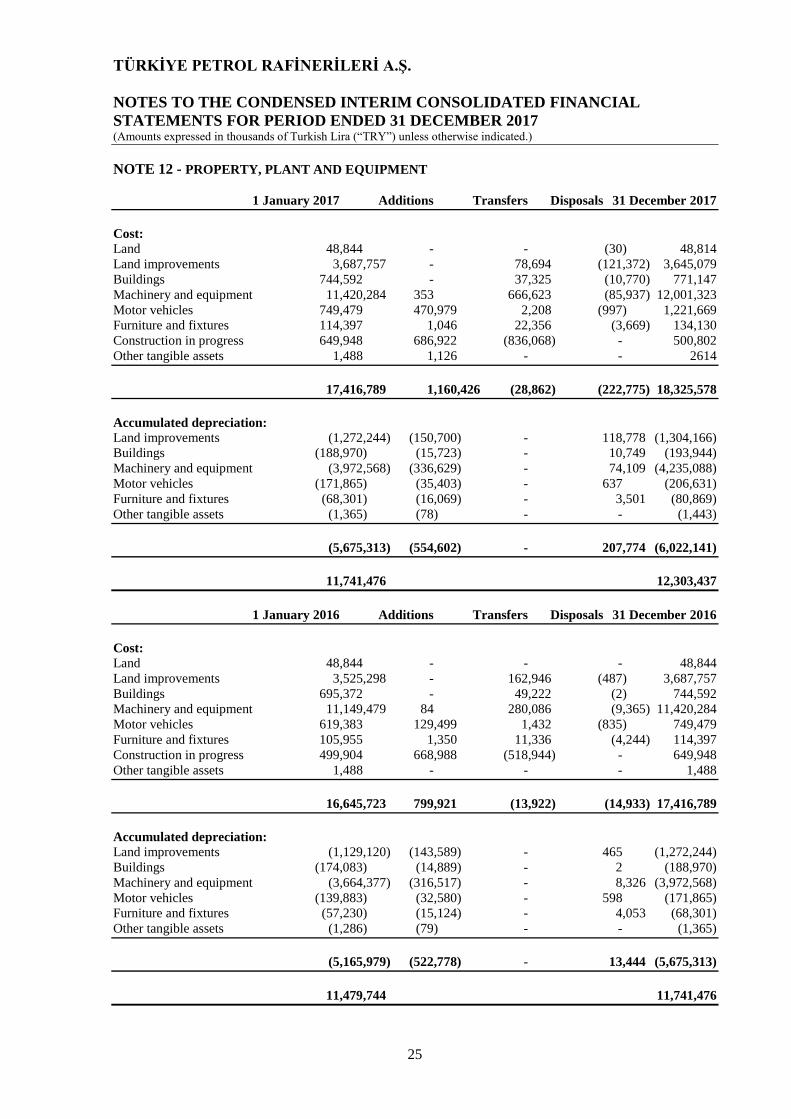
NOTE 12 - PROPERTY, PLANT AND EQUIPMENT
1 January 2017 Additions Transfers Disposals 31 December 2017
Cost:
Land 48,844 - - (30) 48,814
Land improvements 3,687,757 - 78,694 (121,372) 3,645,079
Buildings 744,592 - 37,325 (10,770) 771,147
Machinery and equipment 11,420,284 353 666,623 (85,937) 12,001,323
Motor vehicles 749,479 470,979 2,208 (997) 1,221,669
Furniture and fixtures 114,397 1,046 22,356 (3,669) 134,130
Construction in progress 649,948 686,922 (836,068) - 500,802
Other tangible assets 1,488 1,126 - - 2614
17,416,789 1,160,426 (28,862) (222,775) 18,325,578
Accumulated depreciation: Land improvements (1,272,244) (150,700) - 118,778 (1,304,166)
Buildings (188,970) (15,723) - 10,749 (193,944)
Machinery and equipment (3,972,568) (336,629) - 74,109 (4,235,088)
Motor vehicles (171,865) (35,403) - 637 (206,631)
Furniture and fixtures (68,301) (16,069) - 3,501 (80,869)
Other tangible assets (1,365) (78) - - (1,443)
(5,675,313) (554,602) - 207,774 (6,022,141)
11,741,476 12,303,437
1 January 2016 Additions Transfers Disposals 31 December 2016
Cost:
Land 48,844 - - - 48,844
Land improvements 3,525,298 - 162,946 (487) 3,687,757
Buildings 695,372 - 49,222 (2) 744,592
Machinery and equipment 11,149,479 84 280,086 (9,365) 11,420,284
Motor vehicles 619,383 129,499 1,432 (835) 749,479
Furniture and fixtures 105,955 1,350 11,336 (4,244) 114,397
Construction in progress 499,904 668,988 (518,944) - 649,948
Other tangible assets 1,488 - - - 1,488
16,645,723 799,921 (13,922) (14,933) 17,416,789
Accumulated depreciation: Land improvements (1,129,120) (143,589) - 465 (1,272,244)
Buildings (174,083) (14,889) - 2 (188,970)
Machinery and equipment (3,664,377) (316,517) - 8,326 (3,972,568)
Motor vehicles (139,883) (32,580) - 598 (171,865)
Furniture and fixtures (57,230) (15,124) - 4,053 (68,301)
Other tangible assets (1,286) (79) - - (1,365)
(5,165,979) (522,778) - 13,444 (5,675,313)
11,479,744 11,741,476

TÜRKİYE PETROL RAFİNERİLERİ A.Ş.
NOTES TO THE CONDENSED INTERIM CONSOLIDATED FINANCIAL
STATEMENTS FOR PERIOD ENDED 31 DECEMBER 2017 (Amounts expressed in thousands of Turkish Lira (“TRY”) unless otherwise indicated.)
26
NOTE 12 - PROPERTY, PLANT AND EQUIPMENT (Continued)
Total depreciation expense amounting to TRY554,602 thousand (31 December 2016: TRY522,778
thousand) in the consolidated statement of comprehensive income for the period ended
31 December 2017 has been allocated to cost of goods sold amounting to TRY527,359 thousand
(31 December 2016: TRY483,776 thousand), to marketing, sales and distribution expenses amounting
to TRY3 thousand (31 December 2016: TRY3 thousand), to general administration expenses amounting
to TRY27,240 thousand (31 December 2016 : TRY38,999 thousand).
NOTE 13 - INTANGIBLE ASSETS
Other intangible assets:
The movements of intangible assets and related accumulated amortisation for the period ended
31 December 2017 and 2016 is as follows:
1 January 2017 Additions Transfers Disposals 31 December 2017
Cost:
Rights and software 64,330 257 17,226 (349) 81,464
Development expenses 68,403 - 11,636 - 80,039
132,733 257 28,862 (349) 161,503
Accumulated amortisation:
Rights and software (36,449) (6,960) - 349 (43,060)
Development expenses (41,178) (12,078) - - (53,256)
(77,627) (19,038) - 349 (96,316)
55,106 65
,187
1 January 2016 Additions Transfers Disposals 31 December 2016
Cost:
Rights and software 57,087 - 7,500 (257) 64,330
Development expenses 61,981 - 6,422 - 68,403
119,068 - 13,922 (257) 132,733
Accumulated amortisation:
Rights and software (30,418) (6,288) - 257 (36,449)
Development expenses (29,241) (11,937) - - (41,178)
(59,659) (18,225) - 257 (77,627)
59,409 55,106
Total amortisation expenses amounting to TRY19,038 thousand (31 December 2016: TRY18,225
thousand) in the consolidated statement of comprehensive income for the period ended
31 December 2017 have been allocated to the cost of goods sold amounting to TRY8 thousand
(31 December 2016: TRY13 thousand), and to general administration expenses amounting to
TRY19,030 thousand (31 December 2016: TRY18,212 thousand).

TÜRKİYE PETROL RAFİNERİLERİ A.Ş.
NOTES TO THE CONDENSED INTERIM CONSOLIDATED FINANCIAL
STATEMENTS FOR PERIOD ENDED 31 DECEMBER 2017 (Amounts expressed in thousands of Turkish Lira (“TRY”) unless otherwise indicated.)
27
NOTE 14 - PREPAID EXPENSES Short term prepaid expenses:
31 December 2017 31 December 2016
Insurance and other expenses 49,102 41,680 Investment loan insurance expenses (*) - 27,811 Advances given 13,295 28,412
62,397 97,903
Long term prepaid expenses:
31 December 2017 31 December 2016
Advances given to third parties for property, plant and equipment 28,413 120,883 Prepaid investment loan insurance expenses (*) - 77,589 Advances given to related parties for property, plant and equipment (Note 31) 69,191 37,454 Prepaid other expenses 1,672 2,426
99,276 238,352
(*) The Company made the payment of the investment loans’ insurance expenses related with
Residuum Upgrading Project, when these loans were utilized. Related insurance payments will be expensed within the maturity of related loans.
NOTE 15 - OTHER ASSETS AND LIABILITIES Other current assets:
31 December 2017 31 December 2016
Deferred Value Added Tax (“VAT”) 423,200 357,063 Deferred Special Consumption Tax (“SCT”) 91,647 79,863 Spare parts and material stocks 57,566 69,591 Taxes and funds to be offsetted 85,251 44,302 Income accruals 37,675 19,348 Other current assets 56,920 3,263
752,259 573,430
Other non-current assets: Spare parts and materials 1,030,649 1,008,993 Other 1,146 1,120 Provision for spare parts and materials (19,156) (22,455)
1,012,639 987,658

TÜRKİYE PETROL RAFİNERİLERİ A.Ş.
NOTES TO THE CONDENSED INTERIM CONSOLIDATED FINANCIAL
STATEMENTS FOR PERIOD ENDED 31 DECEMBER 2017 (Amounts expressed in thousands of Turkish Lira (“TRY”) unless otherwise indicated.)
28
NOTE 15 - OTHER ASSETS AND LIABILITIES (Continued) Other non-current assets:
31 December 2017 31 December 2016
SCT payable 1,397,584 1,371,333 Revenue share 1,202,668 1,006,511 VAT payable 145,109 226,314 Deferred VAT 423,200 357,063 Deferred SCT 91,647 79,863 Other taxes and liabilities 53,741 43,475 Accrued expenses (*) 383,058 246,536 Other 26,367 11,827
3,723,374 3,342,922
(*) As of 31 December, 2017, expense accruals consists of commodity derivatives transactions for inventory of Tüpraş which are exposed to commodity price risk.(swap transactions and zero-cost transactions). Weighted average price of outstanding commodity derivatives transactions is USD 54.53/barrel (31 December 2016 – USD 47.47/barrel) for 5,700 thousand crude oil barrel (31 December 2016: 7,050 thousand barrels). Weighted average buying price of zero cost derivatives transactions is USD 50.60 /barrel for 5,700 thousand crude oil barrel inventory(31 December 2016: 6,950 thousand barrels), weighted average selling price of zero cost derivatives transactions is USD 55.78 /barrel (31 December 2016 - USD 53.56/barrel). The expense accruals recognition made as of 31 December 2017 is recognized under cost of goods sold and paid as of 8 January 2018 (31 December 2016: January 2017). Deferred VAT and SCT include VAT and SCT amounts related to export committed sales and are
classified within “Other current assets” under assets and within “Other current liabilities” under
liabilities. Such SCT and VAT amounts are offset when the export transaction is certified and the related
taxes are cancelled by the tax office.
According to the Petroleum Market Law, financing needs of refinery owners to maintain the National
Petroleum Stock are supplied by the revenue share, which is a surplus added to the sales price, limited
to a ceiling of USD 10/ton as determined by Energy Market Regulatory Authority (“EMRA”). In the
case of importation of petroleum products, the revenue share is to be paid to the refinery owner by the
importer.
The Group has been collecting the revenue share over the sales of petroleum products and non-refinery
imports of petroleum products since 1 January 2005, the date the relevant article of the regulation came
into force.
The Group has been collecting revenue share for LPG sales since 16 September 2005 in addition to the
revenue share collected for petroleum products, in accordance with the Liquefied Petroleum Gas
(“LPG”) Market Regulation.
It has been decided by the National Petroleum Reserves Commission that the investment management
of the revenue share collected will be conducted by the General Directorate of Tüpraş, and the collected
amount will be invested in overnight reverse repurchase agreements.

TÜRKİYE PETROL RAFİNERİLERİ A.Ş.
NOTES TO THE CONDENSED INTERIM CONSOLIDATED FINANCIAL
STATEMENTS FOR PERIOD ENDED 31 DECEMBER 2017 (Amounts expressed in thousands of Turkish Lira (“TRY”) unless otherwise indicated.)
29
NOTE 15 - OTHER ASSETS AND LIABILITIES (Continued)
As a result of these regulations, the revenue share amounting to TRY1,202,668 thousand accumulated as at
31 December 2017 (31 December 2016: TRY1,006,511 thousand) which is not recognized in the
comprehensive income statement, has been classified as “Revenue Share” within “Other short-term
liabilities”. TRY1,198,211 thousand that is (31 December 2016: TRY1,002,012 thousand) blocked in banks
as demand deposits related to the calculated revenue share has been classified as Revenue share “Blocked”
within “Cash and cash equivalents” (Note 4).
Other long-term liabilities:
31 December 2017 31 December 2016
Participation share 1,169 1,389
1,169 1,389
NOTE 16 - DEFERRED INCOME
Short-term deferred income
31 December 2017 31 December 2016
Advances taken 18,479 13,591 Deferred income 1,949 1,826
20,428 15,417
Long-term deferred income
31 December 2017 31 December 2016
Deferred income 4,112 3,992
4,112 3,992
NOTE 17 - PROVISIONS
Provision for employee benefits:
Short term provision for employee benefits:
31 December 2017 31 December 2016
Seniority incentive bonus provision 8,024 9,073 Personnel bonus accruals 4,605 4,498
12,629 13,571

TÜRKİYE PETROL RAFİNERİLERİ A.Ş.
NOTES TO THE CONDENSED INTERIM CONSOLIDATED FINANCIAL
STATEMENTS FOR PERIOD ENDED 31 DECEMBER 2017 (Amounts expressed in thousands of Turkish Lira (“TRY”) unless otherwise indicated.)
30

TÜRKİYE PETROL RAFİNERİLERİ A.Ş.
NOTES TO THE CONDENSED INTERIM CONSOLIDATED FINANCIAL
STATEMENTS FOR PERIOD ENDED 31 DECEMBER 2017 (Amounts expressed in thousands of Turkish Lira (“TRY”) unless otherwise indicated.)
31
NOTE 17 - PROVISIONS (Continued)
Long term employee benefits:
31 December 2017 31 December 2016
Provision for employment termination benefits 167,907 159,190 Provision for unused vacation 50,655 44,137 Seniority incentive bonus provision 5,172 4,088
223,734 207,415
Seniority incentive bonus provision:
The Group has an employee benefit plan called “Seniority Incentive Bonus”, which is paid to the
employees with a certain level of seniority.
Seniority incentive bonus is paid to personnel together with their monthly salary when certain seniority
levels are reached. The bonus amounts to 45 days of salary for 5 years of seniority level, 55 days of
salary for 10 years of seniority level, 70 days of salary for 15 years of seniority level, 80 days of salary
for 20 years of seniority level, 90 days of salary for 25 years of seniority level and 100 days of salary
for 30 years of seniority level, paid once for each seniority level.
The movements in the provision for seniority incentive bonus during the period are as follows:
2017 2016
1 January 13,161 12,847 Charge for the period 11,399 7,185 Payments during the period (11,364) (6,871)
31 December 13,196 13,161
Provision for employment termination benefits: Under the Labour Law, the Group is required to pay termination benefits to each employee who has completed one year of service and whose employment is terminated without due cause, is called up for military service, dies or who retires after completing 25 years of service (20 years for women) and achieves the retirement age (58 for women and 60 for men). Since the legislation was changed on 23 May 2002, there are certain transitional provisions relating to length of service prior to retirement. The liability is not funded, as there is no funding requirement. The provision has been calculated by estimating the present value of the future probable obligation of the Company arising from the retirement of the employees. .

TÜRKİYE PETROL RAFİNERİLERİ A.Ş.
NOTES TO THE CONDENSED INTERIM CONSOLIDATED FINANCIAL
STATEMENTS FOR PERIOD ENDED 31 DECEMBER 2017 (Amounts expressed in thousands of Turkish Lira (“TRY”) unless otherwise indicated.)
32
NOTE 17 - PROVISIONS (Continued)
TAS 19 requires that actuarial valuation methods to be developed to estimate the Group’s employment termination benefit provision. The following actuarial assumptions have been used in the calculation of the total provision:
31 December 2017 31 December 2016
Discount rate (%) %4.95 %4.50 Turnover rate to estimate probability of retirement (%) %99.46 %99.51
The principal assumption is that maximum liability of employment termination benefits for each year of service will increase in line with inflation. Thus, the discount rate applied represents the expected real rate after adjusting for the anticipated effects of future inflation. As the maximum liability is revised semi-annually, the maximum amount of TRY5,001.76which is effective as at 1 January 2017, has been taken into consideration in calculating the provision for employment termination benefits of the joint ventures of the Group, which are registered In Turkey (31 December 2016: TRY4,297.21). The movement in the provision for employment termination benefits during the period is as follows:
2017 2016
1 January 159,190 144,547 Interest expense 18,737 14,961 Actuarial (gain)/losses (4,942) 4,249 Increase during the period 20,796 18,922 Payments during the period (25,874) (23,489)
31 December 167,907 159,190
31 December 2017 31 December 2016 100 Base 100 Base 100 Base 100 Base Sensitivity Level Increase Decrease Increase Decrease
Rate 5.95% 3.95% 5.50% 3.50% Provision for employee termination benefit adjusment 10,590 (12,728) 8,245 (10,013)
Provision for unused vacation:
The movement in the provision for unused vacation during the period is as follows:
2017 2016
1 January 44,137 41,904 Increase during the period 12,938 7,785 Payments during the period (6,420) (5,552)
31 December 50,655 44,137

TÜRKİYE PETROL RAFİNERİLERİ A.Ş.
NOTES TO THE CONDENSED INTERIM CONSOLIDATED FINANCIAL
STATEMENTS FOR PERIOD ENDED 31 DECEMBER 2017 (Amounts expressed in thousands of Turkish Lira (“TRY”) unless otherwise indicated.)
33
NOTE 17 - PROVISIONS (Continued)
Other short term provisions:
31 December 2017 31 December 2016
Provisions for pending claims and law suits 16,209 12,523 EMRA participation share 23,823 20,159 Provision for demurrage 11,484 13,787 Other 25,779 5,016
77,295 51,485
Movement of the short-term provisions for the period ended 31 December 2017 and 2016 are as follow:
Provision for EMRA
pending claims participation Provision for
and lawsuits share demurrage Other Total
1 January 2017 12,523 20,159 13,787 5,016 51,485
Charges for the period, net 4,045 23,823 (2,303) 20,763 46,328
Payments during the period (359) (20,159) - - (20,518)
31 December 2017 16,209 23,823 11,484 25,779 77,295
1 January 2016 13,405 17,883 11,032 20,332 62,652
Charges for the period, net (882) 22,148 2,755 (15,316) 8,705
Payments during the period - (19,872) - - (19,872)
31 December 2016 12,523 20,159 13,787 5,016 51,485
EMRA participation share is the participation fee that is paid by the refinery license owners in accordance
with the Petroleum Market License Regulation, calculated by multiplying net sales with the participation
share rate determined by EMRA.
NOTE 18 - LIABILITIES FOR EMPLOYEE BENEFITS
31 December 2017 31 December 2016
Due to the personnel 80,315 59,016 Social security withholdings payment 39,518 33,426
119,833 92,442
NOTE 19 - OTHER PAYABLES
Deposits and guarantees received 13,334 9,407 Other payables to related parties (Note 31) 23,463 18,546
36,797 27,953
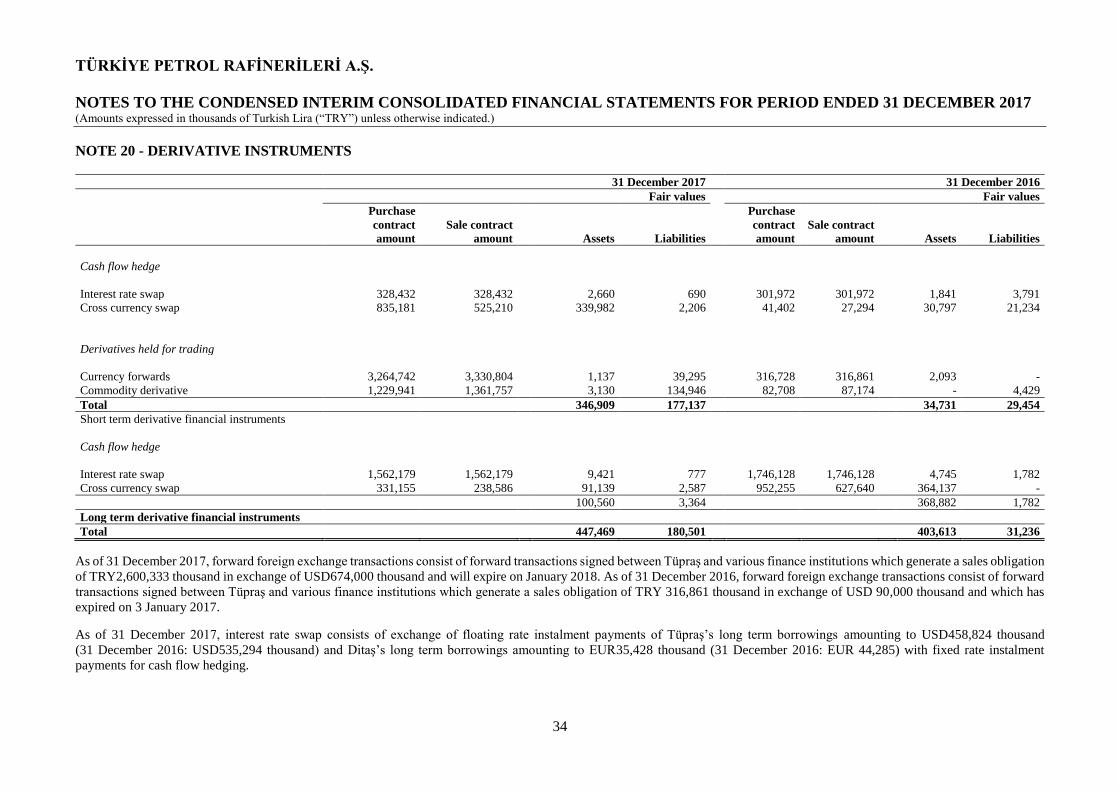
TÜRKİYE PETROL RAFİNERİLERİ A.Ş.
NOTES TO THE CONDENSED INTERIM CONSOLIDATED FINANCIAL STATEMENTS FOR PERIOD ENDED 31 DECEMBER 2017 (Amounts expressed in thousands of Turkish Lira (“TRY”) unless otherwise indicated.)
34
NOTE 20 - DERIVATIVE INSTRUMENTS
31 December 2017 31 December 2016
Fair values Fair values
Purchase
contract
amount
Sale contract
amount Assets Liabilities
Purchase
contract
amount
Sale contract
amount Assets Liabilities
Cash flow hedge
Interest rate swap 328,432 328,432 2,660 690 301,972 301,972 1,841 3,791
Cross currency swap 835,181 525,210 339,982 2,206 41,402 27,294 30,797 21,234
Derivatives held for trading
Currency forwards 3,264,742 3,330,804 1,137 39,295 316,728 316,861 2,093 -
Commodity derivative 1,229,941 1,361,757 3,130 134,946 82,708 87,174 - 4,429
Total 346,909 177,137 34,731 29,454
Short term derivative financial instruments
Cash flow hedge
Interest rate swap 1,562,179 1,562,179 9,421 777 1,746,128 1,746,128 4,745 1,782
Cross currency swap 331,155 238,586 91,139 2,587 952,255 627,640 364,137 - 100,560 3,364 368,882 1,782
Long term derivative financial instruments
Total 447,469 180,501 403,613 31,236
As of 31 December 2017, forward foreign exchange transactions consist of forward transactions signed between Tüpraş and various finance institutions which generate a sales obligation
of TRY2,600,333 thousand in exchange of USD674,000 thousand and will expire on January 2018. As of 31 December 2016, forward foreign exchange transactions consist of forward
transactions signed between Tüpraş and various finance institutions which generate a sales obligation of TRY 316,861 thousand in exchange of USD 90,000 thousand and which has
expired on 3 January 2017.
As of 31 December 2017, interest rate swap consists of exchange of floating rate instalment payments of Tüpraş’s long term borrowings amounting to USD458,824 thousand
(31 December 2016: USD535,294 thousand) and Ditaş’s long term borrowings amounting to EUR35,428 thousand (31 December 2016: EUR 44,285) with fixed rate instalment
payments for cash flow hedging.

TÜRKİYE PETROL RAFİNERİLERİ A.Ş.
NOTES TO THE CONDENSED INTERIM CONSOLIDATED FINANCIAL
STATEMENTS FOR PERIOD ENDED 31 DECEMBER 2017 (Amounts expressed in thousands of Turkish Lira (“TRY”) unless otherwise indicated.)
35
NOTE 20 - DERIVATIVE INSTRUMENTS (Continued)
As of 31 December 2017, cross currency swap transactions consist of swap transaction of foreign
currency indexed, fixed interest rate long-term bonds amounting to USD200,000 thousand belonging to
Tüpraş with TRY currency indexed, fixed interest payments amounting to TRY463,875 thousand (31
December 2016: USD200,000 thousand), swap transaction of long-term borrowings with floating
interest rate amounting to USD70,588 thousand (31 December 2016 USD82,353 thousand) belonging
to Tüpraş with payments of fixed interest rate amounting to TRY163,765 thousand, swap transactions
of foreign currency indexed long term borrowings belonging to Ditaş amounting to EUR17,714
thousand with TRY currency indexed, fixed interest payments amounting to TRY65,717 thousand and
swap transaction of TRY65,717 thousand fixed interest payments with total of USD18,674 thousand
with foreign currency indexed fixed interest payments (31 December 2016: None)
Commodity purchase and sales transactions consist of product crack fixing transactions, swap
transactions and zero cost collar transactions as of 31 December 2017. Product crack fixing transactions
have been made for gasoline stocks of 1,635 thousand barrels, jet stocks of 10,395 thousand barrel and
13,572 thousand barrel and weighted average fixation margin of these transactions are USD10,995,
11,095 and 11,728 per barrel, respectively. Swap transactions have been made for 1,029 thousand barrels
of crude oil and weighted average fixation margin of these transactions in USD is 54.13 per barrel. Zero
cost collar transaction is made for total of 1,050 thousand barrels of crude oil where weighted average
purchase price is 48,7 USD/barrel and weighted average sales price is 55.25 USD/barrel. Commodity
purchase and sales transactions consist of product crack fixing transactions as of 31 December 2016.
Commodity crack fixing transactions have been made for 1,500 thousand barrels of gasoline stocks and
900 thousand barrels of jet stocks with weighted average fixation margin of 10,704 and 9,683 USD per
barrel, respectively.
NOTE 21 - GOVERNMENT GRANTS
On 2 August 2010, the Company has obtained the Certificate of Research and Development Center. As
a result of the implementation of Technology and Innovation Support Programs Administration Project
(“TEYDEB”) and the existence of the Certificate of Research and Development Center, the Company
has benefited from a number of government incentives including research and development expense
deduction, income tax stoppage incentive, social security premium support and stamp tax exemption in
accordance with Law, no 5746, Supporting Research and Development Activities. . In this context, as
of 31 December 2017, the Company's total R & D expenditures amounting to TRY7,152 thousand (31
December 2016: TRY8,085 thousand) were recorded as incentive income.
In the first quarter of 2011, within the scope of the decree of the Council of Ministers dated 14 July 2009
and numbered 2009/15199, the Company was granted a Large-Scaled Investment Incentive Certificate
for Residuum Upgrading Project (RUP). Investment expenditures made within the scope of this
certificate are subject to 30% contribution from the govenment, where the contribution is provided as a
reduction in corporate tax payable by 50%. As of 7 October 2013, Residuum Upgrading Project was
granted Strategic Investment Incentive by Incentive Implementation and Foreign Investment
Department of Ministry of Economy of Republic of Turkey which became applicable after 19 October
2012. Expenditures made within the scope of Strategic Investment Incentive Certificate are subject to
50% contribution from the government, where the contribution is provided as a reduction in corporate
tax payable by 90%.

TÜRKİYE PETROL RAFİNERİLERİ A.Ş.
NOTES TO THE CONDENSED INTERIM CONSOLIDATED FINANCIAL
STATEMENTS FOR PERIOD ENDED 31 DECEMBER 2017 (Amounts expressed in thousands of Turkish Lira (“TRY”) unless otherwise indicated.)
36
NOTE 21 - GOVERNMENT GRANTS (Continued)
On May 29, 2012, the Company received investment incentive from Incentive Implementation and Foreign Investment Department of Ministry of Economy of Republic of Turkey for storage and warehouse services of Kırıkkale Refinery project. Support elements of this investment is to benefit from are, VAT exemption and customs tax exemption. The Company received investment incentive on July 24, 2015 from Incentive Implementation and Foreign Investment Department of Ministry of Economy of Republic of Turkey for Modernization of Izmir Refinery Project. Support elements of this investment is to benefit from are, VAT exemption, tax discount rate (50%), rate of contribution to investment (15%) and customs tax exemption.
The Company received investment incentive on October 27, 2015 from Incentive Implementation and Foreign Investment Department of Ministry of Economy of Republic of Turkey for Modernization of Kırıkkale Refinery Project. Support elements of this investment is to benefit from are, VAT exemption, tax discount rate (70%), rate of contribution to investment (30%), customs tax exemption and interest incentive.
On June 13, 2014, the Company received investment incentive from Incentive Implementation and Foreign Investment Department of Ministry of Economy of Republic of Turkey for Modernization of Batman Refinery project. Support elements of this investment is to benefit from are, VAT exemption, tax discount rate (90%), rate of contribution to investment (50%), interest incentive and customs tax exemption.
On December 14, 2016, the Company received investment incentive from Incentive Implementation and Foreign Investment Department of Ministry of Economy of Republic of Turkey for Modernization of Izmir Refinery project. Support elements of this investment is to benefit from are, VAT exemption, tax discount rate (50%), rate of contribution to investment (15%) and customs tax exemption. On June 26, 2013, the Company received investment incentive from Incentive Implementation and Foreign Investment Department of Ministry of Economy of Republic of Turkey for the purchase of wagons to be used for intercity freight transport by railway. Support elements of this investment is to benefit from are, VAT exemption, interest incentive, customs tax exemption, tax discount rate (80%), rate of contribution to investment (40%), insurance premium employer support (7 years).
As of 31 December 2017 and 2016, the revenues (totally recognized in consolidated statements of profit
or loss) of the Group from government incentives and grants are as follows:
31 December 2017 31 December 2016
Social security withholdings incentives 37,609 30,527 Research and development incentives 7,152 8,085 Interest incentive 288 8,100
45,049 46,712

TÜRKİYE PETROL RAFİNERİLERİ A.Ş.
NOTES TO THE CONDENSED INTERIM CONSOLIDATED FINANCIAL
STATEMENTS FOR PERIOD ENDED 31 DECEMBER 2017 (Amounts expressed in thousands of Turkish Lira (“TRY”) unless otherwise indicated.)
37
NOTE 22 - COMMITMENTS AND CONTINGENT ASSETS AND LIABILITIES 31 December 2017 31 December 2016
Guarantees received:
Original
Currency: TRY Amount: Original
Currency: TRY Amount:
Letter of guarantees received
1,143,144 1,679,662
-Letter of guarantees in TRY
744,646 744,646 1,003,107 1,003,107 - Letter of guarantees in USD
80,221 302,585 160,721 565,608
- Letter of guarantees in EUR
20,368 91,973 27,113 100,585
- Letter of guarantees in other currencies
- 3,940 - 10,362 Guarantee notes received
2,205 14,485
- Guarantee notes in TRY
2,205 2,205 14,485 14,485
Guarantee letters received
238,595. 225,960 - Guarantee letters received in TRY
50,000 50,000 50,000 50,000
- Guarantee letters received in USD
50,000 188,595 50,000 175,960
Direct debiting limits
266,748 20,000 - TRY direct debiting limits
266,748 266,748 20,000 20,000
Total guarantees received 1,652,692 1,940,107
Guarantees given:
Letter of credits given
313,153 672,163
- Letter of credits in USD
78,125 294,530 184,253 648,422
- Letter of credits in EUR
4,165 18,263 3,921 14,545 - Letter of credits in other currencies
- 360 - 9,196
Letter of guarantees given
757,673 796,468
- Letter of guarantees in TRY
681,480 681,480 607,798 607,798 - Letter of guarantees in USD
20,200 76,193 53,612 188,670
Letters of guarantee
given to customs offices
1,644,077 1,000,185
- Letter of guarantees in TRY
1,635,046 1,635,046 955,666 955,666
- Letter of guarantees in EUR
2,000 9,031 12,000 44,519 Letters of guarantee given to banks
667,986 338,033
- Letter of guarantees in USD
119,120 449,309 47,577 167,433
- Letter of guarantees in EUR
48,428 218,677 45,985 170,600
Total guarantees given 3,383,589 2,806,849
As at 31 December 2017 and 31 December 2016, letter of guarantees received are composed of guarantees from customers and suppliers. Guarantees given are mainly composed of guarantees given to government entities and customs offices. As at 30 June 2017, letters of guarantee given to banks are given for loans which were used by Companies within scope of consolidation amounting to TRY626,443 thousand (31 December 2016: TRY331,726 thousand) and for derivative financial instruments amounting to TRY41,543 thousand (31 December 2016: TRY 6,307 thousand).

TÜRKİYE PETROL RAFİNERİLERİ A.Ş.
NOTES TO THE CONDENSED INTERIM CONSOLIDATED FINANCIAL
STATEMENTS FOR PERIOD ENDED 31 DECEMBER 2017 (Amounts expressed in thousands of Turkish Lira (“TRY”) unless otherwise indicated.)
38
NOTE 22 - COMMITMENTS AND CONTINGENT ASSETS AND LIABILITIES
Collaterals, pledges, mortgages given by the Group as at 31 December 2017 and 31 December 2016 are
as follows: 31 December 2017 31 December 2016
A. CPMs given for companies in the name of its own legal personality 2,714,903 2,468,816
- TRY 2,316,526 1,563,464
- USD 370,723 837,092
- EUR 27,294 59,064
- Other 360 9,196
B. CPMs given on behalf of the fully
consolidated companies 667,986 338,033
- USD 449,309 167,433
- EUR 218,677 170,600
C. CPMs given for continuation of
its economic
activities on behalf of third parties - -
D. Total amount of other CPMs - -
i) Total amount of CPMs given on behalf of the majority shareholder - -
ii) Total amount of CPMs given to on behalf of other Group
companies which are not in scope of B and C. - -
iii) Total amount of CPMs given on behalf of
third parties which are not in scope of C. - -
Total 3,382,889 2,806,849
NOTE 23 - EQUITY
The Company’s shareholders and their shareholding percentages as at 31 December 2017 and
31 December 2016 are as follows:
31 December 2017 Share (%) 31 December 2016 Share (%)
Enerji Yatırımları A.Ş 127,714 51 127,714 51
Publicly owned 122,705 49 122,705 49
Total 250,419 100 250,419 100
Adjustment to share capital 1,344,243 1,344,243
Total paid-in capital 1,594,662 1,594,662
Adjustment to share capital represents the restatement effect of cash and cash equivalent contributions
to share capital measured in accordance with the Turkish Financial Reporting Standards.
Registered capital of the Company is TRY500,000 thousand and is divided into 50,000,000,000 shares
with a registered nominal value of 1 Kuruş (“Kr”) (31 December 2016: Kr1) each. The authorised and
paid-in share capital of the Company comprises 25,041,919,999 Group A shares with a registered
nominal value of Kr1 and one Group C share with privileges belonging to the Privatisation
Administration.

TÜRKİYE PETROL RAFİNERİLERİ A.Ş.
NOTES TO THE CONDENSED INTERIM CONSOLIDATED FINANCIAL
STATEMENTS FOR PERIOD ENDED 31 DECEMBER 2017 (Amounts expressed in thousands of Turkish Lira (“TRY”) unless otherwise indicated.)
39
NOTE 23 - EQUITY (Continued)
As per the articles of association of the Company, one member of the Board of Directors should be nominated by
the Group C shareholders. Board of Directors’ decisions on the supply needs of petroleum products of the Turkish
military forces requires the consent of the member representing the Group C shareholders.
Retained earnings, as per the statutory financial statements other than legal reserves, are available for distribution,
subject to the legal reserve requirement referred to below.
Restricted reserves
The legal reserves consist of first and second reserves, appropriated in accordance with the Turkish Commercial Code
(“TCC”). The TCC stipulates that the first legal reserve is appropriated out of statutory profits at the rate of 5% per
annum until the total reserve reaches 20% of the Company’s paid-in share capital. The second legal reserve is
appropriated at the rate of 10% per annum of all cash distributions in excess of 5% of the paid-in share capital. Under
the TCC, the legal reserves can only be used to offset loss and are not available for any other usage unless the reserve
exceeds 50% of paid-in share capital.
In accordance with Turkish Financial Reporting Standards the aforementioned amounts should be classified under
“Restricted Reserves”. At 31 December 2017, the restricted reserves of the Company amount to TRY279,668
thousand (31 December 2016: TRY331,337 thousand).
Dividend distribution
Listed companies distribute dividend in accordance with the Communiqué No. II-19.1 issued by the CMB which
is effective from 1 February 2014.
Companies distribute dividends in accordance with their dividend payment policies settled and dividend payment
decision taken in general assembly and also in conformity with relevant legislations. The communiqué does not
constitute a minimum dividend rate. Companies distribute dividend in accordance with the method defined in their
dividend policy or articles of incorporation. In addition, dividend can be distributed by fixed or variable
installments and advance dividend can be paid in accordance with profit on interim financial statements of the
Company.
In accordance with the Turkish Commercial Code (TCC), unless the required reserves and the dividend for
shareholders as determined in the article of association or in the dividend distribution policy of the company are
set aside, no decision may be made to set aside other reserves, to transfer profits to the subsequent year or to
distribute dividends to the holders of usufruct right certificates, to the members of the board of directors or to the
employees; and no dividend can be distributed to these persons unless the determined dividend for shareholders is
paid in cash.
The total amount of net income of the Company in the statutory records and other equity accounts subject to dividend
distribution amount to TRY5,591,315 thousand as at 31 December 2017. This amount includes inflation adjustment
differences of the equity accounts amounting to TRY1,698,998 thousand and other reserves amounting to TRY12,932
thousand which are subject to corporate taxation when distributed as dividends.
In the period ended as of 31 December 2017, the Company committed to make dividend payment in cash
amounting to TRY1,557,107 thousand which is the total amount remained after first and second composition legal
reserves deducted from 2016 distributable net profit of the period and a portion of second composition legal
reserves. The Company paid a cash dividend at the rate of 621.8% which corresponds to TRY6,218 gross and
TRY6,218 net cash dividend for the shares with a nominal value of TRY1.00 to institutional shareholders who are
full taxpayers or limited liable taxpayers and obtain dividends through a business or permanent representative in
Turkey. The Company paid also a cash dividend at the rate of 621.8%, which corresponds to TRY6,218 gross and
TRY5,2853 net cash dividend for the shares with a nominal value of TRY1.00 to other shareholders.
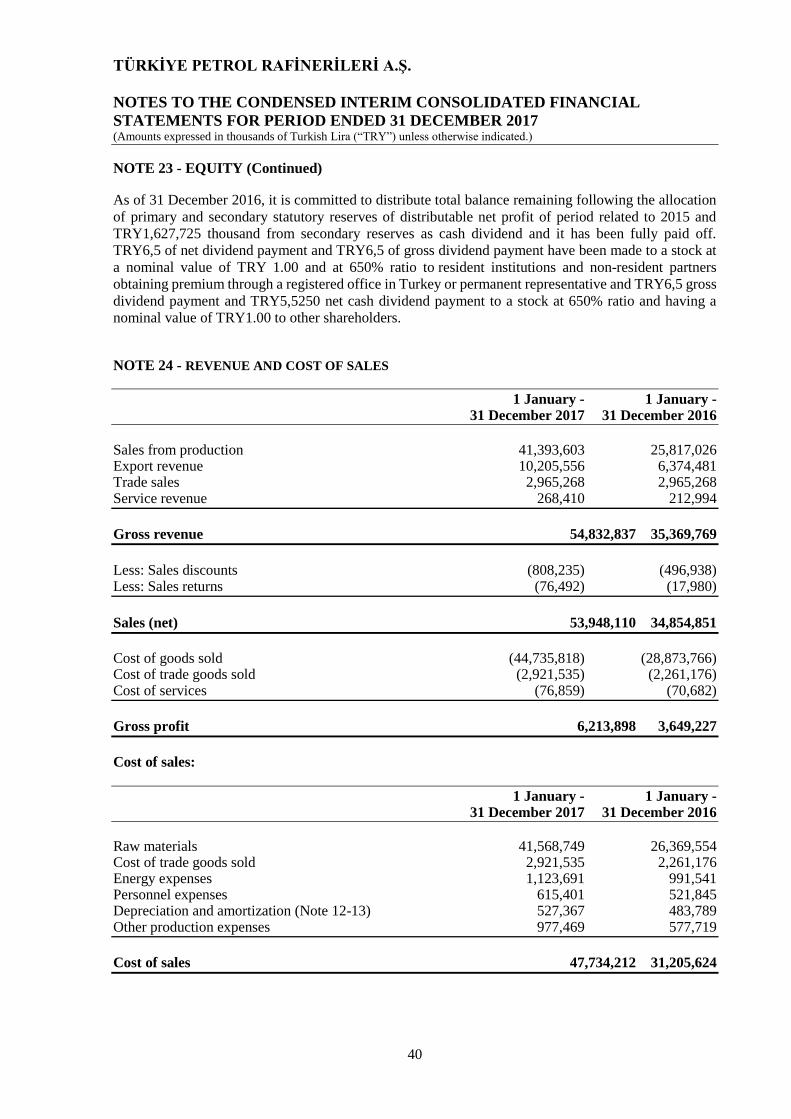
TÜRKİYE PETROL RAFİNERİLERİ A.Ş.
NOTES TO THE CONDENSED INTERIM CONSOLIDATED FINANCIAL
STATEMENTS FOR PERIOD ENDED 31 DECEMBER 2017 (Amounts expressed in thousands of Turkish Lira (“TRY”) unless otherwise indicated.)
40
NOTE 23 - EQUITY (Continued)
As of 31 December 2016, it is committed to distribute total balance remaining following the allocation
of primary and secondary statutory reserves of distributable net profit of period related to 2015 and
TRY1,627,725 thousand from secondary reserves as cash dividend and it has been fully paid off.
TRY6,5 of net dividend payment and TRY6,5 of gross dividend payment have been made to a stock at
a nominal value of TRY 1.00 and at 650% ratio to resident institutions and non-resident partners
obtaining premium through a registered office in Turkey or permanent representative and TRY6,5 gross
dividend payment and TRY5,5250 net cash dividend payment to a stock at 650% ratio and having a
nominal value of TRY1.00 to other shareholders.
NOTE 24 - REVENUE AND COST OF SALES
1 January - 1 January - 31 December 2017 31 December 2016
Sales from production 41,393,603 25,817,026 Export revenue 10,205,556 6,374,481 Trade sales 2,965,268 2,965,268 Service revenue 268,410 212,994
Gross revenue 54,832,837 35,369,769
Less: Sales discounts (808,235) (496,938) Less: Sales returns (76,492) (17,980)
Sales (net) 53,948,110 34,854,851
Cost of goods sold (44,735,818) (28,873,766) Cost of trade goods sold (2,921,535) (2,261,176) Cost of services (76,859) (70,682)
Gross profit 6,213,898 3,649,227
Cost of sales:
1 January - 1 January - 31 December 2017 31 December 2016
Raw materials 41,568,749 26,369,554 Cost of trade goods sold 2,921,535 2,261,176 Energy expenses 1,123,691 991,541 Personnel expenses 615,401 521,845 Depreciation and amortization (Note 12-13) 527,367 483,789 Other production expenses 977,469 577,719
Cost of sales 47,734,212 31,205,624

TÜRKİYE PETROL RAFİNERİLERİ A.Ş.
NOTES TO THE CONDENSED INTERIM CONSOLIDATED FINANCIAL
STATEMENTS FOR PERIOD ENDED 31 DECEMBER 2017 (Amounts expressed in thousands of Turkish Lira (“TRY”) unless otherwise indicated.)
41
NOTE 25 - GENERAL ADMINISTRATIVE EXPENSES, MARKETING AND SELLING EXPENSES AND RESEARCH AND DEVELOPMENT EXPENSES General administrative expenses:
1 January - 1 January - 31 December 2017 31 December 2016 Personnel expenses 334,889 294,988 Insurance expenses 84,848 79,203 Outsourced services 87,161 83,951 Taxes and duties 98,274 82,985 Depreciation and amortization (Note 12-13) 46,270 57,211 Office expenses 38,104 35,230 Subscription fees 26,950 22,958 Lawsuit and consultancy expenses 34,861 23,353 Rent expenses 15,638 7,835 Donation 27,410 20,321 Transportation and travel expenses 4,444 2,702 Other 66,552 37,543
Total general administrative expenses 865,401 748,280
Marketing, selling and distribution expenses:
Personnel expenses 97,041 78,815 Outsourced services 64,695 51,675 Carriage, storage and insurance expenses 42,671 43,414 Rent expenses 11,560 11,897 Energy expenses 11,454 8,157 Advertising expenses 3,220 3,441 Depreciation and amortization (Note 12-13) 3 3 Other 38,245 24,200
Total marketing expenses 268,889 221,602
Research and development expenses:
Personnel expenses 9,789 19,267 Lawsuit and consultancy expenses 1,036 1,340 Outsourced services 580 140 Other 4,545 4,818
Total research and development expenses 15,950 25,565

TÜRKİYE PETROL RAFİNERİLERİ A.Ş.
NOTES TO THE CONDENSED INTERIM CONSOLIDATED FINANCIAL
STATEMENTS FOR PERIOD ENDED 31 DECEMBER 2017 (Amounts expressed in thousands of Turkish Lira (“TRY”) unless otherwise indicated.)
42
NOTE 26 - OTHER OPERATING INCOME/(EXPENSES)
1 January - 1 January - Other operating income: 31 December 2017 31 December 2016
Credit finance gains 228,525 123,632 Rent expenses 4,101 3,497 Foreign exchange gain from trade receivables - 9,147 Transportation and travel expenses - 16,209 Other 28,635 32,266
Total other operating income 261,261 184,751
1 January - 1 January - Other operating expense: 31 December 2017 31 December 2016
Credit finance loss (90,859) (13,398) Foreign exchange loss from trade payables (340,898) (458,668) Foreign exchange loss from trade receivables (2,727) - Other (32,976) (9,176)
Total other operating expense (467,460) (481,242)
NOTE 27 - INCOME/(EXPENSE) FROM INVESTMENT ACTIVITIES
1 January - 1 January - Other operating expense: 31 December 2017 31 December 2016
Gain/(loss) on sales of property plant and equipment and intangible assets (10,199) 161
Total income/(expense) from investment activities (10,199) 161

TÜRKİYE PETROL RAFİNERİLERİ A.Ş.
NOTES TO THE CONDENSED INTERIM CONSOLIDATED FINANCIAL
STATEMENTS FOR PERIOD ENDED 31 DECEMBER 2017 (Amounts expressed in thousands of Turkish Lira (“TRY”) unless otherwise indicated.)
43
NOTE 28 - FINANCIAL INCOME/(EXPENSES) 1 January - 1 January - 31 December 2017 31 December 2016 Financial income: Interest income on deposits 541,226 319,513 Foreign exchange gains on deposits 461,105 709,477 Foreign exchange gains on derivative instruments 160,468 315,312
Total financial income 1,162,799 1,344,302
Financial expense: Interest expenses (701,421) (702,205) Foreign exchange losses on borrowings (1,033,591) (1,148,940) Foreign exchange losses on derivative instruments (41,820) (59,267) Other (3,828) (6,068)
Total financial expense (1,780,660) (1,916,480)
NOTE 29 - TAX ASSETS AND LIABILITIES
i) Corporation tax:
31 December 2017 31 December 2016 Current period corporate tax provision 464,902 141,217 Current year tax assets (443,606) (95,928)
Current tax provision 21,296 45,289
Turkish tax legislation does not permit a parent company, its subsidiaries and its joint ventures to file a consolidated
tax return. Therefore, provisions for taxes, as reflected in these consolidated financial statements, have been
calculated on an individual-entity basis.
The corporation tax rate for the fiscal year 2017 is 20% (2016: 20%). Corporation tax is payable at a rate of 20%
on the total income of the companies after adjusting for certain disallowable expenses, corporate income tax
exemptions (participation exemption, investment allowance, etc.) and allowances (as research and development
expenditures deduction).

TÜRKİYE PETROL RAFİNERİLERİ A.Ş.
NOTES TO THE CONDENSED INTERIM CONSOLIDATED FINANCIAL
STATEMENTS FOR PERIOD ENDED 31 DECEMBER 2017 (Amounts expressed in thousands of Turkish Lira (“TRY”) unless otherwise indicated.)
44
NOTE 29 - TAX ASSETS AND LIABILITIES (Continued)
Reconciliation of the income before tax with the calculated corporate tax is as follows:
2017 2016 Profit before taxation 4,474,038 1,944,022 Expected tax expense (20%) (894,808) (388,804) Investment incentive income (173,803) 75,140 Investment revaluation fund 387,987 123,724 Deductions and exemptions 80,936 58,793 Disallowable expenses and differences not subject to taxation (33,794) (85)
Taxation on income (633,482) (131,232)
The analysis of cumulative temporary differences and the related deferred tax assets and liabilities in
respect of items for which deferred income tax has been provided as at 31 December 2017 and
31 December 2016 using the enacted tax rates are as follows:
Cumulative temporary
differences Deferred tax
2017 2016 2017 2016
Fair value difference of
derivative instruments 257,527 383,690 (56,656) (76,738)
Difference between the carrying values
and tax base of property, plant,
equipment and intangible assets 57,569 - (12,665) -
Prepaid expenses 72,886 105,400 (16,035) (21,080)
Deferred financial income, (net) - 5,594 - (1,119)
Deferred tax liability (85,356) (98,937)
Investment incentive income 8,598,952 8,242,254 3,096,940 3,262,646
Difference between the carrying values
and tax base of property, plant,
equipment and intangible assets - 52,144 - 10,429
Employment termination benefits and
seniority incentive bonus provision 166,459 168,845 36,621 33,769
Provision for unused vacation liability 43,425 42,188 9,554 8,438
Provision for impairment
on spare parts - 22,455 - 4,491
Provisions for pending claims and lawsuits 15,227 12,523 3,350 2,505
Financial losses - 9,271 - 1,854
Deferred financial income, (net) 22,949 - 5,049 -
Other 6,543 9,178 1,439 1,836
Deferred tax assets 3,153,227 3,325,968
Deferred tax asset, net 3,067,871 3,227,031

TÜRKİYE PETROL RAFİNERİLERİ A.Ş.
NOTES TO THE CONDENSED INTERIM CONSOLIDATED FINANCIAL
STATEMENTS FOR PERIOD ENDED 31 DECEMBER 2017 (Amounts expressed in thousands of Turkish Lira (“TRY”) unless otherwise indicated.)
45
NOTE 29 - TAX ASSETS AND LIABILITIES (Continued)
In the first quarter of 2011, within the scope of the decree of the Council of Ministers dated 14 July 2009
and numbered 2009/15199, the Company was granted a Large-Scaled Investment Incentive Certificate
for Residuum Upgrading Project (RUP). Investment expenditures made within the scope of this
certificate are subject to 30% contribution from the govenment, where the contribution is provided as a
reduction in corporate tax payable by 50%. As of 7 October 2013, Residuum Upgrading Project was
granted Strategic Investment Incentive by Incentive Implementation and Foreign Investment
Department of Ministry of Economy of Republic of Turkey which became applicable after
19 October 2012. Expenditures made within the scope of Strategic Investment Incentive Certificate are
subject to 50% contribution from the government, where the contribution is provided as a reduction in
corporate tax payable by 90%. The company has performed the revaluation of the unutilized investment
incentives for both certificates by using the 14,47% revaluation rate, which was announced for the
second provisional tax period of 2017 by the Ministry of Finance. In addition to the government
contribution within the scope of Strategic Investment Incentive, the Company benefits from VAT
exemption, VAT refund, customs duty exemption, incentive for employer share of insurance premium
and interest incentive from this certificate.
The movement of deferred taxes is as follows:
2017 2016
1 January 3,227,031 3,202,503 Charge for the period (168,580) (39,599) Charge to equity: - Hedging cash flow gains/(losses) 10,405 151,540 - Actuarial gains/(losses) arising from defined benefit plans (985) 827 Tax effect of adjestments to previous years - - Investment incentive income - (88,240)
31 December 3,067,871 3,227,031
NOTE 30 - EARNINGS PER SHARE
1 January - 1 January - 31 December 2017 31 December 2016
Profit for the year attributable to
shareholders of the Company 3,811,546 1,793,267
Weighted average number of
shares with nominal value of Kr1
each 25,041,920,000 25,041,9
20,000
Basic and diluted earnings per share in Kr 15.22 7.16

TÜRKİYE PETROL RAFİNERİLERİ A.Ş.
NOTES TO THE CONDENSED INTERIM CONSOLIDATED FINANCIAL
STATEMENTS FOR PERIOD ENDED 31 DECEMBER 2017 (Amounts expressed in thousands of Turkish Lira (“TRY”) unless otherwise indicated.)
46
NOTE 31 - RELATED PARTY TRANSACTIONS
Related party transactions were classified according to the following groups and contain all descriptions in this footnote. (1) Joint ventures (2) Koç Holding group companies (3) Parent, ultimate parent
a) Deposits:
31 December 2017 31 December 2016
Yapı ve Kredi Bankası A.Ş. (2) 4,899,946 3,118,492
4,899,946 3,118,492
b) Due from related parties:
Opet Petrolcülük A.Ş. (1) 899,946 382,580
THY OPET Havacılık Yakıtları A.Ş. (1) 404,959 299,357
Aygaz A.Ş. (2) 88,381 65,483
Opet Fuchs Madeni Yağ San. ve Tic. A.Ş. (1) 6,305 4,396
Diğer (2) 10 8
1,399,601 751,824
As of 31 December 2017, Tüpraş has offset TRY100,000 thousand (31 December 2016: TRY250,000
thousand) from its trade receivables due from related parties that are collected from factoring companies
as a part of irrevocable factoring agreements.
c) Trade payables 31 December 2017 31 December 2016
Aygaz A.Ş. (2) 12,785 21,635
Opet Petrolcülük A.Ş. (1) 8,630 7,275
Zer Merkezi Hizmetler ve Ticaret A.Ş. (2) 14,066 12,800
THY OPET Havacılık Yakıtları A.Ş. (1) 4,923 3,091
Otokoç Otomotiv Tic. ve San. A.Ş. (2) 1,150 850
RAM Sigorta Aracılık Hizmetleri A.Ş. (2) 3,635 11,901
Eltek Elektrik Enerjisi İthalat, İhracat ve Toptan Tic. A.Ş. (2) 835 2,510
Koç Sistem Bilgi ve İletişim A.Ş. (2) 13,881 10,260
Ark İnşaat A.Ş. (2) 9,023 9,393
Setur Servis Turistik A.Ş. (2) 1,614 276
Opet International Limited (1) 39,259 -
Diğer (2) 5,655 8,026
115,456 88,017

TÜRKİYE PETROL RAFİNERİLERİ A.Ş.
NOTES TO THE CONDENSED INTERIM CONSOLIDATED FINANCIAL
STATEMENTS FOR PERIOD ENDED 31 DECEMBER 2017 (Amounts expressed in thousands of Turkish Lira (“TRY”) unless otherwise indicated.)
47
NOTE 31 - RELATED PARTY TRANSACTIONS (Continued)
d) Other payables:
31 December 2017 31 December 2016
Koç Holding A.Ş. (3) 23,463 18,546
23,463 18,546
e) Advances given for property, plant and equipment:
31 December 2017 31 December 2016
RMK Marine Gemi Yapım Sanayii ve
Deniz Taşımacılığı İşl. A.Ş. (2) 67,076 32,441
Ark İnşaat A.Ş. (2) 2,115 5,013
69,191 37,454
f) Product and service sales:
1 January - 1 January -
31 December 2017 31 December 2016
Opet Petrolcülük A.Ş. (1) 6,758,985 3,766,503
THY OPET Havacılık Yakıtları A.Ş. (1) 5,468,078 3,774,871
Aygaz A.Ş. (2) 541,284 314,557
Opet Fuchs Madeni Yağ San. ve Tic. A.Ş. (1) 31,703 24,532
Opet International Limited (2) - -
Diğer (2) 4 4
12,800,054 7,880,467
g) Product and service purchases:
1 January - 1 January -
31 December 2017 31 December 2016
Aygaz A.Ş. (2) 438,566 434,665
Opet Petrolcülük A.Ş. (1) 81,498 69,815
Ram Sigorta Aracılık Hizmetleri A.Ş. (2) (**) 82,734 80,837
Zer Merkezi Hizmetler ve Ticaret A.Ş. (2) 69,770 60,927
Opet International Limited (2) 58,388 -
THY OPET Havacılık Yakıtları A.Ş. (1) 28,513 25,748
Koç Holding A.Ş. (3) (*) 46,047 44,683
Eltek Elektrik Enerjisi İthalat, İhracat ve Toptan Tic. A.Ş. (2) 23,713 24,560
Koç Sistem Bilgi ve İletişim A.Ş. (2) 36,461 30,779
Otokoç Otomotiv Tic. ve San. A.Ş. (2) 10,377 8,458
Diğer (2) 36,177 20,484
912,244 800,956
(*) Consists of the Group’s share of invoices issued by Koç Holding, the ultimate parent of Tüpraş in accordance with the
“11-Intra-group Services” of General Communique numbered 1 on Distribution of Hidden Income through Transfer

TÜRKİYE PETROL RAFİNERİLERİ A.Ş.
NOTES TO THE CONDENSED INTERIM CONSOLIDATED FINANCIAL
STATEMENTS FOR PERIOD ENDED 31 DECEMBER 2017 (Amounts expressed in thousands of Turkish Lira (“TRY”) unless otherwise indicated.)
48
Pricing which represents the services provided for financing, legal, tax and renumeration of senior management by the
ultimate parent to its group companies.
(**) Includes paid and accrued insurance premiums in the periods ended 31 December 2017 and 2016 in connection with insurance policies signed with insurance companies through RAM Sigorta Aracılık Hizmetleri A.Ş acting as an intermediary insurance agent.

TÜRKİYE PETROL RAFİNERİLERİ A.Ş.
NOTES TO THE CONDENSED INTERIM CONSOLIDATED FINANCIAL
STATEMENTS FOR PERIOD ENDED 31 DECEMBER 2017 (Amounts expressed in thousands of Turkish Lira (“TRY”) unless otherwise indicated.)
49
NOTE 31 - RELATED PARTY TRANSACTIONS (Continued)
h) Fixed asset purchases:
1 January - 1 January - 31 December 2017 31 December 2016
Ark İnşaat A.Ş. (2) 50,986 83,396
Koç Sistem Bilgi ve İletişim A.Ş. (2) 7,695 1,837
RMK Marine Gemi Yapım Sanayii ve
Deniz Taşımacılığı İşl. A.Ş. (2) - 18,000
Diğer (2) 1,391 2,410
60,072 105,643
i) Remuneration of board of directors and executive management: The senior management of the Company is determined as members and chair of the Board of Directors and General Manager and General Manager Deputies. The total amount of benefits provided to senior management is TRY53,843 thousand as of period ending on 31 December 2017. (31 December 2016: TRY61,239 thousand) and there are no payments made due to redundancy from the work in 2017 (31 December 2016: TRY17,200 thousand). j) Financial expenses paid to related parties:
1 January - 1 January - 31 December 2017 31 December 2016
Yapı Kredi Faktoring A.Ş. (2) 3,366 1,361
Yapı ve Kredi Bankası A.Ş. (2) 761 -
Yapı Kredi Nederland N.V. (2) 116 -
4,243 1,361
k) Time deposit interest income:
1 January - 1 January - 31 December 2017 31 December 2016
Yapı ve Kredi Bankası A.Ş. (2) 203,941 143,456
203,941 143,456
l) Donations: As of 31 December 2017, total donation is amounting to TRY24,520 thousand (31 December 2016: TRY15,793 thousand).

TÜRKİYE PETROL RAFİNERİLERİ A.Ş.
NOTES TO THE CONDENSED INTERIM CONSOLIDATED FINANCIAL
STATEMENTS FOR PERIOD ENDED 31 DECEMBER 2017 (Amounts expressed in thousands of Turkish Lira (“TRY”) unless otherwise indicated.)
50
NOTE 32 - FINANCIAL INSTRUMENTS AND FINANCIAL RISK MANAGEMENT The Group’s activities expose it to a variety of financial risks, including the effects of changes in debt and equity market prices, foreign currency exchange rates and interest rates. The Group’s overall risk management program focuses on the unpredictability of financial markets and seeks to minimise potential adverse effects on the financial performance of the Group.
Liquidity risk:
The ability to fund the existing and prospective debt requirements is managed by maintaining the
availability of adequate fund providers from high quality lenders.
Prudent liquidity risk management comprises maintaining sufficient cash, the availability of funding
through an adequate amount of committed credit facilities and the ability to close out open positions.
The table below demonstrates the Group’s future cash outflows due to financial liabilities as at
31 December 2017 and 2016. The amounts demonstrated are undiscounted cash flows on agreements and
the Group manages its liquidity risk by taking into account its expected undiscounted cash flows.

TÜRKİYE PETROL RAFİNERİLERİ A.Ş.
NOTES TO THE CONDENSED INTERIM CONSOLIDATED FINANCIAL STATEMENTS FOR PERIOD ENDED 31 DECEMBER 2017 (Amounts expressed in thousands of Turkish Lira (“TRY”) unless otherwise indicated.)
51
NOTE 32 - FINANCIAL INSTRUMENTS AND FINANCIAL RISK MANAGEMENT (Continued)
31 December 2017 Up to 3-12 1-5 More than
Contractual maturities Carrying value Contractual cash flows 3 months months years 5 years
Total liabilities (non derivative) 27,145,323 29,029,942 12,554,044 5,264,019 7,014,846 4,197,033
Financial liabilities 9,727,388 10,760,411 452,503 2,450,417 6,538,418 1,319,073
Bonds & notes issued 5,323,596 6,166,821 - 2,813,602 475,259 2,877,960
Trade payables 8,213,166 8,221,537 8,221,537 - - -
Other liabilities 3,881,173 3,881,173 3,880,004 - 1,169 -
Up to 3-12 1-5 More than
Contractual maturities Carrying value Contractual cash flows 3 months months years 5 years
Derivative instruments (net) 266,968 177,508 (38,837) 162,164 39,051 15,131
Derivative cash inflows 444,469 6,001,922 3,563,116 1,995,823 390,325 52,658
Derivative cash outflows 180,501 5,824,414 3,601,954 1,833,659 351,274 37,527
31 December 2016
Up to 3-12 1-5 More than
Contractual maturities Carrying value Contractual cash flows 3 months months years 5 years
Total liabilities (non derivative) 22,586,814 23,727,085 11,052,961 1,716,245 9,192,715 1,765,164
Financial liabilities 9,445,361 10,439,150 382,280 1,614,628 6,677,078 1,765,164
Bonds & notes issued 2,688,904 2,824,640 208,775 101,617 2,514,248 -
Trade payables 6,987,843 6,998,589 6,998,589 - - -
Other liabilities 3,464,706 3,464,706 3,463,317 - 1,389 -
Up to 3-12 1-5 More than
Contractual maturities Carrying value Contractual cash flows 3 months months years 5 years
Derivative instruments (net) 372,377 235,948 402 (28,178) 240,950 22,774
Derivative cash inflows 403,613 1,707,376 353,698 192,153 1,054,956 106,569
Derivative cash outflows 31,236 1,471,428 353,296 220,331 814,006 83,795
Cash outflows will be financed through cash inflows generated from sales or through funding.

TÜRKİYE PETROL RAFİNERİLERİ A.Ş.
NOTES TO THE CONDENSED INTERIM CONSOLIDATED FINANCIAL
STATEMENTS FOR PERIOD ENDED 31 DECEMBER 2017 (Amounts expressed in thousands of Turkish Lira (“TRY”) unless otherwise indicated.)
52
NOTE 32 - FINANCIAL INSTRUMENTS AND FINANCIAL RISK MANAGEMENT (Continued)
Credit risk:
The Group is subject to credit risk arising from trade receivables related to credit sales, deposits at banks.
These risks are managed by limiting the aggregate risk from any individual counterparty and obtaining
sufficient collateral where necessary and making only cash based sales to customers considered as
having a higher risk. Collectability of trade receivables are evaluated by management depending on their
past experiences and current economic condition, and are presented in the consolidated financial
statements net of adequate doubtful provision.
Major portion of Tüpraş’s customers are composed of financially strong companies or government
entities. As at 31 December 2017 and 2016, trade receivables from the top 5 customers of the Group
constitute 63% and 71% of total receivables, respectively. When these factors are considered together
with the insignificant historical default experience for the Group’s receivables, the Group management
considers the credit risk as low. The Group uses the same risk management principles for the
management of financial assets. Investments are made to highly liquid instruments and the banks that
the Group deposits its cash and cash equivalents in are selected among the financially strong institutions.
As the Group did not have any uncollected, past due, impaired or renegotiated bank deposits, the Group
believes that it does not have any impairment risk related to bank deposits.

TÜRKİYE PETROL RAFİNERİLERİ A.Ş.
NOTES TO THE CONDENSED INTERIM CONSOLIDATED FINANCIAL STATEMENTS FOR PERIOD ENDED 31 DECEMBER 2017 (Amounts expressed in thousands of Turkish Lira (“TRY”) unless otherwise indicated.)
53
NOTE 32 - FINANCIAL INSTRUMENTS AND FINANCIAL RISK MANAGEMENT (Continued)
Credit risks of the Group for each financial instrument type as at 31 December 2017 and 2016 are as follows:
Receivables
Trade Receivables Other Receivables
Related Third Related Third Bank Derivative
31 December 2017 parties parties parties parties deposits instruments Other
Maximum exposed credit risk as of reporting date 1,399,601 3,627,432 - 84,267 8,802,069 430,348 -
- Secured portion of the maximum credit risk
by guarantees, etc. - 378,280 - - - - -
A. Net book value of financial asset either are not due or
not impaired 1,399,601 3,589,027 - 84,267 8,802,069 430,348 -
B. Net book value of overdue but not impaired financial assets - 38,405 - - - - -
C. Net book value of the impaired assets - - - - - - -
- Overdue(gross book value) - 3,184 - 360 - - -
- Impairment (-) - (3,184) - (360) - - -
- Secured portion of the net value by guarantees, etc. - - - - - - -
- Not due yet (gross book value) - - - - - - -
- Impairment (-) - - - - - - -
- Secured portion of the net value by guarantees, etc. - - - - - - -
D. Components which are including credit risk
except financial statement - - - - - - -

TÜRKİYE PETROL RAFİNERİLERİ A.Ş.
NOTES TO THE CONDENSED INTERIM CONSOLIDATED FINANCIAL STATEMENTS FOR PERIOD ENDED 31 DECEMBER 2017 (Amounts expressed in thousands of Turkish Lira (“TRY”) unless otherwise indicated.)
54
NOTE 32 - FINANCIAL INSTRUMENTS AND FINANCIAL RISK MANAGEMENT (Continued)
Receivables
Trade Receivables Other Receivables
Related Third Related Third Bank Derivative
31 December 2016 parties parties parties parties deposits instruments Other
Maximum exposed credit risk as of reporting date 751,824 2,428,458 - 25,626 6,050,721 403,613 -
- Secured portion of the maximum credit risk
by guarantees, etc. - 651,954 - - - - -
A. Net book value of financial asset either are not due or
not impaired 751,854 2,363,541 - 25,626 6,050,721 403,613 -
B. Net book value of overdue but not impaired financial assets - 64,917 - - - - -
C. Net book value of the impaired assets - - - - - - -
- Overdue(gross book value) - 2,676 - 304 - - -
- Impairment (-) - (2,676) - (304) - - -
- Secured portion of the net value by guarantees, etc. - - - - - - -
- Not due yet (gross book value) - - - - - - -
- Impairment (-) - - - - - - -
- Secured portion of the net value by guarantees, etc. - - - - - - -
D. Components which are including credit risk
except financial statement - - - - - - -

TÜRKİYE PETROL RAFİNERİLERİ A.Ş.
NOTES TO THE CONDENSED INTERIM CONSOLIDATED FINANCIAL
STATEMENTS FOR PERIOD ENDED 31 DECEMBER 2017 (Amounts expressed in thousands of Turkish Lira (“TRY”) unless otherwise indicated.)
55
NOTE 32 - FINANCIAL INSTRUMENTS AND FINANCIAL RISK MANAGEMENT (Continued)
Receivables
Trade Other Bank Derivative
31 December 2017 receivables receivables deposits instruments Other
Overdue (1-30 days) 22,920 - - - -
Overdue (1-3 months) 14,304 - - - -
Overdue (3-12 months) 1,181 - - - -
Overdue (1-5 years) - - - - -
Overdue (5+ years) - - - - -
Receivables
Trade Other Bank Derivative
31 December 2016 receivables receivables deposits instruments Other
Overdue (1-30 days) 36,307 - - - -
Overdue (1-3 months) 26,078 - - - -
Overdue (3-12 months) 2,531 - - - -
Overdue (1-5 years) - - - - -
Overdue (5+ years) - - - - -
During the impairment test of financial assets, the Group has considered the indicators regarding uncollectibility of receivables that are due.
Market risk:
Tüpraş identifies commodity price, interest rate and currency risk as major components of market risk. Foreign exchange and interest risk are evaluated separately based on portfolio and product.
Commodity price risk
The Company is exposed to effects of fluctuation in oil prices related to its crude oil inventory held for production. For the elimination of commodity price risk, the management regularly reviews the amount of stocks.
Sales prices' of Tüpraş's products, are determined based on Mediterranean product prices, which is described as the "closest accessible free market formation in the world" by the Turkish Petroleum Market Law N. 5015, and USD selling rates. Within the framework of legal definitions, changes of prices in Mediterranean petroleum products market and changes in USD exchange rate are assessed daily by the management and the new selling price based on these two factors is updated when it differs significantly upwards or downwards from the current sales price.
Since instability in crude oil prices may cause unwanted and unexpected fluctuations in net profit and cash flows, the Company has consituted hedging policy in order to eliminate this risk. Within this framework, short and long term hedging transactions are made by using various derivative instruments (Note 20).
Product crack risk
Besides the fluctuations in crude oil prices, in order to eliminate fluctuation risk in product prices profit margins of the products (crack) can be fixed by using various derivative instruments (hedging). Therefore, a hedging policy has been created by comparing historical price levels and by hedging a certain percentage of the total sales volume at certain crack levels (Note 20).
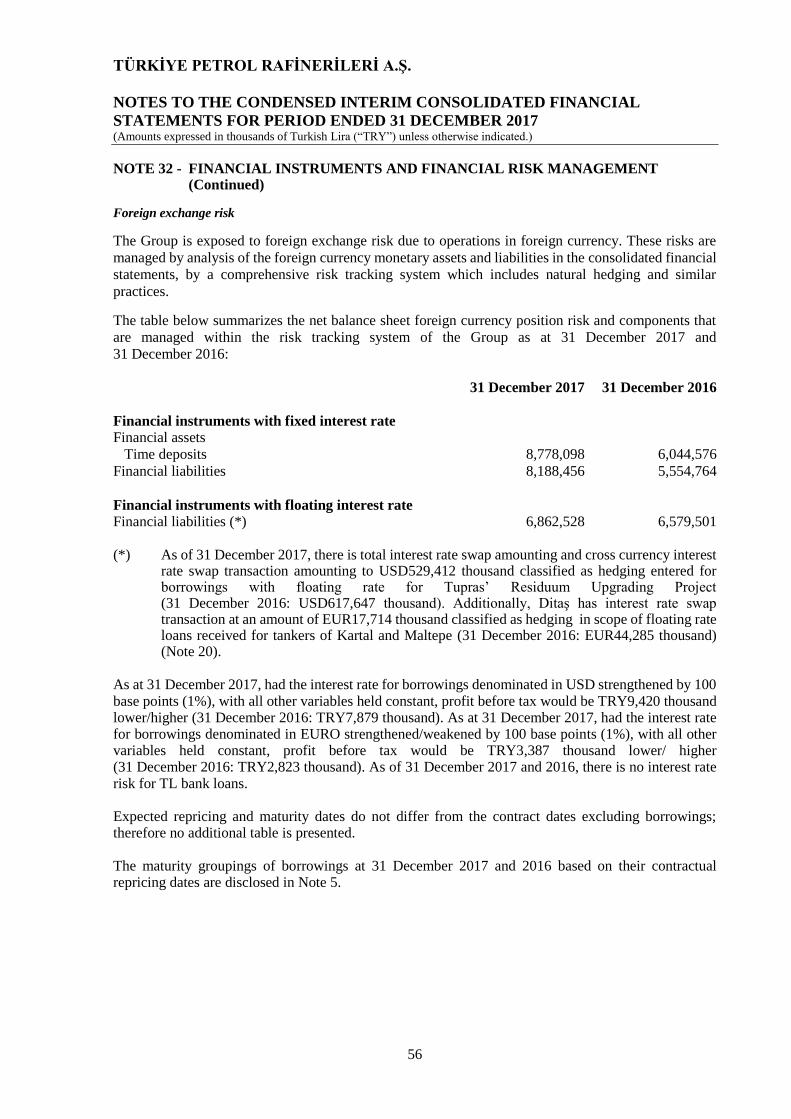
TÜRKİYE PETROL RAFİNERİLERİ A.Ş.
NOTES TO THE CONDENSED INTERIM CONSOLIDATED FINANCIAL
STATEMENTS FOR PERIOD ENDED 31 DECEMBER 2017 (Amounts expressed in thousands of Turkish Lira (“TRY”) unless otherwise indicated.)
56
NOTE 32 - FINANCIAL INSTRUMENTS AND FINANCIAL RISK MANAGEMENT (Continued)
Foreign exchange risk
The Group is exposed to foreign exchange risk due to operations in foreign currency. These risks are
managed by analysis of the foreign currency monetary assets and liabilities in the consolidated financial
statements, by a comprehensive risk tracking system which includes natural hedging and similar
practices.
The table below summarizes the net balance sheet foreign currency position risk and components that
are managed within the risk tracking system of the Group as at 31 December 2017 and
31 December 2016:
31 December 2017 31 December 2016
Financial instruments with fixed interest rate
Financial assets
Time deposits 8,778,098 6,044,576
Financial liabilities 8,188,456 5,554,764
Financial instruments with floating interest rate
Financial liabilities (*) 6,862,528 6,579,501
(*) As of 31 December 2017, there is total interest rate swap amounting and cross currency interest
rate swap transaction amounting to USD529,412 thousand classified as hedging entered for borrowings with floating rate for Tupras’ Residuum Upgrading Project (31 December 2016: USD617,647 thousand). Additionally, Ditaş has interest rate swap transaction at an amount of EUR17,714 thousand classified as hedging in scope of floating rate loans received for tankers of Kartal and Maltepe (31 December 2016: EUR44,285 thousand) (Note 20).
As at 31 December 2017, had the interest rate for borrowings denominated in USD strengthened by 100 base points (1%), with all other variables held constant, profit before tax would be TRY9,420 thousand lower/higher (31 December 2016: TRY7,879 thousand). As at 31 December 2017, had the interest rate for borrowings denominated in EURO strengthened/weakened by 100 base points (1%), with all other variables held constant, profit before tax would be TRY3,387 thousand lower/ higher (31 December 2016: TRY2,823 thousand). As of 31 December 2017 and 2016, there is no interest rate risk for TL bank loans. Expected repricing and maturity dates do not differ from the contract dates excluding borrowings; therefore no additional table is presented. The maturity groupings of borrowings at 31 December 2017 and 2016 based on their contractual repricing dates are disclosed in Note 5.

TÜRKİYE PETROL RAFİNERİLERİ A.Ş.
NOTES TO THE CONDENSED INTERIM CONSOLIDATED FINANCIAL
STATEMENTS FOR PERIOD ENDED 31 DECEMBER 2017 (Amounts expressed in thousands of Turkish Lira (“TRY”) unless otherwise indicated.)
57
NOTE 32 - FINANCIAL INSTRUMENTS AND FINANCIAL RISK MANAGEMENT (Continued)
Foreign exchange risk
The Group is exposed to foreign exchange risk due to operations in foreign currency. These risks are
managed by analysis of the foreign currency monetary assets and liabilities in the consolidated financial
statements, by a comprehensive risk tracking system which includes natural hedging and similar
practices.
The table below summarizes the net balance sheet foreign currency position risk and components that
are managed within the risk tracking system of the Group as at 31 December 2017 and 31 December
2016:
31 December 2017 31 December 2016 31 December 2017 31 December 2016
TRY USD(*) TRY USD(*)
Monetary assets 7,648,679 2,027,805 4,347,693 1,235,421
Monetary liabilities (21,286,304) (5,643,390) (14,585,609) (4,144,581)
Monetary assets/(liabilities)
foreign currency position (13,637,625) (3,615,585) (10,237,916)
(2,909,160)
Non-monetary assets 11,343 3,007 148,748 42,268
Net foreign currency position
of derivative financial instruments 4,294,924 1,138,663 1,310,386 372,353
Net foreign currency asset/(liability)
position (9,331,358) (2,473,914) (8,778,782) (2,494,539)
Cash flow hedging (**) 4,796,118 1,271,539 5,130,371 1,457,823
Net foreign currency position
after cash flow hedging (4,535,240) (1,202,376) (3,648,411) (1,036,716)
Inventory in natural hedge scope (***) 5,058,436 1,341,084 3,477,413 988,126
Net foreign currency position after
cash flow hedging and natural hedge 523,196 138,709 (170,998) (48,590)
(*) Dollar equivalent amounts are determined through dividing total TRY equivalent positions to exchange rate
of dollar as at balance sheet date.
(**) The Group has used its investment loans amounting to USD1,254,421 thousand (TRY4,731,551) as
hedging instruments against USD/TRY spot exchange rate exposed as a result of forecast export proceeds
having a high probability of realization and cash flow hedging is applied in this scope
(31 December 2016: USD1,457,823 thousand (TRY5,130,371 thousand), exchange difference
income/expenses of investment loans are recognized in “Hedging gains/(losses)” account under equity until
cash flows of the item which is included in related hedging are realized, it has no impact on the income
statement.
(***) The Group manages its foreign currency risk arising from foreign currency denominated financial liabilities
and trade payables by regularly considering and reflecting the foreign exchange rate changes in the
determination of petroleum product prices. As at 31 Decmeber 2017, the Group has crude oil and petroleum
products inventories amounting to TRY5,058,436 (31 December 2016: TRY3,477,413 thousand) (Note 8).

TÜRKİYE PETROL RAFİNERİLERİ A.Ş.
NOTES TO THE CONDENSED INTERIM CONSOLIDATED FINANCIAL STATEMENTS FOR PERIOD ENDED 31 DECEMBER 2017 (Amounts expressed in thousands of Turkish Lira (“TRY”) unless otherwise indicated.)
58
NOTE 32 - FINANCIAL INSTRUMENTS AND FINANCIAL RISK MANAGEMENT (Continued)
Foreign exchange position table 31 December 2017 31 December 2016
TRY equivalent (In terms of
functional currency) USD EUR GBP Other
TRY equivalent (In terms of
functional currency) USD EUR GBP Other
Trade receivables 102,783 27,226 19 - - 257,339 73,124 - - - Monetary financial assets (including cash, banks) 7,528,924 1,851,164 120,909 - 554 4,085,609 875,246 270,883 114 - Other 11,343 2,298 590 2 - 3,780 1,074 - - - Current assets 7,643,050 1,880,688 121,518 2 554 4,346,728 949,444 270,883 114 - Monetary financial assets 16,972 2,498 2,002 - - 4,745 1,348 - - - Other - - - - - 144,968 27,163 13,309 - - Non-current assets 16,972 2,498 2,002 - - 149,713 28,511 13,309 - - Total assets 7,660,022 1,883,186 123,520 2 554 4,496,441 977,955 284,192 114 -
Trade payables 7,297,348 1,916,299 14,705 329 3,841,321 1,056,681 27,213 1,043 17,189 Financial liabilities 3,966,781 1,046,575 10,897 - 1,243,661 333,977 18,418 - - Other monetary liabilities 524,280 138,814 153 - 257,008 72,774 243 - - Current liabilities 11,818,409 3,101,688 25,755 329 1,191 5,341,990 1,463,432 45,874 1,043 17,189 Financial liabilities 9,464,531 2,160,677 291,146 - - 9,241,837 2,314,067 296,011 - - Other monetary liabilities 3,364 686 172 - - 1,782 - 480 - - Non-current liabilities 9,467,895 2,161,363 291,318 - - 9,243,619 2,314,067 296,491 - - Total liabilities 21,286,304 5,263,051 317,073 329 1,191 14,585,609 3,777,499 342,365 1,043 17,189
Net asset/(liability) position of off-balance sheet foreign currency derivatives
4,294,924 925,914 177,714 - - 1,310,386 372,353 - - -
Total amount of off-balance sheet derivative financial assets 4,365,360 944,588 177,714 - - 1,310,386 372,353 - - - Total amount of off-balance sheet derivative financial liabilities (70,436) (18,674) - - - - - - - - Net foreign currency asset/(liability) position (9,331,358) (2,453,951) (15,839) (327) (637) (8,778,772) (2,427,191) (58,173) (929) (17,189) Cash flow hedging 4,796,118 1,271,539 - - - 5,130,371 1,457,823 - - - Net foreign currency position after cash flow hedging (4,535,240) (1,182,412) (15,839) (327) (637) (3,648,411) (969,368) (58,173) (929) (17,189) Net monetary foreign currency asset/(liability) position (13,637,625) (3,382,163) (194,143) (329) (637) (10,237,916) (2,827,781) (71,482) (929) (17,189)
Fair value of derivative instruments used for hedging
426,328 113,027 - - - 373,700 106,189 - - -
As at 31 December 2017, the Group has TRY523,196 thousand as net foreign currency surplus after natural hedging (31 December 2016: TRY,170,998 thousand net foreign currency deficit) (p. 54).

TÜRKİYE PETROL RAFİNERİLERİ A.Ş.
NOTES TO THE CONDENSED INTERIM CONSOLIDATED FINANCIAL
STATEMENTS FOR PERIOD ENDED 31 DECEMBER 2017 (Amounts expressed in thousands of Turkish Lira (“TRY”) unless otherwise indicated.)
59
NOTE 32 - FINANCIAL INSTRUMENTS AND FINANCIAL RISK MANAGEMENT (Continued)
The table below summarizes the effect of foreign currency rate changes on net balance sheet foreign currency position of the Group as at 31 December 2017 and 31 December 2016.
Statement of foreign currency risk sensitivity
31 December 2017
Profit/Loss Equity
Appreciation of foreign
currency Depreciation of
foreign currency Appreciation of
foreign currency Depreciation of
foreign currency
10% change in USD rate:
USD net assets/ liabilities (1,275,718) 1,275,718 473,155 (473,155)
Amount hedged for USD risk (-) 808,651 (808,651 - -
USD net effect (467,067) 467,067 473,155 (473,155)
10% change in EUR rate:
Euro net assets/ liabilities (87,665) 87,665 -
Amount hedged for Euro risk (-) 80,247 (80,247) - -
EUR net effect (7,418) 7,418 - -
TOTAL (474,485) 474,485 473,155 (473,155)
31 December 2016
Profit/Loss Equity
Appreciation of foreign
currency Depreciation of
foreign currency Appreciation of
foreign currency Depreciation of
foreign currency
10% change in USD rate:
USD net assets/ liabilities (995,153) 995,153 (513,037) 513,037
Amount hedged for USD risk (-) 644,076 (644,076) - -
USD net effect (351,077) 351,077 (513,037) 513,037
10% change in EUR rate:
Euro net assets/ liabilities (26,519) 26,519 -
Amount hedged for Euro risk (-) - - - -
EUR net effect (26,519) 26,519 - -
TOTAL (377,596) 377,596 (513,037) 513,037
The Company accounted investment loans in scope of cash flow hedge accounting and foreign exchange
income/expense arising from these loans are recognised in equity. 10% increase and decrease effect of foreign
exchange rates are calculated with the same method and the calculated foreign exchange gains/losses are presented
as hedged portion in the foreign exchange sensitivity table. Furthermore, the hedged portion of foreign exchange
gains/losses via forwards and cross currency swap transactions is classified as the amount hedged against US dollar
in the statement of exchange rate sensitivity analysis.

TÜRKİYE PETROL RAFİNERİLERİ A.Ş.
NOTES TO THE CONDENSED INTERIM CONSOLIDATED FINANCIAL
STATEMENTS FOR PERIOD ENDED 31 DECEMBER 2017 (Amounts expressed in thousands of Turkish Lira (“TRY”) unless otherwise indicated.)
60
NOTE 32 - FINANCIAL INSTRUMENTS AND FINANCIAL RISK MANAGEMENT (Continued)
Export and import
1 January - 1 January -
31 December 2017 31 December 2016
Export
USD (equivalent of thousand TRY) 10,205,556 6,374,428
10,205,556 6,374,428
Import
USD (equivalent of thousand TRY) 42,552,146 26,456,318
42,552,146 26,456,318
Capital risk management
The Group’s objectives when managing capital are to safeguard the Group’s ability to continue as a
going concern in order to provide returns for shareholders and benefits for other stakeholders and to
maintain an optimal capital structure to reduce the cost of capital.
In order to maintain or adjust the capital structure, the Group may adjust the amount of dividends paid
to shareholders, issue new shares or sell assets to reduce debt. The gearing ratios as at
31 December 2017 and 31 December 2016 are as follows:
31 December 2017 31 December 2016
Total financial liabilities (Note 5) 15,050,984 12,134,265
Less: Cash and cash equivalents (Note 4) (7,603,858) (5,048,709)
Net financial liabilities 7,447,126 7,085,556
Total shareholders’ equity 10,477,661 8,167,033
Total capital invested 17,924,787 15,252,589
Gearing ratio 41.55% 46.45%
Fair value of financial instruments
Fair value is the price that would be received to sell an asset or paid to transfer a liability in an orderly
transaction between market participants at the measurement date. The estimated fair values of financial
instruments have been determined by the Group, using available market information and appropriate
valuation methodologies. However, judgment is necessarily required to interpret market data to estimate
the fair value. Accordingly, the estimates presented herein are not necessarily indicative of the amounts
the Group could realise in a current market exchange.

TÜRKİYE PETROL RAFİNERİLERİ A.Ş.
NOTES TO THE CONDENSED INTERIM CONSOLIDATED FINANCIAL
STATEMENTS FOR PERIOD ENDED 31 DECEMBER 2017 (Amounts expressed in thousands of Turkish Lira (“TRY”) unless otherwise indicated.)
61
NOTE 32 - FINANCIAL INSTRUMENTS AND FINANCIAL RISK MANAGEMENT (Continued)
Following methods and assumptions were used to estimate the fair value of the financial instruments for which is practicable to estimate fair value:
Financial assets
The carrying amounts of foreign currency denominated monetary assets which are translated at year end exchange rates are considered to approximate their fair values.
The carrying values of cash and cash equivalents are estimated to be their fair values since they are short term.
The carrying values of trade receivables along with the related allowances for uncollectibility are estimated to be their fair values since they are short term.
Financial liabilities
The fair values of short-term financial liabilities and other financial liabilities are estimated to be their fair values since they are short term. The fair values of long-term bank borrowings with variable interest are considered to approximate their respective carrying values, since the initial rates applied to bank borrowings are updated periodically by the lender to reflect active market price quotations.
Fair value hierarchy table:
The Group classifies the fair value measurement of each class of financial instruments according to the source, using the three-level hierarchy, as follows:
Level 1: Market price valuation techniques for the determined financial instruments traded in markets (unadjusted)
Level 2: Other valuation techniques includes direct or indirect observable inputs
Level 3: Valuation techniques does not contains observable market inputs
Fair value hierarchy table as at 31 December 2017 is as follows:
Financial assets at fair value through profit or loss Level 1 Level 2 Level 3
Derivative financial assets - 447,469 - Financial investments - - -
Financial liabilities at fair value through profit or loss
Derivative financial liabilities - 180,501 -
Fair value hierarchy table as at 31 December 2016 is as follows:
Financial assets at fair value through profit or loss Level 1 Level 2 Level 3
Derivative financial assets - 403,613 .- Financial investments - - -
Financial liabilities at fair value through profit or loss
Derivative financial liabilities - 31,236 -
NOTE 32 - SUBSEQUENT EVENTS
None. …………………….