convenience translation of condensed interim … · 30-06-2019 · tÜrkİye petrol...
TRANSCRIPT
CONVENIENCE TRANSLATION OF CONDENSED INTERIM CONSOLIDATED FINANCIAL STATEMENTS ORIGINALLY ISSUED IN TURKISH TÜRKİYE PETROL RAFİNERİLERİ A.Ş. CONDENSED INTERIM CONSOLIDATED FINANCIAL STATEMENTS TOGETHER WITH AUDITOR’S REVIEW REPORT FOR THE PERIOD 1 JANUARY - 30 JUNE 2019
TÜRKİYE PETROL RAFİNERİLERİ A.Ş.
TABLE OF CONTENTS PAGE
CONSOLIDATED INTERIM STATEMENTS OF FINANCIAL POSITION ....................................... 1
CONSOLIDATED INTERIM STATEMENTS OF PROFIT OR LOSS AND OTHER COMPREHENSIVE INCOME ................................................................................................................... 2
CONSOLIDATED INTERIM STATEMENTS OF CHANGES IN EQUITY ........................................ 3
CONSOLIDATED INTERIM STATEMENTS OF CASH FLOWS ....................................................... 4
NOTES TO THE INTERIM CONDENSED CONSOLIDATED FINANCIAL STATEMENTS ......... 5 - 48 NOTE 1 ORGANIZATION OF THE GROUP AND NATURE OF OPERATIONS .................................................. 5-6 NOTE 2 BASIS OF PRESENTATION OF CONSOLIDATED FINANCIAL STATEMENTS ................................. 7-15 NOTE 3 BUSINESS COMBINATIONS ...................................................................................................................... 16 NOTE 4 CASH AND CASH EQUIVALENTS ............................................................................................................ 16 NOTE 5 FINANCIAL LIABILITIES ............................................................................................................................ 17-20 NOTE 6 TRADE RECEIVABLES AND PAYABLES ................................................................................................ 20 NOTE 7 OTHER RECEIVABLES AND PAYABLES ................................................................................................ 21 NOTE 8 INVENTORIES ............................................................................................................................................... 21 NOTE 9 INVESTMENTS ACCOUNTED FOR USING EQUITY METHOD ............................................................ 22 NOTE 10 INVESTMENT PROPERTY .......................................................................................................................... 22 NOTE 11 PROPERTY, PLANT AND EQUIPMENT .................................................................................................... 23 NOTE 12 INTANGIBLE ASSETS ................................................................................................................................. 24 NOTE 13 PREPAID EXPENSES .................................................................................................................................... 24 NOTE 14 OTHER ASSETS AND LIABILITIES ........................................................................................................... 25-26 NOTE 15 PROVISIONS ................................................................................................................................................. 26-28 NOTE 16 LIABILITIES FOR EMPLOYEE BENEFITS ............................................................................................... 28 NOTE 17 OTHER PAYABLES ...................................................................................................................................... 28 NOTE 18 DERIVATIVE INSTRUMENTS .................................................................................................................... 29-30 NOTE 19 COMMITMENTS AND CONTINGENT ASSETS AND LIABILITIES ...................................................... 31-32 NOTE 20 EQUITY .......................................................................................................................................................... 32-33 NOTE 21 REVENUE AND COST OF SALES .............................................................................................................. 34 NOTE 22 GENERAL ADMINISTRATIVE EXPENSES MARKETING SELLING AND DISTRIBUTION EXPENSES, RESEARCH AND DEVELOPMENT EXPENSES ................................................................. 34-35 NOTE 23 OTHER OPERATING INCOME/(EXPENSES) ............................................................................................ 35 NOTE 24 INCOME FROM INVESTMENT ACTIVITIES ........................................................................................... 36 NOTE 25 FINANCIAL INCOME/(EXPENSES) ........................................................................................................... 36 NOTE 26 TAX ASSETS AND LIABILITIES ................................................................................................................ 36-37 NOTE 27 EARNINGS PER SHARE .............................................................................................................................. 38 NOTE 28 RELATED PARTY TRANSACTIONS ......................................................................................................... 38-41 NOTE 29 FINANCIAL INSTRUMENTS AND FINANCIAL RISK MANAGEMENT .............................................. 41-48 NOTE 30 SUBSEQUENT EVENTS ........................................................................................................................................ 48
TÜRKİYE PETROL RAFİNERİLERİ A.Ş.
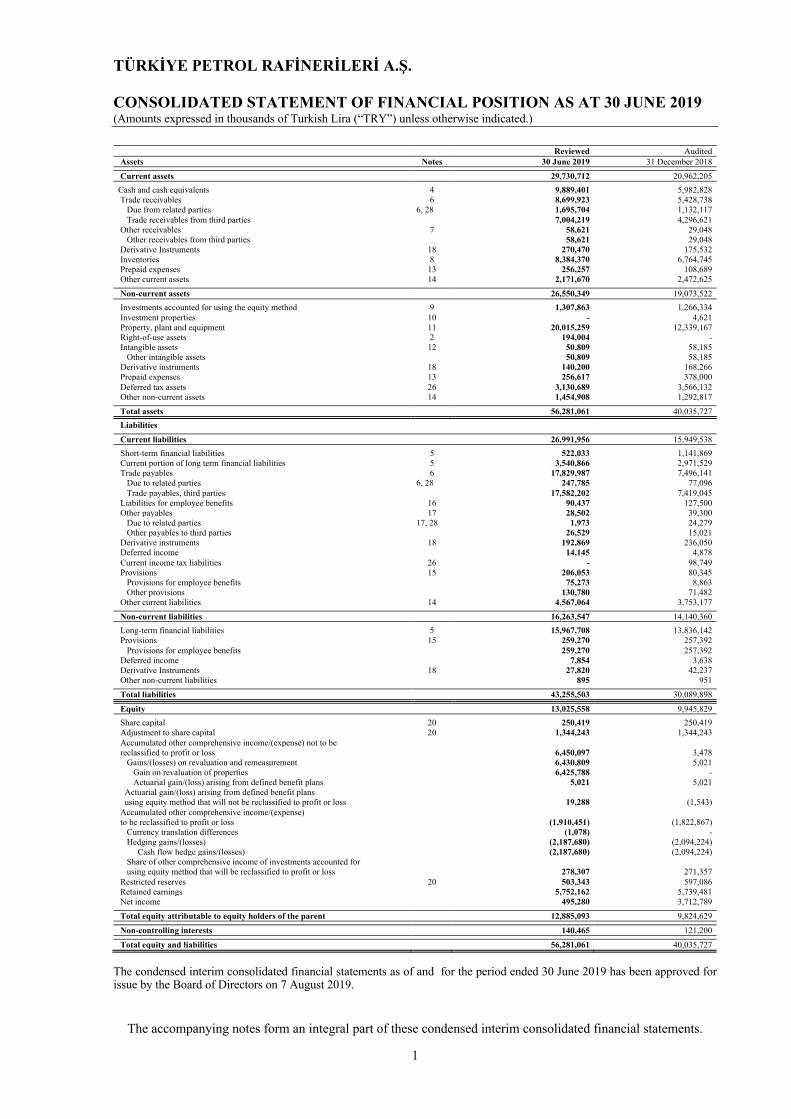
CONSOLIDATED STATEMENT OF FINANCIAL POSITION AS AT 30 JUNE 2019 (Amounts expressed in thousands of Turkish Lira (“TRY”) unless otherwise indicated.)
1
Reviewed Audited Assets Notes 30 June 2019 31 December 2018
Current assets 29,730,712 20,962,205 Cash and cash equivalents 4 9,889,401 5,982,828 Trade receivables 6 8,699,923 5,428,738 Due from related parties 6, 28 1,695,704 1,132,117 Trade receivables from third parties 7,004,219 4,296,621 Other receivables 7 58,621 29,048 Other receivables from third parties 58,621 29,048 Derivative Instruments 18 270,470 175,532 Inventories 8 8,384,370 6,764,745 Prepaid expenses 13 256,257 108,689 Other current assets 14 2,171,670 2,472,625 Non-current assets 26,550,349 19,073,522
Investments accounted for using the equity method 9 1,307,863 1,266,334 Investment properties 10 - 4,621 Property, plant and equipment 11 20,015,259 12,339,167 Right-of-use assets 2 194,004 - Intangible assets 12 50,809 58,185 Other intangible assets 50,809 58,185 Derivative instruments 18 140,200 168,266 Prepaid expenses 13 256,617 378,000 Deferred tax assets 26 3,130,689 3,566,132 Other non-current assets 14 1,454,908 1,292,817 Total assets 56,281,061 40,035,727
Liabilities Current liabilities 26,991,956 15,949,538 Short-term financial liabilities 5 522,033 1,141,869 Current portion of long term financial liabilities 5 3,540,866 2,971,529 Trade payables 6 17,829,987 7,496,141 Due to related parties 6, 28 247,785 77,096 Trade payables, third parties 17,582,202 7,419,045 Liabilities for employee benefits 16 90,437 127,500 Other payables 17 28,502 39,300 Due to related parties 17, 28 1,973 24,279 Other payables to third parties 26,529 15,021 Derivative instruments 18 192,869 236,050 Deferred income 14,145 4,878 Current income tax liabilities 26 - 98,749 Provisions 15 206,053 80,345 Provisions for employee benefits 75,273 8,863 Other provisions 130,780 71,482 Other current liabilities 14 4,567,064 3,753,177 Non-current liabilities 16,263,547 14,140,360 Long-term financial liabilities 5 15,967,708 13,836,142 Provisions 15 259,270 257,392 Provisions for employee benefits 259,270 257,392 Deferred income 7,854 3,638 Derivative Instruments 18 27,820 42,237 Other non-current liabilities 895 951 Total liabilities 43,255,503 30,089,898
Equity 13,025,558 9,945,829 Share capital 20 250,419 250,419 Adjustment to share capital 20 1,344,243 1,344,243 Accumulated other comprehensive income/(expense) not to be reclassified to profit or loss 6,450,097 3,478 Gains/(losses) on revaluation and remeasurement 6,430,809 5,021 Gain on revaluation of properties 6,425,788 - Actuarial gain/(loss) arising from defined benefit plans 5,021 5,021 Actuarial gain/(loss) arising from defined benefit plans using equity method that will not be reclassified to profit or loss 19,288 (1,543) Accumulated other comprehensive income/(expense) to be reclassified to profit or loss (1,910,451) (1,822,867) Currency translation differences (1,078) - Hedging gains/(losses) (2,187,680) (2,094,224) Cash flow hedge gains/(losses) (2,187,680) (2,094,224) Share of other comprehensive income of investments accounted for using equity method that will be reclassified to profit or loss 278,307 271,357 Restricted reserves 20 503,343 597,086 Retained earnings 5,752,162 5,739,481 Net income 495,280 3,712,789 Total equity attributable to equity holders of the parent 12,885,093 9,824,629 Non-controlling interests 140,465 121,200 Total equity and liabilities 56,281,061 40,035,727
The condensed interim consolidated financial statements as of and for the period ended 30 June 2019 has been approved for issue by the Board of Directors on 7 August 2019.
The accompanying notes form an integral part of these condensed interim consolidated financial statements.
TÜRKİYE PETROL RAFİNERİLERİ A.Ş.
CONSOLIDATED STATEMENT OF PROFIT OR LOSS AND OTHER
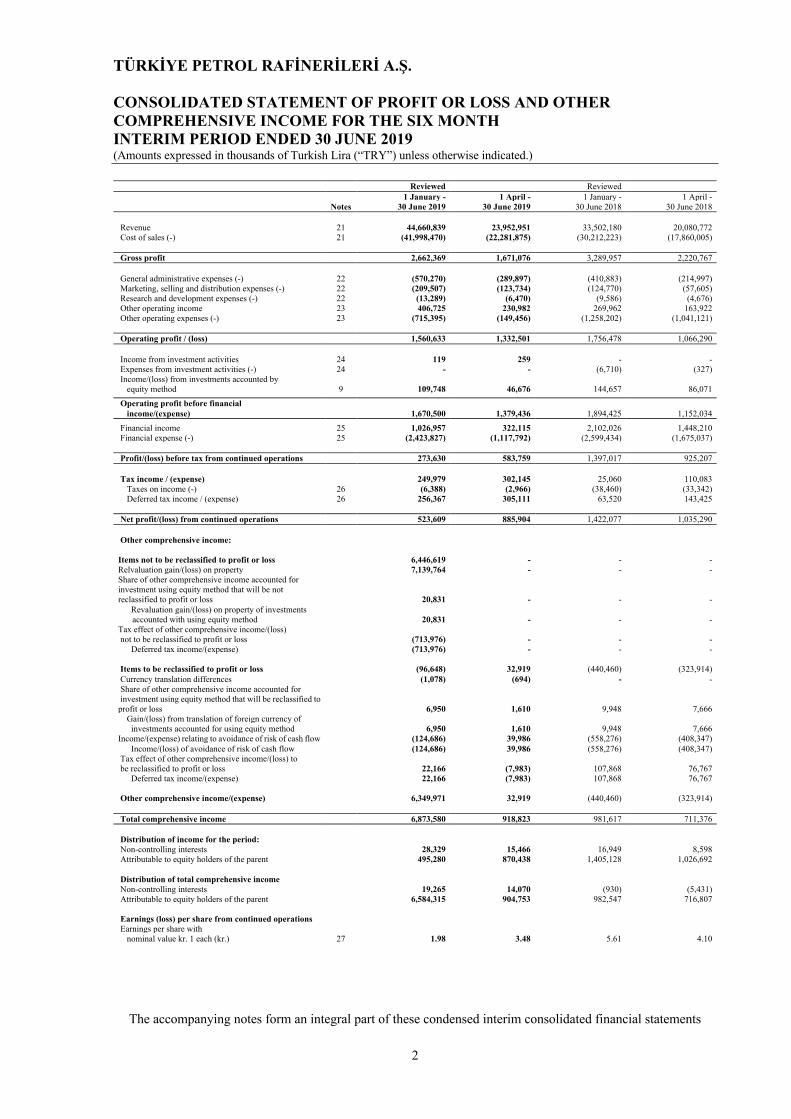
COMPREHENSIVE INCOME FOR THE SIX MONTH INTERIM PERIOD ENDED 30 JUNE 2019 (Amounts expressed in thousands of Turkish Lira (“TRY”) unless otherwise indicated.)
2
Reviewed Reviewed 1 January - 1 April - 1 January - 1 April - Notes 30 June 2019 30 June 2019 30 June 2018 30 June 2018 Revenue 21 44,660,839 23,952,951 33,502,180 20,080,772 Cost of sales (-) 21 (41,998,470) (22,281,875) (30,212,223) (17,860,005) Gross profit 2,662,369 1,671,076 3,289,957 2,220,767 General administrative expenses (-) 22 (570,270) (289,897) (410,883) (214,997) Marketing, selling and distribution expenses (-) 22 (209,507) (123,734) (124,770) (57,605) Research and development expenses (-) 22 (13,289) (6,470) (9,586) (4,676) Other operating income 23 406,725 230,982 269,962 163,922 Other operating expenses (-) 23 (715,395) (149,456) (1,258,202) (1,041,121) Operating profit / (loss) 1,560,633 1,332,501 1,756,478 1,066,290 Income from investment activities 24 119 259 - - Expenses from investment activities (-) 24 - - (6,710) (327) Income/(loss) from investments accounted by equity method 9 109,748 46,676 144,657 86,071
Operating profit before financial income/(expense) 1,670,500 1,379,436 1,894,425 1,152,034
Financial income 25 1,026,957 322,115 2,102,026 1,448,210 Financial expense (-) 25 (2,423,827) (1,117,792) (2,599,434) (1,675,037) Profit/(loss) before tax from continued operations 273,630 583,759 1,397,017 925,207 Tax income / (expense) 249,979 302,145 25,060 110,083 Taxes on income (-) 26 (6,388) (2,966) (38,460) (33,342) Deferred tax income / (expense) 26 256,367 305,111 63,520 143,425 Net profit/(loss) from continued operations 523,609 885,904 1,422,077 1,035,290 Other comprehensive income: Items not to be reclassified to profit or loss 6,446,619 - - - Relvaluation gain/(loss) on property 7,139,764 - - - Share of other comprehensive income accounted for investment using equity method that will be not reclassified to profit or loss 20,831 - - - Revaluation gain/(loss) on property of investments
accounted with using equity method 20,831 - - - Tax effect of other comprehensive income/(loss) not to be reclassified to profit or loss (713,976) - - - Deferred tax income/(expense) (713,976) - - - Items to be reclassified to profit or loss (96,648) 32,919 (440,460) (323,914) Currency translation differences (1,078) (694) - - Share of other comprehensive income accounted for investment using equity method that will be reclassified to profit or loss 6,950 1,610 9,948 7,666 Gain/(loss) from translation of foreign currency of investments accounted for using equity method 6,950 1,610 9,948 7,666 Income/(expense) relating to avoidance of risk of cash flow (124,686) 39,986 (558,276) (408,347) Income/(loss) of avoidance of risk of cash flow (124,686) 39,986 (558,276) (408,347) Tax effect of other comprehensive income/(loss) to be reclassified to profit or loss 22,166 (7,983) 107,868 76,767 Deferred tax income/(expense) 22,166 (7,983) 107,868 76,767 Other comprehensive income/(expense) 6,349,971 32,919 (440,460) (323,914) Total comprehensive income 6,873,580 918,823 981,617 711,376 Distribution of income for the period: Non-controlling interests 28,329 15,466 16,949 8,598 Attributable to equity holders of the parent 495,280 870,438 1,405,128 1,026,692 Distribution of total comprehensive income Non-controlling interests 19,265 14,070 (930) (5,431) Attributable to equity holders of the parent 6,584,315 904,753 982,547 716,807 Earnings (loss) per share from continued operations Earnings per share with nominal value kr. 1 each (kr.) 27 1.98 3.48 5.61 4.10
The accompanying notes form an integral part of these condensed interim consolidated financial statements

TÜRKİYE PETROL RAFİNERİLERİ A.Ş. CONSOLIDATED STATEMENTS OF CHANGES IN EQUITY FOR THE SIX MONTH INTERIM PERIOD ENDED 30 JUNE 2019 (Amounts expressed in thousands of Turkish Lira (“TRY”) unless otherwise indicated.)
3
Accumulated other comprehensive income/(expense)
not to be reclassified to profit or loss
Accumulated other comprehensive income/(expense)
that will be reclassified to profit or loss
Gains/(losses) on valuation
Hedge gains/
(losses)
and remeasurement
Retained earnings
Share of other comprehensive income
of investments accounted for using equity method
that will be not reclassified to profit or loss
Share of other comprehensive income
of investments accounted for using equity method that will be reclassified
to profit or loss
Share capital
Adjustment to share
capital
Gain on revaluation
of properties
Actuarial gains/(losses) arising from
defined benefit plans
Currency
translation differences
Cash flow hedge
gains/(losses)
Net income/
(expense)
Equity holders
of parent
Non controlling
interest
Restricted reserves
Retained earnings
Total equity
Reviewed
1 January 2018 250,419 1,344,243 - (2,211) (1,150) (1,141,847) 180,874 279,668 5,651,805 3,811,546 10,373,347 104,314 10,477,661
Transfers - - - - - - - - 339,393 3,472,153 (3,811,546) - - -
Dividends paid - - - - - - - - (21,975) (3,384,477) - (3,406,452) - (3,406,452)
- Net profit for the period - - - - - - - - - - 1,405,128 1,405,128 16,949 1,422,077
- Other comprehensive income - - - - - - (432,529) 9,948 - - - (422,581) (17,879) (440,460)
Total comprehensive income - - - - - - (432,529) 9,948 - - 1,405,128 982,547 (930) 981,617
-
30 June 2018 250,419 1,344,243 - (2,211) (1,150) - (1,574,376) 190,822 597,086 5,739,481 1,405,128 7,949,442 103,384 8,052,826
Reviewed
1 January 2019 250,419 1,344,243 - 5,021 (1,543) - (2,094,224) 271,357 597,086 5,739,481 3,712,789 9,824,629 121,200 9,945,829
Transfers - - - - - - - - - 3,712,789 (3,712,789) - - - Dividends paid - - - - - - - - (93,743) (3,700,108) - (3,793,851) - (3,793,851) - Net profit for the period - - - - - - - - - - 495,280 495,280 28,329 523,609 - Other comprehensive income - - 6,425,788 - 20,831 (1,078) (93,456) 6,950 - - - 6,359,035 (9,064) 6,349,971 Total comprehensive income - - 6,425,788 - 20,831 (1,078) (93,456) 6,950 - - 495,280 6,854,315 19,265 6,873,580
30 June 2019 250,419 1,344,243 6,425,788 5,021 19,288 (1,078) (2,187,680) 278,307 503,343 5,752,162 495,280 12,885,093 140,465 13,025,558
The accompanying notes form an integral part of these condensed interim consolidated financial statements.
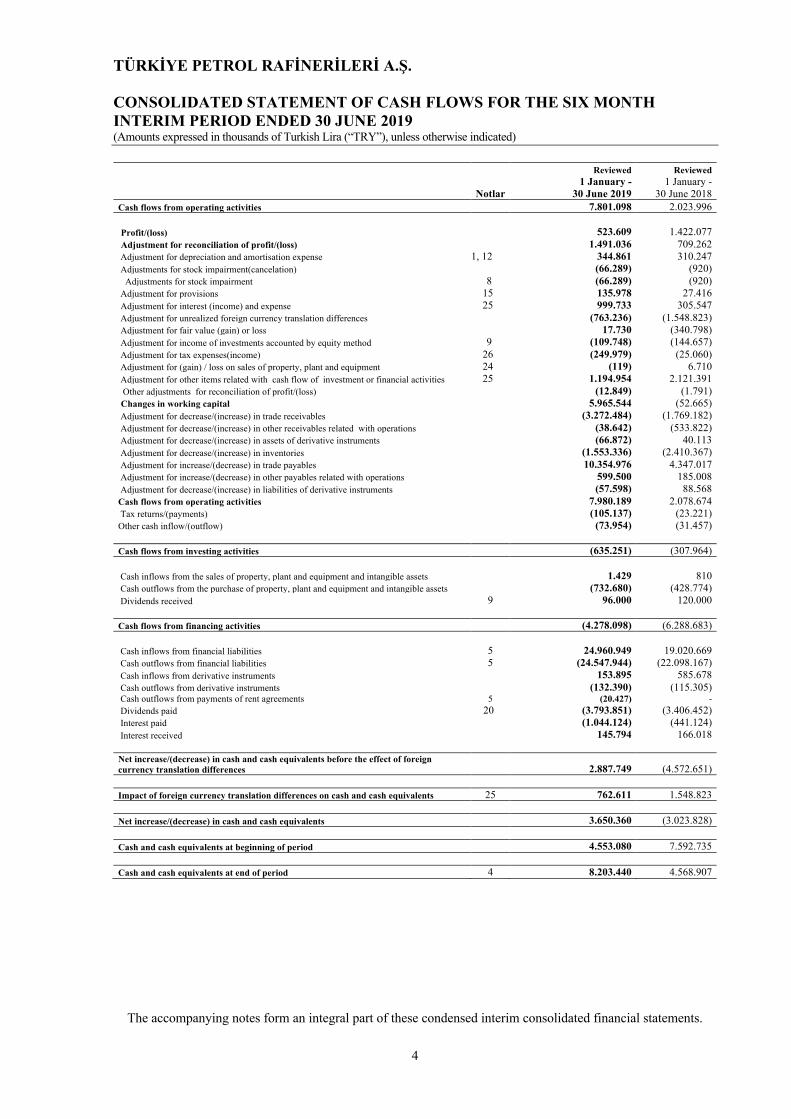
TÜRKİYE PETROL RAFİNERİLERİ A.Ş. CONSOLIDATED STATEMENT OF CASH FLOWS FOR THE SIX MONTH INTERIM PERIOD ENDED 30 JUNE 2019 (Amounts expressed in thousands of Turkish Lira (“TRY”), unless otherwise indicated)
4
Reviewed Reviewed
1 January - 1 January -
Notlar 30 June 2019 30 June 2018
Cash flows from operating activities 7.801.098 2.023.996
Profit/(loss) 523.609 1.422.077
Adjustment for reconciliation of profit/(loss) 1.491.036 709.262
Adjustment for depreciation and amortisation expense 11, 12 344.861 310.247
Adjustments for stock impairment(cancelation) (66.289) (920)
Adjustments for stock impairment 8 (66.289) (920)
Adjustment for provisions 15 135.978 27.416
Adjustment for interest (income) and expense 25 999.733 305.547
Adjustment for unrealized foreign currency translation differences (763.236) (1.548.823)
Adjustment for fair value (gain) or loss 17.730 (340.798)
Adjustment for income of investments accounted by equity method 9 (109.748) (144.657)
Adjustment for tax expenses(income) 26 (249.979) (25.060)
Adjustment for (gain) / loss on sales of property, plant and equipment 24 (119) 6.710
Adjustment for other items related with cash flow of investment or financial activities 25 1.194.954 2.121.391
Other adjustments for reconciliation of profit/(loss) (12.849) (1.791)
Changes in working capital 5.965.544 (52.665)
Adjustment for decrease/(increase) in trade receivables (3.272.484) (1.769.182)
Adjustment for decrease/(increase) in other receivables related with operations (38.642) (533.822)
Adjustment for decrease/(increase) in assets of derivative instruments (66.872) 40.113
Adjustment for decrease/(increase) in inventories (1.553.336) (2.410.367)
Adjustment for increase/(decrease) in trade payables 10.354.976 4.347.017
Adjustment for increase/(decrease) in other payables related with operations 599.500 185.008
Adjustment for decrease/(increase) in liabilities of derivative instruments (57.598) 88.568
Cash flows from operating activities 7.980.189 2.078.674
Tax returns/(payments) (105.137) (23.221)
Other cash inflow/(outflow) (73.954) (31.457)
Cash flows from investing activities (635.251) (307.964)
Cash inflows from the sales of property, plant and equipment and intangible assets 1.429 810
Cash outflows from the purchase of property, plant and equipment and intangible assets (732.680) (428.774)
Dividends received 9 96.000 120.000
Cash flows from financing activities (4.278.098) (6.288.683)
Cash inflows from financial liabilities 5 24.960.949 19.020.669
Cash outflows from financial liabilities 5 (24.547.944) (22.098.167)
Cash inflows from derivative instruments 153.895 585.678
Cash outflows from derivative instruments (132.390) (115.305)
Cash outflows from payments of rent agreements 5 (20.427) -
Dividends paid 20 (3.793.851) (3.406.452)
Interest paid (1.044.124) (441.124)
Interest received 145.794 166.018
Net increase/(decrease) in cash and cash equivalents before the effect of foreign currency translation differences 2.887.749 (4.572.651)
Impact of foreign currency translation differences on cash and cash equivalents 25 762.611 1.548.823
Net increase/(decrease) in cash and cash equivalents 3.650.360 (3.023.828)
Cash and cash equivalents at beginning of period 4.553.080 7.592.735
Cash and cash equivalents at end of period 4 8.203.440 4.568.907
The accompanying notes form an integral part of these condensed interim consolidated financial statements.
TÜRKİYE PETROL RAFİNERİLERİ A.Ş. NOTES TO THE CONDENSED INTERIM CONSOLIDATED FINANCIAL STATEMENTS FOR THE SIX MONTH INTERIM PERIOD ENDED 30 JUNE 2019 (Amounts expressed in thousands of Turkish Lira (“TRY”) unless otherwise indicated.)
5
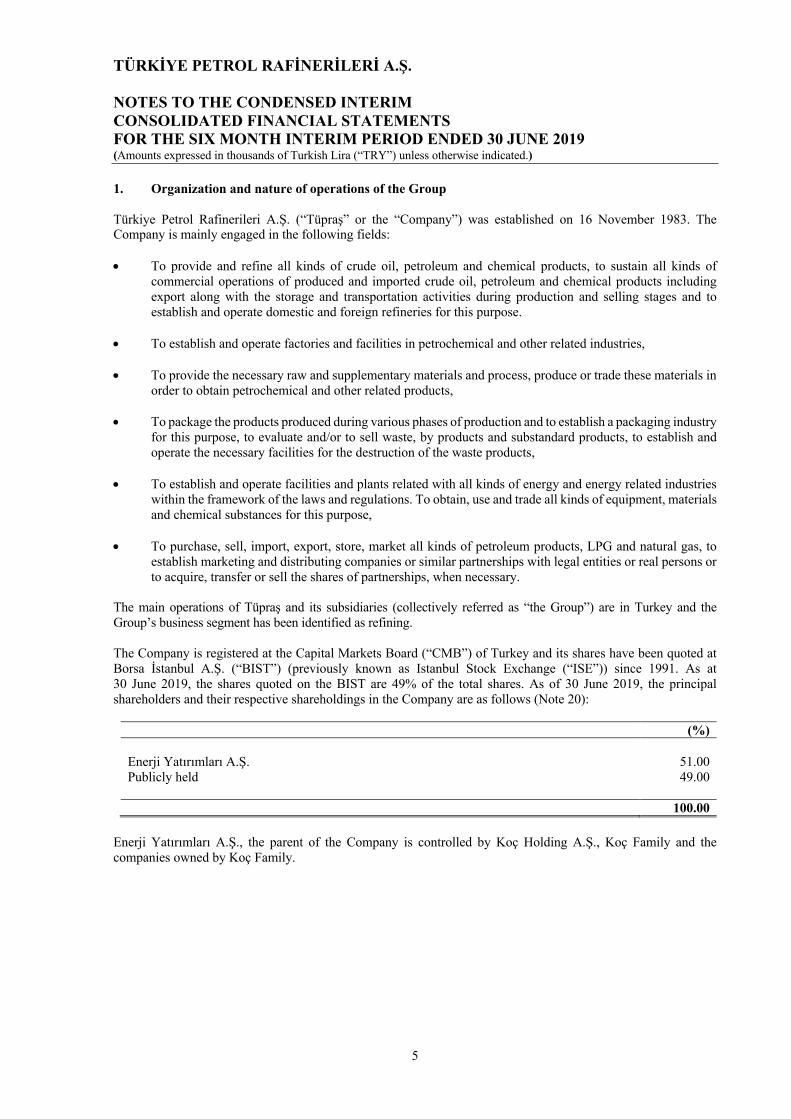
1. Organization and nature of operations of the Group
Türkiye Petrol Rafinerileri A.Ş. (“Tüpraş” or the “Company”) was established on 16 November 1983. The
Company is mainly engaged in the following fields:
• To provide and refine all kinds of crude oil, petroleum and chemical products, to sustain all kinds of
commercial operations of produced and imported crude oil, petroleum and chemical products including
export along with the storage and transportation activities during production and selling stages and to
establish and operate domestic and foreign refineries for this purpose.
• To establish and operate factories and facilities in petrochemical and other related industries,
• To provide the necessary raw and supplementary materials and process, produce or trade these materials in
order to obtain petrochemical and other related products,
• To package the products produced during various phases of production and to establish a packaging industry
for this purpose, to evaluate and/or to sell waste, by products and substandard products, to establish and
operate the necessary facilities for the destruction of the waste products,
• To establish and operate facilities and plants related with all kinds of energy and energy related industries
within the framework of the laws and regulations. To obtain, use and trade all kinds of equipment, materials
and chemical substances for this purpose,
• To purchase, sell, import, export, store, market all kinds of petroleum products, LPG and natural gas, to
establish marketing and distributing companies or similar partnerships with legal entities or real persons or
to acquire, transfer or sell the shares of partnerships, when necessary.
The main operations of Tüpraş and its subsidiaries (collectively referred as “the Group”) are in Turkey and the
Group’s business segment has been identified as refining.
The Company is registered at the Capital Markets Board (“CMB”) of Turkey and its shares have been quoted at
Borsa İstanbul A.Ş. (“BIST”) (previously known as Istanbul Stock Exchange (“ISE”)) since 1991. As at
30 June 2019, the shares quoted on the BIST are 49% of the total shares. As of 30 June 2019, the principal
shareholders and their respective shareholdings in the Company are as follows (Note 20):
(%)
Enerji Yatırımları A.Ş. 51.00
Publicly held 49.00
100.00 Enerji Yatırımları A.Ş., the parent of the Company is controlled by Koç Holding A.Ş., Koç Family and the
companies owned by Koç Family.
TÜRKİYE PETROL RAFİNERİLERİ A.Ş. NOTES TO THE CONDENSED INTERIM CONSOLIDATED FINANCIAL STATEMENTS FOR THE SIX MONTH INTERIM PERIOD ENDED 30 JUNE 2019 (Amounts expressed in thousands of Turkish Lira (“TRY”) unless otherwise indicated.)
6
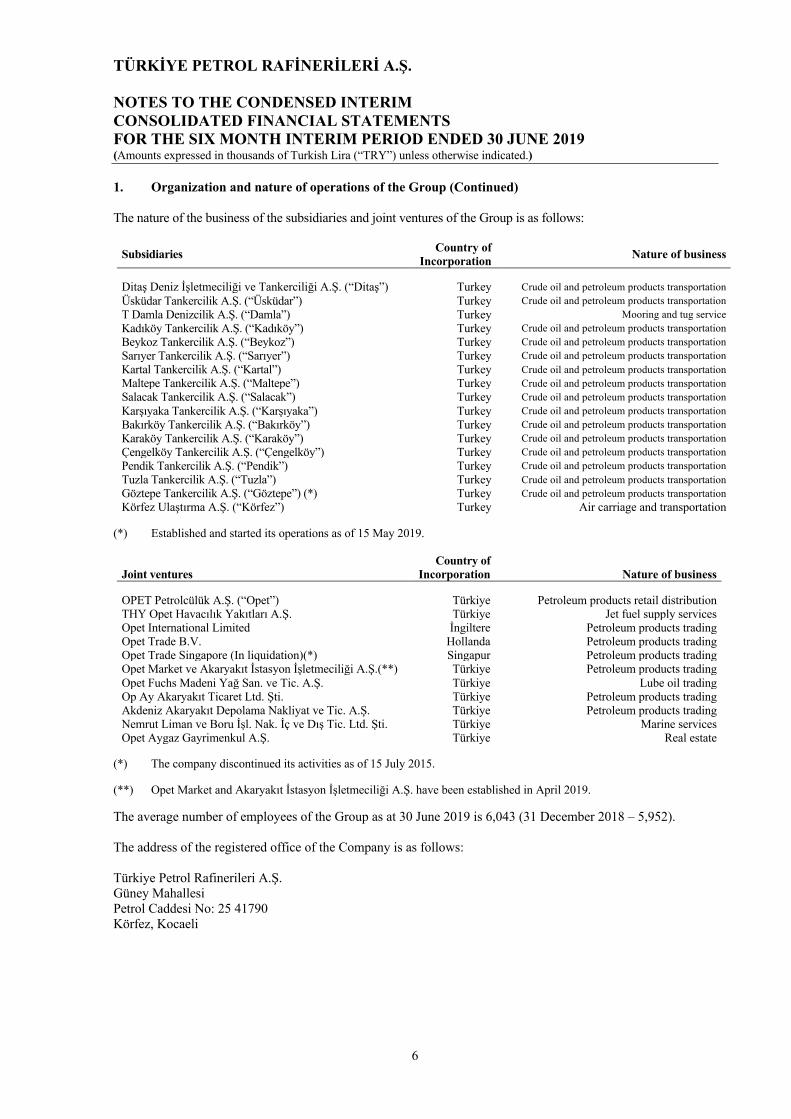
1. Organization and nature of operations of the Group (Continued)
The nature of the business of the subsidiaries and joint ventures of the Group is as follows:
Subsidiaries Country of Incorporation
Nature of business
Ditaş Deniz İşletmeciliği ve Tankerciliği A.Ş. (“Ditaş”) Turkey Crude oil and petroleum products transportation
Üsküdar Tankercilik A.Ş. (“Üsküdar”) Turkey Crude oil and petroleum products transportation
T Damla Denizcilik A.Ş. (“Damla”) Turkey Mooring and tug service
Kadıköy Tankercilik A.Ş. (“Kadıköy”) Turkey Crude oil and petroleum products transportation
Beykoz Tankercilik A.Ş. (“Beykoz”) Turkey Crude oil and petroleum products transportation
Sarıyer Tankercilik A.Ş. (“Sarıyer”) Turkey Crude oil and petroleum products transportation
Kartal Tankercilik A.Ş. (“Kartal”) Turkey Crude oil and petroleum products transportation
Maltepe Tankercilik A.Ş. (“Maltepe”) Turkey Crude oil and petroleum products transportation
Salacak Tankercilik A.Ş. (“Salacak”) Turkey Crude oil and petroleum products transportation
Karşıyaka Tankercilik A.Ş. (“Karşıyaka”) Turkey Crude oil and petroleum products transportation
Bakırköy Tankercilik A.Ş. (“Bakırköy”) Turkey Crude oil and petroleum products transportation
Karaköy Tankercilik A.Ş. (“Karaköy”) Turkey Crude oil and petroleum products transportation
Çengelköy Tankercilik A.Ş. (“Çengelköy”) Turkey Crude oil and petroleum products transportation
Pendik Tankercilik A.Ş. (“Pendik”) Turkey Crude oil and petroleum products transportation
Tuzla Tankercilik A.Ş. (“Tuzla”) Turkey Crude oil and petroleum products transportation
Göztepe Tankercilik A.Ş. (“Göztepe”) (*) Turkey Crude oil and petroleum products transportation
Körfez Ulaştırma A.Ş. (“Körfez”) Turkey Air carriage and transportation
(*) Established and started its operations as of 15 May 2019.
Country of
Joint ventures Incorporation Nature of business
OPET Petrolcülük A.Ş. (“Opet”) Türkiye Petroleum products retail distribution
THY Opet Havacılık Yakıtları A.Ş. Türkiye Jet fuel supply services
Opet International Limited İngiltere Petroleum products trading
Opet Trade B.V. Hollanda Petroleum products trading
Opet Trade Singapore (In liquidation)(*) Singapur Petroleum products trading
Opet Market ve Akaryakıt İstasyon İşletmeciliği A.Ş.(**) Türkiye Petroleum products trading
Opet Fuchs Madeni Yağ San. ve Tic. A.Ş. Türkiye Lube oil trading
Op Ay Akaryakıt Ticaret Ltd. Şti. Türkiye Petroleum products trading
Akdeniz Akaryakıt Depolama Nakliyat ve Tic. A.Ş. Türkiye Petroleum products trading
Nemrut Liman ve Boru İşl. Nak. İç ve Dış Tic. Ltd. Şti. Türkiye Marine services
Opet Aygaz Gayrimenkul A.Ş. Türkiye Real estate
(*) The company discontinued its activities as of 15 July 2015.
(**) Opet Market and Akaryakıt İstasyon İşletmeciliği A.Ş. have been established in April 2019.
The average number of employees of the Group as at 30 June 2019 is 6,043 (31 December 2018 – 5,952).
The address of the registered office of the Company is as follows:
Türkiye Petrol Rafinerileri A.Ş.
Güney Mahallesi
Petrol Caddesi No: 25 41790
Körfez, Kocaeli

TÜRKİYE PETROL RAFİNERİLERİ A.Ş. NOTES TO THE CONDENSED INTERIM CONSOLIDATED FINANCIAL STATEMENTS FOR THE SIX MONTH INTERIM PERIOD ENDED 30 JUNE 2019 (Amount expressed in thousands of Turkish Lira (“TRY”) unless otherwise indicated.)
7
2. Basis of presentation of consolidated financial statements
2.1. Basis of presentation
2.1.1 Financial reporting standards
The consolidated financial statements and disclosures have been prepared in accordance with the communiqué
numbered II-14,1 “Communiqué on the Principles of Financial Reporting In Capital Markets”
(the Communiqué) announced by the Capital Markets Board (“CMB”) on 13 June 2013 which is published on Official
Gazette numbered 28676. In accordance with article 5th of the Communique, companies should apply Turkish
Financial Reporting Standards (“TFRS”) and interpretations regarding these standards as published by the Public
Oversight Accounting and Auditing Standards Authority of Turkey (“POA”).
The consolidated financial statements are presented in accordance with “Announcement regarding with TAS
Taxonomy” which was published on 2 June 2016 by POA and the format and mandatory information
recommended by CMB.
The Group and the group companies established in Turkey maintain their books of account and prepare their statutory
financial statements (“Statutory Financial Statements”) in accordance with rules and principles published by POA,
the Turkish Commercial Code (“TCC”), tax legislation and the Uniform Chart of Accounts issued by the Ministry of
Finance. These consolidated financial statements have been prepared under the historical cost convention except for
derivative instruments that are carried at fair value. These consolidated financial statements are based on the statutory
records with the required adjustments and reclassifications reflected for the purpose of fair presentation in accordance
with the Turkish Financial Reporting Standards.
Functional and presentation currency Items included in the financial statements of each of the Group’s entities are measured using the currency of the
primary economic environment in which the entity operates (‘the functional currency’). The interim condensed
consolidated financial statements are presented in TRY, which is the functional currency of Tüpraş and the
presentation currency of the Group.
2.1.2 Amendments in Turkish Financial Reporting Standards (TFRS) The new standards, amendments and interpretations
The accounting policies adopted in preparation of the interim condensed consolidated financial statements as at
30 June 2019 are consistent with those of the previous financial year, except for the adoption of new and amended
TFRS and IFRIC interpretations effective as of 1 January 2019. The effects of these standards and interpretations
on the Group’s financial position and performance have been disclosed in the related paragraphs.
a. Standards, amendments and interpretations applicable as at 30 June 2019 :
• Amendment to TFRS 9, ‘Financial instruments’; effective from annual periods beginning on or after 1
January 2019. This amendment confirmed two points: (1) that reasonable compensation for prepayments
can be both negative or positive cash flows when considering whether a financial asset solely has cash
flows that are principal and interest and (2) that when a financial liability measured at amortised cost is
modified without this resulting in de-recognition, a gain or loss should be recognised immediately in profit
or loss. The gain or loss is calculated as the difference between the original contractual cash flows and the
modified cash flows discounted at the original effective interest rate. This means that the difference cannot
be spread over the remaining life of the instrument which may be a change in practice from TAS 39. The
amendments do not have a significant impact in the Group’s consolidated financial statement.

TÜRKİYE PETROL RAFİNERİLERİ A.Ş. NOTES TO THE CONDENSED INTERIM CONSOLIDATED FINANCIAL STATEMENTS FOR THE SIX MONTH INTERIM PERIOD ENDED 30 JUNE 2019 (Amounts expressed in thousands of Turkish Lira (“TRY”) unless otherwise indicated.)
8
2. Basis of presentation of consolidated financial statements (Continued) 2.1. Basis of presentation (Continued) 2.1.2 Amendments in Turkish Financial Reporting Standards (TFRS) (Continued)
• Amendment to TAS 28, ‘Investments in associates and joint venture’; effective from annual periods
beginning on or after 1 January 2019. These amendments clarify that companies account for long-term
interests in associate or joint venture to which the equity method is not applied using TFRS 9. The
amendments do not have a significant impact in the Group’s consolidated financial statement.
• TFRS 16, ‘Leases’; effective from annual periods beginning on or after 1 January 2019, with earlier
application permitted if TFRS 15‘Revenue from Contracts with Customers’ is also applied. This standard
replaces the current guidance in TAS 17 and is a farreaching change in accounting by lessees in particular.
Under TAS 17, lessees were required to make a distinction between a finance lease (on balance sheet) and
an operating lease (off balance sheet). TFRS 16 now requires lessees to recognise a lease liability reflecting
future lease payments and a ‘right of use asset’ for virtually all lease contracts. The IASB has included an
optional exemption for certain short-term leases and leases of low-value assets; however, this exemption
can only be applied by lessees. For lessors, the accounting stays almost the same. However, as the IASB
has updated the guidance on the definition of a lease (as well as the guidance on the combination and
separation of contracts), lessors will also be affected by the new standard. At the very least, the new
accounting model for lessees is expected to impact negotiations between lessors and lessees. Under TFRS
16, a contract is, or contains, a lease if the contract conveys the right to control the use of an identified asset
for a period of time in exchange for consideration. The impact of the amendment on The Group’s financial
position and performance has been assessed (Note 2.2).
• TFRS 23, ‘Uncertainty over income tax treatments’; effective from annual periods beginning on or after
1 January 2019. This TFRS clarifies how the recognition and measurement requirements of TAS 12
‘Income taxes’, are applied where there is uncertainty over income tax treatments. The TFRS IC had
clarified previously that TAS 12, not TAS 37 ‘Provisions, contingent liabilities and contingent assets’,
applies to accounting for uncertain income tax treatments. TFRS 23 explains how to recognise and measure
deferred and current income tax assets and liabilities where there is uncertainty over a tax treatment. An
uncertain tax treatment is any tax treatment applied by an entity where there is uncertainty over whether
that treatment will be accepted by the tax authority. For example, a decision to claim a deduction for a
specific expense or not to include a specific item of income in a tax return is an uncertain tax treatment if
its acceptability is uncertain under tax law. TFRS 23 applies to all aspects of income tax accounting where
there is an uncertainty regarding the treatment of an item, including taxable profit or loss, the tax bases of
assets and liabilities, tax losses and credits and tax rates. The impact of the amendments on The Group’s
financial position and performance has been assessed.
• Annual improvements 2015-2017; effective from annual periods beginning on or after
1 January 2019. These amendments include minor changes to:
• TFRS 3, ‘Business combinations’, – a company remeasures its previously held interest in a joint
operation when it obtains control of the business.
• TFRS 11, ‘Joint arrangements’, – a company does not remeasure its previously held interest in a
joint operation when it obtains joint control of the business.
• TAS 12, ‘Income taxes’ – a company accounts for all income tax consequences of dividend
payments in the same way.
• TAS 23, ‘Borrowing costs’ – a company treats as part of general borrowings any borrowing
originally made to develop an asset when the asset is ready for its intended use or sale.
TÜRKİYE PETROL RAFİNERİLERİ A.Ş. NOTES TO THE CONDENSED INTERIM CONSOLIDATED FINANCIAL STATEMENTS FOR THE SIX MONTH INTERIM PERIOD ENDED 30 JUNE 2019 (Amount expressed in thousands of Turkish Lira (“TRY”) unless otherwise indicated.)
9
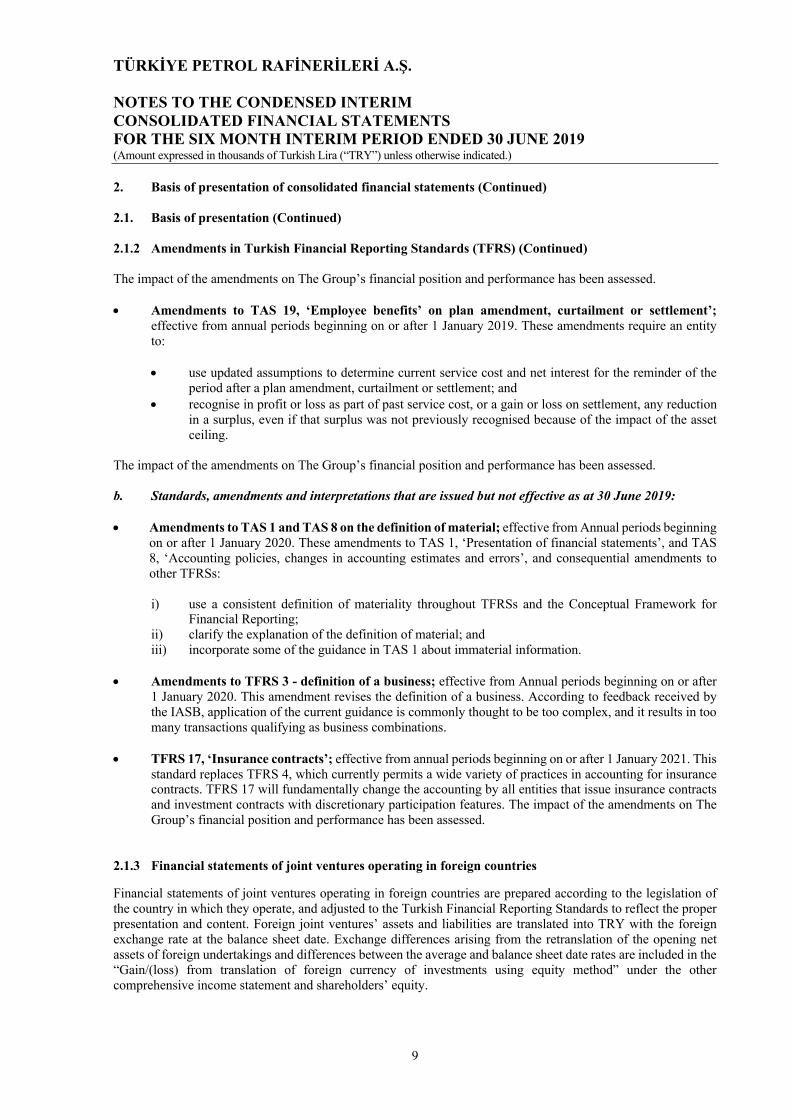
2. Basis of presentation of consolidated financial statements (Continued) 2.1. Basis of presentation (Continued) 2.1.2 Amendments in Turkish Financial Reporting Standards (TFRS) (Continued)
The impact of the amendments on The Group’s financial position and performance has been assessed.
• Amendments to TAS 19, ‘Employee benefits’ on plan amendment, curtailment or settlement’; effective from annual periods beginning on or after 1 January 2019. These amendments require an entity
to:
• use updated assumptions to determine current service cost and net interest for the reminder of the
period after a plan amendment, curtailment or settlement; and
• recognise in profit or loss as part of past service cost, or a gain or loss on settlement, any reduction
in a surplus, even if that surplus was not previously recognised because of the impact of the asset
ceiling.
The impact of the amendments on The Group’s financial position and performance has been assessed.
b. Standards, amendments and interpretations that are issued but not effective as at 30 June 2019:
• Amendments to TAS 1 and TAS 8 on the definition of material; effective from Annual periods beginning
on or after 1 January 2020. These amendments to TAS 1, ‘Presentation of financial statements’, and TAS
8, ‘Accounting policies, changes in accounting estimates and errors’, and consequential amendments to
other TFRSs:
i) use a consistent definition of materiality throughout TFRSs and the Conceptual Framework for
Financial Reporting;
ii) clarify the explanation of the definition of material; and
iii) incorporate some of the guidance in TAS 1 about immaterial information.
• Amendments to TFRS 3 - definition of a business; effective from Annual periods beginning on or after
1 January 2020. This amendment revises the definition of a business. According to feedback received by
the IASB, application of the current guidance is commonly thought to be too complex, and it results in too
many transactions qualifying as business combinations.
• TFRS 17, ‘Insurance contracts’; effective from annual periods beginning on or after 1 January 2021. This
standard replaces TFRS 4, which currently permits a wide variety of practices in accounting for insurance
contracts. TFRS 17 will fundamentally change the accounting by all entities that issue insurance contracts
and investment contracts with discretionary participation features. The impact of the amendments on The
Group’s financial position and performance has been assessed.
2.1.3 Financial statements of joint ventures operating in foreign countries Financial statements of joint ventures operating in foreign countries are prepared according to the legislation of
the country in which they operate, and adjusted to the Turkish Financial Reporting Standards to reflect the proper
presentation and content. Foreign joint ventures’ assets and liabilities are translated into TRY with the foreign
exchange rate at the balance sheet date. Exchange differences arising from the retranslation of the opening net
assets of foreign undertakings and differences between the average and balance sheet date rates are included in the
“Gain/(loss) from translation of foreign currency of investments using equity method” under the other
comprehensive income statement and shareholders’ equity.

TÜRKİYE PETROL RAFİNERİLERİ A.Ş. NOTES TO THE CONDENSED INTERIM CONSOLIDATED FINANCIAL STATEMENTS FOR THE SIX MONTH INTERIM PERIOD ENDED 30 JUNE 2019 (Amounts expressed in thousands of Turkish Lira (“TRY”) unless otherwise indicated.)
10
2. Basis of presentation of consolidated financial statements (Continued) 2.1. Basis of presentation (Continued) 2.1.4 Principles of consolidation
a) The condensed consolidated financial statements for the interim period ended 30 June 2019 have been
prepared in accordance with principles stated on the consolidated financial statements for the year ended
31 December 2018 and include financial statements of Tüpraş, and its Subsidiaries.
b) At 30 June 2019, there are no changes in voting rights or proportion of effective interest on subsidiaries and
joint ventures that are subject to consolidation from the information stated on consolidated financial statements
for the year ended 31 December 2018.
30 June 2019 31 December 2018
Direct and indirect voting right possessed by the
company (%)
Proportion of effective
interest (%)
Direct and indirect voting
right possessed by the
company (%)
Proportion of
effective interest
(%)
Subsidiary
Ditaş 79.98 79.98 79.98 79.98
Üsküdar 79.98 79.98 79.98 79.98
Damla 79.98 79.98 79.98 79.98
Beykoz 79.98 79.98 79.98 79.98
Kadıköy 79.98 79.98 79.98 79.98
Sarıyer 79.98 79.98 79.98 79.98
Kartal 79.98 79.98 79.98 79.98
Maltepe 79.98 79.98 79.98 79.98
Salacak 79.98 79.98 79.98 79.98
Karşıyaka 79.98 79.98 79.98 79.98
Bakırköy 79.98 79.98 79.98 79.98
Karaköy 79.98 79.98 79.98 79.98
Çengelköy 79.98 79.98 79.98 79.98
Pendik 79.98 79.98 79.98 79.98
Tuzla 79.98 79.98 79.98 79.98
Göztepe(*) 79.98 79.98 - -
Körfez 100.00 100.00 100.00 100.00
(*) Established and started its operations as of 15 May 2019.
The statement of financial position and statement of comprehensive income of the subsidiaries are
consolidated on a line-by-line basis and the carrying value of the investment held by the Company is
eliminated against the related equity. Intercompany transactions and balances between the Company and
its subsidiary are eliminated on consolidation. The cost of and the dividends arising from, shares held by
the Company in its subsidiary are eliminated from equity and income for the year, respectively.
c) Joint ventures are companies in which the Group has joint control. Joint control is the contractually agreed
sharing of control. The control, exists only when decisions about the relevant activities require the
unanimous consent of the parties sharing control. The Group’s interest in joint ventures is accounted for
with equity method. Investments accounted by equity method are presented in consolidated statement of
financial position with additions or deductions of changes on share of the Group on net assets of the affiliate
and with deduction of provisions for the decline in the value. The changes of the amount, not reflected on
income or loss of the joint venture, on the equity of the joint venture can requisite an adjustment on the net
book value of the joint venture in proportion of the Group’s share.
TÜRKİYE PETROL RAFİNERİLERİ A.Ş. NOTES TO THE CONDENSED INTERIM CONSOLIDATED FINANCIAL STATEMENTS FOR THE SIX MONTH INTERIM PERIOD ENDED 30 JUNE 2019 (Amount expressed in thousands of Turkish Lira (“TRY”) unless otherwise indicated.)
11
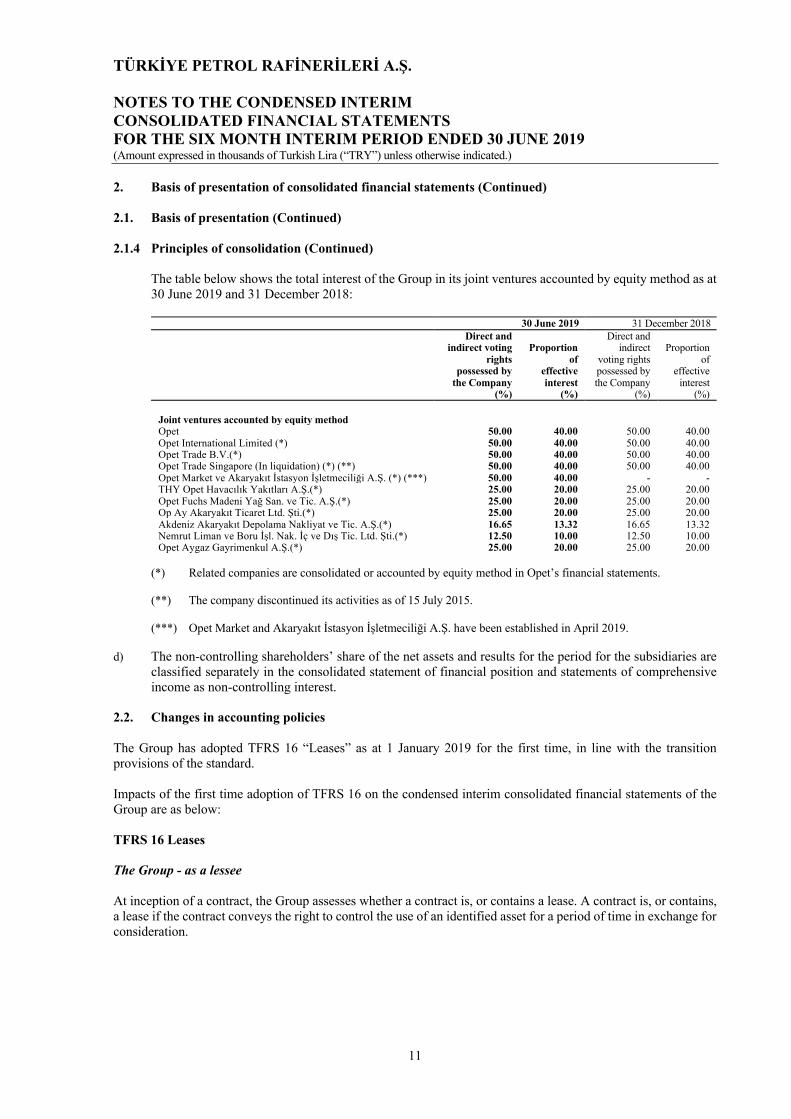
2. Basis of presentation of consolidated financial statements (Continued) 2.1. Basis of presentation (Continued) 2.1.4 Principles of consolidation (Continued)
The table below shows the total interest of the Group in its joint ventures accounted by equity method as at
30 June 2019 and 31 December 2018:
30 June 2019 31 December 2018
Direct and indirect voting
rights possessed by
the Company (%)
Proportion of
effective interest
(%)
Direct and
indirect
voting rights
possessed by
the Company (%)
Proportion
of
effective
interest
(%)
Joint ventures accounted by equity method
Opet 50.00 40.00 50.00 40.00
Opet International Limited (*) 50.00 40.00 50.00 40.00
Opet Trade B.V.(*) 50.00 40.00 50.00 40.00
Opet Trade Singapore (In liquidation) (*) (**) 50.00 40.00 50.00 40.00
Opet Market ve Akaryakıt İstasyon İşletmeciliği A.Ş. (*) (***) 50.00 40.00 - -
THY Opet Havacılık Yakıtları A.Ş.(*) 25.00 20.00 25.00 20.00
Opet Fuchs Madeni Yağ San. ve Tic. A.Ş.(*) 25.00 20.00 25.00 20.00
Op Ay Akaryakıt Ticaret Ltd. Şti.(*) 25.00 20.00 25.00 20.00
Akdeniz Akaryakıt Depolama Nakliyat ve Tic. A.Ş.(*) 16.65 13.32 16.65 13.32
Nemrut Liman ve Boru İşl. Nak. İç ve Dış Tic. Ltd. Şti.(*) 12.50 10.00 12.50 10.00
Opet Aygaz Gayrimenkul A.Ş.(*) 25.00 20.00 25.00 20.00
(*) Related companies are consolidated or accounted by equity method in Opet’s financial statements.
(**) The company discontinued its activities as of 15 July 2015.
(***) Opet Market and Akaryakıt İstasyon İşletmeciliği A.Ş. have been established in April 2019.
d) The non-controlling shareholders’ share of the net assets and results for the period for the subsidiaries are
classified separately in the consolidated statement of financial position and statements of comprehensive
income as non-controlling interest.
2.2. Changes in accounting policies The Group has adopted TFRS 16 “Leases” as at 1 January 2019 for the first time, in line with the transition
provisions of the standard.
Impacts of the first time adoption of TFRS 16 on the condensed interim consolidated financial statements of the
Group are as below:
TFRS 16 Leases The Group - as a lessee
At inception of a contract, the Group assesses whether a contract is, or contains a lease. A contract is, or contains,
a lease if the contract conveys the right to control the use of an identified asset for a period of time in exchange for
consideration.
TÜRKİYE PETROL RAFİNERİLERİ A.Ş. NOTES TO THE CONDENSED INTERIM CONSOLIDATED FINANCIAL STATEMENTS FOR THE SIX MONTH INTERIM PERIOD ENDED 30 JUNE 2019 (Amounts expressed in thousands of Turkish Lira (“TRY”) unless otherwise indicated.)
12
2. Basis of presentation of consolidated financial statements (Continued)
2.2. Changes in accounting policies (Continued)
TFRS 16 Leases (Continued)
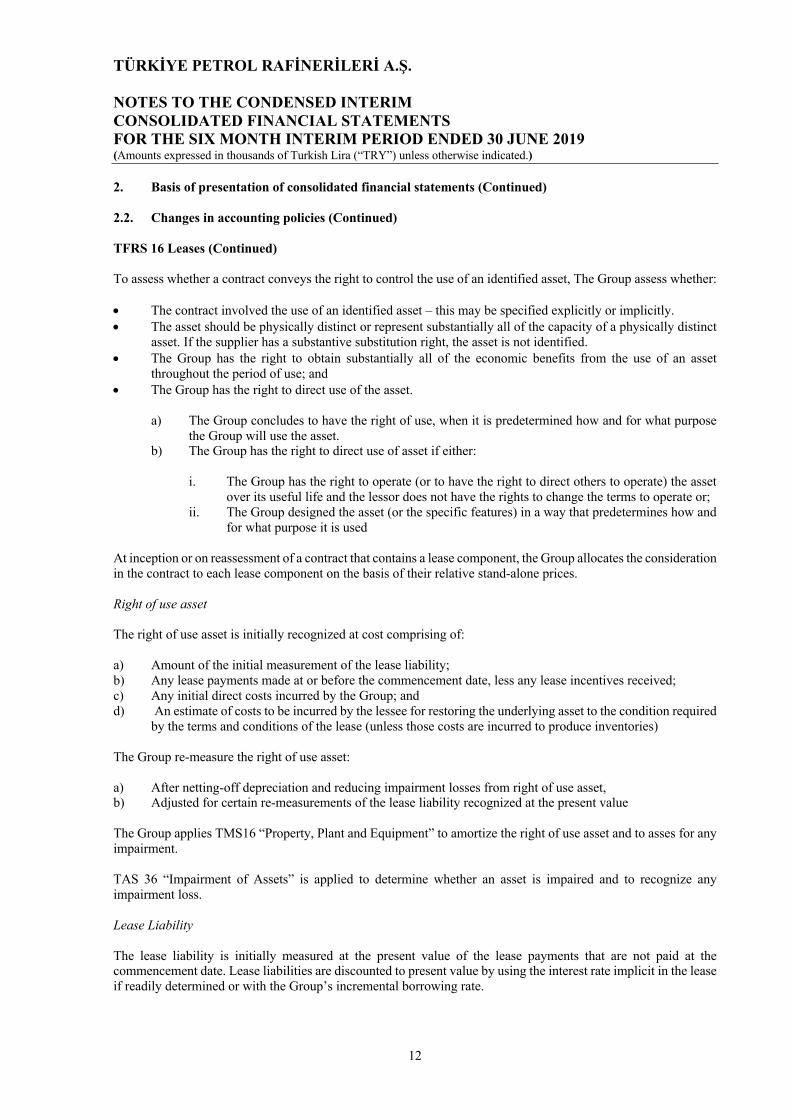
To assess whether a contract conveys the right to control the use of an identified asset, The Group assess whether:
• The contract involved the use of an identified asset – this may be specified explicitly or implicitly.
• The asset should be physically distinct or represent substantially all of the capacity of a physically distinct
asset. If the supplier has a substantive substitution right, the asset is not identified.
• The Group has the right to obtain substantially all of the economic benefits from the use of an asset
throughout the period of use; and
• The Group has the right to direct use of the asset.
a) The Group concludes to have the right of use, when it is predetermined how and for what purpose
the Group will use the asset.
b) The Group has the right to direct use of asset if either:
i. The Group has the right to operate (or to have the right to direct others to operate) the asset
over its useful life and the lessor does not have the rights to change the terms to operate or;
ii. The Group designed the asset (or the specific features) in a way that predetermines how and
for what purpose it is used
At inception or on reassessment of a contract that contains a lease component, the Group allocates the consideration
in the contract to each lease component on the basis of their relative stand-alone prices.
Right of use asset
The right of use asset is initially recognized at cost comprising of:
a) Amount of the initial measurement of the lease liability;
b) Any lease payments made at or before the commencement date, less any lease incentives received;
c) Any initial direct costs incurred by the Group; and
d) An estimate of costs to be incurred by the lessee for restoring the underlying asset to the condition required
by the terms and conditions of the lease (unless those costs are incurred to produce inventories)
The Group re-measure the right of use asset:
a) After netting-off depreciation and reducing impairment losses from right of use asset,
b) Adjusted for certain re-measurements of the lease liability recognized at the present value
The Group applies TMS16 “Property, Plant and Equipment” to amortize the right of use asset and to asses for any
impairment.
TAS 36 “Impairment of Assets” is applied to determine whether an asset is impaired and to recognize any
impairment loss.
Lease Liability
The lease liability is initially measured at the present value of the lease payments that are not paid at the
commencement date. Lease liabilities are discounted to present value by using the interest rate implicit in the lease
if readily determined or with the Group’s incremental borrowing rate.

TÜRKİYE PETROL RAFİNERİLERİ A.Ş. NOTES TO THE CONDENSED INTERIM CONSOLIDATED FINANCIAL STATEMENTS FOR THE SIX MONTH INTERIM PERIOD ENDED 30 JUNE 2019 (Amount expressed in thousands of Turkish Lira (“TRY”) unless otherwise indicated.)
13
2. Basis of presentation of consolidated financial statements (Continued)
2.2. Changes in accounting policies (Continued)
TFRS 16 Leases (Continued)
Lease payments included in the measurement of the lease liability comprise the following:
a) Fixed payments, including in-substance fixed payments;
b) Variable lease payments that depend on an index or a rate, initially measured using the index or rate as the
commencement date,
c) The exercise price under a purchase option that the Group is reasonably certain to exercise, lease payments
in an optional renewable period if the Group is reasonably certain to exercise an extension option, and
penalties for early termination of a lease unless the Group is reasonably certain to terminate early.
After initial recognition, the lease liability is measured:
a) Increasing the carrying amount to reflect interest on lease liability
b) Reducing the carrying amount to reflect the lease payments made and
c) Remeasuring the carrying amount to reflect any reassessment or lease modifications or to reflect revised
in-substance fixed lease payments.
Extension and termination options
In determining the lease liability, the Group considers the extension and termination options. The majority of
extension and termination options held are exercisable both by the group and by the respective lessor. Extension
options are included in the lease term if the lease is reasonably certain to be extended. The group remeasures the
lease term, if a significant event or a significant change in circumstances occurs which affects the initial
assessment.
Variable lease payments
Group’s lease contracts also include variable lease payments which are not in the scope of TFRS 16. Variable
lease payments are recognised in profit or loss in the related period. Exemptions and simplifications Short-term lease payments and payments for leases of low-value assets like IT equipments (mainly printers, laptops
and mobile phones etc.) are not included in the measurement of the lease liabilities in the scope of TFRS 16. Lease
payments of these contracts are continued to be recognised in profit or loss in the related period. The Group applied
a single discount rate to a portfolio of leases which have similar characteristics (asset classes which have similar
remaining rent periods in a similar economic environment)
The Group - as a lessor The Group as a lessor is composed of operating leases. In operating leases, leased assets are classified in the
consolidated balance sheet under investment property, tangible fixed assets or other current assets and the rent
income obtained is reflected to the consolidated income statement in equal amounts during the leasing period.
Rental income is recognized on a straight-line basis over the period of the lease in consolidated income statement.
TÜRKİYE PETROL RAFİNERİLERİ A.Ş. NOTES TO THE CONDENSED INTERIM CONSOLIDATED FINANCIAL STATEMENTS FOR THE SIX MONTH INTERIM PERIOD ENDED 30 JUNE 2019 (Amounts expressed in thousands of Turkish Lira (“TRY”) unless otherwise indicated.)
14
2. Basis of presentation of consolidated financial statements (Continued)
2.2. Changes in accounting policies (Continued) TFRS 16 Leases (Continued) First time adoption of TFRS 16 Leases The Group has applied TFRS 16 “Leases”, which replaces TAS 17, for the effective period beginning on 1 January
2019. The cumulative impact of applying TFRS 16 is accounted in the condensed interim consolidated financial
statements retrospectively (“cumulative impact approach”) at the start of the current accounting period. The
simplified transition approach of the related standard does not require a restatement in the comparative periods or
in the retained earnings.
With the transition to TFRS 16 “Leases”, a “lease liability” is recognized in the condensed interim consolidated
financial statements for the lease contracts which were previously measured under TAS 17 as operational leases.
At transition, lease liabilities are measured at the net present value of the remaining lease payments, discounted at
the Group’s incremental borrowing rate on the effective transition date. The Group measured right-of-use assets
at an amount equal to the lease liability (adjusted by the amount of any prepaid or accrued lease payments) under
TFRS 16 simplified transition approach.
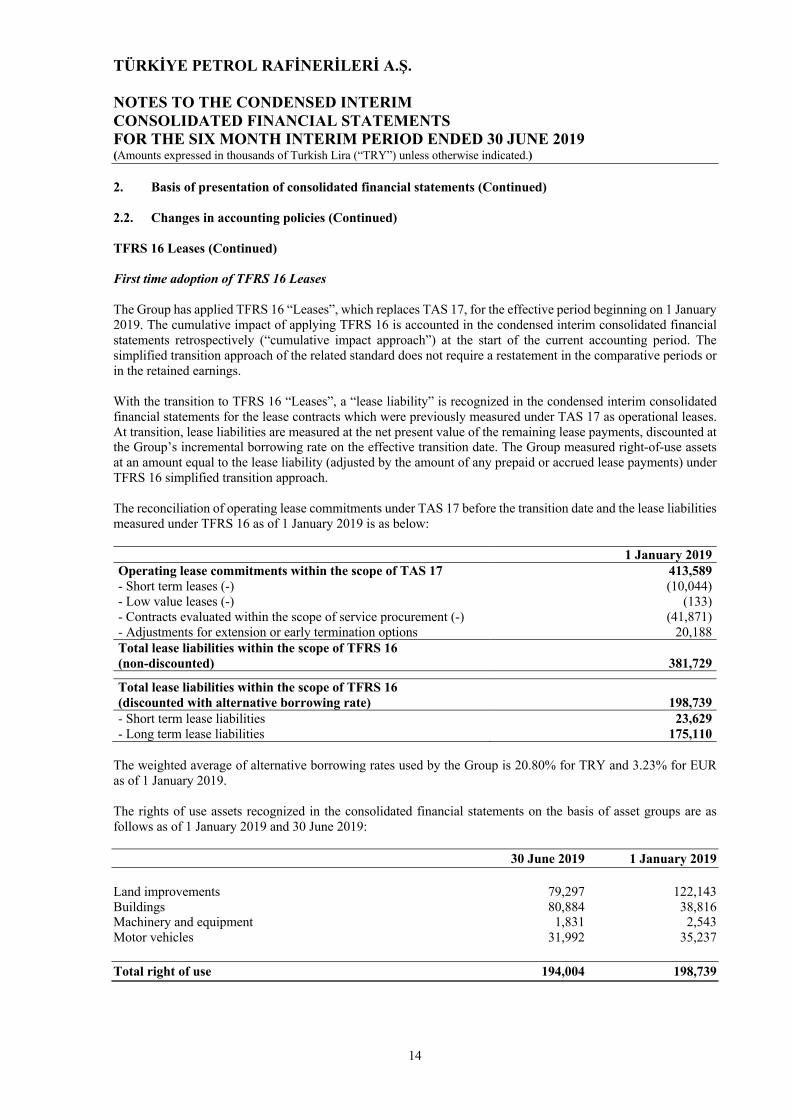
The reconciliation of operating lease commitments under TAS 17 before the transition date and the lease liabilities
measured under TFRS 16 as of 1 January 2019 is as below:
1 January 2019 Operating lease commitments within the scope of TAS 17 413,589 - Short term leases (-) (10,044)
- Low value leases (-) (133)
- Contracts evaluated within the scope of service procurement (-) (41,871)
- Adjustments for extension or early termination options 20,188
Total lease liabilities within the scope of TFRS 16 (non-discounted) 381,729
Total lease liabilities within the scope of TFRS 16 (discounted with alternative borrowing rate) 198,739 - Short term lease liabilities 23,629 - Long term lease liabilities 175,110
The weighted average of alternative borrowing rates used by the Group is 20.80% for TRY and 3.23% for EUR
as of 1 January 2019.
The rights of use assets recognized in the consolidated financial statements on the basis of asset groups are as
follows as of 1 January 2019 and 30 June 2019:
30 June 2019 1 January 2019
Land improvements 79,297 122,143
Buildings 80,884 38,816
Machinery and equipment 1,831 2,543
Motor vehicles 31,992 35,237
Total right of use 194,004 198,739
TÜRKİYE PETROL RAFİNERİLERİ A.Ş. NOTES TO THE CONDENSED INTERIM CONSOLIDATED FINANCIAL STATEMENTS FOR THE SIX MONTH INTERIM PERIOD ENDED 30 JUNE 2019 (Amount expressed in thousands of Turkish Lira (“TRY”) unless otherwise indicated.)
15
2. Basis of presentation of consolidated financial statements (Continued)
2.2. Changes in accounting policies (Continued) Property, plant and equipment
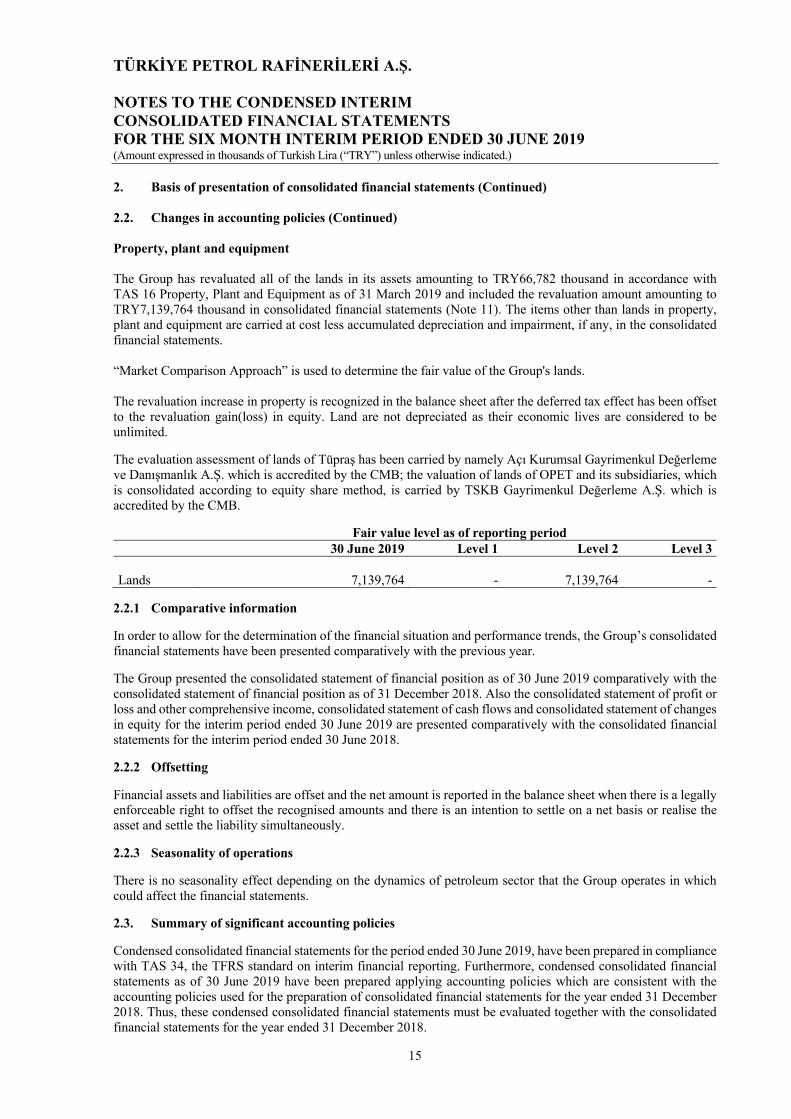
The Group has revaluated all of the lands in its assets amounting to TRY66,782 thousand in accordance with
TAS 16 Property, Plant and Equipment as of 31 March 2019 and included the revaluation amount amounting to
TRY7,139,764 thousand in consolidated financial statements (Note 11). The items other than lands in property,
plant and equipment are carried at cost less accumulated depreciation and impairment, if any, in the consolidated
financial statements.
“Market Comparison Approach” is used to determine the fair value of the Group's lands.
The revaluation increase in property is recognized in the balance sheet after the deferred tax effect has been offset
to the revaluation gain(loss) in equity. Land are not depreciated as their economic lives are considered to be
unlimited.
The evaluation assessment of lands of Tüpraş has been carried by namely Açı Kurumsal Gayrimenkul Değerleme
ve Danışmanlık A.Ş. which is accredited by the CMB; the valuation of lands of OPET and its subsidiaries, which
is consolidated according to equity share method, is carried by TSKB Gayrimenkul Değerleme A.Ş. which is
accredited by the CMB.
Fair value level as of reporting period 30 June 2019 Level 1 Level 2 Level 3
Lands 7,139,764 - 7,139,764 -
2.2.1 Comparative information
In order to allow for the determination of the financial situation and performance trends, the Group’s consolidated
financial statements have been presented comparatively with the previous year.
The Group presented the consolidated statement of financial position as of 30 June 2019 comparatively with the
consolidated statement of financial position as of 31 December 2018. Also the consolidated statement of profit or
loss and other comprehensive income, consolidated statement of cash flows and consolidated statement of changes
in equity for the interim period ended 30 June 2019 are presented comparatively with the consolidated financial
statements for the interim period ended 30 June 2018.
2.2.2 Offsetting
Financial assets and liabilities are offset and the net amount is reported in the balance sheet when there is a legally
enforceable right to offset the recognised amounts and there is an intention to settle on a net basis or realise the
asset and settle the liability simultaneously.
2.2.3 Seasonality of operations There is no seasonality effect depending on the dynamics of petroleum sector that the Group operates in which
could affect the financial statements.
2.3. Summary of significant accounting policies
Condensed consolidated financial statements for the period ended 30 June 2019, have been prepared in compliance
with TAS 34, the TFRS standard on interim financial reporting. Furthermore, condensed consolidated financial
statements as of 30 June 2019 have been prepared applying accounting policies which are consistent with the
accounting policies used for the preparation of consolidated financial statements for the year ended 31 December
2018. Thus, these condensed consolidated financial statements must be evaluated together with the consolidated
financial statements for the year ended 31 December 2018.
TÜRKİYE PETROL RAFİNERİLERİ A.Ş. NOTES TO THE CONDENSED INTERIM CONSOLIDATED FINANCIAL STATEMENTS FOR THE SIX MONTH INTERIM PERIOD ENDED 30 JUNE 2019 (Amounts expressed in thousands of Turkish Lira (“TRY”) unless otherwise indicated.)
16
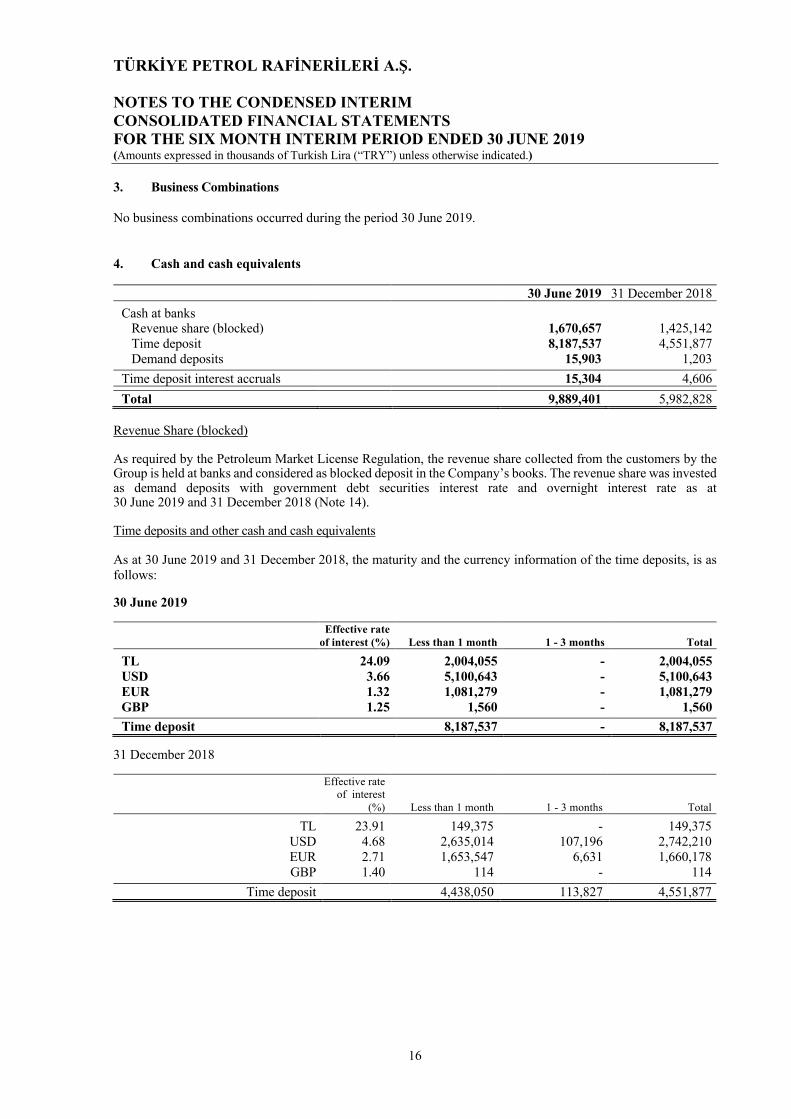
3. Business Combinations No business combinations occurred during the period 30 June 2019.
4. Cash and cash equivalents
30 June 2019 31 December 2018
Cash at banks
Revenue share (blocked) 1,670,657 1,425,142
Time deposit 8,187,537 4,551,877
Demand deposits 15,903 1,203
Time deposit interest accruals 15,304 4,606
Total 9,889,401 5,982,828
Revenue Share (blocked)
As required by the Petroleum Market License Regulation, the revenue share collected from the customers by the
Group is held at banks and considered as blocked deposit in the Company’s books. The revenue share was invested
as demand deposits with government debt securities interest rate and overnight interest rate as at
30 June 2019 and 31 December 2018 (Note 14).
Time deposits and other cash and cash equivalents
As at 30 June 2019 and 31 December 2018, the maturity and the currency information of the time deposits, is as
follows:
30 June 2019
Effective rate of interest (%) Less than 1 month 1 - 3 months Total
TL 24.09 2,004,055 - 2,004,055 USD 3.66 5,100,643 - 5,100,643 EUR 1.32 1,081,279 - 1,081,279 GBP 1.25 1,560 - 1,560
Time deposit 8,187,537 - 8,187,537 31 December 2018
Effective rate
of interest
(%) Less than 1 month 1 - 3 months Total
TL 23.91 149,375 - 149,375
USD 4.68 2,635,014 107,196 2,742,210
EUR 2.71 1,653,547 6,631 1,660,178
GBP 1.40 114 - 114
Time deposit 4,438,050 113,827 4,551,877
TÜRKİYE PETROL RAFİNERİLERİ A.Ş. NOTES TO THE CONDENSED INTERIM CONSOLIDATED FINANCIAL STATEMENTS FOR THE SIX MONTH INTERIM PERIOD ENDED 30 JUNE 2019 (Amount expressed in thousands of Turkish Lira (“TRY”) unless otherwise indicated.)
17
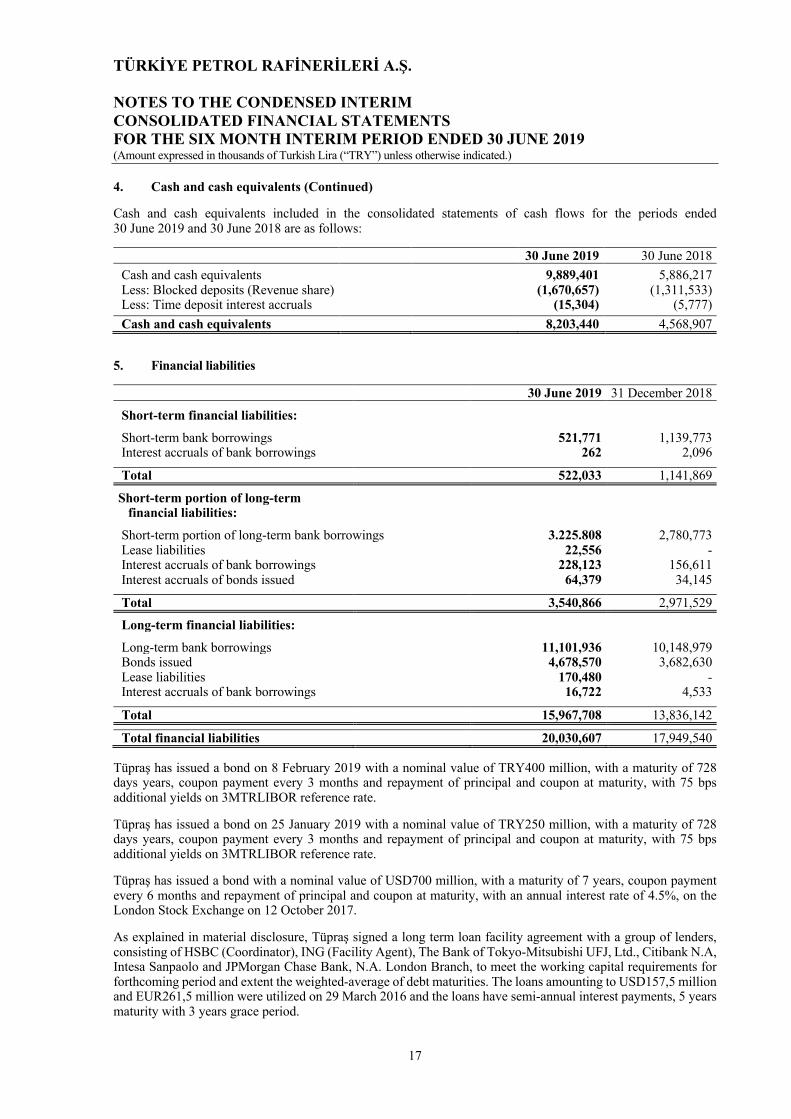
4. Cash and cash equivalents (Continued)
Cash and cash equivalents included in the consolidated statements of cash flows for the periods ended
30 June 2019 and 30 June 2018 are as follows:
30 June 2019 30 June 2018
Cash and cash equivalents 9,889,401 5,886,217
Less: Blocked deposits (Revenue share) (1,670,657) (1,311,533)
Less: Time deposit interest accruals (15,304) (5,777)
Cash and cash equivalents 8,203,440 4,568,907
5. Financial liabilities
30 June 2019 31 December 2018
Short-term financial liabilities:
Short-term bank borrowings 521,771 1,139,773
Interest accruals of bank borrowings 262 2,096
Total 522,033 1,141,869
Short-term portion of long-term
financial liabilities:
Short-term portion of long-term bank borrowings 3.225.808 2,780,773
Lease liabilities 22,556 -
Interest accruals of bank borrowings 228,123 156,611
Interest accruals of bonds issued 64,379 34,145
Total 3,540,866 2,971,529
Long-term financial liabilities:
Long-term bank borrowings 11,101,936 10,148,979
Bonds issued 4,678,570 3,682,630
Lease liabilities 170,480 -
Interest accruals of bank borrowings 16,722 4,533
Total 15,967,708 13,836,142
Total financial liabilities 20,030,607 17,949,540
Tüpraş has issued a bond on 8 February 2019 with a nominal value of TRY400 million, with a maturity of 728
days years, coupon payment every 3 months and repayment of principal and coupon at maturity, with 75 bps
additional yields on 3MTRLIBOR reference rate.
Tüpraş has issued a bond on 25 January 2019 with a nominal value of TRY250 million, with a maturity of 728
days years, coupon payment every 3 months and repayment of principal and coupon at maturity, with 75 bps
additional yields on 3MTRLIBOR reference rate.
Tüpraş has issued a bond with a nominal value of USD700 million, with a maturity of 7 years, coupon payment
every 6 months and repayment of principal and coupon at maturity, with an annual interest rate of 4.5%, on the
London Stock Exchange on 12 October 2017.
As explained in material disclosure, Tüpraş signed a long term loan facility agreement with a group of lenders,
consisting of HSBC (Coordinator), ING (Facility Agent), The Bank of Tokyo-Mitsubishi UFJ, Ltd., Citibank N.A,
Intesa Sanpaolo and JPMorgan Chase Bank, N.A. London Branch, to meet the working capital requirements for
forthcoming period and extent the weighted-average of debt maturities. The loans amounting to USD157,5 million
and EUR261,5 million were utilized on 29 March 2016 and the loans have semi-annual interest payments, 5 years
maturity with 3 years grace period.

TÜRKİYE PETROL RAFİNERİLERİ A.Ş. NOTES TO THE CONDENSED INTERIM CONSOLIDATED FINANCIAL STATEMENTS FOR THE SIX MONTH INTERIM PERIOD ENDED 30 JUNE 2019 (Amounts expressed in thousands of Turkish Lira (“TRY”) unless otherwise indicated.)
18
5. Financial liabilities (Continued)
In 2011, Tüpraş has signed three loan agreements in order to finance Residuum Upgrading Project (“RUP”) and
further to the agreements the loans amounting to USD1,998 million were utilized between 2011 and 2015 for credit
insurance payments and capital expenditures. According to financing package loan was insured by SACE and
CESCE have 12 years to maturity also there will be no principal and interest payment in first 4 years. The third
loan has 7 years to maturity and there will be no principal payment in the first four years. The repayment of the
loans has started in 2015 and as at 30 June 2019 the outstanding amount of the loans is USD860 million
(31 December 2018 - USD954 million).
Foreign currency balances and effective interest rates for the short and long-term financial liabilities as at
30 June 2019 and 31 December 2018 are as follows:
30 June 2019 Effective interest rate
(%) Original
Currency Thousand
TRY
Short-term financial liabilities:
USD borrowings 3.19 50,000,000 287,755 TRY borrowings (*) 24.25 234,015,516 234,016
Interest accruals 262
Total short-term financial liabilities 522,033
Long-term portion of long-term financial liabilities:
USD borrowings 4.29 293,713,197 1,690,349 EUR borrowings 2.02 113,369,727 742,652 TRY borrowings 20.34 792,807,473 792,807 GBP lease liabilities 4.16 158,397 1,154 EUR lease liabilities 3.22 1,350,075 8,844 TRY lease liabilities 21.53 12,558,493 12,558
3,248,364
Interest accruals 292,502
Total short-term portion long-term financial liabilities - 3,540,866
Long-term financial liabilities:
USD borrowings 4.58 1,074,429,538 6,183,450 USD bonds issued 4.55 700,000,000 4,028,570 EUR borrowings 1.89 117,798,227 771,661 TRY borrowings 24.44 4,146,825,397 4,146,825 TRY bonds issued 26.34 650,000,000 650,000 GBP lease liabilities 4.16 1,160,385 8,454 EUR lease liabilities 3.19 7,666,095 50,218 TRY lease liabilities 21.84 111,808,173 111,808
15,950,986
Interest accruals 16,722
Total long-term financial liabilities 15,967,708
(*) Banks provide interest-free loans to the Group for the payment of SCT, Customs and Social Security debts amounting to
TRY181,016 thousand as of 30 June 2019 (31 December 2018 - TRY245,028 thousand).

TÜRKİYE PETROL RAFİNERİLERİ A.Ş. NOTES TO THE CONDENSED INTERIM CONSOLIDATED FINANCIAL STATEMENTS FOR THE SIX MONTH INTERIM PERIOD ENDED 30 JUNE 2019 (Amount expressed in thousands of Turkish Lira (“TRY”) unless otherwise indicated.)
19
5. Financial liabilities (Continued) 31 December 2018
Effective interest rate Original Thousand
(%) currency TRY
Short-term financial liabilities:
USD borrowings 3.83 160,000,000 841,745
TRY borrowings 24.25 298,027,981 298,028
Interest accruals 2,096
Total short-term financial liabilities 1,141,869
Short-term portion of long-term
financial liabilities:
USD borrowings 4.34 303,932,787 1,598,959
EUR borrowings 2.07 117,138,055 706,108
TRY borrowings 18.80 475,705,563 475,706
Total 2,780,773
Interest accruals 190,756
Total short-term portion of long-term financial liabilities 2,971,529
Long-term financial liabilities:
USD borrowings 4.36 1,194,244,687 6,282,802
USD bonds issued 4.55 700,000,000 3,682,630
EUR borrowings 2.05 174,435,583 1,051,498
TRY borrowings 24.11 2,814,678,778 2,814,679
13,831,609
Interest accruals 4,533
Total long-term financial liabilities 13,836,142
As at 30 June 2019 and 31 December 2018, the redemption schedule of long-term bank borrowings is as follows:
30 June 2019 31 December 2018
1-2 years 7,488,395 4,188,207
2-3 years 1,580,320 2,860,518
3-4 years 1,505,957 1,349,307
4-5 years 966,214 1,347,878
Over 5 years 4,426,822 4,090,232
Total 15,967,708 13,836,142

TÜRKİYE PETROL RAFİNERİLERİ A.Ş. NOTES TO THE CONDENSED INTERIM CONSOLIDATED FINANCIAL STATEMENTS FOR THE SIX MONTH INTERIM PERIOD ENDED 30 JUNE 2019 (Amounts expressed in thousands of Turkish Lira (“TRY”) unless otherwise indicated.)
20
5. Financial liabilities (Continued)
The movement of borrowings as of 30 June 2019 and 30 June 2018 is as follows:
2019 2018
1 January 17,949,540 15,050,984
New financial borrowings 24,960,949 19,020,669
Principal payments (24,547,944) (22,098,167)
Increase due to lease liabilities 209,452 -
Decrease due to payment of lease liabilities (20.427) -
Changes in interest accruals 112,101 25,095
Changes in foreign exchange rates 1,366,936 2,810,951
30 June 20,030,607 14,809,532
6. Trade receivables and payables Short-term trade receivables:
30 June 2019 31 December 2018
Trade receivables 7,035,950 4,327,765
Due from related parties (Note 28) 1,695,704 1,132,117
Doubtful trade receivables 5,444 4,740
Other trade receivables 16 21
Less: Unearned credit finance income (31,747) (31,165)
Less: Provision for doubtful receivables (5,444) (4,740)
Total short-term trade receivables (net) 8,699,923 5,428,738
Tüpraş discounts the domestic receivables by using domestic government bonds and foreign receivables by using
monthly libor rates.
As at 30 June 2019, Tüpraş has offsetted TRY600,000 thousand (31 December 2018 - TRY2,232,000 thousand)
from trade receivables that are collected from factoring companies as part of the irrevocable factoring.
Movement of the provision for doubtful receivables for the periods ended 30 June 2019 and 2018 is as follows:
2019 2018
1 January 4,740 3,184
Charge for the period 717 1,439
Payments during the period (13) (264)
30 June 5,444 4,359
Short-term trade payables:
30 June 2019 31 December 2018
Trade payables 17,609,453 7,425,166
Due to related parties (Note 28) 247,785 77,096
Less: Unrealised credit finance charges (27,251) (6,121)
Total short term trade payables (net) 17,829,987 7,496,141
Tüpraş discounts short-term trade payables by using monthly libor rates.
TÜRKİYE PETROL RAFİNERİLERİ A.Ş. NOTES TO THE CONDENSED INTERIM CONSOLIDATED FINANCIAL STATEMENTS FOR THE SIX MONTH INTERIM PERIOD ENDED 30 JUNE 2019 (Amount expressed in thousands of Turkish Lira (“TRY”) unless otherwise indicated.)
21
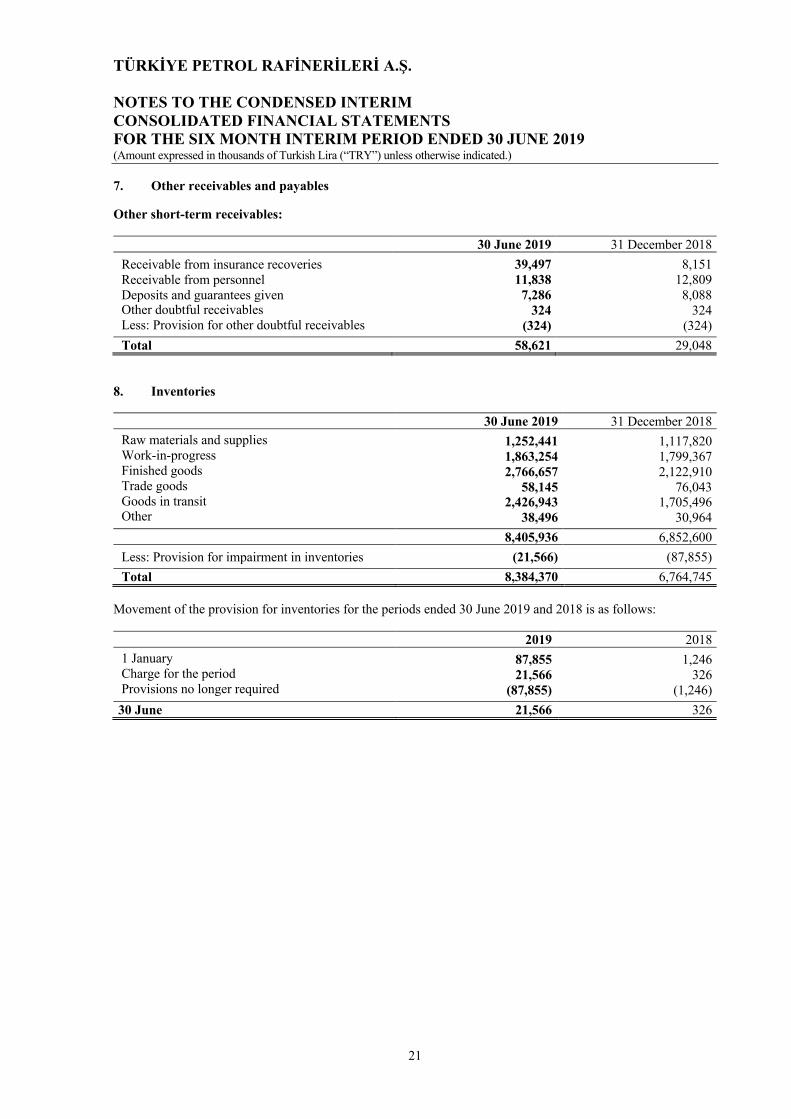
7. Other receivables and payables
Other short-term receivables: 30 June 2019 31 December 2018
Receivable from insurance recoveries 39,497 8,151
Receivable from personnel 11,838 12,809
Deposits and guarantees given 7,286 8,088
Other doubtful receivables 324 324
Less: Provision for other doubtful receivables (324) (324)
Total 58,621 29,048
8. Inventories 30 June 2019 31 December 2018
Raw materials and supplies 1,252,441 1,117,820
Work-in-progress 1,863,254 1,799,367
Finished goods 2,766,657 2,122,910
Trade goods 58,145 76,043
Goods in transit 2,426,943 1,705,496
Other 38,496 30,964
8,405,936 6,852,600
Less: Provision for impairment in inventories (21,566) (87,855)
Total 8,384,370 6,764,745
Movement of the provision for inventories for the periods ended 30 June 2019 and 2018 is as follows:
2019 2018
1 January 87,855 1,246
Charge for the period 21,566 326
Provisions no longer required (87,855) (1,246)
30 June 21,566 326

TÜRKİYE PETROL RAFİNERİLERİ A.Ş. NOTES TO THE CONDENSED INTERIM CONSOLIDATED FINANCIAL STATEMENTS FOR THE SIX MONTH INTERIM PERIOD ENDED 30 JUNE 2019 (Amounts expressed in thousands of Turkish Lira (“TRY”) unless otherwise indicated.)
22
9. Investments accounted for using the equity method
30 June 2019 31 December 2018
Participation share (%) Amount Participation share (%) Amount
OPET Petrolcülük A.Ş. 40.00 1,307,863 40.00 1,266,334
1,307,863 1,266,334
The goodwill amounting to TRY189,073 thousand arising from the purchase of Opet shares on 28 December 2006
were classified on the investments accounted for using the equity method in the financial statements.
The movement in the investments accounted for using the equity method during the period ended
30 June 2019 and 2018 is as follows:
2019 2018
1 January 1,266,334 1,134,364
Investments accounted for using the equity method;
Shares in current year profit 109,748 144,657
Dividend payment (96,000) (120,000)
Gain on revaluation of property 20,831 -
Currency translation differences 6,950 9,948
30 June 1,307,863 1,168,969
Consolidated summary financial statements of investments accounted for using the equity method
(before Group’s effective interest) are as follows:
30 June 2019 31 December 2018
Current assets 5,514,818
4,948,159
Non-current assets 3,486,250
2,963,133
Total assets 9,001,068 7,911,292
Short term liabilities 4,306,183
3,282,386
Long term liabilities 1,897,911
1,935,753
Equity 2,796,974
2,693,153
Total liabilities 9,001,068 7,911,292
1 January - 1 April - 1 January - 1 April -
30 June 2019 30 June 2019 30 June 2018 30 June 2018
Sales (net) 21,323,824 11,744,867 19,065,371 10,781,175
Gross profit 941,317 490,756 965,035 556,692
Operating profit 459,261 252,679 546,096 348,026
Net income for the period 274,370 116,690 361,643 215,179
10. Investment property
Investment properties have been reclassified to lands as of 31 March 2019 due to absence of rent income purpose
and revaluated together with lands (31 December 2018 - TRY4,621 thousand). As of 31 December 2018, the fair
value of the investment property has been determined as TRY156,767 thousand as a result of fair value
assessments.

TÜRKİYE PETROL RAFİNERİLERİ A.Ş. NOTES TO THE CONDENSED INTERIM CONSOLIDATED FINANCIAL STATEMENTS FOR THE SIX MONTH INTERIM PERIOD ENDED 30 JUNE 2019 (Amount expressed in thousands of Turkish Lira (“TRY”) unless otherwise indicated.)
23
11. Property, plant and equipment The movements in property, plant and equipment and related depreciation expenses as of 30 June 2019 and 2018 are as follows:
1 January 2019
Gain on revaluation of
property
Currency translation differences Additions Transfers Disposals 30 June 2019
Cost:
Lands 62,161 7,139,764 - - 4,621 - 7,206,546 Land improvements 3,721,772 - - - 6,019 - 3,727,791 Buildings 789,073 - - - 624 (17) 789,680 Machinery and equipment 12,657,231 - 665 281 (63,923) (305) 12,593,949 Motor vehicles 1,249,363 - - 331,061 - (1) 1,580,423 Furniture and fixtures 128,559 - - 1,146 (18,267) (2,238) 109,200 Construction in progress 339,919 - - 514,868 75,547 - 930,334 Special costs 1,070 - - 2,965 - (1,276) 2,759 Other tangible assets 4,057 - - 23 - - 4,080
18,953,205 7,139,764 665 850,344 4,621 (3,837) 26,944,762
Accumulated depreciation:
Land improvements (1,456,256) - - (77,011) (2,230) - (1,535,497) Buildings (210,688) - - (8,564) (8) 14 (219,246) Machinery and equipment (4,611,075) - (40) (199,777) (13,462) 293 (4,824,061) Motor vehicles (252,335) - - (24,831) - - (277,166) Furniture and fixtures (81,852) - - (7,137) 15,700 2,070 (71,219) Special costs (44) - - (490) - 150 (384) Other tangible assets (1,788) - - (142) - - (1,930)
(6,614,038) - (40) (317,952) - 2,527 (6,929,503)
Net book value 12,339,167 20,015,259
1 January 2018 Additions Transfers Disposals 30 June 2018
Cost:
Lands 48,814 - 17,700 - 66,514
Land improvements 3,645,079 - 4,481 (3) 3,649,557
Buildings 771,147 - 276 - 771,423
Machinery and equipment 12,001,323 77 29,277 (13,355) 12,017,322
Motor vehicles 1,221,669 7,294 9,101 (230) 1,237,834
Furniture and fixtures 134,130 338 5,985 (1,012) 139,441
Construction in progress 500,802 297,926 (70,822) - 727,906
Other tangible assets 2,614 112 - - 2,726
18,325,578 305,747 (4,002) (14,600) 18,612,723
Accumulated depreciation:
Land improvements (1,304,166) (75,928) - 2 (1,380,092)
Buildings (193,944) (8,174) - - (202,118)
Machinery and equipment (4,235,088) (181,056) - 6,062 (4,410,082)
Motor vehicles (206,631) (25,100) - 50 (231,681)
Furniture and fixtures (80,869) (9,329) - 966 (89,232)
Other tangible assets (1,443) (144) - - (1,587)
(6,022,141) (299,731) - 7,080 (6,314,792)
Net book value 12,303,437 12,297,931
Total depreciation expense amounting to TRY317,952 thousand (30 June 2018 - TRY299,731 thousand) in the
consolidated statement of comprehensive income for the period ended 30 June 2019 has been allocated to cost of
goods sold amounting to TRY303,715 thousand (30 June 2018 - TRY 283,797 thousand), to marketing, sales and
distribution expenses amounting to TRY3 thousand (30 June 2018 - TRY2 thousand), to general administration
expenses amounting to TRY14,234 thousand (30 June 2018 - TRY15,932 thousand).
The depreciation expense related to right-of-use assets in the consolidated statement of comprehensive income for
the period ended as of 30 June 2019 is TRY15,449 thousand and has been classified to general administration
expenses (30 June 2018 - None).
As of 30 June 2019, there are no mortgages on property, plant and equipment, (31 December 2018 - None). The
Company has decided to account its lands from fair values as of 31 March 2019. Related details have been
disclosed in Note 2.2.

TÜRKİYE PETROL RAFİNERİLERİ A.Ş. NOTES TO THE CONDENSED INTERIM CONSOLIDATED FINANCIAL STATEMENTS FOR THE SIX MONTH INTERIM PERIOD ENDED 30 JUNE 2019 (Amounts expressed in thousands of Turkish Lira (“TRY”) unless otherwise indicated.)
24
12. Intangible assets
Other intangible assets:
The movements of intangible assets and related accumulated amortisation for the period ended
30 June 2019 and 2018 are as follows:
1 January 2019 Additions Transfers Disposals 30 June 2019
Cost:
Rights and software 91,242 2,706 - - 93,948 Development expenses 85,407 1,378 - - 86,785
176,649 4,084 - - 180,733
Accumulated amortisation:
Rights and software (54,295) (6,588) - - (60,883) Development expenses (64,169) (4,872) - - (69,041)
(118,464) (11,460) - - (129,924)
Net book value 58,185 50,809
1 January 2018 Additions Transfers Disposals 30 June 2018
Cost:
Rights and software 81,464 21 1,589 - 83,074
Development expenses 80,039 - 2,413 - 82,452
161,503 21 4,002 - 165,526
Accumulated amortisation:
Rights and software (43,060) (5,142) - - (48,202)
Development expenses (53,256) (5,374) - - (58,630)
(96,316) (10,516) - - (106,832)
Net book value 65,187 58,694
Total amortisation expenses amounting to TRY11,460 thousand (30 June 2018 – TRY10,516 thousand) in the
consolidated statement of comprehensive income for the period ended 30 June 2019 have been allocated to the
general administration expenses.
13. Prepaid expenses
Short term prepaid expenses: 30 June 2019 31 December 2018
Insurance and other expenses 168,288 81,320
Advances given 87,969 27,369
Total 256,257 108,689
Long term prepaid expenses: 30 June 2019 31 December 2018
Advances given to related parties for property, plant and equipment
(Note 28) 182,546 252,101
Advances given to third parties for property, plant and equipment 72,692 124,885
Other prepaid expenses 1,379 1,014
Total 256,617 378,000
TÜRKİYE PETROL RAFİNERİLERİ A.Ş. NOTES TO THE CONDENSED INTERIM CONSOLIDATED FINANCIAL STATEMENTS FOR THE SIX MONTH INTERIM PERIOD ENDED 30 JUNE 2019 (Amount expressed in thousands of Turkish Lira (“TRY”) unless otherwise indicated.)
25
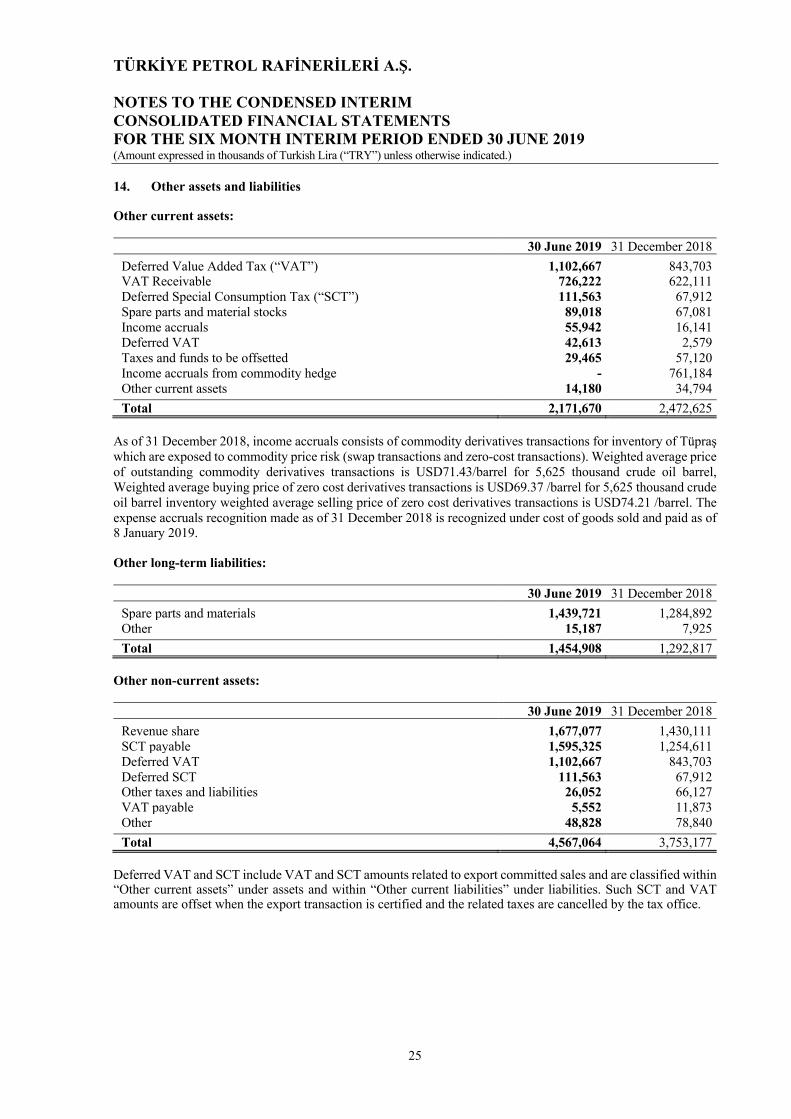
14. Other assets and liabilities Other current assets: 30 June 2019 31 December 2018
Deferred Value Added Tax (“VAT”) 1,102,667 843,703
VAT Receivable 726,222 622,111
Deferred Special Consumption Tax (“SCT”) 111,563 67,912
Spare parts and material stocks 89,018 67,081
Income accruals 55,942 16,141
Deferred VAT 42,613 2,579
Taxes and funds to be offsetted 29,465 57,120
Income accruals from commodity hedge - 761,184
Other current assets 14,180 34,794
Total 2,171,670 2,472,625
As of 31 December 2018, income accruals consists of commodity derivatives transactions for inventory of Tüpraş
which are exposed to commodity price risk (swap transactions and zero-cost transactions). Weighted average price
of outstanding commodity derivatives transactions is USD71.43/barrel for 5,625 thousand crude oil barrel,
Weighted average buying price of zero cost derivatives transactions is USD69.37 /barrel for 5,625 thousand crude
oil barrel inventory weighted average selling price of zero cost derivatives transactions is USD74.21 /barrel. The
expense accruals recognition made as of 31 December 2018 is recognized under cost of goods sold and paid as of
8 January 2019.
Other long-term liabilities: 30 June 2019 31 December 2018
Spare parts and materials 1,439,721 1,284,892
Other 15,187 7,925
Total 1,454,908 1,292,817
Other non-current assets: 30 June 2019 31 December 2018
Revenue share 1,677,077 1,430,111
SCT payable 1,595,325 1,254,611
Deferred VAT 1,102,667 843,703
Deferred SCT 111,563 67,912
Other taxes and liabilities 26,052 66,127
VAT payable 5,552 11,873
Other 48,828 78,840
Total 4,567,064 3,753,177
Deferred VAT and SCT include VAT and SCT amounts related to export committed sales and are classified within
“Other current assets” under assets and within “Other current liabilities” under liabilities. Such SCT and VAT
amounts are offset when the export transaction is certified and the related taxes are cancelled by the tax office.

TÜRKİYE PETROL RAFİNERİLERİ A.Ş. NOTES TO THE CONDENSED INTERIM CONSOLIDATED FINANCIAL STATEMENTS FOR THE SIX MONTH INTERIM PERIOD ENDED 30 JUNE 2019 (Amounts expressed in thousands of Turkish Lira (“TRY”) unless otherwise indicated.)
26
14. Other assets and liabilities (Continued)
According to the Petroleum Market Law, financing needs of refinery owners to maintain the National Petroleum
Stock are supplied by the revenue share, which is a surplus added to the sales price, limited to a ceiling of USD
10/ton as determined by Energy Market Regulatory Authority (“EMRA”). In the case of importation of petroleum
products, the revenue share is to be paid to the refinery owner by the importer.
The Group has been collecting the revenue share over the sales of petroleum products and non-refinery imports of
petroleum products since 1 January 2005, the date the relevant article of the regulation came into force.
The Group has been collecting revenue share for LPG sales since 16 September 2005 in addition to the revenue
share collected for petroleum products, in accordance with the Liquefied Petroleum Gas (“LPG”) Market
Regulation.
It has been decided by the National Petroleum Reserves Commission that the investment management of the
revenue share collected will be conducted by the General Directorate of Tüpraş, and the collected amount will be
invested in overnight reverse repurchase agreements.
As a result of these regulations, the revenue share amounting to TRY1,667,077 thousand accumulated as at
30 June 2019 (31 December 2018: TRY1,430,111 thousand) which is not recognized in the comprehensive income
statement, has been classified as “Revenue Share” within “Other short-term liabilities”,
TRY1,670,657 thousand is (31 December 2018: TRY1,425,142 thousand) blocked in banks as demand deposits with
government debt securities interest rate and overnight interest rate related to the calculated revenue share has been
classified as Revenue share “Blocked” within “Cash and cash equivalents”(Note 4).
15. Provisions Provision for employee benefits: Short-term provision for employee benefits: 30 June 2019 31 December 2018
Personnel bonus accruals 70,904 5,342
Seniority incentive bonus provision 4,369 3,521
Total 75,273 8,863
Long-term employee benefits: 30 June 2019 31 December 2018
Provision for employment termination benefits 182,984 186,525
Provision for unused vacation 63,776 59,787
Seniority incentive bonus provision 12,510 11,080
Total 259,270 257,392
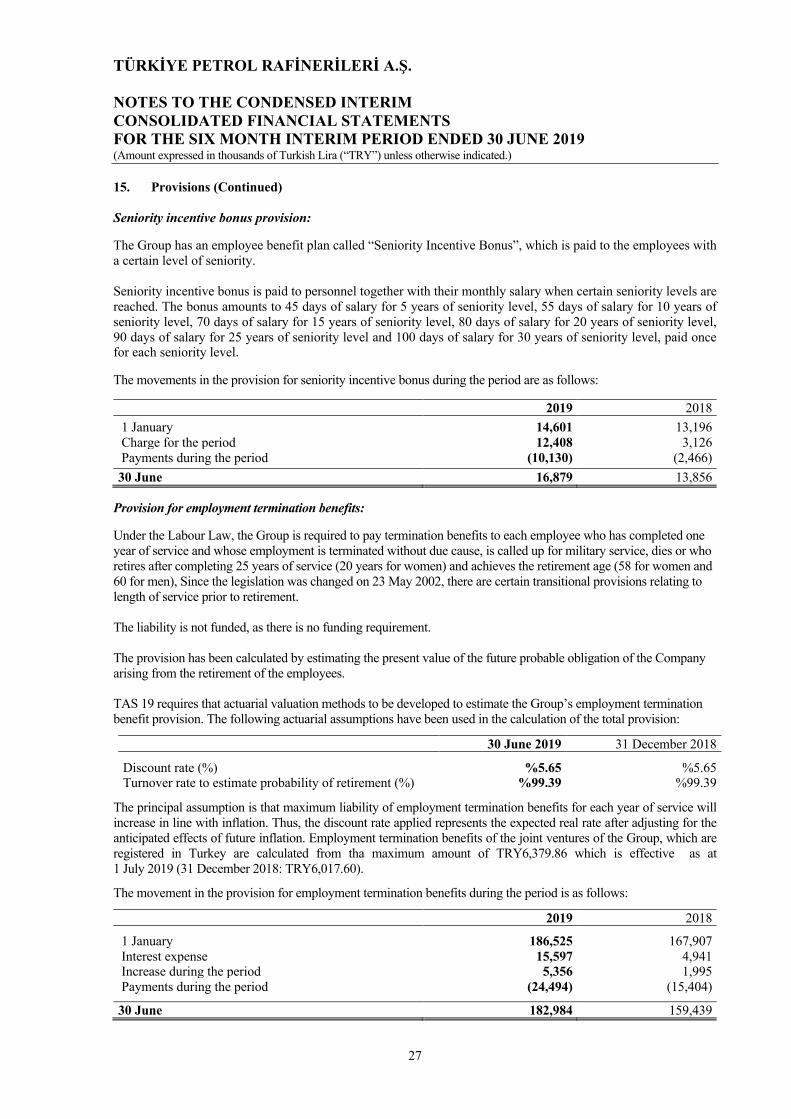
TÜRKİYE PETROL RAFİNERİLERİ A.Ş. NOTES TO THE CONDENSED INTERIM CONSOLIDATED FINANCIAL STATEMENTS FOR THE SIX MONTH INTERIM PERIOD ENDED 30 JUNE 2019 (Amount expressed in thousands of Turkish Lira (“TRY”) unless otherwise indicated.)
27
15. Provisions (Continued) Seniority incentive bonus provision:
The Group has an employee benefit plan called “Seniority Incentive Bonus”, which is paid to the employees with
a certain level of seniority.
Seniority incentive bonus is paid to personnel together with their monthly salary when certain seniority levels are
reached. The bonus amounts to 45 days of salary for 5 years of seniority level, 55 days of salary for 10 years of
seniority level, 70 days of salary for 15 years of seniority level, 80 days of salary for 20 years of seniority level,
90 days of salary for 25 years of seniority level and 100 days of salary for 30 years of seniority level, paid once
for each seniority level.
The movements in the provision for seniority incentive bonus during the period are as follows:
2019 2018
1 January 14,601 13,196
Charge for the period 12,408 3,126
Payments during the period (10,130) (2,466)
30 June 16,879 13,856
Provision for employment termination benefits:
Under the Labour Law, the Group is required to pay termination benefits to each employee who has completed one
year of service and whose employment is terminated without due cause, is called up for military service, dies or who
retires after completing 25 years of service (20 years for women) and achieves the retirement age (58 for women and
60 for men), Since the legislation was changed on 23 May 2002, there are certain transitional provisions relating to
length of service prior to retirement.
The liability is not funded, as there is no funding requirement.
The provision has been calculated by estimating the present value of the future probable obligation of the Company
arising from the retirement of the employees.
TAS 19 requires that actuarial valuation methods to be developed to estimate the Group’s employment termination
benefit provision. The following actuarial assumptions have been used in the calculation of the total provision:
30 June 2019 31 December 2018
Discount rate (%) %5.65 %5.65
Turnover rate to estimate probability of retirement (%) %99.39 %99.39
The principal assumption is that maximum liability of employment termination benefits for each year of service will
increase in line with inflation. Thus, the discount rate applied represents the expected real rate after adjusting for the
anticipated effects of future inflation. Employment termination benefits of the joint ventures of the Group, which are
registered in Turkey are calculated from tha maximum amount of TRY6,379.86 which is effective as at
1 July 2019 (31 December 2018: TRY6,017.60).
The movement in the provision for employment termination benefits during the period is as follows:
2019 2018
1 January 186,525 167,907
Interest expense 15,597 4,941
Increase during the period 5,356 1,995
Payments during the period (24,494) (15,404)
30 June 182,984 159,439
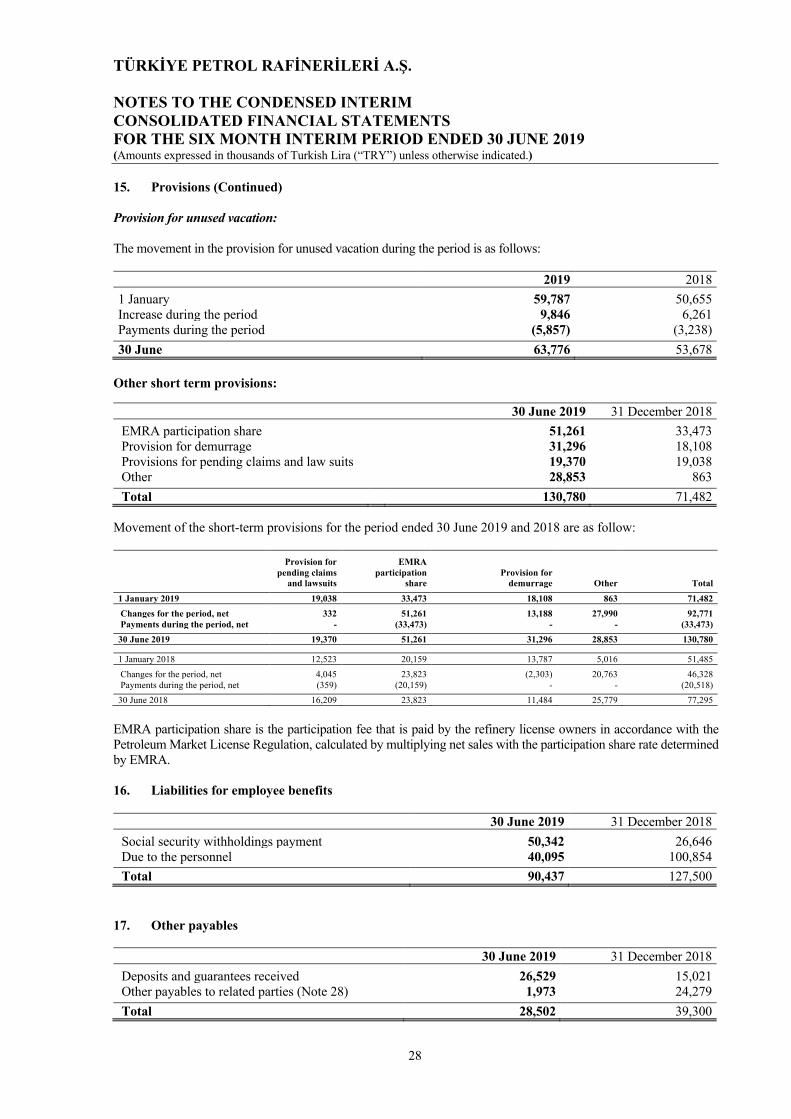
TÜRKİYE PETROL RAFİNERİLERİ A.Ş. NOTES TO THE CONDENSED INTERIM CONSOLIDATED FINANCIAL STATEMENTS FOR THE SIX MONTH INTERIM PERIOD ENDED 30 JUNE 2019 (Amounts expressed in thousands of Turkish Lira (“TRY”) unless otherwise indicated.)
28
15. Provisions (Continued) Provision for unused vacation:
The movement in the provision for unused vacation during the period is as follows:
2019 2018
1 January 59,787 50,655
Increase during the period 9,846 6,261
Payments during the period (5,857) (3,238)
30 June 63,776 53,678
Other short term provisions:
30 June 2019 31 December 2018
EMRA participation share 51,261 33,473
Provision for demurrage 31,296 18,108
Provisions for pending claims and law suits 19,370 19,038
Other 28,853 863
Total 130,780 71,482
Movement of the short-term provisions for the period ended 30 June 2019 and 2018 are as follow:
Provision for pending claims
and lawsuits
EMRA participation
share Provision for
demurrage Other Total
1 January 2019 19,038 33,473 18,108 863 71,482
Changes for the period, net 332 51,261 13,188 27,990 92,771 Payments during the period, net - (33,473) - - (33,473)
30 June 2019 19,370 51,261 31,296 28,853 130,780
1 January 2018 12,523 20,159 13,787 5,016 51,485
Changes for the period, net 4,045 23,823 (2,303) 20,763 46,328
Payments during the period, net (359) (20,159) - - (20,518)
30 June 2018 16,209 23,823 11,484 25,779 77,295
EMRA participation share is the participation fee that is paid by the refinery license owners in accordance with the
Petroleum Market License Regulation, calculated by multiplying net sales with the participation share rate determined
by EMRA.
16. Liabilities for employee benefits
30 June 2019 31 December 2018
Social security withholdings payment 50,342 26,646
Due to the personnel 40,095 100,854
Total 90,437 127,500
17. Other payables 30 June 2019 31 December 2018
Deposits and guarantees received 26,529 15,021
Other payables to related parties (Note 28) 1,973 24,279
Total 28,502 39,300
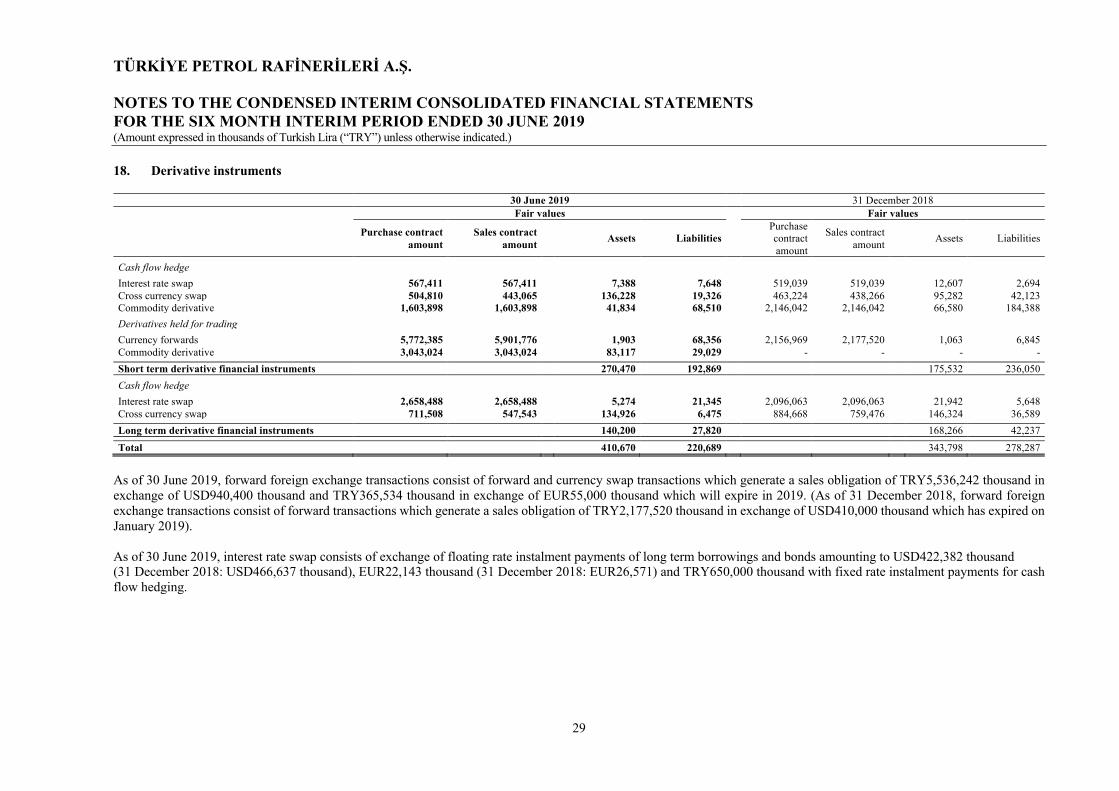
TÜRKİYE PETROL RAFİNERİLERİ A.Ş. NOTES TO THE CONDENSED INTERIM CONSOLIDATED FINANCIAL STATEMENTS FOR THE SIX MONTH INTERIM PERIOD ENDED 30 JUNE 2019 (Amount expressed in thousands of Turkish Lira (“TRY”) unless otherwise indicated.)
29
18. Derivative instruments 30 June 2019 31 December 2018 Fair values Fair values
Purchase contract amount
Sales contract amount
Assets Liabilities Purchase contract amount
Sales contract amount Assets Liabilities
Cash flow hedge
Interest rate swap 567,411 567,411 7,388 7,648 519,039 519,039 12,607 2,694 Cross currency swap 504,810 443,065 136,228 19,326 463,224 438,266 95,282 42,123 Commodity derivative 1,603,898 1,603,898 41,834 68,510 2,146,042 2,146,042 66,580 184,388 Derivatives held for trading Currency forwards 5,772,385 5,901,776 1,903 68,356 2,156,969 2,177,520 1,063 6,845 Commodity derivative 3,043,024 3,043,024 83,117 29,029 - - - - Short term derivative financial instruments 270,470 192,869 175,532 236,050 Cash flow hedge Interest rate swap 2,658,488 2,658,488 5,274 21,345 2,096,063 2,096,063 21,942 5,648 Cross currency swap 711,508 547,543 134,926 6,475 884,668 759,476 146,324 36,589 Long term derivative financial instruments 140,200 27,820 168,266 42,237 Total 410,670 220,689 343,798 278,287
As of 30 June 2019, forward foreign exchange transactions consist of forward and currency swap transactions which generate a sales obligation of TRY5,536,242 thousand in exchange of USD940,400 thousand and TRY365,534 thousand in exchange of EUR55,000 thousand which will expire in 2019. (As of 31 December 2018, forward foreign exchange transactions consist of forward transactions which generate a sales obligation of TRY2,177,520 thousand in exchange of USD410,000 thousand which has expired on January 2019). As of 30 June 2019, interest rate swap consists of exchange of floating rate instalment payments of long term borrowings and bonds amounting to USD422,382 thousand (31 December 2018: USD466,637 thousand), EUR22,143 thousand (31 December 2018: EUR26,571) and TRY650,000 thousand with fixed rate instalment payments for cash flow hedging.

TÜRKİYE PETROL RAFİNERİLERİ A.Ş. NOTES TO THE CONDENSED INTERIM CONSOLIDATED FINANCIAL STATEMENTS FOR THE SIX MONTH INTERIM PERIOD ENDED 30 JUNE 2018 (Amount expressed in thousands of Turkish Lira (“TRY”) unless otherwise indicated.)
30
18. Derivative instruments (Continued) As of 30 June 2019, cross currency swap transactions consist of swaps with fixed interest rate transaction of foreign currency indexed, fixed interest rate long-term bonds amounting to USD179,006 thousand (31 December 2018: USD216,395 thousand) with foreign currency indexed floating interest long-term borrowing of TRY809,805 thousand, EUR11,071 thousand long-term borrowing (31 December 2018: EUR13,286 thousand) foreign currency indexed interest rate of long-term borrowing of TRY41,073 thousand (31 December 2018: TRY49,288 thousand) foreign currency indexed interet rate swap transactions with TRY currency indexed fixed interest payments amounting to TRY41,073 thousand (31 December 2018: TRY49,288 thousand) and TRY currency indexed of swap transactions with total of USD11,671 thousand (31 December 2018: USD14,005 thousand) with foreign currency indexed fixed interest payments and swap transaction of EUR11,071 thousand (31 December 2018: EUR13,286 thousand) foreign currency indexed interest rate of long-term borrowing and USD12,608 thousand (31 December 2018: USD15,130 thousand) foreign currency indexed fixed interest payments. The commodity future purchase and sales transactions consist of transactions of product crack margin fixing, swap transactions and zero cost collar transactions as of 30 June 2019. Future sales product crack margin fixing transactions have been made for gasoline of 2,466 thousand barrels, jet fuel stocks of 1,800 thousand barrels, diesel stock stocks of 4,758 thousand barrels and fuel oil stocks of 2,256 thousand barrels for third quarter of 2019, gasoline stocks of 1,176 thousand barrels, jet fuel stocks of 828 thousand barrels, diesel stocks of 2,337 thousand barrels and fuel oil of 543 thousand barrels for fourth quarter of 2019 and gasoline stocks of 374 thousand barrels, jet fuel stocks of 265 thousand barrels, diesel stocks of 749 thousand barrels and fuel oil stocks of 172 thousand barrels for first quarter of 2020. The weighted average of the fixed margin of these transactions are USD6.70 for gasoline, USD14.88 for jet fuel, USD17.24 for diesel and USD-11.91 for fuel oil per barrel. The total of swap transactions for crude oil stocks is 3,100 thousand barrels with weighted average fixed price of USD64.70, The zero cost collar option transactions were made for total of 2,500 thousand barrels and the the weighted average purchase price of the option transactions giving the right to sell was USD62.93/barrel, and the weighted average selling price of the option transactions that resulted in sales obligation was USD68.34/barrel. The commodity future purchase and sales transactions consist of transactions of product crack margin fixing and swap transactions as of 31 December 2018. Future sales product crack margin fixing transactions have been made for, jet stocks of 4,515 thousand barrels, diesel stocks of 5,580 thousand barrels and fuel oil stocks of 4,371 thousand barrels for first quarter of 2019, gasoline stocks of 315 thousand barrels, jet fuel stocks of 4,188 thousand barrels, diesel stocks of 5,910 thousand barrels and fuel oil stocks of 3,957 thousand barrels for second quarter of 2019, fuel oil stocks of 1,650 thousand barrels for third quarter of 2019. The weighted average of the fixed margin of these transactions are USD9.54 for gasoline, USD13.98 for jet fuel, USD15.92 for diesel and USD-10.05 for fuel oil per barrel.
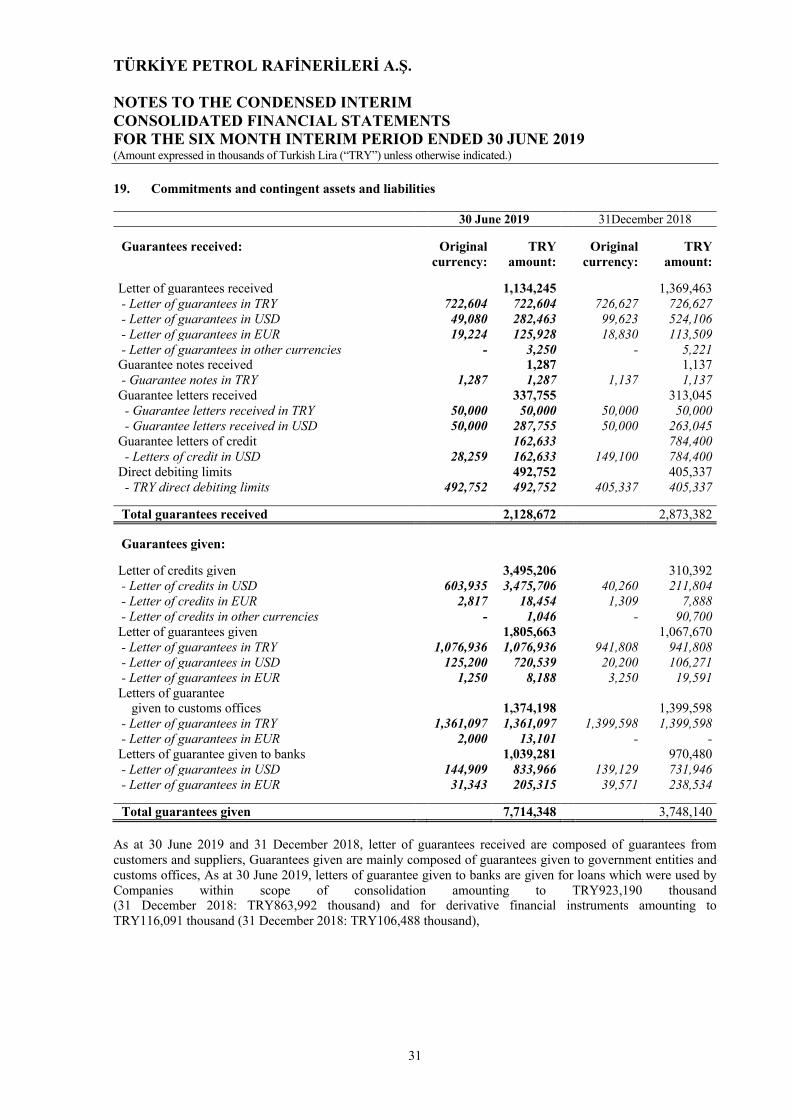
TÜRKİYE PETROL RAFİNERİLERİ A.Ş. NOTES TO THE CONDENSED INTERIM CONSOLIDATED FINANCIAL STATEMENTS FOR THE SIX MONTH INTERIM PERIOD ENDED 30 JUNE 2019 (Amount expressed in thousands of Turkish Lira (“TRY”) unless otherwise indicated.)
31
19. Commitments and contingent assets and liabilities
30 June 2019 31December 2018
Guarantees received:
Original currency:
TRY amount:
Original currency:
TRY amount:
Letter of guarantees received
1,134,245 1,369,463 - Letter of guarantees in TRY
722,604 722,604 726,627 726,627
- Letter of guarantees in USD
49,080 282,463 99,623 524,106 - Letter of guarantees in EUR
19,224 125,928 18,830 113,509
- Letter of guarantees in other currencies
- 3,250 - 5,221 Guarantee notes received
1,287 1,137
- Guarantee notes in TRY
1,287 1,287 1,137 1,137 Guarantee letters received
337,755 313,045
- Guarantee letters received in TRY
50,000 50,000 50,000 50,000 - Guarantee letters received in USD
50,000 287,755 50,000 263,045
Guarantee letters of credit
162,633 784,400 - Letters of credit in USD
28,259 162,633 149,100 784,400
Direct debiting limits
492,752 405,337 - TRY direct debiting limits
492,752 492,752 405,337 405,337
Total guarantees received 2,128,672 2,873,382
Guarantees given:
Letter of credits given
3,495,206 310,392 - Letter of credits in USD
603,935 3,475,706 40,260 211,804
- Letter of credits in EUR
2,817 18,454 1,309 7,888 - Letter of credits in other currencies
- 1,046 - 90,700
Letter of guarantees given
1,805,663 1,067,670 - Letter of guarantees in TRY
1,076,936 1,076,936 941,808 941,808
- Letter of guarantees in USD
125,200 720,539 20,200 106,271 - Letter of guarantees in EUR
1,250 8,188 3,250 19,591
Letters of guarantee
given to customs offices
1,374,198 1,399,598
- Letter of guarantees in TRY
1,361,097 1,361,097 1,399,598 1,399,598 - Letter of guarantees in EUR
2,000 13,101 - -
Letters of guarantee given to banks
1,039,281 970,480 - Letter of guarantees in USD
144,909 833,966 139,129 731,946
- Letter of guarantees in EUR
31,343 205,315 39,571 238,534
Total guarantees given 7,714,348 3,748,140
As at 30 June 2019 and 31 December 2018, letter of guarantees received are composed of guarantees from customers and suppliers, Guarantees given are mainly composed of guarantees given to government entities and customs offices, As at 30 June 2019, letters of guarantee given to banks are given for loans which were used by Companies within scope of consolidation amounting to TRY923,190 thousand (31 December 2018: TRY863,992 thousand) and for derivative financial instruments amounting to TRY116,091 thousand (31 December 2018: TRY106,488 thousand),

TÜRKİYE PETROL RAFİNERİLERİ A.Ş. NOTES TO THE CONDENSED INTERIM CONSOLIDATED FINANCIAL STATEMENTS FOR THE SIX MONTH INTERIM PERIOD ENDED 30 JUNE 2019 (Amount expressed in thousands of Turkish Lira (“TRY”) unless otherwise indicated.)
32
19. Commitments and contingent assets and liabilities (Continued) Collaterals, pledges, mortgages given by the Group as at 30 June 2019 and 31 December 2018 are as follows: 30 June 2019 31.December 2018
A. CPMs given for companies in the name of its own legal personality 6,675,067 2,777,660 - TRY 2,438,033 2,341,406 - USD 4,196,245 318,075 - EUR 39,743 27,479 - Other 1,046 90,700 B. CPMs given on behalf of the fully consolidated companies 1,039,281 970,480 - USD 833,966 731,946 - EUR 205,315 238,534 C. CPMs given for continuation of its economic activities on behalf of third parties - - D. Total amount of other CPMs - - i) Total amount of CPMs given on behalf of the majority shareholder - - ii) Total amount of CPMs given to on behalf of other Group companies which are not in scope of B and C, - - iii) Total amount of CPMs given on behalf of third parties which are not in scope of C, - - Total 7,714,348 3,748,140
20. Equity The Company’s shareholders and their shareholding percentages as at 30 June 2019 and 31 December 2018 are as follows:
30 June 2019
Share (%) 31 December
2018 Share (%)
Enerji Yatırımları A.Ş. 127,714 51 127,714 51 Publicly Owned 122,705 49 122,705 49
Total 250,419 100 250,419 100
Adjustment to share capital 1,344,243 1,344,243
Total paid-in capital 1,594,662 1,594,662
Adjustment to share capital represents the difference between the inflation adjusted amounts of cash and cash equivalents of the paid-in capital and the amounts before the inflation adjustment. Registered capital of the Company is TRY500,000 thousand and is divided into 50,000,000,000 shares with a registered nominal value of 1 Kuruş (“Kr”) (31 December 2018: 1Kr) each, The authorised and paid-in share capital of the Company comprises 25,041,919,999 Group A shares with a registered nominal value of 1Kr and one Group C share with privileges belonging to the Privatisation Administration. As per the articles of association of the Company, one member of the Board of Directors should be nominated by the Group C shareholders. Board of Directors’ decisions on the supply needs of petroleum products of the Turkish Military Forces requires the consent of the member representing the Group C shareholders Retained earnings, as per the statutory financial statements other than legal reserves, are available for distribution, subject to the legal reserve requirement referred to below.

TÜRKİYE PETROL RAFİNERİLERİ A.Ş. NOTES TO THE CONDENSED INTERIM CONSOLIDATED FINANCIAL STATEMENTS FOR THE SIX MONTH INTERIM PERIOD ENDED 30 JUNE 2019 (Amount expressed in thousands of Turkish Lira (“TRY”) unless otherwise indicated.)
33
20. Equity (Continued) Restricted reserves The legal reserves consist of first and second reserves, appropriated in accordance with the Turkish Commercial Code (“TCC”). The TCC stipulates that the first legal reserve is appropriated out of statutory profits at the rate of 5% per annum until the total reserve reaches 20% of the Company’s paid-in share capital, The second legal reserve is appropriated at the rate of 10% per annum of all cash distributions in excess of 5% of the paid-in share capital, Under the TCC, the legal reserves can only be used to offset loss and are not available for any other usage unless the reserve exceeds 50% of paid-in share capital. In accordance with Turkish Financial Reporting Standards the aforementioned amounts should be classified under “Restricted Reserves”. At 30 June 2019, the restricted reserves of the Company amount to TRY503,343 thousand (31 December 2018 - TRY597,086 thousand). Dividend distribution Listed companies distribute dividend in accordance with the Communiqué No, II-19,1 issued by the CMB which is effective from 1 February 2014. Companies distribute dividends in accordance with their dividend payment policies settled and dividend payment decision taken in general assembly and also in conformity with relevant legislations. The communiqué does not constitute a minimum dividend rate. Companies distribute dividend in accordance with the method defined in their dividend policy or articles of incorporation, In addition, dividend can be distributed by fixed or variable instalments and advance dividend can be paid in accordance with profit on interim financial statements of the Company. In accordance with the Turkish Commercial Code (TCC), unless the required reserves and the dividend for shareholders as determined in the article of association or in the dividend distribution policy of the company are set aside, no decision may be made to set aside other reserves, to transfer profits to the subsequent year or to distribute dividends to the holders of usufruct right certificates, to the members of the board of directors or to the employees; and no dividend can be distributed to these persons unless the determined dividend for shareholders is paid in cash. The total amount of net income of the Company in the statutory records and other equity accounts subject to dividend distribution amount to TRY2,002,637 thousand as at 30 June 2019. This amount includes inflation adjustment differences of the equity accounts amounting to TRY1,698,998 thousand and other reserves amounting to TRY14,426 thousand which are subject to corporate taxation when distributed as dividends. In the period ended as of 30 June 2019, the Company committed to make dividend payment in cash amounting to TRY3,793,851 thousand which is the total amount remained after first and second composition legal reserves deducted from 2018 distributable net profit of the period and a portion of second composition legal reserves. The Company paid a cash dividend at the rate of 1,515.0% which corresponds to TRY15,15 gross and TRY15,15 net cash dividend for the shares with a nominal value of TRY1,00 to institutional shareholders who are full taxpayers or limited liable taxpayers and obtain dividends through a business or permanent representative in Turkey. The Company paid also a cash dividend at the rate of 1,515.0%, which corresponds to TRY15,15 gross and TRY12,8775 net cash dividend for the shares with a nominal value of TRY1,00 to other shareholders. In the period ended as of 31 December 2018, the Company committed to make dividend payment in cash amounting to TRY3,406,452 thousand which is the total amount remained after first and second composition legal reserves deducted from 2017 distributable net profit of the period and a portion of second composition legal reserves. The Company paid a cash dividend at the rate of 1,360,3% which corresponds to TRY13,603 gross and TRY13,603 net cash dividend for the shares with a nominal value of TRY1,00 to institutional shareholders who are full taxpayers or limited liable taxpayers and obtain dividends through a business or permanent representative in Turkey. The Company paid also a cash dividend at the rate of 1,360,3%, which corresponds to TRY13,603 gross and TRY11,563 net cash dividend for the shares with a nominal value of TRY1,00 to other shareholders.

TÜRKİYE PETROL RAFİNERİLERİ A.Ş. NOTES TO THE CONDENSED INTERIM CONSOLIDATED FINANCIAL STATEMENTS FOR THE SIX MONTH INTERIM PERIOD ENDED 30 JUNE 2019 (Amount expressed in thousands of Turkish Lira (“TRY”) unless otherwise indicated.)
34
21. Revenue and cost of sales 1 January - 1 April - 1 January - 1 April - 30 June 2019 30 June 2019 30 June 2018 30 June 2018 Domestic revenue 34,508,281 19,014,508 29,856,104 18,379,542 Export revenue 10,662,596 5,231,496 4,238,073 2,070,198 Gross sales 45,170,877 24,246,004 34,094,177 20,449,740 Less: Sales discounts (438,251) (241,741) (556,489) (342,870) Less: Sales returns (71,787) (51,312) (35,508) (26,098) Sales (net) 44,660,839 23,952,951 33,502,180 20,080,772 Cost of goods sold (41,998,470) (22,281,875) (30,212,223) (17,860,005) Gross profit 2,662,369 1,671,076 3,289,957 2,220,767
Cost of sales: 1 January - 1 April - 1 January - 1 April - 30 June 2019 30 June 2019 30 June 2018 30 June 2018 Raw material, manufactured and consumable material 39,320,470 20,902,334 28,526,363 16,966,620 Energy expenses 1,286,520 674,015 625,348 333,179 Personnel expenses 396,677 170,305 358,449 179,922 Depreciation and amortization (Note 11) 303,715 153,080 283,797 141,365 Other production expenses 691,088 382,141 418,266 238,919
Cost of sales 41,998,470 22,281,875 30,212,223 17,860,005
22. General administrative expenses, marketing expenses and research and development expenses General administrative expenses: 1 January - 1 April - 1 January - 1 April - 30 June 2019 30 June 2019 30 June 2018 30 June 2018
Personnel expenses 243,682 120,719 170,669 83,884
Insurance expenses 70,774 39,986 49,855 27,937
Taxes and duties 59,306 25,165 48,483 27,583
Depreciation and amortization (Note 11-12) 41,143 20,731 26,448 13,419
Outsourced services 40,560 21,288 32,631 17,065
Office expenses 33,051 17,669 16,468 9,903
Subscription fees 20,961 10,473 15,477 9,115
Lawsuit and consultancy expenses 14,019 9,672 10,735 6,751
Donations 10,490 5,299 7,817 2,074
Rent expenses 4,135 909 7,579 4,047
Transportation and travel expenses 2,725 1,591 2,192 827 Other 29,424 16,395 22,529 12,392 Total general administrative expenses 570,270 289,897 410,883 214,997
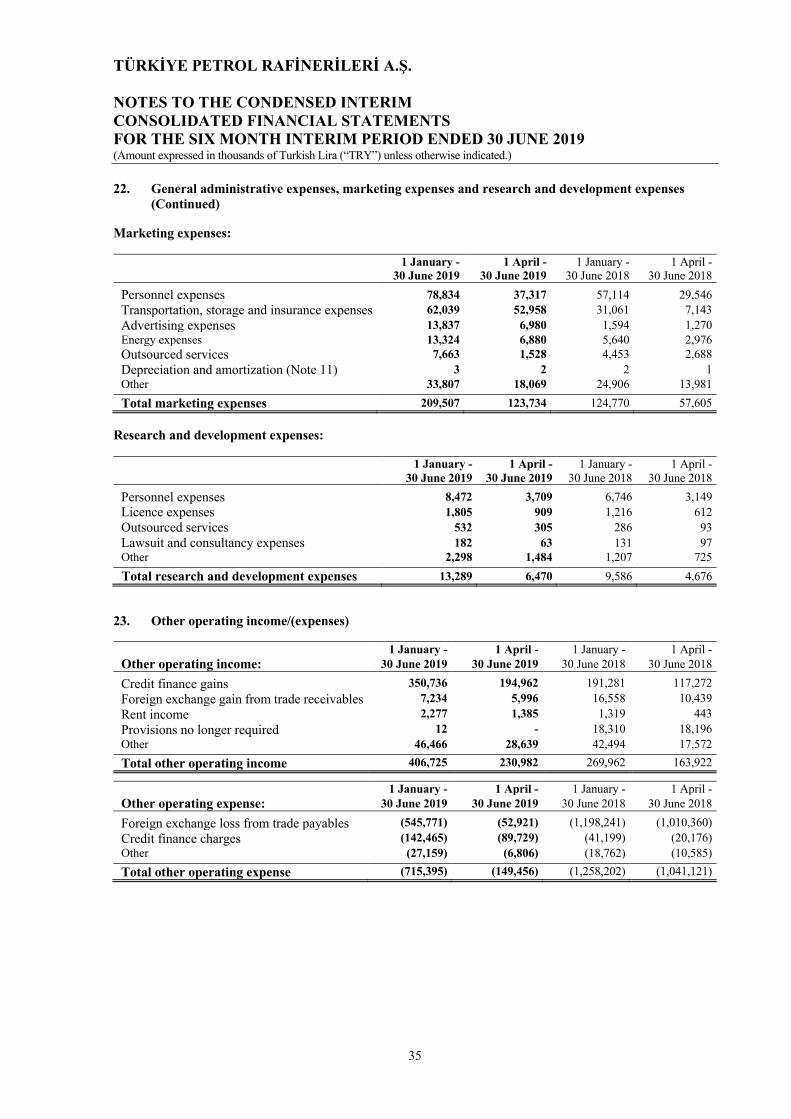
TÜRKİYE PETROL RAFİNERİLERİ A.Ş. NOTES TO THE CONDENSED INTERIM CONSOLIDATED FINANCIAL STATEMENTS FOR THE SIX MONTH INTERIM PERIOD ENDED 30 JUNE 2019 (Amount expressed in thousands of Turkish Lira (“TRY”) unless otherwise indicated.)
35
22. General administrative expenses, marketing expenses and research and development expenses (Continued)
Marketing expenses: 1 January - 1 April - 1 January - 1 April - 30 June 2019 30 June 2019 30 June 2018 30 June 2018
Personnel expenses 78,834 37,317 57,114 29,546
Transportation, storage and insurance expenses 62,039 52,958 31,061 7,143
Advertising expenses 13,837 6,980 1,594 1,270
Energy expenses 13,324 6,880 5,640 2,976
Outsourced services 7,663 1,528 4,453 2,688
Depreciation and amortization (Note 11) 3 2 2 1
Other 33,807 18,069 24,906 13,981
Total marketing expenses 209,507 123,734 124,770 57,605
Research and development expenses: 1 January - 1 April - 1 January - 1 April - 30 June 2019 30 June 2019 30 June 2018 30 June 2018
Personnel expenses 8,472 3,709 6,746 3,149
Licence expenses 1,805 909 1,216 612
Outsourced services 532 305 286 93
Lawsuit and consultancy expenses 182 63 131 97
Other 2,298 1,484 1,207 725
Total research and development expenses 13,289 6,470 9,586 4,676
23. Other operating income/(expenses) 1 January - 1 April - 1 January - 1 April -
Other operating income: 30 June 2019 30 June 2019 30 June 2018 30 June 2018
Credit finance gains 350,736 194,962 191,281 117,272
Foreign exchange gain from trade receivables 7,234 5,996 16,558 10,439
Rent income 2,277 1,385 1,319 443
Provisions no longer required 12 - 18,310 18,196
Other 46,466 28,639 42,494 17,572
Total other operating income 406,725 230,982 269,962 163,922
1 January - 1 April - 1 January - 1 April -
Other operating expense: 30 June 2019 30 June 2019 30 June 2018 30 June 2018
Foreign exchange loss from trade payables (545,771) (52,921) (1,198,241) (1,010,360)
Credit finance charges (142,465) (89,729) (41,199) (20,176)
Other (27,159) (6,806) (18,762) (10,585)
Total other operating expense (715,395) (149,456) (1,258,202) (1,041,121)
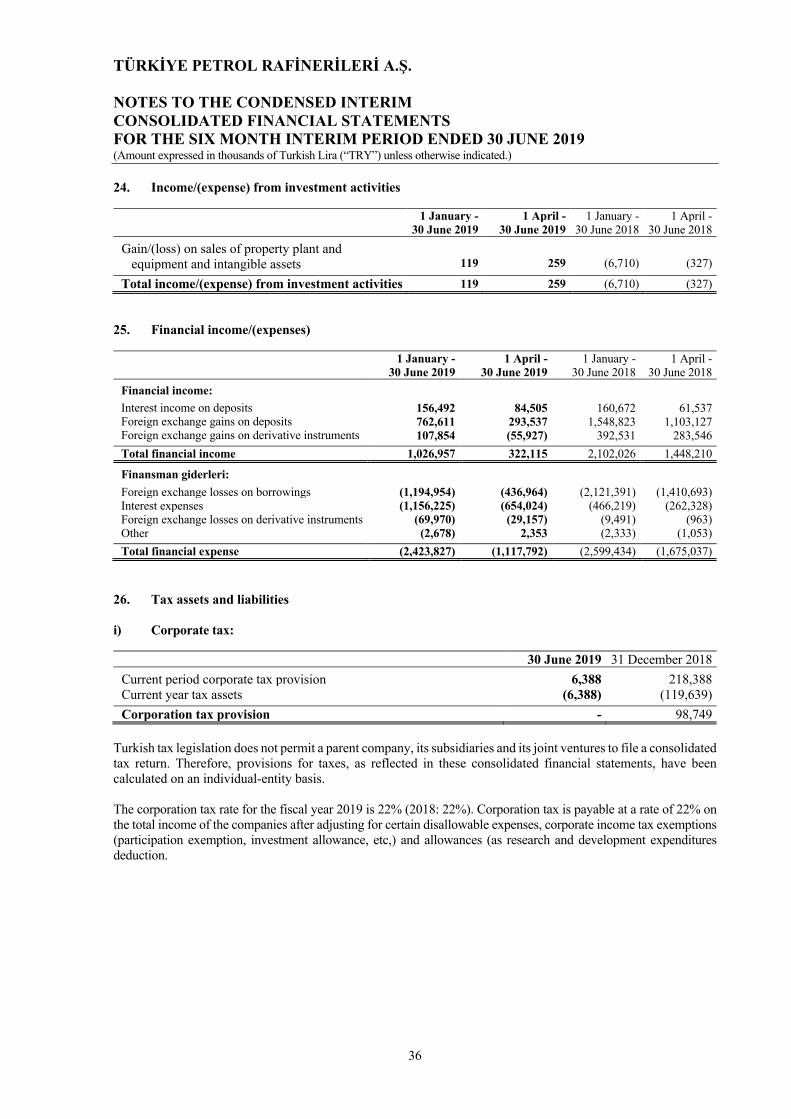
TÜRKİYE PETROL RAFİNERİLERİ A.Ş. NOTES TO THE CONDENSED INTERIM CONSOLIDATED FINANCIAL STATEMENTS FOR THE SIX MONTH INTERIM PERIOD ENDED 30 JUNE 2019 (Amount expressed in thousands of Turkish Lira (“TRY”) unless otherwise indicated.)
36
24. Income/(expense) from investment activities 1 January - 1 April - 1 January - 1 April - 30 June 2019 30 June 2019 30 June 2018 30 June 2018
Gain/(loss) on sales of property plant and equipment and intangible assets 119 259 (6,710) (327)
Total income/(expense) from investment activities 119 259 (6,710) (327)
25. Financial income/(expenses) 1 January - 1 April - 1 January - 1 April - 30 June 2019 30 June 2019 30 June 2018 30 June 2018 Financial income:
Interest income on deposits 156,492 84,505 160,672 61,537 Foreign exchange gains on deposits 762,611 293,537 1,548,823 1,103,127 Foreign exchange gains on derivative instruments 107,854 (55,927) 392,531 283,546 Total financial income 1,026,957 322,115 2,102,026 1,448,210
Finansman giderleri: Foreign exchange losses on borrowings (1,194,954) (436,964) (2,121,391) (1,410,693) Interest expenses (1,156,225) (654,024) (466,219) (262,328) Foreign exchange losses on derivative instruments (69,970) (29,157) (9,491) (963) Other (2,678) 2,353 (2,333) (1,053) Total financial expense (2,423,827) (1,117,792) (2,599,434) (1,675,037)
26. Tax assets and liabilities i) Corporate tax: 30 June 2019 31 December 2018 Current period corporate tax provision 6,388 218,388 Current year tax assets (6,388) (119,639) Corporation tax provision - 98,749
Turkish tax legislation does not permit a parent company, its subsidiaries and its joint ventures to file a consolidated tax return. Therefore, provisions for taxes, as reflected in these consolidated financial statements, have been calculated on an individual-entity basis. The corporation tax rate for the fiscal year 2019 is 22% (2018: 22%). Corporation tax is payable at a rate of 22% on the total income of the companies after adjusting for certain disallowable expenses, corporate income tax exemptions (participation exemption, investment allowance, etc,) and allowances (as research and development expenditures deduction.
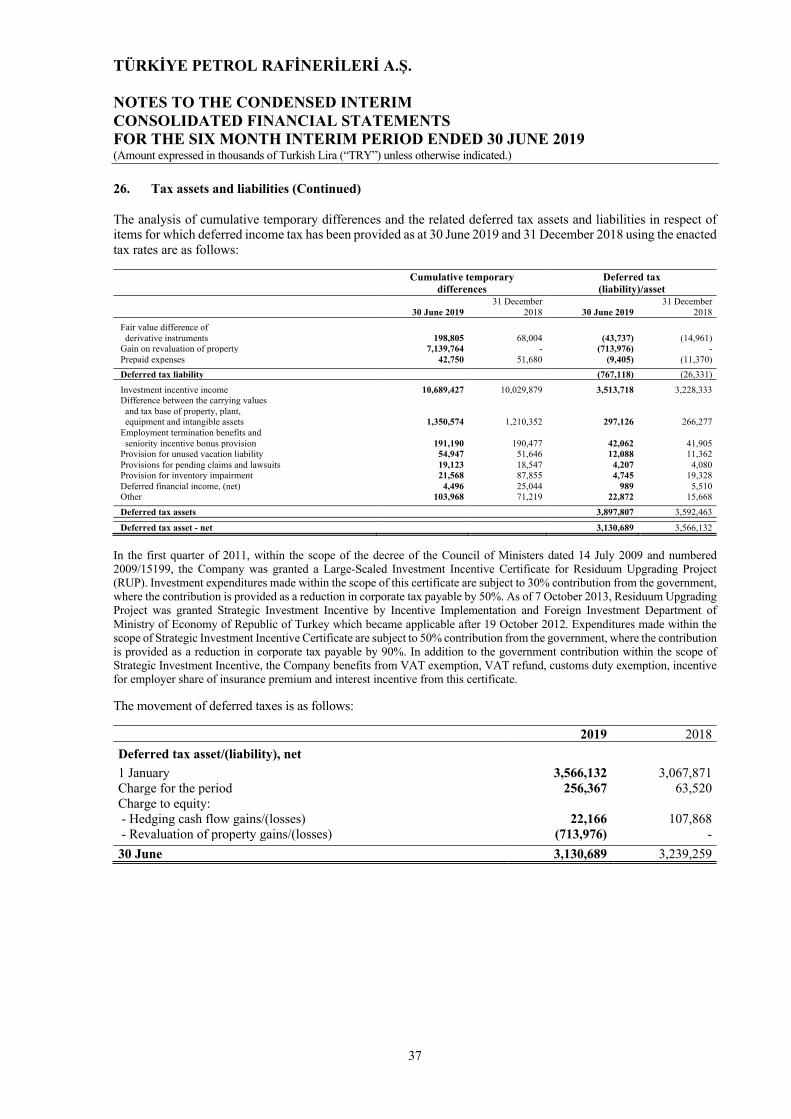
TÜRKİYE PETROL RAFİNERİLERİ A.Ş. NOTES TO THE CONDENSED INTERIM CONSOLIDATED FINANCIAL STATEMENTS FOR THE SIX MONTH INTERIM PERIOD ENDED 30 JUNE 2019 (Amount expressed in thousands of Turkish Lira (“TRY”) unless otherwise indicated.)
37
26. Tax assets and liabilities (Continued) The analysis of cumulative temporary differences and the related deferred tax assets and liabilities in respect of items for which deferred income tax has been provided as at 30 June 2019 and 31 December 2018 using the enacted tax rates are as follows:
Cumulative temporary differences
Deferred tax (liability)/asset
30 June 2019 31 December
2018 30 June 2019 31 December
2018
Fair value difference of derivative instruments 198,805 68,004 (43,737) (14,961) Gain on revaluation of property 7,139,764 - (713,976) -
Prepaid expenses 42,750 51,680 (9,405) (11,370)
Deferred tax liability (767,118) (26,331)
Investment incentive income 10,689,427 10,029,879 3,513,718 3,228,333 Difference between the carrying values and tax base of property, plant, equipment and intangible assets 1,350,574 1,210,352 297,126 266,277
Employment termination benefits and seniority incentive bonus provision 191,190 190,477 42,062 41,905 Provision for unused vacation liability 54,947 51,646 12,088 11,362
Provisions for pending claims and lawsuits 19,123 18,547 4,207 4,080 Provision for inventory impairment 21,568 87,855 4,745 19,328
Deferred financial income, (net) 4,496 25,044 989 5,510 Other 103,968 71,219 22,872 15,668
Deferred tax assets 3,897,807 3,592,463
Deferred tax asset - net 3,130,689 3,566,132
In the first quarter of 2011, within the scope of the decree of the Council of Ministers dated 14 July 2009 and numbered 2009/15199, the Company was granted a Large-Scaled Investment Incentive Certificate for Residuum Upgrading Project (RUP). Investment expenditures made within the scope of this certificate are subject to 30% contribution from the government, where the contribution is provided as a reduction in corporate tax payable by 50%. As of 7 October 2013, Residuum Upgrading Project was granted Strategic Investment Incentive by Incentive Implementation and Foreign Investment Department of Ministry of Economy of Republic of Turkey which became applicable after 19 October 2012. Expenditures made within the scope of Strategic Investment Incentive Certificate are subject to 50% contribution from the government, where the contribution is provided as a reduction in corporate tax payable by 90%. In addition to the government contribution within the scope of Strategic Investment Incentive, the Company benefits from VAT exemption, VAT refund, customs duty exemption, incentive for employer share of insurance premium and interest incentive from this certificate.
The movement of deferred taxes is as follows:
2019 2018
Deferred tax asset/(liability), net 1 January 3,566,132 3,067,871 Charge for the period 256,367 63,520 Charge to equity: - Hedging cash flow gains/(losses) 22,166 107,868 - Revaluation of property gains/(losses) (713,976) - 30 June 3,130,689 3,239,259
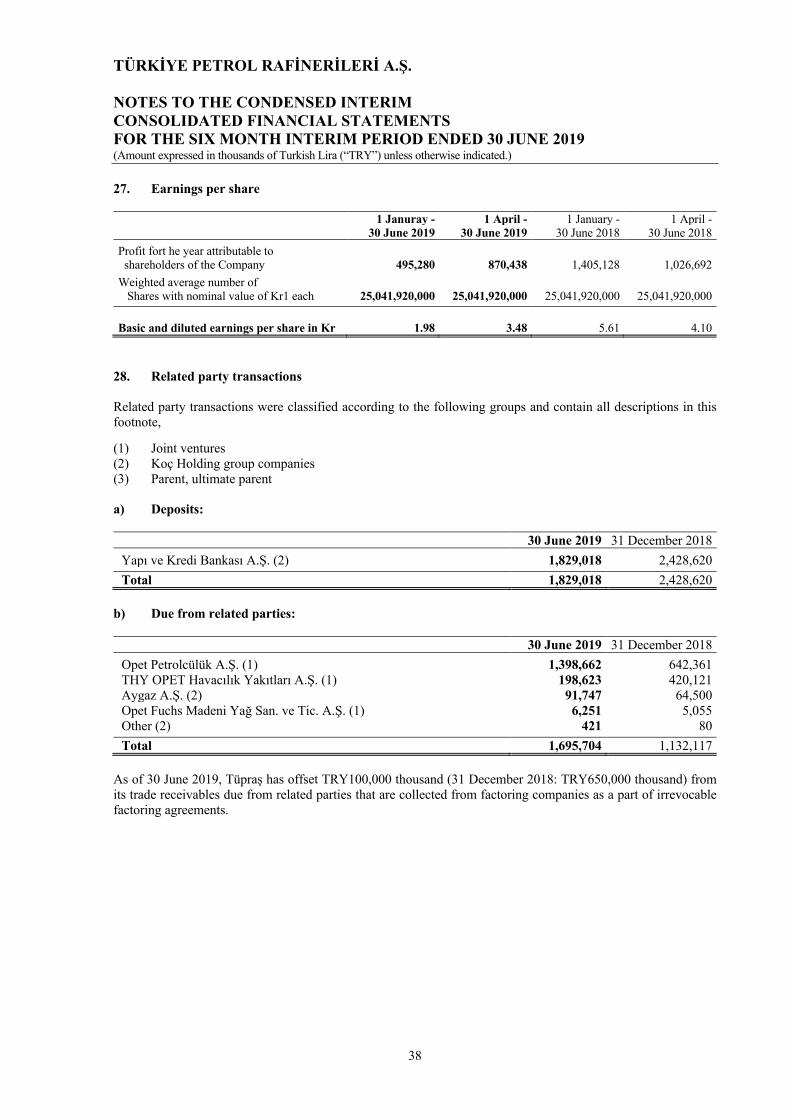
TÜRKİYE PETROL RAFİNERİLERİ A.Ş. NOTES TO THE CONDENSED INTERIM CONSOLIDATED FINANCIAL STATEMENTS FOR THE SIX MONTH INTERIM PERIOD ENDED 30 JUNE 2019 (Amount expressed in thousands of Turkish Lira (“TRY”) unless otherwise indicated.)
38
27. Earnings per share 1 Januray - 1 April - 1 January - 1 April - 30 June 2019 30 June 2019 30 June 2018 30 June 2018 Profit fort he year attributable to shareholders of the Company 495,280 870,438 1,405,128 1,026,692 Weighted average number of Shares with nominal value of Kr1 each 25,041,920,000 25,041,920,000 25,041,920,000 25,041,920,000 Basic and diluted earnings per share in Kr 1.98 3.48 5.61 4.10
28. Related party transactions Related party transactions were classified according to the following groups and contain all descriptions in this footnote,
(1) Joint ventures (2) Koç Holding group companies (3) Parent, ultimate parent a) Deposits:
30 June 2019 31 December 2018 Yapı ve Kredi Bankası A.Ş. (2) 1,829,018 2,428,620 Total 1,829,018 2,428,620
b) Due from related parties:
30 June 2019 31 December 2018 Opet Petrolcülük A.Ş. (1) 1,398,662 642,361 THY OPET Havacılık Yakıtları A.Ş. (1) 198,623 420,121 Aygaz A.Ş. (2) 91,747 64,500 Opet Fuchs Madeni Yağ San. ve Tic. A.Ş. (1) 6,251 5,055 Other (2) 421 80 Total 1,695,704 1,132,117
As of 30 June 2019, Tüpraş has offset TRY100,000 thousand (31 December 2018: TRY650,000 thousand) from its trade receivables due from related parties that are collected from factoring companies as a part of irrevocable factoring agreements.
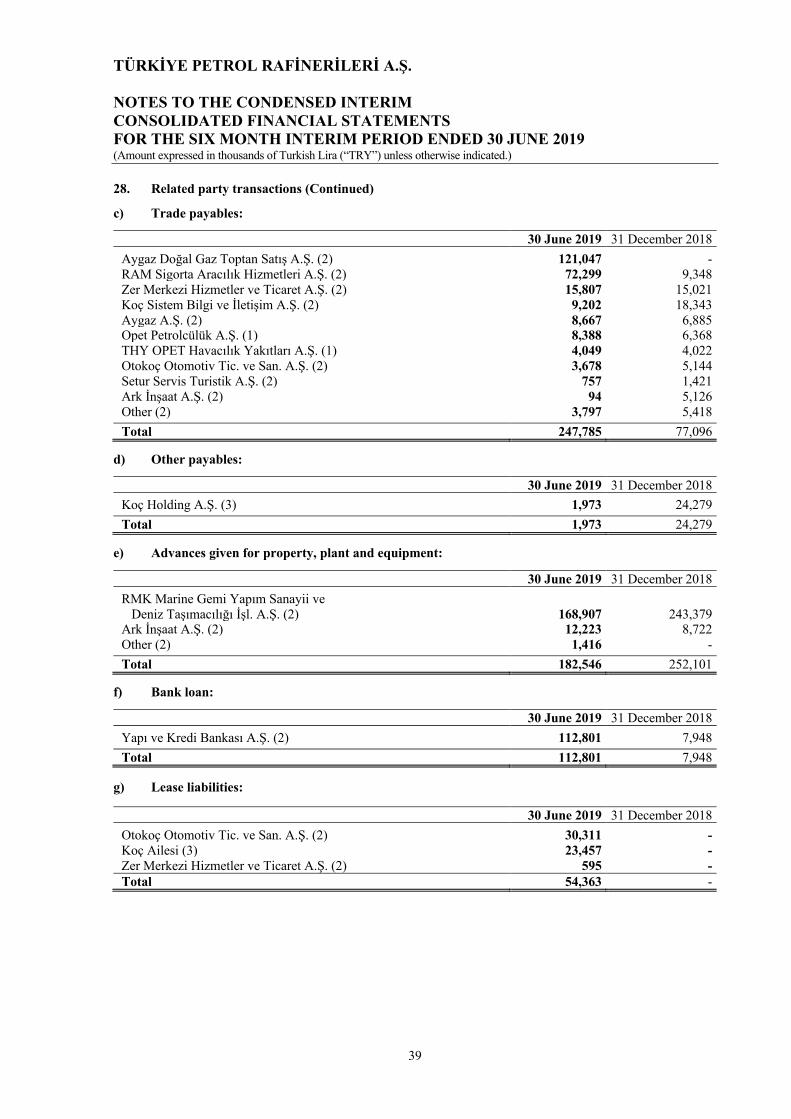
TÜRKİYE PETROL RAFİNERİLERİ A.Ş. NOTES TO THE CONDENSED INTERIM CONSOLIDATED FINANCIAL STATEMENTS FOR THE SIX MONTH INTERIM PERIOD ENDED 30 JUNE 2019 (Amount expressed in thousands of Turkish Lira (“TRY”) unless otherwise indicated.)
39
28. Related party transactions (Continued)
c) Trade payables:
30 June 2019 31 December 2018 Aygaz Doğal Gaz Toptan Satış A.Ş. (2) 121,047 - RAM Sigorta Aracılık Hizmetleri A.Ş. (2) 72,299 9,348 Zer Merkezi Hizmetler ve Ticaret A.Ş. (2) 15,807 15,021 Koç Sistem Bilgi ve İletişim A.Ş. (2) 9,202 18,343 Aygaz A.Ş. (2) 8,667 6,885 Opet Petrolcülük A.Ş. (1) 8,388 6,368 THY OPET Havacılık Yakıtları A.Ş. (1) 4,049 4,022 Otokoç Otomotiv Tic. ve San. A.Ş. (2) 3,678 5,144 Setur Servis Turistik A.Ş. (2) 757 1,421 Ark İnşaat A.Ş. (2) 94 5,126 Other (2) 3,797 5,418 Total 247,785 77,096
d) Other payables:
30 June 2019 31 December 2018 Koç Holding A.Ş. (3) 1,973 24,279 Total 1,973 24,279
e) Advances given for property, plant and equipment:
30 June 2019 31 December 2018 RMK Marine Gemi Yapım Sanayii ve
Deniz Taşımacılığı İşl. A.Ş. (2) 168,907 243,379 Ark İnşaat A.Ş. (2) 12,223 8,722 Other (2) 1,416 - Total 182,546 252,101
f) Bank loan:
30 June 2019 31 December 2018 Yapı ve Kredi Bankası A.Ş. (2) 112,801 7,948 Total 112,801 7,948
g) Lease liabilities:
30 June 2019 31 December 2018 Otokoç Otomotiv Tic. ve San. A.Ş. (2) 30,311 - Koç Ailesi (3) 23,457 - Zer Merkezi Hizmetler ve Ticaret A.Ş. (2) 595 -
Total 54,363 -
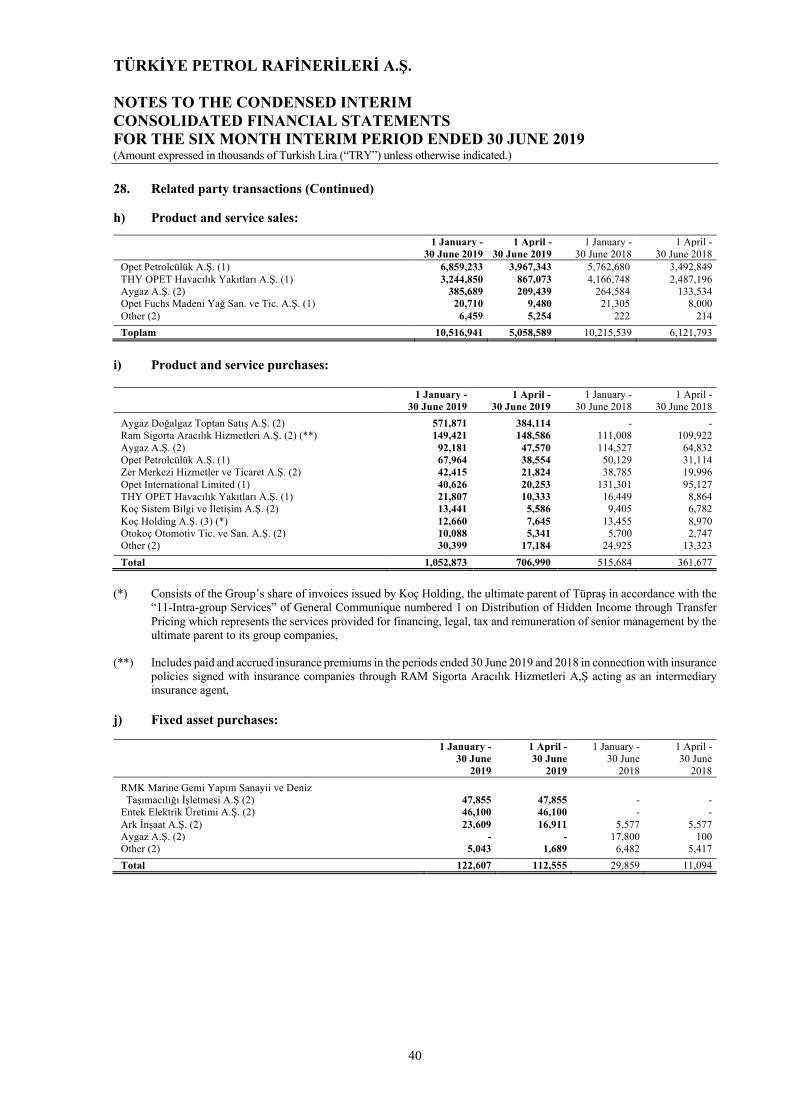
TÜRKİYE PETROL RAFİNERİLERİ A.Ş. NOTES TO THE CONDENSED INTERIM CONSOLIDATED FINANCIAL STATEMENTS FOR THE SIX MONTH INTERIM PERIOD ENDED 30 JUNE 2019 (Amount expressed in thousands of Turkish Lira (“TRY”) unless otherwise indicated.)
40
28. Related party transactions (Continued) h) Product and service sales:
1 January - 1 April - 1 January - 1 April - 30 June 2019 30 June 2019 30 June 2018 30 June 2018
Opet Petrolcülük A.Ş. (1) 6,859,233 3,967,343 5,762,680 3,492,849
THY OPET Havacılık Yakıtları A.Ş. (1) 3,244,850 867,073 4,166,748 2,487,196 Aygaz A.Ş. (2) 385,689 209,439 264,584 133,534 Opet Fuchs Madeni Yağ San. ve Tic. A.Ş. (1) 20,710 9,480 21,305 8,000
Other (2) 6,459 5,254 222 214
Toplam 10,516,941 5,058,589 10,215,539 6,121,793
i) Product and service purchases: 1 January - 1 April - 1 January - 1 April - 30 June 2019 30 June 2019 30 June 2018 30 June 2018 Aygaz Doğalgaz Toptan Satış A.Ş. (2) 571,871 384,114 - - Ram Sigorta Aracılık Hizmetleri A.Ş. (2) (**) 149,421 148,586 111,008 109,922
Aygaz A.Ş. (2) 92,181 47,570 114,527 64,832 Opet Petrolcülük A.Ş. (1) 67,964 38,554 50,129 31,114 Zer Merkezi Hizmetler ve Ticaret A.Ş. (2) 42,415 21,824 38,785 19,996
Opet International Limited (1) 40,626 20,253 131,301 95,127 THY OPET Havacılık Yakıtları A.Ş. (1) 21,807 10,333 16,449 8,864 Koç Sistem Bilgi ve İletişim A.Ş. (2) 13,441 5,586 9,405 6,782
Koç Holding A.Ş. (3) (*) 12,660 7,645 13,455 8,970 Otokoç Otomotiv Tic. ve San. A.Ş. (2) 10,088 5,341 5,700 2,747 Other (2) 30,399 17,184 24,925 13,323 Total 1,052,873 706,990 515,684 361,677
(*) Consists of the Group’s share of invoices issued by Koç Holding, the ultimate parent of Tüpraş in accordance with the
“11-Intra-group Services” of General Communique numbered 1 on Distribution of Hidden Income through Transfer Pricing which represents the services provided for financing, legal, tax and remuneration of senior management by the ultimate parent to its group companies,
(**) Includes paid and accrued insurance premiums in the periods ended 30 June 2019 and 2018 in connection with insurance
policies signed with insurance companies through RAM Sigorta Aracılık Hizmetleri A,Ş acting as an intermediary insurance agent,
j) Fixed asset purchases:
1 January - 1 April - 1 January - 1 April -
30 June
2019 30 June
2019 30 June
2018 30 June
2018
RMK Marine Gemi Yapım Sanayii ve Deniz Taşımacılığı İşletmesi A.Ş (2) 47,855 47,855 - - Entek Elektrik Üretimi A.Ş. (2) 46,100 46,100 - -
Ark İnşaat A.Ş. (2) 23,609 16,911 5,577 5,577 Aygaz A.Ş. (2) - - 17,800 100 Other (2) 5,043 1,689 6,482 5,417 Total 122,607 112,555 29,859 11,094

TÜRKİYE PETROL RAFİNERİLERİ A.Ş. NOTES TO THE CONDENSED INTERIM CONSOLIDATED FINANCIAL STATEMENTS FOR THE SIX MONTH INTERIM PERIOD ENDED 30 JUNE 2019 (Amount expressed in thousands of Turkish Lira (“TRY”) unless otherwise indicated.)
41
28. Related party transactions (Continued) k) Remuneration of board of directors and executive management: The senior management of the Company is determined as members and chair of the Board of Directors and General Manager and General Manager Deputies, The total amount of benefits provided to senior management is TRY14,035 thousand as of period ending on 30 June 2019 (30 June 2018 - TRY5,516 thousand). TRY6,700 (30 June 2018 - None) of this amount is related to payments due to termination of employment and the remaining portion consists of short-term benefits. l) Financial expenses paid to related parties:
1 January - 1 April - 1 January - 1 April - 30 June 2019 30 June 2019 30 June 2018 30 June 2018 Yapı Kredi Faktoring A.Ş. (2) 8,167 6,348 1,215 825 Yapı ve Kredi Bankası A.Ş. (2) 11,623 5,761 267 267 Yapı Kredi Bank Nederland N.V.(2) 179 1 - - Total 19,969 12,110 1,482 1,092
m) Time deposit interest income:
1 January - 1 April - 1 January - 1 April - 30 June 2019 30 June 2019 30 June 2018 30 June 2018 Yapı ve Kredi Bankası A.Ş. (2) 51,413 23,776 89,925 36,637 Total 51,413 23,776 89,925 36,637
n) Donations:
As of 30 June 2019, total donation is amounting to TRY26 thousand (30 June 2018 - TRY6,143 thousand).
29. Financial instruments and financial risk management
The Group’s activities expose it to a variety of financial risks, including the effects of changes in debt and equity market prices, foreign currency exchange rates and interest rates. The Group’s overall risk management program focuses on the unpredictability of financial markets and seeks to minimize potential adverse effects on the financial performance of the Group.
Credit risk: The Group is subject to credit risk arising from trade receivables related to credit sales, deposits at banks. These risks are managed by limiting the aggregate risk from any individual counterparty and obtaining sufficient collateral where necessary and making only cash based sales to customers considered as having a higher risk. Collectability of trade receivables are evaluated by management depending on their past experiences and current economic condition, and are presented in the consolidated financial statements net of adequate doubtful provision.
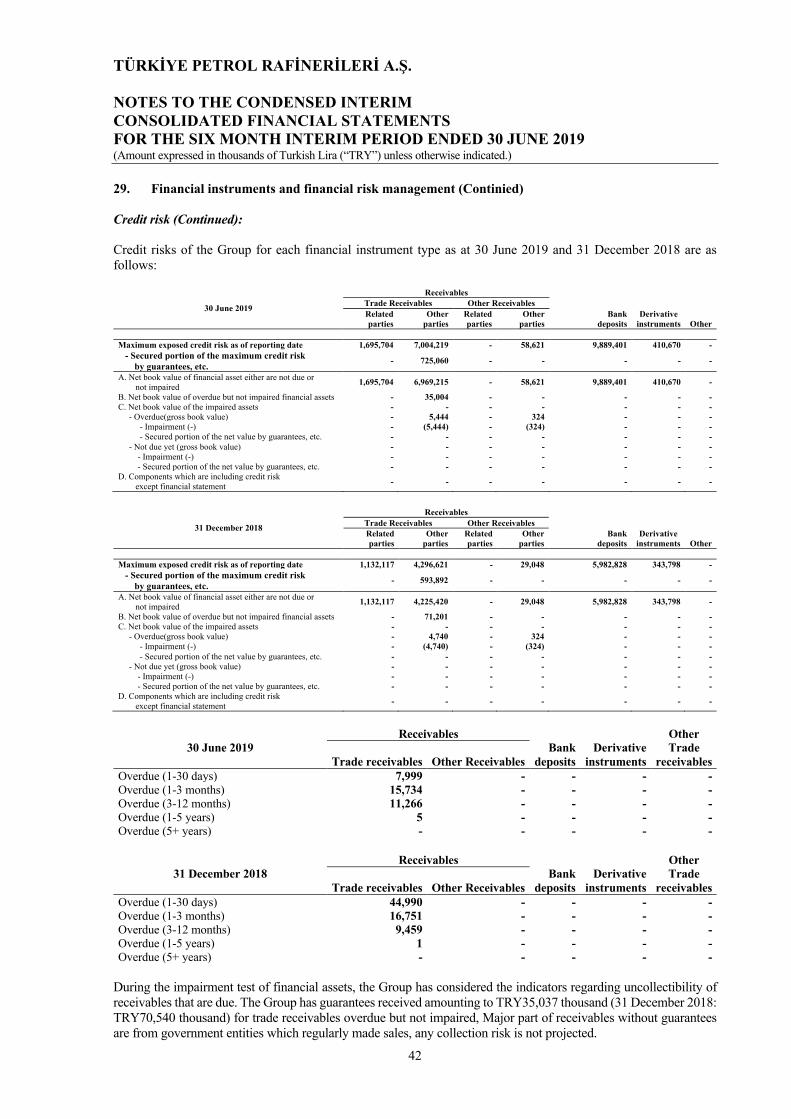
TÜRKİYE PETROL RAFİNERİLERİ A.Ş. NOTES TO THE CONDENSED INTERIM CONSOLIDATED FINANCIAL STATEMENTS FOR THE SIX MONTH INTERIM PERIOD ENDED 30 JUNE 2019 (Amount expressed in thousands of Turkish Lira (“TRY”) unless otherwise indicated.)
42
29. Financial instruments and financial risk management (Continied) Credit risk (Continued): Credit risks of the Group for each financial instrument type as at 30 June 2019 and 31 December 2018 are as follows:
30 June 2019
Receivables
Bank deposits
Derivative instruments Other
Trade Receivables Other Receivables
Related parties
Other parties
Related parties
Other parties
Maximum exposed credit risk as of reporting date 1,695,704 7,004,219 - 58,621 9,889,401 410,670 -
- Secured portion of the maximum credit risk by guarantees, etc.
- 725,060 - - - - -
A. Net book value of financial asset either are not due or not impaired
1,695,704 6,969,215 - 58,621 9,889,401 410,670 -
B. Net book value of overdue but not impaired financial assets - 35,004 - - - - - C. Net book value of the impaired assets - - - - - - - - Overdue(gross book value) - 5,444 - 324 - - - - Impairment (-) - (5,444) - (324) - - - - Secured portion of the net value by guarantees, etc. - - - - - - -
- Not due yet (gross book value) - - - - - - - - Impairment (-) - - - - - - - - Secured portion of the net value by guarantees, etc. - - - - - - - D. Components which are including credit risk except financial statement
- - - - - - -
31 December 2018
Receivables
Bank deposits
Derivative instruments Other
Trade Receivables Other Receivables
Related parties
Other parties
Related parties
Other parties
Maximum exposed credit risk as of reporting date 1,132,117 4,296,621 - 29,048 5,982,828 343,798 -
- Secured portion of the maximum credit risk by guarantees, etc.
- 593,892 - - - - -
A. Net book value of financial asset either are not due or not impaired
1,132,117 4,225,420 - 29,048 5,982,828 343,798 -
B. Net book value of overdue but not impaired financial assets - 71,201 - - - - - C. Net book value of the impaired assets - - - - - - - - Overdue(gross book value) - 4,740 - 324 - - - - Impairment (-) - (4,740) - (324) - - -
- Secured portion of the net value by guarantees, etc. - - - - - - - - Not due yet (gross book value) - - - - - - - - Impairment (-) - - - - - - - - Secured portion of the net value by guarantees, etc. - - - - - - - D. Components which are including credit risk except financial statement
- - - - - - -
30 June 2019 Receivables
Bank deposits
Derivative instruments
Other Trade
receivables Trade receivables Other Receivables
Overdue (1-30 days) 7,999 - - - - Overdue (1-3 months) 15,734 - - - - Overdue (3-12 months) 11,266 - - - - Overdue (1-5 years) 5 - - - - Overdue (5+ years) - - - - -
31 December 2018 Receivables
Bank deposits
Derivative instruments
Other Trade
receivables Trade receivables Other Receivables
Overdue (1-30 days) 44,990 - - - - Overdue (1-3 months) 16,751 - - - - Overdue (3-12 months) 9,459 - - - - Overdue (1-5 years) 1 - - - - Overdue (5+ years) - - - - -
During the impairment test of financial assets, the Group has considered the indicators regarding uncollectibility of receivables that are due. The Group has guarantees received amounting to TRY35,037 thousand (31 December 2018: TRY70,540 thousand) for trade receivables overdue but not impaired, Major part of receivables without guarantees are from government entities which regularly made sales, any collection risk is not projected.
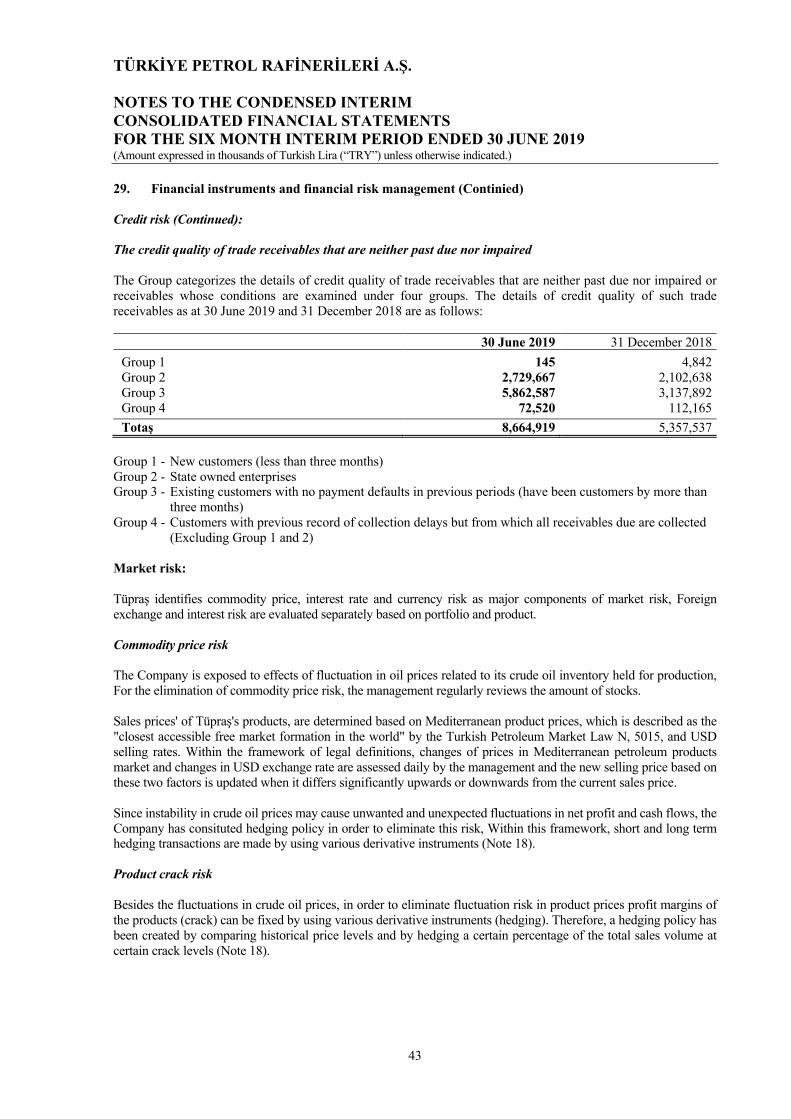
TÜRKİYE PETROL RAFİNERİLERİ A.Ş. NOTES TO THE CONDENSED INTERIM CONSOLIDATED FINANCIAL STATEMENTS FOR THE SIX MONTH INTERIM PERIOD ENDED 30 JUNE 2019 (Amount expressed in thousands of Turkish Lira (“TRY”) unless otherwise indicated.)
43
29. Financial instruments and financial risk management (Continied) Credit risk (Continued): The credit quality of trade receivables that are neither past due nor impaired The Group categorizes the details of credit quality of trade receivables that are neither past due nor impaired or receivables whose conditions are examined under four groups. The details of credit quality of such trade receivables as at 30 June 2019 and 31 December 2018 are as follows:
30 June 2019 31 December 2018 Group 1 145 4,842 Group 2 2,729,667 2,102,638 Group 3 5,862,587 3,137,892 Group 4 72,520 112,165 Totaş 8,664,919 5,357,537
Group 1 - New customers (less than three months) Group 2 - State owned enterprises Group 3 - Existing customers with no payment defaults in previous periods (have been customers by more than
three months) Group 4 - Customers with previous record of collection delays but from which all receivables due are collected
(Excluding Group 1 and 2) Market risk: Tüpraş identifies commodity price, interest rate and currency risk as major components of market risk, Foreign exchange and interest risk are evaluated separately based on portfolio and product. Commodity price risk The Company is exposed to effects of fluctuation in oil prices related to its crude oil inventory held for production, For the elimination of commodity price risk, the management regularly reviews the amount of stocks. Sales prices' of Tüpraş's products, are determined based on Mediterranean product prices, which is described as the "closest accessible free market formation in the world" by the Turkish Petroleum Market Law N, 5015, and USD selling rates. Within the framework of legal definitions, changes of prices in Mediterranean petroleum products market and changes in USD exchange rate are assessed daily by the management and the new selling price based on these two factors is updated when it differs significantly upwards or downwards from the current sales price. Since instability in crude oil prices may cause unwanted and unexpected fluctuations in net profit and cash flows, the Company has consituted hedging policy in order to eliminate this risk, Within this framework, short and long term hedging transactions are made by using various derivative instruments (Note 18). Product crack risk Besides the fluctuations in crude oil prices, in order to eliminate fluctuation risk in product prices profit margins of the products (crack) can be fixed by using various derivative instruments (hedging). Therefore, a hedging policy has been created by comparing historical price levels and by hedging a certain percentage of the total sales volume at certain crack levels (Note 18).

TÜRKİYE PETROL RAFİNERİLERİ A.Ş. NOTES TO THE CONDENSED INTERIM CONSOLIDATED FINANCIAL STATEMENTS FOR THE SIX MONTH INTERIM PERIOD ENDED 30 JUNE 2019 (Amount expressed in thousands of Turkish Lira (“TRY”) unless otherwise indicated.)
44
29. Financial instruments and financial risk management (Continued) Foreign exchange risk The Group is exposed to foreign exchange risk due to operations in foreign currency. These risks are managed by analysis of the foreign currency monetary assets and liabilities in the consolidated financial statements, by a comprehensive risk tracking system which includes natural hedging and similar practices. The table below summarizes the net balance sheet foreign currency position risk and components that are managed within the risk tracking system of the Group as at 30 June 2019 and 31 December 2018:
30 June 2019 31 December 2018
TRY USD(*) TRY USD(*)
Monetary assets 6,560,878 1,140,011 5,288,783 1,005,300 Monetary liabilities (26,700,944) (4,639,527) (20,841,883) (3,961,657)
Monetary assets / (liabilities)
foreign currency position (20,140,066) (3,499,516) (15,553,100) (2,956,357)
Non-monetary assets 77,409 13,451 807,947 153,576
Net foreign currency position
of derivative financial instruments 6,807,901 1,182,934 3,302,295 627,705
Net foreign currency asset / (liability) position (13,254,756) (2,303,132) (11,442,858) (2,175,076)
Cash flow hedging (**) 5,172,240 898,723 5,166,635 982,082
Net foreign currency position after cash flow hedging
(8,082,516) (1,404,409) (6,276,223) (1,192,994)
Inventory in natural hedge scope (***) 8,090,851 1,405,858 6,333,567 1,203,894
Net foreign currency position after cash flow hedging and natural hedge
8,335 1,448 57,344 10,900
(*) Dollar equivalent amounts are determined through dividing total TRY equivalent positions to exchange rate of dollar
as at balance sheet date. (**) The Group uses investment loans amounting to USD898,723 thousand, which is equivalent to TRY5,172,240 thousand
(USD982,082 thousand / TRY5,166,635 thousand in 31 December 2018) as prevention against USD/TRY spot foreign exchange risk of USD denominated export revenue, which is highly probable to be realized. Based on the outcome of effectiveness test performed on related process, the Group has considered that the process is fully effective and therefore applied cash flow hedge accounting. As of 30 June 2019, TRY2,739,885 (31 December 2018 - TRY2,575,965 thousand) thousand of foreign exchange loss that arose from investment loans is classified under equity “Cash flow hedge gains (losses)” which has no effect on current year income statement. As of 30 June 2019, the foreign exchange loss amounting to TRY345,304 thousand corresponding to the export income of investment loans denominated in USD has been transferred to the foreign exchange loss in the income statement from “Cash flow hedge gains (losses)" account under equity. Moreover, as of 30 June 2019, foreign exchange loss of these loans in 2019 amounting to TRY509,224 were added to the "Cash flow hedge gains (losses)" account under equity.
(***) The Group manages its foreign currency risk arising from foreign currency denominated financial liabilities and trade
payables by regularly considering and reflecting the foreign exchange rate changes in the determination of petroleum product prices. As at 30 June 2019, the Group has crude oil and petroleum products inventories amounting to TRY8,090,851 thousand (31 December 2018: TRY6,333,567 thousand).
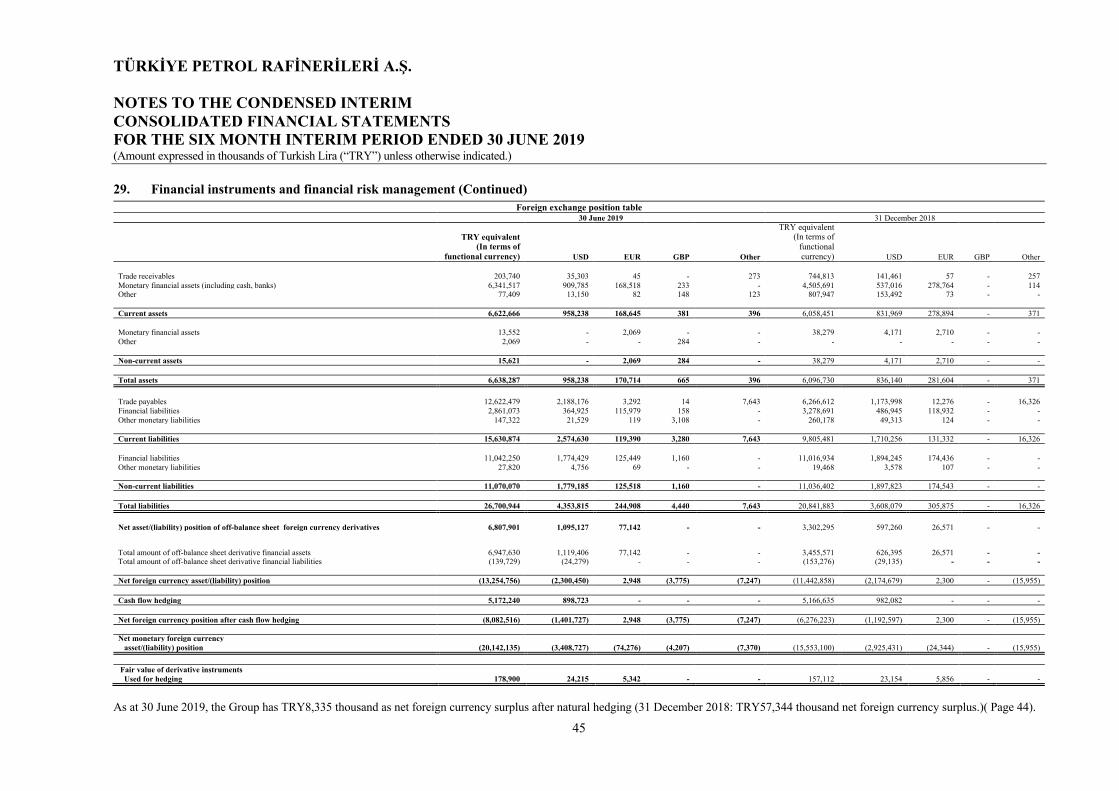
TÜRKİYE PETROL RAFİNERİLERİ A.Ş. NOTES TO THE CONDENSED INTERIM CONSOLIDATED FINANCIAL STATEMENTS FOR THE SIX MONTH INTERIM PERIOD ENDED 30 JUNE 2019 (Amount expressed in thousands of Turkish Lira (“TRY”) unless otherwise indicated.)
45
29. Financial instruments and financial risk management (Continued)
Foreign exchange position table
30 June 2019 31 December 2018
TRY equivalent (In terms of
functional currency) USD EUR GBP Other
TRY equivalent (In terms of
functional currency) USD EUR GBP Other
Trade receivables 203,740 35,303 45 - 273 744,813 141,461 57 - 257 Monetary financial assets (including cash, banks) 6,341,517 909,785 168,518 233 - 4,505,691 537,016 278,764 - 114 Other 77,409 13,150 82 148 123 807,947 153,492 73 - - Current assets 6,622,666 958,238 168,645 381 396 6,058,451 831,969 278,894 - 371 Monetary financial assets 13,552 - 2,069 - - 38,279 4,171 2,710 - - Other 2,069 - - 284 - - - - - - Non-current assets 15,621 - 2,069 284 - 38,279 4,171 2,710 - - Total assets 6,638,287 958,238 170,714 665 396 6,096,730 836,140 281,604 - 371
Trade payables 12,622,479 2,188,176 3,292 14 7,643 6,266,612 1,173,998 12,276 - 16,326 Financial liabilities 2,861,073 364,925 115,979 158 - 3,278,691 486,945 118,932 - - Other monetary liabilities 147,322 21,529 119 3,108 - 260,178 49,313 124 - - Current liabilities 15,630,874 2,574,630 119,390 3,280 7,643 9,805,481 1,710,256 131,332 - 16,326 Financial liabilities 11,042,250 1,774,429 125,449 1,160 - 11,016,934 1,894,245 174,436 - - Other monetary liabilities 27,820 4,756 69 - - 19,468 3,578 107 - - Non-current liabilities 11,070,070 1,779,185 125,518 1,160 - 11,036,402 1,897,823 174,543 - - Total liabilities 26,700,944 4,353,815 244,908 4,440 7,643 20,841,883 3,608,079 305,875 - 16,326
Net asset/(liability) position of off-balance sheet foreign currency derivatives 6,807,901 1,095,127 77,142 - - 3,302,295 597,260 26,571 - - Total amount of off-balance sheet derivative financial assets 6,947,630 1,119,406 77,142 - - 3,455,571 626,395 26,571 - - Total amount of off-balance sheet derivative financial liabilities (139,729) (24,279) - - - (153,276) (29,135) - - - Net foreign currency asset/(liability) position (13,254,756) (2,300,450) 2,948 (3,775) (7,247) (11,442,858) (2,174,679) 2,300 - (15,955) Cash flow hedging 5,172,240 898,723 - - - 5,166,635 982,082 - - - Net foreign currency position after cash flow hedging (8,082,516) (1,401,727) 2,948 (3,775) (7,247) (6,276,223) (1,192,597) 2,300 - (15,955) Net monetary foreign currency asset/(liability) position (20,142,135) (3,408,727) (74,276) (4,207) (7,370) (15,553,100) (2,925,431) (24,344) - (15,955)
Fair value of derivative instruments Used for hedging 178,900 24,215 5,342 - - 157,112 23,154 5,856 - -
As at 30 June 2019, the Group has TRY8,335 thousand as net foreign currency surplus after natural hedging (31 December 2018: TRY57,344 thousand net foreign currency surplus.)( Page 44).
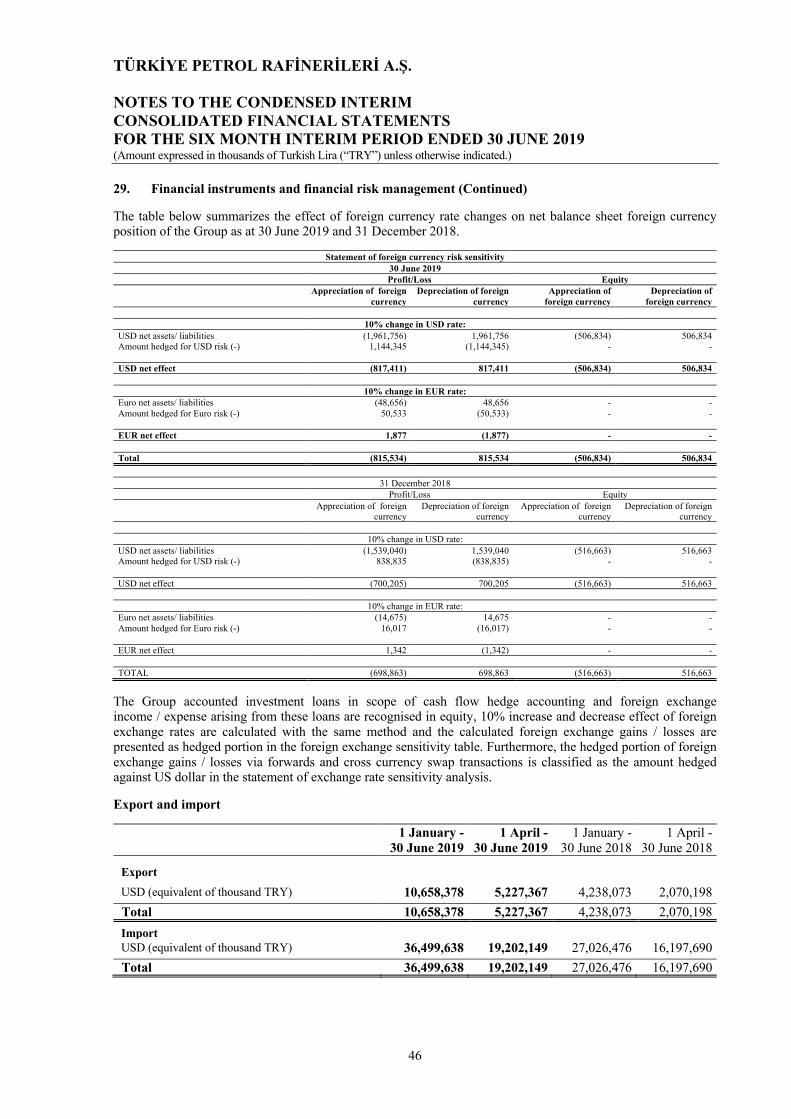
TÜRKİYE PETROL RAFİNERİLERİ A.Ş. NOTES TO THE CONDENSED INTERIM CONSOLIDATED FINANCIAL STATEMENTS FOR THE SIX MONTH INTERIM PERIOD ENDED 30 JUNE 2019 (Amount expressed in thousands of Turkish Lira (“TRY”) unless otherwise indicated.)
46
29. Financial instruments and financial risk management (Continued)
The table below summarizes the effect of foreign currency rate changes on net balance sheet foreign currency position of the Group as at 30 June 2019 and 31 December 2018.
Statement of foreign currency risk sensitivity
30 June 2019
Profit/Loss Equity
Appreciation of foreign
currency Depreciation of foreign
currency Appreciation of
foreign currency Depreciation of
foreign currency
10% change in USD rate:
USD net assets/ liabilities (1,961,756) 1,961,756 (506,834) 506,834 Amount hedged for USD risk (-) 1,144,345 (1,144,345) - - USD net effect (817,411) 817,411 (506,834) 506,834
10% change in EUR rate:
Euro net assets/ liabilities (48,656) 48,656 - - Amount hedged for Euro risk (-) 50,533 (50,533) - - EUR net effect 1,877 (1,877) - -
Total (815,534) 815,534 (506,834) 506,834
31 December 2018
Profit/Loss Equity
Appreciation of foreign
currency Depreciation of foreign
currency Appreciation of foreign
currency Depreciation of foreign
currency
10% change in USD rate: USD net assets/ liabilities (1,539,040) 1,539,040 (516,663) 516,663 Amount hedged for USD risk (-) 838,835 (838,835) - - USD net effect (700,205) 700,205 (516,663) 516,663
10% change in EUR rate: Euro net assets/ liabilities (14,675) 14,675 - - Amount hedged for Euro risk (-) 16,017 (16,017) - - EUR net effect 1,342 (1,342) - - TOTAL (698,863) 698,863 (516,663) 516,663
The Group accounted investment loans in scope of cash flow hedge accounting and foreign exchange income / expense arising from these loans are recognised in equity, 10% increase and decrease effect of foreign exchange rates are calculated with the same method and the calculated foreign exchange gains / losses are presented as hedged portion in the foreign exchange sensitivity table. Furthermore, the hedged portion of foreign exchange gains / losses via forwards and cross currency swap transactions is classified as the amount hedged against US dollar in the statement of exchange rate sensitivity analysis. Export and import 1 January - 1 April - 1 January - 1 April - 30 June 2019 30 June 2019 30 June 2018 30 June 2018 Export
USD (equivalent of thousand TRY) 10,658,378 5,227,367 4,238,073 2,070,198 Total 10,658,378 5,227,367 4,238,073 2,070,198 Import USD (equivalent of thousand TRY) 36,499,638 19,202,149 27,026,476 16,197,690 Total 36,499,638 19,202,149 27,026,476 16,197,690
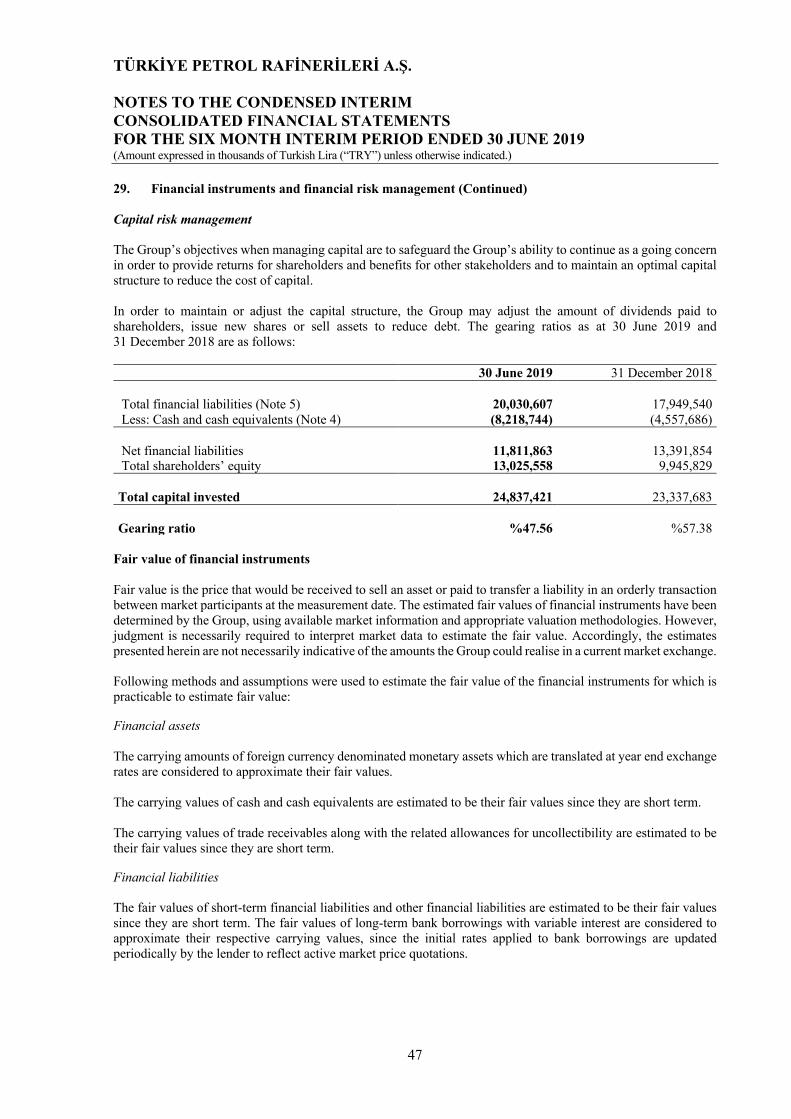
TÜRKİYE PETROL RAFİNERİLERİ A.Ş. NOTES TO THE CONDENSED INTERIM CONSOLIDATED FINANCIAL STATEMENTS FOR THE SIX MONTH INTERIM PERIOD ENDED 30 JUNE 2019 (Amount expressed in thousands of Turkish Lira (“TRY”) unless otherwise indicated.)
47
29. Financial instruments and financial risk management (Continued) Capital risk management The Group’s objectives when managing capital are to safeguard the Group’s ability to continue as a going concern in order to provide returns for shareholders and benefits for other stakeholders and to maintain an optimal capital structure to reduce the cost of capital. In order to maintain or adjust the capital structure, the Group may adjust the amount of dividends paid to shareholders, issue new shares or sell assets to reduce debt. The gearing ratios as at 30 June 2019 and 31 December 2018 are as follows:
30 June 2019 31 December 2018 Total financial liabilities (Note 5) 20,030,607 17,949,540 Less: Cash and cash equivalents (Note 4) (8,218,744) (4,557,686) Net financial liabilities 11,811,863 13,391,854 Total shareholders’ equity 13,025,558 9,945,829 Total capital invested 24,837,421 23,337,683 Gearing ratio %47.56 %57.38
Fair value of financial instruments Fair value is the price that would be received to sell an asset or paid to transfer a liability in an orderly transaction between market participants at the measurement date. The estimated fair values of financial instruments have been determined by the Group, using available market information and appropriate valuation methodologies. However, judgment is necessarily required to interpret market data to estimate the fair value. Accordingly, the estimates presented herein are not necessarily indicative of the amounts the Group could realise in a current market exchange. Following methods and assumptions were used to estimate the fair value of the financial instruments for which is practicable to estimate fair value: Financial assets The carrying amounts of foreign currency denominated monetary assets which are translated at year end exchange rates are considered to approximate their fair values. The carrying values of cash and cash equivalents are estimated to be their fair values since they are short term. The carrying values of trade receivables along with the related allowances for uncollectibility are estimated to be their fair values since they are short term. Financial liabilities The fair values of short-term financial liabilities and other financial liabilities are estimated to be their fair values since they are short term. The fair values of long-term bank borrowings with variable interest are considered to approximate their respective carrying values, since the initial rates applied to bank borrowings are updated periodically by the lender to reflect active market price quotations.
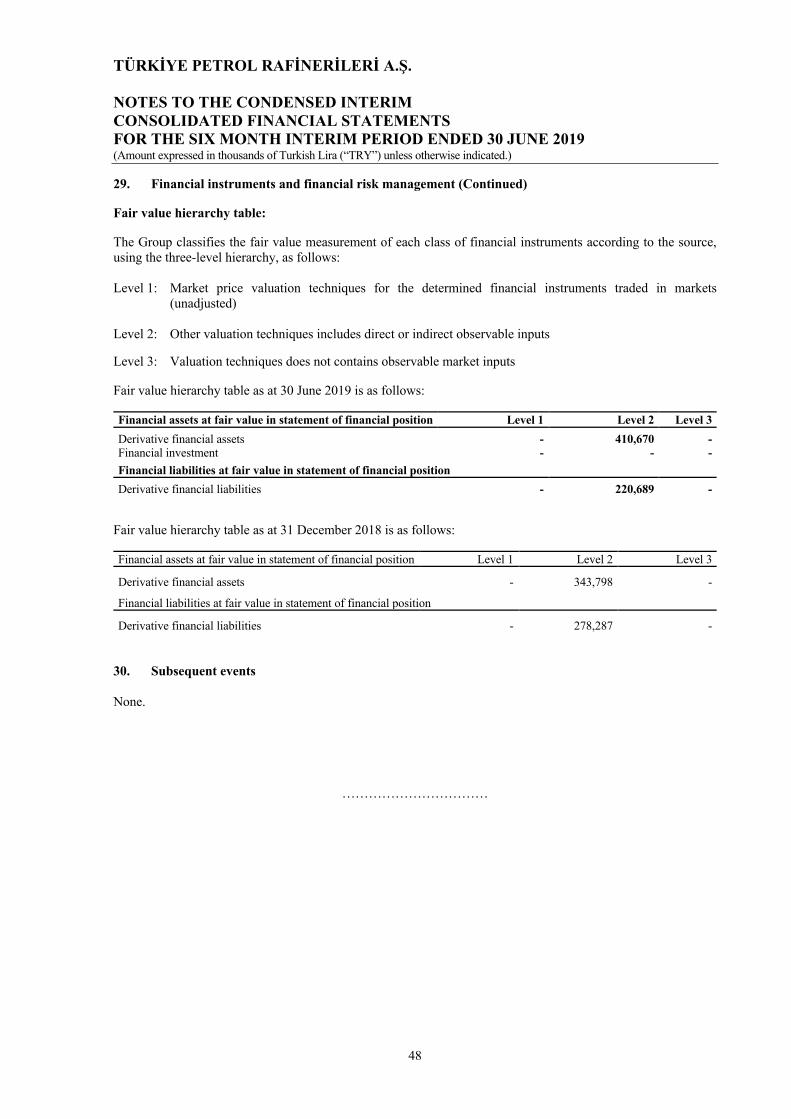
TÜRKİYE PETROL RAFİNERİLERİ A.Ş. NOTES TO THE CONDENSED INTERIM CONSOLIDATED FINANCIAL STATEMENTS FOR THE SIX MONTH INTERIM PERIOD ENDED 30 JUNE 2019 (Amount expressed in thousands of Turkish Lira (“TRY”) unless otherwise indicated.)
48
29. Financial instruments and financial risk management (Continued) Fair value hierarchy table: The Group classifies the fair value measurement of each class of financial instruments according to the source, using the three-level hierarchy, as follows: Level 1: Market price valuation techniques for the determined financial instruments traded in markets
(unadjusted) Level 2: Other valuation techniques includes direct or indirect observable inputs Level 3: Valuation techniques does not contains observable market inputs Fair value hierarchy table as at 30 June 2019 is as follows: Financial assets at fair value in statement of financial position Level 1 Level 2 Level 3
Derivative financial assets - 410,670 - Financial investment - - -
Financial liabilities at fair value in statement of financial position Derivative financial liabilities - 220,689 -
Fair value hierarchy table as at 31 December 2018 is as follows: Financial assets at fair value in statement of financial position Level 1 Level 2 Level 3
Derivative financial assets - 343,798 -
Financial liabilities at fair value in statement of financial position Derivative financial liabilities - 278,287 -
30. Subsequent events None.
……………………………