april 2018 ipaa ogis new york - … affecting ultimate recovery include the sc ope of legacy’s...
TRANSCRIPT

APRIL 2018
IPAA OGIS NEW YORK
2
Certain Disclosures
Forward-Looking InformationThis presentation relates to the proposed corporate reorganization between Legacy and New Legacy (the “Transaction”) and includes “forward-looking statements” within the meaning of Section 27A of the Securities Act of 1933, as amended, and Section 21E of the Securities Exchange Act of 1934, as amended, including, without limitation, statements regarding the expected benefits of the Transaction to Legacy and its unitholders, the anticipated completion of the Transaction or the timing thereof, the expected future growth, dividends, distributions of the reorganized company, and plans and objectives of management for future operations. All statements, other than statements of historical facts, included in this presentation that address activities, events or developments that Legacy expects, believes or anticipates will or may occur in the future, are forward-looking statements. Words such as “anticipates,” “expects,” “intends,” “plans,” “targets,” “projects,” “believes,” “seeks,”“schedules,” “estimated,” and similar expressions are intended to identify such forward-looking statements. These forward-looking statements rely on a number of assumptions concerning future events and are subject to a number of uncertainties, factors and risks, many of which are outside the control of Legacy, which could cause results to differ materially from those expected by management of Legacy. Such risks and uncertainties include, but are not limited to, realized oil and natural gas prices; production volumes, lease operating expenses, general and administrative costs and finding and development costs; future operating results; and the factors set forth under the heading “Risk Factors” in Legacy’s filings with the U.S. Securities and Exchange Commission (the “SEC”), including its Annual Report on Form 10-K, Quarterly Reports on Form 10-Q and Current Reports on Form 8-K. The reader should not place undue reliance on these forward-looking statements, which speak only as of the date of this presentation. Unless legally required, Legacy undertakes no obligation to update publicly any forward-looking statements, whether as a result of new information, future events or otherwise.Reserve EstimatesThe SEC permits oil and natural gas companies, in their filings with the SEC, to disclose only proved, probable and possible reserves that meet the SEC’s definitions for such terms. Legacy discloses proved reserves but does not disclose probable or possible reserves. “Proved reserves” are those quantities of oil and gas, which, by analysis of geoscience and engineering data, can be estimated with reasonable certainty to be economically producible—from a given date forward, from known reservoirs, and under existing economic conditions, operating methods, and government regulations—prior to the time at which contracts providing the right to operate expire, unless evidence indicates that renewal is reasonably certain, regardless of whether deterministic or probabilistic methods are used for the estimation. Legacy may use terms in this presentation that the SEC’s guidelines strictly prohibit in SEC filings, such as “estimated ultimate recovery” or “EUR,” “resource potential,” “development potential,” “potential bench” and similar terms to estimate oil and natural gas that may ultimately be recovered. Legacy defines EUR as estimates of the sum of reserves remaining as of a given date and cumulative production as of that date from a currently producing or hypothetical future well, as applicable. These broader classifications do not constitute reserves as defined by the SEC. Estimates of such broader classification of volumes are by their nature more speculative than estimates of proved, probable and possible reserves as used in SEC filings and, accordingly, are subject to substantially greater uncertainty of being actually realized. You should not assume that such terms are comparable to proved, probable and possible reserves or represent estimates of future production from properties or are indicative of expected future resource recovery. Actual locations drilled and quantities that may be ultimately recovered will likely differ substantially from these estimates. Factors affecting ultimate recovery include the scope of Legacy’s actual drilling program, availability of capital, drilling and production costs, commodity prices, availability of drilling services and equipment, actual encountered geological conditions, lease expirations, transportation constraints, regulatory approvals, field spacing rules, actual drilling results and recoveries of oil and natural gas in place, and other factors. These estimates may change significantly as the development of properties provides additional data.Reserve engineering is a complex and subjective process of estimating underground accumulations of oil and natural gas that cannot be measured in an exact way and the accuracy of any reserve estimate is a function of the quality of available data and of engineering and geological interpretation and judgment. Investors are also urged to consider closely the disclosure relating to “Risk Factors” in the Annual Report and subsequent filings with the SEC, which are available from Legacy’s website at www.legacylp.com or on the SEC’s website at www.sec.gov, for a discussion of the risks and uncertainties involved in the process of estimating reserves.Additional Information and Where to Find ItThe Transaction will be submitted to Legacy’s unitholders for their consideration and approval. In connection with the Transaction, Legacy and New Legacy will prepare and file with the SEC a registration statement on Form S-4 that will include a proxy statement of Legacy and a prospectus of New Legacy (the “proxy statement/prospectus”). In connection with the Transaction, Legacy plans to mail the definitive proxy statement/prospectus to its unitholders.INVESTORS AND UNITHOLDERS ARE URGED TO READ THE PROXY STATEMENT/PROSPECTUS AND OTHER RELEVANT DOCUMENTS FILED OR TO BE FILED WITH THE SEC CAREFULLY AND IN THEIR ENTIRETY WHEN THEY BECOME AVAILABLE BECAUSE THEY WILL CONTAIN IMPORTANT INFORMATION ABOUT LEGACY AND NEW LEGACY, AS WELL AS THE PROPOSED TRANSACTION AND RELATED MATTERS.This communication does not constitute an offer to sell or the solicitation of an offer to buy any securities or a solicitation of any vote or approval, nor shall there be any sale of securities in any jurisdiction in which such offer, solicitation or sale would be unlawful prior to registration or qualification under the securities laws of any such jurisdiction. No offering of securities shall be made except by means of a prospectus meeting the requirements of Section 10 of the U.S. Securities Act of 1933, as amended.A free copy of the proxy statement/prospectus and other filings containing information about Legacy and New Legacy may be obtained at the SEC’s Internet site at www.sec.gov. In addition, the documents filed with the SEC by Legacy and New Legacy may be obtained free of charge by directing such request to: Legacy Reserves LP, Attention: Investor Relations, at 303 W. Wall, Suite 1800, Midland, Texas 79701 or emailing [email protected] or calling 855-534-5200. These documents may also be obtained for free from Legacy’s investor relations website at https://www.legacylp.com/investor-relations.Participants in Solicitation Relating to the TransactionLegacy and its general partner’s directors, executive officers, other members of management and employees may be deemed to be participants in the solicitation of proxies from Legacy’s unitholders in respect of the Transaction that will be described in the proxy statement/prospectus. Information regarding the directors and executive officers of Legacy’s general partner is contained in Legacy’s public filings with the SEC, including its definitive proxy statement on Form DEF 14A filed with the SEC on April 6, 2018 and its Current Report on Form 8-K filed with the SEC on February 21, 2018.A more complete description will be available in the registration statement and the proxy statement/prospectus.Identified Drilling LocationsLegacy’s estimates of gross identified potential drilling locations (as used herein, “locations”, “identified locations,” “identified horizontal locations” or “identified drilling locations”) are prepared internally by Legacy’s engineers, geologists and management and are based upon a number of assumptions inherent in the estimates process. Management, with the assistance of Legacy’s engineers and other professionals, as necessary, conducts a topographical analysis of Legacy’s unproved prospective acreage to identify potential well pad locations. Legacy’s engineers and geologists then apply well spacing assumptions based on industry activity in analogous regions. A net location is calculated as a formula of a gross location multiplied by the ratio of net acreage over gross acreage. Legacy then multiplies this calculation by a pooling factor where appropriate. Legacy generally assumes minimum 5,000’ laterals. Management uses these estimates to, among other things, evaluate Legacy’s acreage holdings and formulate plans for drilling. A number of factors could cause the number of wells Legacy actually drills to vary significantly from these estimates, including the availability of capital, drilling and production costs, oil and natural gas prices, lease expirations, regulatory approvals and other factors.Non-GAAP Financial MeasuresLegacy’s management uses Adjusted EBITDA as a tool to provide additional information and a metric relative to the performance of Legacy’s business. Legacy’s management believes that Adjusted EBITDA is useful to investors because this measure is used by many companies in the industry as a measure of operating and financial performance and is commonly employed by financial analysts and others to evaluate the operating and financial performance of Legacy from period to period and to compare it with the performance of our peers. Adjusted EBITDA may not be comparable to a similarly titled measure of such peers because all entities may not calculate Adjusted EBITDA in the same manner. Adjusted EBITDA should not be considered as an alternative to GAAP measures, such as net income, operating income, cash flow from operating activities or any other GAAP measure of financial performance.
3
37%
28%2%
33%65%
16% 2%
17%46%
28%
1%
25%
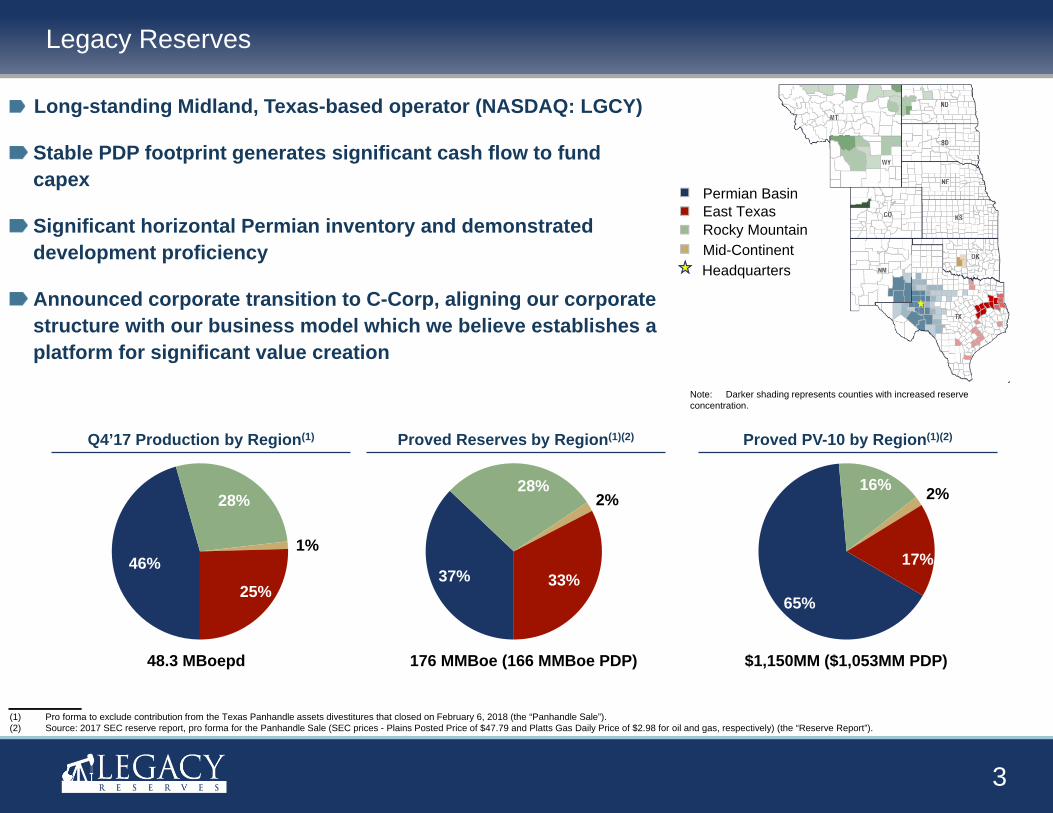
Legacy Reserves
Long-standing Midland, Texas-based operator (NASDAQ: LGCY)
Stable PDP footprint generates significant cash flow to fund capex
Significant horizontal Permian inventory and demonstrated development proficiency
Announced corporate transition to C-Corp, aligning our corporate structure with our business model which we believe establishes a platform for significant value creation
$1,150MM ($1,053MM PDP)176 MMBoe (166 MMBoe PDP)48.3 MBoepd
(1) Pro forma to exclude contribution from the Texas Panhandle assets divestitures that closed on February 6, 2018 (the “Panhandle Sale”).(2) Source: 2017 SEC reserve report, pro forma for the Panhandle Sale (SEC prices - Plains Posted Price of $47.79 and Platts Gas Daily Price of $2.98 for oil and gas, respectively) (the “Reserve Report”).
Permian Basin
Rocky MountainMid-Continent
East Texas
Headquarters
Q4’17 Production by Region(1) Proved Reserves by Region(1)(2) Proved PV-10 by Region(1)(2)
Note: Darker shading represents counties with increased reserve concentration.
4
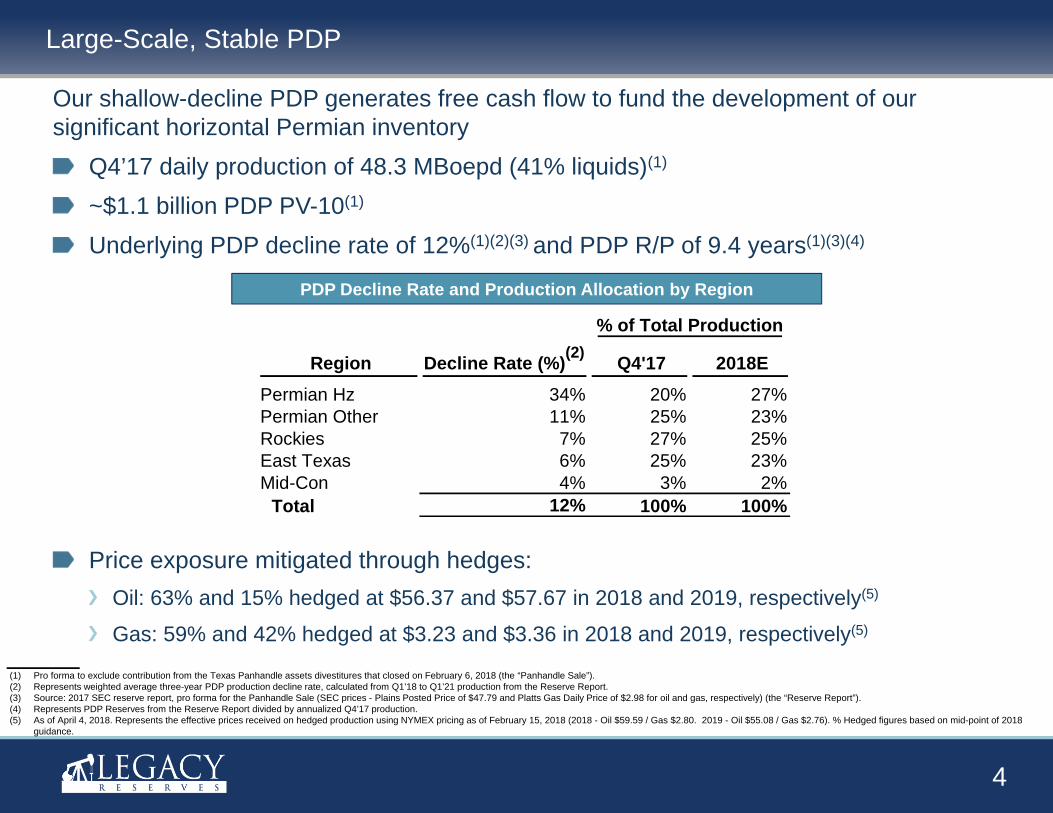
Our shallow-decline PDP generates free cash flow to fund the development of our significant horizontal Permian inventory
Q4’17 daily production of 48.3 MBoepd (41% liquids)(1)
~$1.1 billion PDP PV-10(1)
Underlying PDP decline rate of 12%(1)(2)(3) and PDP R/P of 9.4 years(1)(3)(4)
Price exposure mitigated through hedges:Oil: 63% and 15% hedged at $56.37 and $57.67 in 2018 and 2019, respectively(5)
Gas: 59% and 42% hedged at $3.23 and $3.36 in 2018 and 2019, respectively(5)
Large-Scale, Stable PDP
PDP Decline Rate and Production Allocation by Region
(1) Pro forma to exclude contribution from the Texas Panhandle assets divestitures that closed on February 6, 2018 (the “Panhandle Sale”).(2) Represents weighted average three-year PDP production decline rate, calculated from Q1’18 to Q1’21 production from the Reserve Report.(3) Source: 2017 SEC reserve report, pro forma for the Panhandle Sale (SEC prices - Plains Posted Price of $47.79 and Platts Gas Daily Price of $2.98 for oil and gas, respectively) (the “Reserve Report”).(4) Represents PDP Reserves from the Reserve Report divided by annualized Q4’17 production.(5) As of April 4, 2018. Represents the effective prices received on hedged production using NYMEX pricing as of February 15, 2018 (2018 - Oil $59.59 / Gas $2.80. 2019 - Oil $55.08 / Gas $2.76). % Hedged figures based on mid-point of 2018
guidance.
% of Total Production
Region Decline Rate (%)(2) Q4'17 2018E Permian Hz 34% 20% 27%Permian Other 11% 25% 23%Rockies 7% 27% 25%East Texas 6% 25% 23%Mid-Con 4% 3% 2%
Total 12% 100% 100%
5
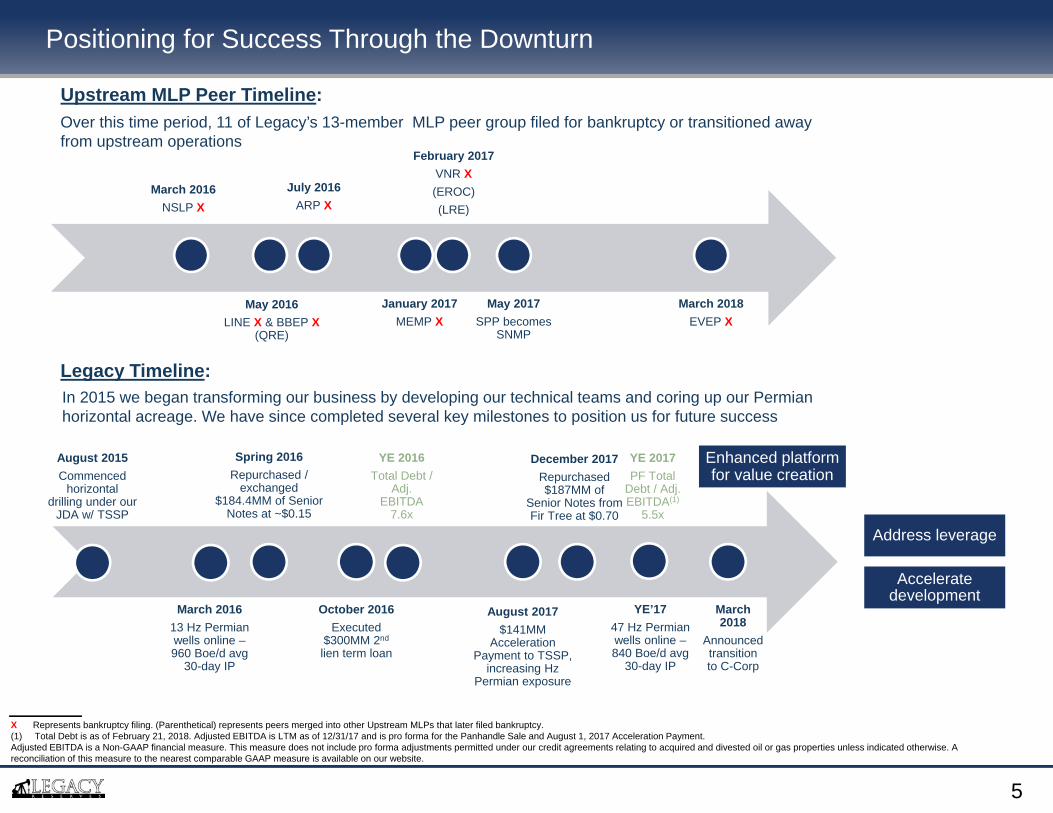
Positioning for Success Through the Downturn
Legacy Timeline:
March 2016NSLP X
May 2016LINE X & BBEP X
(QRE)
July 2016ARP X
January 2017MEMP X
February 2017VNR X(EROC)(LRE)
March 2018EVEP X
Over this time period, 11 of Legacy’s 13-member MLP peer group filed for bankruptcy or transitioned away from upstream operations
Upstream MLP Peer Timeline:
August 2015 Commenced
horizontal drilling under our
JDA w/ TSSP
March 201613 Hz Permian wells online –960 Boe/d avg
30-day IP
Spring 2016Repurchased /
exchanged $184.4MM of Senior
Notes at ~$0.15
October 2016Executed
$300MM 2nd
lien term loan
August 2017$141MM
Acceleration Payment to TSSP,
increasing Hz Permian exposure
YE’1747 Hz Permian wells online –840 Boe/d avg
30-day IP
December 2017Repurchased $187MM of
Senior Notes from Fir Tree at $0.70
March 2018
Announced transition to C-Corp
Address leverage
Accelerate development
YE 2016Total Debt /
Adj. EBITDA
7.6x
YE 2017PF Total
Debt / Adj. EBITDA(1)
5.5x
Enhanced platform for value creation
X Represents bankruptcy filing. (Parenthetical) represents peers merged into other Upstream MLPs that later filed bankruptcy. (1) Total Debt is as of February 21, 2018. Adjusted EBITDA is LTM as of 12/31/17 and is pro forma for the Panhandle Sale and August 1, 2017 Acceleration Payment. Adjusted EBITDA is a Non-GAAP financial measure. This measure does not include pro forma adjustments permitted under our credit agreements relating to acquired and divested oil or gas properties unless indicated otherwise. A reconciliation of this measure to the nearest comparable GAAP measure is available on our website.
May 2017SPP becomes
SNMP
In 2015 we began transforming our business by developing our technical teams and coring up our Permian horizontal acreage. We have since completed several key milestones to position us for future success
6
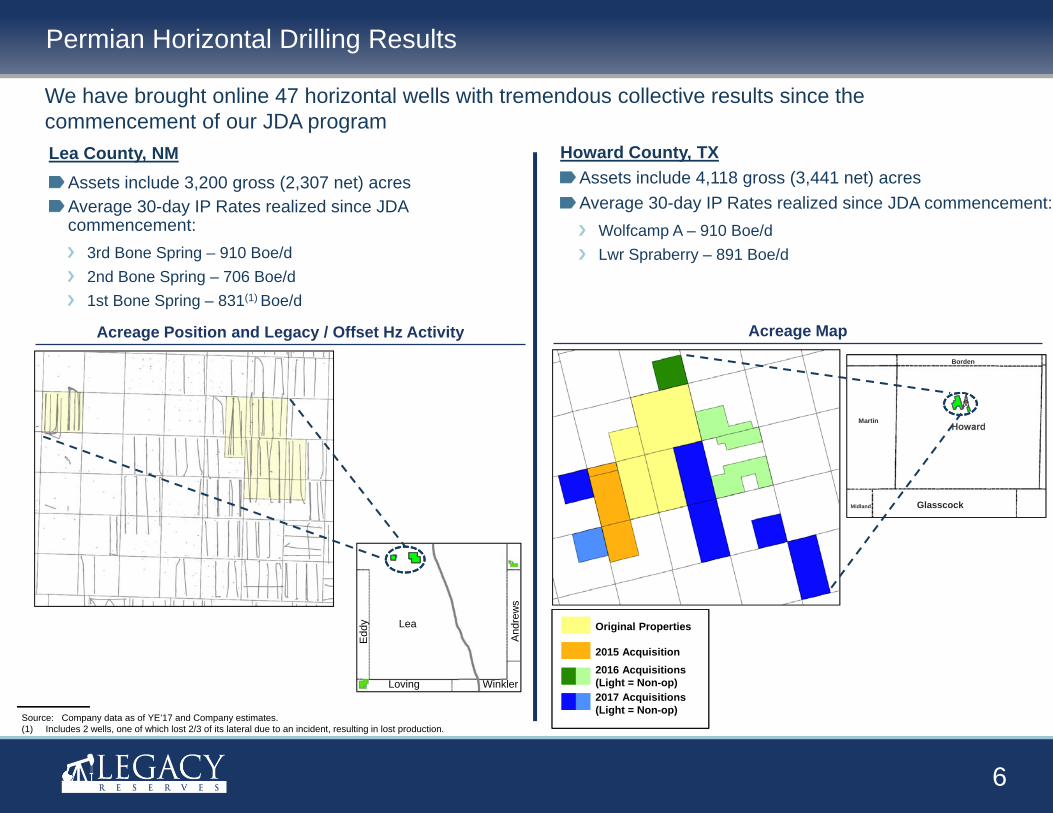
Source: Company data as of YE’17 and Company estimates.(1) Includes 2 wells, one of which lost 2/3 of its lateral due to an incident, resulting in lost production.
Permian Horizontal Drilling Results
Acreage Position and Legacy / Offset Hz Activity
Lea County, NMAssets include 3,200 gross (2,307 net) acresAverage 30-day IP Rates realized since JDA commencement:
3rd Bone Spring – 910 Boe/d2nd Bone Spring – 706 Boe/d1st Bone Spring – 831(1) Boe/d
Borden
Martin
Midland Glasscock
Original Properties
2015 Acquisition
2017 Acquisitions (Light = Non-op)
2016 Acquisitions (Light = Non-op)
Acreage Map
Howard County, TXAssets include 4,118 gross (3,441 net) acresAverage 30-day IP Rates realized since JDA commencement:
Wolfcamp A – 910 Boe/dLwr Spraberry – 891 Boe/d
We have brought online 47 horizontal wells with tremendous collective results since the commencement of our JDA program
And
rew
s
Lea
Loving Winkler
Edd
y
7
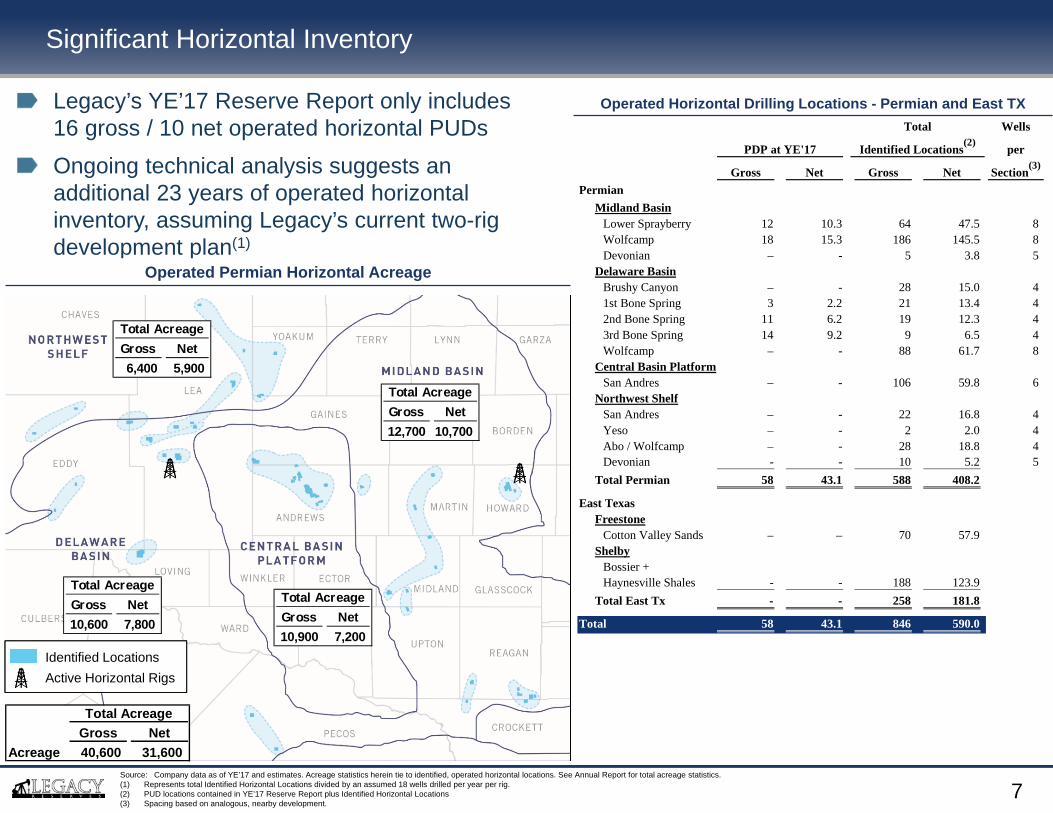
Legacy’s YE’17 Reserve Report only includes 16 gross / 10 net operated horizontal PUDs
Ongoing technical analysis suggests an additional 23 years of operated horizontal inventory, assuming Legacy’s current two-rig development plan(1)
Significant Horizontal Inventory
Operated Horizontal Drilling Locations - Permian and East TX
Operated Permian Horizontal Acreage
Source: Company data as of YE’17 and estimates. Acreage statistics herein tie to identified, operated horizontal locations. See Annual Report for total acreage statistics.(1) Represents total Identified Horizontal Locations divided by an assumed 18 wells drilled per year per rig.(2) PUD locations contained in YE’17 Reserve Report plus Identified Horizontal Locations(3) Spacing based on analogous, nearby development.
Total AcreageGross Net6,400 5,900
Total AcreageGross Net12,700 10,700
Total AcreageGross Net10,900 7,200
Identified LocationsActive Horizontal Rigs
Total AcreageGross Net10,600 7,800
Total Wells
PDP at YE'17 Identified Locations(2) per
Gross Net Gross Net Section(3)
PermianMidland Basin
Lower Sprayberry 12 10.3 64 47.5 8Wolfcamp 18 15.3 186 145.5 8Devonian – - 5 3.8 5
Delaware BasinBrushy Canyon – - 28 15.0 41st Bone Spring 3 2.2 21 13.4 42nd Bone Spring 11 6.2 19 12.3 43rd Bone Spring 14 9.2 9 6.5 4Wolfcamp – - 88 61.7 8
Central Basin PlatformSan Andres – - 106 59.8 6
Northwest ShelfSan Andres – - 22 16.8 4Yeso – - 2 2.0 4Abo / Wolfcamp – - 28 18.8 4Devonian - - 10 5.2 5
Total Permian 58 43.1 588 408.2
East TexasFreestone
Cotton Valley Sands – – 70 57.9 Shelby
Bossier +Haynesville Shales - - 188 123.9
Total East Tx - - 258 181.8
Total 58 43.1 846 590.0
Total AcreageGross Net
Acreage 40,600 31,600

8
Key structural and ownership changes:Legacy units exchanged one-to-one for common shares in New LegacyNew Legacy acquires Legacy’s General Partner (“GP LLC”)9.5 million preferred units exchanged for ~16.9 million common shares of New Legacy
Corporate Transition Overview
Existing Structure & Ownership Pro Forma Structure & Ownership(1)
(1) Includes the effect of ~1.6 million LTIP units vesting upon a Change of Control. See latest S-4 filing for more complete details.
Legacy Reserves
LP
GP LLC
Creditors
New Legacy Inc.
<0.1% GP Interest
Existing82.3%
Preferred17.7%
Legacy’s existing Revolver, 2nd Lien Term Loan and Senior Notes will remain in place as such agreements have been amended to permit the Transaction.
Preferred
Legacy Reserves
LP
GP LLC
<0.1% GP Interest
Existing99.9+%
Creditors
9
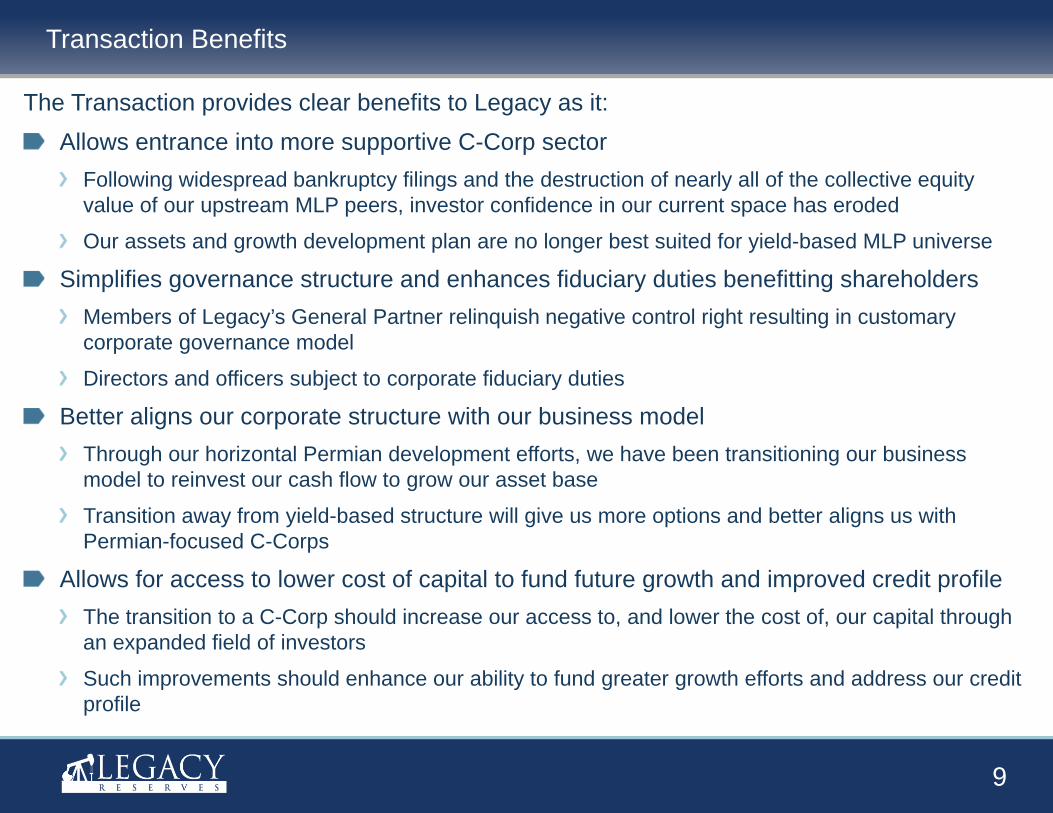
The Transaction provides clear benefits to Legacy as it:Allows entrance into more supportive C-Corp sector
Following widespread bankruptcy filings and the destruction of nearly all of the collective equity value of our upstream MLP peers, investor confidence in our current space has eroded
Our assets and growth development plan are no longer best suited for yield-based MLP universe
Simplifies governance structure and enhances fiduciary duties benefitting shareholdersMembers of Legacy’s General Partner relinquish negative control right resulting in customary corporate governance model
Directors and officers subject to corporate fiduciary duties
Better aligns our corporate structure with our business modelThrough our horizontal Permian development efforts, we have been transitioning our business model to reinvest our cash flow to grow our asset base
Transition away from yield-based structure will give us more options and better aligns us with Permian-focused C-Corps
Allows for access to lower cost of capital to fund future growth and improved credit profileThe transition to a C-Corp should increase our access to, and lower the cost of, our capital through an expanded field of investors
Such improvements should enhance our ability to fund greater growth efforts and address our credit profile
Transaction Benefits
10
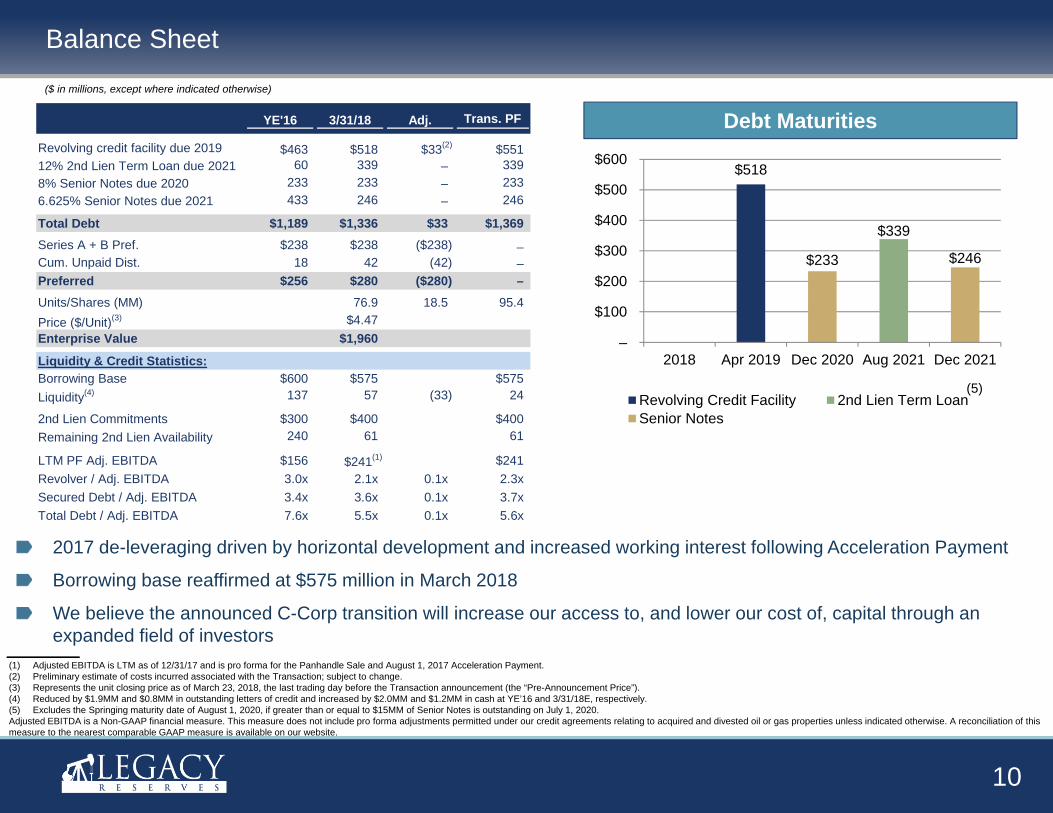
$518
$339
$233 $246
–
$100
$200
$300
$400
$500
$600
2018 Apr 2019 Dec 2020 Aug 2021 Dec 2021
Revolving Credit Facility 2nd Lien Term LoanSenior Notes
Balance Sheet
(1) Adjusted EBITDA is LTM as of 12/31/17 and is pro forma for the Panhandle Sale and August 1, 2017 Acceleration Payment. (2) Preliminary estimate of costs incurred associated with the Transaction; subject to change. (3) Represents the unit closing price as of March 23, 2018, the last trading day before the Transaction announcement (the “Pre-Announcement Price”).(4) Reduced by $1.9MM and $0.8MM in outstanding letters of credit and increased by $2.0MM and $1.2MM in cash at YE’16 and 3/31/18E, respectively.(5) Excludes the Springing maturity date of August 1, 2020, if greater than or equal to $15MM of Senior Notes is outstanding on July 1, 2020.Adjusted EBITDA is a Non-GAAP financial measure. This measure does not include pro forma adjustments permitted under our credit agreements relating to acquired and divested oil or gas properties unless indicated otherwise. A reconciliation of this measure to the nearest comparable GAAP measure is available on our website.
Debt Maturities
(5)
2017 de-leveraging driven by horizontal development and increased working interest following Acceleration Payment
Borrowing base reaffirmed at $575 million in March 2018
We believe the announced C-Corp transition will increase our access to, and lower our cost of, capital through an expanded field of investors
($ in millions, except where indicated otherwise)
YE'16 3/31/18 Adj. Trans. PF
Revolving credit facility due 2019 $463 $518 $33(2) $55112% 2nd Lien Term Loan due 2021 60 339 – 3398% Senior Notes due 2020 233 233 – 2336.625% Senior Notes due 2021 433 246 – 246
Total Debt $1,189 $1,336 $33 $1,369Series A + B Pref. $238 $238 ($238) –Cum. Unpaid Dist. 18 42 (42) –Preferred $256 $280 ($280) –Units/Shares (MM) 76.9 18.5 95.4Price ($/Unit)(3) $4.47Enterprise Value $1,960
Liquidity & Credit Statistics:Borrowing Base $600 $575 $575Liquidity(4) 137 57 (33) 24
2nd Lien Commitments $300 $400 $400Remaining 2nd Lien Availability 240 61 61
LTM PF Adj. EBITDA $156 $241(1) $241Revolver / Adj. EBITDA 3.0x 2.1x 0.1x 2.3xSecured Debt / Adj. EBITDA 3.4x 3.6x 0.1x 3.7xTotal Debt / Adj. EBITDA 7.6x 5.5x 0.1x 5.6x

11
(1) EV / Enterprise Value represents market cap as of March 23, 2018 + Total Debt + Preferred.(2) Based on financial guidance within press release dated February 21, 2018. Adjusted EBITDA is a Non-GAAP financial measure. A reconciliation of this measure to the nearest comparable GAAP measure is available on our website.(3) Based on the Pre-Announcement Price of $4.47.(4) Based on the Pre-Announcement Price of $8.30 and conversion to common at applicable exchange ratio of 1.962.(5) Based on the Pre-Announcement Price of $8.16 and conversion to common at applicable exchange ratio of 1.72236.
Implied Share Price at Various EBITDA Multiples
Many E&P C-Corps trade at higher EBITDA multiples which would imply higher LGCY share prices
LGCY Range of EBITDA MultiplesCurrent EV / '18E EBITDA(1) 5.9x 6.0x 6.5x 7.0x 7.5x 8.0x 8.5x2018E Adjusted EBITDA(2) $330 $330 $330 $330 $330 $330 $330
Current Enterprise Value(1) $1,960 $1,980 $2,145 $2,310 $2,475 $2,640 $2,805Implied Pro Forma Trading Values:
Less : PF Total Debt ($1,369) ($1,369) ($1,369) ($1,369) ($1,369) ($1,369) ($1,369)Market Cap $591 $611 $776 $941 $1,106 $1,271 $1,436
PF Share Count 95.4 95.4 95.4 95.4 95.4 95.4 95.4PF Share Price $6.19 $6.40 $8.13 $9.87 $11.60 $13.33 $15.06
% Inc to Current LP(3) 39% 43% 82% 121% 159% 198% 237%% Inc to Series A Value(4) 46% 51% 92% 133% 174% 215% 256%% Inc to Series B Value(5) 31% 35% 72% 108% 145% 181% 218%
12
Key Takeaways
Stable, low-decline PDP with meaningful free cash flow
Significant operated horizontal inventory
Experienced team with capacity to accelerate development
Proposed structure expected to enhance access to, and cost of, capital