april 2011 - icici prudential life insurance · avaya global connect, ... and expansion in...
TRANSCRIPT

April 2011
Sustained leadership in life insurance

2
Agenda
2
Industry overview and outlook
ICICI Prudential: Strategic elements
Performance snapshot

3
Agenda
3
Industry overview and outlook
ICICI Prudential: Strategic elements
Performance snapshot

Evolution of industry since liberalisation
Total premium (USD bn)
Penetration (as a % to
GDP)
New business
premium1
(USD bn)
Number of players
Insurance premium per
capita (USD)
FY 2010
23
11.96
57.70
~4.3%
~42
FY 2002
13
2.37
10.22
~2.0%
~9
21% CAGR
24% CAGR
1 Retail weighted premium
Source: IRDA, Swiss Re, market estimates
Exchange rate FY 2002 $1=INR 49
FY 2010 S1=INR 464

Industry: New business premium
YOY
Growth
17% 34% 92% 31% (10%)
Source: IRDA, weighted new business premiums for individual
business
5
17% (8%)
0
50
100
150
200
250
300
IN
R in
b
illio
ns
FY 2005 FY 2006 FY 2007 FY 2008 FY 2009 FY 2010 FY 2011
LIC Private

Industry: AUM
6
Source: Life insurance council
4.23
5.49
6.99
8.48
9.34
12.90
14.67
0
5
10
15
IN
R in
trillio
ns
FY 2005 FY 2006 FY 2007 FY 2008 FY 2009 FY 2010 9m 2011

18.9%
CAGR
12.3%
CAGR
12.0%
CAGR
1Net inflow into Insurance
Household savings
Insurance1
FY
2010
28
Financial savings
Nominal GDP
Growth opportunity
FY
2015E
50
540
248
2,388
FY
2000
5
424
12.0%
CAGR
1,355
Significant opportunity at current savings rate
7
13.2%
CAGR
89
45
12.1%
CAGR
12.0%
CAGR
12.0%
CAGR
306
141
USD bn

-20%
0%
20%
40%
60%
80%
100%
1999-00 2000-01 2001-02 2002-03 2003-04 2004-05 2005-06 2006-07 2007-08 2008-09
Currency & Deposits Life Insurance Fund Shares/ Debentures / MFS
Provident and Pension Fund Claims on Government
Increasing life insurance fund
8
Distribution of financial savings
12.1%
20.1%

Source: UN Population division
Favourable demographics
9
Target population expected to increase by over 500 mn
by 2050
38
31
23
18
19
19
16
13
37
42
49
49
6
8
12
20
0 20 40 60 80 100
1990
2010
2030
2050
Ye
ar
Percentage
Aged 0-14 Aged 15-24 Aged 25-60 Aged 60 and above
69%
50%

Agenda
10
Industry overview and outlook
ICICI Prudential: Strategic elements
Performance snapshot

11
Sustained leadership
Highest brand recall and consideration value
amongst private players1
Brand
5,000+ - No. of distribution touch points
176,076 - No. of advisors
50+ - Corporate tie ups & bancassurance
partners
Distribution2
1. Source: Millward Brown Quarterly Brand Track ‘ Oct 2010
2. As at March 31, 2011
Sustained private market leadership
INR 47.80 bn of capital infused till March 2011
Strong parentage: ICICI Bank & Prudential PLC
Strong team of around 13,000 professionals
Organisation

12
Sustained leadership (cont..)
Servicing tie up : Over 10,000 touch points
High customer convenience: Over 60%1
service transactions through electronic modes
Rated most customer responsive company2
Service
Products catering to all life cycle needsProduct
1. For FY 2011
2. Avaya Global Connect, 2005, 2007 & 2010
13
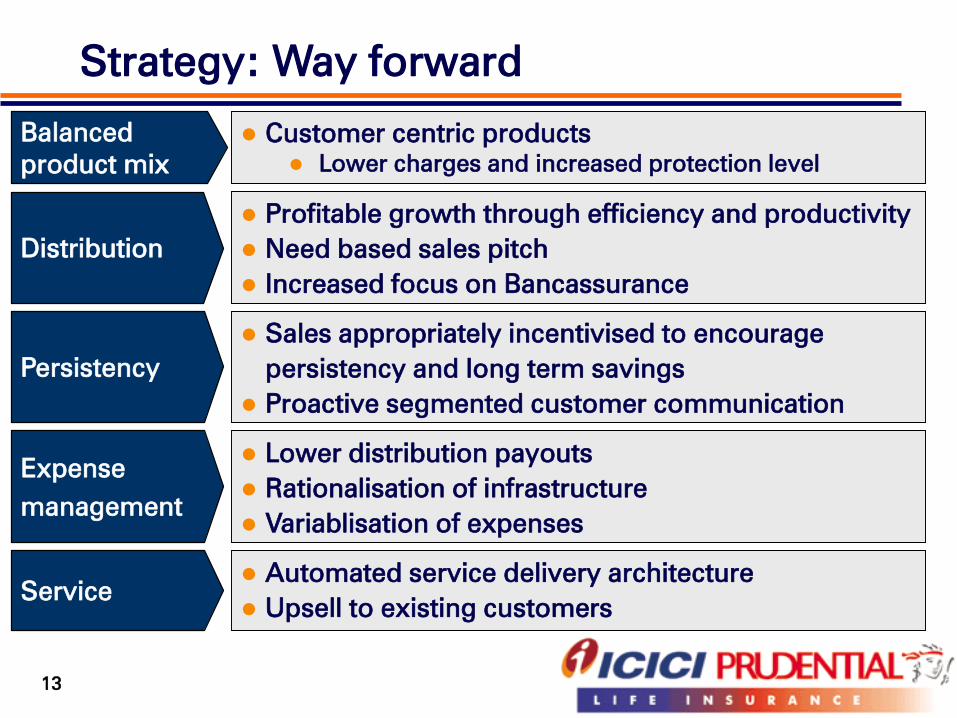
Strategy: Way forward
Profitable growth through efficiency and productivity
Need based sales pitch
Increased focus on Bancassurance
Distribution
Sales appropriately incentivised to encourage
persistency and long term savings
Proactive segmented customer communication
Persistency
Customer centric products
Lower charges and increased protection level
Balanced
product mix
Lower distribution payouts
Rationalisation of infrastructure
Variablisation of expenses
Expense
management
Automated service delivery architecture
Upsell to existing customersService

14
Agenda
14
Industry overview and outlook
ICICI Prudential: Strategic elements
Performance snapshot

APE (INR bn)
NBP margin2
Expense ratio1
Total premium (INR bn)
Asset under management (INR bn)
Profit after tax (INR bn)
Performance snapshot
15
FY 2010
53.45
19.0%
19.5%
165.32
573.18
2.58
FY 2011
39.75
17.9%
17.3%
178.81
681.50
8.08
1Expense ratio: All expenses (incl. commission) / (Total premium
– 90% of single premium)
2Traditional embedded value basis
Renewal premium (INR bn) 101.98 100.19
New business premium (INR bn) 63.34 78.62

Policies issued since inception
16
7.05
9.56
10.83
12.74
0
2
4
6
8
10
12
14
16
No
. in
m
illio
ns
FY 2008 FY 2009 FY 2010 FY 2011

92.36
193.42
166.50
161.38
192.19
381.00
248.25
433.25
0
100
200
300
400
500
600
700
IN
R in
b
illio
ns
March
2008
March
2009
March
2010
March
2011
Debt Equi ty
327.88
285.78
573.19
681.50
1717
Robust growth in assets held
Among the largest domestic fund managers

6.0%
7.4%
5.8%
6.8%
11.5%
13.4%
20.3%
23.2%
0%
5%
10%
15%
20%
25%
Preserver Protector Balancer Maximiser
Benchmark Fund
18
Superior fund performance
Inception Dates:
Preserver Fund: May 17, 2004 Protector Fund: April 2, 2002 Balancer Fund : April 2, 2002 Maximiser
Fund: November 16, 2001
Performance since inception as on March 31, 2011
1All funds in existence for over a year

Sharp decline in expense ratio
Total Expense ratio: All expenses (incl. commission) / (Total premium – 90% of single premium)
Expense ratio: All expenses (excl. commission and front line sales cost) / (Total premium – 90% of single
premium)
19
17.3%
19.5%
23.0%
8.2%9.1%
11.8%
0.0%
5.0%
10.0%
15.0%
20.0%
25.0%
FY 2009 FY 2010 FY 2011
Total expense ratio Expense ratio
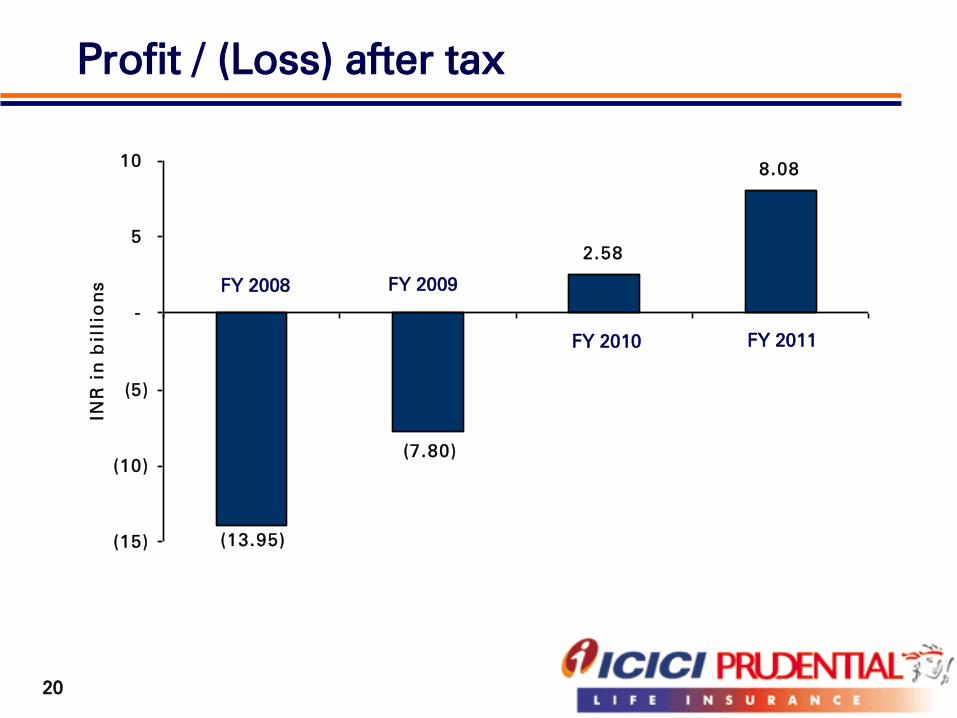
Profit / (Loss) after tax
20
FY 2008 FY 2009
FY 2010 FY 2011
(13.95)
(7.80)
2.58
8.08
(15)
(10)
(5)
-
5
10
IN
R in
b
illio
ns

2121
Summary of key achievements
Private market leader for 9 years in a row1
Asset under management2
of INR 681.50 bn
NBP margin of 17.9% in FY 2011
Over 12 million policies issued since inception
Decline in Expense ratio to 17.3% for FY 2011
APE of INR 39.75 bn in FY 2011
21
1 IRDA new business retail weighted premium basis
2AUM as on March 31, 2011
Profit after tax of INR 8.08 bn for FY 2011

Awards & Recognitions
The Most Trusted Brand
- ET Brand Equity Survey, 2008 & 2009
Runner-up Life Insurer
- Outlook Money & NDTV Profit, 2007, 2008 & 2009
Avaya Global Connect for Customer Responsiveness
- Avaya Global, 2005 & 2007
Best Business Partnership
- UK Trade & Investment India Business Awards, 2008
Excellence in Financial Reporting
- Institute of Chartered Accountants of India, 2008 & 2009
Life Insurance Company of the Year
- Asia Insurance Industry Awards, 2008
22

2323
Safe harbor
Except for the historical information contained herein, statements in this release which
contain words or phrases such as 'will', 'would', ‘indicating’, ‘expected to’ etc., and
similar expressions or variations of such expressions may constitute 'forward-looking
statements'. These forward-looking statements involve a number of risks, uncertainties
and other factors that could cause actual results to differ materially from those
suggested by the forward-looking statements. These risks and uncertainties include,
but are not limited to our ability to successfully implement our strategy, our growth
and expansion in business, the impact of any acquisitions, technological
implementation and changes, the actual growth in demand for insurance products and
services, investment income, cash flow projections, our exposure to market risks,
policies and actions of regulatory authorities; impact of competition; experience with
regard to mortality and morbidity trends, lapse rates and policy renewal rates; the
impact of changes in capital , solvency or accounting standards , tax and other
legislations and regulations in the jurisdictions as well as other risks detailed in the
reports filed by ICICI Bank Limited, our holding company, with the United States
Securities and Exchange Commission. ICICI Bank and we undertake no obligation to
update forward-looking statements to reflect events or circumstances after the date
thereof.

2424
Thank you