appendix g - operations & maintenance cost estimate model
TRANSCRIPT

DRAFT
APPENDIX G OPERATIONS AND MAINTENANCE COST
ESTIMATION MODEL
AGS Feasibility Study O&M Cost Methodology & Results P a g e | 1 October 21, 2013
Operations and Maintenance Cost Methodology and Results The Colorado Department of Transportation is conducting an Advanced Guideway System Feasibility Study (AGS Feasibility Study or Project) to evaluate technology, alignment and financing options related to a proposed high‐speed transit system for the 120‐mile segment of the I‐70 Mountain Corridor from C‐470/Jefferson County Government Center light rail station to Eagle County Regional Airport. In addition, the AGS Feasibility Study interfaces directly with CDOT’s concurrent Interregional Connectivity Study (ICS), which is responsible for identifying and evaluating high‐speed rail options between the eastern boundary of the AGS study area and DIA as well as integration with the Regional Transportation District’s FasTracks system, and alignments, technologies and stations for high‐speed rail along Colorado’s Front Range between Fort Collins and Pueblo. At this point in the AGS Project, the technologies identified for evaluation are: High Speed Steel Rail (HS Rail), High Speed Magnetic Levitation (High Speed Maglev) and Low Speed Magnetic Levitation (120‐mph Maglev). This report describes methods used to estimate annual operating and maintenance costs for the alternatives under evaluation and resulting cost estimates for AGS Project alternatives.
1. General Methodology An operating and maintenance (O&M) cost model estimates the annual cost to operate, maintain and administer a transit system for a given set of service indicators. O&M costs are expressed as the annual total of employee earnings and fringe benefits, contract services, materials and supplies, utilities, and other day‐to‐day expenses incurred in running a transit system. In general, the steps of the O&M cost estimating process are:
1. Develop methodology for estimating O&M costs; 2. Develop appropriate cost model(s) to evaluate alternatives; 3. Generate operating plans and statistics for each study alternative; and 4. Estimate annual O&M costs for each study alternative.
The methodology for O&M costing of the AGS Feasibility Study alternatives is based on the principal assumption that annual operating and maintenance costs vary according to labor productivity, consumption rates, and system characteristics related to service and facilities. The system and service (also called supply) variables selected to describe the AGS study alternatives are: Annual Revenue Train‐Hours: The hours that trains travel while in revenue service over the entire fiscal year. Revenue train‐hours include layover and schedule recovery but exclude time for deadhead, operator training and maintenance testing.
AGS Feasibility Study O&M Cost Methodology & Results P a g e | 2 October 21, 2013
Annual Revenue Train‐Miles: The miles that trains travel while in revenue service over the entire fiscal year. Revenue train‐miles exclude deadhead, operator training and maintenance testing. Annual Revenue Car‐Miles: The miles that passenger cars travel during a year of revenue service. Revenue car‐miles exclude deadhead, operator training and maintenance testing. Fixed Guideway Route Miles: The end‐to‐end mileage over which trains travel in revenue service, which excludes staging or storage tracks. From a maintenance perspective, the guideway includes all buildings and structures dedicated to the operation of transit including track, tunnels, bridges and wayside electrical elements. Number of Major Stations: Major stations are defined where particularly high volumes of passengers and/or connections to other major transportation services occur. For the AGS study corridor, the West Suburban station is defined as a major station. DIA would also be considered a major station. Number of Minor Stations: The stations that do not have unusually high passenger activity or connect to other major transportation services are considered minor stations. The majority of the AGS stations are identified under this category. Number of Peak Cars: The maximum number of passenger service vehicles in simultaneous operation. Typical development of an O&M cost model involves developing productivity ratios with actual expenses and system characteristics from established systems. However, very scant information is available due to the limited application or lack of AGS study technologies currently operating revenue service in the United States. Therefore, the O&M cost model builds on actual O&M costs and data available for more traditional rail systems, tailoring specific line items to account for technology differences. Information on traditional rail systems included Utah Transit Authority for their commuter rail service, as they have been able to maintain lower O&M costs relative to other properties. Information provided by Transrapid International‐USA, Inc. (TRI) and American Maglev Technology, Inc. (AMT) was incorporated as applicable.
2. O&M Cost Spreadsheet Models
Operating and maintenance spreadsheet cost models were developed as Excel worksheets containing a series of line items that can be applied across all AGS study alternatives and also to the ICS study alternatives. The expense categories and line items represent a simplified version of the ‘chart of accounts’ used by the Federal Transit Administration for the National Transit Database but with added detail for station operation and facilities maintenance.
AGS Feasibility Study O&M Cost Methodology & Results P a g e | 3 October 21, 2013
Expense Line Items The project cost models organize typical O&M expenses among three functional areas: Operations, Maintenance, and General Administration. Sub functions within each of these functional areas are as follows:
Operations includes Administration, Train Operations and Station Operations.
Maintenance includes Administration, Vehicle Maintenance, and Right‐of‐Way (ROW) Maintenance.
General Administration represents the Rail Director and staff supporting overall program functions such as Legal, Accounting, Finance, Human Resources, Marketing, Customer Service, IT, Purchasing, Safety and Risk Management.
Each of these functions identifies separate labor and non‐labor expenses, which enables the models to incorporate various assumptions on annual earnings, productivity, staffing, annual earnings, and non‐labor consumption rates.
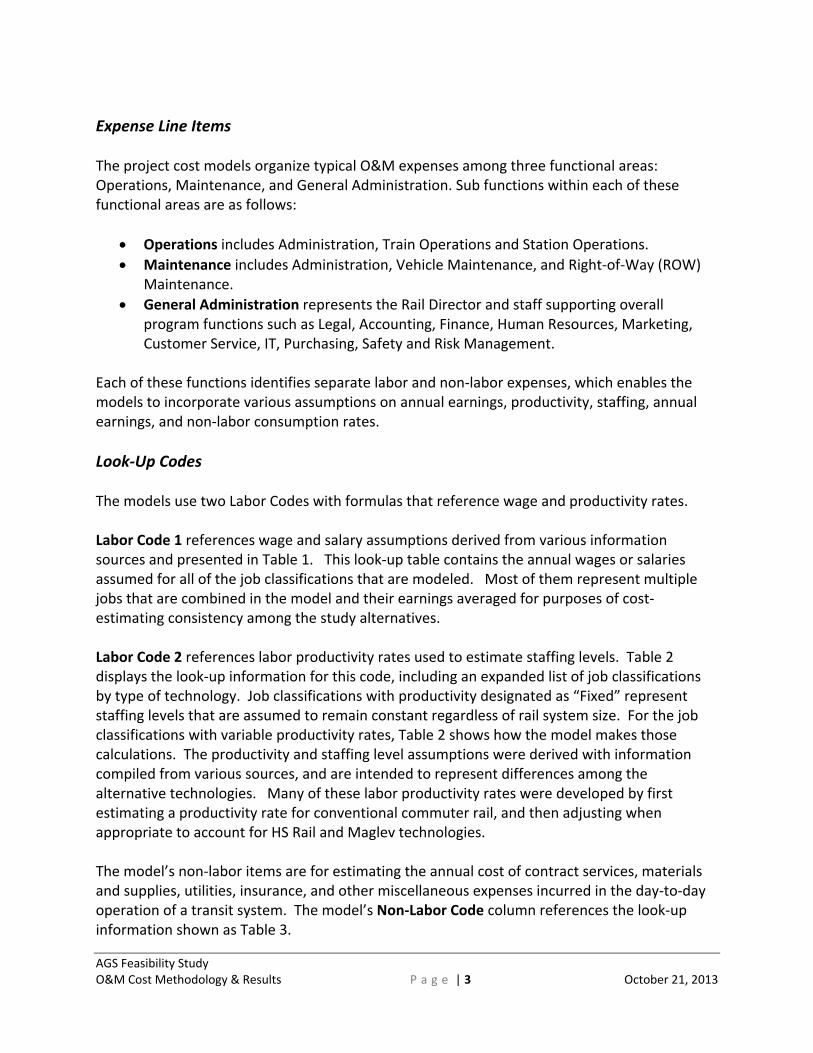
Look‐Up Codes The models use two Labor Codes with formulas that reference wage and productivity rates. Labor Code 1 references wage and salary assumptions derived from various information sources and presented in Table 1. This look‐up table contains the annual wages or salaries assumed for all of the job classifications that are modeled. Most of them represent multiple jobs that are combined in the model and their earnings averaged for purposes of cost‐estimating consistency among the study alternatives. Labor Code 2 references labor productivity rates used to estimate staffing levels. Table 2 displays the look‐up information for this code, including an expanded list of job classifications by type of technology. Job classifications with productivity designated as “Fixed” represent staffing levels that are assumed to remain constant regardless of rail system size. For the job classifications with variable productivity rates, Table 2 shows how the model makes those calculations. The productivity and staffing level assumptions were derived with information compiled from various sources, and are intended to represent differences among the alternative technologies. Many of these labor productivity rates were developed by first estimating a productivity rate for conventional commuter rail, and then adjusting when appropriate to account for HS Rail and Maglev technologies. The model’s non‐labor items are for estimating the annual cost of contract services, materials and supplies, utilities, insurance, and other miscellaneous expenses incurred in the day‐to‐day operation of a transit system. The model’s Non‐Labor Code column references the look‐up information shown as Table 3.

AGS Feasibility Study O&M Cost Methodology & Results P a g e | 4 October 21, 2013
Table 1
LABOR CODE 1 – WAGE/SALARY ASSUMPTIONS
Lookup USEJob Classification Code Annual Wages
OperationsAdministrationOperations Manager 10.0 $140,000Administrative Assistant 11.0 $50,000
Train Operations
Supervisors/Controllers 12.0 $75,000Operators 13.0 $60,000
Train Attendants 14.0 $40,000Training Instructors 15.0 $75,000
Station Operations
Station Managers 16.0 $75,000Station Attendants 17.0 $40,000
MaintenanceAdministrationMaintenance Director 20.0 $140,000Administrative Assistant 21.0 $50,000
Vehicle Maintenance
Veh Maint Supervisors 22.0 $75,000Rail Car Technicians 23.0 $60,000Veh Maint Parts Clerks 24.0 $50,000
ROW Maintenance
Track/Guideway Manager 25.0 $75,000Track/Guideway Technicians 26.0 $60,000CTC/Train Control Manager 27.0 $75,000CTC/Train Control Technicians 28.0 $60,000Facil Maint Materials Clerks 29.0 $40,000
General AdministrationRail Director 40.0 $200,000
Rail Service Adminisration 41.0 $75,000

AGS Feasibility Study O&M Cost Methodology & Results P a g e | 5 October 21, 2013
Table 2 LABOR CODE 2 – PRODUCTIVITY/STAFFING ASSUMPTIONS
Lookup Productivity ProductivityJob Classification Code Rate Driver
Operations
Administration
Operations Manager 10.1 Fixed 1 position
Administrative Assistant 11.1 Fixed 1 position
Train Operations
Supervisors/Controllers 12.1 7,000 Rev. Train‐Hrs/FTE
Operators 13.1 1,400 Rev. Train‐Hrs/FTE
Train Attendants 14.1 1,400 Rev. Train‐Hrs/FTE
Training Instructors 15.1 Fixed 1 position
Station Operations
Station Managers 16.1 4.00 Total Stations/FTE
Station Attendants
Major Stations 17.1 0.22 Major Stations/FTE
Minor Stations 17.2 0.44 Minor Stations/FTE
Maintenance
Administration
Maintenance Director 20.1 Fixed 1 position
Administrative Assistant 21.1 Fixed 1 position
Vehicle Maintenance
Veh Maint Supervisors
High Speed Rail 22.4 1,066,667 Rev. Car‐Mi./FTE
120‐mph Maglev 22.5 5 Rev. Car‐Mi./FTE
High Speed Maglev 22.6 5 Rev. Car‐Mi./FTE
Rail Car Technicians
High Speed Rail 23.4 213,333 Rev. Car‐Mi./FTE
120‐mph Maglev 23.5 1.0 Peak Car/FTE
High Speed Maglev 23.6 1.0 Peak Car/FTE
Veh Maint Parts Clerks
High Speed Rail 24.4 2,133,333 Rev. Car‐Mi./FTE
120‐mph Maglev 24.5 10.0 Peak Car/FTE
High Speed Maglev 24.6 10.0 Peak Car/FTE
ROW Maintenance
Track/Guideway Manager
High Speed Rail 25.4 25.0 Route Mi./FTE
120‐mph Maglev 25.5 25.0 Route Mi./FTE
High Speed Maglev 25.6 25.0 Route Mi./FTE
Track/Guideway Technicians
High Speed Rail 26.4 5.0 Route Mi./FTE
120‐mph Maglev 26.5 5.0 Route Mi./FTE
High Speed Maglev 26.6 5.0 Route Mi./FTE
CTC/Train Control/Power Manager
High Speed Rail 27.4 5.0 Route Mi./FTE
120‐mph Maglev 27.5 8.0 Route Mi./FTE
High Speed Maglev 27.6 8.0 Route Mi./FTE
CTC/Train Control/Power Technicians
High Speed Rail 28.4 1.0 Route Mi./FTE
120‐mph Maglev 28.5 1.6 Route Mi./FTE
High Speed Maglev 28.6 1.6 Route Mi./FTE
Facil Maint Materials Clerks 29.1 25 Route Mi./FTE
General Administration
Rail Director 40.1 Fixed 1 position
Rail Service Adminisration 41.11 25.0 Route Mi./FTE
Rail Service Adminisration 41.12 2.5% FTE's
AGS Feasibility Study O&M Cost Methodology & Results P a g e | 6 October 21, 2013
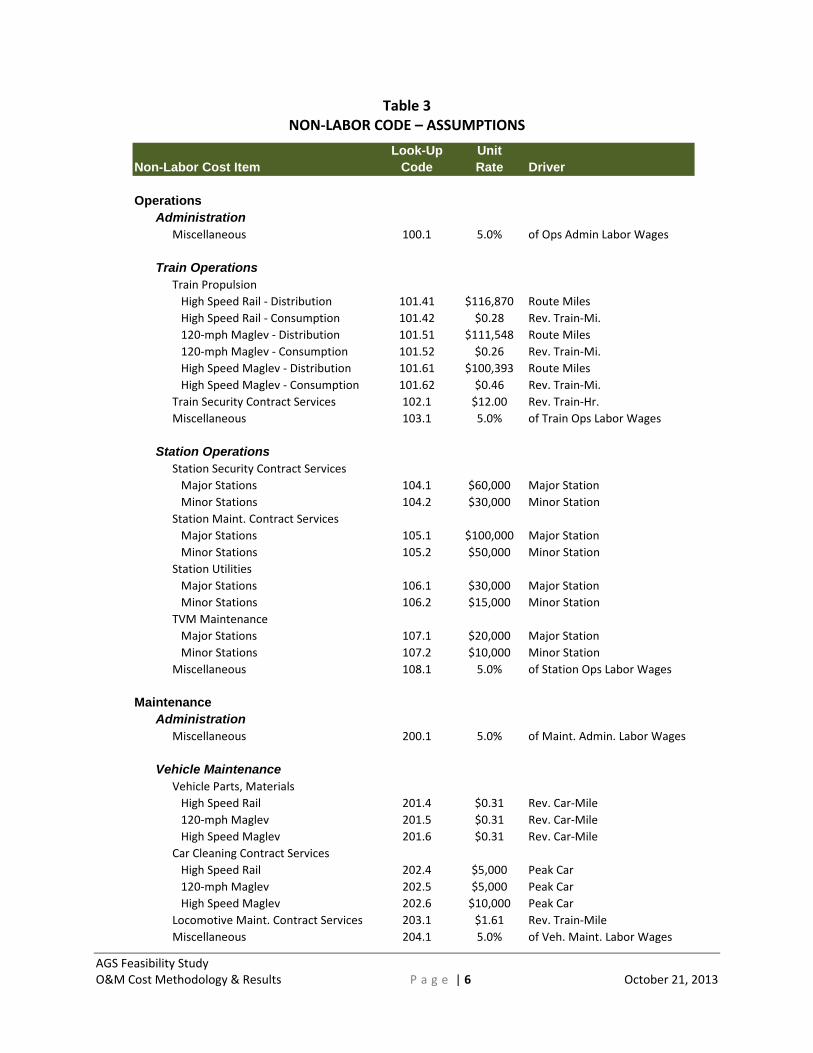
Table 3 NON‐LABOR CODE – ASSUMPTIONS
Look-Up UnitNon-Labor Cost Item Code Rate Driver
OperationsAdministration
Miscellaneous 100.1 5.0% of Ops Admin Labor Wages
Train OperationsTrain Propulsion
High Speed Rail ‐ Distribution 101.41 $116,870 Route Miles
High Speed Rail ‐ Consumption 101.42 $0.28 Rev. Train‐Mi.
120‐mph Maglev ‐ Distribution 101.51 $111,548 Route Miles
120‐mph Maglev ‐ Consumption 101.52 $0.26 Rev. Train‐Mi.
High Speed Maglev ‐ Distribution 101.61 $100,393 Route Miles
High Speed Maglev ‐ Consumption 101.62 $0.46 Rev. Train‐Mi.
Train Security Contract Services 102.1 $12.00 Rev. Train‐Hr.
Miscellaneous 103.1 5.0% of Train Ops Labor Wages
Station OperationsStation Security Contract Services
Major Stations 104.1 $60,000 Major Station
Minor Stations 104.2 $30,000 Minor Station
Station Maint. Contract Services
Major Stations 105.1 $100,000 Major Station
Minor Stations 105.2 $50,000 Minor Station
Station Utilities
Major Stations 106.1 $30,000 Major Station
Minor Stations 106.2 $15,000 Minor Station
TVM Maintenance
Major Stations 107.1 $20,000 Major Station
Minor Stations 107.2 $10,000 Minor Station
Miscellaneous 108.1 5.0% of Station Ops Labor Wages
MaintenanceAdministration
Miscellaneous 200.1 5.0% of Maint. Admin. Labor Wages
Vehicle MaintenanceVehicle Parts, Materials
High Speed Rail 201.4 $0.31 Rev. Car‐Mile
120‐mph Maglev 201.5 $0.31 Rev. Car‐Mile
High Speed Maglev 201.6 $0.31 Rev. Car‐Mile
Car Cleaning Contract Services
High Speed Rail 202.4 $5,000 Peak Car
120‐mph Maglev 202.5 $5,000 Peak Car
High Speed Maglev 202.6 $10,000 Peak Car
Locomotive Maint. Contract Services 203.1 $1.61 Rev. Train‐Mile
Miscellaneous 204.1 5.0% of Veh. Maint. Labor Wages
AGS Feasibility Study O&M Cost Methodology & Results P a g e | 7 October 21, 2013
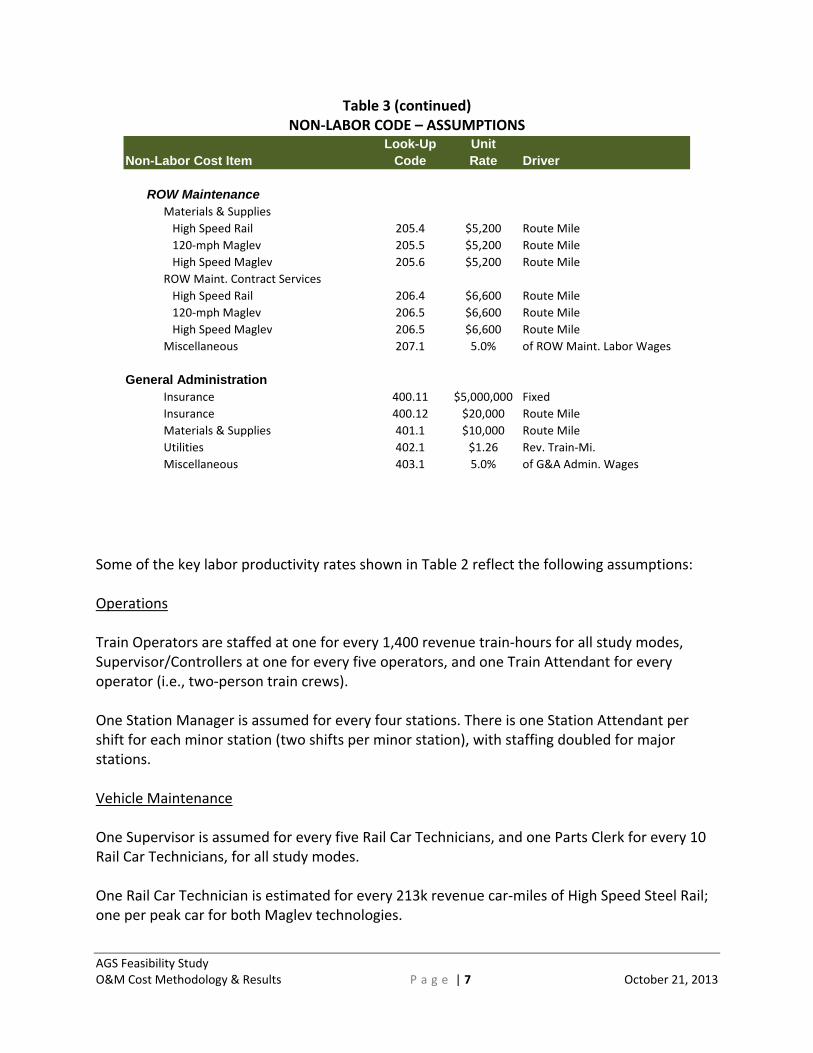
Table 3 (continued) NON‐LABOR CODE – ASSUMPTIONS
Some of the key labor productivity rates shown in Table 2 reflect the following assumptions: Operations Train Operators are staffed at one for every 1,400 revenue train‐hours for all study modes, Supervisor/Controllers at one for every five operators, and one Train Attendant for every operator (i.e., two‐person train crews). One Station Manager is assumed for every four stations. There is one Station Attendant per shift for each minor station (two shifts per minor station), with staffing doubled for major stations. Vehicle Maintenance One Supervisor is assumed for every five Rail Car Technicians, and one Parts Clerk for every 10 Rail Car Technicians, for all study modes. One Rail Car Technician is estimated for every 213k revenue car‐miles of High Speed Steel Rail; one per peak car for both Maglev technologies.
Look-Up UnitNon-Labor Cost Item Code Rate Driver
ROW MaintenanceMaterials & Supplies
High Speed Rail 205.4 $5,200 Route Mile
120‐mph Maglev 205.5 $5,200 Route Mile
High Speed Maglev 205.6 $5,200 Route Mile
ROW Maint. Contract Services
High Speed Rail 206.4 $6,600 Route Mile
120‐mph Maglev 206.5 $6,600 Route Mile
High Speed Maglev 206.5 $6,600 Route Mile
Miscellaneous 207.1 5.0% of ROW Maint. Labor Wages
General AdministrationInsurance 400.11 $5,000,000 Fixed
Insurance 400.12 $20,000 Route Mile
Materials & Supplies 401.1 $10,000 Route Mile
Utilities 402.1 $1.26 Rev. Train‐Mi.
Miscellaneous 403.1 5.0% of G&A Admin. Wages

AGS Feasibility Study O&M Cost Methodology & Results P a g e | 8 October 21, 2013
ROW Maintenance Managers (Track/Guideway and Train Control/Power) are staffed at one for every five technicians for all study modes. Track/Guideway Technicians are modeled as one for every 5.0 route miles, assumed consistent for all study modes. Train Control/Power Technicians are assumed to be staffed as the rate of one per route mile for High Speed Steel Rail, and one per 1.6 route miles for both Maglev technologies. The model assumes two Facilities Maintenance Clerks for every 50 route miles, with two maintenance facilities for the Full‐Build scenarios. Administration All specific administration job classifications are modeled as fixed positions. The aggregated administrative support functions are staffed as one for every 20 route miles (with a minimum of five positions) plus 2.5% of the number of FTEs estimated for the line functions of operations and maintenance.
Supply Variable Unit Costs For purposes of designing a methodology that would distinguish major differences among alternative modes, some expense items are modeled with consistent unit cost assumptions that apply regardless of mode. Fringe benefits are set at 40% of all wages and salaries, and for all study modes. For expenses with consistent unit costs based directly on a supply (system or service) variable, the line item totals may differ by alternative, but only because the number of driving units change (e.g., more or fewer stations, route miles). Functions modeled with consistent unit costs are:
Operations Administration and Maintenance Administration
Train crews (one operator and one train attendant, calculated based on the number of train‐hours of service)
Station operations and maintenance costs (calculated based on the number of stations)
On‐board and station security (assumed to be contracted services)
Vehicle cleaning (assumed to be a contracted service)
General Administration The spreadsheet cost models distinguish primary differences among modes with variable unit costs related to propulsion power, vehicle maintenance, and ROW maintenance. Propulsion power is driven primarily by route miles (distribution) as opposed to usage (consumption). The lookup codes presented in Tables 2 and 3 are used to identify the assumed supply variable unit cost.

AGS Feasibility Study O&M Cost Methodology & Results P a g e | 9 October 21, 2013
Staffing Levels The model estimates the number of full‐time equivalent (FTE) employees for specific job classifications by combining labor productivity assumptions, supply variable unit cost rates and the cost driver values associated with each test alternative. The number of staff estimated is multiplied by the assumed salary to calculate a line item labor cost. The lookup codes presented in Table 2 are used to determine the labor productivity rate that calculates staffing levels.
Cost Ranges The AGS Project O&M cost models calculate two cost estimates for any modeled alternative, providing a planning contingency for items with little or no actual operating data. The model features used for the expense range are:
Low‐Range Cost Estimate for each line item, calculated by applying the unit cost to the quantity of the identified driving variable for each study alternative. A model’s total estimated annual O&M cost is calculated by summing all line items, and expressed in 2013 dollars. Uncertainty Factors that acknowledge there may be a notable variance from calculated O&M costs since some line items must rely heavily on assumptions when actuals are not available. Uncertainty factors of 15%, 25% or 50% were applied to each line item cost. The highest uncertainty (50%) was assigned to propulsion and insurance for High Speed Steel Rail and Maglev technologies. High‐Range Cost Estimates which apply line item uncertainty factors to the low‐range cost estimate. Again, the total estimated annual O&M cost based on integrating the uncertainty factor is calculated by summing all line items.
Project Alternatives
3. Project O&M Cost Estimates After establishing appropriate unit costs, an O&M cost model requires the development of operating statistics that are based on service plans for each alternative. For the AGS Project, there basically are two alternatives to evaluate for each mode: a Full‐Build alternative and a Minimum Operating Segment (MOS). The HS Rail alternative has a different alignment, operating plan and travel speed than the Maglev alternatives. As previously noted, there are two different types of Maglev alternatives – high speed and 120 mph. The two Maglev alternatives have different runtimes and an added station for the 120 mph Maglev due to differences in achievable maximum speeds and corresponding differences in curvature/alignment.

AGS Feasibility Study O&M Cost Methodology & Results P a g e | 10 October 21, 2013
All alternatives are based on an 18‐hour daily span of service, seven days a week. For highest‐demand days (considered Thursday through Sunday for the AGS corridor), hourly service is assumed for 12 hours of the day and 30‐minute frequencies during six hours of the day. For lighter days (Monday through Wednesday), an hourly frequency is assumed for the bulk of the day. Station and service plan assumptions are as follows:
Full‐Build Maglev: Trains are assumed to operate between Golden (Suburban West) and Eagle County Regional Airport (ECRA), with intermediate stations at Idaho Springs, Keystone, Breckenridge, Copper Mountain (for 120 mph maglev only), Vail, and Avon. The basic operating plan assumes 24 round trips daily from Thursday through Sunday, and 15 round trips daily from Monday through Wednesday.
Full‐Build Maglev to DIA: For this alternative, trains operate between DIA and Eagle County Regional Airport, thereby adding stations at DIA and I‐76/72nd Avenue in the metro Denver area. This alternative was tested only for the high speed maglev technology. The operating plan assumes 24 round trips daily from Thursday through Sunday, and 15 round trips daily from Monday through Wednesday.
Full‐Build HS Rail: The HS Rail alternative is only able to serve Breckenridge with a separate branch so there are two line patterns. The main line serves Jefferson County, Idaho Springs, Lakeside, and Vail, terminating at Eagle County Regional Airport. The spur line proceeds from Jefferson County Station to Idaho Springs, Lakeside and Breckenridge. There would be 24 round trips operated Thursday through Sunday (18 on mainline, 6 on branch), and 15 round trips Monday through Wednesday (9 on mainline, 6 on branch).
MOS: Trains would operate between Suburban West and Breckenridge. There would be four stations for all modes. For the basic operating plan, Thursday through Sunday trains would operate 24 round trips and Monday through Wednesday 15 round trips would be provided. An MOS alignment scenario has been defined for both High Speed Rail and Maglev.
Differences among the modes include the capacity of passenger cars and the make‐up of train consists, both of which have implications for annual operating costs. In an attempt to be as consistent as possible for cost estimating, train consist assumptions were made as follows:
High Speed Steel Rail would operate 10 passenger cars per train, providing a capacity of 450 passengers per train.
High Speed Maglev would operate five passenger cars per train, providing a capacity of 410 passengers per train.
AGS Feasibility Study O&M Cost Methodology & Results P a g e | 11 October 21, 2013
120‐mph Maglev trains operate as two‐car married pairs with a capacity of 186 passengers per married pair train. Two scenarios were evaluated for 120‐mph Maglev: 24 trips per day, Thursday through Sunday, for equivalent level of train service as other alternatives (i.e., 30‐minute average peak period frequencies), and 48 trips per day, Thursday through Sunday, for comparable passenger capacity as the other alternatives (i.e., 15‐minute average peak period frequencies).
Tables 3 and 4 summarize O&M cost model results for the full corridor alternatives as well as the MOS alternatives.
For service from Golden to ECRA, operating costs range from $45 million to $73 million annually when accounting for low versus high estimates. The highest O&M operating costs are associated with the high speed steel rail alternative.
Due to its greater mileage and associated longer travel time, the high speed maglev alternative from DIA to ECRA has an annual O&M cost ranging from $59 million to $78 million.
For the MOS options from Golden to Breckenridge, O&M costs range from $26 million to $48 million. Again, the highest O&M operating cost estimates are associated with the high speed steel rail alternative.
Figures 1 and 2 illustrate the break out of costs (labor and non‐labor and by type of cost) for each alternative (full‐build and MOS). Propulsion power costs are the largest single component of the O&M cost estimates, with power consisting of 20 to 30 percent of an alternative’s total estimated O&M cost. Power cost estimates were previously determined for AGS alternatives in a technical paper that took into consideration high speed rail and Maglev power consumption and distribution requirements and Xcel energy rates. Information from this prior analysis was incorporated into this project’s O&M cost estimates. Insurance costs are also a significant portion of the O&M cost estimates. As noted earlier, a high level of uncertainty has been assigned to both of these cost items in the high range of cost estimates. Finally, it should be noted that O&M costs are based on the defined service plan that assumes 24 round trips per day on high‐volume days. Preliminary analysis of ridership forecasts suggests that more frequent service may be needed during peak use. While much of the demand can be accommodated by scheduling more of the 24 round trips during peak periods, it may be advisable to add more trips overall, thereby increasing the estimated O&M costs. Operating plan tables for each project alternative are provided in Appendix A of this document. Detailed cost estimate tables are provided in Appendix B.
AGS Feasibility Study O&M Cost Methodology & Results P a g e | 12 October 21, 2013
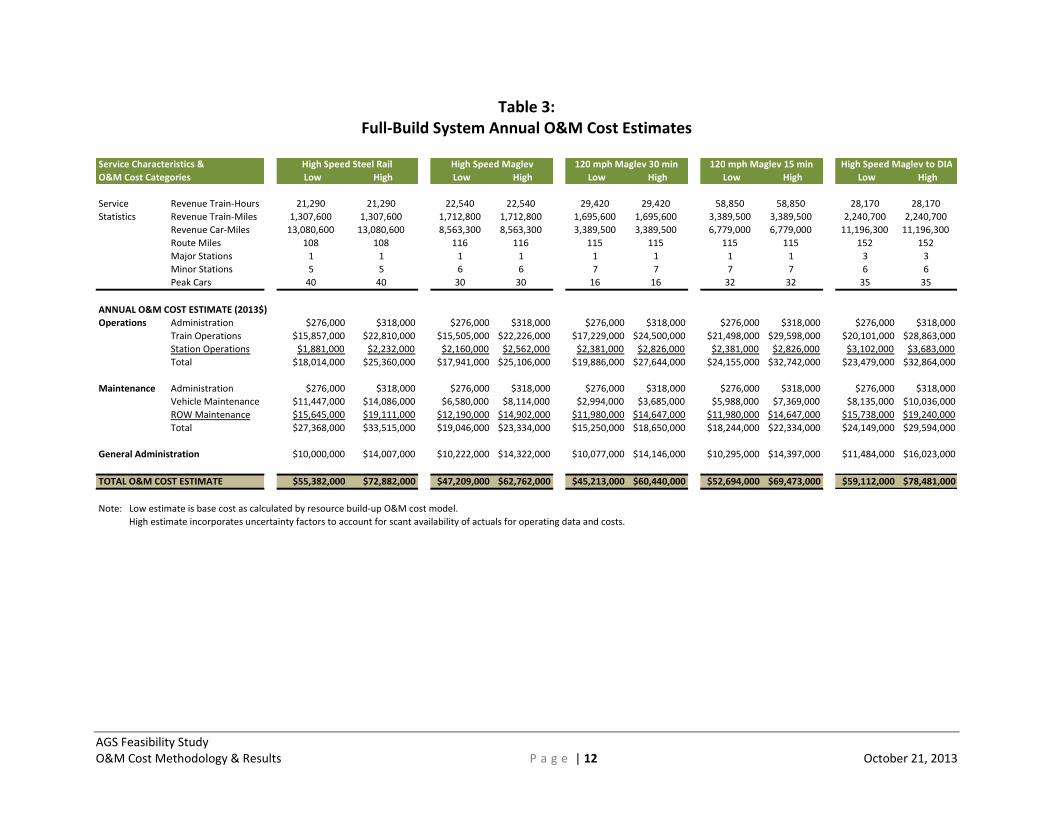
Table 3: Full‐Build System Annual O&M Cost Estimates
Service Characteristics &O&M Cost Categories Low High Low High Low High Low High Low High
Service Revenue Train‐Hours 21,290 21,290 22,540 22,540 29,420 29,420 58,850 58,850 28,170 28,170
Statistics Revenue Train‐Miles 1,307,600 1,307,600 1,712,800 1,712,800 1,695,600 1,695,600 3,389,500 3,389,500 2,240,700 2,240,700
Revenue Car‐Miles 13,080,600 13,080,600 8,563,300 8,563,300 3,389,500 3,389,500 6,779,000 6,779,000 11,196,300 11,196,300
Route Miles 108 108 116 116 115 115 115 115 152 152
Major Stations 1 1 1 1 1 1 1 1 3 3
Minor Stations 5 5 6 6 7 7 7 7 6 6
Peak Cars 40 40 30 30 16 16 32 32 35 35
ANNUAL O&M COST ESTIMATE (2013$)Operations Administration $276,000 $318,000 $276,000 $318,000 $276,000 $318,000 $276,000 $318,000 $276,000 $318,000
Train Operations $15,857,000 $22,810,000 $15,505,000 $22,226,000 $17,229,000 $24,500,000 $21,498,000 $29,598,000 $20,101,000 $28,863,000
Station Operations $1,881,000 $2,232,000 $2,160,000 $2,562,000 $2,381,000 $2,826,000 $2,381,000 $2,826,000 $3,102,000 $3,683,000
Total $18,014,000 $25,360,000 $17,941,000 $25,106,000 $19,886,000 $27,644,000 $24,155,000 $32,742,000 $23,479,000 $32,864,000
Maintenance Administration $276,000 $318,000 $276,000 $318,000 $276,000 $318,000 $276,000 $318,000 $276,000 $318,000
Vehicle Maintenance $11,447,000 $14,086,000 $6,580,000 $8,114,000 $2,994,000 $3,685,000 $5,988,000 $7,369,000 $8,135,000 $10,036,000
ROW Maintenance $15,645,000 $19,111,000 $12,190,000 $14,902,000 $11,980,000 $14,647,000 $11,980,000 $14,647,000 $15,738,000 $19,240,000
Total $27,368,000 $33,515,000 $19,046,000 $23,334,000 $15,250,000 $18,650,000 $18,244,000 $22,334,000 $24,149,000 $29,594,000
General Administration $10,000,000 $14,007,000 $10,222,000 $14,322,000 $10,077,000 $14,146,000 $10,295,000 $14,397,000 $11,484,000 $16,023,000
TOTAL O&M COST ESTIMATE $55,382,000 $72,882,000 $47,209,000 $62,762,000 $45,213,000 $60,440,000 $52,694,000 $69,473,000 $59,112,000 $78,481,000
Note: Low estimate is base cost as calculated by resource build‐up O&M cost model. High estimate incorporates uncertainty factors to account for scant availability of actuals for operating data and costs.
High Speed Maglev to DIAHigh Speed Steel Rail High Speed Maglev 120 mph Maglev 30 min 120 mph Maglev 15 min

AGS Feasibility Study O&M Cost Methodology & Results P a g e | 13 October 21, 2013
Figure 1: Full‐Build System Annual O&M Cost Estimates