appendix l project cost estimate
TRANSCRIPT

Poplar Island Environmental Restoration Project September 2005 General Reevaluation Report (GRR) and Supplemental Environmental Impact Statement (SEIS)
L-1
APPENDIX L PROJECT COST ESTIMATE
GENERAL REEVALUATION REPORT (GRR) AND
SUPPLEMENTAL ENVIRONMENTAL IMPACT STATEMENT (SEIS) FOR THE
POPLAR ISLAND ENVIRONMENTAL RESTORATION PROJECT
CHESAPEAKE BAY, TALBOT COUNTY, MARYLAND 1. Summary. The total, fully-funded cost of the PIERP including the recommended lateral and vertical expansion [(a 575-acre lateral expansion component consisting nominally of 29 percent wetland habitat (165 acres), 47 percent upland habitat (270 acres), and 24 percent open water (140 acres), plus a 5-ft raising of the existing upland cells)], is estimated to be $715.7 million (not including the betterment) through fiscal year (FY) 2030 (Table L-1). All costs are based on present worth costs as of 1 October 2004. This includes costs for maintenance dredging, placement, shaping and planting of the island, site operation and maintenance, supervision and inspection, execution of the General Reevaluation Report (GRR), review of the plans and specifications, advertisement and award of construction contracts, and a ten percent contingency on estimated costs. It also includes the costs for study, design, contruction, site operations and maintenance, and oversight of the existing Poplar Island project. Maintenance of the Federal navigation project includes removal, transportation, and placement of approximately 68 million cubic yards (mcy) of dredged material at Poplar Island, as compared the 40 mcy of dredged material placement projected for the existing project. The construction cost for the expansion (perimeter dikes) is estimated to be $88.7 million, and to occur in FY 09 and 10. The fully funded cost for the PIERP, as currently authorized (not including the costs for the betterment), is $401.5 million; and the estimated fully funded cost of the expansion project is $314.2 million. The cost schedule for the PIERP is presented in Table L-1. A summary of the baseline cost estimate is included in Attachment A (the full detailed cost estimate is in a separate document, and the total project cost summary is included in Attachment B. 2. General. The following methodology was used in the preparation of General Reevaluation Report Cost Estimate for Poplar Island Environmental Restoration Project, Chesapeake Bay, Maryland dated September 2005.
a. The estimate is in accordance with the guidance contained in Engineering Regulation (ER) 1110-2-1302, Civil Works Cost Engineering.
b. The estimate is presented in the standard Work Breakdown Structure. c. The price level for the estimate is 1 October 2004.

Poplar Island Environmental Restoration Project September 2005 General Reevaluation Report (GRR) and Supplemental Environmental Impact Statement (SEIS)
L-2
d. Construction costs developed by Cost Engineering Branch are based on input/quantities from Civil Engineering Section, Civil Works Branch (see Engineering Appendix). Unit costs for were developed using the M-II estimating software containing the 2004 Unit Price Book and from historical data from the Poplar Island Environmental Restoration Project Baseline Estimate. The estimate is documented with notes to explain the assumed construction methods, crews, productivity, and other specific information.
e. Program and Project Management Division (PPMD) provided costs for
Construction Management. f. PPMD provided costs for the Planning, Engineering and Design. g. PPMD provided the escalation factors. The escalation factors are based on
the inflation factors that are developed by the Office of Management and Budget dated 31 Mar 04. These escalation factors were applied to each FY from FY-05 out to the assumed end of construction in FY-31. The costs from FY-98 to FY-04 are sunk cost and were not escalated.
h. The Total Project Cost of $722,168,312 includes $6,436,155 in
betterments. The betterments are a result of phasing the construction of the dikes at the sponsor's request.
3. Estimate Scope. The estimate reflects the cost for constructing:
• 270 acres of new upland habitat, • 165 acres of new wetland habitat, • 130-acre open-water embayment, and • 5 –foot raising of existing Cells 2 & 6.
4. Contingency. Contingency amounts for the construction cost items are based on uncertainties within individual project elements. Considering these uncertainties, contingencies were assigned too individual cost items or groups of related cost items to protect against the risk of potential cost increases.
Navigation, Ports & Harbor Cost Items – 10 Percent. The uncertainty associated with the new dike construction are low. Significant changes are not anticipated for the construction cost items. The assumed method for constructing the expansion is the same as the method used to construct the original dike sections. The costs for the year to year maintenance to the site are based on historical data from the on going maintenance and are not anticipated to change with the expansion. The design team believes that the quantities that were used in developing the estimate are conservative. The additional revisions to the quantities may be the result of slight changes in the alignment to avoid poor foundation areas. The bathymetric

Poplar Island Environmental Restoration Project September 2005 General Reevaluation Report (GRR) and Supplemental Environmental Impact Statement (SEIS)
L-3
data was also considered to be conservative and significant changes are not anticipated based on the final design. Based on discussions with the designer, a contingency of 10 percent is considered reasonable.
5. Construction Quantities and Cost Estimate Assumptions. Quantities were calculated from the typical sections in Figures 2 and 6 through 11, and laid out in Figures 1 and 3 through 5. Cross sectional areas or lengths for each material were multiplied by the length of each reach, to develop volumes or areas as applicable. To determine the cross sectional areas and lengths, the bottom elevation for each reach was averaged in an iterative process using a digital terrain model developed from the bathymetric data. Mean depths (and estimated elevations for upland and raised dikes) are shown in Table L-2. Quantities for the recommended alignment used to develop the cost estimate for the lateral and vertical expansion include the sand and stone quantities for the 50 percent wetlands, 50 percent uplands option (Tables L-3 and L-6); the 60 percent wetlands, 40 percent uplands option (Tables L-4 and L-6); the open water embayment option (Tables L-5 and L-7); and the 5-ft raising of the existing upland cells (Table L-8). For sand, to determine the total borrow required, it was estimated that 30 percent of dredged sand would be lost because of inefficiencies in dredging and stockpiling. The following assumptions were made for turf establishment on proposed new and raised dikes: (a) dredged material will be mined from south end of Cell 2, (b) dredged material, seeding, and erosion control material will be applied to all non-stone surfaces above elevation 0 ft MLLW, and (c) erosion control or dredged material will not be required on the dike crests. It was assumed that some of the existing armor stone on the north side of the existing project can be reused. It was estimated that the existing 3,000 and 4,000-lb armor stone could be used in lieu of the proposed 2,500-lb armor stone, and similarly the existing 2,000 toe armor stone could be used in place of the proposed 1,500-lb toe armor stone. The substitution will not be ton for ton, though, because of a necessarily thicker section for the larger stone. Estimated quantities of reusable armor stone are shown in Table L-9. All armor stone, new and reused, was assumed to weigh 1.5 tons/cubic yard, which was based on analyses of stone placed on the existing project. Dredging requirements and available sand fill for the proposed northern access channel are shown in Table L-10. The sand dredging requirements and available fill shown on this Table are included in the total sand estimates shown in Tables L-3, L-4, L-5, and L-8, for the 50 percent wetland, 50 percent upland option; the 60 percent wetland, 40 percent upland option; the open water embayment option; and the 5-ft vertical raising; respectively. It is assumed that the dredged clays and silts from the channel (Table L-10) will be spoiled in one of the expansion cells. Several spillway, culvert and pipe control structures will also be required, including five permanent spillways (two in upland cells and three in wetland cells). It is anticipated that these spillways will be similar in design to the spillways on the existing pierp. Two sets of eight 4-ft diameter culverts and control structures were estimated to be required on either end of the tidal gut. It is anticipated that the wetland cells that do not have permanent spillways will utilize high density polyethylene (HDPE) outlet structures (similar to structure in Cell 3D) that will be

Poplar Island Environmental Restoration Project September 2005 General Reevaluation Report (GRR) and Supplemental Environmental Impact Statement (SEIS)
L-4
moved from the existing project as wetland cells are developed and dikes are breached. Each of the wetland dikes (five or six, depending on the expansion option) were also estimated to have two 24-in pipes with weir boards between sub cells, similar to the existing wetland sub cells. The total capacity for the three lateral expansion options and the vertical raising are included in Table L-11. It was assumed that clay and silt dredged from the channel will be spoiled in one of the expansion cells and that sand borrow losses will be contained within the expansion cells. A factor of 0.7 was used to convert total air space to capacity to account for consolidation of the dredged material after it is properly dewatered. This factor was based on analyses done for the existing project. Quantities calculated in this section for the cost estimate are not the same as the quantities used during earlier portions of this study (e.g., the plan formulation process). This is because of different methods of estimating the quantities, as well as to the data available at each phase of this study. While the quantities in this section may be the most accurate to date, they do not differ significantly enough from the previous estimates to warrant reanalyses of previous sections. It is expected that there will be additional revisions to the quantities as the boring data, bathymetric surveys, and typical cross sections are better defined in the design phase of the project.

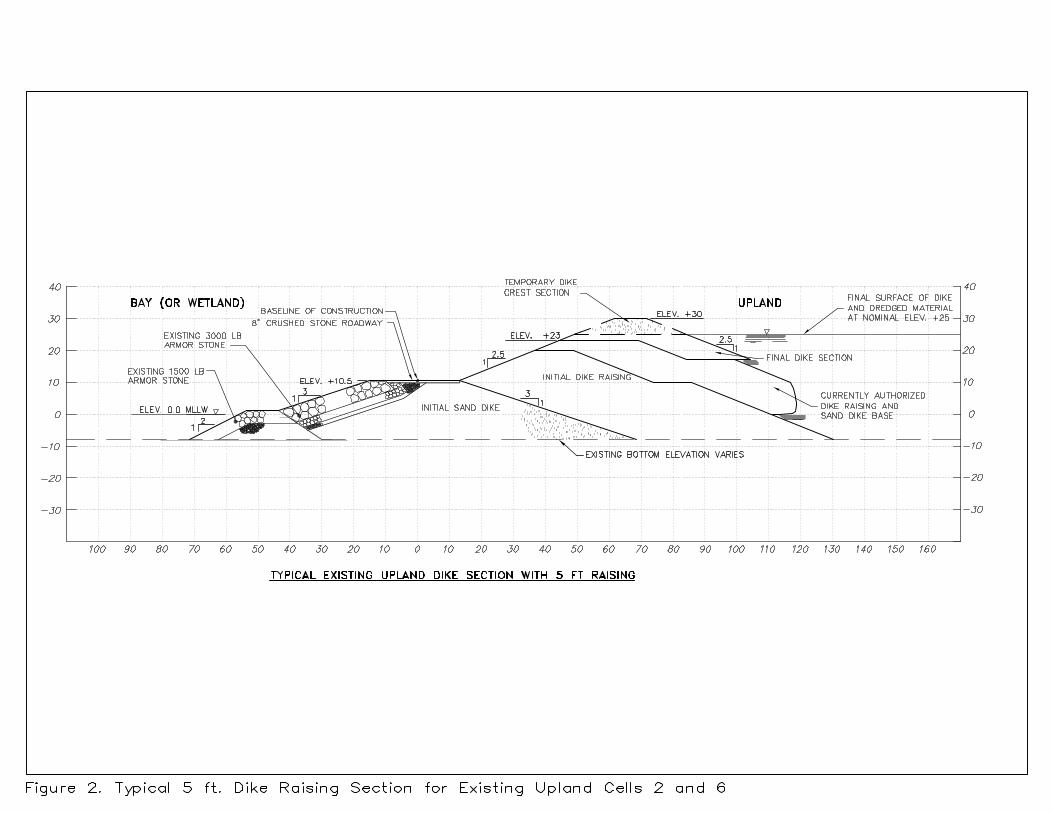
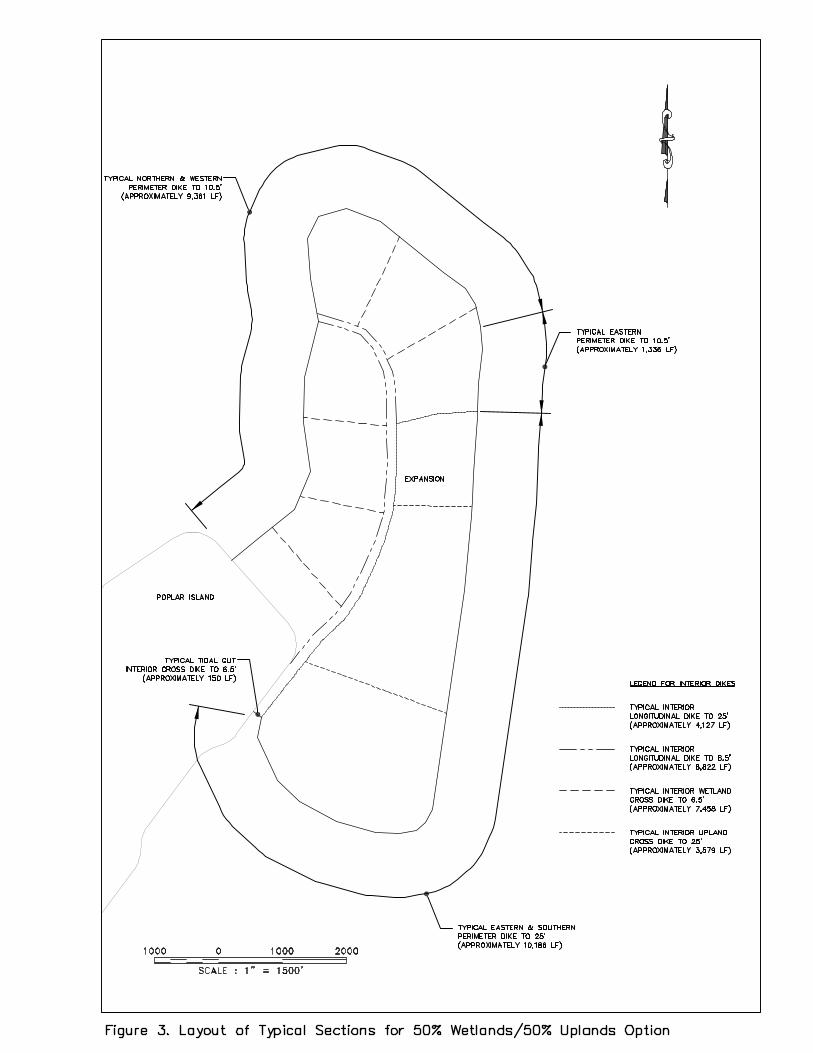


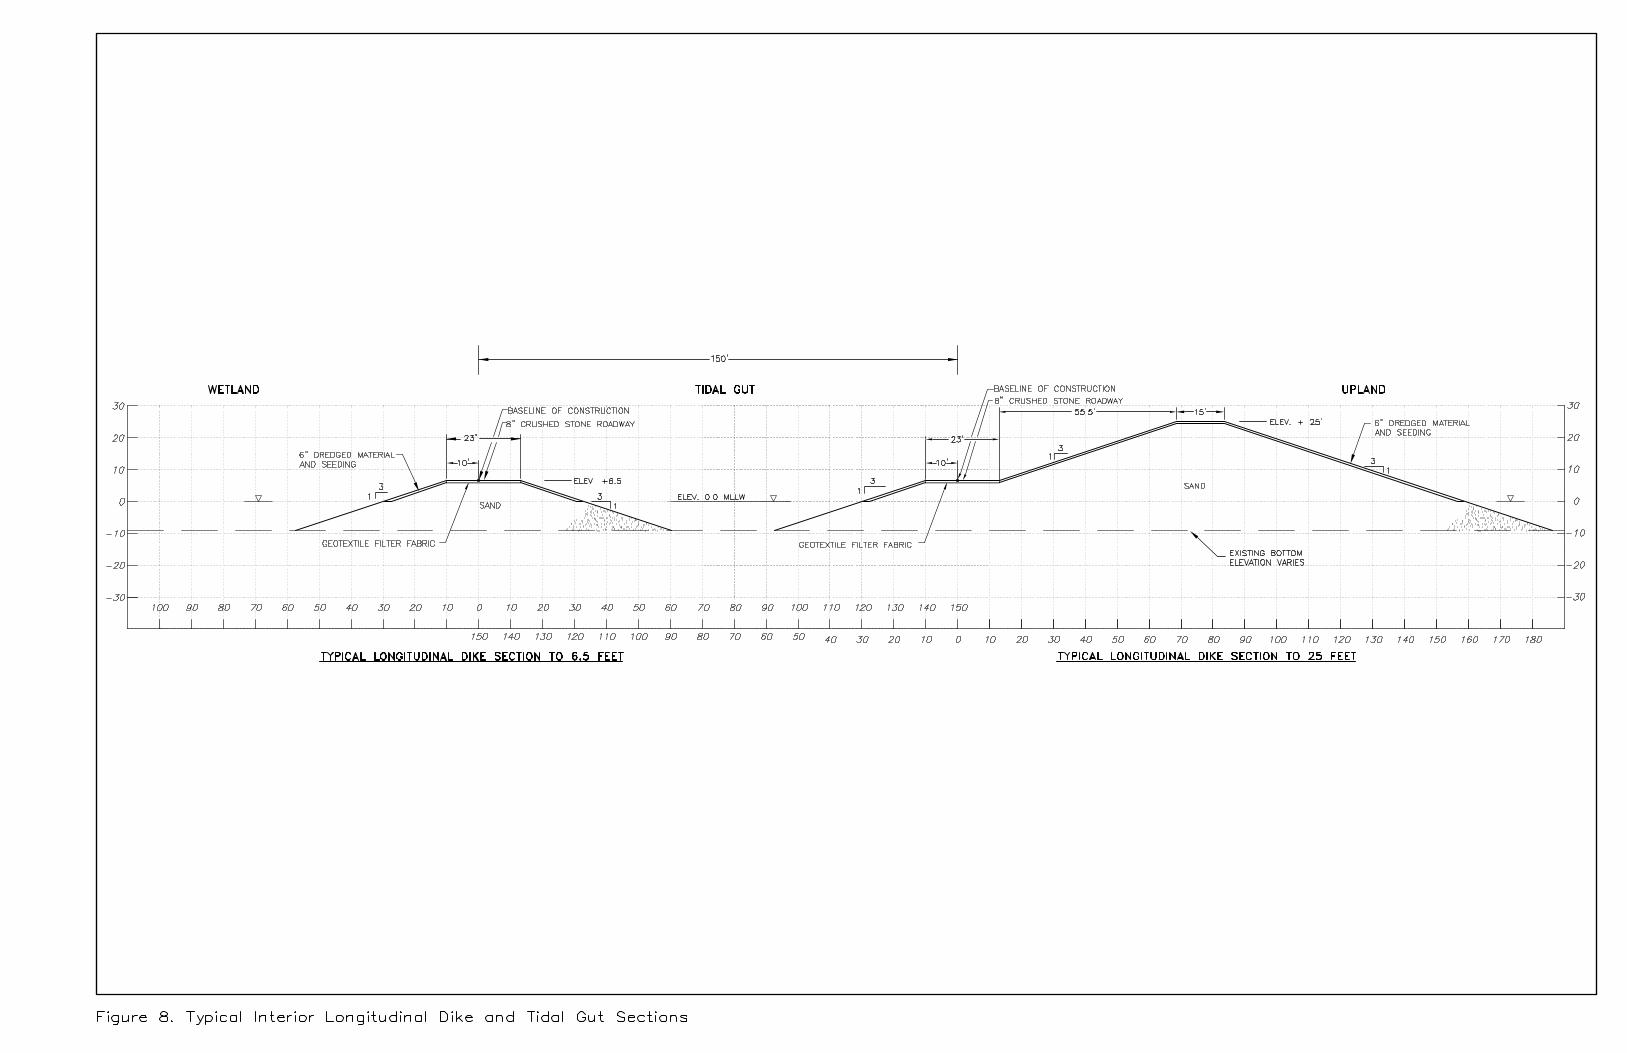

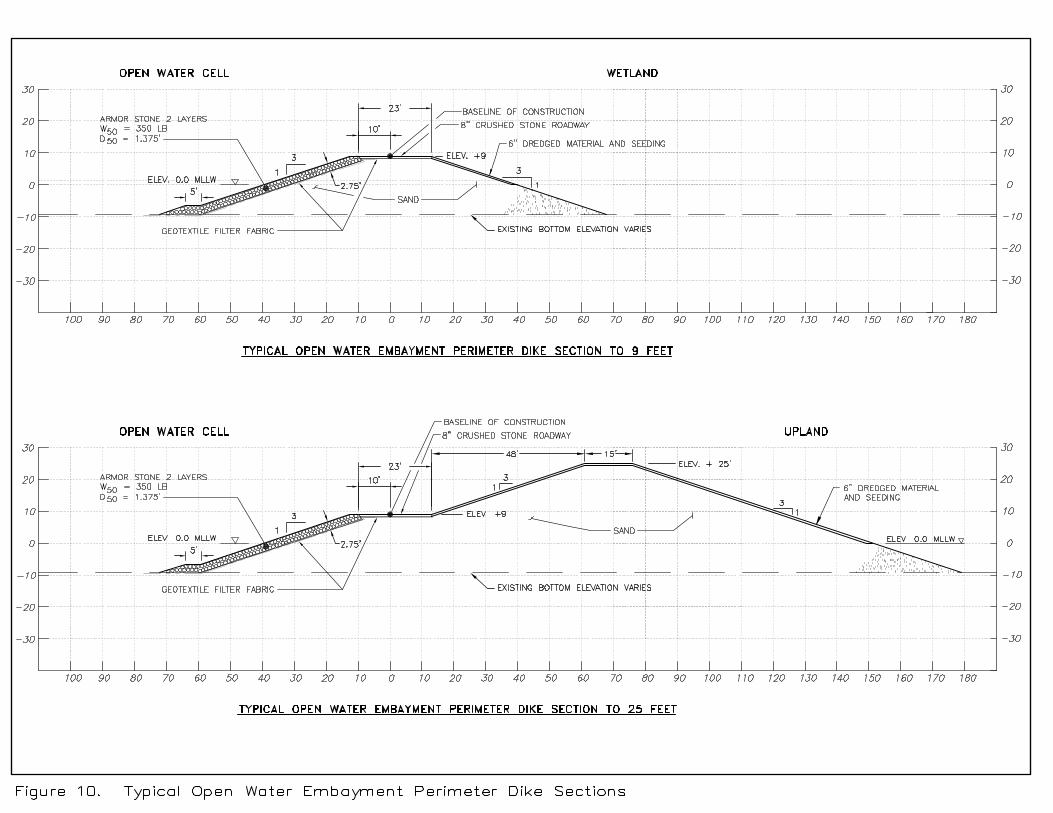


TABLE L-1 FUNDING SCHEDULE FOR THE POPLAR ISLAND ENVIRONMENTAL RESTORATION PROJECT EXISTING PROJECT PLUS EXPANSION (60% WETLANDS, 40% UPLANDS, PLUS 5-FT RAISING OF EXISTING UPLAND CELLS)
Thru FY96 FY97 FY98 FY99 FY00 FY01 FY02 FY03 FY04 FY05 FY06 FY07 FY08 FY09
Pre-Construction Costs (Fed) $1,737,660 $40,192Pre-Construction Costs (Non-Fed) $2,120,316
Site Management $1,999,989 $6,882,513 $15,735,843 $8,897,578 $15,006,924 $7,191,728 $9,078,325 $14,431,675 $7,326,227 $56,742,640Underdrains $999,994 $1,144,139Incremental Dike Raise $999,995 $3,112,195 $1,404,426 $250,000 $6,029,090 Work-In-Kind $7,559,545 $4,218,944 $4,214,828 $2,749,450 $2,805,398 $3,025,621 $2,497,535 $3,009,211 Site Operation $1,297,152 $1,500,000 $854,895 $1,220,610 $1,221,817 $1,239,909 $1,261,620 $1,286,948 Crust Management $2,172,453 $1,798,685 $2,128,481 $835,539 $889,595 $1,081,450 $519,321 $991,283
Habitat Development $450,312Other $264,726 $287,708
Monitoring $2,161,520 $1,188,386 $655,533 $493,432 $693,301 $693,986 $704,262 $716,594 $730,980Enviromental Monitoring $474,031 $295,623 $404,092 $404,491 $410,480 $417,668 $426,053Access Channel $1,939,588Access Channel Closure $30,546 $278,300 $3,342,900 $6,784,800Buildings $302,788 $476,162 Dike Construction (Expansion) $50,633,001Site Development $1,448,971 Habitat Development $36,059 $764,437 $64,699 $868,296 $511,317 $2,196,429 $2,347,224 $561,119Expansion GRR $312,927 $891,447 $890,560 $55,715Hurricane Isabel Repairs $1,285,381Construction Management $16,454 $42,168 $219,013 $553,651 $543,125 $557,335 $571,018 $584,702Planning, Engineering & Design $448,205 $96,066 $1,125,480 $1,500,135 $1,447,379 $1,415,379 $1,457,010 $1,492,782 $1,528,554
Incremental Dredging Cost $538,000 $10,485,029 $12,435,302 $4,453,642 $1,863,232 $6,137,601 $7,176,092 $7,282,352 $7,409,864 $7,558,628Mobilization, Demobilization, Prep $538,000 $908,000 $623,164 $450,000 $400,000 $388,919 $1,114,300 $1,130,800 $1,150,600 $1,173,700Mechanical Dredging $9,577,029 $11,812,138 $4,003,642 $1,463,232 $5,748,682 $6,061,792 $6,151,552 $6,259,264 $6,384,928
Phase I $703,430 $9,899,318 $35,006,425 $7,099,791 $6,209,677Lands and Damages (01) $35,000Real Estate (Labor) (01) $1,055 $1,153 $1,658Dikes (19) $8,744,774 $33,589,469 $5,568,907 $4,785,561Armoring, etc, for Internal Dike ** (19) $0 $100,000 $669,832 $789,116Coaches Island Geotubes (19) $600,000Contingency (19) Planning, Engineering, Design (30) $386,099 $361,484 $157,629 $59,938 Construction Management (31) $317,331 $792,005 $1,158,174 $799,456
Phase II $482,557 $10,704,601 $26,492,042 $6,936,603 ($12,898)Dikes (19) $7,629,986 $24,950,417 $4,533,931 ($18,826)Mob, Demob, and Preparatory Work ** (19) $2,400,000 $0 $1,600,000 Coaches Island By-pass (19) $277,207 Contingency (19) Planning, Engineering, Design (30) $482,557 $339,450 $325,018 $73,727 $4,248 Construction Management (31) $335,165 $1,216,607 $451,738 $1,680
Total Cost $1,737,660 $743,622 $9,899,318 $35,488,982 $20,342,381 $50,069,261 $35,107,748 $13,338,322 $16,870,156 $13,329,329 $16,254,417 $21,714,027 $14,736,091 $64,301,268
Total Betterment $100,000 $3,069,832 $1,389,116 $1,877,207
Total Cost (Excluding Betterment) $1,737,660 $743,622 $9,899,318 $35,388,982 $17,272,549 $48,680,145 $33,230,541 $13,338,322 $16,870,156 $13,329,329 $16,254,417 $21,714,027 $14,736,091 $64,301,268
Federal Cost $1,303,245 $557,717 $7,424,489 $26,541,737 $12,954,412 $36,510,109 $24,922,906 $10,003,741 $12,652,617 $9,996,997 $12,190,813 $16,285,520 $11,052,068 $48,225,951
Non-Federal Cost $434,415 $185,906 $2,474,830 $8,947,246 $7,387,969 $13,559,152 $10,184,842 $3,334,580 $4,217,539 $3,332,332 $4,063,604 $5,428,507 $3,684,023 $16,075,317
Proposed Work-in Kind $9,731,998 $4,218,944 $4,214,828 $2,749,450 $2,805,398 $3,025,621 $2,497,535 $3,009,211
Work In Kind Credited $7,559,545 $2,172,453 $4,218,944 $4,214,828
Non-Federal Cash Required $434,415 $185,906 $2,474,830 $8,947,246 $7,387,969 $13,559,152 $0 $0 $0 $0 $0 $0 $0 $9,957,277
Federal Cash Required $1,303,245 $557,717 $7,424,489 $26,541,737 $12,954,412 $36,510,109 $17,363,361 $11,165,869 $12,651,212 $9,114,501 $13,449,019 $18,688,406 $12,238,556 $51,334,780
Revision Date: 9/16/2005 1 of 3 Actual Costs Through: FY04

Pre-Construction Costs (Fed)Pre-Construction Costs (Non-Fed)
Site ManagementUnderdrainsIncremental Dike RaiseWork-In-Kind Site Operation Crust Management
Habitat DevelopmentOther
MonitoringEnviromental MonitoringAccess ChannelAccess Channel ClosureBuildingsDike Construction (Expansion)Site DevelopmentHabitat DevelopmentExpansion GRRHurricane Isabel RepairsConstruction ManagementPlanning, Engineering & Design
Incremental Dredging CostMobilization, Demobilization, PrepMechanical Dredging
Phase ILands and Damages (01)Real Estate (Labor) (01)Dikes (19)Armoring, etc, for Internal Dike ** (19)Coaches Island Geotubes (19)Contingency (19)Planning, Engineering, Design (30)Construction Management (31)
Phase IIDikes (19)Mob, Demob, and Preparatory Work ** (19)Coaches Island By-pass (19)Contingency (19)Planning, Engineering, Design (30)Construction Management (31)
Total Cost
Total Betterment
Total Cost (Excluding Betterment)
Federal Cost
Non-Federal Cost
Proposed Work-in Kind
Work In Kind Credited
Non-Federal Cash Required
Federal Cash Required
TABLE L-1 (continued)
FY10 FY11 FY12 FY13 FY14 FY15 FY16 FY17 FY18 FY19 FY20 FY21 FY22 FY23
$44,424,552 $5,149,138 $7,610,580 $7,213,231 $7,670,097 $7,671,153 $7,981,880 $5,069,492 $8,216,842 $5,250,563 $7,271,677 $6,003,991 $5,841,144 $5,692,157
$2,058,773 $1,402,888 $1,825,842 $1,988,361 $1,921,259 $2,001,641 $1,764,748 $2,190,393 $2,234,201 $2,278,010 $1,866,554 $1,915,984 $2,370,356 $2,130,699$1,312,278 $817,807 $834,016 $850,961 $867,907 $884,853 $453,983 $854,888 $871,986 $889,084 $906,865 $996,840 $1,016,733 $1,036,626
$400,476 $408,573 $811,820 $890,212 $866,031 $925,810 $1,115,970 $1,136,735 $1,159,470 $1,182,205 $748,834 $703,995 $1,134,181 $870,338
$346,019 $176,508 $180,006 $247,188 $187,321 $190,978 $194,795 $198,770 $202,745 $206,721 $210,855 $215,149 $219,442 $223,735$434,438 $443,223 $452,008 $461,192 $470,375 $479,559 $489,143 $499,125 $509,108 $519,090 $529,471 $540,253 $551,034 $561,815
$38,151,049
$1,615,680 $1,085,155 $3,061,599 $2,437,386 $2,895,106 $2,747,631 $4,078,883 $689,515 $3,740,468 $675,286 $3,052,362 $1,674,338 $0 $0
$598,911 $613,647 $628,383 $643,645 $659,434 $675,749 $518,878 $531,889 $545,295 $559,489 $573,683 $589,455 $807,846 $829,950$1,565,701 $1,604,225 $1,642,748 $1,682,647 $1,723,923 $1,766,573 $1,130,228 $1,158,570 $1,187,770 $1,218,688 $1,249,607 $1,283,961 $2,111,908 $2,169,693
$11,613,747 $11,848,584 $12,083,420 $12,328,932 $12,574,443 $12,819,954 $13,076,140 $13,343,000 $13,609,860 $13,876,720 $14,154,254 $14,442,463 $14,730,672 $6,870,993$1,196,800 $1,221,000 $1,245,200 $1,270,500 $1,295,800 $1,321,100 $1,347,500 $1,375,000 $1,402,500 $1,430,000 $1,458,600 $1,488,300 $1,518,000 $1,547,700
$10,416,947 $10,627,584 $10,838,220 $11,058,432 $11,278,643 $11,498,854 $11,728,640 $11,968,000 $12,207,360 $12,446,720 $12,695,654 $12,954,163 $13,212,672 $5,323,293
$56,038,299 $16,997,722 $19,694,000 $19,542,163 $20,244,540 $20,491,107 $21,058,020 $18,412,492 $21,826,702 $19,127,283 $21,425,931 $20,446,454 $20,571,816 $12,563,150
$56,038,299 $16,997,722 $19,694,000 $19,542,163 $20,244,540 $20,491,107 $21,058,020 $18,412,492 $21,826,702 $19,127,283 $21,425,931 $20,446,454 $20,571,816 $12,563,150
$42,028,724 $12,748,292 $14,770,500 $14,656,622 $15,183,405 $15,368,330 $15,793,515 $13,809,369 $16,370,027 $14,345,462 $16,069,448 $15,334,841 $15,428,862 $9,422,363
$14,009,575 $4,249,431 $4,923,500 $4,885,541 $5,061,135 $5,122,777 $5,264,505 $4,603,123 $5,456,676 $4,781,821 $5,356,483 $5,111,614 $5,142,954 $3,140,788
$2,058,773 $1,402,888 $1,825,842 $1,988,361 $1,921,259 $2,001,641 $1,764,748 $2,190,393 $2,234,201 $2,278,010 $1,866,554 $1,915,984 $2,370,356 $2,130,699
$11,950,802 $2,846,543 $3,097,658 $2,897,180 $3,139,876 $3,121,136 $3,499,757 $2,412,730 $3,222,475 $2,503,811 $3,489,929 $3,195,630 $2,772,598 $1,010,089
$42,028,724 $12,748,292 $14,770,500 $14,656,622 $15,183,405 $15,368,330 $15,793,515 $13,809,369 $16,370,027 $14,345,462 $16,069,448 $15,334,841 $15,428,862 $9,422,363
Revision Date: 9/16/2005 2 of 3 Actual Costs Through: FY04

Pre-Construction Costs (Fed)Pre-Construction Costs (Non-Fed)
Site ManagementUnderdrainsIncremental Dike RaiseWork-In-Kind Site Operation Crust Management
Habitat DevelopmentOther
MonitoringEnviromental MonitoringAccess ChannelAccess Channel ClosureBuildingsDike Construction (Expansion)Site DevelopmentHabitat DevelopmentExpansion GRRHurricane Isabel RepairsConstruction ManagementPlanning, Engineering & Design
Incremental Dredging CostMobilization, Demobilization, PrepMechanical Dredging
Phase ILands and Damages (01)Real Estate (Labor) (01)Dikes (19)Armoring, etc, for Internal Dike ** (19)Coaches Island Geotubes (19)Contingency (19)Planning, Engineering, Design (30)Construction Management (31)
Phase IIDikes (19)Mob, Demob, and Preparatory Work ** (19)Coaches Island By-pass (19)Contingency (19)Planning, Engineering, Design (30)Construction Management (31)
Total Cost
Total Betterment
Total Cost (Excluding Betterment)
Federal Cost
Non-Federal Cost
Proposed Work-in Kind
Work In Kind Credited
Non-Federal Cash Required
Federal Cash Required
TABLE L-1 (continued)
FY24 FY25 FY26 FY27 FY28 FY29 FY30 FY31 TOTAL
$1,777,852$2,120,316
$6,252,878 $5,112,559 $10,656,199 $10,894,079 $4,639,262 $5,507,079 $17,305,088 $23,965,572 $358,692,655$2,144,133
$11,795,706$2,026,377 $1,552,922 $1,517,559 $1,548,030 $675,317 $597,513 $611,349 $623,817 $67,183,125
$910,530 $398,973 $355,834 $362,978 $338,564 $345,314 $354,061 $361,282 $24,608,162$887,659 $917,969 $924,155 $942,712 $89,483 $0 $0 $26,533,435
$450,312$552,434
$228,188 $235,980 $237,570 $242,340 $247,270 $252,199 $257,288 $262,535 $9,651,690$572,996 $296,281 $298,277 $304,267 $310,456 $316,644 $323,033 $329,622 $12,523,848
$1,939,588$10,436,546
$3,693,506 $4,472,456$88,784,050
$1,448,971$570,169 $589,638 $6,091,262 $6,213,577 $1,300,215 $2,173,449 $13,882,440 $16,758,971 $82,682,710
$2,150,649$1,285,381
$853,106 $658,702 $677,273 $696,635 $478,632 $492,096 $506,088 $520,608 $16,746,860$2,230,230 $2,015,016 $2,071,828 $2,131,570 $1,874,642 $1,927,377 $1,982,178 $2,039,048 $48,279,121
$4,826,934 $4,898,247 $3,939,355 $1,798,799 $258,176,259$1,578,500 $1,632,400 $1,643,400 $1,676,400 $33,526,183$3,248,434 $3,265,847 $2,295,955 $122,399 $224,650,076
$58,918,641$35,000
$3,866$52,688,711
$1,558,948$600,000
$0$965,150
$3,066,966
$44,602,905$37,095,508
$4,000,000$277,207
$0$1,225,000$2,005,190
$11,079,812 $10,010,806 $14,595,554 $12,692,878 $4,639,262 $5,507,079 $17,305,088 $23,965,572 $722,168,312
$6,436,155
$11,079,812 $10,010,806 $14,595,554 $12,692,878 $4,639,262 $5,507,079 $17,305,088 $23,965,572 $715,732,157
$8,309,859 $7,508,105 $10,946,666 $9,519,659 $3,479,447 $4,130,309 $12,978,816 $17,974,179 $536,799,118
$2,769,953 $2,502,702 $3,648,889 $3,173,220 $1,159,816 $1,376,770 $4,326,272 $5,991,393 $185,369,194
$2,026,377 $1,552,922 $1,517,559 $1,548,030 $675,317 $597,513 $611,349 $623,817 $69,355,578
$18,165,770
$743,576 $949,780 $2,131,330 $1,625,190 $484,499 $779,257 $3,714,923 $9,082,499 $119,728,539Non-Fed Funds Recei Non-Fed Funds Received as of: 04/04 $41,100,000
$8,309,859 $7,508,105 $10,946,666 $9,519,659 $3,479,447 $4,130,309 $12,978,816 $14,259,256 $533,759,285
Revision Date: 9/16/2005 3 of 3 Actual Costs Through: FY04

Table L-2. Mean Depths and Elevations for Exterior and Interior Dike Sections
Reach Assumed Offset (ft) Actual Offset (ft) Mean Depth/ElevationLeft Right Left Right (ft MLLW)
West and North Perimeter Dikes to 10.5' 76 76 76 75 (10.0)Segmented Breakwater and Reefs to 6' - - - - (10.0)East Perimeter Dike to 10.5' 73 71 74 72 (9.2)East and South Perimeter Dikes to 25' 63 161 67 167 (6.8)
Longitudinal Interior Dike to 25' 54 183 54 183 (8.2)Longitudinal Interior Dike to 6.5' 57 60 57 60 (9.3)Open Water Interior Dike to 25' - - - - (9.3)Open Water Interior Dike to 9' - - - - (9.3)
Wetland Interior Cross Dikes 45 45 45 45 (9.6)Tidal Gut Cross Dike - - - - (6.8)Upland Interior Cross Dike(s) - - - - 15
5' Raising - Cell 2 - - - - 235' Raising - Cell 6 - - - - 23

Table L-3. Non-Armor Stone Quantities for 50 Percent Wetland, 50 Percent Upland Option
Reach Length(ft) Area (sf) Volume (cy) Area (sf) Volume (cy) Volume (cy) Tonnage
West and North Perimeter Dikes to 10.5' 9,361 1,243 430,953 16.6 5,755 5,270 7,905East Perimeter Dike to 10.5' 1,336 1,336 66,107 16.6 821 752 1,128East and South Perimeter Dikes to 25' 10,186 3,718 1,402,650 62.5 23,579 5,734 8,601
Longitudinal Interior Dike to 25' 6,551 4,127 1,001,332 79.1 19,192 3,736 5,604Longitudinal Interior Dike to 6.5' 8,822 1,098 358,761 20.6 6,731 5,032 7,548
Wetland Interior Cross Dikes 7,458 813 224,569 17.6 4,862 0 0Upland Interior Cross Dikes 3,579 350 46,394 13.5 1,790 0 0Tidal Gut Cross Dike 150 733 4,072 17.5 97 85 128
3,534,838 TOTAL 62,827 20,609 30,914
50,000
3,584,838
1,075,451
4,660,289
Reach Length(ft) Length (ft) Area (sy) Length (ft) Area (sy)
West and North Perimeter Dikes to 10.5' 9,361 33.2 34,532 33.2 26,627East Perimeter Dike to 10.5' 1,336 33.2 4,928 33.2 3,800East and South Perimeter Dikes to 25' 10,186 140 158,449 125 28,974
Longitudinal Interior Dike to 25' 6,551 173 125,925 158 18,852Longitudinal Interior Dike to 6.5' 8,822 41.2 40,385 41.2 25,584
Wetland Interior Cross Dikes 7,458 0 0 0 0Upland Interior Cross Dikes 3,579 0 0 0 0Tidal Gut Cross Dike 150 35.0 583 35.0 430
TOTAL 364,802 TOTAL 104,267TOTAL
Area (sy)34,5324,928
141,472
115,00640,385
0 00
25.8
25.926.1
Length (ft)25.625.625.6
TOTALS
GEOTEXTILE UNDER ROADWAYEROSION CONTROL MATERIAL
00
15.3
583
CRUSHED STONE ROADWAYArea (sf)
15.215.215.2
15.415.4
6" DREDGED MATERIALSAND
SUBTOTAL
336,906
Unsuitable Foundation (removal and replacement)
TOTAL SAND FILL
Sand Losses (estimated at 30% of total sand borrow)
SEEDING
TOTAL SAND BORROW
0

Table L-4. Non-Armor Stone Quantities for 60 Percent Wetland, 40 Percent Upland Option
Reach Length(ft) Area (sf) Volume (cy) Area (sf) Volume (cy) Volume (cy) Tonnage
West and North Perimeter Dikes to 10.5' 9,361 1,243 430,953 16.6 5,755 5,270 7,905East Perimeter Dike to 10.5' 2,836 1,336 140,329 16.6 1,744 1,597 2,396East and South Perimeter Dikes to 25' 8,687 3,718 1,196,232 62.5 20,109 0 0
Longitudinal Interior Dike to 25' 5,200 4,127 794,830 79.1 15,234 2,966 4,449Longitudinal Interior Dike to 6.5' 11,398 1,098 463,519 20.6 8,696 6,501 9,752
Wetland Interior Cross Dikes 7,458 813 224,569 17.6 4,862 0 0Upland Interior Cross Dike 2,354 350 30,515 13.5 1,177 0 0Tidal Gut Cross Dike 150 733 4,072 17.5 97 85 128
3,285,019 TOTAL 57,674 16,419 24,630
50,000
3,335,019
1,000,506
4,335,525
Reach Length(ft) Length (ft) Area (sy) Length (ft) Area (sy)
West and North Perimeter Dikes to 10.5' 9,361 33.2 34,532 33.2 26,627East Perimeter Dike to 10.5' 2,836 33.2 10,462 33.2 8,067East and South Perimeter Dikes to 25' 8,687 140 135,131 125 24,710
Longitudinal Interior Dike to 25' 5,200 173 99,956 158 14,964Longitudinal Interior Dike to 6.5' 11,398 41.2 52,178 41.2 33,054
Wetland Interior Cross Dikes 7,458 0 0 0 0Upland Interior Cross Dike 2,354 0 0 0 0Tidal Gut Cross Dike 150 35.0 583 35.0 430
TOTAL 332,842 TOTAL 107,852
0583
309,697 TOTAL
34,53210,462
120,653
91,28952,178
0 00
25.8
25.6
25.926.1
Area (sy) Length (ft)25.625.6
15.3
TOTALS
GEOTEXTILE UNDER ROADWAYEROSION CONTROL MATERIAL
00
6" DREDGED MATERIALSAND CRUSHED STONE ROADWAY
SUBTOTAL
Area (sf)15.215.215.2
15.415.4
Unsuitable Foundation (removal and replacement)
TOTAL SAND FILL
Sand Losses (estimated at 30% of total sand borrow)
SEEDING
TOTAL SAND BORROW

Table L-5. Non-Armor Stone Quantities for Open Water Embayment Option
Reach Length(ft) Area (sf) Volume (cy) Area (sf) Volume (cy) Volume (cy) Tonnage
West and North Perimeter Dikes to 10.5' 5,950 1,243 273,920 16.6 3,658 3,350 5,025East Perimeter Dike to 10.5' 1,343 1,336 66,454 16.6 826 756 1,134East and South Perimeter Dikes to 25' 9,875 3,718 1,359,824 62.5 22,859 0 0
Longitudinal Interior Dike to 25' 4,659 4,127 712,137 79.1 13,649 2,657 3,986Open Water Interior Dike to 25' 1,585 4,263 250,254 84.5 4,960 886 1,329Open Water Interior Dike to 9' 5,653 1,290 270,088 17.9 3,748 3,161 4,742
Wetland Interior Cross Dikes 3,994 813 120,264 17.6 2,603 0 0Upland Interior Cross Dike 2,513 350 32,576 13.5 1,257 0 0Tidal Gut Cross Dike 150 733 4,072 17.5 97 85 128
2,839,335 TOTAL 48,697 10,009 15,015
50,000
2,889,335
866,801
3,756,136
Reach Length(ft) Length (ft) Area (sy) Length (ft) Area (sy)
West and North Perimeter Dikes to 10.5' 5,950 33.2 21,949 33.2 16,924East Perimeter Dike to 10.5' 1,343 33.2 4,954 33.2 3,820East and South Perimeter Dikes to 25' 9,875 140 153,611 125 28,089
Longitudinal Interior Dike to 25' 4,659 173 89,556 158 13,408Open Water Interior Dike to 25' 1,585 145 25,536 145 4,508Open Water Interior Dike to 9' 5,653 28.5 17,901 28.5 16,080
Wetland Interior Cross Dikes 3,994 0 0 0 0Upland Interior Cross Dike 2,513 0 0 0 0Tidal Gut Cross Dike 150 35.0 583 35.0 430
TOTAL 288,554 TOTAL 78,751
SUBTOTAL
15.1
15.4
15.2
TOTALS
15.215.2
15.1
25,536 25.6
00
15.3
Unsuitable Foundation (removal and replacement)
TOTAL SAND FILL
Sand Losses (estimated at 30% of total sand borrow)
SEEDING
TOTAL SAND BORROW
6" DREDGED MATERIALSAND CRUSHED STONE ROADWAYArea (sf)
GEOTEXTILE UNDER ROADWAYEROSION CONTROL MATERIALArea (sy) Length (ft)
25.625.625.6
25.9
25.6
00
25.8
TOTAL
21,9494,954
137,153
81,791
17,901
00
583
264,331

Table L-6. Armor Stone Quantities for the 50/50 and 60/40 Wetland/Upland Options
Reach Length(ft) Area (sf) Volume (cy) Tonnage Area (sf) Volume (cy) Tonnage
West and North Perimeter Dikes to 10.5' 9,361 163 56,513 84,770 131 45,418 68,127East Perimeter Dike to 10.5' 1,336 0 0 0 123 6,086 9,129East and South Perimeter Dikes to 25' 10,186 0 0 0 101 38,103 57,155
Longitudinal Interior Dike to 25' 6,551 0 0 0 0 0 0Longitudinal Interior Dike to 6.5' 8,822 0 0 0 0 0 0
TOTALS 56,513 84,770 TOTALS 89,607 134,411
Reach Length(ft) Area (sf) Volume (cy) Tonnage Area (sf) Volume (cy) Tonnage
West and North Perimeter Dikes to 10.5' 9,361 0 0 0 92.3 32,001 48,002East Perimeter Dike to 10.5' 1,336 86.6 4,285 6,428 0 0 0East and South Perimeter Dikes to 25' 10,186 86.6 32,671 49,007 0 0 0
Longitudinal Interior Dike to 25' 6,551 0 0 0 0 0 0Longitudinal Interior Dike to 6.5' 8,822 0 0 0 0 0 0
TOTALS 36,956 55,435 TOTALS 32,001 48,002
Reach Length(ft) Area (sf) Volume (cy) Tonnage Area (sf) Volume (cy) Tonnage
West and North Perimeter Dikes to 10.5' 9,361 48.9 16,954 25,431 191 66,220 99,330East Perimeter Dike to 10.5' 1,336 0 0 0 161 7,967 11,951East and South Perimeter Dikes to 25' 10,186 0 0 0 83.7 31,577 47,366
Longitudinal Interior Dike to 25' 6,551 0 0 0 0 0 0Longitudinal Interior Dike to 6.5' 8,822 0 0 0 0 0 0
TOTALS 16,954 25,431 TOTALS 105,764 158,647
Reach Length(FT) Length (ft) Area (sy) Length (ft) Area (sy)
West and North Perimeter Dikes to 10.5' 9,361 58.5 60,847 67.2 69,895East Perimeter Dike to 10.5' 1,336 55.7 8,268 58.2 8,639East and South Perimeter Dikes to 25' 10,186 47.3 53,533 54.0 61,116
Longitudinal Interior Dike to 25' 6,551 0 0 0 0Longitudinal Interior Dike to 6.5' 8,822 0 0 0 0
TOTAL 122,648 TOTAL 139,650
GEOTEXTILE UNDER STONE (TOE DIKEGEOTEXTILE UNDER STONE (MAIN DIKE
1,500 LB ARMOR STONE2,500 LB ARMOR STONE
BEDDING STONE QUARRY RUN STONE
250 LB UNDER LAYER STONE350 LB ARMOR STONE

Table L-7. Armor Stone Quantities for the Open Water Embayment Option
Reach Length(ft) Area (sf) Volume (cy) Tonnage Area (sf) Volume (cy) Tonnage
West and North Perimeter Dikes to 10.5' 5,950 163 35,920 53,880 131 28,869 43,304Segmented Breakwater and Reefs to 6' 3,200 268 31,763 47,645 0 0 0East Perimeter Dike to 10.5' 1,343 0 0 0 123 6,118 9,177East and South Perimeter Dikes to 25' 9,875 0 0 0 101 36,940 55,410
Longitudinal Interior Dike to 25' 4,659 0 0 0 0 0 0Open Water Interior Dike to 25' 1,585 0 0 0 0 0 0Open Water Interior Dike to 9' 5,653 0 0 0 0 0 0
TOTALS 67,683 101,525 TOTALS 71,927 107,891
Reach Length(ft) Area (sf) Volume (cy) Tonnage Area (sf) Volume (cy) Tonnage
West and North Perimeter Dikes to 10.5' 5,950 0 0 0 92.3 20,340 30,510Segmented Breakwater and Reefs to 6' 3,200 0 0 0 245 29,037 43,556East Perimeter Dike to 10.5' 1,336 86.6 4,285 6,428 0 0 0East and South Perimeter Dikes to 25' 10,186 86.6 32,671 49,007 0 0 0
Longitudinal Interior Dike to 25' 4,659 0 0 0 0 0 0Open Water Interior Dike to 25' 1,585 167 9,804 14,706 0 0 0Open Water Interior Dike to 9' 5,653 167 34,965 52,448 0 0 0
TOTALS 81,725 122,589 TOTALS 49,377 74,066
Reach Length(ft) Area (sf) Volume (cy) Tonnage Area (sf) Volume (cy) Tonnage
West and North Perimeter Dikes to 10.5' 9,361 48.9 16,954 25,431 191 66,220 99,330Segmented Breakwater and Reefs to 6' 3,200 0 0 0 0 0 0East Perimeter Dike to 10.5' 1,336 0 0 0 161 7,967 11,951East and South Perimeter Dikes to 25' 10,186 0 0 0 83.7 31,577 47,366
Longitudinal Interior Dike to 25' 4,659 0 0 0 0 0 0Open Water Interior Dike to 25' 1,585 0 0 0 0 0 0Open Water Interior Dike to 9' 5,653 0 0 0 0 0 0
TOTALS 16,954 25,431 TOTALS 105,764 158,647
Reach Length(FT) Length (ft) Area (sy) Length (ft) Area (sy)
West and North Perimeter Dikes to 10.5' 9,361 58.5 60,847 67.2 69,895Segmented Breakwater and Reefs to 6' 3,200 73.8 26,240 0 268East Perimeter Dike to 10.5' 1,336 55.7 8,268 58.2 8,639East and South Perimeter Dikes to 25' 10,186 47.3 53,533 54.0 61,116
Longitudinal Interior Dike to 25' 4,659 0 0 0 0Open Water Interior Dike to 25' 1,585 18.3 3,223 58.3 10,267Open Water Interior Dike to 9' 5,653 18.3 11,494 58.3 36,619
TOTAL 152,111 TOTAL 150,185
GEOTEXTILE UNDER STONE (TOE DIKEGEOTEXTILE UNDER STONE (MAIN DIKE
1,500 LB ARMOR STONE2,500 LB ARMOR STONE
BEDDING STONE QUARRY RUN STONE
250 LB UNDER LAYER STONE350 LB ARMOR STONE

Table L-8. Quantities for 5-ft. Dike Raising of Existing Upland Cells
Reach Length(ft) Area (sf) Volume (cy) Area (sf) Volume (cy) Volume (cy) Tonnage
5' Raising - Cell 2 23,354 313 270,733 27.0 23,354 0 05' Raising - Cell 6 13,902 313 161,160 27.0 13,902 0 0
431,893 TOTAL 37,256 0 0
129,568
561,461
Reach Length(ft) Length (ft) Area (sy) Length (ft) Area (sy)
5' Raising - Cell 2 23,354 63.9 165,813 53.9 05' Raising - Cell 6 13,902 63.9 98,704 53.9 0
TOTAL 264,517 TOTAL 0223,123
GEOTEXTILE UNDER ROADWAYLength (ft)
00
TOTAL
EROSION CONTROL MATERIALArea (sy)
139,86583,258
TOTALS
CRUSHED STONE ROADWAYArea (sf)
00
Sand Losses (estimated at 30% of total sand borrow)
SEEDING
TOTAL SAND BORROW
6" DREDGED MATERIALSAND
TOTAL SAND FILL

Table L-9. Reuse of Existing Armor Stone (same for both 50/50 and 60/40 Options)
Size Armor Stone Length (ft) Area (sf) Volume (cy) Tonnage4,000 lb 2,063 108 8,252 12,3782,000 lb 2,063 92.3 7,049 10,573
3,000 lb 765 67.5 1,913 2,8691,500 lb 765 69.8 1,976 2,964

Table L-10. Channel Dredging Quantities (same for 50/50, 60/40, and Open Water Embayment Options)
Borrow Area Avg Depth (ft) Clay Depth Sand Depth Area (sf) Slope Area (sf) Vol Clay (cy) Vol Sand (cy) Total Vol (cy)Clays and Silts (19.3) 5.7 0 408,987 91,832 96,035 0 96,035
Sand (avg. 17.5' deposit) (12.6) 0 12.4 204,425 38,285 0 102,675 102,675Sand (avg. 12.5' deposit) (10.5) 2.0 12.5 284,614 81,907 24,116 150,726 174,842Sand (avg. 7.5' deposit) (10.3) 7.2 7.5 791,681 73,921 220,971 230,178 451,149
TOTAL DREDGING REQUIRED 341,122 483,579 824,701
Borrow Losses (estimated at 30% of total sand borrow) 145,074TOTAL SAND FILL AVAILABLE 338,505

Table L-11. Estimated Capacity of Lateral Expansion Options and 5-Ft Vertical Raising
Cell Area (ac) Avg. Bottom El. (ft) Nominal Volume (cy) Dike Volume (cy) Air Volume (cy)Wetland South 145 (9.7) 2,626,461 362,799 2,263,662Wetland North 124 (9.5) 2,196,864 293,041 1,903,823Upland 280 (7.2) 12,289,918 2,276,212 10,013,706
Totals 549 17,113,243 2,932,052 14,181,191
3,101,259(50,000)341,307
(341,122)
Total Air Volume 17,232,635Total Capacity 24,618,050
Cell Area (ac) Avg. Bottom El. (ft) Nominal Volume (cy) Dike Volume (cy) Air Volume (cy)Wetland South 145 (9.7) 2,626,461 362,799 2,263,662Wetland North 124 (9.5) 2,196,864 293,041 1,903,823Wetland Swing 40 (7.2) 561,182 96,360 464,822Upland 240 (7.2) 10,535,418 1,878,176 8,657,242
Totals 549 15,919,925 2,630,376 13,289,549
2,851,440(50,000)341,307
(341,122)
Total Air Volume 16,091,174Total Capacity 22,987,391
Cell Area (ac) Avg. Bottom El. (ft) Nominal Volume (cy) Dike Volume (cy) Air Volume (cy)Wetland South 25 (9.7) 457,129 102,065 355,064Wetland North 139 (9.5) 2,470,449 375,516 2,094,933Open Water 130 - - - 0Tidal Gut 5 - - - 0Upland 270 (7.2) 11,866,058 2,237,502 9,628,556
Totals 570 14,793,636 2,715,083 12,078,553
2,405,756(50,000)341,307
(341,122)
Total Air Volume 14,434,494Total Capacity 20,620,706
Cell Area (AC) Avg. Bottom El. (FT) Nominal Volume (CY) Dike Volume (CY) Air Volume (CY)5' Raising - Cell 2 326 20 2,627,313 402,208 2,225,1055' Raising - Cell 6 244 20 1,964,233 239,423 1,724,810
Totals 569 4,591,546 641,631 3,949,915
Total Air Volume 3,949,915Total Capacity 5,642,736
Plus Channel Excavation (minus spoils)Minus Channel Excavation Clays and Silts Spoils
50% Wetlands, 50% Uplands Expansion Option
Plus Borrow Areas (not incl. channel)Minus Unsuitable Foundation (spoils)
Plus Channel Excavation (minus spoils)
5-ft. Raising of Existing Upland Cells
Minus Channel Excavation Clays and Silts Spoils
Minus Channel Excavation Clays and Silts Spoils
Plus Borrow Areas (not incl. channel or dike raising)Minus Unsuitable Foundation (spoils)
Plus Channel Excavation (minus spoils)
60% Wetlands, 40% Uplands Expansion Option
Open Water Embayment Expansion Option
Plus Borrow Areas (not incl. channel or dike raising)Minus Unsuitable Foundation (spoils)

Poplar Island Environmental Restoration Project September 2005 General Reevaluation Report (GRR) and Supplemental Environmental Impact Statement (SEIS)
L-5
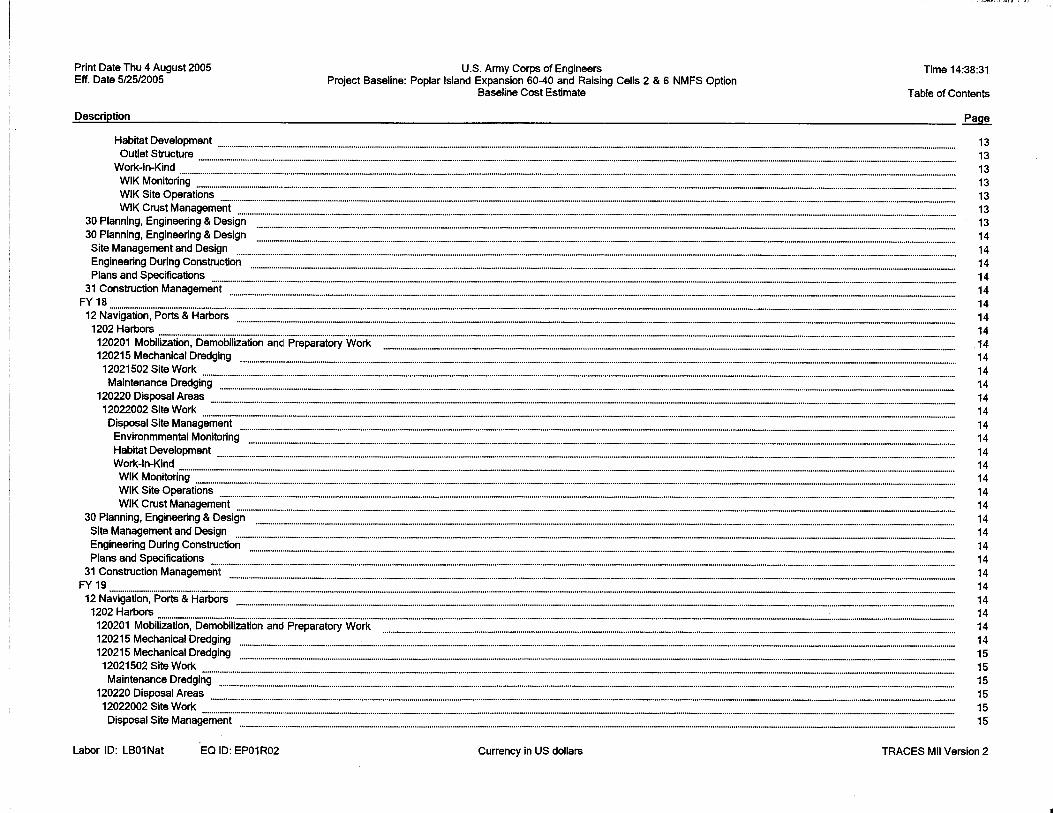
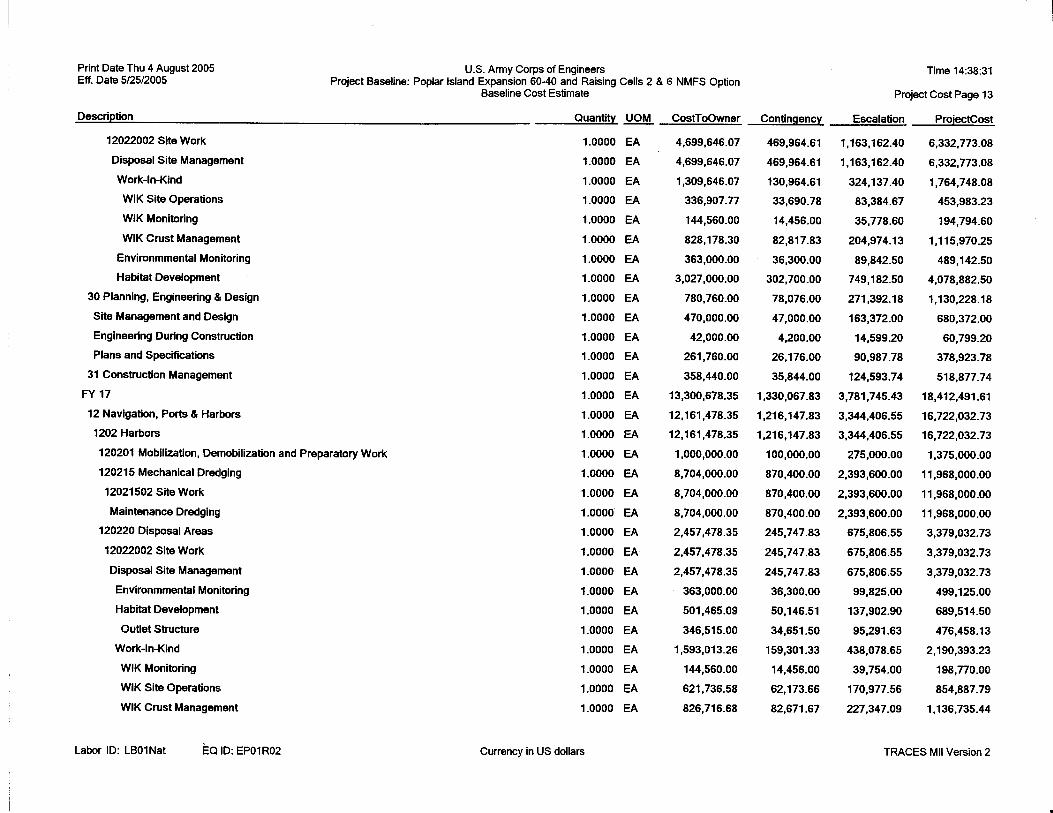
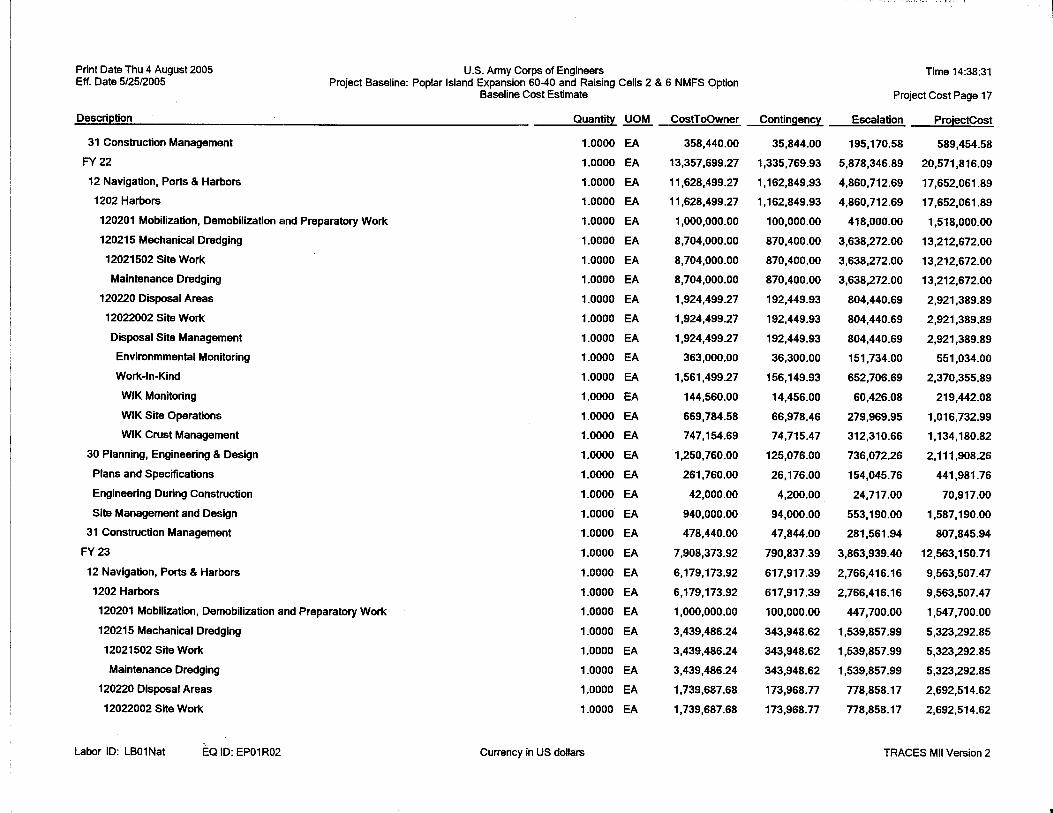
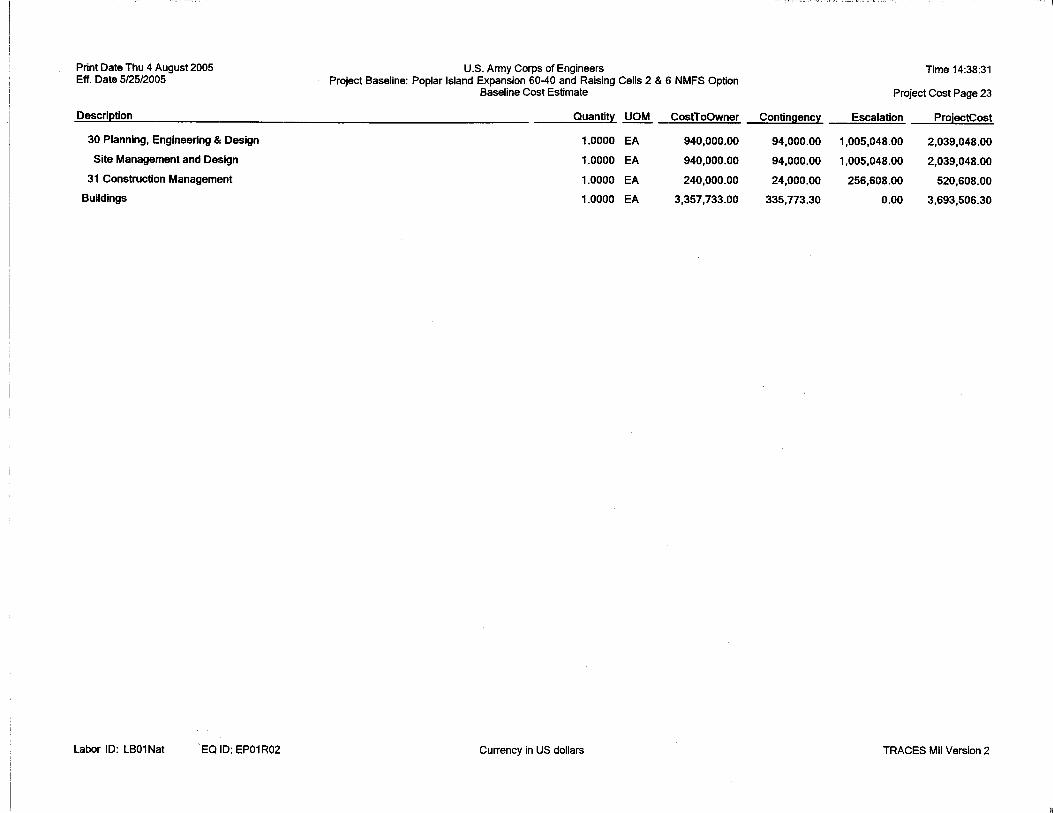
ATTACHMENT A
MCASES Cost Estimate Summary


Poplar Island Environmental Restoration Project September 2005
General Reevaluation Report (GRR) and Supplemental Environmental Impact Statement (SEIS)
L-6
ATTACHMENT B
Total Project Cost Summaries


TOTAL PROJECT COST SUMMARIESPHASE 1
THIS ESTIMATE IS BASED ON THE GRR STUDY, DATED SEPTEMBER 2005PROJECT: POPLAR ISLAND EXPANSION STUDY PREPARED BY : CENAB-EN-DT OLIVER LEIMBACHLOCATION : POPLAR ISLAND, MARYLAND P.O.C.: JOHN NAUROT, CHIEF, ESTIMATING & SPECIFICATIONS SECTION
CURRENT MCACES ESTIMATE 25 MAY 05 AUTHORIZ./BUDGET YEAR * FULLY FUNDED ESTIMATEACCOUNT EFFECTIVE PRICING LEVEL 1OCT 04 EFFECTIVE PRICING LEVEL: NUMBER ITEM DESCRIPTION COST CNTG CNTG TOTAL COST CNTG TOTAL COST CNTG FULL
($K) ($K) % ($K) ($K) ($K) ($K) ($K) ($K) ($K)
12 NAVIGATION, PORTS & HARBORS $54,848 $0 0.0% $54,848 $54,848 $0 $54,848 $54,848 $0 $54,848
TOTAL CONSTRUCTION COST $54,848 $0 0.0% $54,848 $54,848 $0 $54,848 $54,848 $0 $54,848
01 LANDS AND DAMAGES $39 $0 0.0% $39 $39 $0 $39 $39 $0 $39
30 PLANNING, ENGINEERING AND DESIGN $965 $0 0.0% $965 $965 $0 $965 $965 $0 $965
31 CONSTRUCTION MANAGEMENT $3,067 $0 0.0% $3,067 $3,067 $0 $3,067 $3,067 $0 $3,067
TOTAL PROJECT COSTS $58,919 $0 0.0% $58,919 $58,919 $0 $58,919 $58,919 $0 $58,919

TOTAL PROJECT COST SUMMARIESPHASE 2
THIS ESTIMATE IS BASED ON THE GRR STUDY, DATED SEPTEMBER 2005PROJECT: POPLAR ISLAND EXPANSION STUDY PREPARED BY : CENAB-EN-DT OLIVER LEIMBACHLOCATION : POPLAR ISLAND, MARYLAND P.O.C.: JOHN NAUROT, CHIEF, ESTIMATING & SPECIFICATIONS SECTION
CURRENT MCACES ESTIMATE 25 MAY 05 AUTHORIZ./BUDGET YEAR * FULLY FUNDED ESTIMATEACCOUNT EFFECTIVE PRICING LEVEL 1OCT 04 EFFECTIVE PRICING LEVEL: NUMBER ITEM DESCRIPTION COST CNTG CNTG TOTAL COST CNTG TOTAL COST CNTG FULL
($K) ($K) % ($K) ($K) ($K) ($K) ($K) ($K) ($K)
12 NAVIGATION, PORTS & HARBORS $41,373 $0 0.0% $41,373 $41,373 $0 $41,373 $41,373 $0 $41,373
TOTAL CONSTRUCTION COST $41,373 $0 0.0% $41,373 $41,373 $0 $41,373 $41,373 $0 $41,373
30 PLANNING, ENGINEERING AND DESIGN $1,225 $0 0.0% $1,225 $1,225 $0 $1,225 $1,225 $0 $1,225
31 CONSTRUCTION MANAGEMENT $2,005 $0 0.0% $2,005 $2,005 $0 $2,005 $2,005 $0 $2,005
TOTAL PROJECT COSTS $44,603 $0 0.0% $44,603 $44,603 $0 $44,603 $44,603 $0 $44,603

TOTAL PROJECT COST SUMMARIESFY - 98 to FY 00
THIS ESTIMATE IS BASED ON THE GRR STUDY, DATED SEPTEMBER 2005PROJECT: POPLAR ISLAND EXPANSION STUDY PREPARED BY : CENAB-EN-DT OLIVER LEIMBACHLOCATION : POPLAR ISLAND, MARYLAND P.O.C.: JOHN NAUROT, CHIEF, ESTIMATING & SPECIFICATIONS SECTION
CURRENT MCACES ESTIMATE 25 MAY 05 AUTHORIZ./BUDGET YEAR * FULLY FUNDED ESTIMATEACCOUNT EFFECTIVE PRICING LEVEL 1OCT 04 EFFECTIVE PRICING LEVEL: NUMBER ITEM DESCRIPTION COST CNTG CNTG TOTAL COST CNTG TOTAL COST CNTG FULL
($K) ($K) % ($K) ($K) ($K) ($K) ($K) ($K) ($K)
12 NAVIGATION, PORTS & HARBORS $2,538 $0 0.0% $2,538 $2,538 $0 $2,538 $2,538 $0 $2,538
TOTAL CONSTRUCTION COST $2,538 $0 0.0% $2,538 $2,538 $0 $2,538 $2,538 $0 $2,538
30 PLANNING, ENGINEERING AND DESIGN $1,778 $0 0.0% $1,778 $1,778 $0 $1,778 $1,778 $0 $1,778
31 CONSTRUCTION MANAGEMENT $0 $0 #DIV/0! $0 $0 $0 $0 $0 $0 $0
TOTAL PROJECT COSTS $4,316 $0 0.0% $4,316 $4,316 $0 $4,316 $4,316 $0 $4,316

TOTAL PROJECT COST SUMMARIESFY - 01
THIS ESTIMATE IS BASED ON THE GRR STUDY, DATED SEPTEMBER 2005PROJECT: POPLAR ISLAND EXPANSION STUDY PREPARED BY : CENAB-EN-DT OLIVER LEIMBACHLOCATION : POPLAR ISLAND, MARYLAND P.O.C.: JOHN NAUROT, CHIEF, ESTIMATING & SPECIFICATIONS SECTION
CURRENT MCACES ESTIMATE 25 MAY 05 AUTHORIZ./BUDGET YEAR * FULLY FUNDED ESTIMATEACCOUNT EFFECTIVE PRICING LEVEL 1OCT 04 EFFECTIVE PRICING LEVEL: NUMBER ITEM DESCRIPTION COST CNTG CNTG TOTAL COST CNTG TOTAL COST CNTG FULL
($K) ($K) % ($K) ($K) ($K) ($K) ($K) ($K) ($K)
12 NAVIGATION, PORTS & HARBORS $17,368 $0 0.0% $17,368 $17,368 $0 $17,368 $17,368 $0 $17,368
TOTAL CONSTRUCTION COST $17,368 $0 0.0% $17,368 $17,368 $0 $17,368 $17,368 $0 $17,368
30 PLANNING, ENGINEERING AND DESIGN $0 $0 #DIV/0! $0 $0 $0 $0 $0 $0 $0
31 CONSTRUCTION MANAGEMENT $0 $0 #DIV/0! $0 $0 $0 $0 $0 $0 $0
TOTAL PROJECT COSTS $17,368 $0 0.0% $17,368 $17,368 $0 $17,368 $17,368 $0 $17,368

TOTAL PROJECT COST SUMMARIESFY - 02
THIS ESTIMATE IS BASED ON THE GRR STUDY, DATED SEPTEMBER 2005PROJECT: POPLAR ISLAND EXPANSION STUDY PREPARED BY : CENAB-EN-DT OLIVER LEIMBACHLOCATION : POPLAR ISLAND, MARYLAND P.O.C.: JOHN NAUROT, CHIEF, ESTIMATING & SPECIFICATIONS SECTION
CURRENT MCACES ESTIMATE 25 MAY 05 AUTHORIZ./BUDGET YEAR * FULLY FUNDED ESTIMATEACCOUNT EFFECTIVE PRICING LEVEL 1OCT 04 EFFECTIVE PRICING LEVEL: NUMBER ITEM DESCRIPTION COST CNTG CNTG TOTAL COST CNTG TOTAL COST CNTG FULL
($K) ($K) % ($K) ($K) ($K) ($K) ($K) ($K) ($K)
12 NAVIGATION, PORTS & HARBORS $28,171 $0 0.0% $28,171 $28,171 $0 $28,171 $28,171 $0 $28,171
TOTAL CONSTRUCTION COST $28,171 $0 0.0% $28,171 $28,171 $0 $28,171 $28,171 $0 $28,171
30 PLANNING, ENGINEERING AND DESIGN $0 $0 #DIV/0! $0 $0 $0 $0 $0 $0 $0
31 CONSTRUCTION MANAGEMENT $0 $0 #DIV/0! $0 $0 $0 $0 $0 $0 $0
TOTAL PROJECT COSTS $28,171 $0 0.0% $28,171 $28,171 $0 $28,171 $28,171 $0 $28,171

TOTAL PROJECT COST SUMMARIESFY - 03
THIS ESTIMATE IS BASED ON THE GRR STUDY, DATED SEPTEMBER 2005PROJECT: POPLAR ISLAND EXPANSION STUDY PREPARED BY : CENAB-EN-DT OLIVER LEIMBACHLOCATION : POPLAR ISLAND, MARYLAND P.O.C.: JOHN NAUROT, CHIEF, ESTIMATING & SPECIFICATIONS SECTION
CURRENT MCACES ESTIMATE 25 MAY 05 AUTHORIZ./BUDGET YEAR * FULLY FUNDED ESTIMATEACCOUNT EFFECTIVE PRICING LEVEL 1OCT 04 EFFECTIVE PRICING LEVEL: NUMBER ITEM DESCRIPTION COST CNTG CNTG TOTAL COST CNTG TOTAL COST CNTG FULL
($K) ($K) % ($K) ($K) ($K) ($K) ($K) ($K) ($K)
12 NAVIGATION, PORTS & HARBORS $13,351 $0 0.0% $13,351 $13,351 $0 $13,351 $13,351 $0 $13,351
TOTAL CONSTRUCTION COST $13,351 $0 0.0% $13,351 $13,351 $0 $13,351 $13,351 $0 $13,351
30 PLANNING, ENGINEERING AND DESIGN $0 $0 #DIV/0! $0 $0 $0 $0 $0 $0 $0
31 CONSTRUCTION MANAGEMENT $0 $0 #DIV/0! $0 $0 $0 $0 $0 $0 $0
TOTAL PROJECT COSTS $13,351 $0 0.0% $13,351 $13,351 $0 $13,351 $13,351 $0 $13,351

TOTAL PROJECT COST SUMMARIESFY - 04
THIS ESTIMATE IS BASED ON THE GRR STUDY, DATED SEPTEMBER 2005PROJECT: POPLAR ISLAND EXPANSION STUDY PREPARED BY : CENAB-EN-DT OLIVER LEIMBACHLOCATION : POPLAR ISLAND, MARYLAND P.O.C.: JOHN NAUROT, CHIEF, ESTIMATING & SPECIFICATIONS SECTION
CURRENT MCACES ESTIMATE 25 MAY 05 AUTHORIZ./BUDGET YEAR * FULLY FUNDED ESTIMATEACCOUNT EFFECTIVE PRICING LEVEL 1OCT 04 EFFECTIVE PRICING LEVEL: NUMBER ITEM DESCRIPTION COST CNTG CNTG TOTAL COST CNTG TOTAL COST CNTG FULL
($K) ($K) % ($K) ($K) ($K) ($K) ($K) ($K) ($K)
12 NAVIGATION, PORTS & HARBORS $16,870 $0 0.0% $16,870 $16,870 $0 $16,870 $16,870 $0 $16,870
TOTAL CONSTRUCTION COST $16,870 $0 0.0% $16,870 $16,870 $0 $16,870 $16,870 $0 $16,870
30 PLANNING, ENGINEERING AND DESIGN $0 $0 #DIV/0! $0 $0 $0 $0 $0 $0 $0
31 CONSTRUCTION MANAGEMENT $0 $0 #DIV/0! $0 $0 $0 $0 $0 $0 $0
TOTAL PROJECT COSTS $16,870 $0 0.0% $16,870 $16,870 $0 $16,870 $16,870 $0 $16,870

TOTAL PROJECT COST SUMMARIESFY - 05
THIS ESTIMATE IS BASED ON THE GRR STUDY, DATED SEPTEMBER 2005PROJECT: POPLAR ISLAND EXPANSION STUDY PREPARED BY : CENAB-EN-DT OLIVER LEIMBACHLOCATION : POPLAR ISLAND, MARYLAND P.O.C.: JOHN NAUROT, CHIEF, ESTIMATING & SPECIFICATIONS SECTION
CURRENT MCACES ESTIMATE 25 MAY 05 AUTHORIZ./BUDGET YEAR * FULLY FUNDED ESTIMATEACCOUNT EFFECTIVE PRICING LEVEL 1OCT 04 EFFECTIVE PRICING LEVEL: NUMBER ITEM DESCRIPTION COST CNTG CNTG TOTAL COST CNTG TOTAL COST CNTG FULL
($K) ($K) % ($K) ($K) ($K) ($K) ($K) ($K) ($K)
12 NAVIGATION, PORTS & HARBORS $10,176 $1,018 10.0% $11,194 $10,176 $1,018 $11,194 $10,298 $1,030 $11,328
TOTAL CONSTRUCTION COST $10,176 $1,018 10.0% $11,194 $10,176 $1,018 $11,194 $10,298 $1,030 $11,328
30 PLANNING, ENGINEERING AND DESIGN $1,251 $125 10.0% $1,376 $1,251 $125 $1,376 $1,316 $132 $1,447
31 CONSTRUCTION MANAGEMENT $478 $48 10.0% $526 $478 $48 $526 $503 $50 $554
TOTAL PROJECT COSTS $11,906 $1,191 10.0% $13,096 $11,906 $1,191 $13,096 $12,118 $1,212 $13,329

TOTAL PROJECT COST SUMMARIESFY - 06
THIS ESTIMATE IS BASED ON THE GRR STUDY, DATED SEPTEMBER 2005PROJECT: POPLAR ISLAND EXPANSION STUDY PREPARED BY : CENAB-EN-DT OLIVER LEIMBACHLOCATION : POPLAR ISLAND, MARYLAND P.O.C.: JOHN NAUROT, CHIEF, ESTIMATING & SPECIFICATIONS SECTION
CURRENT MCACES ESTIMATE 25 MAY 05 AUTHORIZ./BUDGET YEAR * FULLY FUNDED ESTIMATEACCOUNT EFFECTIVE PRICING LEVEL 1OCT 04 EFFECTIVE PRICING LEVEL: NUMBER ITEM DESCRIPTION COST CNTG CNTG TOTAL COST CNTG TOTAL COST CNTG FULL
($K) ($K) % ($K) ($K) ($K) ($K) ($K) ($K) ($K)
12 NAVIGATION, PORTS & HARBORS $12,830 $1,283 10.0% $14,112 $12,830 $1,283 $14,112 $12,996 $1,300 $14,296
TOTAL CONSTRUCTION COST $12,830 $1,283 10.0% $14,112 $12,830 $1,283 $14,112 $12,996 $1,300 $14,296
30 PLANNING, ENGINEERING AND DESIGN $1,247 $125 10.0% $1,371 $1,247 $125 $1,371 $1,287 $129 $1,415
31 CONSTRUCTION MANAGEMENT $478 $48 10.0% $526 $478 $48 $526 $494 $49 $543
TOTAL PROJECT COSTS $14,555 $1,455 10.0% $16,010 $14,555 $1,455 $16,010 $14,777 $1,478 $16,254

TOTAL PROJECT COST SUMMARIESFY - 07
THIS ESTIMATE IS BASED ON THE GRR STUDY, DATED SEPTEMBER 2005PROJECT: POPLAR ISLAND EXPANSION STUDY PREPARED BY : CENAB-EN-DT OLIVER LEIMBACHLOCATION : POPLAR ISLAND, MARYLAND P.O.C.: JOHN NAUROT, CHIEF, ESTIMATING & SPECIFICATIONS SECTION
CURRENT MCACES ESTIMATE 25 MAY 05 AUTHORIZ./BUDGET YEAR * FULLY FUNDED ESTIMATEACCOUNT EFFECTIVE PRICING LEVEL 1OCT 04 EFFECTIVE PRICING LEVEL: NUMBER ITEM DESCRIPTION COST CNTG CNTG TOTAL COST CNTG TOTAL COST CNTG FULL
($K) ($K) % ($K) ($K) ($K) ($K) ($K) ($K) ($K)
12 NAVIGATION, PORTS & HARBORS $17,421 $1,742 10.0% $19,163 $17,421 $1,742 $19,163 $17,909 $1,791 $19,700
TOTAL CONSTRUCTION COST $17,421 $1,742 10.0% $19,163 $17,421 $1,742 $19,163 $17,909 $1,791 $19,700
30 PLANNING, ENGINEERING AND DESIGN $1,251 $125 10.0% $1,376 $1,251 $125 $1,376 $1,325 $132 $1,457
31 CONSTRUCTION MANAGEMENT $478 $48 10.0% $526 $478 $48 $526 $507 $51 $557
TOTAL PROJECT COSTS $19,150 $1,915 10.0% $21,065 $19,150 $1,915 $21,065 $19,740 $1,974 $21,714

TOTAL PROJECT COST SUMMARIESFY - 08
THIS ESTIMATE IS BASED ON THE GRR STUDY, DATED SEPTEMBER 2005PROJECT: POPLAR ISLAND EXPANSION STUDY PREPARED BY : CENAB-EN-DT OLIVER LEIMBACHLOCATION : POPLAR ISLAND, MARYLAND P.O.C.: JOHN NAUROT, CHIEF, ESTIMATING & SPECIFICATIONS SECTION
CURRENT MCACES ESTIMATE 25 MAY 05 AUTHORIZ./BUDGET YEAR * FULLY FUNDED ESTIMATEACCOUNT EFFECTIVE PRICING LEVEL 1OCT 04 EFFECTIVE PRICING LEVEL: NUMBER ITEM DESCRIPTION COST CNTG CNTG TOTAL COST CNTG TOTAL COST CNTG FULL
($K) ($K) % ($K) ($K) ($K) ($K) ($K) ($K) ($K)
12 NAVIGATION, PORTS & HARBORS $11,014 $1,101 10.0% $12,115 $11,014 $1,101 $12,115 $11,520 $1,152 $12,672
TOTAL CONSTRUCTION COST $11,014 $1,101 10.0% $12,115 $11,014 $1,101 $12,115 $11,520 $1,152 $12,672
30 PLANNING, ENGINEERING AND DESIGN $1,251 $125 10.0% $1,376 $1,251 $125 $1,376 $1,357 $136 $1,493
31 CONSTRUCTION MANAGEMENT $478 $48 10.0% $526 $478 $48 $526 $519 $52 $571
TOTAL PROJECT COSTS $12,743 $1,274 10.0% $14,017 $12,743 $1,274 $14,017 $13,396 $1,340 $14,736

TOTAL PROJECT COST SUMMARIESFY - 09
THIS ESTIMATE IS BASED ON THE GRR STUDY, DATED SEPTEMBER 2005PROJECT: POPLAR ISLAND EXPANSION STUDY PREPARED BY : CENAB-EN-DT OLIVER LEIMBACHLOCATION : POPLAR ISLAND, MARYLAND P.O.C.: JOHN NAUROT, CHIEF, ESTIMATING & SPECIFICATIONS SECTION
CURRENT MCACES ESTIMATE 25 MAY 05 AUTHORIZ./BUDGET YEAR * FULLY FUNDED ESTIMATEACCOUNT EFFECTIVE PRICING LEVEL 1OCT 04 EFFECTIVE PRICING LEVEL: NUMBER ITEM DESCRIPTION COST CNTG CNTG TOTAL COST CNTG TOTAL COST CNTG FULL
($K) ($K) % ($K) ($K) ($K) ($K) ($K) ($K) ($K)
12 NAVIGATION, PORTS & HARBORS $52,985 $5,298 10.0% $58,283 $52,985 $5,298 $58,283 $56,535 $5,653 $62,188
TOTAL CONSTRUCTION COST $52,985 $5,298 10.0% $58,283 $52,985 $5,298 $58,283 $56,535 $5,653 $62,188
30 PLANNING, ENGINEERING AND DESIGN $1,251 $125 10.0% $1,376 $1,251 $125 $1,376 $1,390 $139 $1,529
31 CONSTRUCTION MANAGEMENT $478 $48 10.0% $526 $478 $48 $526 $532 $53 $585
TOTAL PROJECT COSTS $54,714 $5,471 10.0% $60,185 $54,714 $5,471 $60,185 $58,456 $5,846 $64,301

TOTAL PROJECT COST SUMMARIESFY - 10
THIS ESTIMATE IS BASED ON THE GRR STUDY, DATED SEPTEMBER 2005PROJECT: POPLAR ISLAND EXPANSION STUDY PREPARED BY : CENAB-EN-DT OLIVER LEIMBACHLOCATION : POPLAR ISLAND, MARYLAND P.O.C.: JOHN NAUROT, CHIEF, ESTIMATING & SPECIFICATIONS SECTION
CURRENT MCACES ESTIMATE 25 MAY 05 AUTHORIZ./BUDGET YEAR * FULLY FUNDED ESTIMATEACCOUNT EFFECTIVE PRICING LEVEL 1OCT 04 EFFECTIVE PRICING LEVEL: NUMBER ITEM DESCRIPTION COST CNTG CNTG TOTAL COST CNTG TOTAL COST CNTG FULL
($K) ($K) % ($K) ($K) ($K) ($K) ($K) ($K) ($K)
12 NAVIGATION, PORTS & HARBORS $45,015 $4,501 10.0% $49,516 $45,015 $4,501 $49,516 $48,976 $4,898 $53,874
TOTAL CONSTRUCTION COST $45,015 $4,501 10.0% $49,516 $45,015 $4,501 $49,516 $48,976 $4,898 $53,874
30 PLANNING, ENGINEERING AND DESIGN $1,251 $125 10.0% $1,376 $1,251 $125 $1,376 $1,423 $142 $1,566
31 CONSTRUCTION MANAGEMENT $478 $48 10.0% $526 $478 $48 $526 $544 $54 $599
TOTAL PROJECT COSTS $46,744 $4,674 10.0% $51,418 $46,744 $4,674 $51,418 $50,944 $5,094 $56,038

TOTAL PROJECT COST SUMMARIESFY - 11
THIS ESTIMATE IS BASED ON THE GRR STUDY, DATED SEPTEMBER 2005PROJECT: POPLAR ISLAND EXPANSION STUDY PREPARED BY : CENAB-EN-DT OLIVER LEIMBACHLOCATION : POPLAR ISLAND, MARYLAND P.O.C.: JOHN NAUROT, CHIEF, ESTIMATING & SPECIFICATIONS SECTION
CURRENT MCACES ESTIMATE 25 MAY 05 AUTHORIZ./BUDGET YEAR * FULLY FUNDED ESTIMATEACCOUNT EFFECTIVE PRICING LEVEL 1OCT 04 EFFECTIVE PRICING LEVEL: NUMBER ITEM DESCRIPTION COST CNTG CNTG TOTAL COST CNTG TOTAL COST CNTG FULL
($K) ($K) % ($K) ($K) ($K) ($K) ($K) ($K) ($K)
12 NAVIGATION, PORTS & HARBORS $12,105 $1,210 10.0% $13,315 $12,105 $1,210 $13,315 $13,436 $1,344 $14,780
TOTAL CONSTRUCTION COST $12,105 $1,210 10.0% $13,315 $12,105 $1,210 $13,315 $13,436 $1,344 $14,780
30 PLANNING, ENGINEERING AND DESIGN $1,251 $125 10.0% $1,376 $1,251 $125 $1,376 $1,458 $146 $1,604
31 CONSTRUCTION MANAGEMENT $478 $48 10.0% $526 $478 $48 $526 $558 $56 $614
TOTAL PROJECT COSTS $13,834 $1,383 10.0% $15,217 $13,834 $1,383 $15,217 $15,452 $1,545 $16,998

TOTAL PROJECT COST SUMMARIESFY - 12
THIS ESTIMATE IS BASED ON THE GRR STUDY, DATED SEPTEMBER 2005PROJECT: POPLAR ISLAND EXPANSION STUDY PREPARED BY : CENAB-EN-DT OLIVER LEIMBACHLOCATION : POPLAR ISLAND, MARYLAND P.O.C.: JOHN NAUROT, CHIEF, ESTIMATING & SPECIFICATIONS SECTION
CURRENT MCACES ESTIMATE 25 MAY 05 AUTHORIZ./BUDGET YEAR * FULLY FUNDED ESTIMATEACCOUNT EFFECTIVE PRICING LEVEL 1OCT 04 EFFECTIVE PRICING LEVEL: NUMBER ITEM DESCRIPTION COST CNTG CNTG TOTAL COST CNTG TOTAL COST CNTG FULL
($K) ($K) % ($K) ($K) ($K) ($K) ($K) ($K) ($K)
12 NAVIGATION, PORTS & HARBORS $13,992 $1,399 10.0% $15,391 $13,992 $1,399 $15,391 $15,839 $1,584 $17,423
TOTAL CONSTRUCTION COST $13,992 $1,399 10.0% $15,391 $13,992 $1,399 $15,391 $15,839 $1,584 $17,423
30 PLANNING, ENGINEERING AND DESIGN $1,251 $125 10.0% $1,376 $1,251 $125 $1,376 $1,493 $149 $1,643
31 CONSTRUCTION MANAGEMENT $478 $48 10.0% $526 $478 $48 $526 $571 $57 $628
TOTAL PROJECT COSTS $15,721 $1,572 10.0% $17,293 $15,721 $1,572 $17,293 $17,904 $1,790 $19,694

TOTAL PROJECT COST SUMMARIESFY - 13
THIS ESTIMATE IS BASED ON THE GRR STUDY, DATED SEPTEMBER 2005PROJECT: POPLAR ISLAND EXPANSION STUDY PREPARED BY : CENAB-EN-DT OLIVER LEIMBACHLOCATION : POPLAR ISLAND, MARYLAND P.O.C.: JOHN NAUROT, CHIEF, ESTIMATING & SPECIFICATIONS SECTION
CURRENT MCACES ESTIMATE 25 MAY 05 AUTHORIZ./BUDGET YEAR * FULLY FUNDED ESTIMATEACCOUNT EFFECTIVE PRICING LEVEL 1OCT 04 EFFECTIVE PRICING LEVEL: NUMBER ITEM DESCRIPTION COST CNTG CNTG TOTAL COST CNTG TOTAL COST CNTG FULL
($K) ($K) % ($K) ($K) ($K) ($K) ($K) ($K) ($K)
12 NAVIGATION, PORTS & HARBORS $13,550 $1,355 10.0% $14,906 $13,550 $1,355 $14,906 $15,651 $1,565 $17,216
TOTAL CONSTRUCTION COST $13,550 $1,355 10.0% $14,906 $13,550 $1,355 $14,906 $15,651 $1,565 $17,216
30 PLANNING, ENGINEERING AND DESIGN $1,251 $125 10.0% $1,376 $1,251 $125 $1,376 $1,530 $153 $1,683
31 CONSTRUCTION MANAGEMENT $478 $48 10.0% $526 $478 $48 $526 $585 $59 $644
TOTAL PROJECT COSTS $15,280 $1,528 10.0% $16,808 $15,280 $1,528 $16,808 $17,766 $1,777 $19,542

TOTAL PROJECT COST SUMMARIESFY - 14
THIS ESTIMATE IS BASED ON THE GRR STUDY, DATED SEPTEMBER 2005PROJECT: POPLAR ISLAND EXPANSION STUDY PREPARED BY : CENAB-EN-DT OLIVER LEIMBACHLOCATION : POPLAR ISLAND, MARYLAND P.O.C.: JOHN NAUROT, CHIEF, ESTIMATING & SPECIFICATIONS SECTION
CURRENT MCACES ESTIMATE 25 MAY 05 AUTHORIZ./BUDGET YEAR * FULLY FUNDED ESTIMATEACCOUNT EFFECTIVE PRICING LEVEL 1OCT 04 EFFECTIVE PRICING LEVEL: NUMBER ITEM DESCRIPTION COST CNTG CNTG TOTAL COST CNTG TOTAL COST CNTG FULL
($K) ($K) % ($K) ($K) ($K) ($K) ($K) ($K) ($K)
12 NAVIGATION, PORTS & HARBORS $13,784 $1,378 10.0% $15,162 $13,784 $1,378 $15,162 $16,237 $1,624 $17,861
TOTAL CONSTRUCTION COST $13,784 $1,378 10.0% $15,162 $13,784 $1,378 $15,162 $16,237 $1,624 $17,861
30 PLANNING, ENGINEERING AND DESIGN $1,251 $125 10.0% $1,376 $1,251 $125 $1,376 $1,567 $157 $1,724
31 CONSTRUCTION MANAGEMENT $478 $48 10.0% $526 $478 $48 $526 $599 $60 $659
TOTAL PROJECT COSTS $15,513 $1,551 10.0% $17,064 $15,513 $1,551 $17,064 $18,404 $1,840 $20,245

TOTAL PROJECT COST SUMMARIESFY - 15
THIS ESTIMATE IS BASED ON THE GRR STUDY, DATED SEPTEMBER 2005PROJECT: POPLAR ISLAND EXPANSION STUDY PREPARED BY : CENAB-EN-DT OLIVER LEIMBACHLOCATION : POPLAR ISLAND, MARYLAND P.O.C.: JOHN NAUROT, CHIEF, ESTIMATING & SPECIFICATIONS SECTION
CURRENT MCACES ESTIMATE 25 MAY 05 AUTHORIZ./BUDGET YEAR * FULLY FUNDED ESTIMATEACCOUNT EFFECTIVE PRICING LEVEL 1OCT 04 EFFECTIVE PRICING LEVEL: NUMBER ITEM DESCRIPTION COST CNTG CNTG TOTAL COST CNTG TOTAL COST CNTG FULL
($K) ($K) % ($K) ($K) ($K) ($K) ($K) ($K) ($K)
12 NAVIGATION, PORTS & HARBORS $13,662 $1,366 10.0% $15,028 $13,662 $1,366 $15,028 $16,408 $1,641 $18,049
TOTAL CONSTRUCTION COST $13,662 $1,366 10.0% $15,028 $13,662 $1,366 $15,028 $16,408 $1,641 $18,049
30 PLANNING, ENGINEERING AND DESIGN $1,251 $125 10.0% $1,376 $1,251 $125 $1,376 $1,606 $161 $1,767
31 CONSTRUCTION MANAGEMENT $478 $48 10.0% $526 $478 $48 $526 $614 $61 $676
TOTAL PROJECT COSTS $15,391 $1,539 10.0% $16,930 $15,391 $1,539 $16,930 $18,628 $1,863 $20,491

TOTAL PROJECT COST SUMMARIESFY - 16
THIS ESTIMATE IS BASED ON THE GRR STUDY, DATED SEPTEMBER 2005PROJECT: POPLAR ISLAND EXPANSION STUDY PREPARED BY : CENAB-EN-DT OLIVER LEIMBACHLOCATION : POPLAR ISLAND, MARYLAND P.O.C.: JOHN NAUROT, CHIEF, ESTIMATING & SPECIFICATIONS SECTION
CURRENT MCACES ESTIMATE 25 MAY 05 AUTHORIZ./BUDGET YEAR * FULLY FUNDED ESTIMATEACCOUNT EFFECTIVE PRICING LEVEL 1OCT 04 EFFECTIVE PRICING LEVEL: NUMBER ITEM DESCRIPTION COST CNTG CNTG TOTAL COST CNTG TOTAL COST CNTG FULL
($K) ($K) % ($K) ($K) ($K) ($K) ($K) ($K) ($K)
12 NAVIGATION, PORTS & HARBORS $14,404 $1,440 10.0% $15,844 $14,404 $1,440 $15,844 $17,644 $1,764 $19,409
TOTAL CONSTRUCTION COST $14,404 $1,440 10.0% $15,844 $14,404 $1,440 $15,844 $17,644 $1,764 $19,409
30 PLANNING, ENGINEERING AND DESIGN $781 $78 10.0% $859 $781 $78 $859 $1,027 $103 $1,130
31 CONSTRUCTION MANAGEMENT $358 $36 10.0% $394 $358 $36 $394 $472 $47 $519
TOTAL PROJECT COSTS $15,543 $1,554 10.0% $17,097 $15,543 $1,554 $17,097 $19,144 $1,914 $21,058

TOTAL PROJECT COST SUMMARIESFY - 17
THIS ESTIMATE IS BASED ON THE GRR STUDY, DATED SEPTEMBER 2005PROJECT: POPLAR ISLAND EXPANSION STUDY PREPARED BY : CENAB-EN-DT OLIVER LEIMBACHLOCATION : POPLAR ISLAND, MARYLAND P.O.C.: JOHN NAUROT, CHIEF, ESTIMATING & SPECIFICATIONS SECTION
CURRENT MCACES ESTIMATE 25 MAY 05 AUTHORIZ./BUDGET YEAR * FULLY FUNDED ESTIMATEACCOUNT EFFECTIVE PRICING LEVEL 1OCT 04 EFFECTIVE PRICING LEVEL: NUMBER ITEM DESCRIPTION COST CNTG CNTG TOTAL COST CNTG TOTAL COST CNTG FULL
($K) ($K) % ($K) ($K) ($K) ($K) ($K) ($K) ($K)
12 NAVIGATION, PORTS & HARBORS $12,161 $1,216 10.0% $13,378 $12,161 $1,216 $13,378 $15,202 $1,520 $16,722
TOTAL CONSTRUCTION COST $12,161 $1,216 10.0% $13,378 $12,161 $1,216 $13,378 $15,202 $1,520 $16,722
30 PLANNING, ENGINEERING AND DESIGN $781 $78 10.0% $859 $781 $78 $859 $1,053 $105 $1,159
31 CONSTRUCTION MANAGEMENT $358 $36 10.0% $394 $358 $36 $394 $484 $48 $532
TOTAL PROJECT COSTS $13,301 $1,330 10.0% $14,631 $13,301 $1,330 $14,631 $16,739 $1,674 $18,412

TOTAL PROJECT COST SUMMARIESFY - 18
THIS ESTIMATE IS BASED ON THE GRR STUDY, DATED SEPTEMBER 2005PROJECT: POPLAR ISLAND EXPANSION STUDY PREPARED BY : CENAB-EN-DT OLIVER LEIMBACHLOCATION : POPLAR ISLAND, MARYLAND P.O.C.: JOHN NAUROT, CHIEF, ESTIMATING & SPECIFICATIONS SECTION
CURRENT MCACES ESTIMATE 25 MAY 05 AUTHORIZ./BUDGET YEAR * FULLY FUNDED ESTIMATEACCOUNT EFFECTIVE PRICING LEVEL 1OCT 04 EFFECTIVE PRICING LEVEL: NUMBER ITEM DESCRIPTION COST CNTG CNTG TOTAL COST CNTG TOTAL COST CNTG FULL
($K) ($K) % ($K) ($K) ($K) ($K) ($K) ($K) ($K)
12 NAVIGATION, PORTS & HARBORS $14,327 $1,433 10.0% $15,760 $14,327 $1,433 $15,760 $18,267 $1,827 $20,094
TOTAL CONSTRUCTION COST $14,327 $1,433 10.0% $15,760 $14,327 $1,433 $15,760 $18,267 $1,827 $20,094
30 PLANNING, ENGINEERING AND DESIGN $781 $78 10.0% $859 $781 $78 $859 $1,080 $108 $1,188
31 CONSTRUCTION MANAGEMENT $358 $36 10.0% $394 $358 $36 $394 $496 $50 $545
TOTAL PROJECT COSTS $15,466 $1,547 10.0% $17,013 $15,466 $1,547 $17,013 $19,842 $1,984 $21,827

TOTAL PROJECT COST SUMMARIESFY - 19
THIS ESTIMATE IS BASED ON THE GRR STUDY, DATED SEPTEMBER 2005PROJECT: POPLAR ISLAND EXPANSION STUDY PREPARED BY : CENAB-EN-DT OLIVER LEIMBACHLOCATION : POPLAR ISLAND, MARYLAND P.O.C.: JOHN NAUROT, CHIEF, ESTIMATING & SPECIFICATIONS SECTION
CURRENT MCACES ESTIMATE 25 MAY 05 AUTHORIZ./BUDGET YEAR * FULLY FUNDED ESTIMATEACCOUNT EFFECTIVE PRICING LEVEL 1OCT 04 EFFECTIVE PRICING LEVEL: NUMBER ITEM DESCRIPTION COST CNTG CNTG TOTAL COST CNTG TOTAL COST CNTG FULL
($K) ($K) % ($K) ($K) ($K) ($K) ($K) ($K) ($K)
12 NAVIGATION, PORTS & HARBORS $12,132 $1,213 10.0% $13,345 $12,132 $1,213 $13,345 $15,772 $1,577 $17,349
TOTAL CONSTRUCTION COST $12,132 $1,213 10.0% $13,345 $12,132 $1,213 $13,345 $15,772 $1,577 $17,349
30 PLANNING, ENGINEERING AND DESIGN $781 $78 10.0% $859 $781 $78 $859 $1,108 $111 $1,219
31 CONSTRUCTION MANAGEMENT $358 $36 10.0% $394 $358 $36 $394 $509 $51 $559
TOTAL PROJECT COSTS $13,271 $1,327 10.0% $14,599 $13,271 $1,327 $14,599 $17,388 $1,739 $19,127

TOTAL PROJECT COST SUMMARIESFY - 20
THIS ESTIMATE IS BASED ON THE GRR STUDY, DATED SEPTEMBER 2005PROJECT: POPLAR ISLAND EXPANSION STUDY PREPARED BY : CENAB-EN-DT OLIVER LEIMBACHLOCATION : POPLAR ISLAND, MARYLAND P.O.C.: JOHN NAUROT, CHIEF, ESTIMATING & SPECIFICATIONS SECTION
CURRENT MCACES ESTIMATE 25 MAY 05 AUTHORIZ./BUDGET YEAR * FULLY FUNDED ESTIMATEACCOUNT EFFECTIVE PRICING LEVEL 1OCT 04 EFFECTIVE PRICING LEVEL: NUMBER ITEM DESCRIPTION COST CNTG CNTG TOTAL COST CNTG TOTAL COST CNTG FULL
($K) ($K) % ($K) ($K) ($K) ($K) ($K) ($K) ($K)
12 NAVIGATION, PORTS & HARBORS $13,439 $1,344 10.0% $14,783 $13,439 $1,344 $14,783 $17,821 $1,782 $19,603
TOTAL CONSTRUCTION COST $13,439 $1,344 10.0% $14,783 $13,439 $1,344 $14,783 $17,821 $1,782 $19,603
30 PLANNING, ENGINEERING AND DESIGN $781 $78 10.0% $859 $781 $78 $859 $1,136 $114 $1,250
31 CONSTRUCTION MANAGEMENT $358 $36 10.0% $394 $358 $36 $394 $522 $52 $574
TOTAL PROJECT COSTS $14,579 $1,458 10.0% $16,036 $14,579 $1,458 $16,036 $19,478 $1,948 $21,426
TOTAL PROJECT COST SUMMARIESFY - 21
THIS ESTIMATE IS BASED ON THE GRR STUDY, DATED SEPTEMBER 2005PROJECT: POPLAR ISLAND EXPANSION STUDY PREPARED BY : CENAB-EN-DT OLIVER LEIMBACHLOCATION : POPLAR ISLAND, MARYLAND P.O.C.: JOHN NAUROT, CHIEF, ESTIMATING & SPECIFICATIONS SECTION
CURRENT MCACES ESTIMATE 25 MAY 05 AUTHORIZ./BUDGET YEAR * FULLY FUNDED ESTIMATEACCOUNT EFFECTIVE PRICING LEVEL 1OCT 04 EFFECTIVE PRICING LEVEL: NUMBER ITEM DESCRIPTION COST CNTG CNTG TOTAL COST CNTG TOTAL COST CNTG FULL
($K) ($K) % ($K) ($K) ($K) ($K) ($K) ($K) ($K)
12 NAVIGATION, PORTS & HARBORS $12,479 $1,248 10.0% $13,727 $12,479 $1,248 $13,727 $16,885 $1,688 $18,573
TOTAL CONSTRUCTION COST $12,479 $1,248 10.0% $13,727 $12,479 $1,248 $13,727 $16,885 $1,688 $18,573
30 PLANNING, ENGINEERING AND DESIGN $781 $78 10.0% $859 $781 $78 $859 $1,167 $117 $1,284
31 CONSTRUCTION MANAGEMENT $358 $36 10.0% $394 $358 $36 $394 $536 $54 $589
TOTAL PROJECT COSTS $13,619 $1,362 10.0% $14,980 $13,619 $1,362 $14,980 $18,588 $1,859 $20,446
TOTAL PROJECT COST SUMMARIESFY - 22
THIS ESTIMATE IS BASED ON THE GRR STUDY, DATED SEPTEMBER 2005PROJECT: POPLAR ISLAND EXPANSION STUDY PREPARED BY : CENAB-EN-DT OLIVER LEIMBACHLOCATION : POPLAR ISLAND, MARYLAND P.O.C.: JOHN NAUROT, CHIEF, ESTIMATING & SPECIFICATIONS SECTION
CURRENT MCACES ESTIMATE 25 MAY 05 AUTHORIZ./BUDGET YEAR * FULLY FUNDED ESTIMATEACCOUNT EFFECTIVE PRICING LEVEL 1OCT 04 EFFECTIVE PRICING LEVEL: NUMBER ITEM DESCRIPTION COST CNTG CNTG TOTAL COST CNTG TOTAL COST CNTG FULL
($K) ($K) % ($K) ($K) ($K) ($K) ($K) ($K) ($K)
12 NAVIGATION, PORTS & HARBORS $11,628 $1,163 10.0% $12,791 $11,628 $1,163 $12,791 $16,047 $1,605 $17,652
TOTAL CONSTRUCTION COST $11,628 $1,163 10.0% $12,791 $11,628 $1,163 $12,791 $16,047 $1,605 $17,652
30 PLANNING, ENGINEERING AND DESIGN $1,251 $125 10.0% $1,376 $1,251 $125 $1,376 $1,920 $192 $2,112
31 CONSTRUCTION MANAGEMENT $478 $48 10.0% $526 $478 $48 $526 $734 $73 $808
TOTAL PROJECT COSTS $13,358 $1,336 10.0% $14,693 $13,358 $1,336 $14,693 $18,702 $1,870 $20,572

TOTAL PROJECT COST SUMMARIESFY - 23
THIS ESTIMATE IS BASED ON THE GRR STUDY, DATED SEPTEMBER 2005PROJECT: POPLAR ISLAND EXPANSION STUDY PREPARED BY : CENAB-EN-DT OLIVER LEIMBACHLOCATION : POPLAR ISLAND, MARYLAND P.O.C.: JOHN NAUROT, CHIEF, ESTIMATING & SPECIFICATIONS SECTION
CURRENT MCACES ESTIMATE 25 MAY 05 AUTHORIZ./BUDGET YEAR * FULLY FUNDED ESTIMATEACCOUNT EFFECTIVE PRICING LEVEL 1OCT 04 EFFECTIVE PRICING LEVEL: NUMBER ITEM DESCRIPTION COST CNTG CNTG TOTAL COST CNTG TOTAL COST CNTG FULL
($K) ($K) % ($K) ($K) ($K) ($K) ($K) ($K) ($K)
12 NAVIGATION, PORTS & HARBORS $6,179 $618 10.0% $6,797 $6,179 $618 $6,797 $8,694 $869 $9,564
TOTAL CONSTRUCTION COST $6,179 $618 10.0% $6,797 $6,179 $618 $6,797 $8,694 $869 $9,564
30 PLANNING, ENGINEERING AND DESIGN $1,251 $125 10.0% $1,376 $1,251 $125 $1,376 $1,972 $197 $2,170
31 CONSTRUCTION MANAGEMENT $478 $48 10.0% $526 $478 $48 $526 $754 $75 $830
TOTAL PROJECT COSTS $7,908 $791 10.0% $8,699 $7,908 $791 $8,699 $11,421 $1,142 $12,563

TOTAL PROJECT COST SUMMARIESFY - 24
THIS ESTIMATE IS BASED ON THE GRR STUDY, DATED SEPTEMBER 2005PROJECT: POPLAR ISLAND EXPANSION STUDY PREPARED BY : CENAB-EN-DT OLIVER LEIMBACHLOCATION : POPLAR ISLAND, MARYLAND P.O.C.: JOHN NAUROT, CHIEF, ESTIMATING & SPECIFICATIONS SECTION
CURRENT MCACES ESTIMATE 25 MAY 05 AUTHORIZ./BUDGET YEAR * FULLY FUNDED ESTIMATEACCOUNT EFFECTIVE PRICING LEVEL 1OCT 04 EFFECTIVE PRICING LEVEL: NUMBER ITEM DESCRIPTION COST CNTG CNTG TOTAL COST CNTG TOTAL COST CNTG FULL
($K) ($K) % ($K) ($K) ($K) ($K) ($K) ($K) ($K)
12 NAVIGATION, PORTS & HARBORS $5,066 $507 10.0% $5,572 $5,066 $507 $5,572 $7,270 $727 $7,996
TOTAL CONSTRUCTION COST $5,066 $507 10.0% $5,572 $5,066 $507 $5,572 $7,270 $727 $7,996
30 PLANNING, ENGINEERING AND DESIGN $1,251 $125 10.0% $1,376 $1,251 $125 $1,376 $2,027 $203 $2,230
31 CONSTRUCTION MANAGEMENT $478 $48 10.0% $526 $478 $48 $526 $776 $78 $853
TOTAL PROJECT COSTS $6,795 $680 10.0% $7,475 $6,795 $680 $7,475 $10,073 $1,007 $11,080

TOTAL PROJECT COST SUMMARIESFY - 25
THIS ESTIMATE IS BASED ON THE GRR STUDY, DATED SEPTEMBER 2005PROJECT: POPLAR ISLAND EXPANSION STUDY PREPARED BY : CENAB-EN-DT OLIVER LEIMBACHLOCATION : POPLAR ISLAND, MARYLAND P.O.C.: JOHN NAUROT, CHIEF, ESTIMATING & SPECIFICATIONS SECTION
CURRENT MCACES ESTIMATE 25 MAY 05 AUTHORIZ./BUDGET YEAR * FULLY FUNDED ESTIMATEACCOUNT EFFECTIVE PRICING LEVEL 1OCT 04 EFFECTIVE PRICING LEVEL: NUMBER ITEM DESCRIPTION COST CNTG CNTG TOTAL COST CNTG TOTAL COST CNTG FULL
($K) ($K) % ($K) ($K) ($K) ($K) ($K) ($K) ($K)
12 NAVIGATION, PORTS & HARBORS $4,495 $449 10.0% $4,944 $4,495 $449 $4,944 $6,670 $667 $7,337
TOTAL CONSTRUCTION COST $4,495 $449 10.0% $4,944 $4,495 $449 $4,944 $6,670 $667 $7,337
30 PLANNING, ENGINEERING AND DESIGN $1,099 $110 10.0% $1,209 $1,099 $110 $1,209 $1,832 $183 $2,015
31 CONSTRUCTION MANAGEMENT $359 $36 10.0% $395 $359 $36 $395 $599 $60 $659
TOTAL PROJECT COSTS $5,953 $595 10.0% $6,548 $5,953 $595 $6,548 $9,101 $910 $10,011

TOTAL PROJECT COST SUMMARIESFY - 26
THIS ESTIMATE IS BASED ON THE GRR STUDY, DATED SEPTEMBER 2005PROJECT: POPLAR ISLAND EXPANSION STUDY PREPARED BY : CENAB-EN-DT OLIVER LEIMBACHLOCATION : POPLAR ISLAND, MARYLAND P.O.C.: JOHN NAUROT, CHIEF, ESTIMATING & SPECIFICATIONS SECTION
CURRENT MCACES ESTIMATE 25 MAY 05 AUTHORIZ./BUDGET YEAR * FULLY FUNDED ESTIMATEACCOUNT EFFECTIVE PRICING LEVEL 1OCT 04 EFFECTIVE PRICING LEVEL: NUMBER ITEM DESCRIPTION COST CNTG CNTG TOTAL COST CNTG TOTAL COST CNTG FULL
($K) ($K) % ($K) ($K) ($K) ($K) ($K) ($K) ($K)
12 NAVIGATION, PORTS & HARBORS $7,209 $721 10.0% $7,929 $7,209 $721 $7,929 $10,770 $1,077 $11,846
TOTAL CONSTRUCTION COST $7,209 $721 10.0% $7,929 $7,209 $721 $7,929 $10,770 $1,077 $11,846
30 PLANNING, ENGINEERING AND DESIGN $1,099 $110 10.0% $1,209 $1,099 $110 $1,209 $1,883 $188 $2,072
31 CONSTRUCTION MANAGEMENT $359 $36 10.0% $395 $359 $36 $395 $616 $62 $677
TOTAL PROJECT COSTS $8,667 $867 10.0% $9,533 $8,667 $867 $9,533 $13,269 $1,327 $14,596

TOTAL PROJECT COST SUMMARIESFY - 27
THIS ESTIMATE IS BASED ON THE GRR STUDY, DATED SEPTEMBER 2005PROJECT: POPLAR ISLAND EXPANSION STUDY PREPARED BY : CENAB-EN-DT OLIVER LEIMBACHLOCATION : POPLAR ISLAND, MARYLAND P.O.C.: JOHN NAUROT, CHIEF, ESTIMATING & SPECIFICATIONS SECTION
CURRENT MCACES ESTIMATE 25 MAY 05 AUTHORIZ./BUDGET YEAR * FULLY FUNDED ESTIMATEACCOUNT EFFECTIVE PRICING LEVEL 1OCT 04 EFFECTIVE PRICING LEVEL: NUMBER ITEM DESCRIPTION COST CNTG CNTG TOTAL COST CNTG TOTAL COST CNTG FULL
($K) ($K) % ($K) ($K) ($K) ($K) ($K) ($K) ($K)
12 NAVIGATION, PORTS & HARBORS $5,884 $588 10.0% $6,473 $5,884 $588 $6,473 $8,968 $897 $9,865
TOTAL CONSTRUCTION COST $5,884 $588 10.0% $6,473 $5,884 $588 $6,473 $8,968 $897 $9,865
30 PLANNING, ENGINEERING AND DESIGN $1,099 $110 10.0% $1,209 $1,099 $110 $1,209 $1,938 $194 $2,132
31 CONSTRUCTION MANAGEMENT $359 $36 10.0% $395 $359 $36 $395 $633 $63 $697
TOTAL PROJECT COSTS $7,343 $734 10.0% $8,077 $7,343 $734 $8,077 $11,539 $1,154 $12,693

TOTAL PROJECT COST SUMMARIESFY - 28
THIS ESTIMATE IS BASED ON THE GRR STUDY, DATED SEPTEMBER 2005PROJECT: POPLAR ISLAND EXPANSION STUDY PREPARED BY : CENAB-EN-DT OLIVER LEIMBACHLOCATION : POPLAR ISLAND, MARYLAND P.O.C.: JOHN NAUROT, CHIEF, ESTIMATING & SPECIFICATIONS SECTION
CURRENT MCACES ESTIMATE 25 MAY 05 AUTHORIZ./BUDGET YEAR * FULLY FUNDED ESTIMATEACCOUNT EFFECTIVE PRICING LEVEL 1OCT 04 EFFECTIVE PRICING LEVEL: NUMBER ITEM DESCRIPTION COST CNTG CNTG TOTAL COST CNTG TOTAL COST CNTG FULL
($K) ($K) % ($K) ($K) ($K) ($K) ($K) ($K) ($K)
12 NAVIGATION, PORTS & HARBORS $1,336 $134 10.0% $1,470 $1,336 $134 $1,470 $2,078 $208 $2,286
TOTAL CONSTRUCTION COST $1,336 $134 10.0% $1,470 $1,336 $134 $1,470 $2,078 $208 $2,286
30 PLANNING, ENGINEERING AND DESIGN $940 $94 10.0% $1,034 $940 $94 $1,034 $1,704 $170 $1,875
31 CONSTRUCTION MANAGEMENT $240 $24 10.0% $264 $240 $24 $264 $435 $44 $479
TOTAL PROJECT COSTS $2,516 $252 10.0% $2,768 $2,516 $252 $2,768 $4,218 $422 $4,639

TOTAL PROJECT COST SUMMARIESFY - 29
THIS ESTIMATE IS BASED ON THE GRR STUDY, DATED SEPTEMBER 2005PROJECT: POPLAR ISLAND EXPANSION STUDY PREPARED BY : CENAB-EN-DT OLIVER LEIMBACHLOCATION : POPLAR ISLAND, MARYLAND P.O.C.: JOHN NAUROT, CHIEF, ESTIMATING & SPECIFICATIONS SECTION
CURRENT MCACES ESTIMATE 25 MAY 05 AUTHORIZ./BUDGET YEAR * FULLY FUNDED ESTIMATEACCOUNT EFFECTIVE PRICING LEVEL 1OCT 04 EFFECTIVE PRICING LEVEL: NUMBER ITEM DESCRIPTION COST CNTG CNTG TOTAL COST CNTG TOTAL COST CNTG FULL
($K) ($K) % ($K) ($K) ($K) ($K) ($K) ($K) ($K)
12 NAVIGATION, PORTS & HARBORS $1,770 $177 10.0% $1,947 $1,770 $177 $1,947 $2,807 $281 $3,088
TOTAL CONSTRUCTION COST $1,770 $177 10.0% $1,947 $1,770 $177 $1,947 $2,807 $281 $3,088
30 PLANNING, ENGINEERING AND DESIGN $940 $94 10.0% $1,034 $940 $94 $1,034 $1,752 $175 $1,927
31 CONSTRUCTION MANAGEMENT $240 $24 10.0% $264 $240 $24 $264 $447 $45 $492
TOTAL PROJECT COSTS $2,950 $295 10.0% $3,245 $2,950 $295 $3,245 $5,006 $501 $5,507

TOTAL PROJECT COST SUMMARIESFY - 30
THIS ESTIMATE IS BASED ON THE GRR STUDY, DATED SEPTEMBER 2005PROJECT: POPLAR ISLAND EXPANSION STUDY PREPARED BY : CENAB-EN-DT OLIVER LEIMBACHLOCATION : POPLAR ISLAND, MARYLAND P.O.C.: JOHN NAUROT, CHIEF, ESTIMATING & SPECIFICATIONS SECTION
CURRENT MCACES ESTIMATE 25 MAY 05 AUTHORIZ./BUDGET YEAR * FULLY FUNDED ESTIMATEACCOUNT EFFECTIVE PRICING LEVEL 1OCT 04 EFFECTIVE PRICING LEVEL: NUMBER ITEM DESCRIPTION COST CNTG CNTG TOTAL COST CNTG TOTAL COST CNTG FULL
($K) ($K) % ($K) ($K) ($K) ($K) ($K) ($K) ($K)
12 NAVIGATION, PORTS & HARBORS $8,325 $832 10.0% $9,157 $8,325 $832 $9,157 $13,470 $1,347 $14,817
TOTAL CONSTRUCTION COST $8,325 $832 10.0% $9,157 $8,325 $832 $9,157 $13,470 $1,347 $14,817
30 PLANNING, ENGINEERING AND DESIGN $940 $94 10.0% $1,034 $940 $94 $1,034 $1,802 $180 $1,982
31 CONSTRUCTION MANAGEMENT $240 $24 10.0% $264 $240 $24 $264 $460 $46 $506
TOTAL PROJECT COSTS $9,505 $950 10.0% $10,455 $9,505 $950 $10,455 $15,732 $1,573 $17,305

TOTAL PROJECT COST SUMMARIESFY - 31
THIS ESTIMATE IS BASED ON THE GRR STUDY, DATED SEPTEMBER 2005PROJECT: POPLAR ISLAND EXPANSION STUDY PREPARED BY : CENAB-EN-DT OLIVER LEIMBACHLOCATION : POPLAR ISLAND, MARYLAND P.O.C.: JOHN NAUROT, CHIEF, ESTIMATING & SPECIFICATIONS SECTION
CURRENT MCACES ESTIMATE 25 MAY 05 AUTHORIZ./BUDGET YEAR * FULLY FUNDED ESTIMATEACCOUNT EFFECTIVE PRICING LEVEL 1OCT 04 EFFECTIVE PRICING LEVEL: NUMBER ITEM DESCRIPTION COST CNTG CNTG TOTAL COST CNTG TOTAL COST CNTG FULL
($K) ($K) % ($K) ($K) ($K) ($K) ($K) ($K) ($K)
12 NAVIGATION, PORTS & HARBORS $9,753 $975 10.0% $10,728 $9,753 $975 $10,728 $16,102 $1,610 $17,712
TOTAL CONSTRUCTION COST $9,753 $975 10.0% $10,728 $9,753 $975 $10,728 $16,102 $1,610 $17,712
30 PLANNING, ENGINEERING AND DESIGN $940 $94 10.0% $1,034 $940 $94 $1,034 $1,854 $185 $2,039
31 CONSTRUCTION MANAGEMENT $240 $24 10.0% $264 $240 $24 $264 $473 $47 $521
TOTAL PROJECT COSTS $10,933 $1,093 10.0% $12,026 $10,933 $1,093 $12,026 $18,429 $1,843 $20,272

TOTAL PROJECT COST SUMMARIESBuilding
THIS ESTIMATE IS BASED ON THE GRR STUDY, DATED SEPTEMBER 2005PROJECT: POPLAR ISLAND EXPANSION STUDY PREPARED BY : CENAB-EN-DT OLIVER LEIMBACHLOCATION : POPLAR ISLAND, MARYLAND P.O.C.: JOHN NAUROT, CHIEF, ESTIMATING & SPECIFICATIONS SECTION
CURRENT MCACES ESTIMATE 25 MAY 05 AUTHORIZ./BUDGET YEAR * FULLY FUNDED ESTIMATEACCOUNT EFFECTIVE PRICING LEVEL 1OCT 04 EFFECTIVE PRICING LEVEL: NUMBER ITEM DESCRIPTION COST CNTG CNTG TOTAL COST CNTG TOTAL COST CNTG FULL
($K) ($K) % ($K) ($K) ($K) ($K) ($K) ($K) ($K)
12 NAVIGATION, PORTS & HARBORS $3,358 $336 10.0% $3,694 $3,358 $336 $3,694 $3,358 $336 $3,694
TOTAL CONSTRUCTION COST $3,358 $336 10.0% $3,694 $3,358 $336 $3,694 $3,358 $336 $3,694
30 PLANNING, ENGINEERING AND DESIGN $0 $0 #DIV/0! $0 $0 $0 $0 $0 $0 $0
31 CONSTRUCTION MANAGEMENT $0 $0 #DIV/0! $0 $0 $0 $0 $0 $0 $0
TOTAL PROJECT COSTS $3,358 $336 10.0% $3,694 $3,358 $336 $3,694 $3,358 $336 $3,694