operating and maintenance cost estimate technical report
TRANSCRIPT

Operating and Maintenance
Cost Estimate Technical Report
September 2008

Operating and Maintenance Cost Estimate Technical Report ● Page i
Table of Contents Page
1. Introduction to Purple Line Study.................................................................................... 1-1 1.1. Background and Project Location ................................................................................. 1-1
1.1.1. Corridor Setting..................................................................................................... 1-2 1.2. Alternatives Retained for Detailed Study...................................................................... 1-2
1.2.1. Alternative 1: No Build Alternative...................................................................... 1-4 1.2.2. Alternative 2: TSM Alternative ............................................................................ 1-4 1.2.3. Build Alternatives ................................................................................................. 1-4 1.2.4. Design Options.................................................................................................... 1-10 1.2.5. Stations and Station Facilities ............................................................................. 1-11 1.2.6. Maintenance and Storage Facilities .................................................................... 1-13 1.2.7. Traction Power Substations ................................................................................ 1-14
2. General Approach to Cost Estimating.............................................................................. 2-1
3. Cost Estimating Methodology ........................................................................................... 3-1 3.1. Operating and Maintenance Cost Model Development ................................................ 3-1
3.1.1. MTA Bus Model Summary................................................................................... 3-2 3.1.2. MTA Light Rail Model Summary ........................................................................ 3-3 3.1.3. WMATA Bus Cost Model Summary.................................................................... 3-3 3.1.4. Other Local Bus/Other Express Bus Cost Model Summary................................. 3-4 3.1.5. Validation.............................................................................................................. 3-4
3.2. BRT Guideway and Station Costs............................................................................... 3-11
4. Cost Estimates for Purple Line Alternatives.................................................................... 4-1 4.1. Operations for the TSM and the Build Alternatives...................................................... 4-1
4.1.1. TSM Alternative ................................................................................................... 4-1 4.1.2. Build Alternatives Operations............................................................................... 4-2
4.2. No Build/TSM Cost....................................................................................................... 4-7 4.3. Bus Rapid Transit Costs ................................................................................................ 4-8 4.4. Light Rail Costs............................................................................................................. 4-9
5. Sensitivity Testing of Operating and Maintenance Costs ............................................... 5-1
6. References............................................................................................................................ 6-1

Page ii ● Operating and Maintenance Cost Estimate Technical Report
List of Tables Table 1-1: Stations by Alternative........................................................................................ 1-12 Table 3-1: Inflation Rates Compared to September 2007 ...................................................... 3-2 Table 3-2: MTA Bus O&M Cost Model ................................................................................ 3-5 Table 3-3: MTA Light Rail O&M Cost Model ...................................................................... 3-6 Table 3-4: WMATA Bus O&M Cost Model.......................................................................... 3-7 Table 3-5: Montgomery County Bus O&M Cost Model........................................................ 3-8 Table 3-6: MTA Bus Validation............................................................................................. 3-9 Table 3-7: MTA Light Rail Validation................................................................................... 3-9 Table 3-8: WMATA Bus Validation ...................................................................................... 3-9 Table 3-9: Montgomery County Bus Validation.................................................................... 3-9 Table 3-10: Cost and Operating Information for Cities with More Than Ten Miles of
Exclusive Bus Guideway (2005)......................................................................... 3-12 Table 4-1: TSM Bus Headways (minutes) ............................................................................. 4-1 Table 4-2: Span of Service ..................................................................................................... 4-2 Table 4-3: Build Alternatives Headways (minutes) ............................................................... 4-3 Table 4-4: End-to-End Travel Times...................................................................................... 4-3 Table 4-5: Annual O&M Costs by Alternative ...................................................................... 4-4 Table 4-6: Annual Operating Statistics by Alternative and Mode ......................................... 4-5 Table 4-7: Annual O&M Costs by Alternative: Bus Rapid Transit ...................................... 4-8 Table 4-8: Annual O&M Costs by Alternative: Light Rail ................................................... 4-9 Table 5-1: Increases in Fuel, Lubrication, and Labor Fringe Benefit Costs, 2000 to
2006, Compared to Service Volume Increase in Terms of Revenue Vehicle Hours and Miles of Service................................................................................... 5-1
Table 5-2: Fuels, Fluids, and Fringe Benefits Cost and Percentage of Total Costs 2003-2005 Average............................................................................................... 5-2
List of Figures Figure 1-1: Project Area........................................................................................................... 1-2 Figure 1-2: Alternative Alignments ......................................................................................... 1-3 Figure 2-1: Steps in O&M Estimation Process........................................................................ 2-1 Figure 4-1: Incremental Annual O&M Costs above No Build
Cost for TSM and Build Alternatives ................................................................... 4-4 Figure 4-2: Annual O&M Costs by Alternative: Bus Rapid Transit ...................................... 4-8 Figure 4-3: Annual O&M Costs by Alternative: Light Rail ................................................... 4-9

Operating and Maintenance Cost Estimate Technical Report ● Page 1-1
1. Introduction to Purple Line Study The Maryland Transit Administration (MTA) is preparing an Alternatives Analysis and Draft Environmental Impact Statement (AA/DEIS) to study a range of alternatives for addressing mobility and accessibility issues in the corridor between Bethesda and New Carrollton, Maryland. The corridor is located in Montgomery and Prince George’s Counties, just north of the Washington, D.C. boundary. The Purple Line would provide a rapid transit connection along the 16-mile corridor that lies between the Metrorail Red Line (Bethesda and Silver Spring Stations), Green Line (College Park Station), and Orange Line (New Carrollton Station). This Operating and Maintenance Cost Estimate Technical Report documents the development of the operating and maintenance (O&M) cost models used for the analysis of transit alternatives for the Purple Line. This report includes bus and light rail cost estimates, including documentation of data sources and development of the model. The resulting O&M cost estimates were validated by comparing them to actual expenditures using recent MTA bus and light rail operation statistics.
This Technical Report presents the methodology and data used in the analyses documented in the Purple Line Alternatives Analysis/Draft Environmental Impact Statement. The results presented in this report may be updated as the AA/DEIS is finalized and in subsequent study activities.
1.1. Background and Project Location
Changing land uses in the Washington, D.C. area have resulted in more suburb-to-suburb travel, while the existing transit system is oriented toward radial travel in and out of downtown Washington, D.C. The only transit service available for east-west travel is bus service, which is slow and unreliable. A need exists for efficient, rapid, and high capacity transit for east-west travel. The Purple Line would serve transit patrons whose journey is solely east-west in the corridor, as well as those who want to access the existing north-south rapid transit services, particularly Metrorail and MARC commuter rail service.
The corridor has a sizeable population that already uses transit and contains some of the busiest transit routes and transfer areas in the Washington, D.C. metropolitan area. Many communities in the corridor have a high percentage of households without a vehicle, and most transit in these communities is bus service. Projections of substantial growth in population and employment in the corridor indicate a growing need for transit improvements. The increasingly congested roadway system does not have adequate capacity to accommodate the existing average daily travel demand, and congestion on these roadways is projected to worsen as traffic continues to grow through 2030.
A need exists for high quality transit service to key activity centers and to improve transit travel time in the corridor. Although north-south rapid transit serves parts of the corridor, transit users who are not within walking distance of these services must drive or use slow and unreliable buses to access them. Faster and more reliable connections along the east-west Purple Line Corridor to the existing radial rail lines (Metrorail and MARC trains) would improve mobility

Page 1-2 ● Operating and Maintenance Cost Estimate Technical Report
and accessibility. This enhanced system connectivity would also help to improve transit efficiencies. In addition, poor air quality in the region needs to be addressed, and changes to the existing transportation infrastructure would help in attaining federal air quality standards.
1.1.1. Corridor Setting The Purple Line Corridor, as shown in Figure 1-1, is north and northeast of Washington, D.C., with a majority of the alignment within one to three miles of the circumferential I-95/I-495 Capital Beltway.
Figure 1-1: Project Area
1.2. Alternatives Retained for Detailed Study
The Purple Line study has identified eight alternatives for detailed study, shown on Figure 1-2. The alternatives include the No Build Alternative, the Transportation System Management (TSM) Alternative, and six Build Alternatives. The Build Alternatives include three using bus rapid transit (BRT) technology and three using light rail transit (LRT) technology.

Operating and Maintenance Cost Estimate Technical Report ● Page 1-3
Figure 1-2: Alternative Alignments

Page 1-4 ● Operating and Maintenance Cost Estimate Technical Report
All alternatives extend the full length of the corridor between the Bethesda Metro Station in the west and the New Carrollton Metro Station in the east, with variations in alignment, type of running way (shared, dedicated, or exclusive), and amount of grade-separation options (e.g. tunnel segments or aerial). For purposes of evaluation, complete alignments need to be considered. These alternatives were used to examine the general benefits, costs, and impacts for serving major market areas within the corridor.
1.2.1. Alternative 1: No Build Alternative The No Build Alternative is used as the baseline against which the other alternatives are compared for purposes of environmental and community impacts. The No Build Alternative consists of the transit service levels, highway networks, traffic volumes, and forecasted demographics for horizon year 2030 that are assumed in the local Constrained Long Range Plan of the local metropolitan planning organization (in this case, the Metropolitan Washington Council of Governments).
1.2.2. Alternative 2: TSM Alternative The TSM Alternative provides an appropriate baseline against which all major investment alternatives are evaluated for the Federal Transit Administration’s New Starts funding program. The New Starts rating and evaluation process begins when the project applies to enter preliminary engineering and continues through final design.
The TSM Alternative represents the best that can be done for mobility in the corridor without constructing a new transitway. Generally, the TSM Alternative emphasizes upgrades in transit service through operational and minor physical improvements, plus selected highway upgrades through intersection improvements, minor widening, and other focused traffic engineering actions. A TSM Alternative normally includes such features as bus route restructuring, shortened bus headways, expanded use of articulated buses, reserved bus lanes, express and limited-stop service, signalization improvements, and timed-transfer operations.
1.2.3. Build Alternatives The six Build Alternatives generally use the same alignments; only a few segments have locations where different roadways would be used. The differences between the alternatives are more often the incorporation of design features, such as grade separation to avoid congested roadways or intersections.
Alternative 3: Low Investment BRT The Low Investment BRT Alternative would primarily use existing streets to avoid the cost of grade separation and extensive reconstruction of existing streets. It would incorporate signal, signage, and lane improvements in certain places. This alternative would operate mostly in mixed lanes with at-grade crossings of all intersections and queue jump lanes at some intersections. Southbound along Kenilworth Avenue and westbound along Annapolis Road, Low Investment BRT would operate in dedicated lanes. This is the only alternative that would operate on Jones Bridge Road, directly serving the National Institutes of Health and the National Naval Medical Center near Wisconsin Avenue and Jones Bridge Road. It is also the only

Operating and Maintenance Cost Estimate Technical Report ● Page 1-5
alternative that would use the bus portion of the new Silver Spring Transit Center (SSTC). A detailed description of the alternative follows.
From the western terminus in Bethesda, Low Investment BRT would originate at the Bethesda Metro Station bus terminal. The alignment would operate on Woodmont Avenue within the existing curb. At the Bethesda Station, the buses would enter the station via Edgemoor Road and exit onto Old Georgetown Road.
At Wisconsin Avenue, just south of Jones Bridge Road, the transitway would remain on the west side of the road in exclusive lanes. Low Investment BRT would turn onto Jones Bridge Road where the transit would operate in shared lanes with queue jump lanes westbound at the intersection with Wisconsin Avenue and westbound for the intersection at Connecticut Avenue. Some widening would be required at North Chevy Chase Elementary School.
The alignment would continue along Jones Bridge Road to Jones Mill Road where it would turn right (south) onto Jones Mill Road. Eastbound on Jones Bridge Road would be a queue jump lane at the intersection. From Jones Mill Road, the alignment would turn east onto the Georgetown Branch right-of-way, where a new exclusive roadway would be constructed, with an adjacent trail on the south side.
Low Investment BRT would continue on the Georgetown Branch right-of-way, crossing Rock Creek Park on a new bridge, replacing the existing pedestrian bridge. The trail would also be accommodated on the bridge or on an adjacent bridge. A trail connection to the Rock Creek Trail would be provided east of the bridge. The alignment would continue on the Georgetown Branch right-of-way until the CSX corridor at approximately Kansas Avenue.
At this point, the alignment would turn southeast to run parallel and immediately adjacent to the CSX tracks on a new exclusive right-of-way. The trail would parallel the transitway, crossing the transitway and the CSX right-of-way east of Talbot Avenue on a new structure and continuing on the north side of the CSX right-of-way. The transitway would continue on a new roadway between the CSX tracks and Rosemary Hills Elementary School and continue past the school. The transitway would cross 16th Street at -grade, where a station would be located. The transitway would continue parallel to the CSX tracks to Spring Street where it would connect to Spring Street and turn to cross over the CSX tracks on Spring Street. The alignment would continue on Spring Street to 2nd Avenue where it would turn east. Buses would operate in shared lanes on Spring Street and Second Avenue.
Low Investment BRT would cross Colesville Road at-grade and continue up Wayne Avenue to Ramsey Street, where the buses would turn right to enter the SSTC at the second level.
The buses would leave the SSTC and return to Wayne Avenue via Ramsey Street. Low Investment BRT would continue east on Wayne Avenue in shared lanes. After crossing Sligo Creek Parkway, the alignment would operate in shared lanes.

Page 1-6 ● Operating and Maintenance Cost Estimate Technical Report
At Flower Avenue, the alignment would turn left (south) onto Arliss Street, operating in shared lanes to Piney Branch Road. At Piney Branch Road, the alignment would turn left to continue in shared lanes to University Boulevard.
Low Investment BRT would follow University Boulevard to Adelphi Road. The lanes on University Boulevard would be shared. At Adelphi Road, the alignment would enter the University of Maryland campus on Campus Drive. The alignment would follow the Union Drive extension, as shown in the University of Maryland Facilities Master Plan (2001-2020), through what are currently parking lots. The alignment would follow Union Drive and then Campus Drive through campus in mixed traffic and the main gate to US 1.
Low Investment BRT would operate on Paint Branch Parkway to the College Park Metro Station in shared lanes. The alignment would then follow River Road to Kenilworth Avenue in shared lanes. Along Kenilworth Avenue, the southbound alignment would be a dedicated lane, but northbound would be in mixed traffic.
The alignment turns east from Kenilworth Avenue on East West Highway (MD 410) and continues in shared lanes on Veterans Parkway. This alignment turns left on Annapolis Road and then right on Harkins Road to the New Carrollton Metro Station. The westbound alignment on Annapolis would be dedicated, but the eastbound lanes would be shared.
Alternative 4: Medium Investment BRT Alternative 4, the Medium Investment BRT Alternative, is, by definition, an alternative that uses the various options that provide maximum benefit relative to cost. Most of the segments are selected from either the Low or High Investment BRT Alternatives.
This alternative follows a one-way counter-clockwise loop from the Georgetown Branch right-of-way onto Pearl Street, East West Highway, Old Georgetown Road, Edgemoor Lane, and Woodmont Avenue and from there onto the Georgetown Branch right-of-way under the Air Rights Building. The buses stop at both the existing Bethesda Metro Station on Edgemoor Lane and at the new southern entrance to the Metro station under the Air Rights Building.
The alignment continues on the Georgetown Branch right-of-way with an aerial crossing over Connecticut Avenue and a crossing under Jones Mill Road.
This alignment, and all others that use the Georgetown Branch right-of-way, includes construction of a hiker-biker trail between Bethesda and the SSTC.
The alignment would continue on the Georgetown Branch right-of-way until the CSX right-of-way. The alignment would cross Rock Creek Park on a new bridge, replacing the existing pedestrian bridge. The trail would also be accommodated on the bridge or on an adjacent bridge. The alignment would continue on the Georgetown Branch right-of-way until the CSX corridor at approximately Kansas Avenue. This segment of the alignment, from Jones Mill Road to the CSX corridor, would be the same for all the alternatives.

Operating and Maintenance Cost Estimate Technical Report ● Page 1-7
As with Low Investment BRT, this alternative would follow the CSX corridor on the south side of the right-of-way, but it would cross 16th Street and Spring Street below the grade of the streets, at approximately the same grade as the CSX tracks. The station at 16th Street would have elevators and escalators to provide access from 16th Street.
After passing under the Spring Street Bridge, Medium Investment BRT would rise above the level of the existing development south of the CSX right-of-way. East of the Falklands Chase apartments, Medium Investment BRT would cross over the CSX tracks on an aerial structure to enter the SSTC parallel to, but at a higher level than, the existing tracks.
After the SSTC, Medium Investment BRT would leave the CSX right-of-way and follow Bonifant Street at-grade, crossing Georgia Avenue, and just prior to Fenton Street turn north toward Wayne Avenue. The alignment would continue on Wayne Avenue in shared lanes with added left turn lanes to Flower Avenue and then Arliss Street. At Piney Branch Road, the alternative would turn left into dedicated lanes to University Boulevard.
Medium Investment BRT would be in dedicated lanes on University Boulevard with an at-grade crossing of the intersections. The alignment would continue through the University of Maryland campus in dedicated lanes on Campus Drive and then continue at grade in a new exclusive transitway through the parking lots adjacent to the Armory and turns on to Rossborough Lane south of the Visitor’s Center.
Crossing US 1 at grade, Medium Investment BRT would pass through the East Campus development on Rossborough Lane to Paint Branch Parkway. The alignment would continue on Paint Branch Parkway and River Road in shared lanes, as with Low Investment BRT. At Kenilworth Avenue, both lanes would be dedicated.
Turning left on East West Highway, Medium Investment BRT would be in dedicated lanes. As with Low Investment BRT, this alternative would travel in shared lanes on Veterans Parkway.
Medium Investment BRT would continue on Veterans Parkway to Ellin Road, where it would turn left into dedicated lanes to the New Carrollton Metro Station.
Alternative 5: High Investment BRT via Master Plan Alignment The High Investment BRT Alternative is intended to provide the most rapid travel time for a BRT alternative. It would make maximum use of vertical grade separation and horizontal traffic separation. Tunnels and aerial structures are proposed at key locations to improve travel time and reduce delay. When operating within or adjacent to existing roads, this alternative would operate primarily in dedicated lanes. Like Medium Investment BRT, this alternative would serve the Bethesda Station both at the existing Bethesda bus terminal at the Metro station and at the new south entrance to the Metro station beneath the Apex Building.
High Investment BRT would follow a one-way loop in Bethesda from the Master Plan alignment onto Pearl Street, then travel west on East West Highway and Old Georgetown Road into the Bethesda Metro Station bus terminal, exit onto Woodmont Avenue southbound, and then

Page 1-8 ● Operating and Maintenance Cost Estimate Technical Report
continue left under the Air Rights Building to rejoin the Georgetown Branch right-of-way. Elevators would provide a direct connection to the south end of the Bethesda Metro Station in the tunnel under the Air Rights Building.
High Investment BRT would be the same as Medium Investment BRT until it reaches the CSX corridor. As with the Low and Medium Investment BRT Alternatives, this alternative would follow the CSX corridor on the south side of the right-of-way, but it would cross 16th Street and Spring Street below the grade of the streets, at approximately the same grade as the CSX tracks. The station at 16th Street would have elevators and escalators to provide access from 16th Street.
The crossing of the CSX right-of-way would be the same as for Medium Investment BRT. From the SSTC, High Investment BRT would continue along the CSX tracks until Silver Spring Avenue, where the alignment would turn east entering a tunnel, passing under Georgia Avenue, and turning north to Wayne Avenue. The alignment would return to the surface on Wayne Avenue near Cedar Street. It would continue on Wayne Avenue in dedicated lanes, crossing Sligo Creek Parkway, and entering a tunnel approximately half-way between Sligo Creek and Flower Avenue, then turning east to pass under Plymouth Street, crossing under Flower Avenue, and emerging from the tunnel on Arliss Street.
High Investment BRT would be the same on Piney Branch Road and University Boulevard except that the alignment would have grade-separated crossings over New Hampshire Avenue and Riggs Road.
Approaching University of Maryland, the alignment would cross under Adelphi Road. After Adelphi Road, the alignment would follow Campus Drive and turn onto the proposed Union Drive extended. The alignment would enter a tunnel while on Union Drive, prior to Cole Field House, and pass through the campus under Campus Drive. After emerging from the tunnel east of Regents Drive, the alignment would be the same as Medium Investment BRT, until Paint Branch Parkway.
The alignment would continue east on Paint Branch Parkway in shared lanes to the College Park Metro Station. The alternative would then follow River Road in dedicated lanes.
From River Road near Haig Drive, the alignment would turn right and enter a tunnel heading south, roughly parallel to Kenilworth Avenue. Near East West Highway (MD 410), the alignment would turn left and continue in the tunnel under Anacostia River Park. The alignment would transition to a surface alignment west of the Kenilworth Avenue/East West Highway intersection. The alternative would follow East West Highway in dedicated lanes.
High Investment BRT would turn right down Veterans Parkway in dedicated lanes. Unlike Medium Investment BRT, this alignment would cross under Annapolis Road before continuing on to Ellin Road.

Operating and Maintenance Cost Estimate Technical Report ● Page 1-9
Alternative 6: Low Investment LRT The Low Investment LRT Alternative would operate in shared and dedicated lanes with minimal use of vertical grade separation and horizontal traffic separation. All LRT Alternatives would serve only the south entrance of the Bethesda Station and would operate there in a stub-end platform arrangement.
Low Investment LRT would begin on the Georgetown Branch right-of-way near the Bethesda Metro Station under the Air Rights Building. The hiker-biker trail connection to the Capital Crescent Trail would not be through the tunnel under the Air Rights Building, but rather through Elm Street Park on existing streets. The terminal station would be the Bethesda Metro Station with a connection to the southern end of the existing station platform.
After emerging from under the Air Rights Building, the transitway would follow the Georgetown Branch right-of-way, crossing Connecticut Avenue at-grade and crossing under Jones Mill Road. Between approximately Pearl Street and just west of Jones Mill Road, the trail would be on the north side of the transitway; elsewhere it would be on the south side.
The segment from Jones Mill Road to Spring Street in the CSX corridor would be the same as for Low and Medium Investment BRT.
After crossing Spring Street, Low Investment LRT would be the same as the Medium and High Investment BRT Alternatives.
Low Investment LRT would be the same as Medium Investment BRT from the SSTC to Bonifant Street to Wayne Avenue.
Turning right, Low Investment LRT would continue at-grade on Wayne Avenue in shared lanes, crossing Sligo Creek Parkway and entering a tunnel from Wayne Avenue to pass under Plymouth Street. As with High Investment BRT, the alignment emerges from the tunnel on Arliss Street.
The Low Investment LRT Alternative would then follow Piney Branch Road and University Boulevard at-grade in dedicated lanes. In keeping with the low investment definition of this alternative, the major intersections of New Hampshire Avenue and Riggs Road would not be grade-separated.
As this alternative approaches Adelphi Road, the grade of the existing roadway is too steep for the type of LRT vehicles being considered. For this reason, the transitway would cross the intersection below grade.
At Adelphi Road, the alignment would enter the University of Maryland campus on Campus Drive. The alignment would follow the same alignment to the College Park Metro Station as described for Medium Investment BRT.

Page 1-10 ● Operating and Maintenance Cost Estimate Technical Report
From the College Park Metro Station to the terminus at the New Carrollton Metro Station, Low Investment LRT would be in dedicated lanes on River Road. On Kenilworth Avenue, the LRT would be in a dedicated lane southbound, but a shared lane northbound. On East West Highway, the LRT would be in dedicated lanes with shared left turn lanes and in shared lanes under Baltimore-Washington Parkway. On Veterans Parkway, the LRT is in dedicated lanes.
As with Low Investment BRT, this alignment turns left on Annapolis Road from Veterans Parkway and then right on Harkins Road to the New Carrollton Metro Station. The segments on Annapolis Road and Harkins Lane would be dedicated.
Alternative 7: Medium Investment LRT Medium Investment LRT is the same as Low Investment LRT from Bethesda to the CSX corridor, except that the alignment would cross over Connecticut Avenue.
Along the CSX corridor, the alignment would be the same as High Investment BRT, grade-separated (below) at 16th and Spring Streets. The alignment would be the same as Medium and High Investment BRT and Low Investment LRT from Spring Street through the SSTC.
From the SSTC, the alignment would follow Bonifant Street in dedicated lanes to Wayne Avenue. On Wayne Avenue, this alterative would be in shared lanes with added left turn lanes. The alignment would be the same as Low Investment LRT until Annapolis Road. The LRT would follow River Road, Kenilworth Avenue, East West Highway, and Veterans Parkway in dedicated lanes. At the intersection of Veterans Parkway and Annapolis Road the LRT continues across Annapolis, turning left at Ellin Road still in dedicated lanes.
Alternative 8: High Investment LRT Alternative 8, High Investment LRT, would be the same as the High Investment BRT Alternative, except for the Bethesda terminus. The alignment would begin just west of the tunnel under the Air Rights Building. The hiker-biker trail would follow the alignment through the tunnel under the Air Rights Building. Because of physical constraints, the trail would be elevated above the westbound tracks. The trail would return to grade as it approaches Woodmont Avenue. The terminal station would be the Bethesda Metro Station with a connection to the southern end of the existing station platform.
1.2.4. Design Options North Side of CSX
This design option is based on the Georgetown Branch Master Plan. From the eastern end of the Georgetown Branch right-of-way, the alignment would cross under the CSX corridor and then continue down the north side. It would emerge from the tunnel near Lyttonsville Road in Woodside. The alignment would be below the grade of 16th Street, passing under the bridge, but providing a station at that location. It would also pass under the Spring Street Bridge but would begin to rise on an aerial structure over the CSX right-of-way 1,000 feet northwest of Colesville Road due to the location of the Metro Plaza Building. The aerial structure over the CSX right-

Operating and Maintenance Cost Estimate Technical Report ● Page 1-11
of-way would provide the required 23-foot clearance from top of rail to bottom of structure. The alternative would enter the SSTC parallel to, but at a higher level than, the existing tracks.
South Side of CSX with a Crossing West of the Falklands Chase Apartments This option would operate on the south side of the CSX, as described either at or below grade at 16th Street. The alignment would cross the CSX corridor between Spring Street and Fenwick Lane. This option would continue along the north side of the CSX right-of-way on an aerial structure over the CSX right-of-way 1,000 feet northwest of Colesville Road, due to the location of the Metro Plaza Building. The aerial structure over the CSX right-of-way would provide the required 23-foot clearance from top of rail to bottom of structure. The alternative would enter the SSTC parallel to, but at a higher level than, the existing tracks.
Silver Spring/Thayer Tunnel This design option would begin at the SSTC where the alignment leaves the CSX corridor near Silver Spring Avenue. It would enter a tunnel on Silver Spring Avenue passing under Georgia Avenue and Fenton Street. At approximately Grove Street, the alignment would shift northward to continue under the storm drain easement and backyards of homes on Thayer and Silver Spring Avenues. The transitway would emerge from the tunnel behind the East Silver Spring Elementary School on Thayer Avenue and follow Thayer Avenue across Dale Drive to Piney Branch Road. If the mode selected were LRT, the grade of Piney Branch Road would require an aerial structure from west of Sligo Creek and Sligo Creek Parkway and would return to grade just west of Flower Avenue. This aerial structure requires that the road be widened. For this design option, a station would be located on Thayer Avenue where the alignment would emerge from the tunnel.
Preinkert/Chapel Drive The Preinkert/Chapel Drive design option is being evaluated for both BRT and LRT through the campus of University of Maryland. The alignment would run from the west on Campus Drive turning right onto Preinkert Drive where it would head southeast. The transitway would turn left to pass directly between LeFrak Hall and the South Dining Campus Hall and then northeast through the Lot Y parking lot. From there, the alignment would run east along Chapel Drive between Memorial Chapel and Marie Mount Hall and eventually would pass to the south of Lee Building at Chapel Fields. The alignment would continue onto Rossborough Lane, passing directly north of Rossborough Inn to cross US 1, and continues east through the East Campus development.
1.2.5. Stations and Station Facilities Between 20 and 21 stations are being considered for each of the alternatives. Table 1-1 provides the stations for each of the Build Alternatives.

Page 1-12 ● Operating and Maintenance Cost Estimate Technical Report
Table 1-1: Stations by Alternative
Segment Name Low
Invest. BRT
Medium Invest. BRT
High Invest. BRT
Low Invest. LRT
Medium Invest. LRT
High Invest. LRT
Bethesda Metro, North Entrance Yes Yes Yes N/A N/A N/A Medical Center Metro Yes N/A N/A N/A N/A N/A Bethesda Metro, South Entrance N/A Yes Yes Yes Yes Yes Connecticut Avenue Yes Yes Yes Yes Yes Yes Lyttonsville Yes Yes Yes Yes Yes Yes Woodside/16th Street Yes Yes Yes Yes Yes Yes Silver Spring Transit Center Yes Yes Yes Yes Yes Yes Fenton Street Yes Yes N/A Yes Yes N/A Dale Drive Yes Yes Yes Yes Yes Yes Manchester Road Yes Yes Yes Yes Yes Yes Arliss Street Yes Yes Yes Yes Yes Yes Gilbert Street Yes Yes Yes Yes Yes Yes Takoma/Langley Transit Center Yes Yes Yes Yes Yes Yes Riggs Road Yes Yes Yes Yes Yes Yes Adelphi Road Yes Yes Yes Yes Yes Yes University of Maryland Campus Center Yes Yes Yes Yes Yes Yes US 1 Yes N/A N/A N/A N/A N/A East Campus N/A Yes Yes Yes Yes Yes College Park Metro Yes Yes Yes Yes Yes Yes River Road Yes Yes Yes Yes Yes Yes Riverdale Park Yes Yes Yes Yes Yes Yes Riverdale Heights Yes Yes Yes Yes Yes Yes Annapolis Road Yes Yes Yes Yes Yes Yes New Carrollton Metro Yes Yes Yes Yes Yes Yes
The design of the Purple Line stations has not been determined at this stage of the project; however, the stations would likely include the following elements: shelters, ticket vending machines, seating, and electronic schedule information. The stations would be located along the transitway and would be on local sidewalks or in the median of the streets, depending on the location of the transitway. Because both the BRT and LRT vehicles under consideration are “low floor,” the platforms would be about 14 inches above the height of the roadway. The platforms would be approximately 200 feet long and between 10 and 15 feet wide, depending on the anticipated level of ridership at each particular station. No new parking facilities would be constructed as part of the Purple Line. Municipal parking garages exist near the Bethesda and Silver Spring Metro Stations, and transit parking facilities exist at the College Park and New Carrollton Metro Stations.
Additional kiss-and-ride facilities would be considered at the stations at Connecticut Avenue on the Georgetown Branch right-of-way and Lyttonsville. The SSTC, College Park Metro Station, and New Carrollton Metro Station already have kiss-and-ride parking facilities available and the

Operating and Maintenance Cost Estimate Technical Report ● Page 1-13
Purple Line would not add more. It has been determined that kiss-and-ride facilities are not needed at the Takoma/Langley Transit Center.
1.2.6. Maintenance and Storage Facilities LRT and BRT both require maintenance and storage facilities; however, the requirements in terms of location and size are not the same. LRT requires a facility located along the right-of-way while a BRT facility can be located elsewhere. Depending on the construction phasing and mode chosen, two maintenance facilities (one in Montgomery County and one in Prince George’s County) are ideal.
The size of the facility depends on the number of vehicles required. A fleet of 40 to 45 LRT vehicles or 40 to 60 buses (including spares) would require approximately 20 acres. The Purple Line would also require storage for non-revenue vehicles and equipment such as: maintenance, supervisory, and security vehicles.
Activities at the maintenance facility would include:
• Vehicle Storage area (tracks for LRT)
• Inspection/Cleaning
• Running Repairs
• Maintenance/Repair
• Operations/Security
• Parking
• Materials/Equipment Storage
Two sites improve operations by providing services and storage near the ends of the alignment. It is possible to have one site provide the majority of the services and the other function as an auxiliary site.
Five potential sites were identified during the course of the alternatives analysis and were evaluated for environmental impacts. As part of the screening process three were eliminated from further consideration. These five sites are listed below:
• Lyttonsville – This is a maintenance facility on Brookville Road in Lyttonsville, currently used by Montgomery County Ride On buses and school buses. The Purple Line would require the use of some additional adjacent property.
• Haig Court – This site is located on River Road at Haig Court. It would require minimal grading, but is partly wooded, and is very close to the residential neighborhood of Riverdale which is also a historic district.
• North Veterans Parkway – This site is located on the north side of Veterans Parkway. This site is heavily wooded and includes steep grades.

Page 1-14 ● Operating and Maintenance Cost Estimate Technical Report
• Glenridge Maintenance Facility – This site is located on the south side of Veterans Parkway near West Lanham Shopping Center. It is currently being used as a maintenance facility for Prince George’s County Park vehicles.
• MTA New Carrollton property – This site is a parcel owned but the MTA on the east side of the New Carrollton Metro station. It is not particularly well located for use by the Purple Line because it would require the Purple Line to pass under or around the New Carrollton Metro Station.
The Lyttonsville site and the Glenridge Maintenance Facility were identified as the two sites most appropriate for maintenance and storage facilities for the project based on potential environmental effects and location. These two sites would provide sufficient capacity for either BRT or LRT operations; and are well located near either end of the alignment.
1.2.7. Traction Power Substations Light rail’s electric traction power system requires electrical substations approximately every 1.25 miles, depending on the frequency and size of the vehicles. These substations, which are approximately 10 feet by 40 feet, do not need to be immediately adjacent to the tracks. This flexibility means the substations can be located to minimize visual intrusions and can be visually shielded by fencing, landscaping, or walls, or can be incorporated into existing buildings. The number and location of these substations will be determined during the preliminary engineering phase of project development.
Operating and Maintenance Cost Estimate Technical Report ● Page 2-1
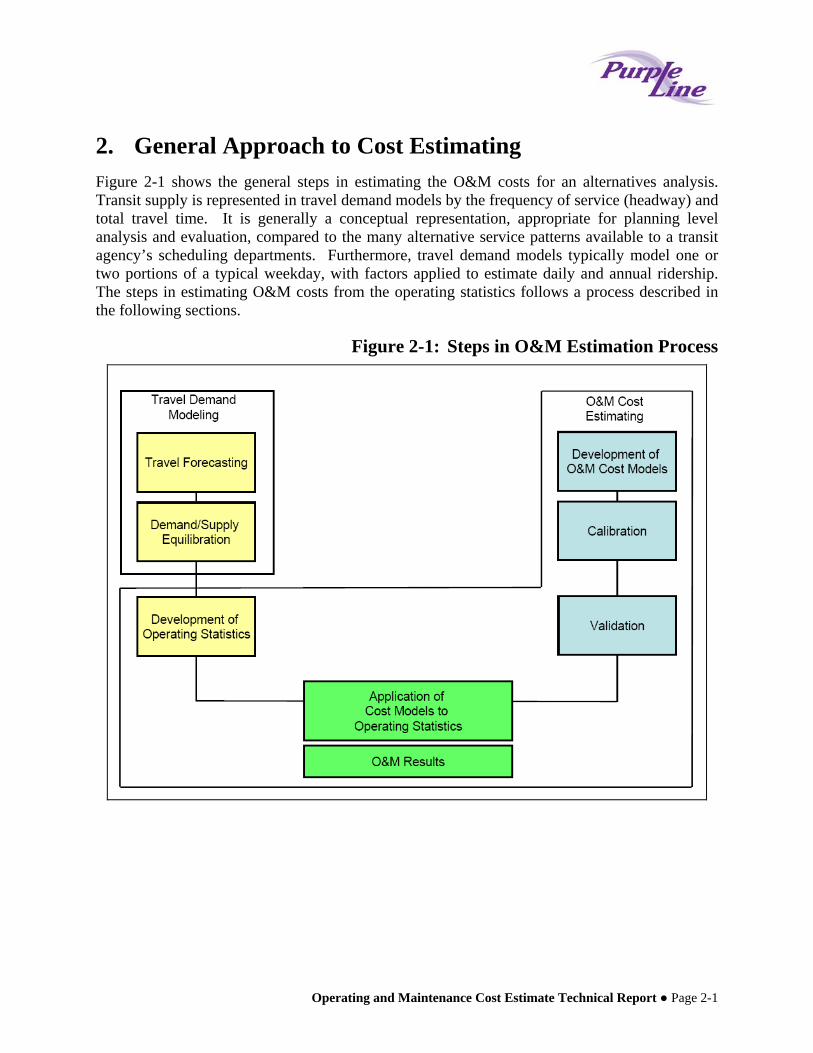
2. General Approach to Cost Estimating Figure 2-1 shows the general steps in estimating the O&M costs for an alternatives analysis. Transit supply is represented in travel demand models by the frequency of service (headway) and total travel time. It is generally a conceptual representation, appropriate for planning level analysis and evaluation, compared to the many alternative service patterns available to a transit agency’s scheduling departments. Furthermore, travel demand models typically model one or two portions of a typical weekday, with factors applied to estimate daily and annual ridership. The steps in estimating O&M costs from the operating statistics follows a process described in the following sections.
Figure 2-1: Steps in O&M Estimation Process

Operating and Maintenance Cost Estimate Technical Report ● Page 3-1
3. Cost Estimating Methodology The resource build-up approach is used to determine O&M costs for the alternatives in FTA New Starts projects. Costs are computed in the resource build-up model by estimating the labor and materials needed to provide a given level-of-service and then multiplying by the unit costs of said labor and materials. This approach involves disaggregating O&M costs from recent years into categories that can be reasonably assumed to vary with service levels. The bus model, for example, has costs that vary by miles of service (for example, fuel costs), by hours of service (driver labor), and by the number of peak vehicles (bus cleaning). Productivity factors were broken out where reasonable, so that the impacts of new assumptions (such as new fuel costs, labor rates, or fuel efficiency) could be tested directly in the model. The disaggregated costs per unit of service were then summed to produce a cost model that calculates future costs for each alternative based on the service characteristics and productivity assumptions defined for that alternative.
The model for the Purple Line was based on unit costs derived via resource build-up equations, and wage and fringe rates for the agencies that operate within the area were used throughout the estimation procedures. This report documents the model used and presents the results of the 2030 annual O&M costs for the project alternatives in 2007 dollars. The methodology used in this report is consistent with the FTA guidance suggesting a resource productivity approach to estimating O&M costs.
3.1. Operating and Maintenance Cost Model Development
Public transportation in the Purple Line corridor is provided by MTA, Washington Metropolitan Area Transit Authority (WMATA) Metrobus and Metrorail, county systems operated by Montgomery and Prince George’s Counties, and the University of Maryland.
Currently, MTA operates a network of bus routes operating primarily in mixed traffic, with approximately 20 million vehicle miles of bus service per year. MTA also operates a door-to-door service, heavy rail transit, commuter rail service oriented to Baltimore and Washington, D.C. (MARC), and nearly 60 miles of (directional) light rail service. MTA’s operational and cost experience for bus and light rail service was used as the basis for the Purple Line service model development. Because changes to the heavy rail or commuter rail systems are not a factor in the present study, cost models were not prepared for those modes.
Besides the 106.3 miles of heavy rail service that comprises their Metrorail rail transit system, WMATA provides local and express bus and Americans with Disabilities Act-compliant complementary paratransit service in the Washington, D.C. area. WMATA operates 338 fixed bus routes on 171 lines, operating more than 423 million annual revenue vehicle miles of bus service per year. Cost models, based on WMATA bus, were developed for projected WMATA service within the different models.
Ride On Montgomery County bus transit operates 12.4 million annual revenue vehicle miles of fixed-route bus service and provides complementary paratransit service within Montgomery

Page 3-2 ● Operating and Maintenance Cost Estimate Technical Report
County, providing connections to Metrobus and Metrorail services. Prince George’s County TheBus transit service provides 10.5 million annual passenger miles of bus service within the county, together with paratransit, and connects to WMATA and Montgomery County services. Cost models for local and express bus service within the Purple Line model were developed using Montgomery County bus costs.
3.1.1. MTA Bus Model Summary The basic bus cost model was calibrated using FTA’s NTD reports for FY 2003 through 2005. The NTD is the FTA’s national database of statistics for the transit industry. The NTD is comprised of data reported by transit agencies across the US, which is then analyzed and compiled into reports published by FTA and made available to the public on the NTD program website. The types of data collected and reported include:
• Operational Characteristics - Vehicle revenue hours and miles, unlinked passenger trips, and passenger miles.
• Service Characteristics - Service reliability and safety, etc.
• Capital Revenues and Assets - Sources and uses of capital, fleet size and age, and fixed guideways, etc.
• Financial Operating Statistics - Revenues, federal, state, and local funding; costs, etc.
The NTD has been expanded in recent years to include data on safety, security, and rural transit.
An average of 2003, 2004, and 2005 actual costs for MTA bus were developed for each expense category. Costs were escalated from their year of expenditure to September 2007 dollars using escalation factors derived from Bureau of Labor Statistics Consumer Price Index inflation estimates for the Baltimore-Washington area. September 2007 is the most recent month for which Consumer Price Index data is currently available at the regional level. The factors used to inflate from year of expenditure to September 2007 are listed in Table 3-1.
Table 3-1: Inflation Rates Compared to September 2007 Year of Expenditure Escalation Factor
2003 1.153 2004 1.12 2005 1.077
Source: Based on US Bureau of Labor Statistics, Consumer Price Index Data for Baltimore Washington, D.C.-MD-VA-WV. Series Id: CUURA311SA0, CUUSA311SA0. Accessed November 2007.
Detailed costs that form the basis of the MTA bus model are presented in Table 3-2. These individual costs were summed to form a cost model based on three service characteristics: service hours, vehicle miles, and peak vehicles (the number of vehicles that operate during peak hours). The costs were then divided by the number of units of each operating statistic to develop unit cost factors for each category. The resulting unit cost factors include:

Operating and Maintenance Cost Estimate Technical Report ● Page 3-3
• $67,727 X number of buses operated during peak • $3.41 X number of annual vehicle miles • $58.52 X number of annual vehicle service hours
For BRT, station and guideway maintenance costs were priced using a factor of $79,642 for each mile (in each direction) of BRT guideway, using a methodology described in Section 3.2. To capture the additional cost of using articulated buses or other unconventional transit vehicles in such areas as fuel, tires, and maintenance, for BRT services, the cost factor for annual vehicle miles of service was increased by 50 percent, from $3.41 for conventional bus service to $5.11 for BRT.
3.1.2. MTA Light Rail Model Summary The LRT cost model was calibrated using MTA’s NTD reports for FY 2003. The year 2003 was chosen because it was the last full year of operation before changes were made to the operational procedure, which coincided with rail double tracking projects on the existing LRT line. These operational changes distorted operating costs (discussed below in the validation section) to the point where operating cost data from the years since 2003 are inappropriate predictor of future rail operations. The detailed costs for the development of the cost factors employed in the MTA light rail model are presented in Table 3-3. The individual costs were summed to form a cost model based on four service characteristics: vehicles in maximum service (peak number of vehicles), track miles, passenger car revenue hours (to account for multi-car trains), and revenue miles. The rail model distinguishes between labor costs and non-labor costs for operating characteristics.
The unit cost factors for light rail include:
• $70,645 X number of vehicles in maximum service • $160,325 X number of directional route miles (track miles) • $3.22 X number of annual passenger car revenue miles • $108.85 X number of annual passenger car revenue hours
3.1.3. WMATA Bus Cost Model Summary The WMATA bus cost model was calibrated using WMATA’s NTD reports for FY 2003-2005. An average of 2003, 2004, and 2005 actual costs for WMATA buses were developed for each expense category and were inflated to September 2007 costs. Average WMATA costs were used to estimate costs for both local and express WMATA buses in the model. The detailed costs for the development of the cost factors employed in the WMATA bus model are presented in Table 3-4.
The unit cost factors for WMATA bus include:
• $78,454 X number of vehicles in maximum service • $3.71 X number of annual passenger car revenue miles • $61.46 X number of annual passenger car revenue hours

Page 3-4 ● Operating and Maintenance Cost Estimate Technical Report
3.1.4. Other Local Bus/Other Express Bus Cost Model Summary The Montgomery County bus cost model was used to estimate bus costs in the Other Local Bus and Other Express Bus modes for the different alternatives. The Other Local Bus and Other Express Bus categories in the model included bus services in Montgomery County, Prince George’s County, Fairfax County, Virginia, and other local bus services in the region. Montgomery County was chosen for development of the cost model primarily because Montgomery County’s costs are somewhat higher than those of Prince Georges County. This will cause the model to err on the more conservative side, projecting slightly higher costs than would be generated by a model based on Prince George’s County service.
The Montgomery County bus cost model was calibrated using Montgomery County’s NTD reports for FY 2003-2005. An average of 2003, 2004, and 2005 actual costs for Montgomery County buses were developed for each expense category and were inflated to September 2007 costs. The detailed costs for the development of the cost factors employed in the Montgomery County bus model are presented in Table 3-5.
The unit cost factors for Montgomery County bus include: • $84,513 X number of vehicles in maximum service • $2.04 X number of annual passenger car revenue miles • $52.61 X number of annual passenger car revenue hours
3.1.5. Validation Validation is a process used to indicate that the model is accurate and that the assumptions used in building the model were valid. Of the three years considered in the MTA bus model validation, 2004 had the largest variance between actual and predicted costs, at 6 percent. For the years 2003 through 2005, the model predicted the actual (inflation adjusted) costs to within less than ±6 percent. Table 3-6 shows the results of the validation for MTA bus.
The rail model is less accurate than the bus model for predicting the actual costs of individual years. Even under normal circumstances, an LRT model typically is less accurate in predicting the actual costs of individual years because the scale of an LRT system is smaller. This makes an LRT system model more sensitive to small changes in service patterns from year to year. In addition, as noted in Section 3.1.3, the LRT model is based on a single year—2003—because the years 2004 and 2005 were affected by significant service changes due to construction. However, there is a reasonable degree of confidence that the model accurately projects costs for a normal year of operation. Table 3-7 shows the results of the validation for MTA light rail.
For the WMATA bus validation, 2003 had the largest variance between actual and predicted costs, at 4 percent. The WMATA bus cost model predicted the actual (inflation adjusted) costs to within less than ±4 percent. Table 3-8 shows the results of the validation for WMATA bus validation.
For Montgomery County, bus validation for year 2005 had the largest variance, 5 percent, between actual and predicted costs. The Montgomery County bus cost model predicted the actual (inflation adjusted) costs to within less than ±5 percent. Table 3-9 shows the results of the validation for Montgomery County bus validation.

Operating and Maintenance Cost Estimate Technical Report ● Page 3-5
Table 3-2: MTA Bus O&M Cost Model Based on 2003-2005 Submittals to National Transit Database NTD ID: 3034 Mode: MB Service: DO
September 2007 dollars 1.0000
1. Cost Allocation Model (In November 2006 Dollars)2003-2005 Average Expenses
Annual Cost Annual Cost & Attribution
NTDB Reference
Revenue-Vehicle-Hours
Scheduled Revenue-Vehicle-
Miles Peak Vehicles
Exclusive Access Right-of-Way
Miles % of TotalVehicle Operations Labor
F-30, 01 a 50,811,771$ 50,811,771$ 24%Other Salaries and Wages F-30, 02 a 10,351,272$ 10,351,272$ 5%Fringe Benefits F-30, 03 a 40,917,192$ 40,917,192$ 20%Services F-30, 04 a 126,005$ 126,005$ 0%Sub-Total 102,206,240$ 102,206,240$ -$ -$ -$ 49%
Vehicle Operations Materials and SuppliesFuel and Lubricants F-30, 05 a 10,132,703$ 10,132,703$ 4.8%Tires and Tubes F-30, 06 a 1,000,131$ 1,000,131$ 0%Other Materials/Supplies F-30, 07 a 151,752$ 151,752$ 0%Utilities F-30, 08 a -$ -$ 0%Casualty and Liability F-30, 09 a -$ -$ 0%Taxes F-30, 10 a -$ -$ 0%Miscellaneous F-30, 13 a -$ -$ 0%Expense Transfers F-30, 14 a 0%Sub-Total 11,284,586$ -$ 11,284,586$ -$ -$ 5%
0Vehicle Maintenance LaborOther Salaries and Wages F-30, 02 b 21,465,895$ 21,465,895$ 10%Fringe Benefits F-30, 03 b 14,365,693$ 14,365,693$ 7%Services F-30, 04 b 1,508,523$ 1,508,523$ 1%Sub-Total 37,340,111$ -$ 37,340,111$ -$ -$ 18%
Vehicle Maintenance Materials and SuppliesFuel and Lubricants F-30, 05 b 689,368$ 689,368$ 0%Tires and Tubes F-30, 06 b -$ -$ 0%Other Materials and Supplies F-30, 07 b 17,102,142$ 17,102,142$ 8%Utilities F-30, 08 b -$ -$ 0%Casualty & Liability F-30, 09 b 384,350$ 384,350$ 0%Taxes F-30, 10 b -$ -$ 0%Miscellaneous F-30, 13 b -$ -$ 0%Expense Transfer F-30, 14 b 0%Sub-Total 18,175,860$ -$ 18,175,860$ -$ -$ 9%
0%Non-Vehicle Maintenance LaborOther Salaries and Wages F-30, 02 c 2,698,616$ 2,698,616$ 1%Fringe Benefits F-30, 03 c 1,805,972$ 1,805,972$ 1%Services F-30, 04 c 1,136,536$ 1,136,536$ 1%Sub-Total 5,641,124$ -$ -$ 5,641,124$ -$ 3%
Non-Vehicle Maintenance Materials and SuppliesFuel and Lubricants F-30, 05 c -$ -$ 0%Tires and Tubes F-30, 06 c -$ -$ 0%Other Materials and Supplies F-30, 07 c 1,076,217$ 1,076,217$ 1%Utilities F-30, 08 c -$ -$ 0%Casualty & Liability F-30, 09 c 401,073$ 401,073$ 0%Taxes F-30, 10 c -$ -$ 0%Miscellaneous F-30, 13 c -$ -$ 0%Expense Transfer F-30, 14 c -$ -$ 0%Sub-Total 1,477,290$ -$ -$ 1,477,290$ -$ 1%
7,118,414$ 3%General AdministrationOther Salaries and Wages F-30, 02 d 17,406,625$ 17,406,625$ 8%Fringe Benefits F-30, 03 d 11,643,389$ 11,643,389$ 6%Services F-30, 04 d 5,507,584$ 5,507,584$ 3%Fuel and Lubricants F-30, 05 d -$ -$ 0%Tires and Tubes F-30, 06 d -$ -$ 0%Other Materials and Supplies F-30, 07 d 2,326,235$ 2,326,235$ 1%Utilities F-30, 08 d 3,712,963$ 3,712,963$ 2%Casualty and Liability F-30, 09 d 3,433,818$ 3,433,818$ 2%Taxes F-30, 10 d -$ -$ 0%Miscellaneous Expense F-30, 13 d 2,666,748$ 2,666,748$ 1%Expense Transfers F-30, 14 d (13,314,853)$ (13,314,853)$ -6%Sub-Total 33,382,508$ -$ -$ 33,382,508$ -$ 16%
TOTAL 209,507,719$ 102,206,240$ 66,800,557$ 40,500,922$ -$ 100%Percent
Units Per Year 1,746,564 19,590,300 598 UNIT COST (September 2007 Dollars) 58.52$ 3.41$ 67,727$

Page 3-6 ● Operating and Maintenance Cost Estimate Technical Report
Table 3-3: MTA Light Rail O&M Cost Model Maryland Mass Transit Administration Light Rail Operating Cost ModelBased on 2003 Sumbittals to National Transit Database NTD ID: 3034 Mode: LR Service: DO
Conversion from 2003 to September 2007 Dollars 1.1531
1. Cost Allocation Model (In Year of Expenditure Dollars)2003 Actual Expenses
Train-Revenue-HoursScheduled Revenue-
Car-Miles Peak Vehicles Track-Miles % of TotalVehicle Operations LaborOperator Salaries and Wages 3,132,738$ 3,132,738$ 9%Other Salaries and Wages 5,883,151$ 5,883,151$ 17%Fringe Benefits 6,090,007$ 6,090,007$ 18%Services 1,592,421$ 1,592,421$ 5%Sub-Total 16,698,317$ 16,698,317$ -$ -$ -$ 48%
Vehicle Operations Materials and SuppliesFuel and Lubricants 6,833$ 6,833$ 0%Tires and Tubes -$ -$ 0%Other Materials/Supplies 19,538$ 19,538$ 0%Utilities 1,331,572$ 1,331,572$ 4%Casualty and Liability -$ -$ 0%Taxes -$ -$ 0%Miscellaneous -$ -$ 0%Expense Transfers -$ 0%Sub-Total 1,357,943$ -$ 1,357,943$ -$ -$ 4%
18,056,260$ Vehicle Maintenance LaborOther Salaries and Wages 2,445,941$ 2,445,941$ 7%Fringe Benefits 1,652,172$ 1,652,172$ 5%Services 137,956$ 137,956$ 0%Sub-Total 4,236,069$ -$ 4,236,069$ -$ -$ 12%
Vehicle Maintenance Materials and SuppliesFuel and Lubricants 23,872$ 23,872$ 0%Tires and Tubes -$ -$ 0%Other Materials and Supplies 1,827,623$ 1,827,623$ 5%Utilities -$ -$ 0%Casualty & Liability 327,057$ 327,057$ 1%Taxes -$ -$ 0%Miscellaneous -$ -$ 0%Expense Transfer -$ 0%Sub-Total 2,178,552$ -$ 2,178,552$ -$ -$ 6%
6,414,621$ Non-Vehicle Maintenance LaborOther Salaries and Wages 3,394,762$ 3,394,762$ 10%Fringe Benefits 2,293,077$ 2,293,077$ 7%Services 1,901,348$ 1,901,348$ 6%Sub-Total 7,589,187$ -$ -$ -$ 7,589,187$ 22%
Non-Vehicle Maintenance Materials and SuppliesFuel and Lubricants -$ -$ 0%Tires and Tubes -$ -$ 0%Other Materials and Supplies 405,646$ 405,646$ 1%Utilities -$ -$ 0%Casualty & Liability 14,021$ 14,021$ 0%Taxes -$ -$ 0%Miscellaneous -$ -$ 0%Expense Transfer -$ 0%Sub-Total 419,667$ -$ -$ -$ 419,667$ 1%
8,008,854$ General AdministrationOther Salaries and Wages 564,745$ 564,745$ 2%Fringe Benefits 381,471$ 381,471$ 1%Services 711,622$ 711,622$ 2%Fuel and Lubricants -$ -$ 0%Tires and Tubes -$ -$ 0%Other Materials and Supplies 260,011$ 260,011$ 1%Utilities 723,323$ 723,323$ 2%Casualty and Liability 315,040$ 315,040$ 1%Taxes -$ -$ 0%Miscellaneous Expense 355,669$ 355,669$ 1%Expense Transfers (1,290,069)$ (1,290,069)$ -4%Sub-Total 2,021,812$ -$ -$ 2,021,812$ -$ 6%
TOTAL 34,501,547$ 16,698,317$ 7,772,564$ 2,021,812$ 8,008,854$ 100%Percent
Units Per Year 176,887 2,781,102 33 57.60 UNIT COST (2003 Dollars) 94.40$ 2.79$ 61,267$ 139,043$ UNIT COST (September 2007 Dollars) 108.85$ 3.22$ 70,645$ 160,325$
Annual Cost
Annual Cost & Attribution

Operating and Maintenance Cost Estimate Technical Report ● Page 3-7
Table 3-4: WMATA Bus O&M Cost Model WMATA Motor Bus Operating Cost Model
Based on 2003-2005 Sumbittals to National Transit Database NTD ID: 3030 Mode: MB Service: DOSeptember 2007 Dollars
September 2007 Dollars 1.0000
1. Cost Allocation Model (In September 2007 Dollars)2003-2005 Average Expenses
Annual Cost Annual Cost & Attribution
NTDB Reference
Revenue-Vehicle-Hours
Scheduled Revenue-
Vehicle-Miles Peak Vehicles
Exclusive Access Right-of-Way Miles % of Total
Vehicle Operations LaborOperator Salaries and Wages F-30, 01 a 120,182,601$ 120,182,601$ 27%Other Salaries and Wages F-30, 02 a 19,916,119$ 19,916,119$ 5%Fringe Benefits F-30, 03 a 71,219,675$ 71,219,675$ 16%Services F-30, 04 a 4,712$ 4,712$ 0%Sub-Total 211,323,107$ 211,323,107$ -$ -$ -$ 48%
Vehicle Operations Materials and SuppliesFuel and Lubricants F-30, 05 a 16,771,400$ 16,771,400$ 3.8%Tires and Tubes F-30, 06 a 2,520,288$ 2,520,288$ 1%Other Materials/Supplies F-30, 07 a 264,044$ 264,044$ 0%Utilities F-30, 08 a -$ -$ 0%Casualty and Liability F-30, 09 a -$ -$ 0%Taxes F-30, 10 a -$ -$ 0%Miscellaneous F-30, 13 a 981$ 981$ 0%Expense Transfers F-30, 14 a -$ 0%Sub-Total 19,556,714$ -$ 19,555,732$ 981$ -$ 4%
0Vehicle Maintenance LaborOther Salaries and Wages F-30, 02 b 59,286,898$ 59,286,898$ 13%Fringe Benefits F-30, 03 b 29,660,293$ 29,660,293$ 7%Services F-30, 04 b 1,619,134$ 1,619,134$ 0%Sub-Total 90,566,325$ -$ 90,566,325$ -$ -$ 20%
Vehicle Maintenance Materials and SuppliesFuel and Lubricants F-30, 05 b 3,906,214$ 3,906,214$ 1%Tires and Tubes F-30, 06 b 29,286$ 29,286$ 0%Other Materials and Supplies F-30, 07 b 29,636,263$ 29,636,263$ 7%Utilities F-30, 08 b -$ -$ 0%Casualty & Liability F-30, 09 b -$ -$ 0%Taxes F-30, 10 b -$ -$ 0%Miscellaneous F-30, 13 b 4,875$ 4,875$ 0%Expense Transfer F-30, 14 b (6,728,685)$ -2%Sub-Total 26,847,953$ -$ 33,576,637$ -$ -$ 6%
0%Non-Vehicle Maintenance LaborOther Salaries and Wages F-30, 02 c 13,379,635$ 13,379,635$ 3%Fringe Benefits F-30, 03 c 6,861,504$ 6,861,504$ 2%Services F-30, 04 c 1,368,359$ 1,368,359$ 0%Sub-Total 21,609,498$ -$ -$ 21,609,498$ -$ 5%
Non-Vehicle Maintenance Materials and SuppliesFuel and Lubricants F-30, 05 c -$ -$ 0%Tires and Tubes F-30, 06 c -$ -$ 0%Other Materials and Supplies F-30, 07 c 377,835$ 377,835$ 0%Utilities F-30, 08 c 689,549$ 689,549$ 0%Casualty & Liability F-30, 09 c -$ -$ 0%Taxes F-30, 10 c -$ -$ 0%Miscellaneous F-30, 13 c -$ -$ 0%Expense Transfer F-30, 14 c -$ -$ 0%Sub-Total 1,067,383$ -$ -$ 1,067,383$ -$ 0%
22,676,882$ 5%General AdministrationOther Salaries and Wages F-30, 02 d 27,784,637$ 27,784,637$ 6%Fringe Benefits F-30, 03 d 14,009,142$ 14,009,142$ 3%Services F-30, 04 d 10,530,003$ 10,530,003$ 2%Fuel and Lubricants F-30, 05 d -$ -$ 0%Tires and Tubes F-30, 06 d -$ -$ 0%Other Materials and Supplies F-30, 07 d 3,992,698$ 3,992,698$ 1%Utilities F-30, 08 d 5,594,844$ 5,594,844$ 1%Casualty and Liability F-30, 09 d 7,366,465$ 7,366,465$ 2%Taxes F-30, 10 d -$ -$ 0%Miscellaneous Expense F-30, 13 d 2,058,926$ 2,058,926$ 0%Expense Transfers F-30, 14 d (210,022)$ (210,022)$ 0%Sub-Total 71,126,693$ -$ -$ 71,126,693$ -$ 16%
TOTAL 442,097,673$ 211,323,107$ 143,698,695$ 93,804,556$ -$ 100%Percent
Units Per Year - 3,438,387 38,752,591 1,196 UNIT COST (September 2007 Dollars) 61.46$ 3.71$ 78,454$ UNIT COST (September 2007 Dollars) 61.46$ 3.71$ 78,454$

Page 3-8 ● Operating and Maintenance Cost Estimate Technical Report
Table 3-5: Montgomery County Bus O&M Cost Model Montgomery County Motor Bus Operating Cost Model
Based on 2003-2005 Sumbittals to National Transit Database NTD ID: 3030 Mode: MB Service: DO
September 2007 Dollars 1.0000
1. Cost Allocation Model (In September 2007 Dollars)2003-2005 Average Expenses
Annual Cost Annual Cost & Attribution
NTDB Reference
Revenue-Vehicle-Hours
Scheduled Revenue-
Vehicle-Miles Peak Vehicles
Exclusive Access Right-of-Way Miles % of Total
Vehicle Operations LaborOperator Salaries and Wages F-30, 01 a 18,848,339$ 18,848,339$ 27%Other Salaries and Wages F-30, 02 a 2,042,763$ 2,042,763$ 3%Fringe Benefits F-30, 03 a 12,150,682$ 12,150,682$ 18%Services F-30, 04 a 485,924$ 485,924$ 1%Sub-Total 33,527,708$ 33,527,708$ -$ -$ -$ 49%
Vehicle Operations Materials and SuppliesFuel and Lubricants F-30, 05 a 4,415,030$ 4,415,030$ 6.4%Tires and Tubes F-30, 06 a 3,317,787$ 3,317,787$ 5%Other Materials/Supplies F-30, 07 a 3,116,176$ 3,116,176$ 5%Utilities F-30, 08 a 84,459$ 84,459$ 0%Casualty and Liability F-30, 09 a 1,117,216$ 1,117,216$ 2%Taxes F-30, 10 a -$ -$ 0%Miscellaneous F-30, 13 a 5,749,584$ 5,749,584$ 8%Expense Transfers F-30, 14 a -$ 0%Sub-Total 17,800,251$ -$ 12,050,667$ 5,749,584$ -$ 26%
0Vehicle Maintenance LaborOther Salaries and Wages F-30, 02 b -$ -$ 0%Fringe Benefits F-30, 03 b 508,556$ 508,556$ 1%Services F-30, 04 b 1,283,454$ 1,283,454$ 2%Sub-Total 1,792,010$ -$ 1,792,010$ -$ -$ 3%
Vehicle Maintenance Materials and SuppliesFuel and Lubricants F-30, 05 b 131,504$ 131,504$ 0%Tires and Tubes F-30, 06 b 1,549,526$ 1,549,526$ 2%Other Materials and Supplies F-30, 07 b 1,890,496$ 1,890,496$ 3%Utilities F-30, 08 b -$ -$ 0%Casualty & Liability F-30, 09 b 860,905$ 860,905$ 1%Taxes F-30, 10 b -$ -$ 0%Miscellaneous F-30, 13 b -$ -$ 0%Expense Transfer F-30, 14 b -$ 0%Sub-Total 4,432,431$ -$ 4,432,431$ -$ -$ 6%
0%Non-Vehicle Maintenance LaborOther Salaries and Wages F-30, 02 c -$ -$ 0%Fringe Benefits F-30, 03 c 144,673$ 144,673$ 0%Services F-30, 04 c 287,809$ 287,809$ 0%Sub-Total 432,482$ -$ -$ 432,482$ -$ 1%
Non-Vehicle Maintenance Materials and SuppliesFuel and Lubricants F-30, 05 c -$ -$ 0%Tires and Tubes F-30, 06 c -$ -$ 0%Other Materials and Supplies F-30, 07 c 3,752,300$ 3,752,300$ 5%Utilities F-30, 08 c -$ -$ 0%Casualty & Liability F-30, 09 c -$ -$ 0%Taxes F-30, 10 c -$ -$ 0%Miscellaneous F-30, 13 c 488,122$ 488,122$ 1%Expense Transfer F-30, 14 c -$ -$ 0%Sub-Total 4,240,423$ -$ -$ 4,240,423$ -$ 6%
4,672,905$ 7%General AdministrationOther Salaries and Wages F-30, 02 d 3,410,364$ 3,410,364$ 5%Fringe Benefits F-30, 03 d 1,906,278$ 1,906,278$ 3%Services F-30, 04 d 474,294$ 474,294$ 1%Fuel and Lubricants F-30, 05 d -$ -$ 0%Tires and Tubes F-30, 06 d -$ -$ 0%Other Materials and Supplies F-30, 07 d 115,150$ 115,150$ 0%Utilities F-30, 08 d -$ -$ 0%Casualty and Liability F-30, 09 d 12,434$ 12,434$ 0%Taxes F-30, 10 d -$ -$ 0%Miscellaneous Expense F-30, 13 d 420,705$ 420,705$ 1%Expense Transfers F-30, 14 d -$ -$ 0%Sub-Total 6,339,225$ -$ -$ 6,339,225$ -$ 9%
TOTAL 68,564,529$ 33,527,708$ 18,275,107$ 16,761,714$ -$ 100%Percent
Units Per Year 637,280$ 8,947,756$ 198$ UNIT COST (September 2007 Dollars) 52.61$ 2.04$ 84,513$ UNIT COST (September 2007 Dollars) 52.61$ 2.04$ 84,513$

Operating and Maintenance Cost Estimate Technical Report ● Page 3-9
Table 3-6: MTA Bus Validation
MTA Bus Validation Peak Buses Revenue Vehicle Miles
Revenue Vehicle Hours
Estimated Costs Using Model
(Inflated to September 2007 Dollars)
Actual Cost (Year of Expenditure
Dollars) Inflation Factors
Actual Cost (September 2007
Dollars) Difference Percent
Difference
Average 2003-2005 (Cost Model) 598 19,590,300 1,746,564 $209,507,719 NA - $209,507,719 - 0% 2005 (in Model) 577 19,685,513 1,771,229 $209,853,449 $198,452,825 1.08 $213,817,837 ($3,964,388) -2% 2004 (in Model) 606 19,839,810 1,748,322 $211,003,192 $177,251,647 1.12 $198,601,475 $12,401,717 6% 2003 (in Model) 611 19,245,577 1,720,142 $207,666,516 $187,416,870 1.15 $216,103,846 ($8,437,330) -4%
Table 3-7: MTA Light Rail Validation
MTA Light Rail Validation
Peak Rail Passenger
Cars
Passenger Car Revenue Miles
Passenger Car Revenue Hours
Track Miles Stations
Estimated Costs Using Model
(Inflated to September 2007
Dollars)
Actual Cost (Year of
Expenditure Dollars)
Inflation Factors
Actual Cost (September 2007
Dollars) Difference Percent
Difference
Actual Cost/ Passenger
Revenue Mile
Actual Cost/ Passenger
Revenue Hour
2005 28 1,494,163 89,811 58 33 $25,803,794 $36,314,050 1.0774 $39,125,629 ($13,321,835) -52% $26.19 $435.64 2004 33 2,060,331 122,634 57.6 33 $31,554,331 $33,687,929 1.1204 $37,745,615 ($6,191,284) -20% $18.32 $307.79 2003 (Current Cost Model) 33 2,781,102 176,887 57.6 33 $39,782,529 $34,501,547 1.1531 $39,782,529 $0 0% $14.30 $224.90
Table 3-8: WMATA Bus Validation
WMATA Bus Validation Peak Buses Revenue Vehicle Miles
Revenue Vehicle Hours
Estimated Costs Using Model (Inflated to September 2007 Dollars)
Actual Cost (Year of Expenditure
Dollars) Inflation Factors
Actual Cost (September 2007
Dollars) Difference Percent
Difference
Average 2003-2005 (Cost Model) 1,196 38,752,591 3,438,387 $442,097,673 NA - $442,097,673 - 0%
2005 (in Model) 1,187 38,458,955 3,422,983 $446,110,844 $420,249,296 1.08 $452,786,677 ($6,675,834) -1% 2004 (in Model) 1,190 38,901,318 3,458,658 $450,179,117 $395,725,481 1.12 $443,390,319 $6,788,798 2% 2003 (in Model) 1,210 38,897,499 3,433,521 $450,189,113 $373,019,732 1.15 $430,116,023 $20,073,090 4%
Table 3-9: Montgomery County Bus Validation
Montgomery County Bus Validation Peak Buses Revenue Vehicle
Miles Revenue Vehicle
Hours Estimated Costs Using Model (Inflated to September 2007 Dollars)
Actual Cost (Year of Expenditure
Dollars) Inflation Factors
Actual Cost (September 2007
Dollars) Difference Percent
Difference
Average 2003-2005 (Cost Model) 198 8,947,756 637,280 $68,564,529 NA - $68,564,529 - 0% 2005 (in Model) 207 9,777,269 720,090 $75,347,878 $66,244,516 1.08 $71,373,431 $3,974,447 5% 2004 (in Model) 195 8,512,353 664,930 $68,848,227 $64,036,866 1.12 $71,750,059 ($2,901,832) -4% 2003 (in Model) 193 8,553,646 526,820 $61,497,483 $54,264,152 1.15 $62,570,098 ($1,072,615) -2%

Page 3-10 ● Operating and Maintenance Cost Estimate Technical Report
THIS PAGE LEFT BLANK INTENTIONALLY.

Operating and Maintenance Cost Estimate Technical Report ● Page 3-11
3.2. BRT Guideway and Station Costs
The fully allocated cost model prepared for the LRT system includes all costs associated with the MTA’s existing Baltimore Light Rail system, and thus can be used to project the operating O&M costs of both the rail service operation and the rail infrastructure, including the stations and guideway. The bus cost models, in contrast, do not account for the costs of stations, since the passenger facilities of the local and express bus networks are relatively minor. These models also do not include the costs of the BRT guideway, because the buses operate on public streets that are not maintained by the transit system. A BRT guideway, however, would most likely be maintained by the transit system. Methodologies have been prepared to capture the additional costs of stations and guideway maintenance for the BRT Alternatives.
The methodology for estimating station and guideway cost for BRT systems is based on an analysis of costs for cities that report more than 10 miles of exclusive bus guideway in the NTD. Table 3-10 provides NTD cost and operating information for these systems. Costs associated with maintaining exclusive right-of-way for buses vary greatly from system to system depending on station spacing and scale; whether the alignment is at, above, or below grade; and climate (which requires, for example, heating and snow removal), among other factors. Data availability also is limited because most bus systems do not report exclusive bus guideway maintenance separately from other non-vehicle maintenance expenditures. Based on 2005 NTD data for the eight systems shown in Table 3-10, the average value of the number of (full-time equivalent) non-vehicle maintenance employees per directional route mile of exclusive bus was 1.17.
Exclusive bus facility maintenance costs (for both the guideway and stations) were estimated by assuming an average of one maintenance employee per directional mile of exclusive bus right-of-way. Table 3-10 provides data from eight transit agencies that run buses in exclusive right-of-way. This data was used to find the average number of employees and average wages and fringe benefits per route mile. The average annual maintenance cost of $79,642 per directional mile, is shown in the equation below.
Exclusive Bus Facility Maintenance Labor
= Directional route miles x staff per directional route mile x annual salaries and wages x (1+ fringe).
= Directional route miles x 1.17 staff per directional route mile x $39,700.19 annual salary and wages x 1+0.643 (average fringe benefits).
= Directional route miles x $79,642.

Page 3-12 ● Operating and Maintenance Cost Estimate Technical Report
Table 3-10: Cost and Operating Information for Cities with More Than Ten Miles of Exclusive Bus Guideway (2005)
NTD ID
Non-Rail Exclusive
and Controlled
ROW Miles
Non-Vehicle Maintenance:
Other Salaries and
Wages
Non-Vehicle Maintenance:
Fringe Benefits
Number of Full time and ½ of
Part Time Employees
Average Annual Salaries
and Wages per Mile
Ratio of Fringe
Benefits to Wages
Total Average Salaries
and Fringe per
Exclusive ROW mile
Non-Vehicle Maintenance Employees
per Exclusive
Mile
Dallas, TX 6056 71.5 $1,931,960 $1,150,893 50.0 $27,020.42 59.6% $43,116.83 0.70 Hartford, CT 1048 28.8 $495,034 $290,496 12.0 $17,188.68 58.7% $27,275.35 0.42 Houston, TX 6008 200.7 $5,261,281 $3,514,585 145.2 $26,214.65 66.8% $43,726.29 0.72 Madison, WI 5005 12.5 $395,445 $258,182 8.2 $31,635.60 65.3% $52,290.16 0.66 Minneapolis-St. Paul, MN
5027 232.0 $3,305,415 $2,348,913 83.0 $14,247.48 71.1% $24,372.10 0.36
Pittsburgh, PA 3022 56.5 $4,575,603 $2,802,609 94.3 $80,984.12 61.3% $130,587.82 1.67 San Juan, PR 4086 17.1 $1,472,227 $905,663 71.0 $86,095.15 64.6% $141,689.47 4.15 Seattle, WA 0001 245.5 $8,400,120 $5,617,898 168.6 $34,216.37 66.9% $57,099.87 0.69 Maryland MTA 3034 0.0 $2,646,128 $1,772,498 53.0 $0.00 67.0% $0.00 0.00 Average* $39,700.31 64.3% $65,019.74 1.17

Operating and Maintenance Cost Estimate Technical Report ● Page 4-1
4. Cost Estimates for Purple Line Alternatives The estimate of costs for each alternative was determined by multiplying the unit costs by the number of vehicles, hours, and miles of service estimated for each alternative and the one way track miles for BRT and LRT alternatives. The fully burdened cost comes from adding together the costs generated by these factors and the factors for BRT or LRT guideway. Table 4-1 shows these operating statistics for each alternative. These operating statistics form the inputs to the cost models for each alternative. These operating statistics for each alternative are multiplied by the cost factors described in Chapter 3 to develop the operating costs for each mode, and then aggregated to calculate the total system-wide operating cost for each alternative.
Table 4-1: TSM Bus Headways (minutes)
Route Terminal and Intermediate Points
Ear
ly
Mor
ning
AM
Pea
k
Mid
day
PM P
eak
Eve
ning
Wee
kend
TSM Bethesda – New Carrollton 10 6 10 6 10 20 J1 Medical Center – Silver Spring -- 20 -- 20 -- -- J3 Eliminate; replace with Ride On 15 service -- -- -- -- -- -- C2 Terminate at Langley Park
Langley Park – Greenbelt 30 15 20 15 30 30
C4 Twinbrook Metro – Prince George’s Plaza Metro 10 8 15 8 20 20 F4 Silver Spring – New Carrollton 12 10 30 10 -- 30 F6 Terminate at Prince George’s Plaza
Prince George’s Plaza – New Carrollton -- 15 30 15 -- --
Ride On 15 Bethesda – Langley Park (extend to Bethesda) 15 15 15 15 30 15 TheBus 17 Langley Park–University of Maryland–
College Park Metro 45 45 45 45 -- --
4.1. Operations for the TSM and the Build Alternatives
4.1.1. TSM Alternative Because of the importance of serving the trips that interface with the Metrorail services in the Purple Line corridor, the TSM span of service would match the Metrorail span of service. The Metrorail system opens at 5 AM on weekdays and 7 AM on weekends. It operates until midnight Sunday through Thursday and until 3 AM on Fridays and Saturdays.
The fare structure for the TSM service would be the same as under the No Build Alternative, recognizing that fares would increase over time. SmartCard, or some other means of electronic fare collection, may enable an integrated fare structure and convenient transfer with other transit services in the corridors.
End-to-end, the TSM route is 16 miles long, requiring about 108 minutes of running time with an average round trip speed of 9 miles per hour. Today, the bus routes along the alignment operate

Page 4-2 ● Operating and Maintenance Cost Estimate Technical Report
in very difficult circumstances with a wide range of times in each direction and between the AM and PM. Anecdotal reports from WMATA indicate that the J4 route may require 50 percent more time than scheduled on certain runs to complete its trip. These conditions complicate schedule preparation and operations planning. It is assumed TSM measures would somewhat mitigate these conditions; however, 2030 background traffic volumes and traffic congestion levels will be far greater than they are today.
The TSM Alternative includes modifications to existing Metrobus routes intended to improve reliability, including limited-stop bus service, and intersection improvements and signal priority at certain intersections. At intersections where queue jump lanes and signal priority would be implemented, transit’s reliability would increase because the effects of congestion at these locations would be reduced. In addition, the limited-stop route would provide faster connections between major origins and destinations, as well as providing one-seat rides.
However, there is only limited opportunity for improving transit service reliability using signal preference strategies in the corridor. The major radial roadways that cross the corridor, such as Connecticut Avenue, Georgia Avenue, New Hampshire Avenue, Riggs Road, Adelphi Road, US 1, Kenilworth Avenue, and Annapolis Road, are the major sources of delay and unreliability. These roadways carry very heavy arterial traffic flows into and out of Washington, D.C. and other major activity centers. There is very little opportunity to introduce signal preferences at these intersections without causing a major exacerbation of traffic congestion. Queue jump lanes, however, do provide a travel time reliability advantage enabling transit vehicles to get to the intersection and limit the delay to one or two traffic signal cycles.
4.1.2. Build Alternatives Operations The span of service for the Build Alternatives would mirror that for the Metrorail system, including extended hours on weekend nights (see Table 4-2).
Table 4-2: Span of Service Day of Week Hours
Monday - Thursday 5:00 AM – 12:00 AM Friday 5:00 AM – 3:00 AM
Saturday 7:00 AM – 3:00 AM Sunday 7:00 AM – 12:00 AM
The headways of the various Build Alternatives would vary by time period to reflect demand requirements. Proposed headways are shown by time period in Table 4-3. The span of services of the bus routes that feed the TSM and Build Alternatives would be adjusted to service the market needing extended service times.

Operating and Maintenance Cost Estimate Technical Report ● Page 4-3
Table 4-3: Build Alternatives Headways (minutes) Day of Week Early AM Peak Midday PM Peak Evening Late PM
Weekdays 10 6 10 6 10 10 Saturdays 20 N/A 10 N/A 10 20 Sundays 20 N/A 10 N/A 10 20
The fare for all of the Build Alternatives under consideration would be consistent with the current local bus fare structure, recognizing that this would increase over time. SmartCard, or some other means of electronic fare collection, would enable an integrated fare structure and convenient transfer with the other transit services in the corridor.
The end-to-end travel times and average estimated speeds for each Build Alternative are shown in Table 4-4. As expected, the High Investment LRT Alternative, with strategic grade separation and mostly dedicated or exclusive right-of-way, would have the shortest running time and the highest average speed of all the alternatives.
Table 4-4: End-to-End Travel Times
End-to-End Running Time
(minutes) Average Speed (mph) TSM 108 9 Low Investment BRT 96 10 Medium Investment BRT 73 13 High Investment BRT 59 16 Low Investment LRT 62 15 Medium Investment LRT 59 16 High Investment LRT 50 19
Operating costs are initially developed on a system-wide level, to insure that all costs associated with the alternative (including both the costs of operating the new fixed route BRT or Light Rail service and the increased or decreased costs of changes to the background bus network) are included in the operating cost estimates. The total estimated annual cost of operating the No Build system, including WMATA Metrobus and other regional bus services potentially affected by the Purple Line operation, is more than $1.1 billion. However, for the calculation of user benefits under the FTA New Starts process, the operating costs that are presented are the increments of costs for each alternative over the cost of the baseline alternative. The Baseline alternative, which will be selected for comparison purposes by the FTA, can be either the No Build or the TSM alternative. In this narrative, we have presented operating costs as the increment over the No Build.
Incremental estimated costs over No Build for the Build Alternatives are shown in Table 4-5 and Figure 4-1. The High Investment BRT and LRT Alternatives have lower incremental operating cost than the Low Investment Alternatives. This is because the “high” alternatives represent a

Page 4-4 ● Operating and Maintenance Cost Estimate Technical Report
higher level of capital investment on guideway and other improvements. These improvements result in faster travel speeds and shorter travel times for the “high” alternatives, which results in a lower number of operating hours and a smaller bus fleet. The estimated operating statistics for each alternative, on which the operating and maintenance cost estimates were based, are listed in Table 4-6.
Table 4-5: Annual O&M Costs by Alternative
TSM Low
Invest. BRT
Medium Invest. BRT
High Invest. BRT
Low Invest. LRT
Medium Invest. LRT
High Invest. LRT
Incremental Bus and BRT O&M (including BRT service, station, and guideway operation)
$14.6 $17.3 $17.3 $15.8 -$3.6 -$3.6 -$3.6
Incremental LRT O&M, service, station, and guideway costs
$30.0 $28.6 $26.4*
Total O&M Cost Increase $14.6 $17.3 $17.3 $15.8 $26.4 $25.0 $22.8 * Includes $0.6 million for tripper services
Figure 4-1: Incremental Annual O&M Costs above No Build Cost for TSM and Build Alternatives
$-
$5.0
$10.0
$15.0
$20.0
$25.0
$30.0
TSM
Low
Inve
stm
ent
BRT
Med
ium
Inve
stm
ent
BRT
Hig
hIn
vest
men
tBR
T
Low
Inve
stm
ent
LRT
Med
ium
Inve
stm
ent
LRT
Hig
hIn
vest
men
tLR
T
Total Incremental Cost Over No-Build by Alternative
Note: All Costs in Millions of 2007 Dollars

Operating and Maintenance Cost Estimate Technical Report ● Page 4-5
Table 4-6: Annual Operating Statistics by Alternative and Mode Alternative No. 1 No Build
Peak Hour (From Model Worksheet) Off-Peak HourMode Model Mode Name Revenue Vehicle Hours Revenue Vehicle Miles Revenue Vehicle Hours Revenue Vehicle Miles Peak Vehicles One Way Guideway Miles
Mode 1 1 WMATA Local 1,068 11,921 521 5,452 1,288Mode 2 2 WMATA Express 85 1,750 13 244 111Mode 3 6/8 Other Local Bus 741 10,473 417 5,915 927Mode 4 7/9 Other Express Bus 346 7,464 61 1,321 414
Alternative No. 2 TSMPeak Hour (From Model Worksheet) Off-Peak Hour
Mode Model Mode Name Revenue Vehicle Hours Revenue Vehicle Miles Revenue Vehicle Hours Revenue Vehicle Miles Peak Vehicles One Way Guideway MilesMode 1 1 WMATA Local 1,063 11,857 521 5,452 1,283Mode 2 2 WMATA Express 126 2,069 34 435 153Mode 3 6/8 Other Local Bus 734 10,429 412 5,874 920Mode 4 7/9 Other Express Bus 346 7,464 61 1,321 414
Alternative No. 3 Low BRTPeak Hour (From Model Worksheet) Off-Peak Hour
Mode Model Mode Name Revenue Vehicle Hours Revenue Vehicle Miles Revenue Vehicle Hours Revenue Vehicle Miles Peak Vehicles One Way Guideway MilesMode 1 1 WMATA Local 1,063 11,857 521 5,452 1,283Mode 2 2 WMATA Express 85 1,750 13 244 111Mode 3 6/8 Other Local Bus 734 10,415 413 5,882 920Mode 4 7/9 Other Express Bus 346 7,464 61 1,321 414Mode 5 10 BRT 37 319 22 192 38 0
Alternative No. 4 Medium BRTPeak Hour (From Model Worksheet) Off-Peak Hour
Mode Model Mode Name Revenue Vehicle Hours Revenue Vehicle Miles Revenue Vehicle Hours Revenue Vehicle Miles Peak Vehicles One Way Guideway MilesMode 1 1 WMATA Local 1,063 11,857 521 5,452 1,283Mode 2 2 WMATA Express 85 1,750 13 244 111Mode 3 6/8 Other Local Bus 734 10,415 413 5,882 920Mode 4 7/9 Other Express Bus 346 7,464 61 1,321 414Mode 5 10 BRT 34 372 17 186 34 15.5
Alternative No. 5 High BRTPeak Hour (From Model Worksheet) Off-Peak Hour
Mode Model Mode Name Revenue Vehicle Hours Revenue Vehicle Miles Revenue Vehicle Hours Revenue Vehicle Miles Peak Vehicles One Way Guideway MilesMode 1 1 WMATA Local 1,063 11,857 521 5,452 1,283Mode 2 2 WMATA Express 85 1,750 13 244 111Mode 3 6/8 Other Local Bus 734 10,415 413 5,882 920Mode 4 7/9 Other Express Bus 346 7,464 61 1,321 414Mode 5 10 BRT 27 372 14 186 28 15.5
Alternative No. 6 Low LRTPeak Hour (From Model Worksheet) Off-Peak Hour
Mode Model Mode Name Revenue Vehicle Hours Revenue Vehicle Miles Revenue Vehicle Hours Revenue Vehicle Miles Peak Vehicles One Way Guideway MilesMode 1 1 WMATA Local 1,063 11,883 521 5,460 1,283Mode 2 2 WMATA Express 85 1,750 13 244 111Mode 3 6/8 Other Local Bus 734 10,439 413 5,893 920Mode 4 7/9 Other Express Bus 346 7,464 61 1,321 414Mode 5 5 Light Rail 24 334 14 200 24 15.3
Alternative No. 7 Medium LRTPeak Hour (From Model Worksheet) Off-Peak Hour
Mode Model Mode Name Revenue Vehicle Hours Revenue Vehicle Miles Revenue Vehicle Hours Revenue Vehicle Miles Peak Vehicles One Way Guideway MilesMode 1 1 WMATA Local 1,063 11,883 521 5,460 1,283Mode 2 2 WMATA Express 85 1,750 13 244 111Mode 3 6/8 Other Local Bus 734 10,439 413 5,893 920Mode 4 7/9 Other Express Bus 346 7,464 61 1,321 414Mode 5 5 Light Rail 23 310 14 186 24 15.3
Alternative No. 8 High LRTPeak Hour (From Model Worksheet) Off-Peak Hour
Mode Model Mode Name Revenue Vehicle Hours Revenue Vehicle Miles Revenue Vehicle Hours Revenue Vehicle Miles Peak Vehicles One Way Guideway MilesMode 1 1 WMATA Local 1,063 11,883 521 5,460 1,283Mode 2 2 WMATA Express 85 1,750 13 244 111Mode 3 6/8 Other Local Bus 734 10,439 413 5,893 920Mode 4 7/9 Other Express Bus 346 7,464 61 1,321 414Mode 5 5 Light Rail 19 306 11 183 20 15.3

Page 4-6 ● Operating and Maintenance Cost Estimate Technical Report
THIS PAGE LEFT BLANK INTENTIONALLY

Operating and Maintenance Cost Estimate Technical Report ● Page 4-7
4.2. No Build/TSM Cost
Incremental annual operating costs over the No Build for the TSM Alternative are $14.6 million. The No Build Alternative consisted of estimated service for WMATA local bus, WMATA express bus, other local bus, and other express bus services. The TSM Alternative includes those services mentioned above, with an additional cost assigned to BRT in order to account for the enhanced bus service in the TSM Alternative. It was assumed this enhanced service will be provided by MTA.

Page 4-8 ● Operating and Maintenance Cost Estimate Technical Report
4.3. Bus Rapid Transit Costs
Incremental operating costs (over No Build) for the proposed BRT services are shown in Table 4-7 and Figure 4-2. The incremental cost of operating the various BRT alternatives ranges from $15.8 million for the High Investment alternative to $17.3 million for the Low and Medium Investment alternatives. As noted above, the higher level of capital investment in guideway improvements, elevated and tunnel sections, results in higher operating speeds, which significantly reduces costs.
Table 4-7: Annual O&M Costs by Alternative: Bus Rapid Transit Alternative Alternative Incremental Cost over No Build (Millions)
TSM $14.6 Low Investment BRT $17.3
Medium Investment BRT $17.3 High Investment BRT $15.8
Figure 4-2: Annual O&M Costs by Alternative: Bus Rapid Transit
$13.0
$13.5
$14.0
$14.5
$15.0
$15.5
$16.0
$16.5
$17.0
$17.5
TSM
Low
Inve
stm
ent
BRT
Med
ium
Inve
stm
ent
BRT
Hig
hIn
vest
men
tBR
T
Total Incremental Cost Over No-Build - BRT Alternatives

Operating and Maintenance Cost Estimate Technical Report Page 4-9
4.4. Light Rail Costs
Incremental operating costs over No Build for the proposed LRT services are shown in Table 4-8and Figure 4-3. The various LRT costs range from $22.8 million for the High Investment LRTAlternative to $26.4 million for the Low Investment LRT Alternative. As with the BRTalternatives, the higher level of capital investment under the High Investment LRT alternativeresults in faster travel speeds and less delay, which causes it to run more efficiently with fewervehicles, and thus have lower estimated O&M costs.
Table 4-8: Annual O&M Costs by Alternative: Light RailAlternative Alternative Incremental Operating Cost over No Build (Millions)
Low Investment LRT $26.4Medium Investment LRT $25.0High Investment LRT $22.8
Figure 4-3: Annual O&M Costs by Alternative: Light Rail
$20.0
$21.0
$22.0
$23.0
$24.0
$25.0
$26.0
$27.0
Low
Inve
stm
ent
LRT
Med
ium
Inve
stm
ent
LRT
Hig
hIn
vest
men
tLR
T
Total Incremental Cost Over No-Build - LRT Alternatives


Operating and Maintenance Cost Estimate Technical Report ● Page 5-1
5. Sensitivity Testing of Operating and Maintenance Costs Two areas of O&M costs have experienced higher-than-inflation increases in recent years: fuels, energy, and lubricants and the costs of employee fringe benefits due to increasing costs of health care. The changes in costs are shown in Table 5-1. For bus costs in fuels and lubricants, between 2000 and 2005, WMATA increased 127 percent, Montgomery County Transit increased 120 percent, and Maryland MTA increased by 111 percent. The utility costs for light rail, however, only increased 16 percent in the same time period, but this is with service volume decrease of 45 percent since 2000.
Fringe benefits have also increased between 2000 and 2005, although by varying degrees based on agency. Fringe benefits for WMATA increased 146 percent with less than a 13 percent increase in service volume, while Montgomery County Transit experienced a 79 percent increase in fringe benefit costs on a 30 percent increase in service volume. Expenditures on fringe benefits increased for MTA’s bus service by 37 percent, as against an increase in service volume of less than 13 percent. MTA’s light rail system saw its costs for fringe benefits increase 160 percent over the same period while service volume decreased by more than 45 percent.
Table 5-1: Increases in Fuel, Lubrication, and Labor Fringe Benefit Costs, 2000 to 2006, Compared to Service Volume Increase in Terms of Revenue
Vehicle Hours and Miles of Service
WMATA Metrobus
Montgomery County Transit MTA Bus MTA LRT
2000 $10,964,725 $2,434,886 $6,264,000 $2,056,0002005 $24,918,855 $5,359,772 $13,225,000 $2,384,000
Fuels and Lubricants Costs (all categories) Percent Change 127.3% 120.1% 111.1% 16.0%
2000 $45,650,077 $7,435,353, $47,180,000 $4,076,0002005 $112,371,454 $13,278,585 $64,680,000 $10,593,000
Labor Fringe Benefits (all categories) Percent Change 146.2% 78.6% 37.1% 159.9%
2000 $3,065,946 $583,291 $1,737,000 $172,0002005 $3,422,983, $931,216 $1,922,000 $90,000
Revenue Vehicle Hours of Service Percent Change 11.6% 59.6% 10.7% -47.7%
2000 $34,192,726 $9,822,388 $20,828,000 $2,736,0002005 $38,458,955 $12,729,004, $23,493,000 $1,494,000
Revenue Vehicles Miles of Service Percent Change 12.5% 29.6% 12.8% -45.4%
Combined Percentage Change (revenue vehicle hours and miles of
service) 12.4% 31.3% 12.6% -45.5%
Source: NTD, 2000 and 2005
The fully allocated O&M cost model allows for testing of the sensitivity of the cost estimates to extraordinary changes in any cost categories, including effects of extraordinary and superinflationary increases in energy and fringe benefit costs. Table 5-2 shows the level of expenditure and percent of total costs represented by fuel and fringe benefits.

Page 5-2 ● Operating and Maintenance Cost Estimate Technical Report
Table 5-2: Fuels, Fluids, and Fringe Benefits Cost and Percentage of Total Costs
2003-2005 Average
MTA Bus MTA LRT WMATA Montgomery County Transit
Fuel and Lubricants (all categories) – Annual Cost $10,132,703 $1,775,988
(utilities) $16,771,400 $4,415,030
Percent of Total Costs 4.8% 4.6% 3.8% 6.4% Fringe Benefits (all categories) – Annual Cost $68,732,245 $11,475,755 $121,750,614 $14,710,189
Percent of Total Costs 32.8% 29.5% 27.5% 215% Source: NTD 2003-2005
The cost of fuel and lubricants represents less than 4 percent of WMATA’s overall operating cost and 6.4 percent of Montgomery County Ride On’s overall operating cost.
For MTA bus fringe benefits are less than 5 percent of the operating cost, while the cost of utilities for the MTA Light Rail system likewise is under 5 percent of total cost (fuels and fluids are more significant for the Montgomery County system at 13 percent). This means that, for the bus and light rail systems, a 1 percent increase in fuel costs would translate to only a 0.04-0.06 percent increase in total operating costs amongst the agencies. It would take a 16 to 25 percent increase in fuel costs to represent a 1 percent increase in overall O&M costs. Predicting the future price of motor fuels, lubricants, and the effects of higher fuel prices on the cost of other elements of a bus operation, is difficult. However, it is important to note that while the trend in fuel prices in the past five years has been upward, the trend during most of the previous 20 years, when adjusting for inflation, had been generally down. The price of oil only recently (March 2008) reached the all-time inflation adjusted price peaks of the early 1980s.
Fringe benefits are a more significant portion of overall costs, representing between 21.5 and 32.8 percent of total costs depending on the agency. A 1 percent increase in fringe benefits costs would increase overall costs by 0.2–0.3 percent; or, about a 2–3 percent increase in fringe benefit prices would result in a 1 percent increase in overall costs. Medical care, the largest element of fringe benefits, has been rising at rates higher than inflation for many years and can be expected to continue to do so in the future, making it very likely that this important element of operating costs will increase at a rate higher than the background rate of inflation in the future.

Operating and Maintenance Cost Estimate Technical Report ● Page 6-1
6. References Federal Transit Administration, Procedures and Technical Methods for Transit Project
Planning: Review Draft, September 1986 and updates.
Federal Transit Administration, National Transit Database reports for FY 2003 through 2005.
US Bureau of Labor Statistics, Consumer Price Index Data for Baltimore Washington, D.C.-MD-VA-WV. Series Id: CUURA311SA0, CUUSA311SA0. Accessed November 2007.