appendix a: regionally significant fauna found on bimblebox
TRANSCRIPT
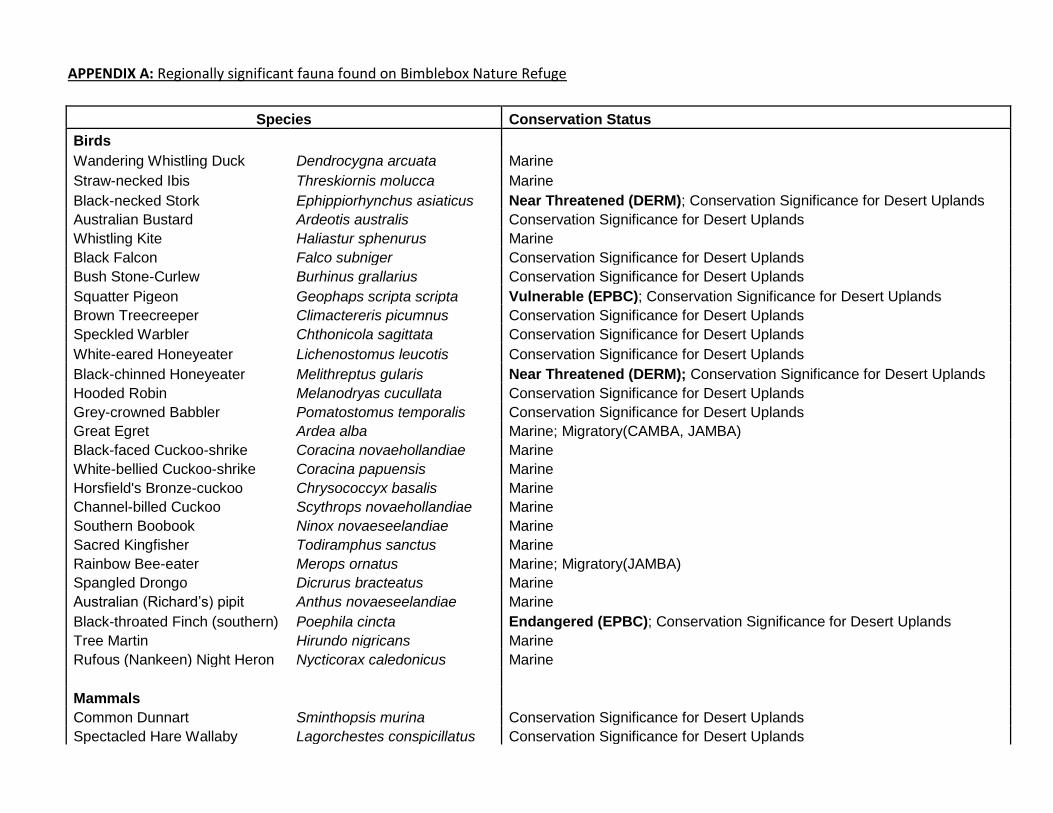
APPENDIX A: Regionally significant fauna found on Bimblebox Nature Refuge
Species Conservation Status
Birds
Wandering Whistling Duck Dendrocygna arcuata Marine
Straw-necked Ibis Threskiornis molucca Marine
Black-necked Stork Ephippiorhynchus asiaticus Near Threatened (DERM); Conservation Significance for Desert Uplands
Australian Bustard Ardeotis australis Conservation Significance for Desert Uplands
Whistling Kite Haliastur sphenurus Marine
Black Falcon Falco subniger Conservation Significance for Desert Uplands
Bush Stone-Curlew Burhinus grallarius Conservation Significance for Desert Uplands
Squatter Pigeon Geophaps scripta scripta Vulnerable (EPBC); Conservation Significance for Desert Uplands
Brown Treecreeper Climactereris picumnus Conservation Significance for Desert Uplands
Speckled Warbler Chthonicola sagittata Conservation Significance for Desert Uplands
White-eared Honeyeater Lichenostomus leucotis Conservation Significance for Desert Uplands
Black-chinned Honeyeater Melithreptus gularis Near Threatened (DERM); Conservation Significance for Desert Uplands
Hooded Robin Melanodryas cucullata Conservation Significance for Desert Uplands
Grey-crowned Babbler Pomatostomus temporalis Conservation Significance for Desert Uplands
Great Egret Ardea alba Marine; Migratory(CAMBA, JAMBA)
Black-faced Cuckoo-shrike Coracina novaehollandiae Marine
White-bellied Cuckoo-shrike Coracina papuensis Marine
Horsfield's Bronze-cuckoo Chrysococcyx basalis Marine
Channel-billed Cuckoo Scythrops novaehollandiae Marine
Southern Boobook Ninox novaeseelandiae Marine
Sacred Kingfisher Todiramphus sanctus Marine
Rainbow Bee-eater Merops ornatus Marine; Migratory(JAMBA)
Spangled Drongo Dicrurus bracteatus Marine
Australian (Richard’s) pipit Anthus novaeseelandiae Marine
Black-throated Finch (southern) Poephila cincta Endangered (EPBC); Conservation Significance for Desert Uplands
Tree Martin Hirundo nigricans Marine
Rufous (Nankeen) Night Heron Nycticorax caledonicus Marine
Mammals
Common Dunnart Sminthopsis murina Conservation Significance for Desert Uplands
Spectacled Hare Wallaby Lagorchestes conspicillatus Conservation Significance for Desert Uplands
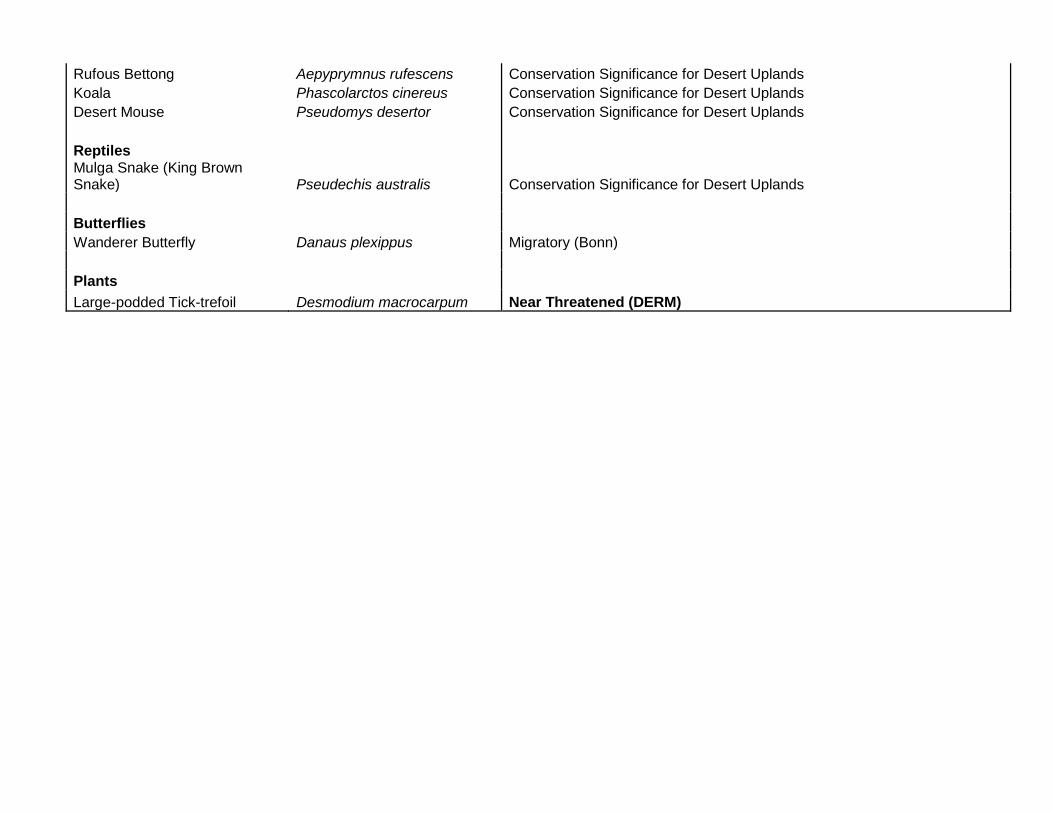
Rufous Bettong Aepyprymnus rufescens Conservation Significance for Desert Uplands
Koala Phascolarctos cinereus Conservation Significance for Desert Uplands
Desert Mouse Pseudomys desertor Conservation Significance for Desert Uplands
Reptiles Mulga Snake (King Brown Snake) Pseudechis australis Conservation Significance for Desert Uplands
Butterflies
Wanderer Butterfly Danaus plexippus Migratory (Bonn)
Plants
Large-podded Tick-trefoil Desmodium macrocarpum Near Threatened (DERM)
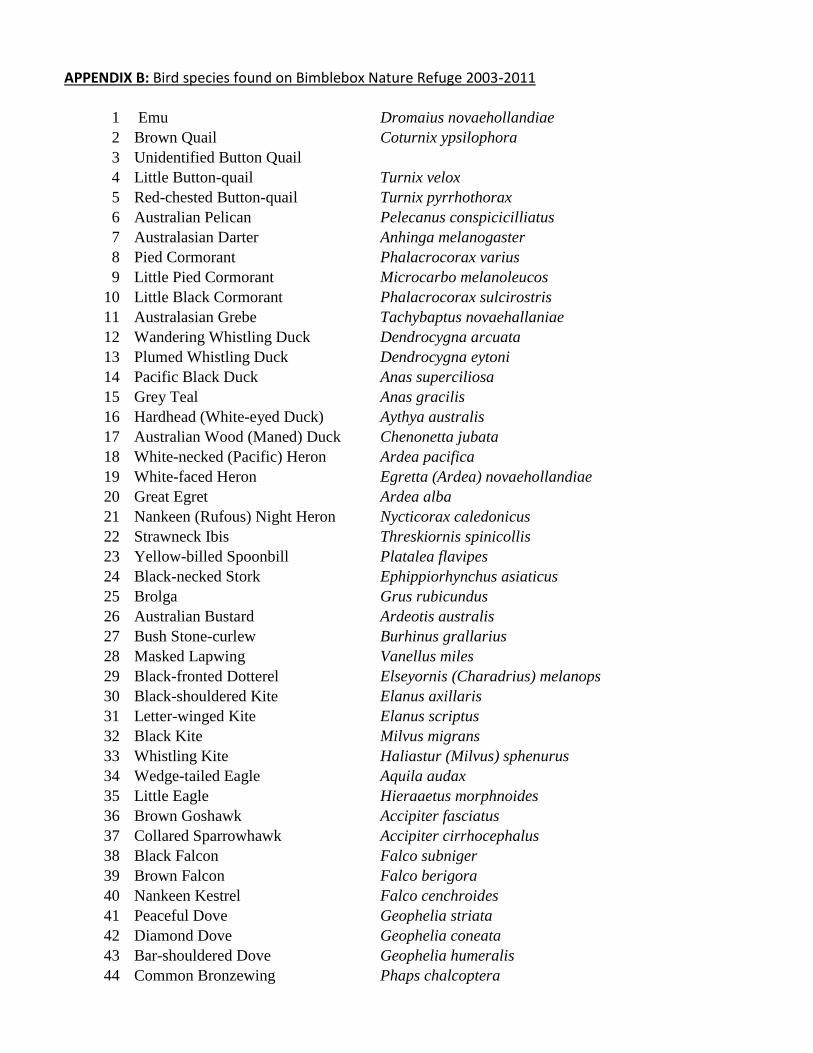
APPENDIX B: Bird species found on Bimblebox Nature Refuge 2003-2011
1 Emu Dromaius novaehollandiae
2 Brown Quail Coturnix ypsilophora
3 Unidentified Button Quail
4 Little Button-quail Turnix velox
5 Red-chested Button-quail Turnix pyrrhothorax
6 Australian Pelican Pelecanus conspicicilliatus
7 Australasian Darter Anhinga melanogaster
8 Pied Cormorant Phalacrocorax varius
9 Little Pied Cormorant Microcarbo melanoleucos
10 Little Black Cormorant Phalacrocorax sulcirostris
11 Australasian Grebe Tachybaptus novaehallaniae
12 Wandering Whistling Duck Dendrocygna arcuata
13 Plumed Whistling Duck Dendrocygna eytoni
14 Pacific Black Duck Anas superciliosa
15 Grey Teal Anas gracilis
16 Hardhead (White-eyed Duck) Aythya australis
17 Australian Wood (Maned) Duck Chenonetta jubata
18 White-necked (Pacific) Heron Ardea pacifica
19 White-faced Heron Egretta (Ardea) novaehollandiae
20 Great Egret Ardea alba
21 Nankeen (Rufous) Night Heron Nycticorax caledonicus
22 Strawneck Ibis Threskiornis spinicollis
23 Yellow-billed Spoonbill Platalea flavipes
24 Black-necked Stork Ephippiorhynchus asiaticus
25 Brolga Grus rubicundus
26 Australian Bustard Ardeotis australis
27 Bush Stone-curlew Burhinus grallarius
28 Masked Lapwing Vanellus miles
29 Black-fronted Dotterel Elseyornis (Charadrius) melanops
30 Black-shouldered Kite Elanus axillaris
31 Letter-winged Kite Elanus scriptus
32 Black Kite Milvus migrans
33 Whistling Kite Haliastur (Milvus) sphenurus
34 Wedge-tailed Eagle Aquila audax
35 Little Eagle Hieraaetus morphnoides
36 Brown Goshawk Accipiter fasciatus
37 Collared Sparrowhawk Accipiter cirrhocephalus
38 Black Falcon Falco subniger
39 Brown Falcon Falco berigora
40 Nankeen Kestrel Falco cenchroides
41 Peaceful Dove Geophelia striata
42 Diamond Dove Geophelia coneata
43 Bar-shouldered Dove Geophelia humeralis
44 Common Bronzewing Phaps chalcoptera
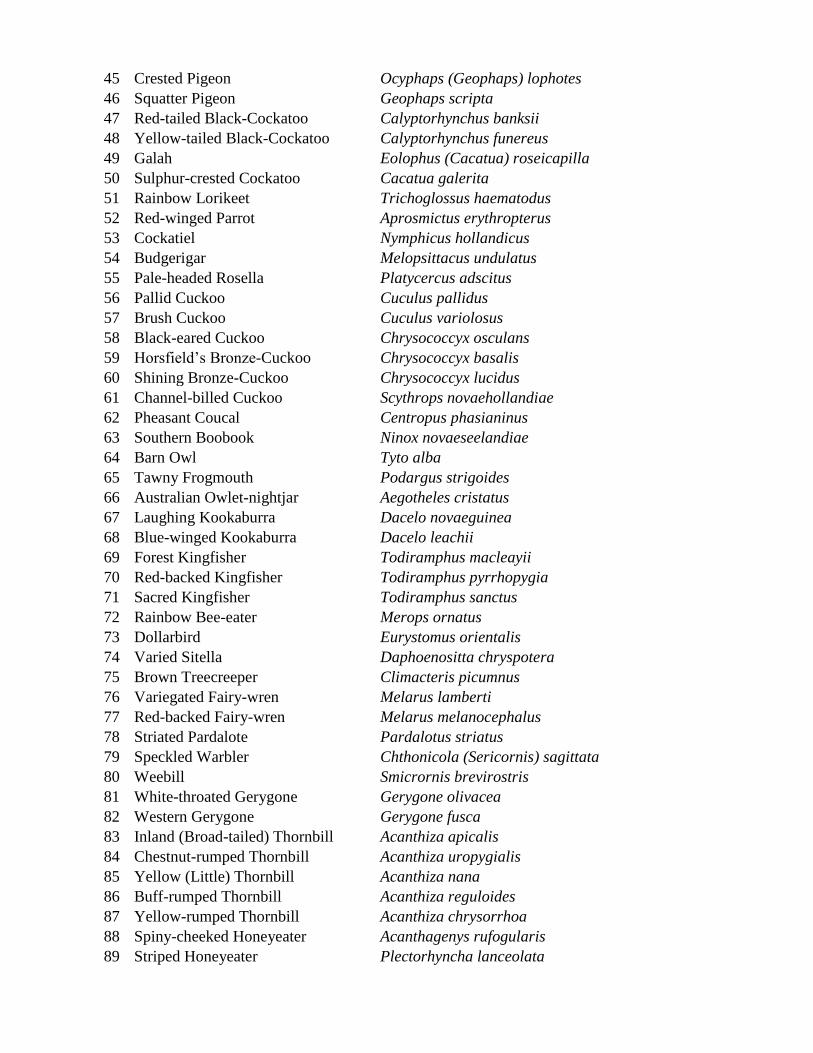
45 Crested Pigeon Ocyphaps (Geophaps) lophotes
46 Squatter Pigeon Geophaps scripta
47 Red-tailed Black-Cockatoo Calyptorhynchus banksii
48 Yellow-tailed Black-Cockatoo Calyptorhynchus funereus
49 Galah Eolophus (Cacatua) roseicapilla
50 Sulphur-crested Cockatoo Cacatua galerita
51 Rainbow Lorikeet Trichoglossus haematodus
52 Red-winged Parrot Aprosmictus erythropterus
53 Cockatiel Nymphicus hollandicus
54 Budgerigar Melopsittacus undulatus
55 Pale-headed Rosella Platycercus adscitus
56 Pallid Cuckoo Cuculus pallidus
57 Brush Cuckoo Cuculus variolosus
58 Black-eared Cuckoo Chrysococcyx osculans
59 Horsfield’s Bronze-Cuckoo Chrysococcyx basalis
60 Shining Bronze-Cuckoo Chrysococcyx lucidus
61 Channel-billed Cuckoo Scythrops novaehollandiae
62 Pheasant Coucal Centropus phasianinus
63 Southern Boobook Ninox novaeseelandiae
64 Barn Owl Tyto alba
65 Tawny Frogmouth Podargus strigoides
66 Australian Owlet-nightjar Aegotheles cristatus
67 Laughing Kookaburra Dacelo novaeguinea
68 Blue-winged Kookaburra Dacelo leachii
69 Forest Kingfisher Todiramphus macleayii
70 Red-backed Kingfisher Todiramphus pyrrhopygia
71 Sacred Kingfisher Todiramphus sanctus
72 Rainbow Bee-eater Merops ornatus
73 Dollarbird Eurystomus orientalis
74 Varied Sitella Daphoenositta chryspotera
75 Brown Treecreeper Climacteris picumnus
76 Variegated Fairy-wren Melarus lamberti
77 Red-backed Fairy-wren Melarus melanocephalus
78 Striated Pardalote Pardalotus striatus
79 Speckled Warbler Chthonicola (Sericornis) sagittata
80 Weebill Smicrornis brevirostris
81 White-throated Gerygone Gerygone olivacea
82 Western Gerygone Gerygone fusca
83 Inland (Broad-tailed) Thornbill Acanthiza apicalis
84 Chestnut-rumped Thornbill Acanthiza uropygialis
85 Yellow (Little) Thornbill Acanthiza nana
86 Buff-rumped Thornbill Acanthiza reguloides
87 Yellow-rumped Thornbill Acanthiza chrysorrhoa
88 Spiny-cheeked Honeyeater Acanthagenys rufogularis
89 Striped Honeyeater Plectorhyncha lanceolata

90 Noisy Friarbird Philemon corniculatus
91 Little Friarbird Philemon citreogularis
92 Blue-faced Honeyeater Entomyzon cyanotis
93 Noisy Miner Manorina melanocephala
94 Yellow-throated Miner Manorina flavigula
95 Singing Honeyeater Lichenostomus virescens
96 White-eared Honeyeater Lichenostomus leucotis
97 Fuscous Honeyeater Lichenostomus fuscus
98 Grey-fronted Honeyeater Lichenostomus plumulus
99 White-plumed Honeyeater Lichenostomus penicillatus
100 Black-chinned Honeyeater Melithreptus gularis
101 Brown Honeyeater Lichmera indistincta
102 Grey-crowned Babbler Pomatostomus temporalis
103 Red-capped Robin Petroica goodenovii
104 Hooded robin Melanodryus cucullata
105 Jacky winter Microeca fascinans (leucophaea)
106 Crested Bellbird Oreoica gutturalis
107 Grey Shrike-Thrush Colluricincla harmonica
108 Golden Whistler Pachycephala pectoralis
109 Rufous Whistler Pachycephala rufiventris
110 Grey Fantail Rhipidura fuliginosa
111 Willie Wagtail Rhipidura leucophrys
112 Leaden Flycatcher Myiagra rubecula
113 Restless Flycatcher Myiagra inquieta
114 Magpie-Lark Grallina cyanoleuca
115 Spangled Drongo Dicrurus bracteaus
116 Olive-backed Oriole Oriolus sagittatus
117 Figbird Specotheres viridis
118 Spotted Bowerbird Chlamydera maculata
119 Black-faced Cuckoo-shrike Coracina novaehollandiae
120 White-bellied Cuckoo-shrike Coracina papuensis
121 Ground Cuckoo-shrike Coracina maxima
122 White-winged Triller Lalage sueurii
123 Masked Woodswallow Artamus personatus
124 White-browed Woodswallow Artamus superciliosus
125 Black-faced Woodswallow Artamus cinereus
126 Dusky Woodswallow Artamus cyanopterus
127 Little Woodswallow Artamus minor
128 Grey Butcherbird Cracticus torquatus
129 Pied Butcherbird Cracticus nigrogularis
130 Australian Magpie Gymnorhina tibicen
131 Pied Currawong Stepera graculina
132 Australian Raven Corvus coronoides
133 Torresian Crow Corvus orru
134 Apostlebird Struthidea cinerea

135 Tree Martin Hirundo nigricans
136 Fairy Martin Hirundo ariel
137 Australian (Richard’s) Pipit Anthus novaeseelandiae
138 Horsfield’s Bushlark Mirafra javanica
139 Rufous Songlark Cincloramphus mathewsii
140 Brown Songlark Cincloramphus cruralis
141 Double-barred Finch Taeniopygia bichenovii
142 Zebra Finch Taeniopygia guttata
143 Black-throated Finch Poephila cincta cincta
144 Plum-headed Finch Neochmia modesta
145 Mistletoebird Dicaeum hirundinaceum

APPENDIX C: Climate change impacts on flora and fauna1
1 Biodiversity and Climate Change Expert Advisory Group (Steffen, W. et al), 2009, Australia’s Biodiversity and Climate Change: A strategic assessment of the vulnerability of Australia’s biodiversity to climate change, Commonwealth of Australia, pp.90-91. Available at http://www.climatechange.gov.au/publications/biodiversity/biodiversity-climatechange.aspx (accessed 30.11.11).
APPENDIX D: Summary of Research undertaken on Bimblebox Nature Refuge (Glen Innes)
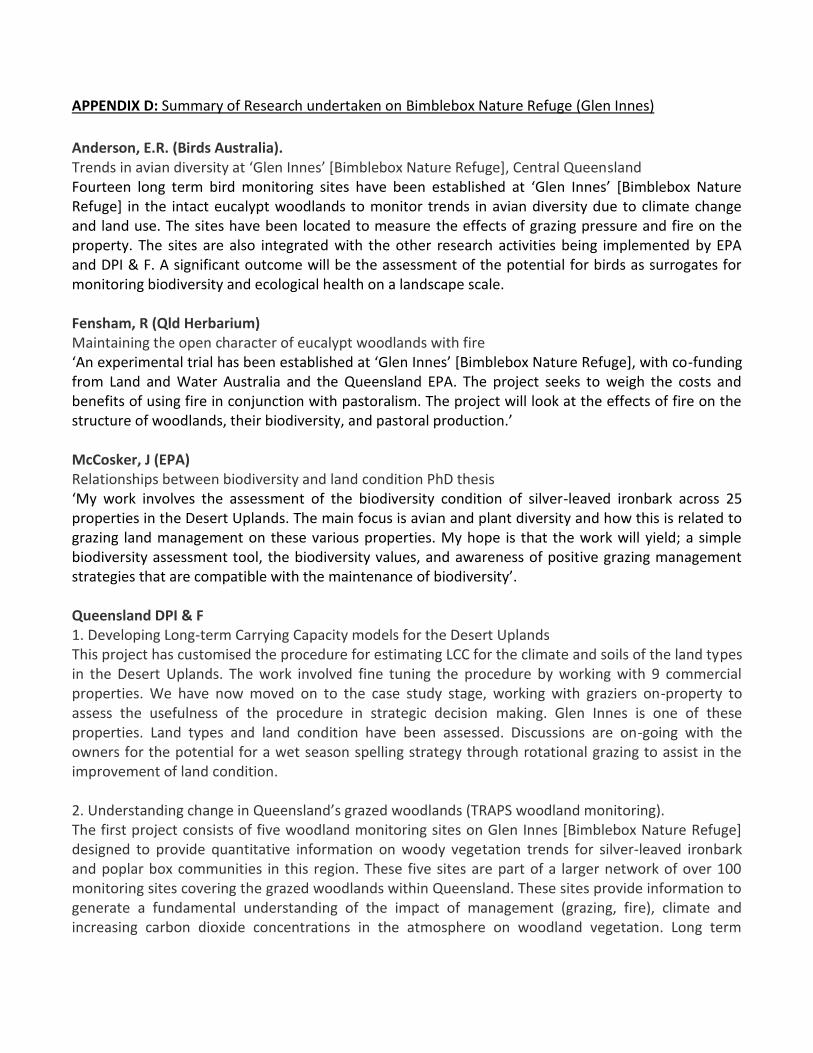
Anderson, E.R. (Birds Australia). Trends in avian diversity at ‘Glen Innes’ *Bimblebox Nature Refuge+, Central Queensland Fourteen long term bird monitoring sites have been established at ‘Glen Innes’ *Bimblebox Nature Refuge] in the intact eucalypt woodlands to monitor trends in avian diversity due to climate change and land use. The sites have been located to measure the effects of grazing pressure and fire on the property. The sites are also integrated with the other research activities being implemented by EPA and DPI & F. A significant outcome will be the assessment of the potential for birds as surrogates for monitoring biodiversity and ecological health on a landscape scale. Fensham, R (Qld Herbarium) Maintaining the open character of eucalypt woodlands with fire ‘An experimental trial has been established at ‘Glen Innes’ *Bimblebox Nature Refuge+, with co-funding from Land and Water Australia and the Queensland EPA. The project seeks to weigh the costs and benefits of using fire in conjunction with pastoralism. The project will look at the effects of fire on the structure of woodlands, their biodiversity, and pastoral production.’ McCosker, J (EPA) Relationships between biodiversity and land condition PhD thesis ‘My work involves the assessment of the biodiversity condition of silver-leaved ironbark across 25 properties in the Desert Uplands. The main focus is avian and plant diversity and how this is related to grazing land management on these various properties. My hope is that the work will yield; a simple biodiversity assessment tool, the biodiversity values, and awareness of positive grazing management strategies that are compatible with the maintenance of biodiversity’. Queensland DPI & F 1. Developing Long-term Carrying Capacity models for the Desert Uplands This project has customised the procedure for estimating LCC for the climate and soils of the land types in the Desert Uplands. The work involved fine tuning the procedure by working with 9 commercial properties. We have now moved on to the case study stage, working with graziers on-property to assess the usefulness of the procedure in strategic decision making. Glen Innes is one of these properties. Land types and land condition have been assessed. Discussions are on-going with the owners for the potential for a wet season spelling strategy through rotational grazing to assist in the improvement of land condition. 2. Understanding change in Queensland’s grazed woodlands (TRAPS woodland monitoring). The first project consists of five woodland monitoring sites on Glen Innes [Bimblebox Nature Refuge] designed to provide quantitative information on woody vegetation trends for silver-leaved ironbark and poplar box communities in this region. These five sites are part of a larger network of over 100 monitoring sites covering the grazed woodlands within Queensland. These sites provide information to generate a fundamental understanding of the impact of management (grazing, fire), climate and increasing carbon dioxide concentrations in the atmosphere on woodland vegetation. Long term
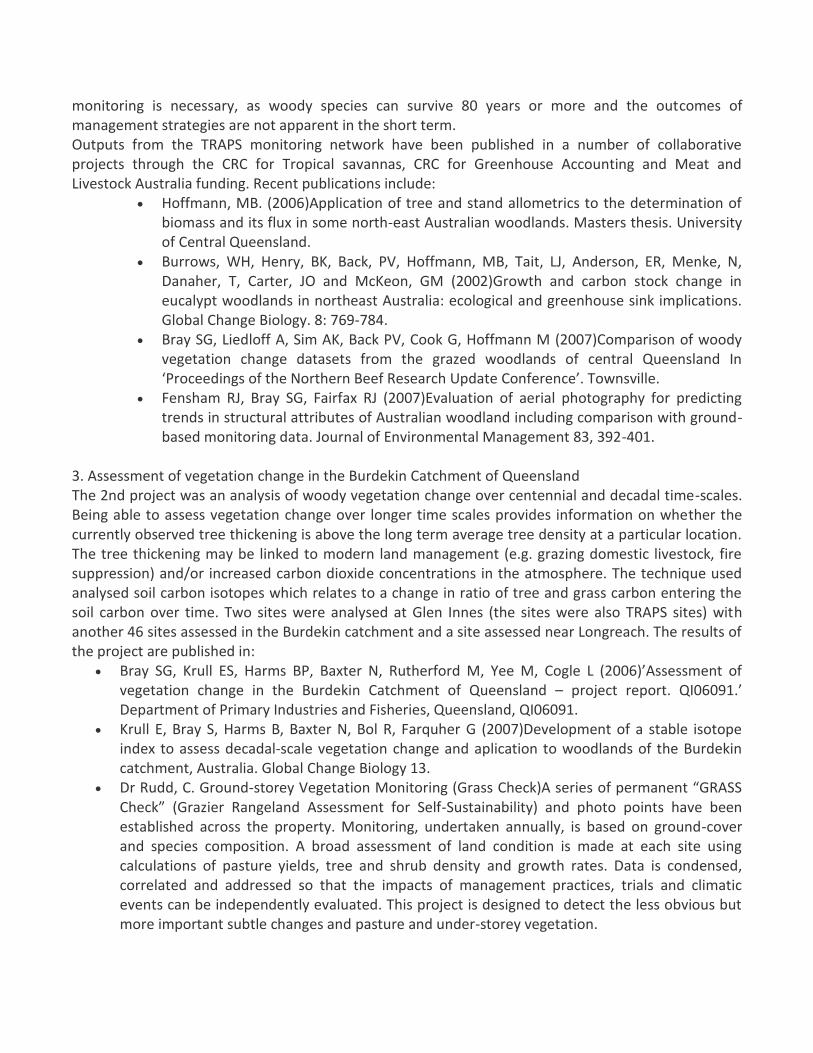
monitoring is necessary, as woody species can survive 80 years or more and the outcomes of management strategies are not apparent in the short term. Outputs from the TRAPS monitoring network have been published in a number of collaborative projects through the CRC for Tropical savannas, CRC for Greenhouse Accounting and Meat and Livestock Australia funding. Recent publications include:
Hoffmann, MB. (2006)Application of tree and stand allometrics to the determination of biomass and its flux in some north-east Australian woodlands. Masters thesis. University of Central Queensland.
Burrows, WH, Henry, BK, Back, PV, Hoffmann, MB, Tait, LJ, Anderson, ER, Menke, N, Danaher, T, Carter, JO and McKeon, GM (2002)Growth and carbon stock change in eucalypt woodlands in northeast Australia: ecological and greenhouse sink implications. Global Change Biology. 8: 769-784.
Bray SG, Liedloff A, Sim AK, Back PV, Cook G, Hoffmann M (2007)Comparison of woody vegetation change datasets from the grazed woodlands of central Queensland In ‘Proceedings of the Northern Beef Research Update Conference’. Townsville.
Fensham RJ, Bray SG, Fairfax RJ (2007)Evaluation of aerial photography for predicting trends in structural attributes of Australian woodland including comparison with ground-based monitoring data. Journal of Environmental Management 83, 392-401.
3. Assessment of vegetation change in the Burdekin Catchment of Queensland The 2nd project was an analysis of woody vegetation change over centennial and decadal time-scales. Being able to assess vegetation change over longer time scales provides information on whether the currently observed tree thickening is above the long term average tree density at a particular location. The tree thickening may be linked to modern land management (e.g. grazing domestic livestock, fire suppression) and/or increased carbon dioxide concentrations in the atmosphere. The technique used analysed soil carbon isotopes which relates to a change in ratio of tree and grass carbon entering the soil carbon over time. Two sites were analysed at Glen Innes (the sites were also TRAPS sites) with another 46 sites assessed in the Burdekin catchment and a site assessed near Longreach. The results of the project are published in:
Bray SG, Krull ES, Harms BP, Baxter N, Rutherford M, Yee M, Cogle L (2006)’Assessment of vegetation change in the Burdekin Catchment of Queensland – project report. QI06091.’ Department of Primary Industries and Fisheries, Queensland, QI06091.
Krull E, Bray S, Harms B, Baxter N, Bol R, Farquher G (2007)Development of a stable isotope index to assess decadal-scale vegetation change and aplication to woodlands of the Burdekin catchment, Australia. Global Change Biology 13.
Dr Rudd, C. Ground-storey Vegetation Monitoring (Grass Check)A series of permanent “GRASS Check” (Grazier Rangeland Assessment for Self-Sustainability) and photo points have been established across the property. Monitoring, undertaken annually, is based on ground-cover and species composition. A broad assessment of land condition is made at each site using calculations of pasture yields, tree and shrub density and growth rates. Data is condensed, correlated and addressed so that the impacts of management practices, trials and climatic events can be independently evaluated. This project is designed to detect the less obvious but more important subtle changes and pasture and under-storey vegetation.
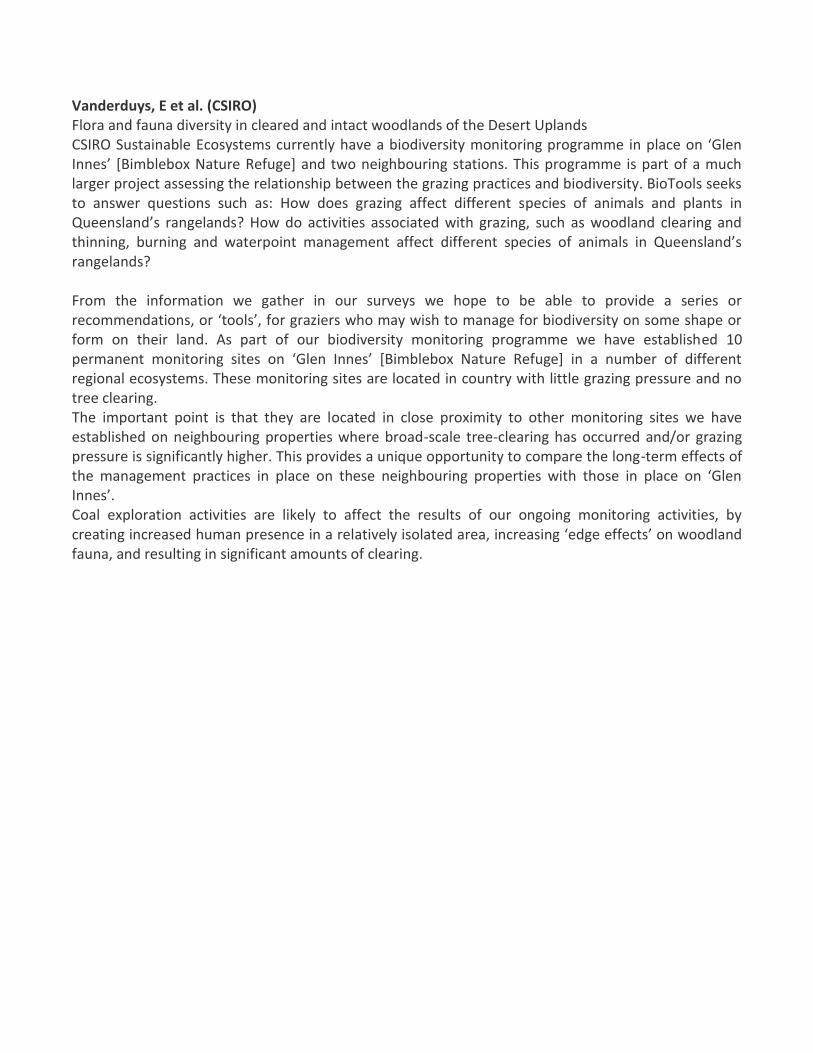
Vanderduys, E et al. (CSIRO) Flora and fauna diversity in cleared and intact woodlands of the Desert Uplands CSIRO Sustainable Ecosystems currently have a biodiversity monitoring programme in place on ‘Glen Innes’ *Bimblebox Nature Refuge] and two neighbouring stations. This programme is part of a much larger project assessing the relationship between the grazing practices and biodiversity. BioTools seeks to answer questions such as: How does grazing affect different species of animals and plants in Queensland’s rangelands? How do activities associated with grazing, such as woodland clearing and thinning, burning and waterpoint management affect different species of animals in Queensland’s rangelands? From the information we gather in our surveys we hope to be able to provide a series or recommendations, or ‘tools’, for graziers who may wish to manage for biodiversity on some shape or form on their land. As part of our biodiversity monitoring programme we have established 10 permanent monitoring sites on ‘Glen Innes’ *Bimblebox Nature Refuge+ in a number of different regional ecosystems. These monitoring sites are located in country with little grazing pressure and no tree clearing. The important point is that they are located in close proximity to other monitoring sites we have established on neighbouring properties where broad-scale tree-clearing has occurred and/or grazing pressure is significantly higher. This provides a unique opportunity to compare the long-term effects of the management practices in place on these neighbouring properties with those in place on ‘Glen Innes’. Coal exploration activities are likely to affect the results of our ongoing monitoring activities, by creating increased human presence in a relatively isolated area, increasing ‘edge effects’ on woodland fauna, and resulting in significant amounts of clearing.

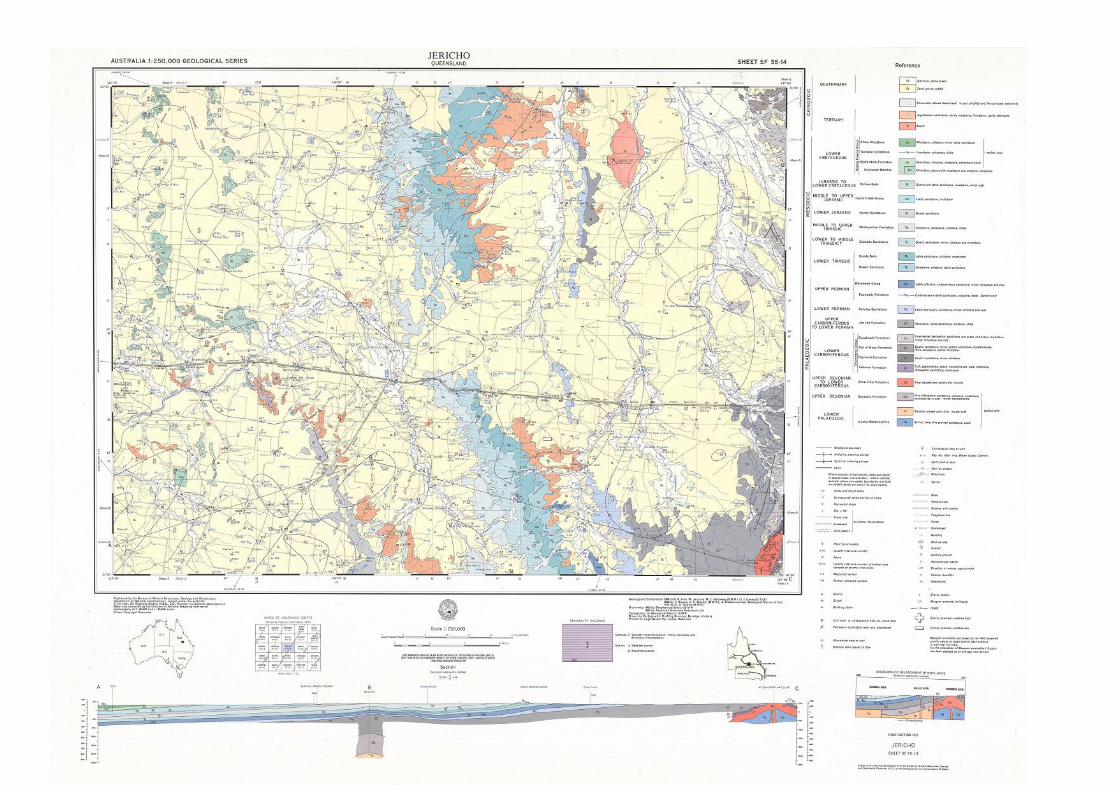
APPENDIX E: 1:250 000 Geological Map of Jericho Queensland2
2 Bureau of Mineral Resources, Geology and Geophysics 1972, ‘Jericho Queensland, Sheet SF 55-14’, Department of National
Development. Available from http://www.geoscience.gov.au/bin/mapserv36?map=/public/http/www/geoportal/250/index.map&mode=browse&layer=map250&queryon=true

APPENDIX F: Review of Economic Impact Assessment (Economists at Large)
Review of Economic Impact Assessment for the China First Project EIS
Prepared by
Economists at Large Pty Ltd
December 2011
Economists at Large 3
Report prepared by:
Economists at Large Pty Ltd Melbourne, Australia www.ecolarge.com [email protected]
Phone: +61 3 9005 0154 | Fax: +61 3 8080 1604 98 Gertrude St, Fitzroy VIC 3065, Melbourne, Australia
Citation:
Campbell, R., 2011, Review of Economic Impact Assessment for the China First Project EIS, a report
for the Bimblebox Nature Refuge Landholders, prepared by Economists at Large, Melbourne,
Australia.
Disclaimer:
The views expressed in this report are those of the authors and may not in any circumstances be
regarded as stating an official position of the organisations involved.
This report is distributed with the understanding that the authors are not responsible for the results
of any actions undertaken on the basis of the information that is contained within, nor for any
omission from, or error in, this publication.
Economists at Large 4
Contents
Introduction ..................................................................................................................... 5
Background .............................................................................................................................. 5
This submission ........................................................................................................................ 5
Review of Key findings of the Economic Impact Assessment ............................................. 7
Lack of Cost-Benefit Analysis .......................................................................................... 13
Conclusion ...................................................................................................................... 14
References ..................................................................................................................... 15
Economists at Large 5
Introduction
Background
The proposed China First Coal Project is for an open-cut and underground mine on pastoral land and
remnant woodland in the Galilee Basin, Central Queensland. The proposal is for a 20-plus-year
mine which will produce up to 40megatonnes of thermal coal per year. The proponent is currently
seeking project approval and has prepared an environmental impact statement.
The China First Project is one of several mining proposals in this traditionally pastoral area. The
Bimblebox Nature Refuge landholders are concerned that the proposed projects will substantially
affect the Bimblebox Nature Refuge, as well as impact on water and the community in the local area.
Many communities in Australia are facing similar issues and are concerned that the often-touted
benefits of the mining boom may be overstated and/or not accruing to local people.
This submission
The Bimblebox Nature Refuge landholders are making a submission on the China First Coal Project Environmental Impact Statement. As part of their submission they have asked Economists at Large to review the Economic Impact Assessment. In this submission:
Part 1: We have reviewed all the key findings of the Economic Impact Assessment and have found that there are few unambiguous benefits to this project. The impacts of the project, as identified in the assessment, relate to trade-offs between industries and regions, rather than clear benefits.
No part of the economic assessment supports a claim in the EIS executive summary that the project will lead to “an additional 70,000 indirect jobs”. This claim seems to be based on a misunderstanding of a finding of the economic impact assessment and should be immediately corrected.
Part 2: Part of the reason for this ambiguity about the overall costs and benefits of the project relates to the nature of the assessment – it is based on economic impact assessment, not cost-benefit analysis. The entire economics profession, and the Queensland Department of Infrastructure and Planning, is in agreement that cost-benefit analysis is the best tool for decision making and project assessment.
Another issue to bear in mind throughout our report, is that while this assessment reviews the impacts of the project in isolation, many other large coal projects are being proposed in the same region. This is likely to exacerbate negative impacts associated with skilled labour shortages, exchange rate rises and inequitable distribution of benefits.
These problems are symptomatic of a wider planning issue in Australia: the project assessment
process has become the project approvals process. The implicit assumption of this difference is that
projects are in the public interest or “good for the economy”. As we see here, not only are the
benefits of the project ambiguous, but the question of is it in the public interest is not addressed.
We believe this issue is at the core of the public perception that mining projects are lacking a “social
licence to operate” in farming areas. Conflicts between farming communities and coal and coal
seam gas developments are making headlines regularly, with farmers and the broader community

Economists at Large 6
losing confidence that such developments are in the community’s best interests. Robust and
transparent assessment of this project could help to address this issue.
Economists at Large 7
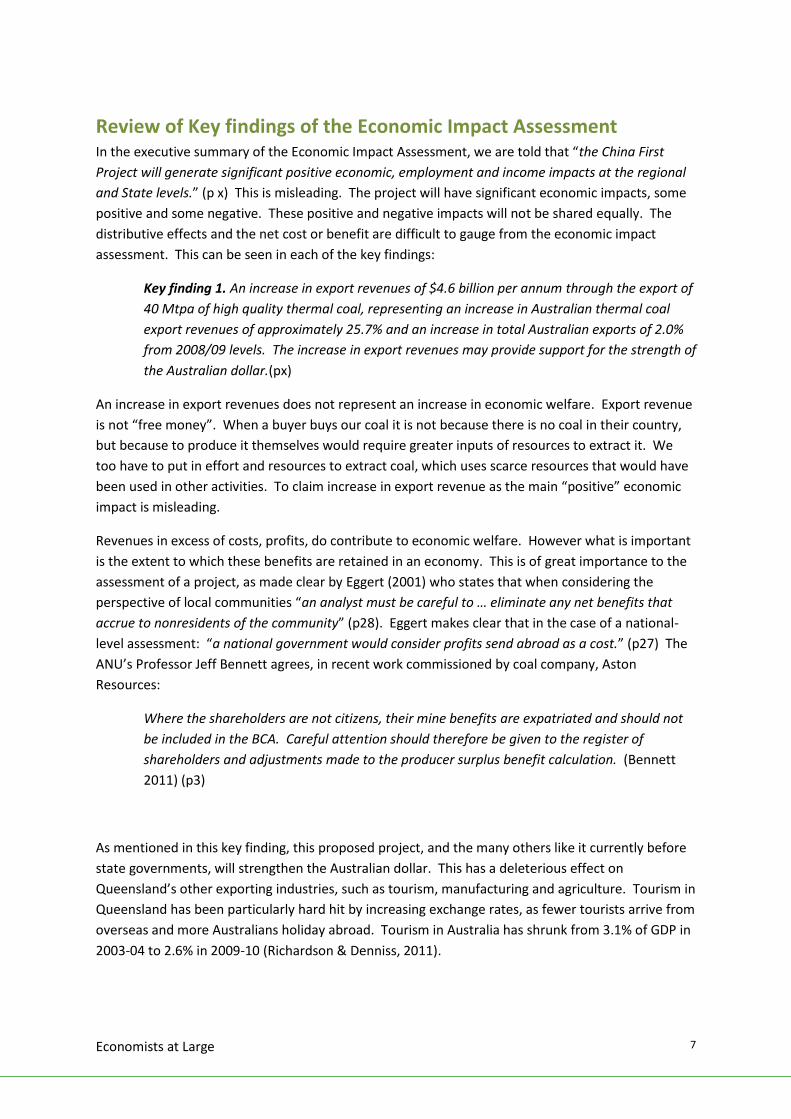
Review of Key findings of the Economic Impact Assessment In the executive summary of the Economic Impact Assessment, we are told that “the China First
Project will generate significant positive economic, employment and income impacts at the regional
and State levels.” (p x) This is misleading. The project will have significant economic impacts, some
positive and some negative. These positive and negative impacts will not be shared equally. The
distributive effects and the net cost or benefit are difficult to gauge from the economic impact
assessment. This can be seen in each of the key findings:
Key finding 1. An increase in export revenues of $4.6 billion per annum through the export of
40 Mtpa of high quality thermal coal, representing an increase in Australian thermal coal
export revenues of approximately 25.7% and an increase in total Australian exports of 2.0%
from 2008/09 levels. The increase in export revenues may provide support for the strength of
the Australian dollar.(px)
An increase in export revenues does not represent an increase in economic welfare. Export revenue
is not “free money”. When a buyer buys our coal it is not because there is no coal in their country,
but because to produce it themselves would require greater inputs of resources to extract it. We
too have to put in effort and resources to extract coal, which uses scarce resources that would have
been used in other activities. To claim increase in export revenue as the main “positive” economic
impact is misleading.
Revenues in excess of costs, profits, do contribute to economic welfare. However what is important
is the extent to which these benefits are retained in an economy. This is of great importance to the
assessment of a project, as made clear by Eggert (2001) who states that when considering the
perspective of local communities “an analyst must be careful to … eliminate any net benefits that
accrue to nonresidents of the community” (p28). Eggert makes clear that in the case of a national-
level assessment: “a national government would consider profits send abroad as a cost.” (p27) The
ANU’s Professor Jeff Bennett agrees, in recent work commissioned by coal company, Aston
Resources:
Where the shareholders are not citizens, their mine benefits are expatriated and should not
be included in the BCA. Careful attention should therefore be given to the register of
shareholders and adjustments made to the producer surplus benefit calculation. (Bennett
2011) (p3)
As mentioned in this key finding, this proposed project, and the many others like it currently before
state governments, will strengthen the Australian dollar. This has a deleterious effect on
Queensland’s other exporting industries, such as tourism, manufacturing and agriculture. Tourism in
Queensland has been particularly hard hit by increasing exchange rates, as fewer tourists arrive from
overseas and more Australians holiday abroad. Tourism in Australia has shrunk from 3.1% of GDP in
2003-04 to 2.6% in 2009-10 (Richardson & Denniss, 2011).
Economists at Large 8
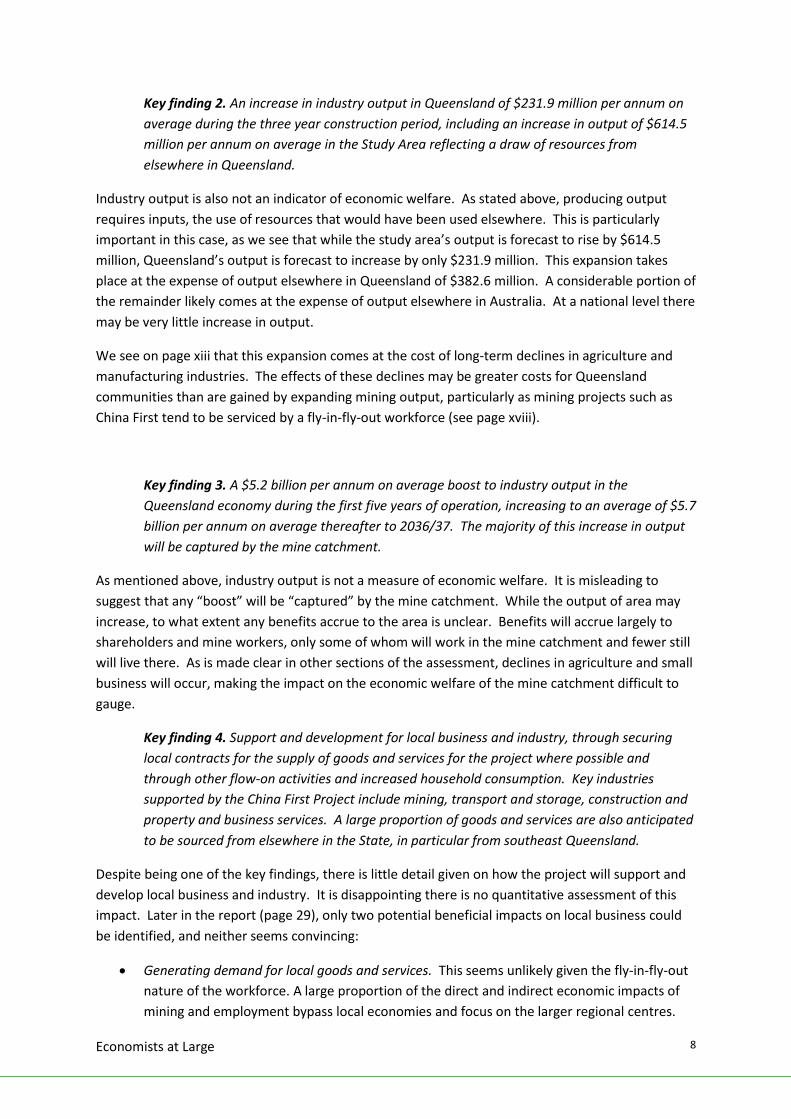
Key finding 2. An increase in industry output in Queensland of $231.9 million per annum on
average during the three year construction period, including an increase in output of $614.5
million per annum on average in the Study Area reflecting a draw of resources from
elsewhere in Queensland.
Industry output is also not an indicator of economic welfare. As stated above, producing output
requires inputs, the use of resources that would have been used elsewhere. This is particularly
important in this case, as we see that while the study area’s output is forecast to rise by $614.5
million, Queensland’s output is forecast to increase by only $231.9 million. This expansion takes
place at the expense of output elsewhere in Queensland of $382.6 million. A considerable portion of
the remainder likely comes at the expense of output elsewhere in Australia. At a national level there
may be very little increase in output.
We see on page xiii that this expansion comes at the cost of long-term declines in agriculture and
manufacturing industries. The effects of these declines may be greater costs for Queensland
communities than are gained by expanding mining output, particularly as mining projects such as
China First tend to be serviced by a fly-in-fly-out workforce (see page xviii).
Key finding 3. A $5.2 billion per annum on average boost to industry output in the
Queensland economy during the first five years of operation, increasing to an average of $5.7
billion per annum on average thereafter to 2036/37. The majority of this increase in output
will be captured by the mine catchment.
As mentioned above, industry output is not a measure of economic welfare. It is misleading to
suggest that any “boost” will be “captured” by the mine catchment. While the output of area may
increase, to what extent any benefits accrue to the area is unclear. Benefits will accrue largely to
shareholders and mine workers, only some of whom will work in the mine catchment and fewer still
will live there. As is made clear in other sections of the assessment, declines in agriculture and small
business will occur, making the impact on the economic welfare of the mine catchment difficult to
gauge.
Key finding 4. Support and development for local business and industry, through securing
local contracts for the supply of goods and services for the project where possible and
through other flow-on activities and increased household consumption. Key industries
supported by the China First Project include mining, transport and storage, construction and
property and business services. A large proportion of goods and services are also anticipated
to be sourced from elsewhere in the State, in particular from southeast Queensland.
Despite being one of the key findings, there is little detail given on how the project will support and
develop local business and industry. It is disappointing there is no quantitative assessment of this
impact. Later in the report (page 29), only two potential beneficial impacts on local business could
be identified, and neither seems convincing:
Generating demand for local goods and services. This seems unlikely given the fly-in-fly-out
nature of the workforce. A large proportion of the direct and indirect economic impacts of
mining and employment bypass local economies and focus on the larger regional centres.

Economists at Large 9
Such workforces generally get supplies and services from larger metropolitan centres
(McHugh, 2009).
New rail infrastructure has the potential to assist in easing bottlenecks in the existing rail
network....recognised as a common issue by coal companies [which has a negative] impact
on Queensland’s coal export capacity. While there may be a need for infrastructure
improvement in the region is uncertain how this development will assist any industry other
than the coal industry. What benefits this development would provide to agriculture or
tourism remains unclear, while enhancing export capacity of coal has negative implications
to these industries through exchange rate movements and resource crowding out.
Key finding 5.Increased competition for inputs such as land, labour and capital will result in
resources moving to regions and industries that generate the greatest returns. As a result,
output from the manufacturing and agricultural industries is estimated to decrease, largely
due to increased competition for skilled labour.
Some of these impacts are quantified in the assessment (page xiii).
Industry Forecast decline in annual output to 2012-13
Forecast decline in annual output to 2018
Forecast decline in annual output to 2037
Agriculture ($M) -42.0 -38.0 -15.2
Manufacturing ($M) -209.3 -1,249.4 -1,050.8
Local residents already understand what this feels like in real terms, as a recent email shows:
Was talking to a local grazier a couple of days ago (15mins out of Springsure) who hasn’t
been able to get an electrician in to fix his pump from the floods at the beginning of the year.
He is now organising to fly in an electrician from Brisbane! Similarly Ergon Energy are losing
electricians to the mines at an alarming rate and there is talk that they will have to offer
much better conditions and pay in order to retain them. The outcome being higher costs to
Ergon and hence to us. (personal communication)
Key finding 6. An increase in employment in Queensland of 2,975 full time equivalent (FTE)
employees per annum on average during the three years construction period, including a
draw of labour to the Study Area from elsewhere in Queensland and Australia. During the
first five years of operation the China First Project is estimated to support an additional 4,464
FTE employment positions per annum on average in Queensland, and approximately 3,954
FTE employment positions per annum on average thereafter.
Key finding 8.A decrease in unemployment and the unemployment rate as a result of jobs
created by the China First Project, in particular in the project’s Study Area.
Economists at Large 10
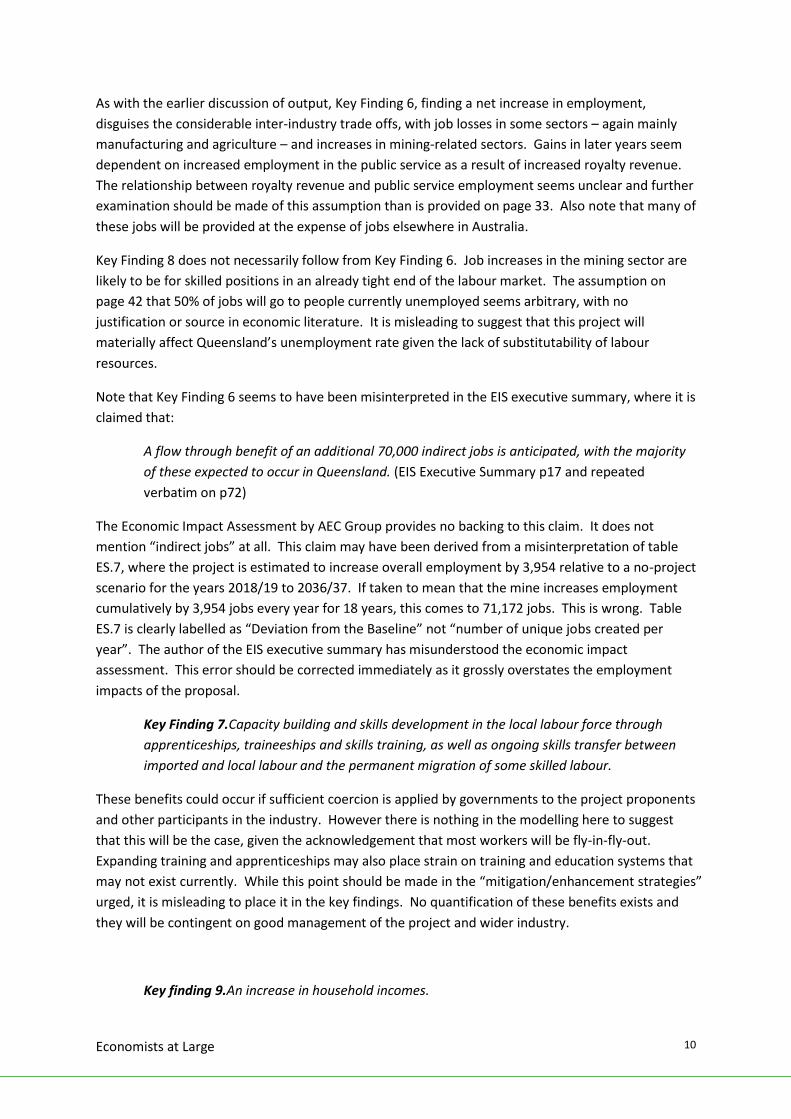
As with the earlier discussion of output, Key Finding 6, finding a net increase in employment,
disguises the considerable inter-industry trade offs, with job losses in some sectors – again mainly
manufacturing and agriculture – and increases in mining-related sectors. Gains in later years seem
dependent on increased employment in the public service as a result of increased royalty revenue.
The relationship between royalty revenue and public service employment seems unclear and further
examination should be made of this assumption than is provided on page 33. Also note that many of
these jobs will be provided at the expense of jobs elsewhere in Australia.
Key Finding 8 does not necessarily follow from Key Finding 6. Job increases in the mining sector are
likely to be for skilled positions in an already tight end of the labour market. The assumption on
page 42 that 50% of jobs will go to people currently unemployed seems arbitrary, with no
justification or source in economic literature. It is misleading to suggest that this project will
materially affect Queensland’s unemployment rate given the lack of substitutability of labour
resources.
Note that Key Finding 6 seems to have been misinterpreted in the EIS executive summary, where it is
claimed that:
A flow through benefit of an additional 70,000 indirect jobs is anticipated, with the majority
of these expected to occur in Queensland. (EIS Executive Summary p17 and repeated
verbatim on p72)
The Economic Impact Assessment by AEC Group provides no backing to this claim. It does not
mention “indirect jobs” at all. This claim may have been derived from a misinterpretation of table
ES.7, where the project is estimated to increase overall employment by 3,954 relative to a no-project
scenario for the years 2018/19 to 2036/37. If taken to mean that the mine increases employment
cumulatively by 3,954 jobs every year for 18 years, this comes to 71,172 jobs. This is wrong. Table
ES.7 is clearly labelled as “Deviation from the Baseline” not “number of unique jobs created per
year”. The author of the EIS executive summary has misunderstood the economic impact
assessment. This error should be corrected immediately as it grossly overstates the employment
impacts of the proposal.
Key Finding 7.Capacity building and skills development in the local labour force through
apprenticeships, traineeships and skills training, as well as ongoing skills transfer between
imported and local labour and the permanent migration of some skilled labour.
These benefits could occur if sufficient coercion is applied by governments to the project proponents
and other participants in the industry. However there is nothing in the modelling here to suggest
that this will be the case, given the acknowledgement that most workers will be fly-in-fly-out.
Expanding training and apprenticeships may also place strain on training and education systems that
may not exist currently. While this point should be made in the “mitigation/enhancement strategies”
urged, it is misleading to place it in the key findings. No quantification of these benefits exists and
they will be contingent on good management of the project and wider industry.
Key finding 9.An increase in household incomes.

Economists at Large 11
Key finding 10.Upward pressure on labour prices due to the increase in demand for skilled
labour, particularly in industries experiencing skills shortages, further increasing household
incomes. This increase is expected to be over and above any increases in the costs of living,
representing an increase in real wages.
Increases in household incomes will also not be distributed equally. This increase will be primarily
felt by mine employees and those in related industries, while people in other industries may
experience a decline. The assessment acknowledges that the mining boom has led to a “wealth
divide between mining families and other residents (page xxii)” and provide no suggestion that this
project will change this.
There is little examination of costs of living in the assessment, other than declining housing
affordability. There is no discussion of food, fuel, clothing or other consumer prices in comparison to
wage rates and this finding seems to be based on assumption rather than analysis.
Key finding 11.An increase in
Queensland Government revenues of approximately $364.9 million, primarily in the
form of approximately $343 million per annum in royalty payments; and
Australian Government revenues of approximately $709.8 million, primarily through
avenues such as company tax (approximately $302.9 million), personal income tax
(approximately $237.8 million) and goods and services tax (approximately $158.3
million).
As with discussion of other revenues and outputs earlier, revenues to governments here are not a
measure of benefit. This finding overlooks the fact that substantial subsidies are paid by
governments to mining companies. While it is beyond the scope of this review to identify these in
the case of the China First Project, common subsidies and tax breaks include:
Direct subsidies
tax holidays or concessional treatment with respect to payroll tax, rates and other taxes and levies
in-kind assistance through the provision of cheap or free water and power
Tax deductibility of research and exploration expenses
Fuel rebates
(see (Richardson & Denniss, 2011)
Key finding 12.Development of rail and port infrastructure, as well as local road
infrastructure, an airstrip and utilities infrastructure to support the project. This will provide
benefits to the entire study area by providing a link between the abundant resources in the

Economists at Large 12
Galilee Basin and export infrastructure, assisting in commercialising these resources. This
infrastructure will also improve regional business capacity and competitiveness, and will
provide positive legacy benefits for the region.
This finding raises three points already mentioned:
It is difficult to identify how this infrastructure will be of benefit to the community and other
industries. Developing infrastructure primarily for use by the coal industry may not provide
infrastructure options with the widest economic benefit. This and other mining projects
place major strain on existing road and rail infrastructure to the detriment of other users.
Much of this infrastructure development may be subsidised by tax and ratepayers. The lack
of quantification here suggests these benefits are again assumed rather than stemming from
deeper analysis.
As mentioned several times, maximising exports is not the same as maximising economic
welfare. Decision makers should not be mislead by this confusion of “benefits” and
“exports”.
Economists at Large 13
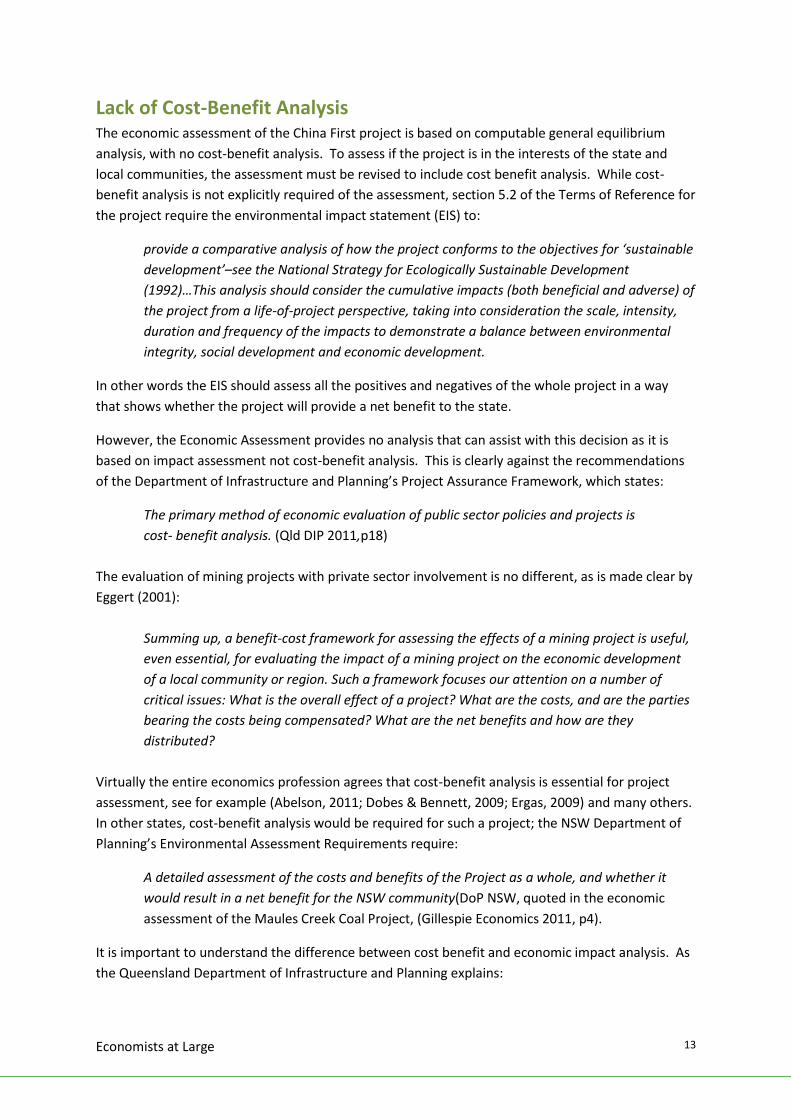
Lack of Cost-Benefit Analysis The economic assessment of the China First project is based on computable general equilibrium
analysis, with no cost-benefit analysis. To assess if the project is in the interests of the state and
local communities, the assessment must be revised to include cost benefit analysis. While cost-
benefit analysis is not explicitly required of the assessment, section 5.2 of the Terms of Reference for
the project require the environmental impact statement (EIS) to:
provide a comparative analysis of how the project conforms to the objectives for ‘sustainable
development’–see the National Strategy for Ecologically Sustainable Development
(1992)…This analysis should consider the cumulative impacts (both beneficial and adverse) of
the project from a life-of-project perspective, taking into consideration the scale, intensity,
duration and frequency of the impacts to demonstrate a balance between environmental
integrity, social development and economic development.
In other words the EIS should assess all the positives and negatives of the whole project in a way
that shows whether the project will provide a net benefit to the state.
However, the Economic Assessment provides no analysis that can assist with this decision as it is
based on impact assessment not cost-benefit analysis. This is clearly against the recommendations
of the Department of Infrastructure and Planning’s Project Assurance Framework, which states:
The primary method of economic evaluation of public sector policies and projects is
cost- benefit analysis. (Qld DIP 2011,p18)
The evaluation of mining projects with private sector involvement is no different, as is made clear by
Eggert (2001):
Summing up, a benefit-cost framework for assessing the effects of a mining project is useful,
even essential, for evaluating the impact of a mining project on the economic development
of a local community or region. Such a framework focuses our attention on a number of
critical issues: What is the overall effect of a project? What are the costs, and are the parties
bearing the costs being compensated? What are the net benefits and how are they
distributed?
Virtually the entire economics profession agrees that cost-benefit analysis is essential for project
assessment, see for example (Abelson, 2011; Dobes & Bennett, 2009; Ergas, 2009) and many others.
In other states, cost-benefit analysis would be required for such a project; the NSW Department of
Planning’s Environmental Assessment Requirements require:
A detailed assessment of the costs and benefits of the Project as a whole, and whether it
would result in a net benefit for the NSW community(DoP NSW, quoted in the economic
assessment of the Maules Creek Coal Project, (Gillespie Economics 2011, p4).
It is important to understand the difference between cost benefit and economic impact analysis. As
the Queensland Department of Infrastructure and Planning explains:
Economists at Large 14
[Cost-benefit analysis should] comprehensively identify and estimate as many costs and
benefits of a project as can reasonably be measured, including those which can be thought of
as social and environmental, [in order]to rank project options according to their net
economic benefit.(p18)
Whereas economic impact assessment:
typically measures the impact of a project on the volume of economic activity in a region (e.g.
on gross domestic product or employment),(Qld DIP 2011, p23)
The NSW Treasury confirms these interpretations:
Model based economic impact assessment is not a substitute for a thorough economic
analysis of a policy. The appropriate method for analysing policy alternatives is benefit cost
analysis (BCA). (NSW Treasury 2009, p4)
To understand if the China First project is in the interests of the Queensland and local communities it
is essential that economic analysis be based on thorough cost-benefit analysis, including
consideration of social and environmental, in accordance with the Department of Infrastructure and
Planning guidelines before further consideration is given to this project.
Conclusion The China First Coal project will have impacts on the local and Queensland economies. Some of
these impacts will be beneficial, while others will reduce the economic welfare of stakeholders. As
the Economic Impact Assessment is focused on measures of impact, such as industry output, export
revenues, labour demand, it does not provide an understanding of if the project’s benefits outweigh
its costs, nor of how any costs and benefits are distributed. What is certain is that participants in the
mining industry – investors, employees – will benefit, while non-mining stakeholders, including the
agricultural and manufacturing industries will face higher costs and difficulties related to a strong
exchange rate. These factors will be exacerbated if similar large projects proposed for the region are
approved.
What is needed is cost-benefit analysis, which would allow for a decision to be made in the
Queensland public interest. This is the approach preferred by economists and the Queensland
Department of Infrastructure and Planning.
Economists at Large 15
References
Abelson, P. (2011). Evaluating Major Events and Avoiding the Mercantilist Fallacy. Economic Papers: Journal of the Economic Society of Australia, 30(1), 48-59. doi:10.1111/j.1759-3441.2011.00096.x
Dobes, L., & Bennett, J. (2009). Multi-Criteria Analysis: “Good Enough” for Government Work? Agenda, 16(3).
Eggert, R. G. (2001). Mining and Economic Sustainability: National Economies and Local Communities. Sustainable Development. Report commissioned by the Mining, Minerals and Sustainable Development project of the Institute for Environment and Development, England.
Ergas, H. (2009). In Defence of Cost-Benefit Analysis. Agenda, 16(3), 31-40.
Gillespie Economics. (2011). Maules Creek Coal Project Economic Impact Assessment. Assessment. Prepared for Aston Resources.
McHugh, B. (2009) Fly-in-Fly-out in the Noughties; ABC Rural: Perth, Australia, 2009; available online: http://www.abc.net.au/rural/content/2009/s2764167.htm (accessed on 30 September 2011).
NSW Treasury. (2009). Employment Support Estimates - Methodological Framework. Secretary. Office of Financial Management: Research and Information Paper.
Qld DIP. (2011). Project Assurance Framework: Cost Benefit Analysis. Analysis. Queensland Department of Infrastructure and Planning. Retrieved from http://www.treasury.qld.gov.au/office/knowledge/docs/project-assurance-framework-guidelines/paf-cost-benefit-analysis.pdf
Richardson, D., & Denniss, R. (2011). Mining the truth: the rhetoric and reality of the mining boom. Institute paper number 7, The Australia Institute, Canberra.