appendices to marine mammal monitoring and mitigation ... · appendices to: marine mammal...
TRANSCRIPT

APPENDICES TO:
MARINE MAMMAL MONITORING AND MITIGATION DURING OPEN WATER SEISMIC EXPLORATION BY SHELL OFFSHORE INC. IN THE CHUKCHI AND BEAUFORT SEAS,
JULY–NOVEMBER 2007: 90-DAY REPORT
Edited by
Darren Irelanda, Robert. Rodriguesa, Dale Funka, William R. Koskib, and David Hannayc
a LGL Alaska Research Associates, Inc.
1101 East 76th Ave., Suite B, Anchorage, AK 99518, U.S.A.
b LGL Limited, environmental research associates P.O. Box 280, 22 Fisher Street, King City, Ont. L7B 1A6, Canada
c JASCO Research Ltd
Suite 2101, 4464 Markham St., Victoria, BC V8Z 7X8, Canada
for
Shell Offshore, Inc.
P.O. Box 576, Houston, TX 77001-0576 and
National Marine Fisheries Service, Office of Protected Resources 1315 East-West Hwy, Silver Spring, MD 20910-3282
and
U.S. Fish and Wildlife Service, Marine Mammal Management 1101 E. Tudor Road, M.S. 341, Anchorage, AK 99503
LGL Report P1049-1
January 2009

APPENDIX A: NATIONAL MARINE FISHERIES SERVICE IHA
APPENDIX B: U.S. FISH AND WILDLIFE SERVICE LOA
APPENDIX C: CONFLICT AVOIDANCE AGREEMENT
APPENDIX D: DESCRIPTION OF VESSELS AND EQUIPMENT
APPENDIX E: UNDERWATER SOUND MEASUREMENT RESULTS
APPENDIX F: DETAILS OF MONITORING, MITIGATION, AND ANALYSIS METHODS
APPENDIX G: BEAUFORT WIND FORCE DEFINITIONS
APPENDIX H: BACKGROUND ON MARINE MAMMALS IN THE CHUKCHI AND BEAUFORT SEAS
APPENDIX I: CHUKCHI SEA VESSEL-BASED SEISMIC MONITORING RESULTS
APPENDIX J: CHUKCHI SEA VESSEL-BASED SHALLOW HAZARDS AND SITE CLEARANCE MONITORING RESULTS
APPENDIX K: BEAUFORT SEA VESSEL-BASED SEISMIC MONITORING RESULTS
APPENDIX L: BEAUFORT SEA VESSEL-BASED SHALLOW HAZARDS AND SITE CLEARANCE MONITORING RESULTS
APPENDIX M: MARINE MAMMAL MONITORING RESULTS DURING AERIAL SURVEYS OF THE BEAUFORT SEA
Appendix A: NMFS IHA A-1
APPENDIX A: NATIONAL MARINE FISHERIES SERVICE IHA

A-2 Monitoring in the Chukchi and Beaufort Seas: Shell Offshore Inc, 2008

Appendix A: NMFS IHA A-3

A-4 Monitoring in the Chukchi and Beaufort Seas: Shell Offshore Inc, 2008

Appendix A: NMFS IHA A-5

A-6 Monitoring in the Chukchi and Beaufort Seas: Shell Offshore Inc, 2008
Appendix A: NMFS IHA A-7

A-8 Monitoring in the Chukchi and Beaufort Seas: Shell Offshore Inc, 2008

Appendix A: NMFS IHA A-9

A-10 Monitoring in the Chukchi and Beaufort Seas: Shell Offshore Inc, 2008

Appendix A: NMFS IHA A-11
A-12 Monitoring in the Chukchi and Beaufort Seas: Shell Offshore Inc, 2008

Appendix A: NMFS IHA A-13

A-14 Monitoring in the Chukchi and Beaufort Seas: Shell Offshore Inc, 2008

Appendix A: NMFS IHA A-15
DEPARTMENT OF COMMERCE
NATIONAL OCEANIC AND ATMOSPHERIC ADMINISTRATION
NATIONAL MARINE FISHERIES SERVICE
Incidental Harassment Authorization
Shell Offshore, Inc. and WesternGeco, Inc.(SOI/WG) are hereby authorized under section 101(a)(5)(D) of the Marine Mammal Protection Act (16 U.S.C. 1371 (a)(5)(D)) and 50 CFR 216.107, to take by Level B harassment only, small numbers of marine mammals incidental to conducting a marine seismic survey program in the Chukchi and Beaufort seas in Arctic Ocean waters under the jurisdiction of the United States, contingent upon the following conditions:
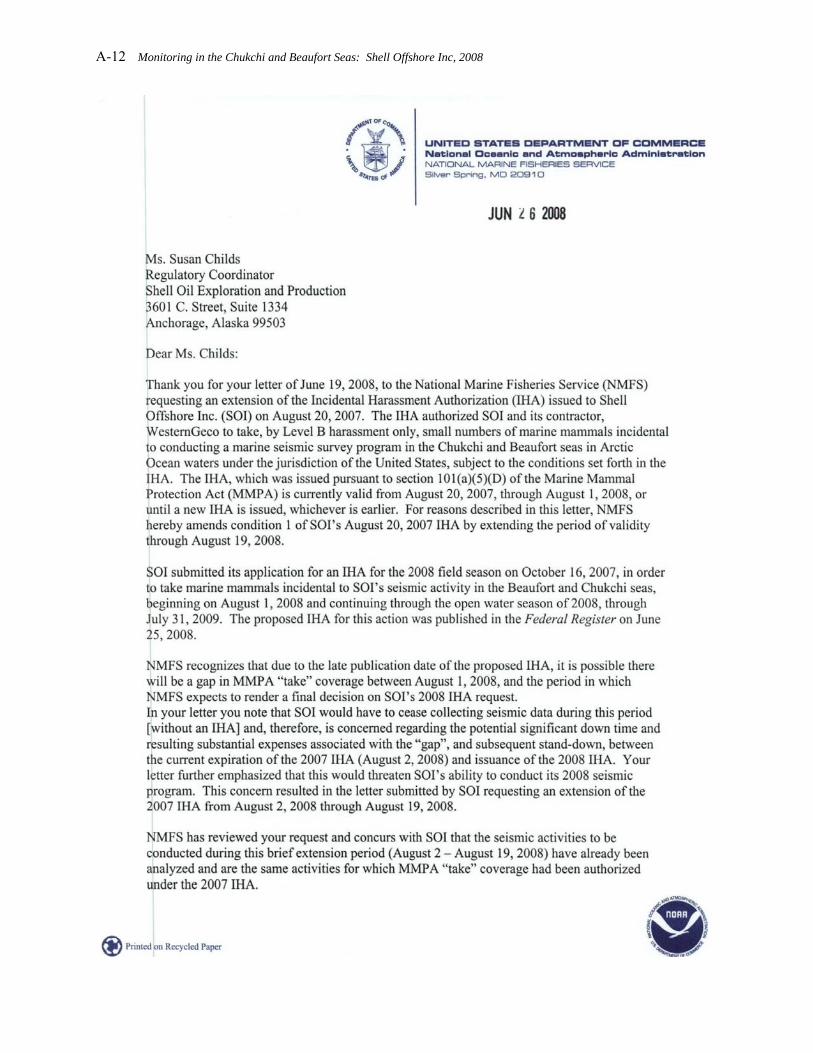
1. This Authorization is valid from August 20, 2008, through August 19, 2009, or until a new Incidental Harassment Authorization is issued to SOI/WG, whichever is earlier.
2. This Authorization is valid only for activities (including support vessels and aircraft) associated with the M/V Gilavar conducting deep 3D seismic surveys in the Chukchi and Beaufort seas, and the M/V Henry Christoffersen and the M/VAlpha Helix (or comparable vessels) conducting shallow-hazard seismic survey programs , in the Beaufort and Chukchi seas respectively, as described in SOI/WG's October 16, 2007, IHA application.
3 (a) The species authorized for incidental harassment takings are : bowhead whales (Balaena mysticetus ), gray whales (Eschrichtius robustus), humpback whales (Megaptera novaeangliae), fin whales (Balaenoptera physalus), beluga whales (Delphinapterus leucas), killer whales (Orcinus orca), harbor porpoise (Phocoena phocoena), ringed seals (Phoca hispida), spotted seals (Phoca largha), and bearded seals (Erignathus barbatus).
(b) The authorization for taking by harassment is limited to vessel and aircraft noise and to the following acoustic sources (or sources with comparable frequency and intensity ) without an amendment to this Authorization:
(i) On the M/V Gilavar. (A) A Bolt-seismic airgun array of 3147 in3 composed of 3 identically tuned
1049-in3 Bolt-gun sub-arrays operating at an air pressure of 2,000 psi; (B) a subbottom profiler ( 1 - 12.0 kHz); (C) a boomer/sparker/ airgun (400-800 Hz); (D) a hi-resolution multi-channel seismic system (20-300 Hz);
A-16 Monitoring in the Chukchi and Beaufort Seas: Shell Offshore Inc, 2008
2
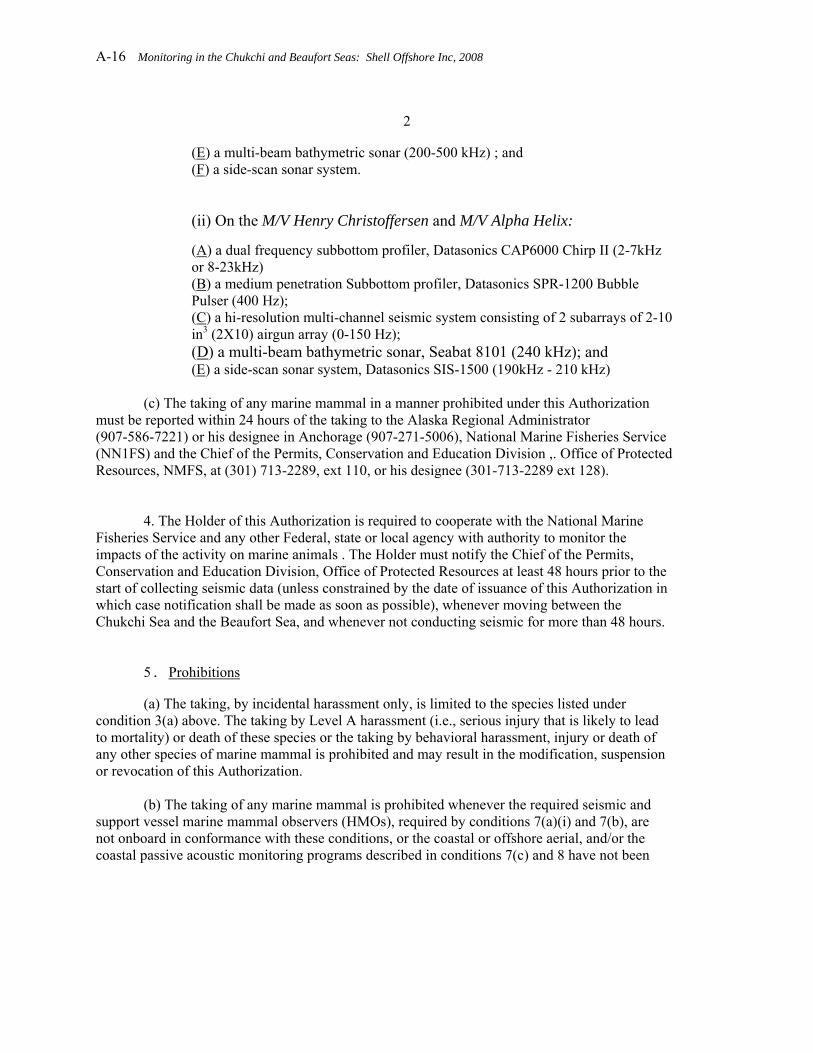
(E) a multi-beam bathymetric sonar (200-500 kHz) ; and (F) a side-scan sonar system.
(ii) On the M/V Henry Christoffersen and M/V Alpha Helix:
(A) a dual frequency subbottom profiler, Datasonics CAP6000 Chirp II (2-7kHz or 8-23kHz) (B) a medium penetration Subbottom profiler, Datasonics SPR-1200 Bubble Pulser (400 Hz); (C) a hi-resolution multi-channel seismic system consisting of 2 subarrays of 2-10 in3 (2X10) airgun array (0-150 Hz); (D) a multi-beam bathymetric sonar, Seabat 8101 (240 kHz); and (E) a side-scan sonar system, Datasonics SIS-1500 (190kHz - 210 kHz)
(c) The taking of any marine mammal in a manner prohibited under this Authorization
must be reported within 24 hours of the taking to the Alaska Regional Administrator (907-586-7221) or his designee in Anchorage (907-271-5006), National Marine Fisheries Service (NN1FS) and the Chief of the Permits, Conservation and Education Division ,. Office of Protected Resources, NMFS, at (301) 713-2289, ext 110, or his designee (301-713-2289 ext 128).
4. The Holder of this Authorization is required to cooperate with the National Marine Fisheries Service and any other Federal, state or local agency with authority to monitor the impacts of the activity on marine animals . The Holder must notify the Chief of the Permits, Conservation and Education Division, Office of Protected Resources at least 48 hours prior to the start of collecting seismic data (unless constrained by the date of issuance of this Authorization in which case notification shall be made as soon as possible), whenever moving between the Chukchi Sea and the Beaufort Sea, and whenever not conducting seismic for more than 48 hours.
5. Prohibitions
(a) The taking, by incidental harassment only, is limited to the species listed under condition 3(a) above. The taking by Level A harassment (i.e., serious injury that is likely to lead to mortality) or death of these species or the taking by behavioral harassment, injury or death of any other species of marine mammal is prohibited and may result in the modification, suspension or revocation of this Authorization.
(b) The taking of any marine mammal is prohibited whenever the required seismic and support vessel marine mammal observers (HMOs), required by conditions 7(a)(i) and 7(b), are not onboard in conformance with these conditions, or the coastal or offshore aerial, and/or the coastal passive acoustic monitoring programs described in conditions 7(c) and 8 have not been

Appendix A: NMFS IHA A-17
3
fully implemented as required by this Authorization.
(c) The taking of any marine mammals by seismic sounds when the seismic vessel is within 15 miles of another operating seismic vessel.
6. Mitigation. (a) General Mitigation: The Holder of this Authorization is required to:
(i) (A) Avoid concentrations or groups of whales by all vessels and aircraft under the direction of SOI/WG. Operators of support vessels and aircraft should, at all times, conduct their activities at the maximum distance possible from such concentrations of whales. Except as provided in condition 6(a)(Il), under no circumstances, other than an emergency, should aircraft operate at an altitude lower than 1,000 feet when within 500 lateral yards of groups of whales. Helicopters may not hover or circle above such areas or within 500 lateral yards of such areas; and (B) When weather conditions do not allow a 1,000-ft flying altitude, such as during severe storms or when cloud cover is low, aircraft may be operated below the 1,000-ft altitude stipulated above. However, when aircraft are operated at altitudes below 1,000 feet because of weather conditions, the operator must avoid known whale concentration areas and should take precautions to avoid flying directly over or within 500 yards of groups of whales.
(ii) Take every precaution to avoid harassment of whale concentrations when a vessel is operated near these animals. Vessels should reduce speed when within 300 yards of whales and those vessels capable of steering around such groups should do so. Vessels may not be operated in such a way as to separate members of a group of whales from other members of the group, especially bowhead whale cow/calf pairs.
(iii) Avoid multiple changes in direction and speed when within 300 yards of whales. In addition, operators should check the waters immediately adjacent to a vessel to ensure that no whales will be injured when the vessel's propellers (or screws) are engaged.
(iv) Not operate support vessels (including small boats) at a speed that would make collisions with whales likely.
(v) When weather conditions require, such as when visibility drops, vessels should adjust speed accordingly to avoid the likelihood of injury to whales.
(vi) (A) To avoid having an unmitigable adverse impact on the availability of marine mammal species or stocks for taking for subsistence uses, the following measures must be fully implemented:
(I) Plan all vessel and aircraft routes to minimize any potential conflict with subsistence whaling and sealing activities , particularly the fall bowhead whale subsistence

A-18 Monitoring in the Chukchi and Beaufort Seas: Shell Offshore Inc, 2008
4
harvest by the villages of Nuiqsuk, Kaktovik and Barrow. All vessels shall avoid areas of active or anticipated whaling activity.
(II) (1) During the fall bowhead whaling season, aircraft shall not operate below 1500 ft unless the aircraft is engaged in marine mammal monitoring, approaching, landing or taking off, or unless engaged in providing assistance to a whaler or in poor weather (low ceilings) or other emergency situations.
(2) Aircraft engaged in marine mammal monitoring shall not operate below 1500 ft in areas of active whaling (such areas to be identified though communications with the Com- Centers).
(III) All geophysical activity in the Beaufort Sea and eastern Chukchi seas shall be restricted from conducting seismic survey and related work as set forth below:
(1) Kaktovik: No geophysical activity from the Canadian border to the Canning River (-146 deg. 4 min. W) from 25 August to close of fall bowhead whale hunt in Kaktovik and Nuiqsut. From August 10 to August 25, the Holder of this Authorization shall communicate and collaborate with the Alaska Eskimo Whaling Commission on any planned vessel movement in and around Kaktovik and Cross Island to avoid impacts to the whale hunt.
(2) Nuiqsut: (a) Point Storkersen (-148 deg. 42 min. W) to Thetis Island (-150 deg. 10.2 min. W): (i) Inside the barrier islands, no geophysical activity prior to August 5; geophysical activity allowed from August 5 until completion of operations. Geophysical activity allowed in this area after August 25 shall include a source array of no more than 12 airguns, a source layout no greater than 8 in x 6 in, and a single source volume of no greater than 880 cubic inches. (ii) Outside the barrier islands, no geophysical activity from August 25 to the close of fall towhead whale hunting in Nuiqsut; geophysical activity allowed at all other times; (b) Canning River (-146 deg. 4 min. W) to Point Storkersen (-148 deg. 42 min. W): No geophysical activity from August 25 to the close of the bowhead whale subsistence hunting in Nuiqsut.
(3) Barrow: No geophysical activity from Pitt Point on the east side of Smith Bay (- 152 deg. 15 min. W) to a location about half way between Barrow and Peard Bay (-157 deg. 20 min_ W) from September 15 to the close of fall bowhead whale hunting in Barrow.
(4) Chukchi Sea: (a) Geophysical activities may not commence prior to July 20, 2008, but in any case geophysical exploration activities shall not be conducted within 60 miles from the Chukchi Sea coast at any point.
(b) Geophysical activity may occur beginning July 20th, and shall end on September l0th. Geophysical activity may resume in the Chukchi Sea following the close of the fall 2008 towhead whale subsistence hunt in Barrow, Wainwright, Pt. Lay and Pt Hope, unless an earlier start date is specifically authorized by the Whaling Captains' Associations of Barrow, Wainwright, Pt. Lay, and Pt. Hope, and the AEWC.
(c) For purposes of this Authorization, fall bowhead whale subsistence hunting in the Chukchi Sea is considered to be occurring if the following conditions are met: (i) the villages of Wainwright, Pt. Hope and Pt Lay have remaining village quotas for 2008; and (ii) traditional bowhead whale subsistence hunting activity is anticipated or ongoing.
(5) Beginning with spring ice break-up and until fall freeze-up, all vessels transiting east of Bullet Point, to the Canadian border should remain at least 5 miles offshore during transit along the coast.

Appendix A: NMFS IHA A-19
5
(6) Seismic and support vessel transits in the Chukchi Sea spring lead system must not occur prior to July 1, 2009, and should remain a minimum of 30 miles offshore during transit during the year.
(IV) For the purposes of reducing or eliminating conflicts between subsistence whaling activities and the seismic activity, the Holder of this Authorization, in cooperation with Holders of related Authorizations, will establish and operate at least five Communication Centers (Com-Centers) to be staffed by Inupiat operators. The Com-Centers will be operated 24 hours/day during the 2008 fall subsistence bowhead whale hunt.
(V) Upon notification by Com-Center operator of an at-sea emergency, the Holder of this Authorization shall provide such assistance as necessary to prevent the loss of life.
(VI) Upon request for emergency assistance made by a subsistence whale hunting organization, or by a member of such an organization in order to prevent the loss of a whale, the Holder of this Authorization shall assist towing of a whale taken in a traditional subsistence whale hunt.
(Vll)(a) Post-Season Review: Following the end of the fall 2008 bowhead whale subsistence hunt and prior to the 2009 Pre-season Introduction Meetings , the Holder of this Authorization and other Industry Participants will host a joint meeting with all whaling captains of the Villages of Nuiqsut, Kaktovik and Barrow, the Inupiat Communicator (s) and with the Chairman and Executive Director of the AEWC at a mutually agreed upon place on the North Slope to review the results of the 2008 fall season (unless it is agreed by all designated individuals or their representatives that such a meeting should be held at a different location, should be postponed , or is not necessary).
(b) Following completion of Chukchi Sea geophysical activities, and prior to the 2009 Pre-Season Introduction Meetings, the Holder of this Authorization and other Chukchi Sea Industry Participants will host a meeting in each of the villages of: Wainwright, Point Lay, Point Hope, and Barrow (or a joint meeting of the whaling captain from all these villages if the whaling captains agree to a joint meeting) to review the results of operations and to discuss any concerns residents of those villages might have regarding the operations.
(b) Seismic Vessel Mitgation: The Holder of this Authorization is required to:
(i) Reduce the volume of the airgun array during vessel turns while running seismic lines to one airgun or to a reduced number of airguns (unless seismic data collection will continue during line turns).
(ii) Whenever a marine mammal is detected outside the exclusion zone radius, and based on its position and motion relative to the ship track is likely to enter the safety radius, calculate and implement an alternative ship speed or track.

A-20 Monitoring in the Chukchi and Beaufort Seas: Shell Offshore Inc, 2008
6
(iii) Exclusion and Monitoring-Safety Zones: (A) Establish and monitor with trained MMOs, a preliminary exclusion zone for
cetaceans surrounding the seismic airgun array on the M/V Gilavar where the received level would be 180 dB re I μPa rms . For purposes of the field verification test, described in condition 7(d), this radius is estimated to be 1.3 mi (2.1 km) from the seismic source.
(B) Establish and monitor with trained MMOs a preliminary exclusion zone for pinnipeds surrounding the seismic airgun array on the M/V Gilavar where the received level would be 190 dB re 1 μPa rms. For purposes of the field verification test described in condition 7(d), this radius is estimated to be 0 .5 mi (0.86 km) from the seismic source.
(C) Establish and monitor with trained MMOs a preliminary exclusion zone for cetaceans and pinnipeds surrounding the high-resolution seismic airgun arrays on the M/V Henry Christoffersen and M/V Alpha Helix where the received level would be preliminarily determined to be 180 dB and 190 dB re I μPa rms, respectively.
(D) Immediately upon completion of data analysis of the field verification measurements required under condition 7(d) below, establish and monitor the new 180-dB and 190-dB marine mammal exclusion zones.
(E) Cetacean Monitor (Safety) Zones: (I) Whenever the support "chase" vessel monitoring program described in
condition 7(b) below detects an aggregation of 12 or more non-migratory mysticete whales within an acoustically verified 160-dB rms zone ahead of, or perpendicular to, the seismic vessel track, the Holder of this Authorization must: (a) Immediately shutdown the seismic airgun array and/or other acoustic sources to ensure that sound pressure levels (SPLs) at the shortest distance to the aggregation do not exceed 160 dB rms (the mitigation airgun may continue to operate provided its 160-dB SPL does not reach the aggregation); and (b) Not proceed with ramping up the seismic airgun array until the lead MMO on board the support "chase" vessel(s) or survey aircraft confirm that no mysticete whale aggregations have been detected within the seismic vessel's 160-dB zone based upon ship course, direction and distance from last sighting and the last aggregation sighting appropriate safety zones;
(II) Whenever the aerial monitoring program described in conditions 7(c) below detects 4 bowhead whale cow/calf pairs within an acoustically-verified 120-dB monitoring zone, the Holder of this Authorization must: (a) Immediately shutdown the seismic airgun array and/or other acoustic sources, and (b) not proceed with ramping up the seismic airgun array until two consecutive aerial surveys confirm that there are no more than 3 bowhead cow/calf pairs within the area to be seismically surveyed within the next 24 hours.

Appendix A: NMFS IHA A-21
7
(iv) Power-down/Shut-down.
(A) Immediately power-down the seismic airgun array and/or other acoustic sources, whenever any cetaceans are sighted approaching close to or within the area delineated by the 180-dB (re 1 μParms), or pinnipeds are sighted approaching close to or within the area delineated by the 190-dB re 1 .Pa rms isopleth as established under condition 6(b)(iii) for the authorized seismic airgun array- If the power-down operation cannot reduce the received sound pressure level at the cetacean or pinniped to 180 dB or 190 dB, whichever is appropriate, the Holder of this Authorization must immediately shut-down the seismic airgun array and/or other acoustic sources.
(B) Not proceed with ramping up the seismic airgun array unless the marine mammal exclusion zones described in condition 6(b)(iii)(A), W), and (C) are visible and no marine mammals are detected within the appropriate safety zones ; or until 15 minutes (for small odontocetes, pinnipeds) or a minimum of 30 minutes (for mysticetes/large odontocetes) after there has been no further visual detection of the animal(s) within the safety zone and the trained MMO on duty is confident that no marine mammals remain within the appropriate safety zone.
(C) Emergency shut-down. In the unanticipated event that an injured or dead marine mammal is sighted within an area where the Holder of this Authorization deployed and utilized seismic airguns within the past 24 hours, immediately shutdown the seismic airgun array.
(I) In the event that the marine mammal has been determined to have been deceased for at least 72 hours, as certified by the lead MMO onboard the seismic vessel, and no other marine mammals have been reported injured or dead during that same 72 hour period, the airgun array may be restarted (by conducting the necessary ramp-up procedures described in condition 6(b)(v) below) upon completion of a written certification, including supporting documents (e.g., photographs or other evidence to support the certification) by the MMO. Within 24 hours after the event specified herein, the Holder of this Authorization must notify the designated staff person (see III below) by telephone or email of the event and ensure that the written certification and supporting documents are provided to the NWS staff person.
(II) In the event that the marine mammal injury resulted from something other than seismic airgun operations (e. g., gunshot wound, polar bear attack), as certified by the lead MMO onboard the seismic vessel, the airgun array may be restarted (by conducting the necessary ramp-up procedures described in condition 6(b)(v) below) upon completion of a written certification, including supporting documents (e.g., photographs or other evidence to support the certification) by the MMO. Within 24 hours after the event specified herein, the Holder of this Authorization must notify the designated staff person (see III below) by telephone or email of the event and ensure that the written certification and supporting documents are provided to the NMFS staff person.
(III) In the event the animal has not been dead for a period greater than 72 hours or the cause of the injury or death cannot be immediately determined by the lead MMO, the Holder shall immediately report the incident to either the NWS staff person designated by the Director, Office of Protected Resources (Ken Hollingshead, Office of Protected Resources,

A-22 Monitoring in the Chukchi and Beaufort Seas: Shell Offshore Inc, 2008
8
NMFS, 301-713-2289 ext 128 or [email protected]) or to the staff person(s) designated by the Alaska Regional Administrator (Brad Smith or James Wilder, Alaska Regional Office, NMFS, 907-271-5006 or [email protected] or James.Wilder@noaagov).
(1) The seismic airgun array shall not be restarted until NMFS is able to review the circumstances of the take, make determinations as to whether modifications to the activities are appropriate and necessary, and has notified the Holder that activities may be resumed.
(2) NMFS approval to resume operations may be given by the Director, Office of Protected Resources, NMFS, or his designee or by the Alaska Regional Administrator, NMFS, or his designee. NMFS approval may be provided in writing via a letter or an email or via the telephone.
(v) Ramp-up (A) Prior to commencing ramp-up described in condition 6 (b)(v)(C), conduct a
30-minute period of marine mammal observations by at least one trained MMO W at the commencement of seismic operations and (2) at any time electrical power to the airgun array is discontinued for a period of 10 minutes or more and the MMO watch has been suspended;
(B) If the complete safety radii are not visible for at least 30 minutes prior to ramp-up in either daylight or nighttime, do not commence ramp-up unless the seismic source has maintained a sound pressure level at the source of at least 180 dB re 1 μPa rms during the interruption of seismic survey operations.
(C) If no marine mammals are observed while undertaking mitigation conditions 6(v)(A) and (B), ramp-up airgun arrays no greater than approximately 6 dB per 5-minute period starting with the smallest airgun in the array and then adding additional guns in sequence, until the full array is firing: (1) At the commencement of seismic operations, and (2), anytime after the airgun array has been powered down for more than 10 minutes;
7. Monitoring.
(a) Vessel Monitoring:
(i) Seismic Vessel: The Holder of this Authorization must designate biologicallytrai ned, on-site individuals (MMOs) to be onboard the M/V Gilavar, M/V Henry Christoffersen, and M/V Alpha Helix (or similar source vessel) and designated support vessels conducting marine mammal observations or surveys, approved in advance by National Marine Fisheries Service (one may be an Inupiat), to conduct the visual monitoring programs required under this Authorization and to record the effects of seismic surveys and the resulting noise on marine mammals. The minimum number of observers required for the source vessels are:

Appendix A: NMFS IHA A-23
9
(A) Between August 16 and September 15, 2008 , there must be at least 4 MMOs onboard each source vessel at any one time during all seismic operations;
(B) Between September 16 and the end of the 2008 survey, there must be at least 3 MMOs onboard each source vessel at any time during all seismic operations.
(C) Between July 20, 2009 and August 19, 2009, there must be at least 5 MMOs onboard each source vessel at any one time during all seismic operations.
(ii) To the extent possible , MMOs should be on duty for 4 consecutive hours or . less, although more than one 4-hour shift per day is acceptable.
(iii) Monitoring is to be conducted by the MMOs described in condition 7(a)(i) above, onboard each active seismic vessel and support vessel , to (A) ensure that no marine mammals enter the appropriate safety zone whenever the seismic array is on, and/or `B) to record marine mammal activity as described in condition 7(a)(vi ) below, at least two MMOs must be on watch during ramp ups and the 30 minutes prior to full ramp ups , and for as large a fraction of the other operating hours as possible . At all other times, at least one MMO must be on active watch whenever the seismic airgun array is operating during all daytime airgun operations, during any nighttime power-ups of the airguns and at night , whenever daytime monitoring resulted in one or more power-down situations due to marine mammal presence.
(iv) At all times, the crew must be instructed to keep watch for marine mammals. If any are sighted, the bridge watch-stander must immediately notify the MMO on-watch. If a marine mammal is within, or closely approaching, its designated safety zone, the airgun array must be immediately powered down.
(v) Observations by the MMOs described in condition 7(a)(i) above on marine mammal presence and activity will begin a minimum of 30 minutes prior to the estimated time that the seismic source is to be turned on and/or ramped-up.
(vi) Monitoring will consist of recording : (i) the species, group size, age/size/sex categories (if determinable), the general behavioral activity, heading (if consistent), bearing and distance from seismic vessel, sighting cue, behavioral pace , and apparent reaction of all marine mammals seen near the seismic vessel and/or its airgun array (e.g., none, avoidance, approach, paralleling, etc) and; (ii) the time, location, heading, speed, and activity of the vessel (shooting or not), along with sea state, visibility, cloud cover and sun glare at (1) any time a marine mammal is sighted, (2) at the start and end of each watch, and (3) during a watch (whenever there is a change in one or more variable); and, (iii) the identification of all vessels that are visible within 5 km of the seismic vessel whenever a marine mammal is sighted , and the time observed, bearing, distance, heading , speed and activity of the other vessel(s).
(vii) All MMOs and Inupiat observers must be provided with and use appropriate
A-24 Monitoring in the Chukchi and Beaufort Seas: Shell Offshore Inc, 2008
10
night-vision devices, Big Eyes, and reticulated and/or laser range finding binoculars, in order to detect marine mammals within the Exclusion Zone.
(b) Chase Boat Monitoring:
(i) At least one "chase boat "and/or support vessel will assist in monitoring safety and monitoring zones during active seismic survey operations in the Chukchi and Beaufort Seas. The chase boat and support vessel will have at least two MMOs onboard to collect marine mammal observations.
(ii) During all active seismic survey activity, the chase boat will conduct marine mammal surveys no less than every 48 hours or 3 times per 7 days, and at all other times except during re-supply operations, of the 160-dB area to be seismically surveyed over the next 24 hours. MMOs will search for aggregations of bowhead and gray whale feeding utilizing a survey design approved by the National Marine Fisheries Service.
(iii) The MMOs on the chase boat will immediately contact the seismic survey ship if marine mammals are sited within the 180/190-dB safety zone or aggregations of 12 or more non-migratory bowhead whales or gray whales are sited within the surveyed 160-dB zone.
(iv) MMOs onboard chase boats will be limited to 4 hrs in length and 12 hrs total in a 24 hr period.
(c) Aerial Surveys: Beaufort Sea
(i) In accordance with the survey design descnibed in Shell's 2008 Beaufort Sea monitoring plan, the Holder of this Authorization must conduct aerial surveys of the seismic area and nearby waters (A) biweekly through August 31, 2008, and (B) daily, weather permitting, from September 1, 2008, until 3 days after the conclusion of the seismic program.
(ii) Using standard aerial survey procedures for marine mammal surveys, monitoring is to be conducted by 2 primary MMOs and a third MMO for part-time observations and data logging.
(iii) Aerial monitoring will consist of noting the marine mammal species, number, age/size/sex class (if determinable), general activity, heading (if consistent), swimming speed category (if traveling), sighting cue, ice conditions, and inclinometer reading.
(iv) As proposed by SOI, after September 1, 2008, the aerial survey will look for migratory cow/calf pairs during normal survey activity. If the biological observers onboard the aircraft see 4 or more migratory bowhead whale cow/calf pairs within the surveyed portion of the 120-dB isopleth from the seismic survey vessel, the lead MMO or his/her designee will immediately contact the MMO on watch onboard the seismic vessel of the observation. The
Appendix A: NMFS IHA A-25
11
location, bearing and approximate speed of the migratory bowhead whales will be recorded.
(d) Field Source Verification Using a bottom founded hydrophone system, the Holder of this Authorization is required to conduct sound source verification tests for all seismic sources and vessels and also for all support vessels not previously measured and at a minimum report the following results within 5 days of completing the test:
(i)(A) the empirical distances from the airgun array and other acoustic sources utilized during the pendency of this authorization to broadband received levels of 190, 180, 160, and 120 dB(rms) re 1 microPa, and
(i)(B) the radiated sounds vs. distance from the seismic vessels supporting the survey.
(ii) Measurements are to be made at the beginning of the survey for locations not previously modeled in the Chukchi Sea and Beaufort Sea in water depths shallower than 200 m (656 ft) and water depths greater than 200 m (656 ft).
8. Additional Monitoring (a) The Holder of the Authorization, in cooperation with other oil company participants
must conduct all monitoring described in the "Marine Mammal Monitoring and Mitigation Plan for Seismic Exploration in the Alaskan Chukchi and Beaufort Seas, 2008." Research will include establishment of:(i) an acoustic program to measure sounds produced by seismic vessels (required under condition 7(d); (ii) an aerial monitoring and reconnaissance of marine mammals available for subsistence harvest along the Chukchi Sea coast; (iii) deployment, and later analysis of data from , bottom-founded autonomous acoustic recorder arrays along the coast of the Chukchi Sea to record ambient sound levels, vocalizations of marine mammals, and received levels of seismic operations should they be detectable and, (iv) an acoustic study of bowhead deflections in the Beaufort Sea.
9. Reporting.
(a) Field Source Verification and the distances to the various radii are to be reported to the National Marine Fisheries Service within 5 days of completing the measurements. In addition to reporting the radii of specific regulatory concern, distances to other sound isopleths down to 120 dB rms (if measurable ) will be reported in increments of 10 dB.
(b) Seismic Vessel Monitoring Program: A draft report will be submitted to the Director, Office of Protected Resources, National Marine Fisheries Service within 90 days after the end of Shell 's seismic survey program in the Arctic Ocean . The report will describe in detail (i) the

A-26 Monitoring in the Chukchi and Beaufort Seas: Shell Offshore Inc, 2008
12
operations that were conducted, (ii) the results of the acoustical measurements to verify the safety radii, (iii) the methods, results, and interpretation pertaining to all monitoring tasks; (iv) the results of the 2008 shipboard marine mammal monitoring;; (v), a summary of the dates and locations of seismic operations, including summaries of power downs, shut downs, and ramp up delays; (vi) marine mammal si tins (species, numbers, dates, times and locations; age/size/gender, environmental correlates, activities, associated seismic survey activities), (vii) estimates of the amount and nature of potential take (exposure) of marine mammals (by species) by harassment or in other ways to industry sounds; (viii) an analysis of the effects of seismic operations (e.g., on sighting rates, sighting distances, behaviors, movement patterns of marine mammals); (ix) provide an analysis of factors influencing detectability of marine mammals; and (x) provide summaries on communications with hunters and potential effects on subsistence uses.
(c) The draft report will be subject to review and comment by the National Marine Fisheries Service. Any recommendations made by the National Marine Fisheries Service must be addressed in the final report prior to acceptance by the National Marine Fisheries Service. The draft report will be considered the final report for this activity under this Authorization if the National Marine Fisheries Service has not provided comments and recommendations within 90 days of receipt of the draft report.
(d) A draft comprehensive report describing the acoustic, vessel-based, and aerial monitoring programs will be prepared and submitted within 240 days of the date of this Authorization. The comprehensive report will describe the methods, results, conclusions and limitations of each of the individual data sets in detail. The report will also integrate (to the extent possible) the studies into a broad based assessment of all industry activities and their impacts on marine mammals in the Arctic Ocean during 2008.
(e) The draft comprehensive report will be reviewed by participants at the 2009 Open Water Scientific Meeting to be held in Anchorage AK in the spring of 2009. The draft comprehensive report will be accepted by the National Marine Fisheries Service as the final comprehensive report upon incorporation of recommendations by the workshop participants.
10. Activities related to the monitoring described in this Authorization do not require a separate scientific research permit issued under section 104 of the Marine Mammal Protection Act.
11. The Plan of Cooperation and that portion of the Conflict Avoidance Agreement outlining the steps that will be taken to cooperate and communicate with the native communities to ensure the availability of marine mammals for subsistence uses, must be implemented.
12. This Authorization may be modified, suspended or withdrawn if the Holder fails to
Appendix A: NMFS IHA A-27
13
abide by the conditions prescribed herein or if the authorized taking is having more than a negligible impact on the species or stock of affected marine mammals, or an unmitigable adverse impact on the availability of such species or stocks for subsistence uses.
13. A copy of this Authorization must be in the possession of each seismic vessel operator taking marine mammals under the authority of this Incidental Harassment Authorization.
14. The Holder of this Authorization is required to comply with the Terms and Conditions of the Incidental Take Statement corresponding to NMFS' Biological Opinion.
A-28 Monitoring in the Chukchi and Beaufort Seas: Shell Offshore Inc, 2008
Appendix A: NMFS IHA A-29

Appendix B: USFWS IHA B-1
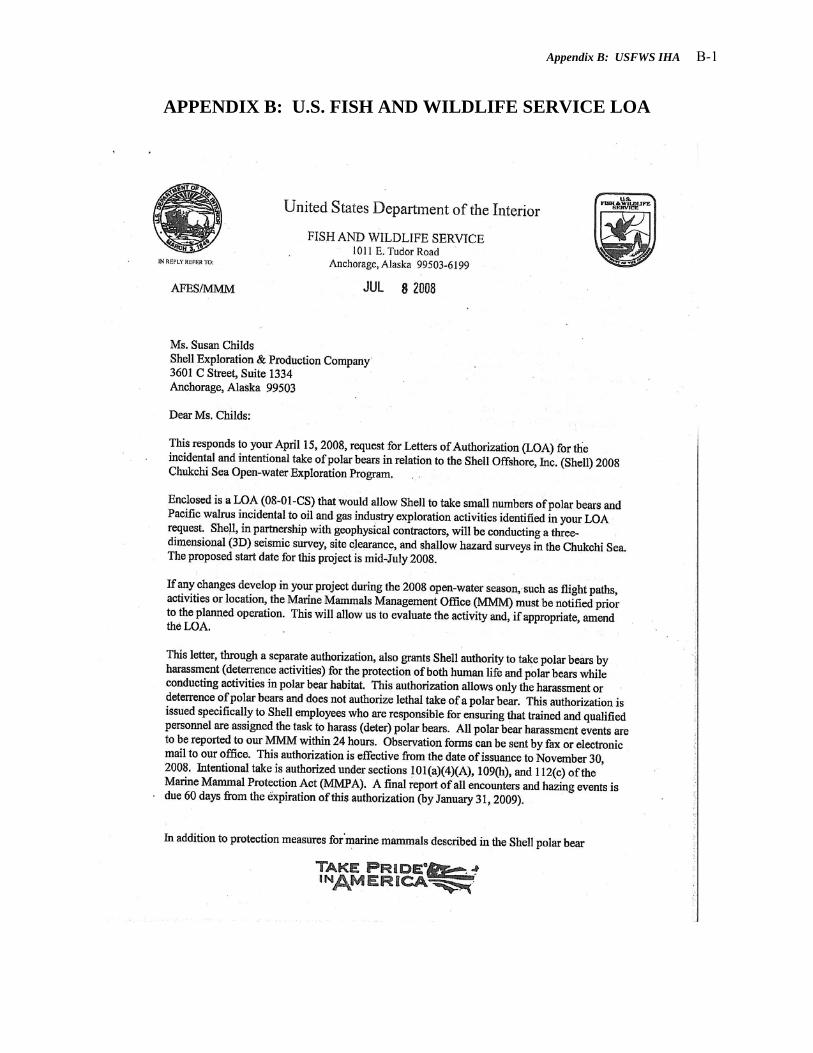
APPENDIX B: U.S. FISH AND WILDLIFE SERVICE LOA

B-2 Monitoring in the Chukchi & Beaufort Seas: Shell Offshore, 2008
Appendix B: USFWS IHA B-3

B-4 Monitoring in the Chukchi & Beaufort Seas: Shell Offshore, 2008

Appendix B: USFWS IHA B-5

B-6 Monitoring in the Chukchi & Beaufort Seas: Shell Offshore, 2008
Appendix B: USFWS IHA B-7
B-8 Monitoring in the Chukchi & Beaufort Seas: Shell Offshore, 2008

Appendix B: USFWS IHA B-9
B-10 Monitoring in the Chukchi & Beaufort Seas: Shell Offshore, 2008

Appendix B: USFWS IHA B-11


Appendix C: Conflict Avoidance Agreement C-1
APPENDIX C: CONFLICT AVOIDANCE AGREEMENT

C-2 Monitoring in the Chukchi & Beaufort Seas: Shell Offshore, 2008
Appendix C: Conflict Avoidance Agreement C-3
C-4 Monitoring in the Chukchi & Beaufort Seas: Shell Offshore, 2008
Appendix C: Conflict Avoidance Agreement C-5
C-6 Monitoring in the Chukchi & Beaufort Seas: Shell Offshore, 2008

Appendix C: Conflict Avoidance Agreement C-7

C-8 Monitoring in the Chukchi & Beaufort Seas: Shell Offshore, 2008

Appendix C: Conflict Avoidance Agreement C-9

C-10 Monitoring in the Chukchi & Beaufort Seas: Shell Offshore, 2008

Appendix C: Conflict Avoidance Agreement C-11

C-12 Monitoring in the Chukchi & Beaufort Seas: Shell Offshore, 2008

Appendix C: Conflict Avoidance Agreement C-13

C-14 Monitoring in the Chukchi & Beaufort Seas: Shell Offshore, 2008

Appendix C: Conflict Avoidance Agreement C-15

C-16 Monitoring in the Chukchi & Beaufort Seas: Shell Offshore, 2008

Appendix C: Conflict Avoidance Agreement C-17

C-18 Monitoring in the Chukchi & Beaufort Seas: Shell Offshore, 2008

Appendix C: Conflict Avoidance Agreement C-19

C-20 Monitoring in the Chukchi & Beaufort Seas: Shell Offshore, 2008

Appendix C: Conflict Avoidance Agreement C-21
C-22 Monitoring in the Chukchi & Beaufort Seas: Shell Offshore, 2008
Appendix C: Conflict Avoidance Agreement C-23

C-24 Monitoring in the Chukchi & Beaufort Seas: Shell Offshore, 2008
Appendix C: Conflict Avoidance Agreement C-25

C-26 Monitoring in the Chukchi & Beaufort Seas: Shell Offshore, 2008

Appendix C: Conflict Avoidance Agreement C-27

C-28 Monitoring in the Chukchi & Beaufort Seas: Shell Offshore, 2008

Appendix C: Conflict Avoidance Agreement C-29

C-30 Monitoring in the Chukchi & Beaufort Seas: Shell Offshore, 2008
Appendix C: Conflict Avoidance Agreement C-31

C-32 Monitoring in the Chukchi & Beaufort Seas: Shell Offshore, 2008

Appendix D: Description of Vessels and Equipment D-1
APPENDIX D: DESCRIPTION OF VESSELS AND EQUIPMENT
Vessels
M/V Gilavar
SOI’s seismic source vessel, the Gilavar, was built in Norway in 1981. The Gilavar is owned by
Caspian Geophysical Ltd., of Baku, Azerbaijan, and its current port of registry is Panama. The overall length of the Gilavar is 84.9 m (279 ft) and its gross tonnage is 3779 metric tons with a mean draft of 5.9 m (19 ft). The total fuel capacity of the Gilavar is 916 m3 with a fuel consumption rate ranging from 24 to 35 m3 per day. The Gilavar has a helicopter deck rated for a Bell 214 or Super Puma. The Gilavar is equipped with fresh water making capabilities, and a sludge and waste oil incinerator. Airgun Description and Safety Radii: Gilavar
Aboard the Gilavar, SOI used WesternGeco’s 3147 in3 Bolt-Gun Array for its 3–D seismic survey operations in the Chukchi Sea. WesternGeco’s source arrays were composed of three identically tuned Bolt-Gun sub-arrays operated at an air pressure of 2000 psi. Each sub-array was 15 m in length, and was 8 m from the adjacent array(s). The individual airguns ranged in volume from 30 to 235 in3, and each sub-array included two 235 in3 and two 125 in3 airguns in two-gun clusters. A 30 in3 airgun was used for mitigation when marine mammals were observed within or about to enter the applicable safety radius. The airgun arrays were towed at a depth of 6 m. The system also included four to six hydrophone streamers with hydrophones distributed over a length of 4200 m and spaced 100 m apart, which recorded reflected sound energy. Air compressors aboard the Gilavar were the source of high pressure air used to operate the airgun arrays. Seismic pulses were emitted at intervals of 25 m (~10 sec) while the Gilavar traveled at a speed of 4 to 5 knots (7.4–9.3 km/h). In general, the Gilavar towed this system along a predetermined survey track, although adjustments were occasionally made during the field season to avoid obstacles or during repairs to the equipment.

D-2 Monitoring in the Chukchi & Beaufort Seas: Shell Offshore, 2008
In general, the signature produced by an array composed of multiple sub-arrays has the same shape as that produced by a single sub-array while the overall acoustic output of the array is determined by the number of sub-arrays employed. The gun arrangement for each of the three 1049-in3 sub-arrays was detailed in SOI’s IHA application. As indicated in the application’s diagram, each sub-array was composed of six tuning elements; two 2–gun clusters and four single guns. The standard configuration of a source array for 3–D surveys consists of one or more 1049 in3 sub-arrays. When more than one sub-array is used, as here, the arrays are lined up parallel to each other with 8 m (26 ft) cross-line separation between them. This separation was chosen to minimize the dimensions of the array in order to approximate point source radiation characteristics for frequencies in the nominal seismic processing band. For the 3147 in3 array the overall dimensions were 15 m (49 ft) long by 16 m (52.5 ft) wide.
Standard 1049 in3 sub-array - 3 subarrays comprise each 3147 in3
Source
Information on WesternGeco’s source arrays was taken from the IHA application.
As noted above, the sub-array was composed of six tuning elements; two 2-gun clusters and four
single guns. The clusters had their component guns arranged in a fixed side-by-side fashion with the distance between the gun ports set to maximize the bubble suppression effects of clustered guns. A near-field hydrophone was mounted about 1 m above each gun station (one phone was used per cluster). One depth transducer per position was mounted on the gun’s ultrabox, and a high pressure transducer was mounted at the aft end of the sub-array to monitor high pressure air supply. All the data from these sensors were transmitted to the vessel for input into the onboard systems and recording to tape.

Appendix D: Description of Vessels and Equipment D-3
M/V Henry Christoffersen
The Henry Christoffersen was built in Victoria, B.C., Canada, and is owned by Northern
Transportation Company, Ltd. Its port of registry is Edmonton, Alberta, Canada. The overall length of the Henry Christoffersen is 47 m (153 ft) and the gross tonnage is 783 metric tons. The Henry Christoffersen is powered by four Caterpillar V16 D399 diesel engines and can travel at a speed of 14 knots. The fuel capacity of the Henry Christoffersen is 313 m3 and the fuel consumption rate is ~13.2 m3 per day. The Henry Christoffersen conducted shallow hazards and site clearance surveys in the Beaufort Sea during the 2007 open-water season. High-Resolution Seismic Profiling
Reflected sound energy, often called acoustic or seismic energy, can produce graphic images of seafloor and sub-seafloor features. High-resolution profiling systems transmit the acoustic energy from various sources called transducers that are attached to the hull of the vessel or towed astern. Part of this energy is reflected from the seafloor and from geologic strata below the seafloor. This reflected energy is received by one or more hydrophones or a streamer, and the signals are recorded to produce seismic records or profiles. Seismic profiles often take the form of geologic cross-sections along the course traveled by the survey vessel.
The Henry Christoffersen operated several high-resolution profiling systems simultaneously in the Beaufort Sea to obtain detailed records of seafloor and near seafloor conditions. A typical survey included • a dual-frequency sub-bottom profiler (Datasonics CAP6000 Chirp II; 2–7 or 8–23 kHz) as a shallow
penetration or sub-bottom profiler; transducer depth ~1 m; pulse interval 0.25–5 sec; • a Datasonics SPR-1200 Bubble Pulser as a medium penetration system, nominally operating at 400
Hz and pulse interval 0.5–5 sec (but see Chapter 3 for empirical data on measured frequency output); • a high resolution multi-channel seismic system comprised of a two 10 in3 airgun array with a total
volume of 20 in3 with predominant output at 0–150 Hz. This small airgun system should not be confused with the much larger system deployed from the Gilavar for deep-penetration seismic exploration for hydrocarbons.
These profiling systems complement each other since each system achieves different degrees of resolution and depths of sub-seafloor penetrations.

D-4 Monitoring in the Chukchi & Beaufort Seas: Shell Offshore, 2008
Side Scan Sonar SOI used a Datasonics SIS-1500 side scan sonar system to collect data on seafloor topography. Unlike
seismic profiling systems, which produce a vertical profile along the vessel’s path, side scan sonar systems provide graphic records that show two-dimensional (map) views of seafloor topography and of objects on the seafloor. The sonar images provide a swath display/record covering an area on the seafloor up to several hundred feet on both sides of the survey trackline. The side scan sonar transmits very high-frequency acoustic signals (190–210 kHz) and records the reflected energy from the seafloor. Signals reflected from the seafloor are displayed on a continuous record produced by a two-channel recorder. Reflected signals normally appear as dark areas on the record whereas shadows behind objects appear as light or white areas. The intensity and distribution of reflections displayed on the sonar image depend on the composition and surface texture of the reflecting features, on their size, and on their orientation with respect to the transducers. Line spacing and display range are designed to ensure 100 percent coverage of the proposed survey area in the prime survey line direction, with additional tie-lines acquired in an orthogonal direction. Side scan sonar data are useful for mapping areas of boulders, rock outcrops, and other areas of rough seafloor, and for determining the location and trends of seafloor scarps and ice gouges. These data are also used to locate shipwrecks, pipelines, and other objects on the seafloor. Multi-beam Bathymetry
A Seabat 8101 multi-beam bathymetric sonar was used to determine water depths in the surveyed area. Multi-beam bathymetric systems are either hull mounted or towed astern of the survey vessel. The system transmits acoustic signals (200–500 kHz; 240 kHz in this project) from multiple projectors propagating to either side of the vessel at angles that vary from vertical to near horizontal. The locations of the soundings cover a swath whose width may be equal to many times the water depth. By adjusting the spacing of the survey tracklines such that adjacent swaths overlap, SOI obtained depth information for 100 percent of the bottom in the survey area. The time required to receive the signals as well as signal intensity, position, and other characteristics for echoes received across the swath were used to calculate the depth where each individual beam in the swath reached the bottom. Acoustic systems similar to the ones used by SOI have been described in detail by NMFS previously (see 66 FR 40996, 6 Aug 2001; 70 FR 13466, 21 Mar 2005).

Appendix D: Description of Vessels and Equipment D-5
R/V Cape Flattery
The R/V Cape Flattery was built in 1990 by McDermott, Inc. and its home port is Seattle. The Cape Flattery has an overall length of 56.7 m (186 ft) and a width of 12.2 m (40 ft). The gross tonnage is 496 GRT. The Cape Flattery is powered by a Cummins KTA 50, 1250 hp engine with reinjes wav870 7x1 reduction gear and a bow thruster. The maximum speed of the Caper Flattery is 12 kt and fuel consumption is 1700 gal/day at 11 kt. The vessel has a fuel capacity of 246 m3 and a range of 6000 mi. There are three Cummins 1728 generator engines, three 650 kW generators, and one Cummins nt855 auxiliary power unit. The Cape Flattery had a 10-ton crane with a 72 in reach and a 3-ton knuckle boon with a 36 in reach. The draft when loaded is ~3.7 m (12 ft). The upper deck space on the Cape Flattery has 171 m2 (1840 ft2) of space on the main deck and 59 m2 (640 ft2) on the upper deck. The Cape Flattery will accommodate a crew of four plus 36 passengers.
The Cape Flattery conducted shallow hazards and site clearance surveys for SOI in the Chukchi Sea in 2008. High resolution profiling systems onboard the Cape Flattery included
• a small airgun array comprised of four-10in3 airguns;
• a Reson Seabat 7125 Multi-beam Echo Sounder;
• an Odom Echotrack MK III Echo Sounder;
• an Oceanscience UCTD;
• a 100 kHz side scan sonar;
• a 3.5 kHz sub-bottom profiler;
• a 400 Hz bubble pulser.

D-6 Monitoring in the Chukchi & Beaufort Seas: Shell Offshore, 2008
R/V Alpha Helix
In addition to the Henry C. SOI also used the R/V Alpha Helix to conduct shallow hazard surveys in the Beaufort Sea. The Alpha Helix later assisted the Cape Flattery during shallow hazards surveys in the Chukchi Sea.
The Alpha Helix is an oceanographic research vessel built in 1966. Its overall length is 40.5 m (133 ft) and the width is 9.4 m (31 ft) with a draft of 4.2 m (13.8 ft) when loaded. The gross tonnage is 289 GRT. The main engine is an EMD-8-567CR with a total of 820 horsepower at 800 rpm. The Alpha Helix has variable pitch propellers and cruising speed is 10 kt with a maximum speed to 11 kt. The range is 6500 miles at 9.5 kt. The Alpha Helix has three Detroit 8V71 diesel generators and is equipped with a 1500 kg (3300 lb) A frame, a S.W.L. deck crane, and a bow thruster. The fuel capacity is 87 m3 (29,250 gal) and the potable water storage capacity is 5000 gal. The aft deck is 1280 ft2, and the Alpha Helix has an 7.5 m2 (81 ft2)wet lab and a 42.5 m2 (457 ft2) dry lab. The Alpha Helix has an eight person crew with space for 15 scientists.
High resolution profiling systems onboard the Alpha Helix included
• a small airgun array comprised of to two-10in3 airguns;
• a 3.5 kHz sub-bottom profiler;

Appendix D: Description of Vessels and Equipment D-7
M/V Gulf Provider
The Gulf Provider was the Gilavar’s primary supply vessel and also served as monitoring vessel during the 2008 seismic surveys in the Chukchi and Beaufort seas. The Gulf Provider was built in Jennings, Louisiana, in 1979 and was re-built in 2001. The current port of registry is Panama. The overall length of the Gulf Provider is 57.8 m (190 ft) and the gross tonnage is 926 metric tons. The fuel capacity of the Gulf Provider is 530 m3 (140,000 gal) and the fuel consumption rate is 6-10 m3 (1585–2641 gal) per day. The Gulf Provider is powered by two Caterpillar D-399 diesel engines and is equipped with a waste oil and sludge incinerator.

D-8 Monitoring in the Chukchi & Beaufort Seas: Shell Offshore, 2008
M/V Theresa Marie
The Theresa Marie was built in Seattle in 1974 and the home port is Petersburg, Alaska. The overall length of the Theresa Marie is 28 m (93 ft) and the width is 9 m (30 ft) with a gross tonnage of 190 tons. The main deck is ~21 x 9 m (70 x 30 ft) and supports a module used for bunk space and showers, and a lounge area. A second module on the main deck houses a watermaker and space for heated storage. A 6-ton hydraulic crane with a safe working capacity of 2700 lbs and extended reach of 10 m (33 ft) is located on the port side. The vessel is powered by a 940 hp 16V149 Detroit diesel attached to a Twin Disc MG 5301 with 5.98:1 reduction driving a 1.9 m (76 in) propeller. A new drive train was installed in the Theresa Marie in 2002 and the vessel is capable of 10 kt. Two generators are onboard including a Detroit Series 50 engine with a 200 kW generator on the starboard side, and a 4–71 Detroit with a 125 kW generator on the port side. The Theresa Marie has a capacity of 30,000 gal of fuel, 4000 gal of fresh water, 750 gal of lube oil, 260 gal of hydraulic oil, 160 gal of waste oil, and a 250 gal sewage holding tank.
Appendix D: Description of Vessels and Equipment D-9
M/V Torsvik
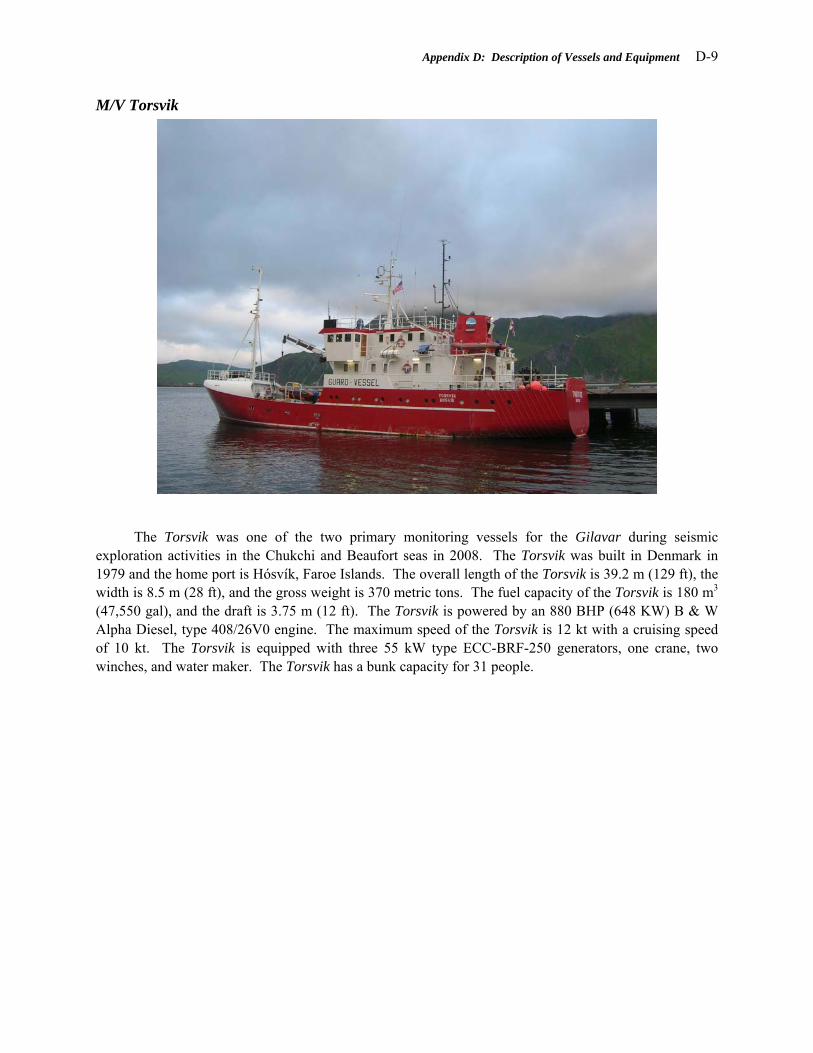
The Torsvik was one of the two primary monitoring vessels for the Gilavar during seismic exploration activities in the Chukchi and Beaufort seas in 2008. The Torsvik was built in Denmark in 1979 and the home port is Hósvík, Faroe Islands. The overall length of the Torsvik is 39.2 m (129 ft), the width is 8.5 m (28 ft), and the gross weight is 370 metric tons. The fuel capacity of the Torsvik is 180 m3 (47,550 gal), and the draft is 3.75 m (12 ft). The Torsvik is powered by an 880 BHP (648 KW) B & W Alpha Diesel, type 408/26V0 engine. The maximum speed of the Torsvik is 12 kt with a cruising speed of 10 kt. The Torsvik is equipped with three 55 kW type ECC-BRF-250 generators, one crane, two winches, and water maker. The Torsvik has a bunk capacity for 31 people.

D-10 Monitoring in the Chukchi & Beaufort Seas: Shell Offshore, 2008
MV Norseman II
The Norseman II was built in Seattle at the Marco Shipyard in 1979. In 2007 the Norseman II underwent major modification adding the new dinning, work area and lounge along with 4 staterooms and bathrooms. The vessel measures 115 ft in length, 27 ft wide and draws 13 ft when loaded. The main engine is a Caterpillar 398 operating at 850 hp. The gross tonnage is 199 tons. Fuel capacity is 44,000 gallons and cruising speed is 10.5 knots. The Norseman II operated as a chase/monitoring vessel for the Gilavar, and was involved in the deployment and retrieval of acoustic equipment in both the Chukchi and Beaufort seas in 2007.

Appendix E: Underwater Sound Measurement Results E-1
APPENDIX E: UNDERWATER SOUND MEASUREMENT RESULTS English Units Tables and Figures from Chapter 3
Table 1. MV Gilivar SSV coordinates, Kakapo Prospect, Alaska. (ref. Error! Reference source not found.)
Latitude Longitude UTM (N) UTM (E) DEPTH (ft)
OBH A 70.0440 N 165.7082 W 7770931 473024 140
OBH B 70.0370 N 145.6749 W 7770143 474284 130
OBH C 70.0088 N 165.5422 W 7766941 479313 130
OBH D 69.8792 N 164.9451 W 7752397 502107 120
OBH E 69.9932 N 165.8152 W 7765322 468873 140
OBH F 69.6643 N 166.4000 W 7729061 445701 130
Point X 70.0464 N 165.7192 W 7771207 472612 140
Start 70.4258 N 165.0134 W 7813353 469921 140
Stop 70.2066 N 165.4251 W 7788969 483949 140
Table 2. MV Gilivar SSV survey line and OBH deployment locations, and water depths for the Como prospect. (ref. Error! Reference source not found.)
Location Latitude Longitude Water Depth CPA (ft) OBH A 70° 58.714’W 151° 26.528’W 63.6 ft 2090 OBH B 70° 59.366’N 151° 25.265’W 64.6 ft 6790 OBH C 71° 02.034’N 151° 19.815’W 69.6 ft 26340 OBH D 71º 18.220’N 150º 46.510’W 78.7 ft 131490 OBH E 71º 00.520’N 151º 36.779’W 66.6 ft 280 OBH F 71º 14.492’N 152º 43.938’W 138 ft 147210
Gilivar Track Start 70º 43.460’N 150º 19.070’ W 63.0 ft – Gilivar Track End 70º 59.921’ N 151º 33.968’ W 65.9 ft –
Table 3. Deployment locations, water depth, and total deployment period (deployment to recovery) of the OBH recorders for the sound level measurements. (ref. Error! Reference source not found.)
OBH Latitude Longitude Water Depth Total Deployment Period (Hours)
S02 70° 24’ 27.5981” N 146° 02’ 28.8311” W 108 ft 17.3 S03 70° 24’ 05.3888” N 146° 03’ 24.6975” W 108 ft 17.1

E-2 Monitoring in the Chukchi & Beaufort Seas: Shell Offshore, 2008
Table 4. Forward-endfire sound level threshold distances for the full 3147 in3 airgun array. (ref. Error! Reference source not found.)
rms SPL (dB re 1 µPa) Best fit range (ft) 90th percentile range (ft) 190 1200 1500 180 3600 4600 170 10000 12000 160 26000 30000 120 360000 390000
Table 5. Broadside sound level threshold distances for the full 3147 in3 airgun array. (ref. Error! Reference source not found.)
rms SPL (dB re 1 µPa) Best fit range (ft) 90th percentile range (ft) 190 1800 2000 180 5600 6600 170 17000 19000 160 39000 43000 120 250000* 250000*
*Extrapolated from maximum measurement range of 34.9 km (21.7 mi).
Table 6. Sound level threshold distances for the 30 in3 mitigation airgun. (ref. Error! Reference source not found.)
rms SPL (dB re 1 µPa) Best fit range (ft) 90th percentile range (ft) 190 460* 520* 180 1000* 1200* 170 2300* 2700* 160 5200* 6200* 120 130000 150000
*Extrapolated from minimum measurement range of 8 km (5 mi).
Table 7. Maximum cumulative SEL for each OBH off the seismic survey line. (ref. Error! Reference source not found.)
Cumulative SEL (dB re 1 µPa2s) Distance off seismic survey
line Flat-weighted Low Frequency Cetaceans
Mid-Frequency Cetaceans
High Frequency Cetaceans
Pinnipeds underwater
0.31 mi 196.3 195.8 186.1 184.0 190.0 1.2 mi 190.8 190.3 182.7 180.8 185.9 5 mi 185.6 185.5 180.5 178.6 183.4

Appendix E: Underwater Sound Measurement Results E-3
Table 8. Best fit (least squares) equation to cumulative SEL vs. range for different m-weighting and distances to injury criterion proposed by Southall et al. (2007). (ref. Error! Reference source not found.)
Weighting Best fit equation Injury Criteria (dB re 1 µPa2s)
Distance to Injury Criteria (ft)
Flat RL = 193.6 – 8.9 LOG R - - LFC RL = 193.1 – 8.6 LOG R 198 890 MFC RL = 184.5 – 4.7 LOG R 198 3 HFC RL = 182.5 – 4.5 LOG R 198 3 PINN RL = 188.1 – 5.5 LOG R 186 7900
Table 9. Sound level threshold distances for the support vessel RV Norseman II at 10.4 kts. (ref. Error! Reference source not found.)
rms SPL (dB re 1 µPa) Best fit range (ft) 90th percentile range (ft) 140 100 190 130 620 1100 120 3600 7000
Table 10. Sound level threshold distances for the MV Gilavar at 3.8 kts. (ref. Error! Reference source not found.)
rms SPL (dB re 1 µPa) Best fit range (ft) 90th percentile range (ft) 140 720* 890* 130 4600 5600 120 29000 36000
*Extrapolated from minimum measurement range of 500 m (0.31 mi).
Table 11. Aft sound level threshold distances for the Gulf Provider at 12.6 kts. (ref. Error! Reference source not found.)
rms SPL (dB re 1 µPa) Best fit range (ft) 90th percentile range (ft) 140 250* 310* 130 3000 3600 120 30000 43000
*Extrapolated from minimum measurement range of 350 m (1150 ft).
Table 12. Forward sound level threshold distances for the Gulf Provider at 12.6 kts. (ref. Error! Reference source not found.)
rms SPL (dB re 1 µPa) Best fit range (ft) 90th percentile range (ft) 140 110* 130* 130 890* 1000* 120 6900 7900
*Extrapolated from minimum measurement range of 350 m (1150 ft).

E-4 Monitoring in the Chukchi & Beaufort Seas: Shell Offshore, 2008
Table 13. Aft sound level threshold distances for the Torsvik at 12.0 kts. (ref. Error! Reference source not found.)
rms SPL (dB re 1 µPa) Best fit range (ft) 90th percentile range (ft) 140 240* 260* 130 1500 1600 120 9200 10000
*Extrapolated from minimum measurement range of 630 m (2060 ft).
Table 14. Forward sound level threshold distances for the Torsvik at 12.0 kts. (ref. Error! Reference source not found.)
rms SPL (dB re 1 µPa) Best fit range (ft) 90th percentile range (ft) 140 52* 72* 130 490 700 120 4300 5900
*Extrapolated from minimum measurement range of 630 m (2060 ft).
Table 15. Sound level threshold distances for the Theresa Marie at 10.5 kts. (ref. Error! Reference source not found.)
rms SPL (dB re 1 µPa) Best fit range (ft) 90th percentile range (ft) 140 52* 79* 130 820 1200 120 13000 19000
*Extrapolated from minimum measurement range of 100 m (330 ft).
Table 16 - Times, locations, and water depths of the twelve temperature and salinity profile casts obtained during the present study. (ref. Error! Reference source not found.)
Station Time (AKDT) Latitude Longitude Max Depth (ft) OBH A 5/Sep/08 11:16 70º 58.7’N 151º 25.5’W 62 OBH A 6/Sep/08 12:28 70º 58.7’N 151º 25.5’W 62 OBH B 5/Sep/08 12:38 70º 59.4’N 151º 25.3’W 62 OBH B 6/Sep/08 12:54 70º 59.4’N 151º 25.3’W 62 OBH C 5/Sep/08 13:32 71º 02.0’N 151º 19.8’W 69 OBH C 6/Sep/08 13:51 71º 02.0’N 151º 19.8’W 69 OBH D 5/Sep/08 16:12 71º 18.2’N 151º 26.5’W 290* OBH D 6/Sep/08 17:45 71º 18.2’N 151º 26.5’W 490* OBH E 5/Sep/08 10:29 71º 00.5’N 151º 36.8’W 62 OBH E 6/Sep/08 11:25 71º 00.5’N 151º 36.8’W 62 OBH F 5/Sep/08 07:03 71º 14.5’N 152º 43.9’W 130 OBH F 6/Sep/08 08:08 71º 14.5’N 152º 43.9’W 130
*Depths are different here because of a lack of rope on 5-Sep. Also, the maximum operating depth of the CTD profiler was 150 m (490 ft).

Appendix E: Underwater Sound Measurement Results E-5
Table 17. Forward-endfire sound level threshold distances for the full 3147 in3 airgun array. (ref. Error! Reference source not found.)
rms SPL (dB re 1 µPa) Best fit range (ft) 90th percentile range (ft) 190 79 (†) 170 (†) 180 690 1400 170 4900 9200 160 22000 31000 150 52000 66000 140 89000 100000 130 130000 150000 120 180000 190000
(†) Distances to the 190 dB re µPa level were extrapolated from data at longer ranges.
Table 18. Broadside sound level threshold distances for the full 3147 in3 airgun array. (ref. Error! Reference source not found.)
rms SPL (dB re 1 µPa) Best fit range (ft) 90th percentile range (ft) 190 2,500 3,000 180 8,200 9,500 170 18,000 19,000 160 30,000 31,000 150 – (†) – (†) 140 – (†) – (†) 130 – (†) – (†) 120 ≤ 150,000 (‡) ≤ 150,000 (‡)
(†) Due to the presence of interfering airgun signals on OBH D (45 km, or 28 mi, range at CPA), broadside threshold ranges between 150 dB and 130 dB re 1 µPa could not be accurately estimated.
(‡) The level of the interfering airgun signals on OBH D was approximately 120 dB re µPa. Therefore the 120 dB re 1 µPa threshold range for was constrained to less than 45 km, or 28 mi, from the array.
Table 19. Broadside sound level threshold distances for the 30 in3 mitigation airgun. (ref. Error! Reference source not found.)
rms SPL (dB re 1 µPa) Best fit range (ft) 90th percentile range (ft) 190 30 (†) 43 (†) 180 150 190 170 690 890 160 3000 3,600 150 10,000 12,000 140 26,000 29,000 130 49,000 52,000 120 75,000 79,000
(†) Distances to the 190 dB re 1 µPa level were extrapolated from data at longer ranges.

E-6 Monitoring in the Chukchi & Beaufort Seas: Shell Offshore, 2008
Table 20. Maximum cumulative SEL for each OBH off the seismic survey line. (ref. Error! Reference source not found.)
Cumulative SEL (dB re 1 µPa2s) Distance off seismic survey
line Flat-weighted Low Frequency Cetaceans
Mid-Frequency Cetaceans
High Frequency Cetaceans
Pinnipeds underwater
0.4 mi 189.5 189.5 185.5 183.7 188.0 1.2 mi 186.7 186.6 182.9 181.2 185.4 5 mi 174.2 174.2 171.6 170.3 173.4
Table 21. Sound threshold level distances for 190, 180, 170, 160 and 120 dB re 1 µPa (rms) from 2 x 10 in3 airgun array. (ref. Error! Reference source not found.)
rms SPL (dB re 1 µPa) Best fit range (ft) 90th percentile range (ft) 190 110* 150* 180 300* 390* 170 790 1050 160 2070 2700 120 49000 59000
*Extrapolated from minimum measurement range of 190 m (623 ft).
Table 22. Sound threshold level distances for 190, 180, 170, 160 and 120 dB re 1 µPa (rms) from single 10 in3 airgun. (ref. Error! Reference source not found.)
rms SPL (dB re 1 µPa) Best fit range (ft) 90th percentile range (ft) 190 130* 170* 180 295* 390* 170 660 850 160 1400 1900 120 36000 46000
*Extrapolated from minimum measurement range of 190 m (620 ft).
Table 23. Sound threshold level distances for 160, 150, 140, 130 and 120 dB re 1 µPa (rms) from the Geopulse sub-bottom profiler. (ref. Error! Reference source not found.)
rms SPL (dB re 1 µPa) Best fit range (ft) 90th percentile range (ft) 190 36* 46* 180 82* 98* 170 180* 210* 160 390* 460* 120 850 1020
*Extrapolated from minimum measurement range of 190 m (620 ft).

Appendix E: Underwater Sound Measurement Results E-7
Table 24. Sound threshold level distances for 120-150 dB re 1 µPa (rms) for the RV Alpha Helix sailing at 4.5 kts during operation of the 2 x 10 in3 airgun array. (ref. Error! Reference source not found.)
rms SPL (dB re 1 µPa) Best fit range (ft) 90th percentile range (ft) 150 3.3* 3.3* 140 23* 36* 130 240* 360 120 2400 1020
*Extrapolated from minimum measurement range of 90 m (295 ft).
Table 25. Sound threshold level distances for 190, 180, 170, 160 and 120 dB re 1 µPa (rms) from 2 x 10 in3 airgun array. (ref. Error! Reference source not found.)
rms SPL (dB re 1 µPa) Best fit range (ft) 90th percentile range (ft) 190 23* 33* 180 89* 120* 170 330 460 160 1200 1600 120 49000 52000
*Extrapolated from minimum measurement range of 90 m (295 ft).
Table 26. Sound threshold level distances for 190, 180, 170, 160 and 120 dB re 1 µPa (rms) from single 10 in3 airgun. (ref. Error! Reference source not found.)
rms SPL (dB re 1 µPa) Best fit range (ft) 90th percentile range (ft) 190 13* 13* 180 46* 59* 170 190* 240* 160 760 920 120 46000 52000
*Extrapolated from minimum measurement range of 90 m (295 ft).
Table 27. Sound threshold level distances for 160, 150, 140, 130 and 120 dB re 1 µPa (rms) from Datasonics SPR-1200 Bubble Pulser sub-bottom profiler. (ref. Error! Reference source not found.)
rms SPL (dB re 1 µPa) Best fit range (ft) 90th percentile range (ft) 160 20* 30* 150 75* 110* 140 280* 390 130 1020 1400 120 3300 4600
*Extrapolated from minimum measurement range of 90 m (295 ft).

E-8 Monitoring in the Chukchi & Beaufort Seas: Shell Offshore, 2008
Table 28. Sound threshold level distances for 160, 150, 140, 130 and 120 dB re 1 µPa (rms) from the ODEC Strata Box sub-bottom profiler. (ref. Error! Reference source not found.)
rms SPL (dB re 1 µPa) Best fit range (ft) 90th percentile range (ft) 160 7* 10* 150 30* 39* 140 130* 170* 130 560 760 120 2400 3200
*Extrapolated from minimum measurement range of 90 m (295 ft).
Table 29. Sound threshold level distances for 120-150 dB re 1 µPa (rms) for the MV Henry Christofferson sailing at 3.5 kts during operation of the 2 x 10 in3 airgun array. (ref. Error! Reference source not found.)
rms SPL (dB re 1 µPa) Best fit range (ft) 90th percentile range (ft) 150 - - 140 43* 59* 130 560 790 120 7500 10000
*Extrapolated from minimum measurement range of 90 m (295 ft).
Table 30. Sound threshold level distances for 120-150 dB re µPa (rms) for the MV Henry Christofferson sailing at full speed (10 kts). (ref. Error! Reference source not found.)
rms SPL (dB re 1 µPa) Best fit range (ft) 90th percentile range (ft) 150 20* 36* 140 150* 250* 130 1100 1800 120 7900 13000
*Extrapolated from minimum measurement range of 90 m (295 ft).
Table 31. Sound threshold level distances for 160, 150, 140, 130 and 120 dB re 1 µPa (rms) for the sub-bottom profiler (3.5 kHz). (ref. Error! Reference source not found.)
rms SPL (dB re 1 µPa) Best fit range (ft) 90th percentile range (ft) 160 16* 20* 150 49* 62* 140 150* 200* 130 490* 620* 120 1600 2000
*Extrapolated from minimum measurement range of 200 m (660 ft).

Appendix E: Underwater Sound Measurement Results E-9
Table 32. Sound threshold level distances for 100-140 dB re 1 µPa (rms) for the Alpha Helix sailing at 4.5 kts. (ref. Error! Reference source not found.)
rms SPL (dB re 1 µPa) Best fit range (ft) 90th percentile range (ft) 140 23* 30* 130 150* 220* 120 1100 1500 110 7500 11000 100 52000‡ 79000‡
*Extrapolated from minimum measurement range of 200 m (660 ft). ‡Extrapolated from maximum measurement range of 8000 m (5 mi).
Table 33. Sound threshold level distances to 190, 180, 170, 160 and 120 dB re 1 μPa (rms) for the 4 x 10 in3 airgun array. (ref. Error! Reference source not found.)
rms SPL (dB re 1 µPa) Best fit range (ft) 90th percentile range (ft) 190 150* 160* 180 460* 530* 170 1400 1600 160 3900 4600 120 75000‡ 79000‡
*Extrapolated from minimum measurement range of 194 m (640 ft). ‡Extrapolated from maximum measurement range of 15000 m (9.3 mi).
Table 34. Sound threshold level distances to 190, 180, 170, 160 and 120 dB re 1 μPa (rms) for the 2 x 10 in3 airgun array. (ref. Error! Reference source not found.)
rms SPL (dB re 1 µPa) Best fit range (ft) 90th percentile range (ft) 190 46* 56* 180 160* 200* 170 660* 760 160 2400 2700 120 79000‡ 82000‡
*Extrapolated from minimum measurement range of 208 m (680 ft). ‡Extrapolated from maximum measurement range of 15000 m (9.3 mi).
Table 35. Sound threshold level distances to 190, 180, 170, 160 and 120 dB re 1 μPa (rms) for a single 10 in3 airgun. (ref. Error! Reference source not found.)
rms SPL (dB re 1 µPa) Best fit range (ft) 90th percentile range (ft) 190 23* 26* 180 92* 105* 170 330* 390* 160 1200 1400 120 49000 52000‡
*Extrapolated from minimum measurement range of 199 m (653 ft). ‡Extrapolated from maximum measurement range of 15000 m (9.3 mi).

E-10 Monitoring in the Chukchi & Beaufort Seas: Shell Offshore, 2008
Table 36: Sound threshold level distances for 160, 150, 140, 130 and 120 dB re 1 μPa (rms) for the sub-bottom profiler (3.5 kHz). (ref. Error! Reference source not found.)
rms SPL (dB re 1 µPa) Best fit range (ft) 90th percentile range (ft) 160 36* 59* 150 110* 170* 140 320* 490 130 920 1400 120 2500 3600
*Extrapolated from minimum measurement range of 197 m (650 ft).
Table 37: Sound threshold level distances for 160, 150, 140, 130 and 120 dB re 1 μPa (rms) from bubble pulser (400 Hz) sub-bottom profiler. (ref. Error! Reference source not found.)
rms SPL (dB re 1 µPa) Best fit range (ft) 90th percentile range (ft) 160 3* 10* 150 23* 52* 140 160* 330* 130 850 1500 120 3000 4300
*Extrapolated from minimum measurement range of 151 m (495 ft).
Table 38: Sound threshold level distances for 100-140 dB re 1 μPa (rms) for the Cape Flattery (vessel noise alone) sailing at 4.0 kts while towing the airgun array. (ref. Error! Reference source not found.)
rms SPL (dB re 1 µPa) Best fit range (ft) 90th percentile range (ft) 140 20* 30* 130 130* 180* 120 850 1200 110 5600 7500 100 36000‡ 49000‡
*Extrapolated from minimum measurement range of 208 m (680 ft). ‡Extrapolated from maximum measurement range of 8000 m (5 mi).
Table 39. Sound threshold level distances for 100-140 dB re 1 µPa for the Norseman II sailing at 17.6 km/h (9.5 kts). (ref. Error! Reference source not found.)
rms SPL (dB re 1 µPa) Best fit range (ft) 90th percentile range (ft) 140 320 430 130 900 1100 120 2400 3100 110 6200 8200 100 17000 22000

Appendix E: Underwater Sound Measurement Results E-11
Table 40. Sound threshold level distances for 100-140 dB re 1 µPa for the Arctic Seal sailing at 18.5 km/h (10 kts). (ref. Error! Reference source not found.)
rms SPL (dB re 1 µPa) Best fit range (ft) 90th percentile range (ft) 140 280* 360 130 790* 1100 120 2200 2900 110 6200 8200 100 17000 23000
Table 41. Sound threshold level distances for 100-140 dB re 1 µPa for the Point Barrow sailing at 11.5 km/h (6.2 kts). (ref. Error! Reference source not found.)
rms SPL (dB re 1 µPa) Best fit range (ft) 90th percentile range (ft) 140 95 290 130 360 1100 120 1300 3900 110 4900 15000 100 19000 56000
Table 42. Sound threshold level distances for 100-140 dB re 1 µPa for the Annika Marie sailing at 5 kts. (ref. Error! Reference source not found.)
rms SPL (dB re 1 µPa) Best fit range (ft) 90th percentile range (ft) 140 89 160 130 270 460 120 760 1400 110 2300 3900 100 6600 12000
Table 43. Sound level threshold horizontal distances for the support vessel Maxime sailing at 8 kts. (ref. Error! Reference source not found.)
rms SPL (dB re 1 µPa) Best fit range (ft) 90th percentile range (ft) 140 26* 36* 130 120 150 120 490 620 110 2000 2600 100 8200 11000
*Extrapolated from minimum horizontal measurement distance of 20 m (66 ft).
E-12 Monitoring in the Chukchi & Beaufort Seas: Shell Offshore, 2008
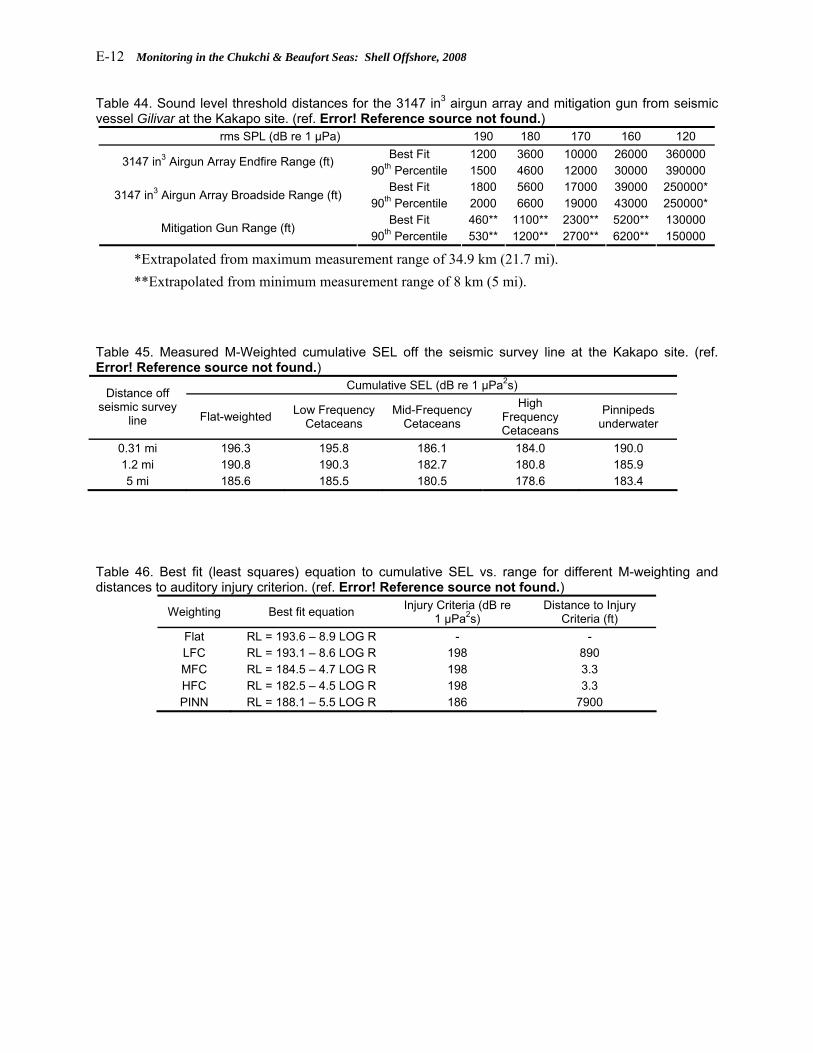
Table 44. Sound level threshold distances for the 3147 in3 airgun array and mitigation gun from seismic vessel Gilivar at the Kakapo site. (ref. Error! Reference source not found.)
rms SPL (dB re 1 µPa) 190 180 170 160 120 Best Fit 1200 3600 10000 26000 360000 3147 in3 Airgun Array Endfire Range (ft)
90th Percentile 1500 4600 12000 30000 390000 Best Fit 1800 5600 17000 39000 250000*
3147 in3 Airgun Array Broadside Range (ft) 90th Percentile 2000 6600 19000 43000 250000*
Best Fit 460** 1100** 2300** 5200** 130000 Mitigation Gun Range (ft)
90th Percentile 530** 1200** 2700** 6200** 150000
*Extrapolated from maximum measurement range of 34.9 km (21.7 mi). **Extrapolated from minimum measurement range of 8 km (5 mi).
Table 45. Measured M-Weighted cumulative SEL off the seismic survey line at the Kakapo site. (ref. Error! Reference source not found.)
Cumulative SEL (dB re 1 µPa2s) Distance off seismic survey
line Flat-weighted Low Frequency Cetaceans
Mid-Frequency Cetaceans
High Frequency Cetaceans
Pinnipeds underwater
0.31 mi 196.3 195.8 186.1 184.0 190.0 1.2 mi 190.8 190.3 182.7 180.8 185.9 5 mi 185.6 185.5 180.5 178.6 183.4
Table 46. Best fit (least squares) equation to cumulative SEL vs. range for different M-weighting and distances to auditory injury criterion. (ref. Error! Reference source not found.)
Weighting Best fit equation Injury Criteria (dB re 1 µPa2s)
Distance to Injury Criteria (ft)
Flat RL = 193.6 – 8.9 LOG R - - LFC RL = 193.1 – 8.6 LOG R 198 890 MFC RL = 184.5 – 4.7 LOG R 198 3.3 HFC RL = 182.5 – 4.5 LOG R 198 3.3 PINN RL = 188.1 – 5.5 LOG R 186 7900
Appendix E: Underwater Sound Measurement Results E-13
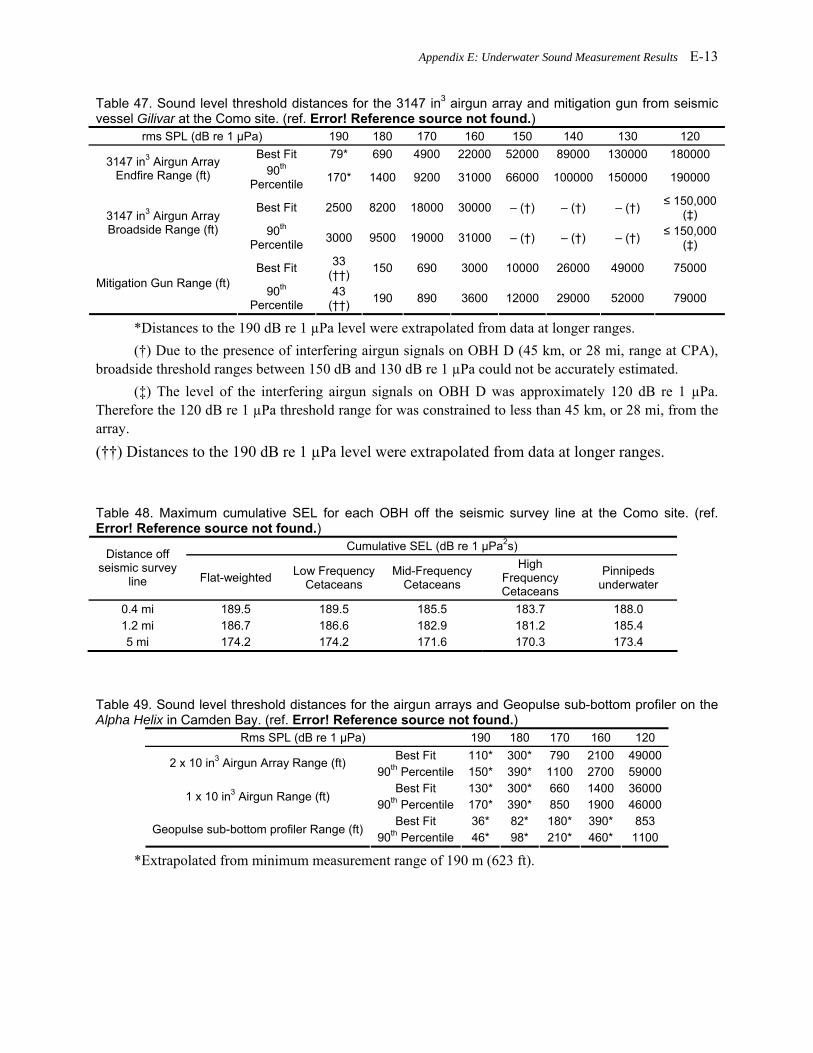
Table 47. Sound level threshold distances for the 3147 in3 airgun array and mitigation gun from seismic vessel Gilivar at the Como site. (ref. Error! Reference source not found.)
rms SPL (dB re 1 µPa) 190 180 170 160 150 140 130 120 Best Fit 79* 690 4900 22000 52000 89000 130000 180000 3147 in3 Airgun Array
Endfire Range (ft) 90th Percentile 170* 1400 9200 31000 66000 100000 150000 190000
Best Fit 2500 8200 18000 30000 – (†) – (†) – (†) ≤ 150,000 (‡) 3147 in3 Airgun Array
Broadside Range (ft) 90th Percentile 3000 9500 19000 31000 – (†) – (†) – (†) ≤ 150,000
(‡)
Best Fit 33 (††) 150 690 3000 10000 26000 49000 75000
Mitigation Gun Range (ft) 90th
Percentile 43
(††) 190 890 3600 12000 29000 52000 79000
*Distances to the 190 dB re 1 µPa level were extrapolated from data at longer ranges. (†) Due to the presence of interfering airgun signals on OBH D (45 km, or 28 mi, range at CPA),
broadside threshold ranges between 150 dB and 130 dB re 1 µPa could not be accurately estimated. (‡) The level of the interfering airgun signals on OBH D was approximately 120 dB re 1 µPa.
Therefore the 120 dB re 1 µPa threshold range for was constrained to less than 45 km, or 28 mi, from the array. (††) Distances to the 190 dB re 1 µPa level were extrapolated from data at longer ranges. Table 48. Maximum cumulative SEL for each OBH off the seismic survey line at the Como site. (ref. Error! Reference source not found.)
Cumulative SEL (dB re 1 µPa2s) Distance off seismic survey
line Flat-weighted Low Frequency Cetaceans
Mid-Frequency Cetaceans
High Frequency Cetaceans
Pinnipeds underwater
0.4 mi 189.5 189.5 185.5 183.7 188.0 1.2 mi 186.7 186.6 182.9 181.2 185.4 5 mi 174.2 174.2 171.6 170.3 173.4
Table 49. Sound level threshold distances for the airgun arrays and Geopulse sub-bottom profiler on the Alpha Helix in Camden Bay. (ref. Error! Reference source not found.)
Rms SPL (dB re 1 µPa) 190 180 170 160 120 Best Fit 110* 300* 790 2100 49000 2 x 10 in3 Airgun Array Range (ft)
90th Percentile 150* 390* 1100 2700 59000 Best Fit 130* 300* 660 1400 36000
1 x 10 in3 Airgun Range (ft) 90th Percentile 170* 390* 850 1900 46000
Best Fit 36* 82* 180* 390* 853 Geopulse sub-bottom profiler Range (ft)
90th Percentile 46* 98* 210* 460* 1100
*Extrapolated from minimum measurement range of 190 m (623 ft).

E-14 Monitoring in the Chukchi & Beaufort Seas: Shell Offshore, 2008
Table 50. Sound level threshold distances for the airgun arrays, bubble pulser, and ODEC Strata box from the Henry C in Camden Bay. (ref. Error! Reference source not found.)
rms SPL (dB re 1 µPa) 190 180 170 160 120 Best Fit 23* 89* 330 1200 49000 2 x 10 in3 Airgun Array Range (ft)
90th Percentile 33* 120* 460 1600 52000 Best Fit 13* 46* 190* 760 46000
1 x 10 in3 Airgun Range (ft) 90th Percentile 13* 59* 240* 920 52000
Best Fit 20* 75* 280* 1000 3300 Datasonics SPR-1200 Bubble Pulser Range (ft) 90th Percentile 30* 110* 390 1400 4600
Best Fit 7* 30* 130* 560 2400 ODEC Strata Box
90th Percentile 10* 39* 170* 760 3200
*Extrapolated from minimum measurement range of 90 m (295 ft).
Table 51. Sound threshold level distances for the Geopulse sub-bottom profiler (3.5 kHz) on the Alpha Helix in the Chukchi Sea. (ref. Error! Reference source not found.)
rms SPL (dB re 1 µPa) 190 180 170 160 120 Best Fit (ft) 16* 49* 490* 490* 1600
90th Percentile (ft) 20* 62* 200* 620* 2000
*Extrapolated from minimum measurement range of 200 m (660 ft).
Table 52. Sound level threshold distances for the airgun array configurations and sub-bottom profilers on the Cape Flattery in the Chukchi Sea. (ref. Error! Reference source not found.)
rms SPL (dB re 1 µPa) 190 180 170 160 120 Best Fit 150* 460* 1400 3900 75000‡ 4 x 10 in3 Airgun Array Range (ft)
90th Percentile 160* 530* 1600 4600 79000‡ Best Fit 46* 160* 660* 2400 79000‡
2 x 10 in3 Airgun Array Range (ft) 90th Percentile 56* 200* 760 2700 82000‡
Best Fit 23* 92* 330* 1200 49000 1 x 10 in3 Airgun Range (ft)
90th Percentile 26* 110* 390* 1400 52000‡ Best Fit 36 (†) 110 (†) 320 (†) 920 2500
Sub-bottom Profiler Range (ft) 90th Percentile 59 (†) 170 (†) 490 1400 3600
Best Fit 3** 23** 160** 850 3000 Bubble Pulser
90th Percentile 10** 52** 330** 1500 4300
*Extrapolated beyond the minimum measurement range of 190 m (623 ft). ‡Extrapolated from maximum measurement range of 15000 m (9.3 mi). (†)Extrapolated from minimum measurement range of 197 m (646 ft). **Extrapolated from minimum measurement range of 151 m (495 ft).
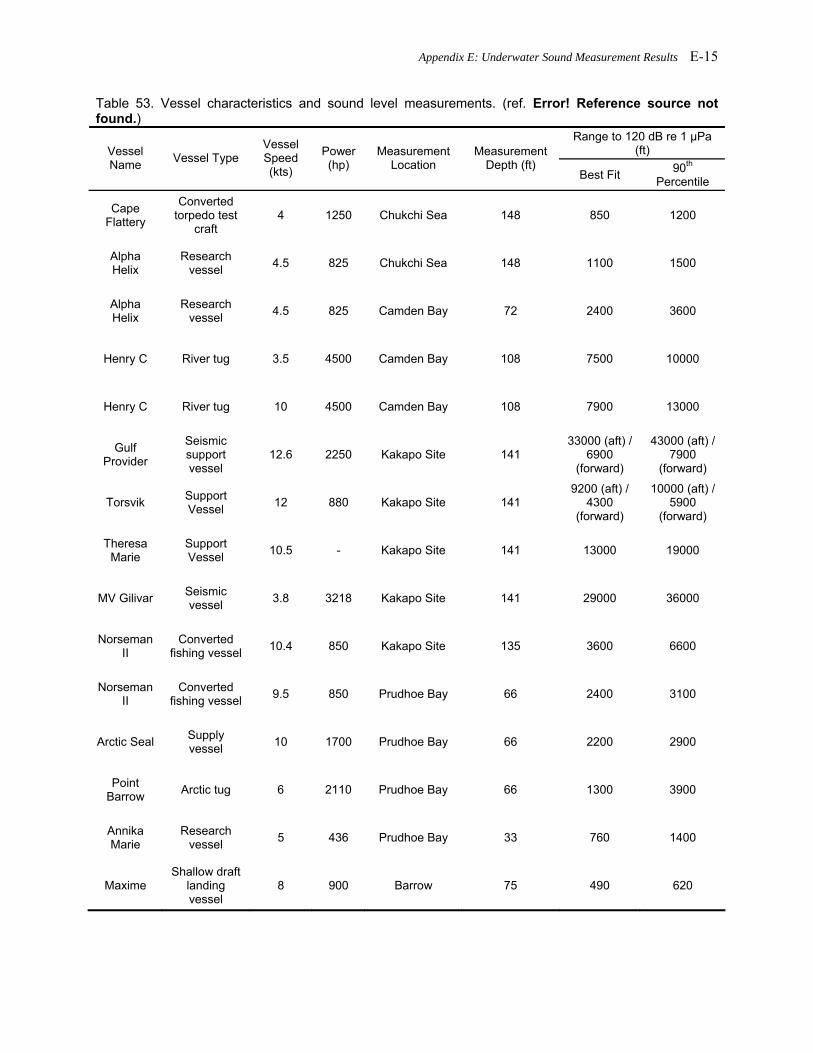
Appendix E: Underwater Sound Measurement Results E-15
Table 53. Vessel characteristics and sound level measurements. (ref. Error! Reference source not found.)
Range to 120 dB re 1 µPa (ft) Vessel
Name Vessel Type Vessel Speed (kts)
Power (hp)
Measurement Location
Measurement Depth (ft)
Best Fit 90th Percentile
Cape Flattery
Converted torpedo test
craft 4 1250 Chukchi Sea 148 850 1200
Alpha Helix
Research vessel 4.5 825 Chukchi Sea 148 1100 1500
Alpha Helix
Research vessel 4.5 825 Camden Bay 72 2400 3600
Henry C River tug 3.5 4500 Camden Bay 108 7500 10000
Henry C River tug 10 4500 Camden Bay 108 7900 13000
Gulf Provider
Seismic support vessel
12.6 2250 Kakapo Site 141 33000 (aft) /
6900 (forward)
43000 (aft) / 7900
(forward)
Torsvik Support Vessel 12 880 Kakapo Site 141
9200 (aft) / 4300
(forward)
10000 (aft) / 5900
(forward)
Theresa Marie
Support Vessel 10.5 - Kakapo Site 141 13000 19000
MV Gilivar Seismic vessel 3.8 3218 Kakapo Site 141 29000 36000
Norseman II
Converted fishing vessel 10.4 850 Kakapo Site 135 3600 6600
Norseman II
Converted fishing vessel 9.5 850 Prudhoe Bay 66 2400 3100
Arctic Seal Supply vessel 10 1700 Prudhoe Bay 66 2200 2900
Point Barrow Arctic tug 6 2110 Prudhoe Bay 66 1300 3900
Annika Marie
Research vessel 5 436 Prudhoe Bay 33 760 1400
Maxime Shallow draft
landing vessel
8 900 Barrow 75 490 620


Appendix F: Monitoring, Mitigation, and Data Analysis F-1
APPENDIX F: DETAILS OF MONITORING, MITIGATION, AND ANALYSIS METHODS
This appendix provides details on the standard visual and acoustic monitoring methods and data analysis techniques implemented for this project and previous seismic studies. Five marine mammal observers (MMOs) were aboard the Gilavar throughout the cruise. Three MMOs were biologists experienced in marine mammal identification and observation methods and the other two MMOs were Inupiat with various levels of experience identifying arctic marine mammals. In addition to the MMOs onboard the Gilavar, SOI placed 3-4 MMOs on each of the chase and support vessels. MMOs generally worked 2-4 hr shifts for up to 12 hrs per day during a 6-week shift before being replaced by other MMOs.
All MMOs participated in extensive safety training and a 2-14 day observer training course, depending on previous MMO experience, designed to familiarize them with the operational and data recording procedures, reporting protocols, and IHA stipulations. The IHA stipulations and requirements were also explained to the Operations Manager and Head Airgun Operator(s) aboard the Gilavar and other source vessels during a meeting prior to seismic operations. MMO duties included
recording environmental and sighting conditions; searching for and identifying marine mammals, and recording their numbers, distances from the
vessel, and behavior; recording possible reactions of marine mammals to the seismic operations; and initiating mitigation measures when appropriate.
Visual Monitoring for Marine Mammals Vessel-based observers monitored marine mammals from seismic source vessels (Gilavar, Henry
C., Alpha Helix, Cape Flattery) during all daytime seismic operations, and during any nighttime power ups of the airgun(s), as specified in the IHAs. MMOs onboard the chase vessels also monitored marine mammals during much of the time that seismic operations were occurring. Seismic operations were suspended or amended when marine mammals were observed within, or about to enter, designated safety zones described in the IHAs. In general, vessel-based observations for marine mammals were conducted using the following guidelines:
Observations during daylight hours were conducted in good and poor visibility whenever the airgun(s) were operating, and by two observers when possible, unless precluded by safety considerations.
MMOs observed during transit periods without airgun operations, at the discretion of the lead MMO, to obtain baseline data on marine mammal distribution and (in the case of less experienced observers) to become more familiar with observation protocols.
Two MMOs observed for 30 min prior to the planned start of seismic operations after an extended shut down and the entirety of the ≥180 dB radius was required to be visible for those 30 min.
When the airgun array was powered up at night, two MMOs watched for marine mammals, using night vision devices, for 30 min prior to start up. (Note that there was 24-hour daylight until late August.)
At least one MMO was on stand-by during ongoing seismic operations at night, but was not necessarily on watch.
Bridge personnel watched for marine mammals during seismic operations at night and were required to call for the airgun(s) to be shut down if a marine mammal was observed within or
F-2 Monitoring in the Chukchi & Beaufort Seas: Shell Offshore, 2008
about to enter the applicable safety zone. Bridge personnel also notified the MMO on stand-by if marine mammals were observed in or about to enter the safety radii.
MMOs also recorded locations and movements of vessels when on watch; information regarding vessels as well as marine mammals was recorded in a database.
From the duty station, MMO(s) systematically scanned the area around the vessel in a sweeping pattern, usually alternating scan sweeps between reticle binoculars (e.g., Fujinon 7 × 50) and the unaided eye during the daytime. Observations were focused forward and to the sides of the vessel in an arc of ~210º, but MMOs also regularly checked for the presence of marine mammals astern of the vessel. Night vision devices were used aboard seismic source vessels during non-daylight hours using a similar sweep search pattern.
The duration of a single visual shift was no longer than 4 hr to minimize observer fatigue. Use of two observers simultaneously was desirable and was scheduled when possible to increase detection of marine mammals near the source vessel. In addition to the dedicated MMOs, bridge personnel were instructed and assisted in detecting marine mammals, implementing mitigation requirements, and collecting data when possible.
While on watch, MMOs kept systematic written records of the vessel’s position, activity, and environmental conditions using codes that were entered either onto a datasheet and later transcribed onto database, or entered directly into a database using a hand-held computer. Vessel and environmental data were recorded onto the datasheet every 30 min or whenever conditions changed significantly. Additional data were recorded when marine mammals were observed. For all records, the date and time, vessel position (longitude and latitude), and environmental conditions were recorded. The database was constructed to prevent entry of out-of-range values and codes. Data entries were checked manually by comparing listings of the computerized data with the original handwritten datasheets, both in the field and upon later analyses.
The following information was recorded for each marine mammal sighting: date, time, species, total number of individuals, number of juveniles, bearing relative to vessel’s heading, direction of movement relative to the vessel, distance from the vessel, behavior when sighted, whether animal was in the water or hauled out on ice or land, behavioral pace, reaction to the vessel, vessel position, water depth, observer initials, species identification reliability, and the time that mitigation measures were requested (if necessary). On the seismic vessel, distance to marine mammals was measured from the MMO’s location on the bridge rather than from the nominal center of the seismic source. The distance of the animal from the airgun array was calculated using a GIS during data error checking and processing at the end of the season. However, for sightings near or within the safety radius in effect at the time, the distance from the marine mammal to the nearest airgun was estimated and recorded for the purposes of implementing power downs or shut downs. The bearing from the vessel to individual or groups of marine mammals was estimated using positions on a clock face, with the bow of the vessel considered to be 12 o’clock and the stern 6 o’clock.
Operational activities that were recorded by MMOs onboard seismic vessels included the number of airguns in use, total volume of the airguns, and the type of vessel/seismic activity. Intra-ship communication between seismic technicians and MMOs was conducted via radio or telephone and used to alert MMOs of any changes in operations, and to request power or shut downs by MMOs. The position of the vessel was logged every 60 sec by the ships navigational system and these data were integrated with the marine mammal database to check for data recording errors. Details regarding the seismic activities (start and stop times, number of guns firing, etc.) was collected from the airgun operators log and also used to error check MMO data.

Appendix F: Monitoring, Mitigation, and Data Analysis F-3
Marine Mammal Mitigation During Operations The following mitigation measures were adopted for marine mammal sightings during the
proposed seismic program, provided that doing so did not compromise operational safety requirements: ramp ups, power ups, shut downs, power downs, and course alterations. Ramp Up
A ramp up is a process commonly used by seismic vessels with large airgun arrays that involves a gradual increase in the number of airguns firing from none or one airgun until the full array is active. In this report, a ramp up from no airguns firing is simply called a ramp up. However, when a ramp up was initiated while the single “mitigation” airgun had been firing it is referred to as a power up. The reason for the different terms, as described further below, is that a ramp up can not be initiated during times when the full safety radii are not visible to MMOs for 30 minutes while a power up can be initiated during times when the full safety radius is not visible because the mitigation gun has been firing. Daylight Procedure
During daylight hours, a ramp up or power up was required when the full airgun array had not been operating for a period of >10 min. A 30 min watch period performed by at least two MMOs was required prior to a ramp up. The entire ≥180 dB safety radius for the full array must be visible for the entire 30-min pre-ramp up observation period before the ramp-up could commence. However, if the mitigation airgun had been operating during the break in full array activity, then a power up could be initiated at any time provided two MMOs were on active watch during the power up. If the airguns had been shut down or powered down because of the presence of a marine mammal within or near the applicable safety radius, a ramp up or power up could not begin until that safety radius was clear of marine mammals. Following a marine mammal sighting the safety radius was considered clear when the marine mammal was observed to exit safety radius, or if no marine mammals were seen in the safety radii for 15 min (for small odontocetes and pinnipeds) or 30 min ( for mysticetes and large odontocetes). If a marine mammal was observed within the applicable safety radius during the 30-min pre-ramp up observation period, the airgun operator was informed and the ramp up was postponed.
Ramp ups of the airgun array began with firing a single airgun. The number of airguns firing was then increased at a rate no greater than an increase of ~6 dB per 5-min period. During a power up the same procedure was applied by increasing the number of operating guns from the single “mitigation” gun to the full array. During a ramp up or power up, the safety zone for the full airgun array was maintained even though fewer airguns were operating.
MMOs informed the airgun operators when ramp up could proceed. If a marine mammal was observed within its applicable safety radius during the 30-min observation period, or during the ramp up, the bridge and airgun operators were informed, as usual, of any necessary mitigation measures (power down, shutdown). Darkness Procedures
During hours of darkness, ramp up could commence only if the entire ≥180 dB safety radius for the full array was visible to MMOs for 30 min using either the unaided eye or night-vision devices (unlikely with very large safety radii). However, similar to daylight periods with poor visibility conditions, a power up could commence at night even if the full array ≥180 dB radius was not visible. Power Down
A power down is a reduction in the number of operating airguns (usually from all airguns firing to a single mitigation gun firing). If marine mammals were detected outside the applicable safety radius of
F-4 Monitoring in the Chukchi & Beaufort Seas: Shell Offshore, 2008
the full airgun array but were likely to enter the safety radius (i.e., if the mammals were moving towards the vessel or if the vessel was moving in the direction of the mammals), and if the vessel's course or speed could not be changed to avoid having the mammals enter the safety radius, the airgun array was powered down to the single mitigation airgun before the mammals were within the full array safety radius. Likewise, if a mammal was first observed already within the full array safety radius, the airguns were immediately powered down. The single airgun continued firing at a source level of at least 180 dB re 1 μPa-m (rms) during the interruption of full array seismic operations. A shut-down (see below) was implemented only if a marine mammal was detected within or about to enter the smaller safety zone around the mitigation airgun. Full airgun activity did not resume (via a power up) until the marine mammal had cleared the safety zone for the full array. Shut Down
A shut down is the cessation of all airgun activity, including the single mitigation airgun. If a cetacean or pinniped was detected within or about to enter the applicable safety radius of the mitigation gun, the airgun was shut down. After a shut down, the animal must have cleared the safety zone before start up procedures could begin. If the mitigation airgun was shut down for >10 min and no observer was on duty, then at least 30 min of observation by two MMOs was necessary prior to ramp up. MMOs informed the bridge when ramp up of the airgun(s) could proceed. Course Alteration
If a marine mammal was detected outside the applicable safety radius and, based on its position and direction of travel, was likely to enter the safety radius, one possible mitigation measure was to adjust the ship track and/or speed to avoid close approach to the mammal. However, given the presence of the streamer(s) and airgun(s) behind the vessel, the turning rate of the vessel while this gear is deployed is limited, and course alteration is generally not a practical mitigation method for a seismic vessel. Instead, the marine mammal’s activities and movements relative to the seismic vessel were closely monitored. If the mammal appeared likely to enter the safety radius, further mitigation actions were taken, i.e., power or shut down of the airgun(s).
Analyses
Vessel Based Monitoring This section describes the analyses of the marine mammal sightings and survey effort recorded
during this project. It also describes the methods used to calculate densities and estimate the number of marine mammals potentially exposed to airgun sounds associated with SOI’s seismic and shallow-hazards surveys.
The sightings and effort data were grouped into three categories to assess potential effects of seismic sounds on marine mammals. The categories were “seismic” (1 or more airguns operating and up to 3 minutes after airguns stopped firing), “post-seismic” (3 min to 1h for pinnipeds and 2 h for cetaceans after the airguns were turned off), and “non-seismic” (periods before seismic started or >1 or >2 h after airguns were turned off for pinnipeds and cetaceans, respectively). Unless specifically stated otherwise, comparison of seismic and non-seismic periods excluded the post seismic period. The justification for the selection of these criteria was based on the size of the array in use and is provided below. These criteria were also used and discussed in previous reports to NMFS (see Haley and Koski 2004; Smultea et al. 2004, 2005; MacLean and Koski 2005; Holst et al. 2005a,b):
• Mammal distribution and behavior during the short period up to 3 min after the last seismic shot are assumed to be similar to those while seismic surveying is ongoing.

Appendix F: Monitoring, Mitigation, and Data Analysis F-5
• It is likely that any marine mammals near the vessel between 3 min and 30 min after the cessation of seismic activities would have been “recently exposed” (i.e., within the past 30 min) to sounds from the seismic survey. During at least a part of that period, the distribution and perhaps behavior of the marine mammals may still be influenced by the (previous) sounds.
• For some unknown part of the period from 30 min to 1 or 2 h post-seismic, it is possible that the distribution of the animals near the ship, and perhaps the behavior of some of those animals, would still be at least slightly affected by the (previous) seismic sounds.
• By 1 or 2 h after the cessation of seismic operations, the distribution and behavior of pinnipeds and cetaceans, respectively, would be expected to be indistinguishable from “normal” because of (a) waning of responses to past seismic activity, (b) re-distribution of mobile animals, and (c) movement of the ship and thus the MMOs. Given those considerations, plus the limited observed responses of most marine mammals to seismic surveys (e.g., Stone 2003; Smultea et al. 2004; Haley and Koski 2004; MacLean and Koski 2005; Holst et al. 2005a,b), it is unlikely that the distribution or behavior of marine mammals near the vessel > 1 or 2 h post-seismic would be appreciably different from “normal” even if they had been exposed to seismic sounds earlier. Therefore, we consider animals seen >1 or 2 h after cessation of seismic operations to be unaffected by the (previous) seismic sounds.
As summarized in Chapter 4, marine mammal density was one of the variables examined to assess differences in the distribution of marine mammals relative to the seismic vessel between seismic and non-seismic periods. Densities were calculated using line-transect procedures for vessel-based surveys. To allow for animals missed during daylight, we corrected our visual observations using correction factors calculated with these procedures. Corrections for Sightability
As is standard for line-transect estimation procedures, corrections for the following two parameters were included in the calculation of densities:
• g(0), a measure of detection bias. This factor allows for the fact that less than 100% of the animals present along a transect line are detected.
• f(0), the reduced probability of detecting an animal with increasing distance from a transect line.
Where species-specific values did not exist, values for similar species were used. The g(0) values for gray whales and bowhead whales were taken from previously calculated values for gray whales and right whales respectively. The g(0) values for pinniped species observed during this study were taken from values calculated previously for pinniped species off California. Other correction factors were extracted from species-specific g(0) tables produced for previous studies.
The f(0) factors used in the analysis were calculated from observations made during this study when enough data were available. The sightings from all vessels involved in this study were combined to achieve the largest sample size possible and to minimize the number of f(0)s calculated. Only non-seismic period sightings that were made during good sighting conditions were used for the calculations. These sightings were imported into DISTANCE 4.1 where the f(0) values were calculated separately for each species or species group. The default analysis method was conventional distance sampling with a half-normal model and cosine expansion with no stratification. As very few sightings were of large groups of animals, we simply used the ratio of f(0)s between group sizes of 1–16, 17–60 and >60 individuals used in previous studies to estimate the appropriate f(0)s for the two larger group categories.
F-6 Monitoring in the Chukchi & Beaufort Seas: Shell Offshore, 2008
Number of Individuals Exposed Estimates of the number of individual marine mammals potentially exposed to sound levels ≥160 dB re
1 µPa (rms) were calculated by multiplying the area of water ensonified to that level by the density of marine mammals estimated by line transect methods. The area of water ensonified was calculated using MapInfo Geographic Information System (GIS) software to create a “buffer” that extended around the vessel’s trackline to the predicted ≥160 dB distance. The area of water covered by the buffer was calculated two different ways: 1) “Including Overlap Area” is the area of water ensonified to ≥160 dB where areas exposed on more than one occasion (as a result of crossing tracklines or tracklines that were close enough for their ≥160 dB zones to overlap) were counted repeatedly each time they were exposed; and 2) “Excluding Overlap Area” was the area of water that was exposed to airgun sounds ≥160 dB where areas exposed on more than one occasion were counted only once. Number of Exposures per Individual
The estimated number of potential exposures per individual is the ratio of the two area calculations described above and represents the average number of times a given area of water was exposed to sound levels ≥160 dB.

Appendix G: Beaufort Wind Force G-1
APPENDIX G: BEAUFORT WIND FORCE DEFINITIONS
Knots m/s
<1 <0.5 0 Calm 0 Glassy like a mirror
1-3 0.5-1.5 1 Light air <0.1 Ripples with the appearance of scales but no whitecaps or foam crests
4-6 2.1-3.1 2 Light breeze 0-0.1 Small wavelets, crests have a glassy appearance but do not break (no whitecaps)
7-10 3.6-5.1 3 Gentle breeze 0.1-0.5 Smooth large wavelets, crests begin to break, occasional/scattered whitecaps
11-16 5.7-8.2 4 Moderate breeze 0.5-1.2 Slight; small fairly frequent whitecaps
17-21 8.7-10.8 5 Fresh breeze 1.2-2.4 Moderate waves becoming longer, some spray, frequent moderate whitecaps
22-27 11.3-13.9 6 Strong breeze 2.4-4 Rough, larger waves, longer-formed waves, many large whitecaps
28-33 14.4-17.0 7 Near gale 4-6 Very rough, large waves forming, white foam crests everywhere, spray is present
34-40 17.5-20.6 8 Gale41-47 21.1-24.2 9 Strong gale48-55 24.7-28.3 10 Storm 6-9 High
56-63 28.8-32.4 11 Violent storm 11-14 Very high
Wind Speed Beaufort Wind Force
Wave Height (m)
World Meteorological
Organization Terms Description


Appendix H: Marine Mammal Populations and Status H-1
APPENDIX H: BACKGROUND ON MARINE MAMMALS IN THE CHUKCHI AND BEAUFORT SEAS
TABLE F-1. The habitat, abundance and conservation status of marine mammals potentially inhabiting the project areas.
Species Habitat Abundance ESA1 IUCN2 CITES3 Odontocetes
Beluga whale
(Delphinapterus leucas)
Offshore, Coastal, Ice edges
50,0004
39,2575 Not listed VU
Narwhal (Monodon monoceros) Offshore, Ice edge Rare6 Not listed DD II
Killer whale (Orcinus orca) Widely distributed Not listed LR-cd II
Harbor Porpoise (Phocoena phocoena)
Coastal, inland waters, shallow offshore waters
Common (Chukchi)
Uncommon (Beaufort)
Not listed VU II
Mysticetes Bowhead whale (Balaena mysticetus)
Pack ice & coastal 10,5457 Endangered LR-cd I
Gray whale (Eschrichtius robustus) (eastern Pacific population)
Coastal, lagoons 4888
17,5009 Not listed LR-cd I
Minke whale (Balaenoptera acutorostrata) Shelf, coastal Small
numbers Not listed LR-cd I
Fin whale (Balaenoptera physalus)
Slope, mostly pelagic
Rare (Chukchi) Endangered EN I
Humpback whale (Megaptera novaeangliae) Shelf, coastal Rare Endangered – –
Pinnipeds Bearded seal (Erignathus barbatus)
Pack ice 300,000-450,00010
486311
In review for listing – –
Spotted seal (Phoca largha) Pack ice 100012 In review for
listing – –
Ringed seal (Pusa hispida)
Landfast & pack ice
Up to 3.6 million 13
~208,000-252,00014
326,50015
In review for listing – –
Ribbon seal (Histriophoca fasciata) Offshore, pack ice 90-100,00016 In review for
listing – –
1 U.S. Endangered Species Act. 2 IUCN Red List of Threatened Species (2003). Codes for IUCN classifications: CR = Critically Endangered; EN = Endangered; VU = Vulnerable; LR = Lower Risk (-cd = Conservation Dependent; -nt = Near Threatened; -lc = Least Concern); DD = Data Deficient. 3 Convention on International Trade in Endangered Species of Wild Fauna and Flora (UNEP-WCMC 2004). 4 Total Western Alaska population, including Beaufort Sea animals that occur there during migration and in winter (Small and
DeMaster 1995). 5 Beaufort Sea population (IWC 2000). 6 Population in Baffin Bay and the Canadian arctic archipelago is ~60,000 (DFO 2004); very few enter the Beaufort Sea. 7 Abundance of bowheads surveyed near Barrow, as of 2001 (George et al. 2004); revised to 10,545 by Zeh and Punt (2005). 8 Southern Chukchi Sea and northern Bering Sea (Clark and Moore 2002). 9 North Pacific gray whale population (Rugh 2003 in Keller and Gerber 2004) ; see also Rugh et al. (2005).
10 Alaska population (USDI/MMS 1996).

H-2 Monitoring in the Chukchi & Beaufort Seas: Shell Offshore, 2008
11 Eastern Chukchi Sea population (NMML, unpublished data). 12 Alaska Beaufort Sea population (USDI/MMS 1996). 13 Alaska estimate (Frost et al. 1988 in Angliss and Outlaw 2008). 14 Bering/Chukchi Sea population (Bengston et al. 2005). 15 Alaskan Beaufort Sea population estimate (Amstrup 1995). 16 Burns, J.J. 1981a.

Appendix I: Chukchi Sea Seismic Monitoring Results I-1
APPENDIX I: CHUKCHI SEA VESSEL-BASED SEISMIC MONITORING RESULTS
Part 1: Tables and Figures Referenced from Chapter 5 TABLE I.1. Total marine mammal sightings (individuals) during the Chukchi Sea survey (18 Jul - 31 Aug 2008) from the Gilavar and its monitoring vessels. There were no polar bear sightings during this survey.
Species
Cetaceans
Fin Whale 1 (2) 1 (3) 2 (5) Gray Whale 10 (23) 20 (44) 30 (67) Harbor Porpoise 2 (7) 7 (13) 9 (20) Humpback Whale 0 1 (1) 1 (1) Killer Whale 0 2 (2) 2 (2) Minke Whale 13 (18) 8 (9) 21 (27) Unidentified Mysticete Whale 12 (13) 19 (25) 31 (38) Unidentified Whale 0 8 (12) 8 (12)
Total Cetaceans 38 (63) 66 (109) 104 (172)
Seals
Bearded Seal 4 (4) 6 (6) 10 (10) Ringed Seal 17 (20) 61 (64) 78 (84) Spotted Seal 6 (6) 15 (19) 21 (25) Unidentified Pinniped 2 (2) 1 (15) 3 (17) Unidentified Seal 14 (14) 79 (80) 93 (94)
Total Seals 43 (46) 162 (184) 205 (230)
Pacific Walruses
In Water 0 1 (1) 1 (1) On Ice 0 1 (2) 1 (2)
Total Pacific Walruses 0 2 (3) 2 (3)
Grand Total of All Sightings 81 (109) 230 (296) 311 (405)
Gilavar Monitoring Vessels Total
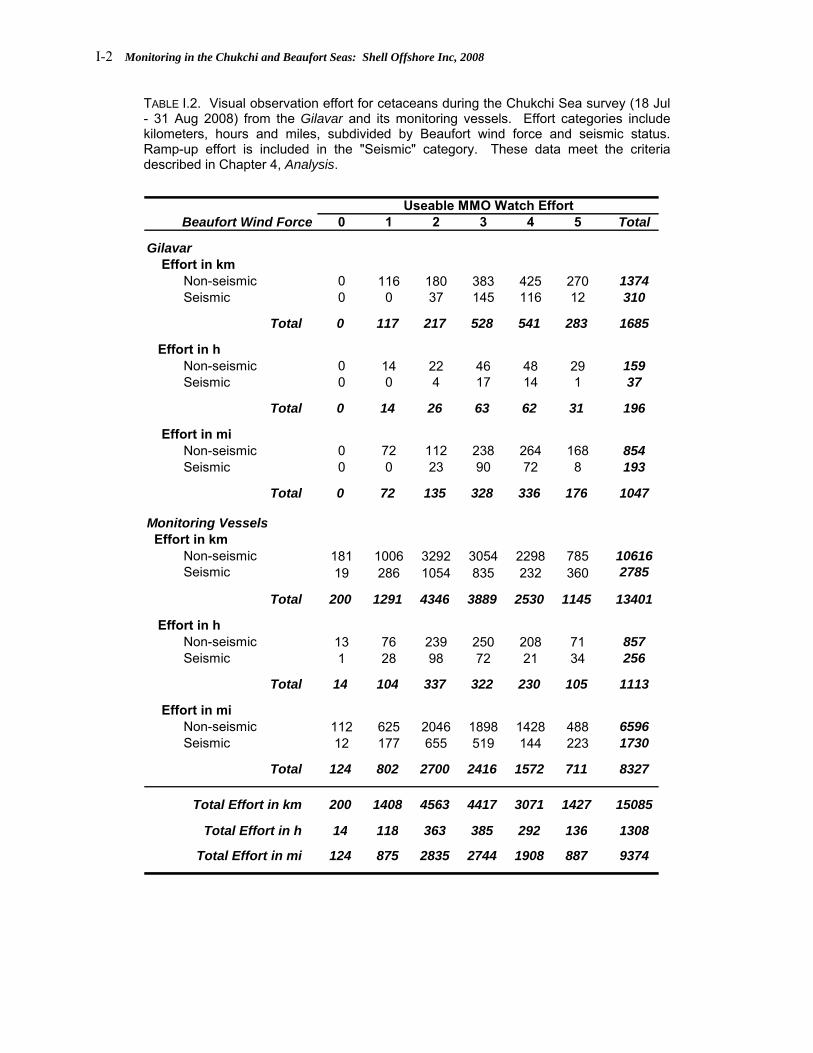
I-2 Monitoring in the Chukchi and Beaufort Seas: Shell Offshore Inc, 2008
TABLE I.2. Visual observation effort for cetaceans during the Chukchi Sea survey (18 Jul - 31 Aug 2008) from the Gilavar and its monitoring vessels. Effort categories include kilometers, hours and miles, subdivided by Beaufort wind force and seismic status. Ramp-up effort is included in the "Seismic" category. These data meet the criteria described in Chapter 4, Analysis.
Beaufort Wind Force 0 1 2 3 4 5 Total
Gilavar Effort in km Non-seismic 0 116 180 383 425 270 1374 Seismic 0 0 37 145 116 12 310
Total 0 117 217 528 541 283 1685
Effort in h Non-seismic 0 14 22 46 48 29 159 Seismic 0 0 4 17 14 1 37
Total 0 14 26 63 62 31 196
Effort in mi Non-seismic 0 72 112 238 264 168 854 Seismic 0 0 23 90 72 8 193
Total 0 72 135 328 336 176 1047
Monitoring Vessels Effort in km Non-seismic 181 1006 3292 3054 2298 785 10616 Seismic 19 286 1054 835 232 360 2785
Total 200 1291 4346 3889 2530 1145 13401
Effort in h Non-seismic 13 76 239 250 208 71 857 Seismic 1 28 98 72 21 34 256
Total 14 104 337 322 230 105 1113
Effort in mi Non-seismic 112 625 2046 1898 1428 488 6596 Seismic 12 177 655 519 144 223 1730
Total 124 802 2700 2416 1572 711 8327
Total Effort in km 200 1408 4563 4417 3071 1427 15085
Total Effort in h 14 118 363 385 292 136 1308
Total Effort in mi 124 875 2835 2744 1908 887 9374
Useable MMO Watch Effort
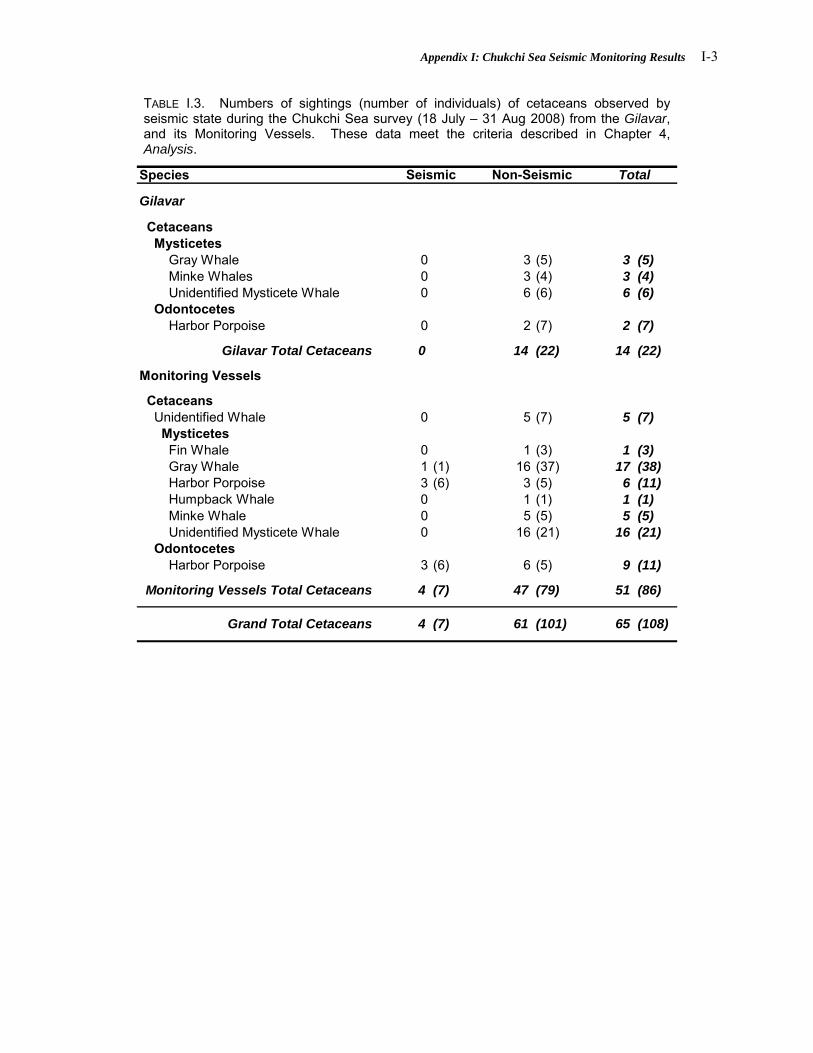
Appendix I: Chukchi Sea Seismic Monitoring Results I-3
TABLE I.3. Numbers of sightings (number of individuals) of cetaceans observed by seismic state during the Chukchi Sea survey (18 July – 31 Aug 2008) from the Gilavar, and its Monitoring Vessels. These data meet the criteria described in Chapter 4, Analysis.
Species
Gilavar
Cetaceans Mysticetes Gray Whale 0 3 (5) 3 (5) Minke Whales 0 3 (4) 3 (4) Unidentified Mysticete Whale 0 6 (6) 6 (6) Odontocetes Harbor Porpoise 0 2 (7) 2 (7)
Gilavar Total Cetaceans 0 14 (22) 14 (22)
Monitoring Vessels
Cetaceans Unidentified Whale 0 5 (7) 5 (7) Mysticetes Fin Whale 0 1 (3) 1 (3) Gray Whale 1 (1) 16 (37) 17 (38) Harbor Porpoise 3 (6) 3 (5) 6 (11) Humpback Whale 0 1 (1) 1 (1) Minke Whale 0 5 (5) 5 (5) Unidentified Mysticete Whale 0 16 (21) 16 (21) Odontocetes Harbor Porpoise 3 (6) 6 (5) 9 (11)
Monitoring Vessels Total Cetaceans 4 (7) 47 (79) 51 (86)
Grand Total Cetaceans 4 (7) 61 (101) 65 (108)
Seismic Non-Seismic Total

I-4 Monitoring in the Chukchi and Beaufort Seas: Shell Offshore Inc, 2008
TABLE I.4. Visual observation effort for pinnipeds and Pacific walruses during the Chukchi Sea survey (18 Jul - 31 Aug 2008) from the Gilavar and its monitoring vessels. Effort categories include kilometers, hours and miles, subdivided by Beaufort wind force and seismic status. Ramp-up effort is included in the "Seismic" category. These data meet the criteria described in Chapter 4, Analysis.
Beaufort Wind Force 0 1 2 3 4 5 Total
Gilavar Effort in km Non-seismic 0 131 278 875 936 407 2628 Seismic 0 24 184 705 484 153 1550
Total 0 156 462 1580 1420 561 4178
Effort in h Non-seismic 0 16 34 107 108 46 311 Seismic 0 3 22 84 58 19 185
Total 0 19 55 191 166 65 496
Effort in mi Non-seismic 0 82 173 544 582 253 1633 Seismic 0 15 114 438 301 95 963
Total 0 97 287 981 883 348 2596
Monitoring Vessels Effort in km Non-seismic 226 1311 4166 4121 2952 997 13773 Seismic 4 247 793 546 116 176 1883
Total 230 1558 4960 4667 3068 1173 15656
Effort in h Non-seismic 16 96 302 334 265 88 1101 Seismic 0 27 84 58 13 22 204
Total 16 123 387 392 278 109 1305
Effort in mi Non-seismic 140 815 2589 2561 1834 619 8558 Seismic 2 153 493 339 72 110 1170
Total 143 968 3082 2900 1907 729 9728
Total Effort in km 230 1714 5422 6247 4489 1734 19834
Total Effort in h 16 142 442 582 445 174 1801
Total Effort in mi 143 1065 3369 3881 2789 1078 12325
Daylight MMO Watch Effort
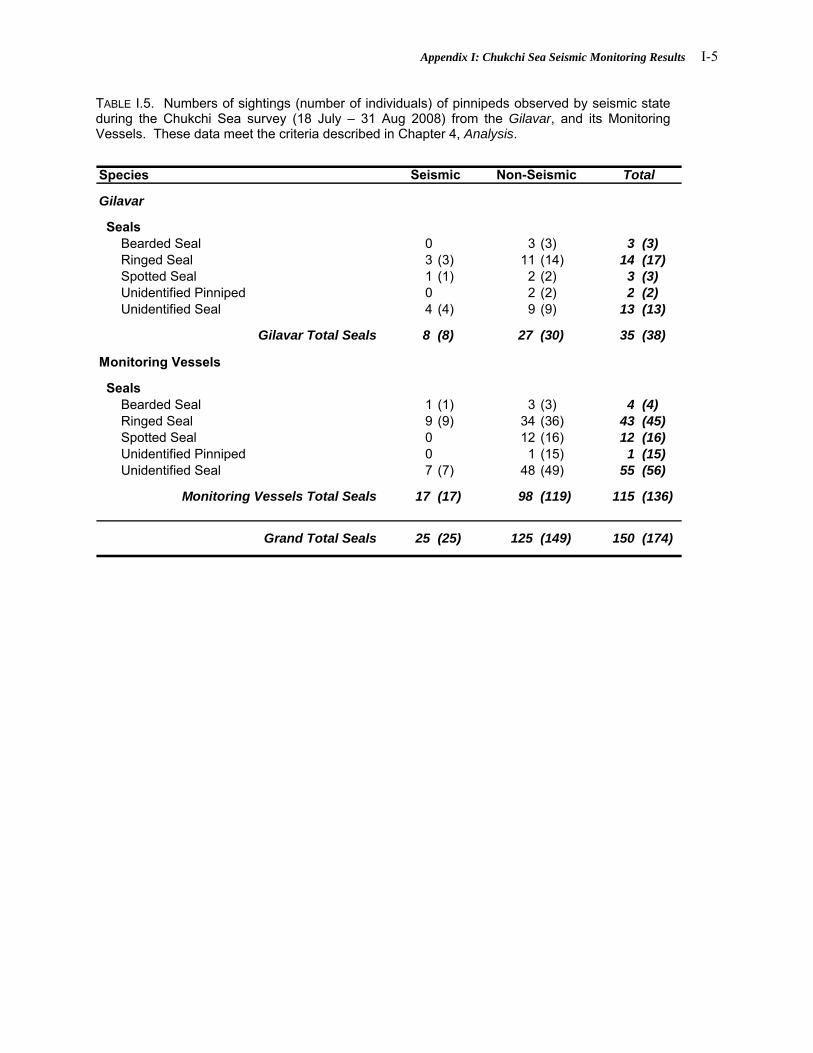
Appendix I: Chukchi Sea Seismic Monitoring Results I-5
TABLE I.5. Numbers of sightings (number of individuals) of pinnipeds observed by seismic state during the Chukchi Sea survey (18 July – 31 Aug 2008) from the Gilavar, and its Monitoring Vessels. These data meet the criteria described in Chapter 4, Analysis.
Species
Gilavar
Seals Bearded Seal 0 3 (3) 3 (3) Ringed Seal 3 (3) 11 (14) 14 (17) Spotted Seal 1 (1) 2 (2) 3 (3) Unidentified Pinniped 0 2 (2) 2 (2) Unidentified Seal 4 (4) 9 (9) 13 (13)
Gilavar Total Seals 8 (8) 27 (30) 35 (38)
Monitoring Vessels
Seals Bearded Seal 1 (1) 3 (3) 4 (4) Ringed Seal 9 (9) 34 (36) 43 (45) Spotted Seal 0 12 (16) 12 (16) Unidentified Pinniped 0 1 (15) 1 (15) Unidentified Seal 7 (7) 48 (49) 55 (56)
Monitoring Vessels Total Seals 17 (17) 98 (119) 115 (136)
Grand Total Seals 25 (25) 125 (149) 150 (174)
Seismic Non-Seismic Total

I-6 Monitoring in the Chukchi and Beaufort Seas: Shell Offshore Inc, 2008
Part 2: English Units Tables and Figures from Chapter 5 and this Appendix
193
1730
854
6596
0
1000
2000
3000
4000
5000
6000
7000
Gilavar Monitoring Vessels
MM
O E
ffort
(mi)
SeismicNon-seismic
FIGURE I.5.1E. Cetacean MMO effort (mi) in the Chukchi Sea study area (18 Jul - 31 Aug 2008) from the Gilavar and its monitoring vessels.
226
6534
821
1793
0
1000
2000
3000
4000
5000
6000
7000
Gilavar Monitoring Vessels
MM
O E
ffort
(mi)
1 MMO2 MMO
FIGURE I.5.2E. Cetacean MMO effort (mi) by number of observers in the Chukchi Sea study area (18 Jul - 31 Aug 2008) from the Gilavar and its monitoring vessels.

Appendix I: Chukchi Sea Seismic Monitoring Results I-7
0.0
2.3
16.4
7.1
0.0
2.0
4.0
6.0
8.0
10.0
12.0
14.0
16.0
18.0
Gilavar Monitoring Vessels
Sig
htin
gs p
er 1
000
mi o
f MM
O E
ffort
SeismicNon-seismic
FIGURE I.5.4E. Cetacean sightings rates by seismic state from the Gilavar and its monitoring vessels during the Chukchi Sea survey (18 Jul – 31 Aug 2008).
8.9
5.8
14.6
2.8
0.0
2.0
4.0
6.0
8.0
10.0
12.0
14.0
16.0
Gilavar Monitoring Vessels
Sig
htin
gs p
er 1
000
mi o
f MM
O E
ffort
1 MMO2 MMO
FIGURE I.5.5E. Cetacean sightings rates by number of MMOs on watch from the Gilavar and its monitoring vessels during the Chukchi Sea survey (18 Jul – 31 Aug 2008).

I-8 Monitoring in the Chukchi and Beaufort Seas: Shell Offshore Inc, 2008
9631170
1633
8558
0
1000
2000
3000
4000
5000
6000
7000
8000
9000
Gilavar Monitoring Vessels
MM
O E
ffort
(mi)
SeismicNon-seismic
FIGURE I.5.6E. Pinniped MMO effort (mi) in the Chukchi Sea study area (18 Jul - 31 Aug 2008) from the Gilavar and its monitoring vessels.
576
7710
2020 2018
0
1000
2000
3000
4000
5000
6000
7000
8000
9000
Gilavar Monitoring Vessels
MM
O E
ffort
(mi)
1 MMO2 MMO
FIGURE I.5.7E. Pinniped MMO effort (mi) by number of observers in the Chukchi Sea study area (18 Jul - 31 Aug 2008) from the Gilavar and its Monitoring Vessls.

Appendix I: Chukchi Sea Seismic Monitoring Results I-9
8.3
14.5
16.5
11.3
0.0
2.0
4.0
6.0
8.0
10.0
12.0
14.0
16.0
18.0
Gilavar Monitoring Vessels
Sig
htin
gs p
er 1
000
mi o
f MM
O E
ffort
SeismicNon-seismic
FIGURE I.5.9E. Seal sightings rates by seismic state from the Gilavar and its monitoring vessels during the Chukchi Sea survey (18 Jul - 31 Aug 2008).
15.6
11.812.9
11.9
0.0
2.0
4.0
6.0
8.0
10.0
12.0
14.0
16.0
18.0
Gilavar Monitoring Vessels
Sig
htin
gs p
er 1
000
mi o
f MM
O E
ffort
1 MMO2 MMO
FIGURE I.5.10E. Seal sightings rates by number of MMOs from the Gilavar and its monitoring vessels during the Chukchi Sea survey (18 Jul - 31 Aug 2008).

I-10 Monitoring in the Chukchi and Beaufort Seas: Shell Offshore Inc, 2008
TABLE I.5.3E. Comparison of cetacean CPA distances by seismic period from the Gilavar and its monitoring vessels during the Chukchi Sea survey (18 Jul - 31 Aug 2008). The overall mean includes both seismic and non-seismic CPA distances in the calculation.
Vessel and Seismic Status Mean CPAa (yd) s.d. Range (yd) n
Gilavar Seismic -- -- -- --Gilavar Non-seismic 2528 1378 650-5048 19
Gilavar Overall Mean 2528 1378 650-5048 14
Monitoring Vessels Seismic 137 130 55-328 4Monitoring Vessels Non-seismic 1322 1488 22-5468 47
Monitoring Vessels Overall Mean 1229 1463 22-5468 51
a CPA = Closest Point of Approach . For Gilavar this value is the marine mammal's closest point of approach to the airgun array, formonitoring vessels this value is the marine mammal's closest point of approach to the MMO/vessel.
TABLE I.5.6E. Comparison of seal CPA distances by seismic period from MMO sightings aboard the Gilavar and its monitoring vessels during the Chukchi Sea survey (18 Jul – 31 Aug 2008). The overall mean includes both seismic and non-seismic CPA distances in the calculation.
Vessel and Seismic Status Mean CPAa (yd) s.d. Range (yd) n
Gilavar Seismic 589 236 346-926 8Gilavar Non-seismic 857 500 328-2328 27
Gilavar Overall Mean 796 464 328-2328 35
Monitoring Vessels Seismic 93 133 11-482 17Monitoring Vessels Non-seismic 157 261 5-2018 98
Monitoring Vessels Overall Mean 149 247 5-2018 115
a CPA = Closest Point of Approach . For Gilavar this value is the marine mammal's closest point of approach to the airgun array, for monitoringvessels this value is the marine mammal's closest point of approach to the MMO/vessel.
TABLE I.5.9E. Power downs for marine mammals sighted in the Gilavar's 190-dB safety radius (610 m; 667 yd) for seals during the Chukchi Sea seismic survey (18 Jul - 31 Aug 2008).
Sighting ID SpeciesGroup Size
Day in 2007 UTC
Water Depth (yd)
Reaction to Vessela
Distanceto airguns at
first detection
(yd) CPAb to
airguns (yd)
GIL200889 Spotted seal 1 28-Jul 43.2 LO 677 677GIL2008145 Unidentified seal 1 21-Aug 45.4 LO 348 348GIL2008148 Ringed seal 1 23-Aug 45.6 CD 638 638GIL2008149 Unidentified seal 1 26-Aug 44.0 LO 346 346GIL2008151 Spotted seal 1 27-Aug 46.2 NO 394 394
b CPA=Closest Point of Approach
a Observed reaction of animal to vessel: CD=Change Direction, LO=Look at Vessel, NO=None
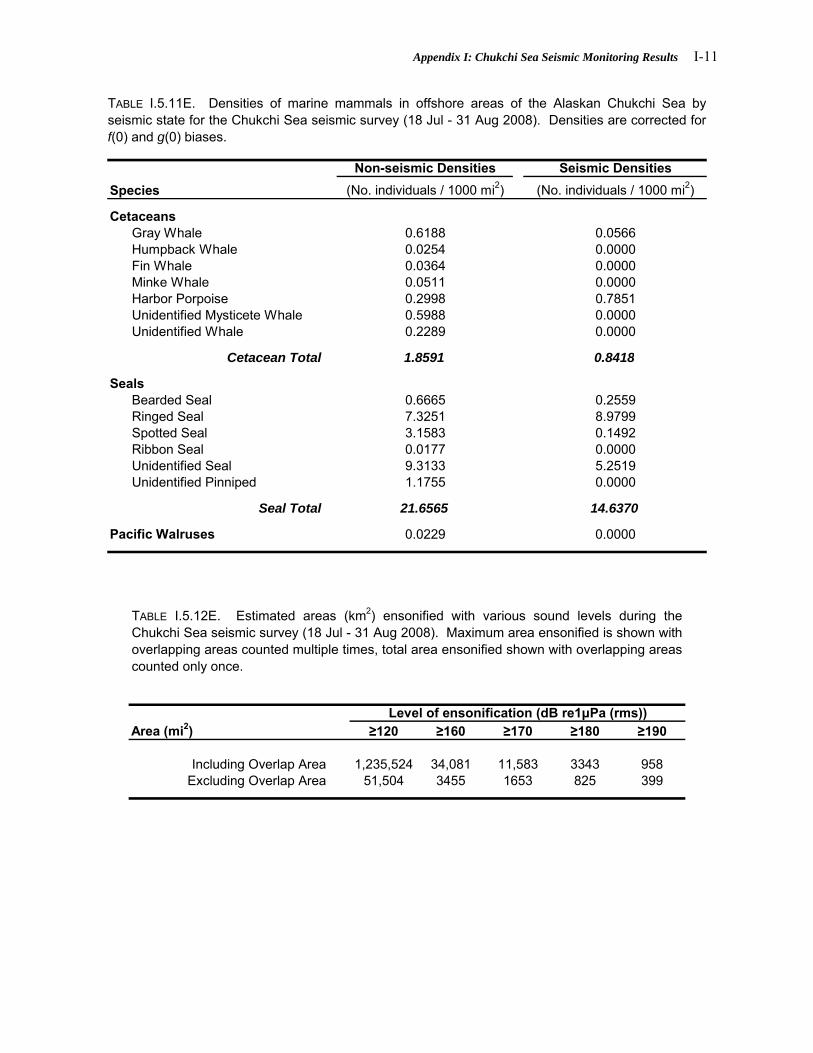
Appendix I: Chukchi Sea Seismic Monitoring Results I-11
TABLE I.5.11E. Densities of marine mammals in offshore areas of the Alaskan Chukchi Sea by seismic state for the Chukchi Sea seismic survey (18 Jul - 31 Aug 2008). Densities are corrected for f(0) and g(0) biases.
Non-seismic Densities Seismic DensitiesSpecies (No. individuals / 1000 mi2) (No. individuals / 1000 mi2)
Cetaceans Gray Whale 0.6188 0.0566 Humpback Whale 0.0254 0.0000 Fin Whale 0.0364 0.0000 Minke Whale 0.0511 0.0000 Harbor Porpoise 0.2998 0.7851 Unidentified Mysticete Whale 0.5988 0.0000 Unidentified Whale 0.2289 0.0000
Cetacean Total 1.8591 0.8418
Seals Bearded Seal 0.6665 0.2559 Ringed Seal 7.3251 8.9799 Spotted Seal 3.1583 0.1492 Ribbon Seal 0.0177 0.0000 Unidentified Seal 9.3133 5.2519 Unidentified Pinniped 1.1755 0.0000
Seal Total 21.6565 14.6370
Pacific Walruses 0.0229 0.0000
TABLE I.5.12E. Estimated areas (km2) ensonified with various sound levels during the Chukchi Sea seismic survey (18 Jul - 31 Aug 2008). Maximum area ensonified is shown with overlapping areas counted multiple times, total area ensonified shown with overlapping areas counted only once.
Area (mi2) ≥120 ≥160 ≥170 ≥180 ≥190
Including Overlap Area 1,235,524 34,081 11,583 3343 958Excluding Overlap Area 51,504 3455 1653 825 399
Level of ensonification (dB re1μPa (rms))


Appendix J: Chukchi Sea Shallow Hazards Monitoring Results J-1
APPENDIX J: CHUKCHI SEA VESSEL-BASED SHALLOW HAZARDS AND SITE CLEARANCE MONITORING RESULTS
Part 1: Tables and Figures Referenced from Chapter 6 Table J.1. Number of sightings (number of individuals) of marine mammals during the Chukchi Sea shallow hazards survey (22 Aug – 13 Sep 2008) from the Cape Flattery and Alpha Helix. All survey sightings are show regardless of whether they met the data-analysis criteria discussed in Chapter 4, Analyses.
Species
Cetaceans
Bowhead Whale 0 5 (13) 5 (13) Gray Whale 1 (1) 2 (4) 3 (5) Harbor Porpoise 1 (1) 0 1 (1) Unidentified Mysticete Whale 0 () 5 (9) 5 (9)
Total Cetaceans 2 (2) 12 (26) 14 (28)
Seals
Bearded Seal 1 (1) 36 (47) 37 (48) Bearded Seal (On Ice) 0 1 (1) 1 (1) Ringed Seal 7 (7) 9 (9) 16 (16) Unidentified Pinniped 0 14 (14) 14 (14) Unidentified Seal 5 (5) 39 (41) 44 (46)
Total Seals 13 (13) 99 (112) 112 (125)
Pacific Walruses
In Water 0 13 (23) 13 (23) On Ice 0 3 (42) 3 (42)
Total Pacific Walruses 0 16 (65) 16 (65)
Grand Total of All Sightings 15 (15) 127 (203) 142 (218)
Cape Flattery. Alpha Helix Total
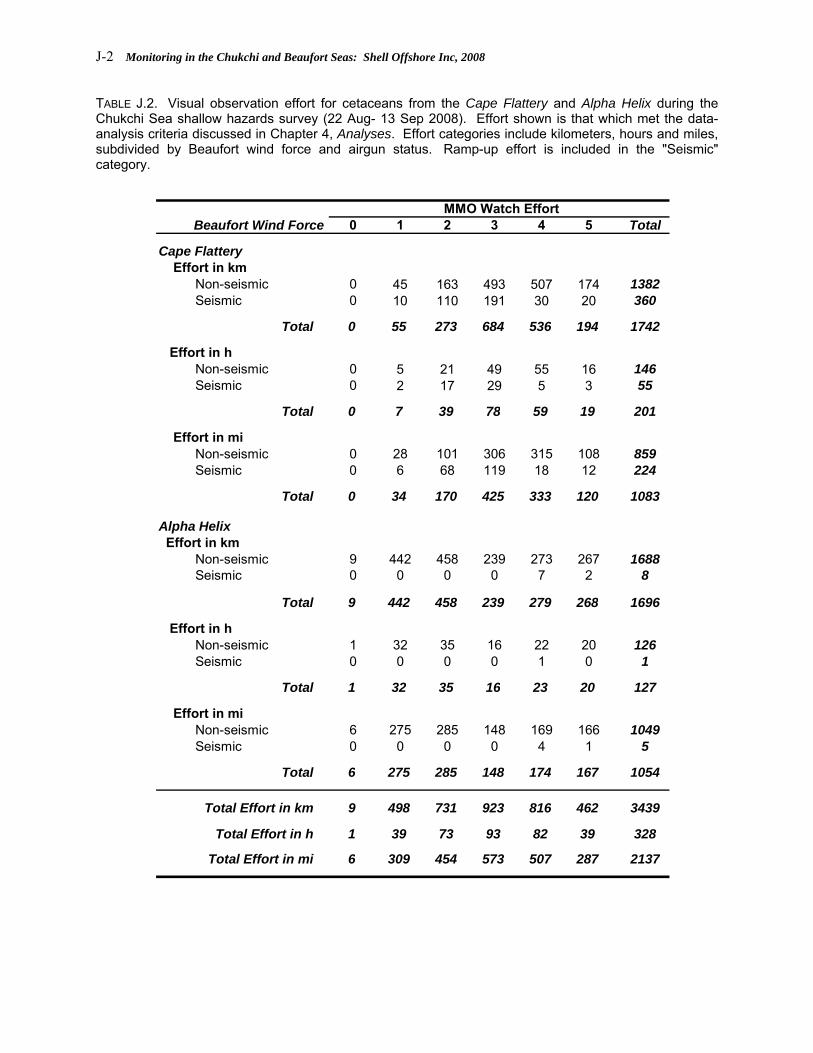
J-2 Monitoring in the Chukchi and Beaufort Seas: Shell Offshore Inc, 2008
TABLE J.2. Visual observation effort for cetaceans from the Cape Flattery and Alpha Helix during the Chukchi Sea shallow hazards survey (22 Aug- 13 Sep 2008). Effort shown is that which met the data-analysis criteria discussed in Chapter 4, Analyses. Effort categories include kilometers, hours and miles, subdivided by Beaufort wind force and airgun status. Ramp-up effort is included in the "Seismic" category.
Beaufort Wind Force 0 1 2 3 4 5 Total
Cape Flattery Effort in km Non-seismic 0 45 163 493 507 174 1382 Seismic 0 10 110 191 30 20 360
Total 0 55 273 684 536 194 1742
Effort in h Non-seismic 0 5 21 49 55 16 146 Seismic 0 2 17 29 5 3 55
Total 0 7 39 78 59 19 201
Effort in mi Non-seismic 0 28 101 306 315 108 859 Seismic 0 6 68 119 18 12 224
Total 0 34 170 425 333 120 1083
Alpha Helix Effort in km Non-seismic 9 442 458 239 273 267 1688 Seismic 0 0 0 0 7 2 8
Total 9 442 458 239 279 268 1696
Effort in h Non-seismic 1 32 35 16 22 20 126 Seismic 0 0 0 0 1 0 1
Total 1 32 35 16 23 20 127
Effort in mi Non-seismic 6 275 285 148 169 166 1049 Seismic 0 0 0 0 4 1 5
Total 6 275 285 148 174 167 1054
Total Effort in km 9 498 731 923 816 462 3439
Total Effort in h 1 39 73 93 82 39 328
Total Effort in mi 6 309 454 573 507 287 2137
MMO Watch Effort

Appendix J: Chukchi Sea Shallow Hazards Monitoring Results J-3
TABLE J.3. Visual observation effort for pinnipeds from the Cape Flattery and Alpha Helix during the Chukchi Sea shallow hazards survey (22 Aug- 13 Sep 2008). Effort shown is that which met the data-analysis criteria discussed in Chapter 4, Analyses. Effort categories include kilometers, hours and miles, subdivided by Beaufort wind force and airgun status. Ramp-up effort is included in the "Seismic" category.
Beaufort Wind Force 0 1 2 3 4 5 Total
Cape Flattery Effort in km Non-seismic 0 45 167 505 512 180 1410 Seismic 0 10 110 191 30 20 360
Total 0 55 276 697 542 200 1770
Effort in h Non-seismic 0 5 22 51 56 17 151 Seismic 0 2 17 29 5 3 55
Total 0 7 39 80 60 20 206
Effort in mi Non-seismic 0 28 104 314 318 112 876 Seismic 0 6 68 119 18 12 224
Total 0 34 172 433 337 124 1100
Alpha Helix Effort in km Non-seismic 9 444 458 239 301 314 1765 Seismic 0 0 0 0 0 0 0
Total 9 444 458 239 301 314 1765
Effort in h Non-seismic 1 33 35 16 25 24 133 Seismic 0 0 0 0 0 0 0
Total 1 33 35 16 25 24 133
Effort in mi Non-seismic 6 276 285 148 187 195 1097 Seismic 0 0 0 0 0 0 0
Total 6 276 285 148 187 195 1097
Total Effort in km 9 499 735 935 842 514 3535
Total Effort in h 1 39 74 96 86 44 339
Total Effort in mi 6 310 457 581 523 319 2196
MMO Watch Effort

J-4 Monitoring in the Chukchi and Beaufort Seas: Shell Offshore Inc, 2008
Table J.4. Numbers of sightings (number of individuals) of cetaceans by seismic state from the Cape Flattery and Alpha Helix during the Chukchi Sea shallow hazards survey (22 Aug – 13 Sep 2008). Sightings shown are those that met the data-analysis criteria discussed in Chapter 4, Analyses.
Species
Cape Flattery
Gray Whale 0 1 (1) 1 (1) Harbor Porpoise 0 1 (1) 1 (1)
Cape Flattery Total Cetaceans 0 2 (2) 2 (2)
Alpha Helix
Bowhead Whale 0 5 (13) 5 (13) Gray Whale 0 2 (4) 2 (4) Unidentified Mysticete Whale 0 4 (6) 4 (6)
Alpha Helix Total Cetaceans 0 11 (23) 11 (23)
Grand Total Cetaceans 0 13 (25) 13 (25)
Seismic Non-Seismic Total
Table J.5. Numbers of sightings (number of individuals) of seals by seismic state from the Cape Flattery and Alpha Helix during the Chukchi Sea shallow hazards survey (22 Aug – 13 Sep 2008). Sightings shown are those that met the data-analysis criteria discussed in Chapter 4, Analyses.
Species
Cape Flattery
Bearded Seal 0 1 (1) 1 (1) Ringed Seal 0 7 (7) 7 (7) Unidentified Seal 0 4 (4) 4 (4)
Cape Flattery Total Seals 0 12 (12) 12 (12)
Alpha Helix
Bearded Seal 0 34 (45) 34 (45) Bearded Seal (On Ice) 0 1 (1) 1 (1) Ringed Seal 0 7 (7) 7 (7) Unidentified Seal 0 12 (12) 12 (12) Unidentified Pinniped 0 38 (40) 38 (40)
Alpha Helix Total Seals 0 92 (105) 92 (105)
Grand Total Seals 0 104 (117) 104 (117)
Seismic Non-Seismic Total

Appendix J: Chukchi Sea Shallow Hazards Monitoring Results J-5
Table J.6. Numbers of sightings (number of individuals) of Pacific walruses by seismic state from the Alpha Helix during the Chukchi Sea shallow hazards survey (22 Aug – 13 Sep 2008). There were no sightings of Pacific walruses from the Cape Flattery. Sightings shown are those that met the data-analysis criteria discussed in Chapter 4, Analyses.
Species
Cape Flattery Pacific Walrus in Water 0 0 0 Pacific Walrus on Ice 0 0 0
Cape Flattery Total Pacific Walruses 0 0 0
Alpha Helix
Pacific Walrus in Water 0 8 (16) 8 (16) Pacific Walrus on Ice 0 3 (42) 3 (42)
Alpha Helix Total Pacific Walruses 0 11 (58) 11 (58)
Grand Total Pacific Walruses 0 11 (58) 11 (58)
Seismic Non-Seismic Total

J-6 Monitoring in the Chukchi and Beaufort Seas: Shell Offshore Inc, 2008
Part 2: English Units Tables and Figures from Chapter 6 and this Appendix
5
859
1049
224
0
200
400
600
800
1000
1200
Cape Flattery Alpha Helix
MM
O E
ffort
(mi) Seismic
Non-Seismic
FIGURE J.6.1E. Marine mammal observer effort (km) from the Cape Flattery and Alpha Helix by seismic activity in the Chukchi Sea study area (22 Aug – 13 Sep 2008). TABLE J.6.4E. Pacific walrus CPA distances recorded in water and on ice from the Alpha Helix during the Chukchi Sea shallow hazards survey (22 Aug- 13 Sep 2008). There were no Pacific walruses observed during seismic periods.
Species and Seismic StatusMean CPA
(yd)a s.d.Range
(yd) n Sightings
Pacific Walruses in Water Non-Seismic 166 159 49-517 8Pacific Walruses on Ice Non-Seismic 973 1003 128-2081 3
a CPA = Closest Point of Approach . For Alpha Helix: this value is the marine mammal's closest point of approach to the airgun array.

Appendix J: Chukchi Sea Shallow Hazards Monitoring Results J-7
TABLE J.6.6E. Estimated densities of marine mammals in offshore areas of the Chukchi Sea based on effort and sightings from the Cape Flattery. Densities are corrected for f(0) and g(0) biases.
Non-seismic Densities Seismic DensitiesSpecies (No. individuals / 1000 mi2) (No. individuals / 1000 mi2)
Cetaceans Gray Whale 0.052 0.000* Harbor Porpoise 0.039 0.000*
Cetacean Total 0.091 0.000*
Seals Bearded Seal 2.543 0.000* Ringed Seal 1.231 0.000* Unidentified Seal 1.453 0.000*
Seal Total 5.227 0.000*
Pacific Walruses 0.000* 0.000*
* Estimates based on less than 500 km of effort
TABLE J.6.7E. Estimated areas (mi2) ensonified to various sound levels during the Chukchi Sea shallow hazards survey (22 Aug - 13 Sep 2008). Maximum area ensonified is shown with overlapping areas counted multiple times, total area ensonified shown with overlapping areas counted only once.
Area (mi2) 120 160 170 180 190
Including Overlap Area 30,123 625 193 59 18Excluding Overlap Area 3,434 243 131 49 16
Level of ensonification (dB re1μPa (rms))
TABLE J.6.8E. Estimated numbers of individual cetaceans exposed to received sound levels ≥160,170,180, and 190 dB (rms) and average number of exposures per individual during the Chukchi Sea shallow hazards survey (22 Aug- 13 Sep 2008). Estimates were based on densities of cetaceans calculated from effort during seismic and non-seismic periods.
Exposure level in dB re 1μPa (rms) Individuals
Exposures per Individual Individuals
Exposures per Individual
≥160 1* 2.6 0** 2.6≥170 1* 1.5 0** 1.5≥180 1* 1.2 0** 1.2≥190 1* 1.1 0** 1.1
* Actual value less than 1.** Estimates based on less than 350 mi of effort
Non-seismic Densities Seismic Densities
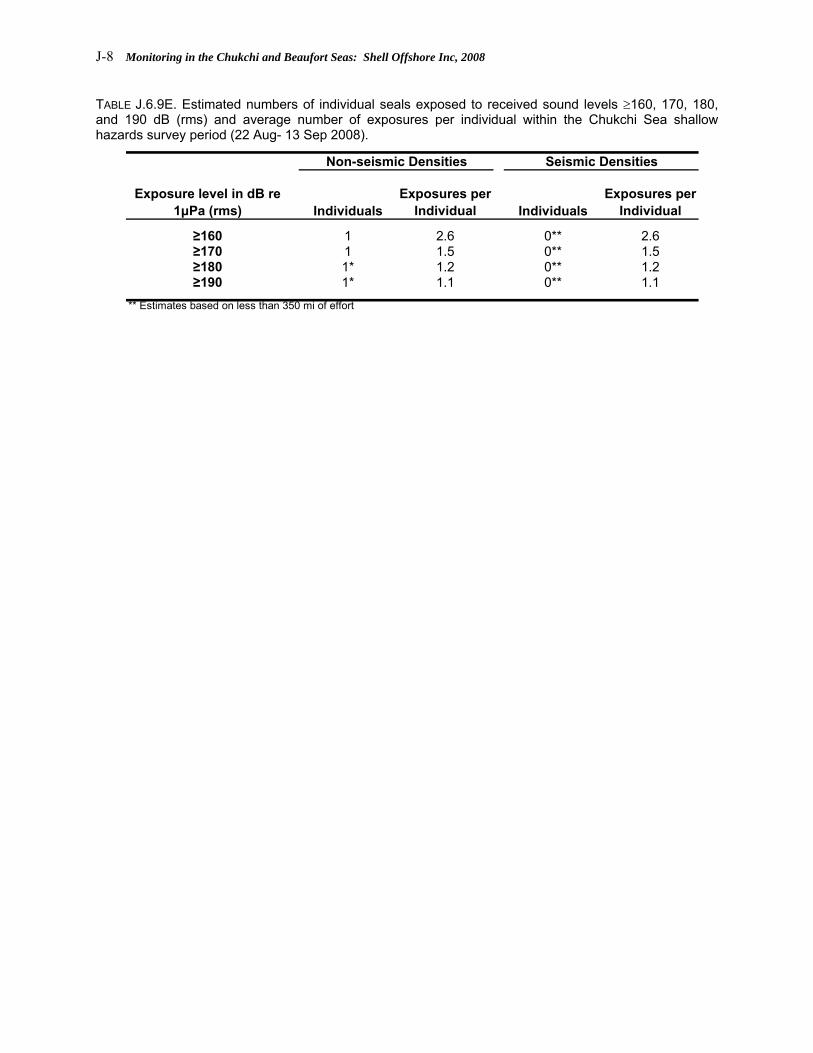
J-8 Monitoring in the Chukchi and Beaufort Seas: Shell Offshore Inc, 2008
TABLE J.6.9E. Estimated numbers of individual seals exposed to received sound levels ≥160, 170, 180, and 190 dB (rms) and average number of exposures per individual within the Chukchi Sea shallow hazards survey period (22 Aug- 13 Sep 2008).
Exposure level in dB re 1μPa (rms) Individuals
Exposures per Individual Individuals
Exposures per Individual
≥160 1 2.6 0** 2.6≥170 1 1.5 0** 1.5≥180 1* 1.2 0** 1.2≥190 1* 1.1 0** 1.1
** Estimates based on less than 350 mi of effort
Non-seismic Densities Seismic Densities
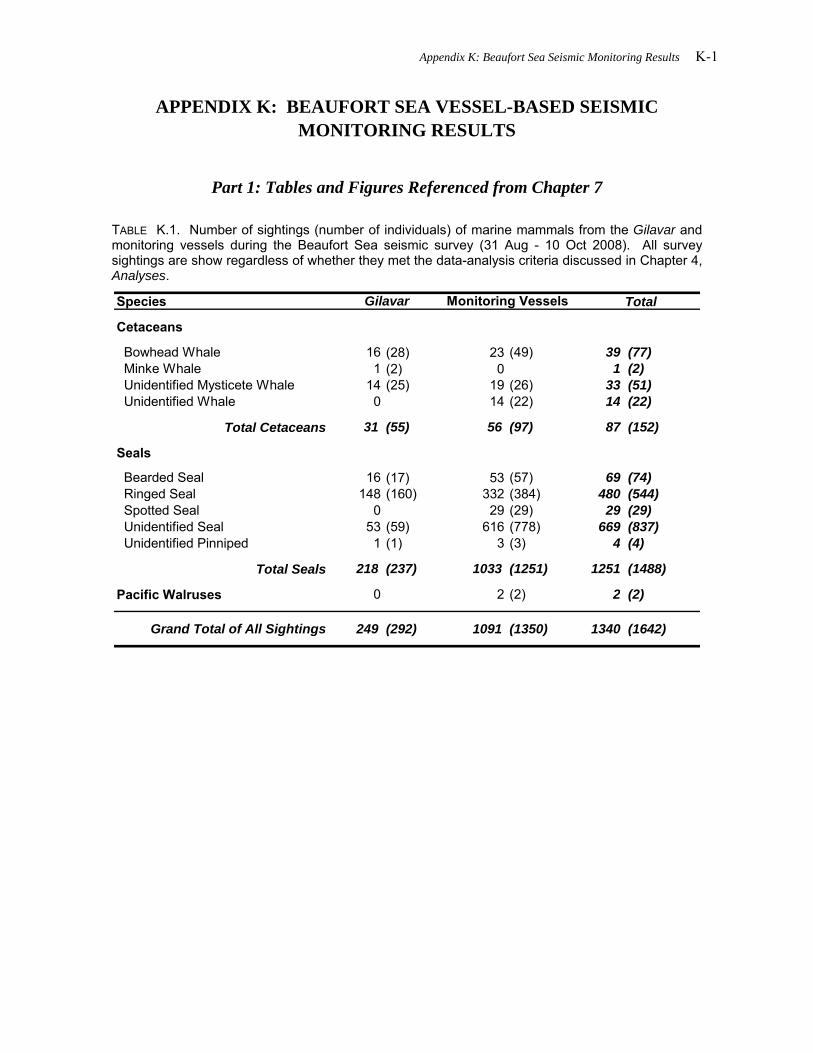
Appendix K: Beaufort Sea Seismic Monitoring Results K-1
APPENDIX K: BEAUFORT SEA VESSEL-BASED SEISMIC MONITORING RESULTS
Part 1: Tables and Figures Referenced from Chapter 7
TABLE K.1. Number of sightings (number of individuals) of marine mammals from the Gilavar and monitoring vessels during the Beaufort Sea seismic survey (31 Aug - 10 Oct 2008). All survey sightings are show regardless of whether they met the data-analysis criteria discussed in Chapter 4, Analyses.
Species
Cetaceans
Bowhead Whale 16 (28) 23 (49) 39 (77) Minke Whale 1 (2) 0 1 (2) Unidentified Mysticete Whale 14 (25) 19 (26) 33 (51) Unidentified Whale 0 14 (22) 14 (22)
Total Cetaceans 31 (55) 56 (97) 87 (152)
Seals
Bearded Seal 16 (17) 53 (57) 69 (74) Ringed Seal 148 (160) 332 (384) 480 (544) Spotted Seal 0 29 (29) 29 (29) Unidentified Seal 53 (59) 616 (778) 669 (837) Unidentified Pinniped 1 (1) 3 (3) 4 (4)
Total Seals 218 (237) 1033 (1251) 1251 (1488)
Pacific Walruses 0 2 (2) 2 (2)
Grand Total of All Sightings 249 (292) 1091 (1350) 1340 (1642)
Gilavar Monitoring Vessels Total

K-2 Monitoring in the Chukchi and Beaufort Seas: Shell Offshore Inc, 2008
TABLE K.2. Marine mammal observer cetacean effort from the Gilavar and monitoring vessels during the Beaufort Sea seismic survey (31 Aug - 10 Oct 2008). Effort shown is that which met the data-analysis criteria discussed in Chapter 4, Analyses. Effort categories include kilometers, hours and miles, subdivided by Beaufort wind force and airgun status. Ramp-up effort is included in the "Seismic" category.
Beaufort Wind Force 0 1 2 3 4 5 Total
Gilavar Effort in km Non-seismic 0 4 8 40 10 14 77 Seismic 0 37 73 133 72 34 348
Total 0 41 81 173 81 48 425
Effort in h Non-seismic 0 0 1 4 1 2 9 Seismic 0 4 8 15 8 4 40
Total 0 5 9 20 9 6 49
Effort in mi Non-seismic 0 3 5 25 6 9 48 Seismic 0 23 45 82 45 21 216
Total 0 25 51 107 51 30 264
Monitoring Vessels Effort in km Non-seismic 83 747 1637 964 999 456 4886 Seismic 199 606 1320 1009 670 292 4096
Total 282 1353 2956 1973 1669 748 8982
Effort in h Non-seismic 6 50 113 80 77 46 372 Seismic 15 51 127 91 65 25 374
Total 21 101 240 171 142 71 746
Effort in mi Non-seismic 52 464 1017 599 621 283 3036 Seismic 124 376 820 627 416 182 2545
Total 175 840 1837 1226 1037 465 5581
Total Effort in km 282 1394 3038 2146 1751 796 9407
Total Effort in h 21 106 250 190 151 77 795
Total Effort in mi 175 866 1888 1334 1088 495 5845
MMO Watch Effort
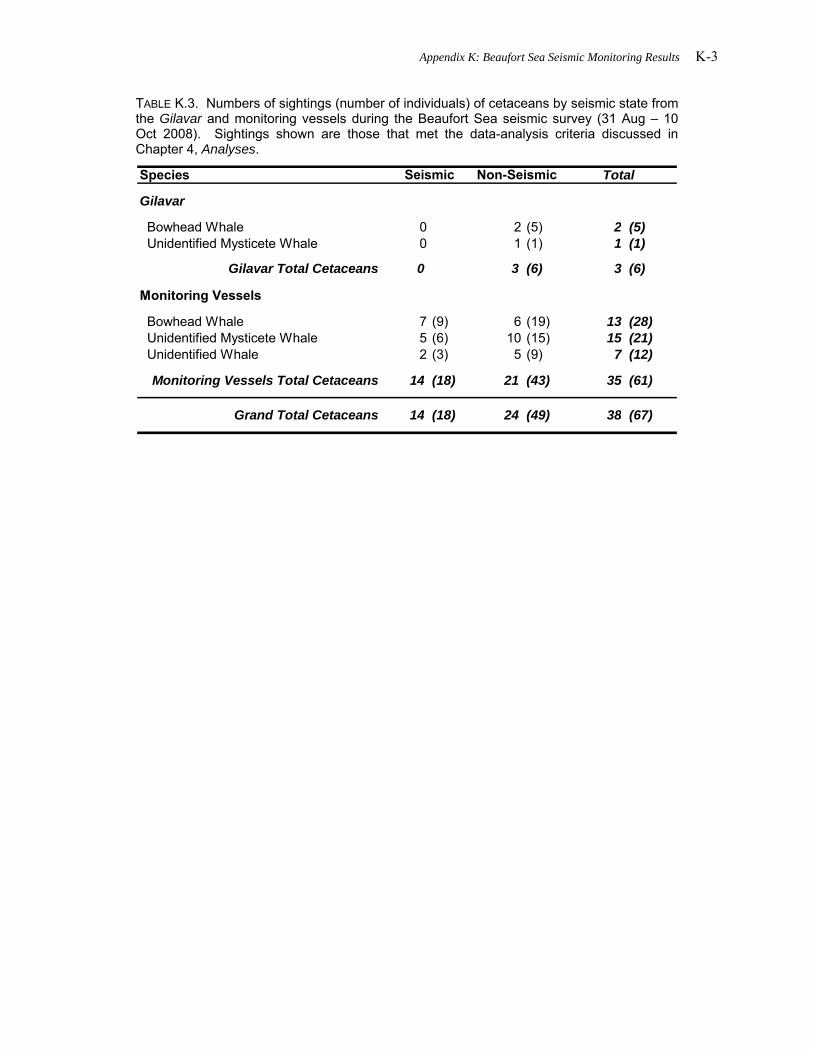
Appendix K: Beaufort Sea Seismic Monitoring Results K-3
TABLE K.3. Numbers of sightings (number of individuals) of cetaceans by seismic state from the Gilavar and monitoring vessels during the Beaufort Sea seismic survey (31 Aug – 10 Oct 2008). Sightings shown are those that met the data-analysis criteria discussed in Chapter 4, Analyses.
Species
Gilavar
Bowhead Whale 0 2 (5) 2 (5) Unidentified Mysticete Whale 0 1 (1) 1 (1)
Gilavar Total Cetaceans 0 3 (6) 3 (6)
Monitoring Vessels
Bowhead Whale 7 (9) 6 (19) 13 (28) Unidentified Mysticete Whale 5 (6) 10 (15) 15 (21) Unidentified Whale 2 (3) 5 (9) 7 (12)
Monitoring Vessels Total Cetaceans 14 (18) 21 (43) 35 (61)
Grand Total Cetaceans 14 (18) 24 (49) 38 (67)
Seismic Non-Seismic Total

K-4 Monitoring in the Chukchi and Beaufort Seas: Shell Offshore Inc, 2008
TABLE K.4. Marine mammal observer pinniped effort from the Gilavar and monitoring vessels during the Beaufort Sea seismic survey (31 Aug - 10 Oct 2008). Effort shown is that which met the data-analysis criteria discussed in Chapter 4, Analyses. Effort categories include kilometers, hours and miles, subdivided by Beaufort wind force and airgun status. Ramp-up effort is included in the "Seismic" category.
Beaufort Wind Force 0 1 2 3 4 5 Total
Gilavar Effort in km Non-seismic 6 29 112 132 247 186 712 Seismic 4 293 406 839 503 302 2348
Total 10 322 518 972 750 488 3060
Effort in h Non-seismic 1 4 13 15 33 25 91 Seismic 0 35 48 98 59 36 276
Total 1 38 61 113 92 61 367
Effort in mi Non-seismic 4 18 69 82 153 116 442 Seismic 2 182 252 522 313 188 1459
Total 6 200 322 604 466 303 1901
Monitoring Vessels Effort in km Non-seismic 299 1438 2566 1842 1487 794 8425 Seismic 62 339 1141 741 456 204 2943
Total 361 1777 3707 2583 1943 998 11368
Effort in h Non-seismic 21 96 180 143 115 71 625 Seismic 7 37 121 75 49 21 309
Total 27 133 301 218 164 92 935
Effort in mi Non-seismic 186 894 1595 1145 924 493 5235 Seismic 39 211 709 460 284 127 1828
Total 224 1104 2303 1605 1207 620 7064
Total Effort in km 371 2100 4225 3555 2693 1486 14428
Total Effort in h 29 171 363 331 256 152 1302
Total Effort in mi 230 1305 2625 2209 1673 923 8965
Useable MMO Watch Effort

Appendix K: Beaufort Sea Seismic Monitoring Results K-5
TABLE K.5. Numbers of sightings (number of individuals) of seals by seismic state from the Gilavar and monitoring vessels during the Beaufort Sea seismic survey (31 Aug – 10 Oct 2008). Sightings shown are those that met the data-analysis criteria discussed in Chapter 4, Analyses.
Species
Gilavar
Bearded Seal 13 (13) 1 (1) 14 (14) Ringed Seal 95 (103) 32 (34) 127 (137) Unidentified Seal 41 (46) 2 (2) 43 (48) Unidentified Pinniped 1 (1) 0 1 (1)
Gilavar Total Seals 150 (163) 35 (37) 185 (200)
Monitoring Vessels
Bearded Seal 12 (13) 26 (28) 38 (41) Ringed Seal 107 (121) 135 (153) 242 (274) Spotted Seal 6 (6) 10 (10) 16 (16) Unidentified Seal 128 (138) 328 (452) 456 (590) Unidentified Pinniped 0 2 (2) 2 (2)
Monitoring Vessels Total Seals 253 (278) 501 (645) 754 (923)
Grand Total Seals 403 (441) 536 (682) 939 (1123)
Seismic Non-Seismic Total
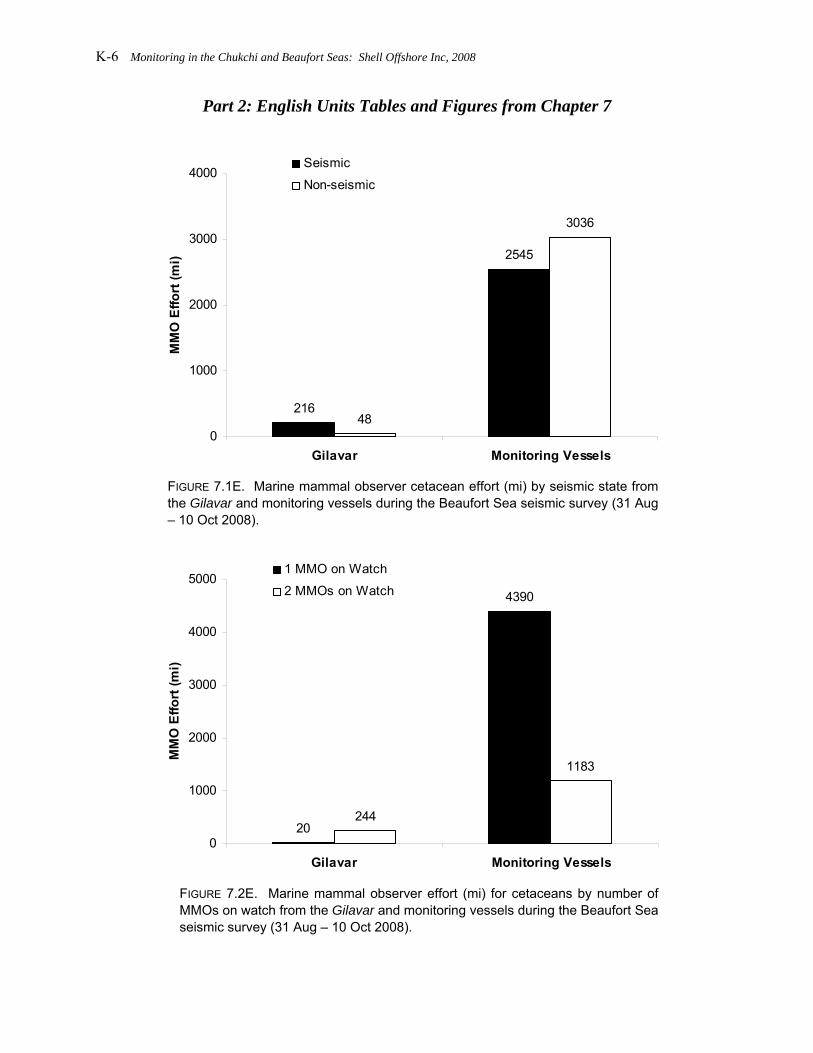
K-6 Monitoring in the Chukchi and Beaufort Seas: Shell Offshore Inc, 2008
Part 2: English Units Tables and Figures from Chapter 7
216
2545
48
3036
0
1000
2000
3000
4000
Gilavar Monitoring Vessels
MM
O E
ffort
(mi)
Seismic
Non-seismic
FIGURE 7.1E. Marine mammal observer cetacean effort (mi) by seismic state from the Gilavar and monitoring vessels during the Beaufort Sea seismic survey (31 Aug – 10 Oct 2008).
20
4390
1183
244
0
1000
2000
3000
4000
5000
Gilavar Monitoring Vessels
MM
O E
ffort
(mi)
1 MMO on Watch
2 MMOs on Watch
FIGURE 7.2E. Marine mammal observer effort (mi) for cetaceans by number of MMOs on watch from the Gilavar and monitoring vessels during the Beaufort Sea seismic survey (31 Aug – 10 Oct 2008).
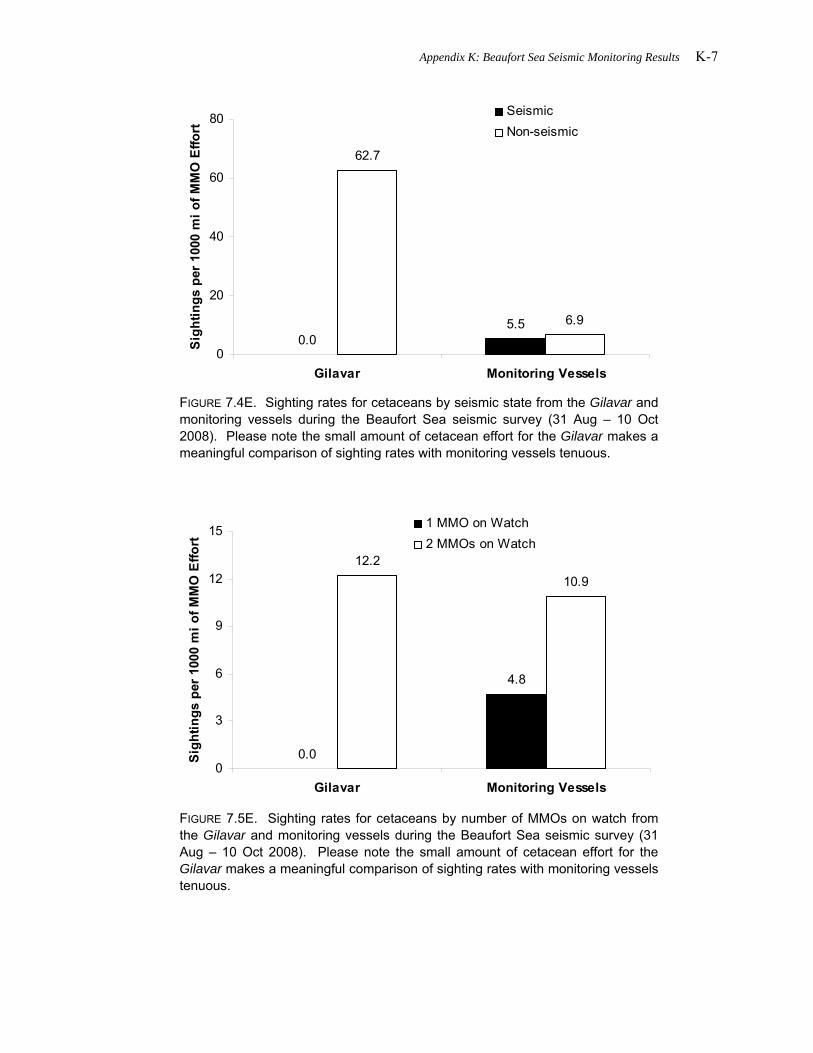
Appendix K: Beaufort Sea Seismic Monitoring Results K-7
0.05.5
62.7
6.9
0
20
40
60
80
Gilavar Monitoring Vessels
Sig
htin
gs p
er 1
000
mi o
f MM
O E
ffort
SeismicNon-seismic
FIGURE 7.4E. Sighting rates for cetaceans by seismic state from the Gilavar and monitoring vessels during the Beaufort Sea seismic survey (31 Aug – 10 Oct 2008). Please note the small amount of cetacean effort for the Gilavar makes a meaningful comparison of sighting rates with monitoring vessels tenuous.
0.0
4.8
12.210.9
0
3
6
9
12
15
Gilavar Monitoring Vessels
Sigh
tings
per
100
0 m
i of M
MO
Effo
rt
1 MMO on Watch2 MMOs on Watch
FIGURE 7.5E. Sighting rates for cetaceans by number of MMOs on watch from the Gilavar and monitoring vessels during the Beaufort Sea seismic survey (31 Aug – 10 Oct 2008). Please note the small amount of cetacean effort for the Gilavar makes a meaningful comparison of sighting rates with monitoring vessels tenuous.

K-8 Monitoring in the Chukchi and Beaufort Seas: Shell Offshore Inc, 2008
14591828
442
5235
0
1500
3000
4500
6000
Gilavar Monitoring Vessels
MM
O E
ffort
(mi)
Seismic
Non-seismic
FIGURE 7.6E. Marine mammal observer effort (mi) for pinnipeds by seismic state from the Gilavar and monitoring vessels during the Beaufort Sea seismic survey (31 Aug – 10 Oct 2008).
238
5446
1649 1609
0
1500
3000
4500
6000
Gilavar Monitoring Vessels
MM
O E
ffort
(mi)
1 MMO on Watch
2 MMOs on Watch
FIGURE 7.7E. Marine mammal observer effort (mi) for pinnipeds by number of MMOs on watch from the Gilavar and monitoring vessels during the Beaufort Sea seismic survey (31 Aug – 10 Oct 2008).

Appendix K: Beaufort Sea Seismic Monitoring Results K-9
102.2
137.6
78.7
95.1
0
30
60
90
120
150
Gilavar Monitoring Vessels
Sig
htin
gs p
er 1
000
mi o
f MM
O E
ffort
SeismicNon-seismic
FIGURE 7.9E. Sighting rates for seals by seismic state from the Gilavar and monitoring vessels during the Beaufort Sea seismic survey (31 Aug – 10 Oct 2008).
37.7
79.4
105.5
196.5
0
50
100
150
200
Gilavar Monitoring Vessels
Sigh
tings
per
100
0 m
i of M
MO
Effo
rt
1 MMO on Watch2 MMOs on Watch
FIGURE 7.10E. Sighting rates for seals by number of MMOs on watch from the Gilavar and monitoring vessels during the Beaufort Sea seismic survey (31 Aug – 10 Oct 2008).

K-10 Monitoring in the Chukchi and Beaufort Seas: Shell Offshore Inc, 2008
TABLE 7.3E. Comparison of cetacean CPA distances by seismic state from the Gilavar and monitoring vessels during the Beaufort Sea seismic survey ((31 Aug – 10 Oct 2008).
Vessel and Seismic Status Mean CPAa (yd) s.d. Range (yd) n
Gilavar Seismic -- -- -- --Gilavar Non-seismic 2168 679 1149-2800 3
Gilavar Overall Mean 2168 679 1449-2800 3
Monitoring Vessels Seismic 1681 1120 547-3843 14Monitoring Vessels Non-seismic 1336 917 219-3281 21
Monitoring Vessels Overall Mean 1474 1002 219-3843 35
a CPA = Closest Point of Approach . For Gilavar this value is the marine mammal's closest point of approach to the airgunarray, for monitoring vessels this value is the marine mammal's closest point of approach to the MMO/vessel.
TABLE 7.7E. Comparison of seal CPA distances by seismic state from the Gilavar and monitoring vessels during the Beaufort Sea seismic survey (31 Aug - 10 Oct 2008).
Vessel and Seismic Status Mean CPAa (yd) s.d. Range (yd) n
Gilavar Seismic 830 443 283-2859 150Gilavar Non-seismic 691 231 341-1282 35
Gilavar Overall Mean 804 414 283-2859 185
Monitoring Vessels Seismic 161 182 11-1141 253Monitoring Vessels Non-seismic 205 236 1-1859 501
Monitoring Vessels Overall Mean 190 220 1-1859 754
a CPA = Closest Point of Approach . For Gilavar this value is the marine mammal's closest point of approach to the airgunarray, for monitoring vessels this value is the marine mammal's closest point of approach to the MMO/vessel.
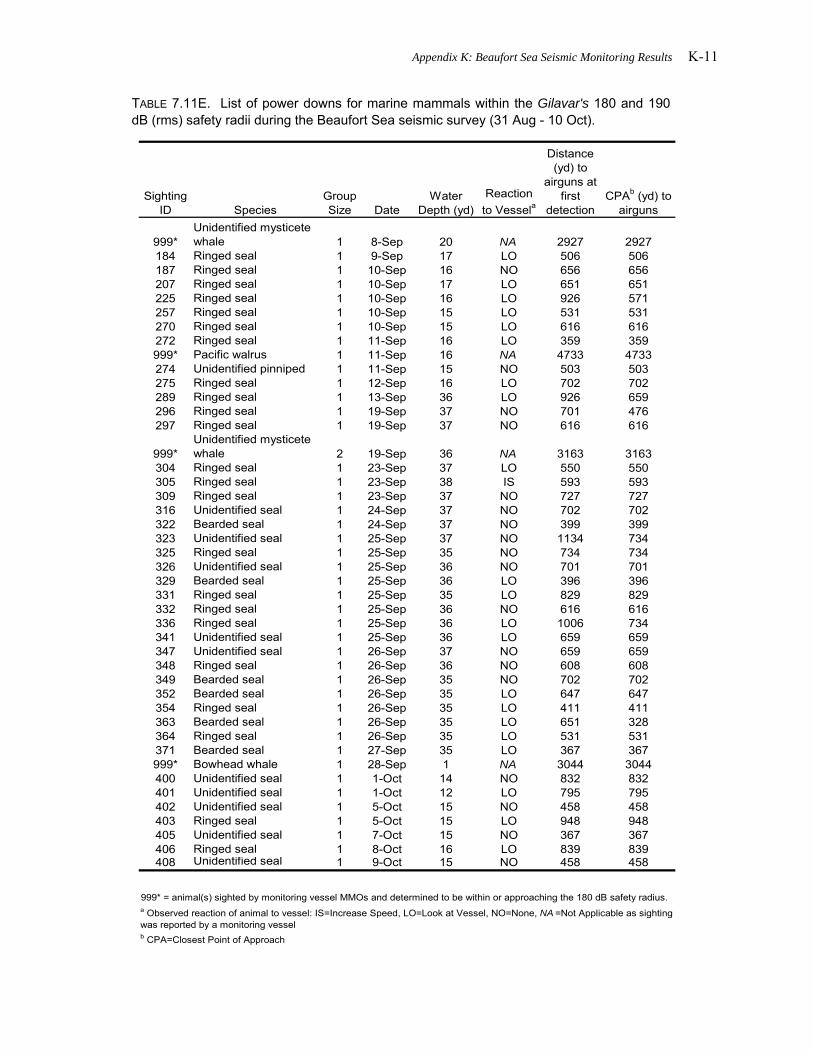
Appendix K: Beaufort Sea Seismic Monitoring Results K-11
TABLE 7.11E. List of power downs for marine mammals within the Gilavar's 180 and 190 dB (rms) safety radii during the Beaufort Sea seismic survey (31 Aug - 10 Oct).
Sighting ID Species
Group Size Date
Water Depth (yd)
Reaction to Vessela
Distance (yd) to
airguns at first
detectionCPAb (yd) to
airguns
999*Unidentified mysticete whale 1 8-Sep 20 NA 2927 2927
184 Ringed seal 1 9-Sep 17 LO 506 506187 Ringed seal 1 10-Sep 16 NO 656 656207 Ringed seal 1 10-Sep 17 LO 651 651225 Ringed seal 1 10-Sep 16 LO 926 571257 Ringed seal 1 10-Sep 15 LO 531 531270 Ringed seal 1 10-Sep 15 LO 616 616272 Ringed seal 1 11-Sep 16 LO 359 359999* Pacific walrus 1 11-Sep 16 NA 4733 4733274 Unidentified pinniped 1 11-Sep 15 NO 503 503275 Ringed seal 1 12-Sep 16 LO 702 702289 Ringed seal 1 13-Sep 36 LO 926 659296 Ringed seal 1 19-Sep 37 NO 701 476297 Ringed seal 1 19-Sep 37 NO 616 616
999*Unidentified mysticete whale 2 19-Sep 36 NA 3163 3163
304 Ringed seal 1 23-Sep 37 LO 550 550305 Ringed seal 1 23-Sep 38 IS 593 593309 Ringed seal 1 23-Sep 37 NO 727 727316 Unidentified seal 1 24-Sep 37 NO 702 702322 Bearded seal 1 24-Sep 37 NO 399 399323 Unidentified seal 1 25-Sep 37 NO 1134 734325 Ringed seal 1 25-Sep 35 NO 734 734326 Unidentified seal 1 25-Sep 36 NO 701 701329 Bearded seal 1 25-Sep 36 LO 396 396331 Ringed seal 1 25-Sep 35 LO 829 829332 Ringed seal 1 25-Sep 36 NO 616 616336 Ringed seal 1 25-Sep 36 LO 1006 734341 Unidentified seal 1 25-Sep 36 LO 659 659347 Unidentified seal 1 26-Sep 37 NO 659 659348 Ringed seal 1 26-Sep 36 NO 608 608349 Bearded seal 1 26-Sep 35 NO 702 702352 Bearded seal 1 26-Sep 35 LO 647 647354 Ringed seal 1 26-Sep 35 LO 411 411363 Bearded seal 1 26-Sep 35 LO 651 328364 Ringed seal 1 26-Sep 35 LO 531 531371 Bearded seal 1 27-Sep 35 LO 367 367999* Bowhead whale 1 28-Sep 1 NA 3044 3044400 Unidentified seal 1 1-Oct 14 NO 832 832401 Unidentified seal 1 1-Oct 12 LO 795 795402 Unidentified seal 1 5-Oct 15 NO 458 458403 Ringed seal 1 5-Oct 15 LO 948 948405 Unidentified seal 1 7-Oct 15 NO 367 367406 Ringed seal 1 8-Oct 16 LO 839 839408 Unidentified seal 1 9-Oct 15 NO 458 458
999* = animal(s) sighted by monitoring vessel MMOs and determined to be within or approaching the 180 dB safety radius. a Observed reaction of animal to vessel: IS=Increase Speed, LO=Look at Vessel, NO=None, NA =Not Applicable as sighting was reported by a monitoring vesselb CPA=Closest Point of Approach
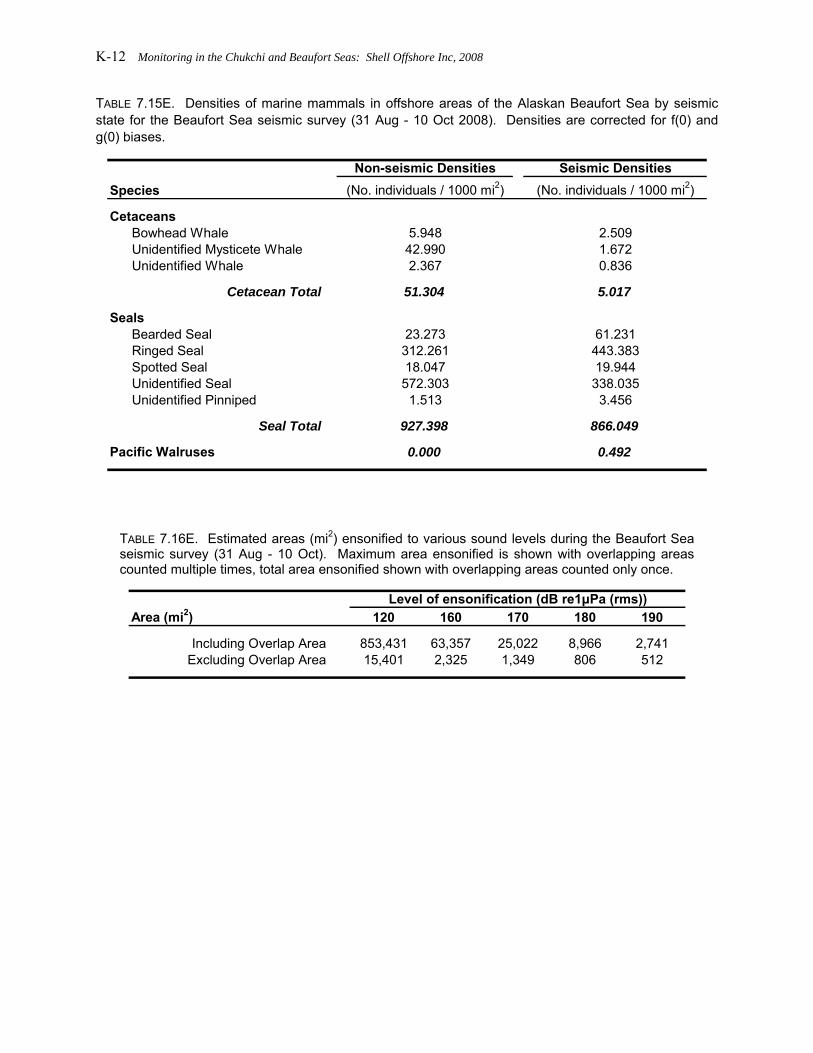
K-12 Monitoring in the Chukchi and Beaufort Seas: Shell Offshore Inc, 2008
TABLE 7.15E. Densities of marine mammals in offshore areas of the Alaskan Beaufort Sea by seismic state for the Beaufort Sea seismic survey (31 Aug - 10 Oct 2008). Densities are corrected for f(0) and g(0) biases.
Non-seismic Densities Seismic DensitiesSpecies (No. individuals / 1000 mi2) (No. individuals / 1000 mi2)
Cetaceans Bowhead Whale 5.948 2.509 Unidentified Mysticete Whale 42.990 1.672 Unidentified Whale 2.367 0.836
Cetacean Total 51.304 5.017
Seals Bearded Seal 23.273 61.231 Ringed Seal 312.261 443.383 Spotted Seal 18.047 19.944 Unidentified Seal 572.303 338.035 Unidentified Pinniped 1.513 3.456
Seal Total 927.398 866.049
Pacific Walruses 0.000 0.492
TABLE 7.16E. Estimated areas (mi2) ensonified to various sound levels during the Beaufort Sea seismic survey (31 Aug - 10 Oct). Maximum area ensonified is shown with overlapping areas counted multiple times, total area ensonified shown with overlapping areas counted only once.
Area (mi2) 120 160 170 180 190
Including Overlap Area 853,431 63,357 25,022 8,966 2,741Excluding Overlap Area 15,401 2,325 1,349 806 512
Level of ensonification (dB re1μPa (rms))
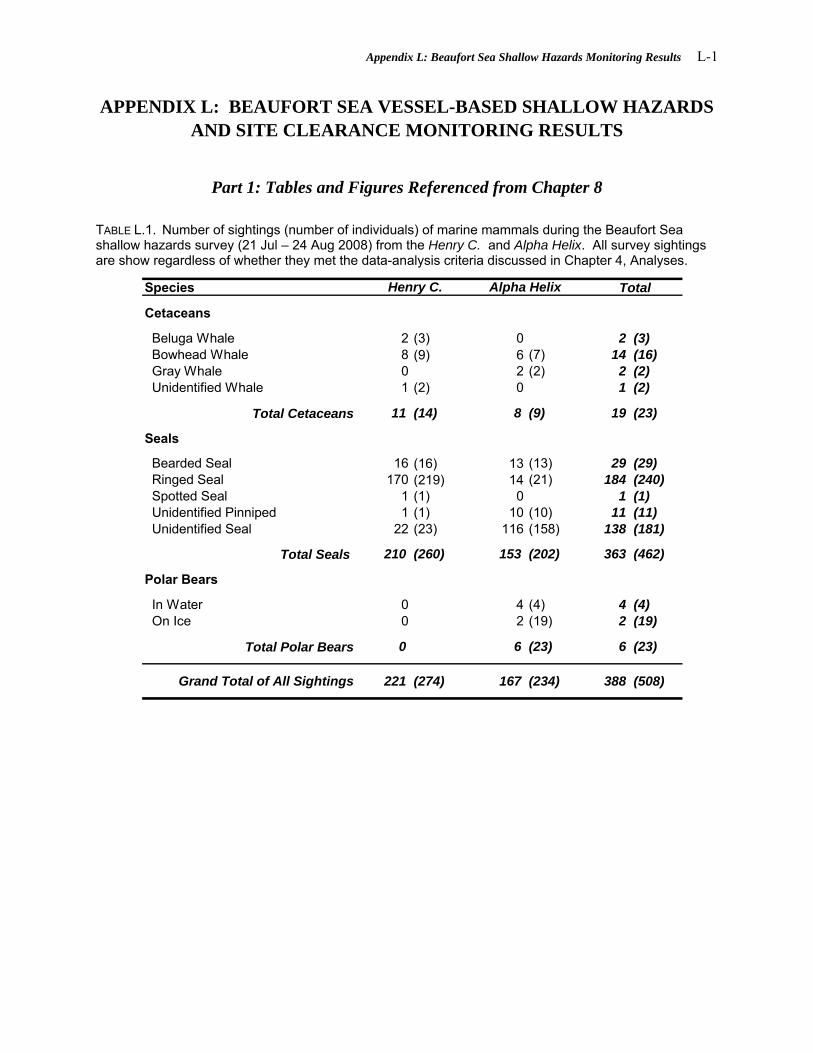
Appendix L: Beaufort Sea Shallow Hazards Monitoring Results L-1
APPENDIX L: BEAUFORT SEA VESSEL-BASED SHALLOW HAZARDS AND SITE CLEARANCE MONITORING RESULTS
Part 1: Tables and Figures Referenced from Chapter 8 TABLE L.1. Number of sightings (number of individuals) of marine mammals during the Beaufort Sea shallow hazards survey (21 Jul – 24 Aug 2008) from the Henry C. and Alpha Helix. All survey sightings are show regardless of whether they met the data-analysis criteria discussed in Chapter 4, Analyses.
Species
Cetaceans
Beluga Whale 2 (3) 0 2 (3) Bowhead Whale 8 (9) 6 (7) 14 (16) Gray Whale 0 2 (2) 2 (2) Unidentified Whale 1 (2) 0 1 (2)
Total Cetaceans 11 (14) 8 (9) 19 (23)
Seals
Bearded Seal 16 (16) 13 (13) 29 (29) Ringed Seal 170 (219) 14 (21) 184 (240) Spotted Seal 1 (1) 0 1 (1) Unidentified Pinniped 1 (1) 10 (10) 11 (11) Unidentified Seal 22 (23) 116 (158) 138 (181)
Total Seals 210 (260) 153 (202) 363 (462)
Polar Bears
In Water 0 4 (4) 4 (4) On Ice 0 2 (19) 2 (19)
Total Polar Bears 0 6 (23) 6 (23)
Grand Total of All Sightings 221 (274) 167 (234) 388 (508)
Henry C. Alpha Helix Total

L-2 Monitoring in the Chukchi and Beaufort Seas: Shell Offshore Inc, 2008
TABLE L.2. Visual observation effort for cetaceans from the Henry C. and Alpha Helix during the Beaufort Sea shallow hazards survey (21 Jul- 24 Aug 2008). Effort shown is that which met the data-analysis criteria discussed in Chapter 4, Analyses. Effort categories include kilometers, hours and miles, subdivided by Beaufort wind force and airgun status. Ramp-up effort is included in the "Seismic" category.
Beaufort Wind Force 0 1 2 3 4 5 Total
Henry C. Effort in km Non-seismic 44 403 562 600 206 78 1894 Seismic 15 89 296 300 142 18 859
Total 59 492 859 901 348 95 2754
Effort in h Non-seismic 5 49 74 74 28 11 242 Seismic 2 13 43 44 21 3 125
Total 7 62 117 118 49 14 367
Effort in mi Non-seismic 28 251 350 373 128 48 1177 Seismic 9 55 184 187 88 11 534
Total 37 306 533 560 216 59 1711
Alpha Helix Effort in km Non-seismic 0 272 641 1030 654 101 2699 Seismic 0 0 100 81 65 5 251
Total 0 272 741 1111 719 106 2950
Effort in h Non-seismic 0 34 69 103 60 11 278 Seismic 0 0 11 9 8 1 29
Total 0 34 81 113 69 11 308
Effort in mi Non-seismic 0 169 398 640 406 63 1677 Seismic 0 0 62 50 40 3 156
Total 0 169 461 691 447 66 1833
Total Effort in km 59 764 1600 2012 1067 201 5703
Total Effort in h 7 96 197 230 118 25 674
Total Effort in mi 37 475 994 1250 663 125 3544
MMO Watch Effort
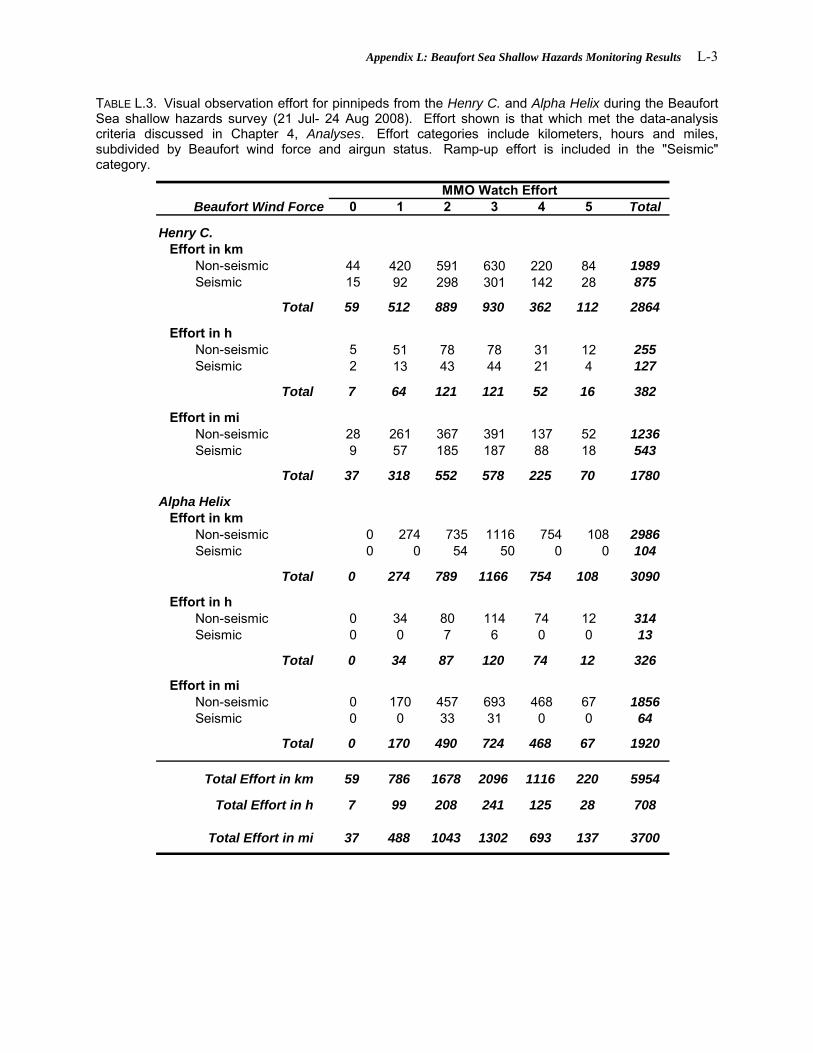
Appendix L: Beaufort Sea Shallow Hazards Monitoring Results L-3
TABLE L.3. Visual observation effort for pinnipeds from the Henry C. and Alpha Helix during the Beaufort Sea shallow hazards survey (21 Jul- 24 Aug 2008). Effort shown is that which met the data-analysis criteria discussed in Chapter 4, Analyses. Effort categories include kilometers, hours and miles, subdivided by Beaufort wind force and airgun status. Ramp-up effort is included in the "Seismic" category.
Beaufort Wind Force 0 1 2 3 4 5 Total
Henry C. Effort in km Non-seismic 44 420 591 630 220 84 1989 Seismic 15 92 298 301 142 28 875
Total 59 512 889 930 362 112 2864
Effort in h Non-seismic 5 51 78 78 31 12 255 Seismic 2 13 43 44 21 4 127
Total 7 64 121 121 52 16 382
Effort in mi Non-seismic 28 261 367 391 137 52 1236 Seismic 9 57 185 187 88 18 543
Total 37 318 552 578 225 70 1780
Alpha Helix Effort in km Non-seismic 0 274 735 1116 754 108 2986 Seismic 0 0 54 50 0 0 104
Total 0 274 789 1166 754 108 3090
Effort in h Non-seismic 0 34 80 114 74 12 314 Seismic 0 0 7 6 0 0 13
Total 0 34 87 120 74 12 326
Effort in mi Non-seismic 0 170 457 693 468 67 1856 Seismic 0 0 33 31 0 0 64
Total 0 170 490 724 468 67 1920
Total Effort in km 59 786 1678 2096 1116 220 5954
Total Effort in h 7 99 208 241 125 28 708
Total Effort in mi 37 488 1043 1302 693 137 3700
MMO Watch Effort
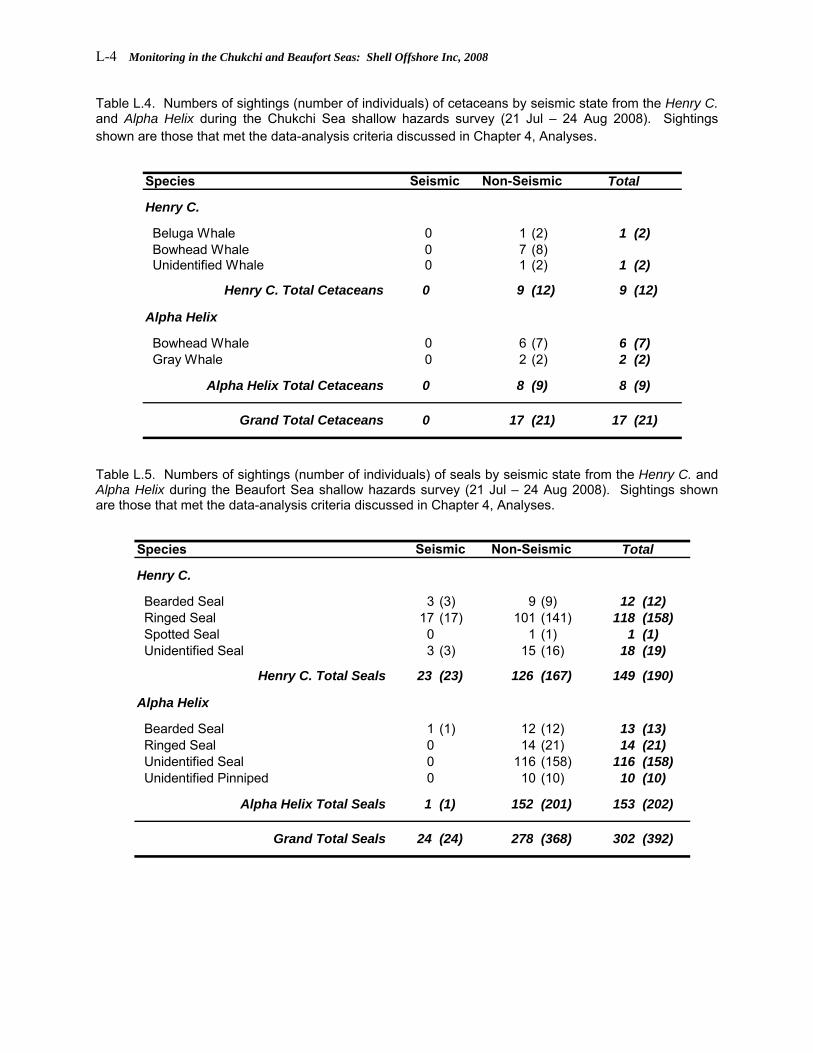
L-4 Monitoring in the Chukchi and Beaufort Seas: Shell Offshore Inc, 2008
Table L.4. Numbers of sightings (number of individuals) of cetaceans by seismic state from the Henry C. and Alpha Helix during the Chukchi Sea shallow hazards survey (21 Jul – 24 Aug 2008). Sightings shown are those that met the data-analysis criteria discussed in Chapter 4, Analyses.
Species
Henry C.
Beluga Whale 0 1 (2) 1 (2) Bowhead Whale 0 7 (8) Unidentified Whale 0 1 (2) 1 (2)
Henry C. Total Cetaceans 0 9 (12) 9 (12)
Alpha Helix
Bowhead Whale 0 6 (7) 6 (7) Gray Whale 0 2 (2) 2 (2)
Alpha Helix Total Cetaceans 0 8 (9) 8 (9)
Grand Total Cetaceans 0 17 (21) 17 (21)
Seismic Non-Seismic Total
Table L.5. Numbers of sightings (number of individuals) of seals by seismic state from the Henry C. and Alpha Helix during the Beaufort Sea shallow hazards survey (21 Jul – 24 Aug 2008). Sightings shown are those that met the data-analysis criteria discussed in Chapter 4, Analyses.
Species
Henry C.
Bearded Seal 3 (3) 9 (9) 12 (12) Ringed Seal 17 (17) 101 (141) 118 (158) Spotted Seal 0 1 (1) 1 (1) Unidentified Seal 3 (3) 15 (16) 18 (19)
Henry C. Total Seals 23 (23) 126 (167) 149 (190)
Alpha Helix
Bearded Seal 1 (1) 12 (12) 13 (13) Ringed Seal 0 14 (21) 14 (21) Unidentified Seal 0 116 (158) 116 (158) Unidentified Pinniped 0 10 (10) 10 (10)
Alpha Helix Total Seals 1 (1) 152 (201) 153 (202)
Grand Total Seals 24 (24) 278 (368) 302 (392)
Seismic Non-Seismic Total
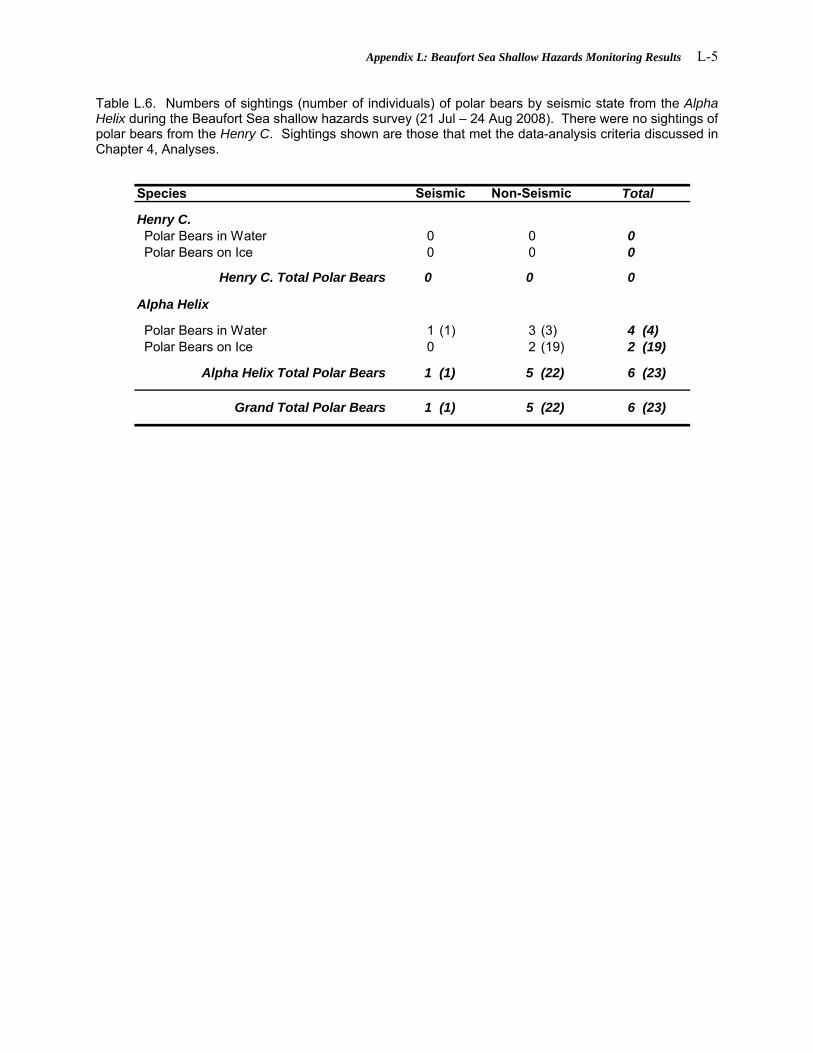
Appendix L: Beaufort Sea Shallow Hazards Monitoring Results L-5
Table L.6. Numbers of sightings (number of individuals) of polar bears by seismic state from the Alpha Helix during the Beaufort Sea shallow hazards survey (21 Jul – 24 Aug 2008). There were no sightings of polar bears from the Henry C. Sightings shown are those that met the data-analysis criteria discussed in Chapter 4, Analyses.
Species
Henry C. Polar Bears in Water 0 0 0 Polar Bears on Ice 0 0 0
Henry C. Total Polar Bears 0 0 0
Alpha Helix
Polar Bears in Water 1 (1) 3 (3) 4 (4) Polar Bears on Ice 0 2 (19) 2 (19)
Alpha Helix Total Polar Bears 1 (1) 5 (22) 6 (23)
Grand Total Polar Bears 1 (1) 5 (22) 6 (23)
Seismic Non-Seismic Total
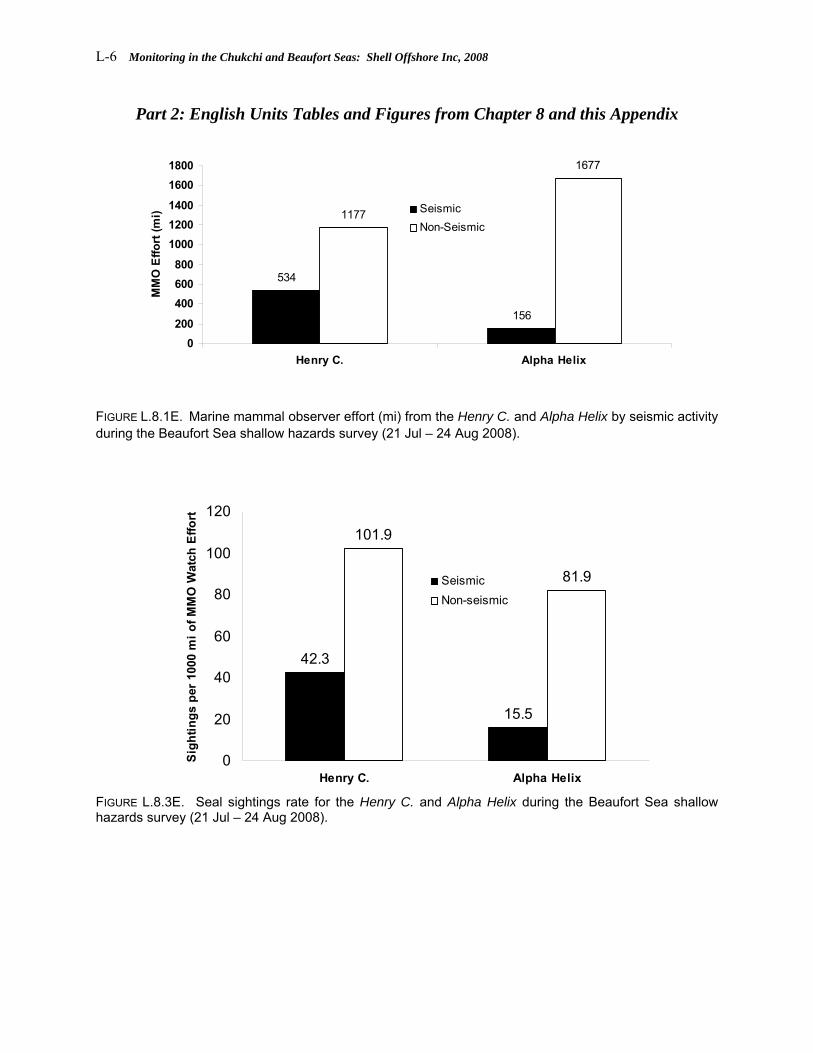
L-6 Monitoring in the Chukchi and Beaufort Seas: Shell Offshore Inc, 2008
Part 2: English Units Tables and Figures from Chapter 8 and this Appendix
156
1177
1677
534
0200
400600800
100012001400
16001800
Henry C. Alpha Helix
MM
O E
ffort
(mi) Seismic
Non-Seismic
FIGURE L.8.1E. Marine mammal observer effort (mi) from the Henry C. and Alpha Helix by seismic activity during the Beaufort Sea shallow hazards survey (21 Jul – 24 Aug 2008).
42.3
15.5
101.9
81.9
0
20
40
60
80
100
120
Henry C. Alpha Helix
Sigh
tings
per
100
0 m
i of M
MO
Wat
ch E
ffort
SeismicNon-seismic
FIGURE L.8.3E. Seal sightings rate for the Henry C. and Alpha Helix during the Beaufort Sea shallow hazards survey (21 Jul – 24 Aug 2008).
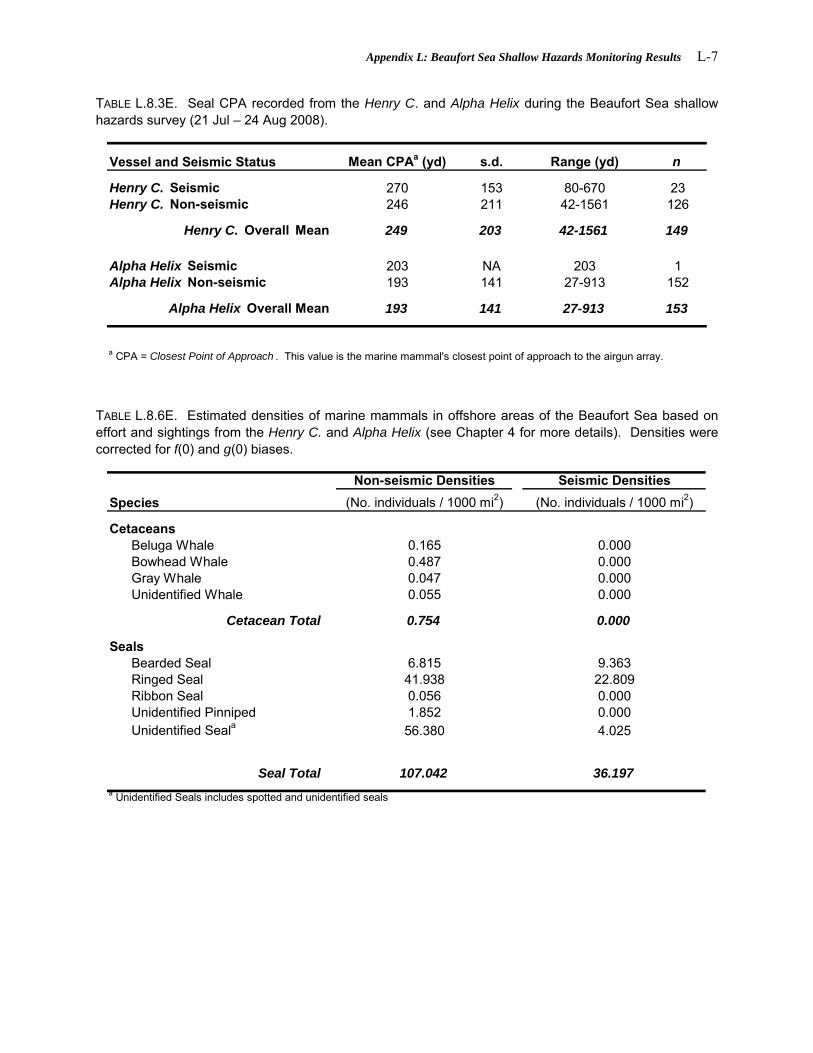
Appendix L: Beaufort Sea Shallow Hazards Monitoring Results L-7
TABLE L.8.3E. Seal CPA recorded from the Henry C. and Alpha Helix during the Beaufort Sea shallow hazards survey (21 Jul – 24 Aug 2008).
Vessel and Seismic Status Mean CPAa (yd) s.d. Range (yd) n
Henry C. Seismic 270 153 80-670 23Henry C. Non-seismic 246 211 42-1561 126
Henry C. Overall Mean 249 203 42-1561 149
Alpha Helix Seismic 203 NA 203 1Alpha Helix Non-seismic 193 141 27-913 152
Alpha Helix Overall Mean 193 141 27-913 153
a CPA = Closest Point of Approach . This value is the marine mammal's closest point of approach to the airgun array. TABLE L.8.6E. Estimated densities of marine mammals in offshore areas of the Beaufort Sea based on effort and sightings from the Henry C. and Alpha Helix (see Chapter 4 for more details). Densities were corrected for f(0) and g(0) biases.
Non-seismic Densities Seismic DensitiesSpecies (No. individuals / 1000 mi2) (No. individuals / 1000 mi2)
Cetaceans Beluga Whale 0.165 0.000 Bowhead Whale 0.487 0.000 Gray Whale 0.047 0.000 Unidentified Whale 0.055 0.000
Cetacean Total 0.754 0.000
Seals Bearded Seal 6.815 9.363 Ringed Seal 41.938 22.809 Ribbon Seal 0.056 0.000 Unidentified Pinniped 1.852 0.000 Unidentified Seala 56.380 4.025
Seal Total 107.042 36.197a Unidentified Seals includes spotted and unidentified seals

L-8 Monitoring in the Chukchi and Beaufort Seas: Shell Offshore Inc, 2008
TABLE L.8.7E. Estimated areas (mi2) ensonified to various sound levels during the Beaufort Sea shallow hazards survey (21 Jul - 24 Aug 2008). Maximum area ensonified is shown with overlapping areas counted multiple times, total area ensonified shown with overlapping areas counted only once.
Area (mi2) 120 160 170 180 190Henry C.
Including Overlap Area 21991 486 136 36 9Excluding Overlap Area 1402 244 107 32 9
Alpha HelixIncluding Overlap Area 1546 56 22 9 3
Excluding Overlap Area 700 25 12 5 2
Level of ensonification (dB re1μPa (rms)
TABLE L.8.8E. Estimated numbers of individual cetaceans exposed to received sound levels ≥160, 170, 180, and 190 dB (rms) and average number of exposures per individual for the Henry C. and Alpha Helix during the Beaufort Sea shallow hazards survey (21 Jul – 24 Aug 2008). Estimates are based on "corrected" densities of cetaceans calculated from effort and sightings data during seismic and non-seismic periods.
Exposure level in dB re 1μPa (rms) Individuals
Exposures per Individual Individuals
Exposures per Individual
Henry C≥160 1* 2.0 0 2.0≥170 1* 1.3 0 1.3≥180 1* 1.1 0 1.1≥190 1* 1.0 0 1.0
Alpha Helix≥160 1* 2.2 0 2.2≥170 1* 1.8 0 1.8≥180 1* 1.8 0 1.9≥190 1* 1.5 0 1.7
* Actual value less than 1.
Non-seismic Densities Seismic Densities
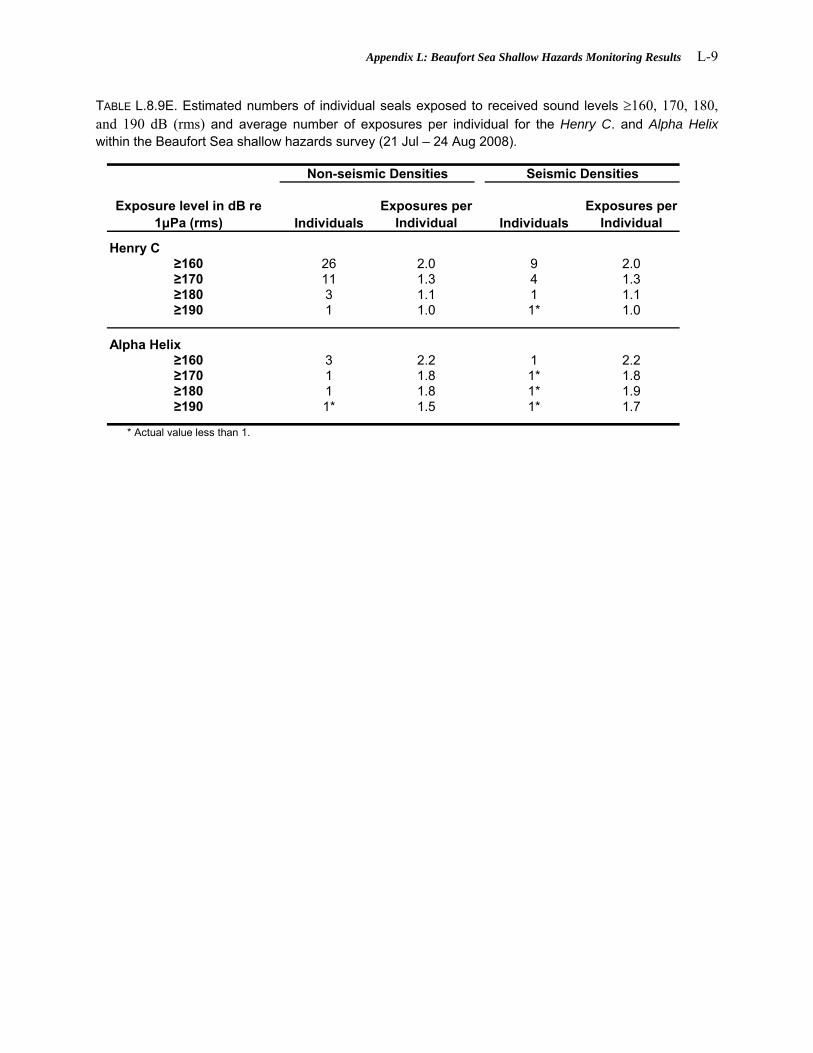
Appendix L: Beaufort Sea Shallow Hazards Monitoring Results L-9
TABLE L.8.9E. Estimated numbers of individual seals exposed to received sound levels ≥160, 170, 180, and 190 dB (rms) and average number of exposures per individual for the Henry C. and Alpha Helix within the Beaufort Sea shallow hazards survey (21 Jul – 24 Aug 2008).
Exposure level in dB re 1μPa (rms) Individuals
Exposures per Individual Individuals
Exposures per Individual
Henry C≥160 26 2.0 9 2.0≥170 11 1.3 4 1.3≥180 3 1.1 1 1.1≥190 1 1.0 1* 1.0
Alpha Helix≥160 3 2.2 1 2.2≥170 1 1.8 1* 1.8≥180 1 1.8 1* 1.9≥190 1* 1.5 1* 1.7
* Actual value less than 1.
Non-seismic Densities Seismic Densities

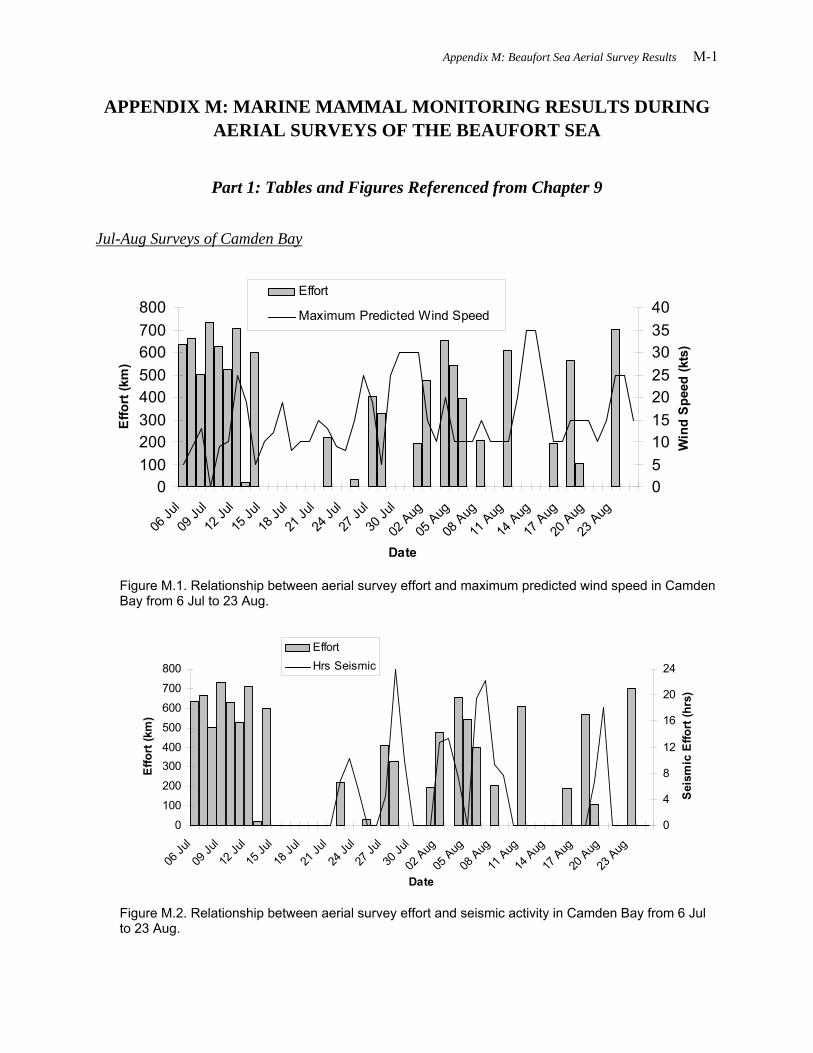
Appendix M: Beaufort Sea Aerial Survey Results M-1
APPENDIX M: MARINE MAMMAL MONITORING RESULTS DURING AERIAL SURVEYS OF THE BEAUFORT SEA
Part 1: Tables and Figures Referenced from Chapter 9
Jul-Aug Surveys of Camden Bay
0100200300400500600700800
06 Ju
l
09 Ju
l
12 Ju
l
15 Ju
l
18 Ju
l
21 Ju
l
24 Ju
l
27 Ju
l
30 Ju
l
02 Aug
05 Aug
08 Aug
11 Aug
14 Aug
17 Aug
20 Aug
23 Aug
Date
Effo
rt (k
m)
0510152025303540
Win
d S
peed
(kts
)
Effort
Maximum Predicted Wind Speed
Figure M.1. Relationship between aerial survey effort and maximum predicted wind speed in Camden Bay from 6 Jul to 23 Aug.
0
100
200
300400
500
600
700
800
06 Ju
l
09 Ju
l
12 Ju
l
15 Ju
l
18 Ju
l
21 Ju
l
24 Ju
l
27 Ju
l
30 Ju
l
02 Aug
05 Aug
08 Aug
11 Aug
14 Aug
17 Aug
20 Aug
23 Aug
Date
Effo
rt (k
m)
0
4
8
12
16
20
24S
eism
ic E
ffort
(hrs
)
EffortHrs Seismic
Figure M.2. Relationship between aerial survey effort and seismic activity in Camden Bay from 6 Jul to 23 Aug.

M-2 Monitoring in the Chukchi and Beaufort Seas: Shell Offshore Inc, 2008
TABLE M.1. Sighting rates of bowhead whales in 5-km distance from shore bins by survey area and seismic state in Camden Bay from 6 Jul to 23 Aug. Dashes represent bins in which no effort was collected. Numbers in bold indicate maximum values.
Distance bin Pre Seismic Post Non Pre Seismic Post Non Pre Seismic Post Non Pre Seismic Post Non0-5 0.0 0.0 0.0 0.0 0.0 0.0 0.0 0.0 0.0 0.0 0.0 0.0 0.0 0.0 0.0 0.05-10 0.0 0.0 0.0 0.0 0.0 0.0 0.0 0.0 0.0 0.0 0.0 0.0 0.0 0.0 0.0 0.010-15 0.0 0.0 0.0 0.0 0.0 0.0 0.0 0.0 0.0 25.8 0.0 0.0 0.0 10.2 0.0 0.015-20 0.0 0.0 0.0 0.0 0.0 0.0 0.0 0.0 0.0 0.0 0.0 0.0 0.0 0.0 0.0 0.020-25 0.0 0.0 0.0 0.0 0.0 0.0 0.0 0.0 0.0 0.0 0.0 0.0 0.0 0.0 0.0 0.025-30 0.0 0.0 0.0 0.0 0.0 0.0 0.0 0.0 0.0 0.0 0.0 0.0 0.0 0.0 0.0 0.030-35 0.0 0.0 0.0 0.0 0.0 0.0 0.0 26.8 0.0 0.0 0.0 0.0 0.0 0.0 0.0 8.935-40 0.0 0.0 0.0 0.0 0.0 0.0 0.0 10.2 0.0 0.0 0.0 0.0 0.0 0.0 0.0 3.840-45 0.0 0.0 0.0 0.0 0.0 0.0 0.0 0.0 0.0 0.0 0.0 0.0 0.0 0.0 0.0 0.045-50 0.0 0.0 0.0 0.0 0.0 0.0 0.0 0.0 0.0 0.0 0.0 0.0 0.0 0.0 0.0 0.050-55 0.0 0.0 0.0 0.0 0.0 0.0 0.0 0.0 0.0 0.0 0.0 0.0 0.0 0.0 0.0 0.055-60 0.0 0.0 -- 0.0 0.0 0.0 0.0 0.0 0.0 0.0 0.0 0.0 0.0 0.0 0.0 0.060-65 0.0 0.0 0.0 0.0 14.6 0.0 0.0 0.0 70.0 0.0 0.0 0.0 24.0 0.0 0.0 0.065-70 0.0 -- -- 0.0 7.0 0.0 -- 0.0 11.0 0.0 0.0 0.0 7.9 0.0 0.0 0.070-75 0.0 -- -- -- 0.0 0.0 0.0 0.0 0.0 0.0 0.0 0.0 0.0 0.0 0.0 0.075-80 -- -- -- -- 0.0 0.0 -- 0.0 0.0 0.0 0.0 0.0 0.0 0.0 0.0 0.080-85 -- -- -- -- -- -- -- -- 0.0 0.0 0.0 0.0 0.0 0.0 0.0 0.085-90 -- -- -- -- -- -- -- -- 0.0 -- -- -- 0.0 -- -- --
Average 0.0 0.0 0.0 0.0 1.3 0.0 0.0 2.3 4.5 1.5 0.0 0.0 1.8 0.6 0.0 0.7
West Central East All
TABLE M.2. All bowhead sightings observed during seismic activities in Camden Bay from 6 Jul through 23 Aug.
Date Time Number On/Off Transect
Distance (km) from center of seismic patch
Heading Start of seismicTime elapsed since start of
seismic
19 Aug 18:45:46 1 On 54.8 150 19-Aug 17:20:37 1.4
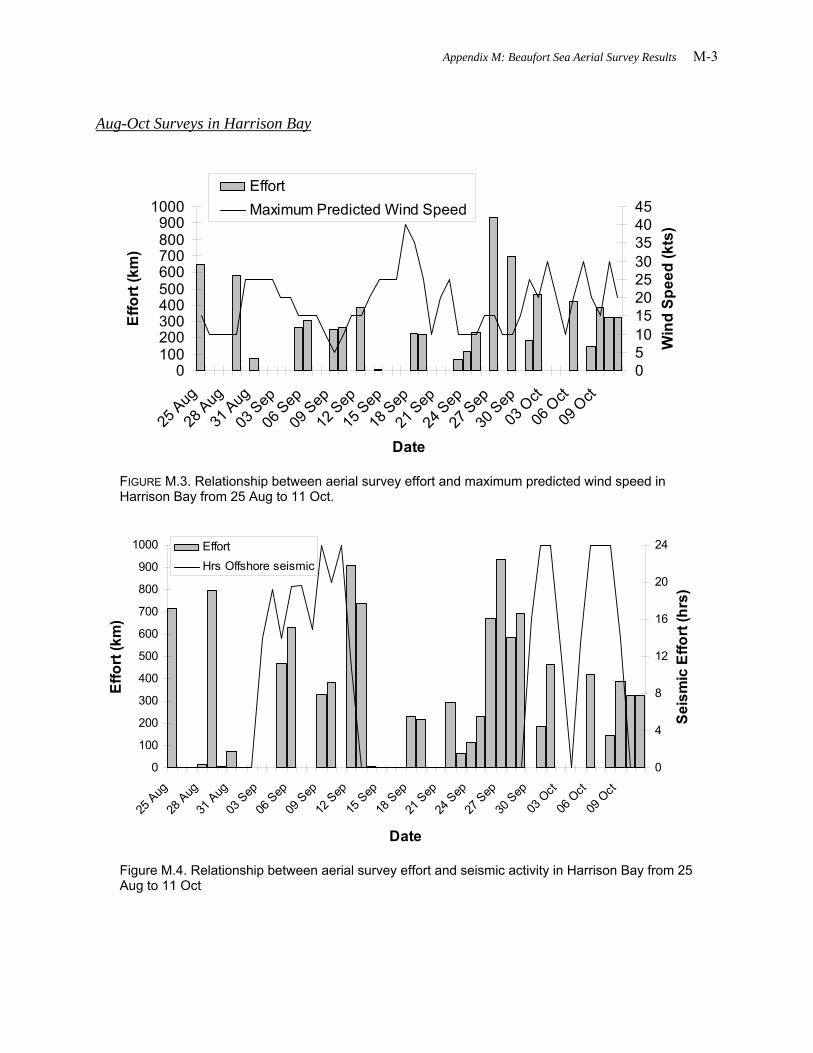
Appendix M: Beaufort Sea Aerial Survey Results M-3
Aug-Oct Surveys in Harrison Bay
0100200300400500600700800900
1000
25 Aug
28 Aug
31 Aug
03 Sep
06 Sep
09 Sep
12 Sep
15 Sep
18 Sep
21 Sep
24 Sep
27 Sep
30 Sep
03 O
ct
06 O
ct
09 O
ct
Date
Effo
rt (k
m)
051015202530354045
Win
d Sp
eed
(kts
)
EffortMaximum Predicted Wind Speed
FIGURE M.3. Relationship between aerial survey effort and maximum predicted wind speed in Harrison Bay from 25 Aug to 11 Oct.
0
100
200
300
400
500
600
700
800
900
1000
25 Aug
28 Aug
31 Aug
03 Sep
06 Sep
09 Sep
12 Sep
15 Sep
18 Sep
21 Sep
24 Sep
27 Sep
30 Sep
03 O
ct
06 O
ct
09 O
ct
Date
Effo
rt (k
m)
0
4
8
12
16
20
24
Seis
mic
Effo
rt (h
rs)
EffortHrs Offshore seismic
Figure M.4. Relationship between aerial survey effort and seismic activity in Harrison Bay from 25 Aug to 11 Oct

M-4 Monitoring in the Chukchi and Beaufort Seas: Shell Offshore Inc, 2008
TABLE M.3. Sighting rates of bowhead whales in 5-km distance from shore bins by survey area and seismic state in Harrison Bay from 25 Aug to 11 Oct. Dashes represent bins in which no effort was collected. Numbers in bold indicate maximum values.
Distance bin Seismic Post Non Seismic Post Non Seismic Post Non Seismic Post Non0-5 -- -- -- 0 0 0 0 0 0 0 0 05-10 0.0 0.0 0.0 0.0 0.0 0.0 0.0 0.0 0.0 0.0 0.0 0.010-15 0.0 0.0 0.0 0.0 0.0 0.0 0.0 34.2 0.0 0.0 7.3 0.015-20 0.0 0.0 0.0 0.0 0.0 3.3 45.5 0.0 0.0 4.8 0.0 2.620-25 0.0 0.0 0.0 0.0 0.0 3.6 0.0 0.0 0.0 0.0 0.0 2.425-30 0.0 0.0 0.0 21.1 0.0 50.9 68.9 31.6 47.4 18.5 6.2 39.930-35 15.8 0.0 12.2 0.0 0.0 3.9 0.0 0.0 0.0 8.4 0.0 5.435-40 8.5 0.0 0.0 0.0 0.0 5.0 0.0 48.4 0.0 4.1 8.0 2.940-45 0.0 0.0 0.0 0.0 0.0 0.0 0.0 0.0 0.0 16.7 0.0 0.045-50 17.9 34.9 0.0 10.7 25.6 0.0 0.0 0.0 0.0 0.0 20.1 0.050-55 0.0 0.0 0.0 0.0 0.0 0.0 0.0 0.0 0.0 0.0 0.0 0.055-60 0.0 0.0 0.0 0.0 101.0 8.6 0.0 0.0 0.0 0.0 30.9 4.760-65 0.0 0.0 0.0 0.0 0.0 9.2 0.0 0.0 0.0 0.0 0.0 5.165-70 0.0 0.0 0.0 0.0 0.0 0.0 0.0 0.0 0.0 0.0 0.0 0.070-75 0.0 0.0 0.0 0.0 0.0 0.0 0.0 0.0 0.0 0.0 0.0 0.075-80 0.0 0.0 -- 0.0 0.0 0.0 0.0 -- 0.0 0.0 0.0 0.080-85 0.0 -- 0.0 0.0 0.0 0.0 0.0 0.0 0.0 0.0 0.0 0.085-90 -- -- -- 0.0 0.0 0.0 0.0 0.0 -- 0.0 0.0 0.090-95 -- -- -- 0.0 0.0 0.0 0.0 -- 0.0 0.0 0.0 0.095-100 -- -- -- 0.0 0.0 0.0 -- -- 0.0 0.0 0.0 0.0100-105 -- -- -- -- 0.0 0.0 -- -- -- -- 0.0 0.0105-110 -- -- -- 0.0 0.0 -- -- -- -- 0.0 0.0 --110-115 -- -- -- 0.0 -- 0.0 -- -- -- 0.0 -- 0.0
Average 2.6 2.3 0.8 1.4 5.8 3.8 6.0 6.7 2.5 2.4 3.3 2.9
West Central East All
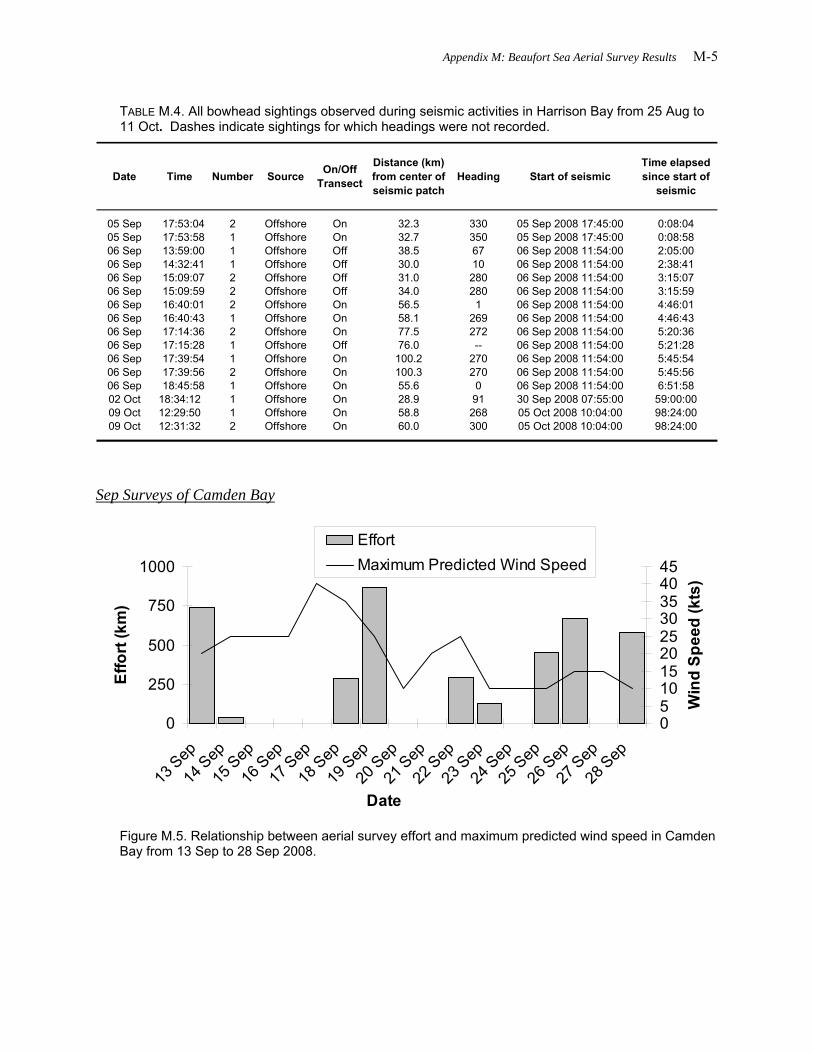
Appendix M: Beaufort Sea Aerial Survey Results M-5
TABLE M.4. All bowhead sightings observed during seismic activities in Harrison Bay from 25 Aug to 11 Oct. Dashes indicate sightings for which headings were not recorded.
Date Time Number Source On/Off Transect
Distance (km) from center of seismic patch
Heading Start of seismicTime elapsed since start of
seismic
05 Sep 17:53:04 2 Offshore On 32.3 330 05 Sep 2008 17:45:00 0:08:0405 Sep 17:53:58 1 Offshore On 32.7 350 05 Sep 2008 17:45:00 0:08:5806 Sep 13:59:00 1 Offshore Off 38.5 67 06 Sep 2008 11:54:00 2:05:0006 Sep 14:32:41 1 Offshore Off 30.0 10 06 Sep 2008 11:54:00 2:38:4106 Sep 15:09:07 2 Offshore Off 31.0 280 06 Sep 2008 11:54:00 3:15:0706 Sep 15:09:59 2 Offshore Off 34.0 280 06 Sep 2008 11:54:00 3:15:5906 Sep 16:40:01 2 Offshore On 56.5 1 06 Sep 2008 11:54:00 4:46:0106 Sep 16:40:43 1 Offshore On 58.1 269 06 Sep 2008 11:54:00 4:46:4306 Sep 17:14:36 2 Offshore On 77.5 272 06 Sep 2008 11:54:00 5:20:3606 Sep 17:15:28 1 Offshore Off 76.0 -- 06 Sep 2008 11:54:00 5:21:2806 Sep 17:39:54 1 Offshore On 100.2 270 06 Sep 2008 11:54:00 5:45:5406 Sep 17:39:56 2 Offshore On 100.3 270 06 Sep 2008 11:54:00 5:45:5606 Sep 18:45:58 1 Offshore On 55.6 0 06 Sep 2008 11:54:00 6:51:5802 Oct 18:34:12 1 Offshore On 28.9 91 30 Sep 2008 07:55:00 59:00:0009 Oct 12:29:50 1 Offshore On 58.8 268 05 Oct 2008 10:04:00 98:24:0009 Oct 12:31:32 2 Offshore On 60.0 300 05 Oct 2008 10:04:00 98:24:00
Sep Surveys of Camden Bay
0
250
500
750
1000
13 Sep
14 Sep
15 Sep
16 Sep
17 Sep
18 Sep
19 Sep
20 Sep
21 Sep
22 Sep
23 Sep
24 Sep
25 Sep
26 Sep
27 Sep
28 Sep
Date
Effo
rt (k
m)
051015202530354045
Win
d Sp
eed
(kts
)
EffortMaximum Predicted Wind Speed
Figure M.5. Relationship between aerial survey effort and maximum predicted wind speed in Camden Bay from 13 Sep to 28 Sep 2008.

M-6 Monitoring in the Chukchi and Beaufort Seas: Shell Offshore Inc, 2008
0100200300400500600700800900
1000
13 Sep
14 Sep
15 Sep
16 Sep
17 Sep
18 Sep
19 Sep
20 Sep
21 Sep
22 Sep
23 Sep
24 Sep
25 Sep
26 Sep
27 Sep
28 Sep
Date
Effo
rt (k
m)
0
4
8
12
16
20
24
Sei
smic
Effo
rt (h
rs)
EffortHrs Seismic
Figure M.6. Relationship between aerial survey effort and hours of seismic data acquisition in Camden Bay from 13 Sep to 28 Sep 2008.

Appendix M: Beaufort Sea Aerial Survey Results M-7
TABLE M.5. Sighting rates of bowhead whales in 5-km distance bins by survey area and seismic state in Camden Bay from 13 Sep through 28 Sep 2008. Dashes represent bins in which no effort was collected. Numbers in bold indicate maximum values.
Distance bin Seismic Non-Seismic Seismic Non-Seismic Seismic Non-Seismic Seismic Non-Seismic0-5 0.0 0.0 73.9 0.0 0.0 0.0 16.1 0.05-10 39.0 0.0 0.0 0.0 0.0 0.0 21.7 0.010-15 65.3 144.5 0.0 -- 0.0 0.0 27.3 45.215-20 53.5 0.0 13.5 265.1 0.0 0.0 27.4 82.220-25 36.4 0.0 0.0 66.2 16.2 0.0 22.1 24.525-30 0.0 0.0 0.0 0.0 30.4 0.0 7.6 0.030-35 10.9 0.0 0.0 0.0 13.5 0.0 9.1 0.035-40 0.0 0.0 0.0 0.0 19.7 -- 5.2 0.040-45 10.6 -- 0.0 0.0 0.0 -- 4.5 0.045-50 0.0 0.0 0.0 -- 0.0 -- 0.0 0.050-55 0.0 -- 0.0 -- 0.0 -- 0.0 --55-60 0.0 -- 0.0 -- 0.0 -- 0.0 --60-65 0.0 -- 0.0 -- 0.0 -- 0.0 --65-70 0.0 -- 0.0 -- 0.0 -- 0.0 --70-75 0.0 -- 0.0 -- 0.0 -- 0.0 --75-80 0.0 -- 0.0 -- 0.0 -- 0.0 --80-85 0.0 -- 0.0 -- 0.0 -- 0.0 --85-90 0.0 -- 0.0 -- 0.0 -- 0.0 --90-95 0.0 -- 0.0 -- 0.0 -- 0.0 --95-100 0.0 -- 0.0 -- 0.0 -- 0.0 --100-105 -- -- 0.0 -- 0.0 -- 0.0 --105-110 -- -- 0.0 -- 0.0 -- 0.0 --110-115 -- -- 0.0 -- 0.0 -- 0.0 --115-120 -- -- 0.0 -- -- -- 0.0 --120-125 -- -- 0.0 -- -- -- 0.0 --
Average 10.8 16.1 3.5 41.4 3.5 0.0 5.6 15.2
West Central East All

M-8 Monitoring in the Chukchi and Beaufort Seas: Shell Offshore Inc, 2008
TABLE M.6. All bowhead sightings observed during seismic activities in Camden Bay from 13 Sep to 28 Sep, 2008. Dashes indicate sightings for which headings were not recorded and the term “Various” is used for groups of individuals with different headings.
Date Time Number On/Off Transect
Distance (km) from center of seismic patch
Heading Start of seismic
Time (hrs) elapsed
since start of seismic
13 Sep 12:07:49 1 On 49.9 280 13-Sep 07:11:00 4.913 Sep 12:10:37 1 On 51.9 272 13-Sep 07:11:00 5.013 Sep 12:12:19 1 On 54.0 280 13-Sep 07:11:00 5.013 Sep 12:28:35 1 On 33.4 -- 13-Sep 07:11:00 5.313 Sep 12:29:03 1 On 32.2 271 13-Sep 07:11:00 5.313 Sep 12:34:04 1 On 25.9 180 13-Sep 07:11:00 5.413 Sep 13:47:21 3 On 46.7 Various 13-Sep 07:11:00 6.613 Sep 13:49:02 1 Off 40.9 269 13-Sep 07:11:00 6.613 Sep 14:43:17 1 On 56.6 280 13-Sep 07:11:00 7.513 Sep 14:44:27 1 On 59.8 280 13-Sep 07:11:00 7.613 Sep 18:38:38 1 On 81.9 -- 13-Sep 07:11:00 11.513 Sep 18:39:45 1 On 79.9 -- 13-Sep 07:11:00 11.513 Sep 19:16:55 1 On 102.1 -- 13-Sep 07:11:00 12.119 Sep 14:11:31 1 On 59.4 200 18-Sep 19:47:00 18.419 Sep 14:11:33 1 On 59.5 -- 18-Sep 19:47:00 18.419 Sep 14:24:35 1 On 38.1 280 18-Sep 19:47:00 18.619 Sep 14:24:44 1 On 37.9 -- 18-Sep 19:47:00 18.619 Sep 14:27:10 1 On 35.5 300 18-Sep 19:47:00 18.719 Sep 14:29:28 2 On 35.0 Various 18-Sep 19:47:00 18.719 Sep 14:29:50 1 On 35.2 -- 18-Sep 19:47:00 18.719 Sep 15:31:01 1 On 26.5 70 18-Sep 19:47:00 19.719 Sep 15:31:21 2 On 26.0 0,150 18-Sep 19:47:00 19.719 Sep 15:32:11 1 On 24.5 -- 18-Sep 19:47:00 19.819 Sep 15:32:11 2 On 24.5 -- 18-Sep 19:47:00 19.819 Sep 15:32:30 1 On 24.3 -- 18-Sep 19:47:00 19.819 Sep 16:07:40 1 On 29.6 -- 18-Sep 19:47:00 20.319 Sep 16:08:16 1 On 31.9 -- 18-Sep 19:47:00 20.422 Sep 18:48:40 1 Off 57.0 267 18-Sep 19:47:00 95.022 Sep 19:03:41 1 On 74.0 0 18-Sep 19:47:00 95.322 Sep 19:04:33 1 On 74.3 -- 18-Sep 19:47:00 95.325 Sep 16:45:23 1 On 81.2 271 18-Sep 19:47:00 165.026 Sep 12:11:25 1 On 49.4 -- 18-Sep 19:47:00 184.426 Sep 12:11:42 1 On 49.4 270 18-Sep 19:47:00 184.426 Sep 13:11:50 1 Off 31.3 313 18-Sep 19:47:00 185.426 Sep 15:42:46 1 Off 40.8 296 18-Sep 19:47:00 187.926 Sep 15:50:52 1 Off 40.4 179 18-Sep 19:47:00 188.126 Sep 15:52:24 1 Off 40.7 318 18-Sep 19:47:00 188.128 Sep 13:03:41 1 On 39.6 271 18-Sep 19:47:00 233.3
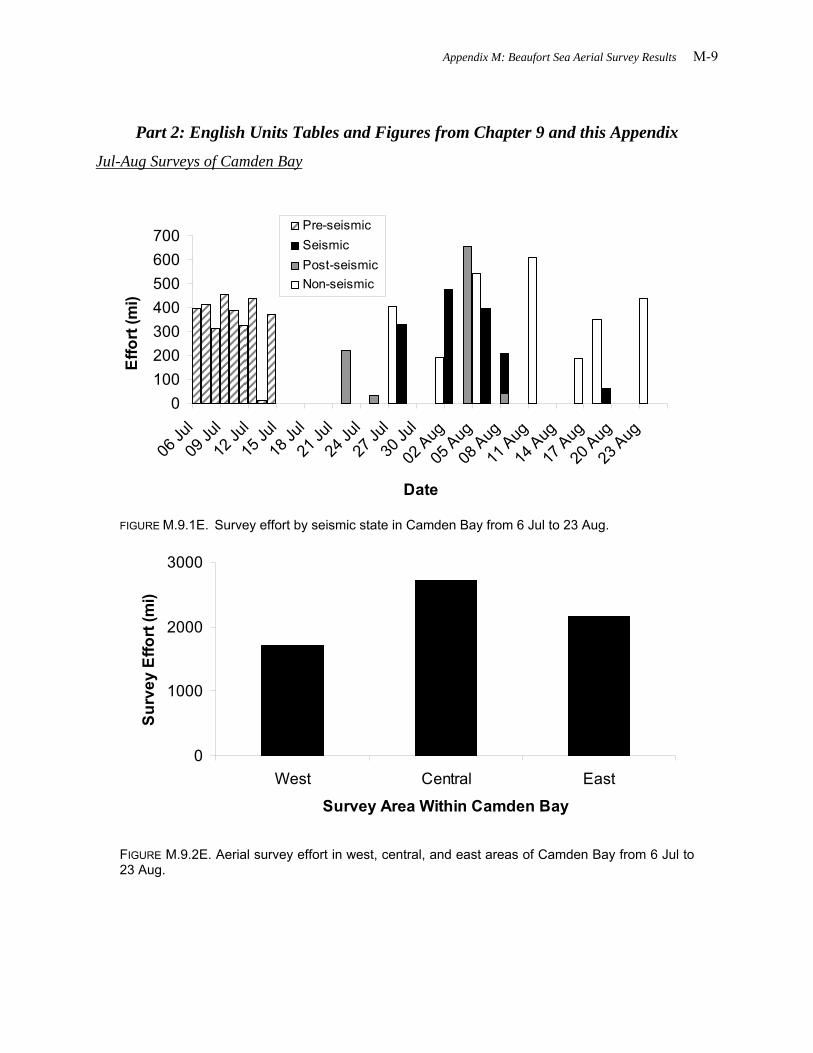
Appendix M: Beaufort Sea Aerial Survey Results M-9
Part 2: English Units Tables and Figures from Chapter 9 and this Appendix
Jul-Aug Surveys of Camden Bay
0100200300400500600700
06 Ju
l
09 Ju
l
12 Ju
l
15 Ju
l
18 Ju
l
21 Ju
l
24 Ju
l
27 Ju
l
30 Ju
l
02 Aug
05 Aug
08 Aug
11 Aug
14 Aug
17 Aug
20 Aug
23 Aug
Date
Effo
rt (m
i)
Pre-seismicSeismicPost-seismicNon-seismic
FIGURE M.9.1E. Survey effort by seismic state in Camden Bay from 6 Jul to 23 Aug.
0
1000
2000
3000
West Central East
Survey Area Within Camden Bay
Surv
ey E
ffort
(mi)
FIGURE M.9.2E. Aerial survey effort in west, central, and east areas of Camden Bay from 6 Jul to 23 Aug.

M-10 Monitoring in the Chukchi and Beaufort Seas: Shell Offshore Inc, 2008
0
250
500
750
0-3 6-912
-1619
-2225
-2831
-3437
-4043
-4750
-5356
-5962
-6568
-71
Distance from shore (mi)
Surv
ey E
ffort
(mi)
FIGURE M.9.3E. Aerial survey effort by 3-mi distance–from–shore bin in Camden Bay from 6 Jul to 23 Aug.
TABLE M.9.1E. Summary of aerial survey effort and sighting rates for bowhead and beluga whales in Camden Bay from 6 Jul through 23 Aug 2008. Numbers of sightings and individuals in parentheses were based on <310 mi of effort and should be viewed with caution. Sighting rates were not calculated (“NC”) when effort was less than 155 mi.
Sightings Individuals Sightings/1000 mi
Individuals/1000 mi Sightings Individuals Sightings/
1000 miIndividuals/
1000 mi
06 Jul 1 395 42 0 0 0.0 0.0 2 5 5.1 12.707 Jul 2 413 43 1 1 2.4 2.4 4 7 9.7 17.008 Jul 3 311 33 0 0 0.0 0.0 0 0 0.0 0.009 Jul 4 454 48 5 8 11.0 17.6 72 198 158.5 435.810 Jul 5 389 41 0 0 0.0 0.0 11 17 28.3 43.711 Jul 6 327 34 0 0 0.0 0.0 1 3 3.1 9.212 Jul 7 439 46 2 2 4.6 4.6 7 18 16.0 41.013 Jul 8 11 1 (0) (0) NC NC (0) (0) NC NC14 Jul 9 372 39 0 0 0.0 0.0 10 18 26.9 48.422 Jul 10 137 14 (0) (0) NC NC (0) (0) NC NC25 Jul 11 20 2 (0) (0) NC NC (0) (0) NC NC27 Jul 12 252 27 (0) (0) 0.0 0.0 (1) (1) 4.0 4.028 Jul 13 204 21 (0) (0) 0.0 0.0 (2) (2) 9.8 9.801 Aug 14 118 12 (0) (0) NC NC (0) (0) NC NC02 Aug 14 295 31 (0) (0) 0.0 0.0 (7) (7) 23.8 23.804 Aug 15 406 43 0 0 0.0 0.0 1 1 2.5 2.505 Aug 16 336 35 0 0 0.0 0.0 0 0 0.0 0.006 Aug 17 247 26 (0) (0) 0.0 0.0 (0) (0) 0.0 0.008 Aug 17 128 14 (0) (0) NC NC (0) (0) NC NC11 Aug 18 377 40 0 0 0.0 0.0 2 2 5.3 5.316 Aug 19 117 12 (0) (0) NC NC (0) (0) NC NC18 Aug 20 351 37 0 0 0.0 0.0 0 0 0.0 0.019 Aug 21 64 7 (1) (1) NC NC (0) (0) NC NC21 Aug 22 0 0 (0) (0) NC NC (0) (0) NC NC23 Aug 22 435 46 3 6 6.9 13.8 1 1 2.3 2.3
Total 22 6597 100 12 18 1.82 2.73 0 121 280 18.34 42.44
Bowhead Whale Beluga WhaleDate Survey
No.Effort (mi)
Percent of Survey
Area

Appendix M: Beaufort Sea Aerial Survey Results M-11
0
2
4
6
8
10
12
6 Ju
l8
Jul
10 J
ul12
Jul
14 J
ul16
Jul
18 J
ul20
Jul
22 J
ul24
Jul
26 J
ul28
Jul
30 J
ul1
Aug
3 A
ug5
Aug
7 A
ug9
Aug
11 A
ug13
Aug
15 A
ug17
Aug
19 A
ug21
Aug
23 A
ug
Date
Sigh
tings
/100
0 m
i Non-seismicSeismicPre-seismic
* * * * * * * * * * * * * * * ** * +
FIGURE M.9.4E. Bowhead whale sighting rates from aerial surveys of the central Beaufort Sea from 6 Jul through 23 Aug 2008. Days on which surveys were conducted but no sightings were recorded are indicated by an asterisk. Sighting rates for surveys with less than 250 km (311 mi) of effort were not calculated, but are indicated with a plus-sign. Seismic activities at the time of sightings are indicated by fill pattern.
Table M.9.2E. Bowhead whale sightings and sighting rates during aerial surveys in Camden Bay by seismic state from 6 Jul through 23 Aug 2008.
Pre-seismic Seismic Post-seismic Non-seismic Total
West Sightings 0 0 0 0 0Individuals 0 0 0 0 0Sightings/1000 km 0.0 0.0 0.0 0.0 0.0Individuals/1000 km 0.0 0.0 0.0 0.0 0.0
Central Sightings 3 0 0 3 6Individuals 3 0 0 6 9Sightings/1000 km 1.4 0.0 0.0 2.4 1.4Individuals/1000 km 1.4 0.0 0.0 4.7 2.1
East Sightings 5 1 0 0 6Individuals 8 1 0 0 9Sightings/1000 km 4 2 0 0 2Individuals/1000 km 6 2 0 0 3
All areas Sightings 8 1 0 3 12Individuals 11 1 0 6 18Sightings/1000 km 1.6 0.7 0.0 0.9 1.1Individuals/1000 km 2.2 0.7 0.0 1.9 1.7

M-12 Monitoring in the Chukchi and Beaufort Seas: Shell Offshore Inc, 2008
TABLE M.9.3E. Chi–square test comparing differences in number of bowhead whale sightings by seismic state during aerial surveys in Camden Bay, 6 Jul through 23 Aug, 2008.
Pre-seismic Seismic Post-seismic Non-seismic χ2 One-tailed P
Sightings (obs.) 8 1 0 3 2.416 0.491Sightings (exp.) 5.7 1.6 1.1 3.6Effort (mi) 3110.4 895.4 604.6 1986.4
TABLE M.9.4E. Chi–square test comparing bowhead sighting rates in the east, west, and central areas during aerial surveys in Camden Bay, 6 Jul through 23 Aug, 2008.
West Central East χ2 One-tailed P
Sightings (obs.) 0 6 6 22.595 0.108Sightings (exp.) 3 5 4Effort (mi) 1719.1 2717.6 2160.1
TABLE M.9.5E. Estimated numbers of bowhead whales in the aerial survey area in Camden Bay, 6 Jul through 23 Aug 2008. Estimates were obtained using DISTANCE software for each individual survey. Numbers in parentheses should be interpreted with caution due to low effort (<311 mi). Estimates include allowance for f(0) (as calculated by DISTANCE) and g(0) (value of 0.144 from Thomas et al. 2002).
Survey No. Date Effort (mi) Sightings
Density (No./1000 mi2)
Est. No. Whales
1 06 Jul 395 0 0.0 0 -- --2 07 Jul 413 1 15.9 56 11 2923 08 Jul 311 0 0.0 0 -- --4 09 Jul 454 5 115.5 406 166 9925 10 Jul 389 0 0.0 0 -- --6 11 Jul 327 0 0.0 0 -- --7 12 Jul 439 2 29.9 105 25 4508 13 Jul 11 (0) NC NC -- --9 14 Jul 372 0 0.0 0 -- --10 22 Jul 137 (0) NC NC -- --11 25 Jul 20 (0) NC NC -- --12 27 Jul 252 (0) 0.0 (0) -- --13 28 Jul 204 (0) 0.0 (0) -- --14 1, 2 Aug 413 0 0.0 0 -- --15 04 Aug 406 0 0.0 0 -- --16 05 Aug 336 0 0.0 0 -- --17 6, 8 Aug 376 0 0.0 0 -- --18 11 Aug 377 0 0.0 0 -- --19 16 Aug 117 (0) NC NC -- --20 18 Aug 351 0 0.0 0 -- --21 19 Aug 64 (1) NC NC -- --22 23 Aug 435 3 90.4 318 76 1330
95% C.I.
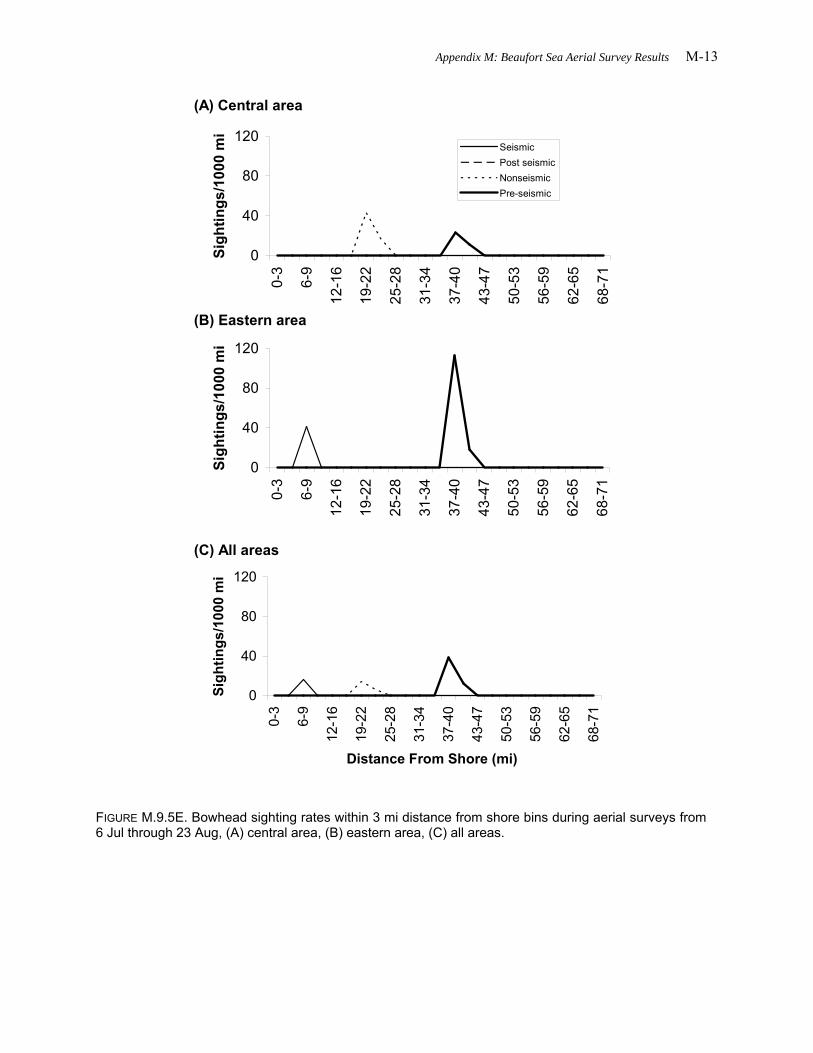
Appendix M: Beaufort Sea Aerial Survey Results M-13
(A) Central area
(B) Eastern area
(C) All areas
0
40
80
120
0-3
6-9
12-1
6
19-2
2
25-2
8
31-3
4
37-4
0
43-4
7
50-5
3
56-5
9
62-6
5
68-7
1
Sigh
tings
/100
0 m
i
SeismicPost seismicNonseismicPre-seismic
0
40
80
120
0-3
6-9
12-1
6
19-2
2
25-2
8
31-3
4
37-4
0
43-4
7
50-5
3
56-5
9
62-6
5
68-7
1
Sigh
tings
/100
0 m
i
0
40
80
120
0-3
6-9
12-1
6
19-2
2
25-2
8
31-3
4
37-4
0
43-4
7
50-5
3
56-5
9
62-6
5
68-7
1
Distance From Shore (mi)
Sigh
tings
/100
0 m
i
FIGURE M.9.5E. Bowhead sighting rates within 3 mi distance from shore bins during aerial surveys from 6 Jul through 23 Aug, (A) central area, (B) eastern area, (C) all areas.
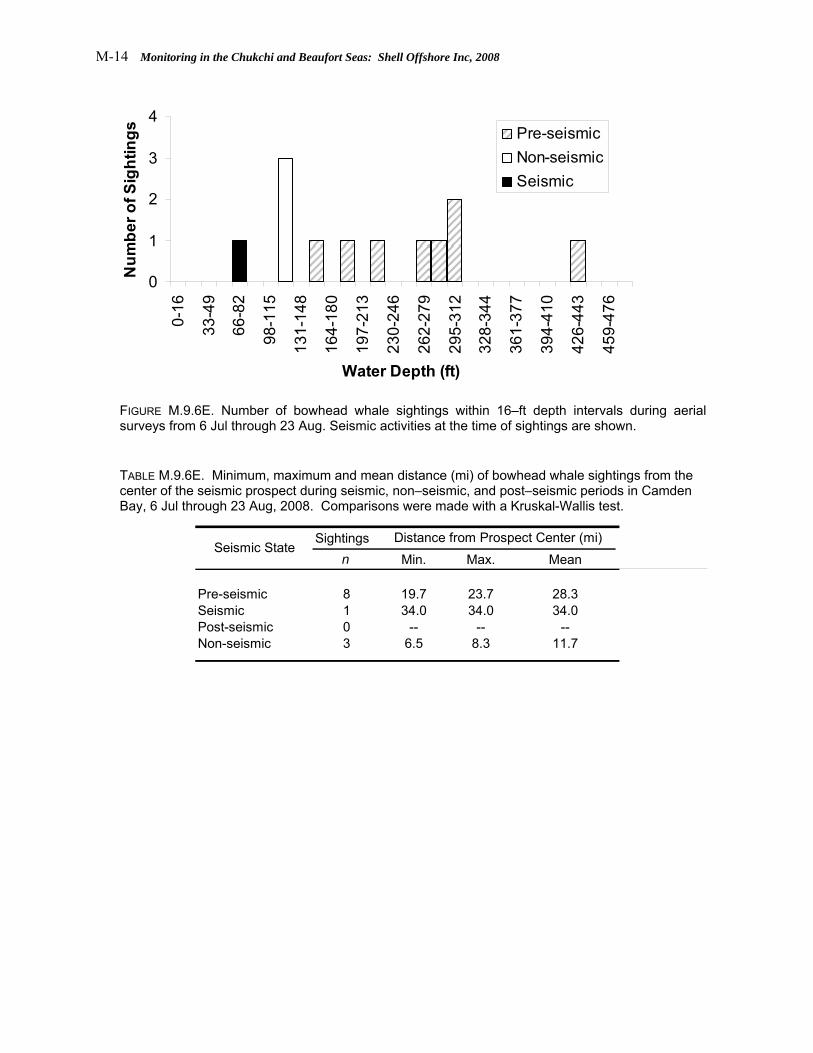
M-14 Monitoring in the Chukchi and Beaufort Seas: Shell Offshore Inc, 2008
0
1
2
3
4
0-16
33-4
9
66-8
2
98-1
15
131-
148
164-
180
197-
213
230-
246
262-
279
295-
312
328-
344
361-
377
394-
410
426-
443
459-
476
Water Depth (ft)
Num
ber o
f Sig
htin
gs Pre-seismicNon-seismicSeismic
FIGURE M.9.6E. Number of bowhead whale sightings within 16–ft depth intervals during aerial surveys from 6 Jul through 23 Aug. Seismic activities at the time of sightings are shown.
TABLE M.9.6E. Minimum, maximum and mean distance (mi) of bowhead whale sightings from the center of the seismic prospect during seismic, non–seismic, and post–seismic periods in Camden Bay, 6 Jul through 23 Aug, 2008. Comparisons were made with a Kruskal-Wallis test.
Sightingsn Min. Max. Mean
Pre-seismic 8 19.7 23.7 28.3Seismic 1 34.0 34.0 34.0Post-seismic 0 -- -- --Non-seismic 3 6.5 8.3 11.7
Seismic StateDistance from Prospect Center (mi)

Appendix M: Beaufort Sea Aerial Survey Results M-15
TABLE M.9.7E. Estimated numbers of beluga whales in the survey area in Camden Bay, 6 Jul through 23 Aug 2008. Estimates obtained using DISTANCE software for each individual survey. Numbers in parentheses should be interpreted with caution due to low effort (311 mi). Estimates include allowance for f(0) (as calculated by DISTANCE) and g(0) (value of 0.144 from Thomas et al. 2002).
Survey No. Date Effort (mi) Sightings
Density (No./1000 mi2)
Est. No. Whales
1 06 Jul 395 2 21.8 76 10 5982 07 Jul 413 4 25.0 88 24 3173 08 Jul 311 0 0.0 0 -- --4 09 Jul 454 72 469.9 1651 662 41165 10 Jul 389 11 53.2 187 38 9276 11 Jul 327 1 15.8 55 9 3487 12 Jul 439 7 30.7 108 16 7188 13 Jul 11 (0) NC NC -- --9 14 Jul 372 10 69.2 243 51 116910 22 Jul 137 (0) NC NC -- --11 25 Jul 20 (0) NC NC -- --12 27 Jul 252 (1) 6.8 (24) (5) (109)13 28 Jul 204 (2) 16.8 (59) (13) (275)14 1, 2 Aug 413 7 29.1 102 30 34415 04 Aug 406 1 4.1 15 2 10216 05 Aug 336 0 0.0 0 -- --17 6, 8 Aug 376 0 0.0 0 -- --18 11 Aug 377 2 9.1 32 6 17319 16 Aug 117 (0) NC NC -- --20 18 Aug 351 0 0.0 0 -- --21 19 Aug 64 (0) NC NC -- --22 23 Aug 435 1 0.0 0 -- --
95% C.I.
0
100
200
300
400
500
0-3
6-9
12-1
6
19-2
2
25-2
8
31-3
4
37-4
0
43-4
7
50-5
3
56-5
9
62-6
5
Distance From Shore (mi)
Sigh
tings
/100
0 m
i SightingsIndividuals
FIGURE M.9.7E. Beluga whale sighting rates by distance from shore during aerial surveys in Camden Bay from 6 Jul through 23 Aug 2008. Number of sightings/1000 mi and number of individuals/1000 mi are shown.

M-16 Monitoring in the Chukchi and Beaufort Seas: Shell Offshore Inc, 2008
Aug-Oct Surveys in Harrison Bay
0
250
500
750
25 Aug
28 Aug
31 Aug
03 Sep
06 Sep
09 Sep
12 Sep
15 Sep
18 Sep
21 Sep
24 Sep
27 Sep
30 Sep
03 O
ct
06 O
ct
09 O
ct
Date
Effo
rt (m
i)SeismicPost-seismicNon-seismic
FIGURE M.9.8E. Survey effort over time from 25 Aug to 11 Oct in Harrison Bay in the Central Beaufort Sea. Offshore seismic activities on each date are shown.
0
1000
2000
3000
4000
West Central East
Survey Area Within Harrison Bay
Surv
ey E
ffort
(mi)
FIGURE M.9.9E. Aerial survey effort in west, central, and eastern sub–areas of Harrison Bay from 25 Aug to 11 Oct.

Appendix M: Beaufort Sea Aerial Survey Results M-17
0
100
200
300
400
500
0-3 6-912
-1619
-2225
-2831
-3437
-4043
-4750
-5356
-5962
-6568
-71
Distance from shore (mi)
Surv
ey E
ffort
(mi)
FIGURE M.9.10E. Aerial survey effort by distance from shore category in Harrison Bay from 25 Aug to 11 Oct.
TABLE M.9.8E. Summary of aerial survey effort and sighting rates for bowhead and beluga whales in Harrison Bay from 25 Aug through 11 Oct 2008. Numbers in parentheses should be interpreted with caution due to low effort (311 mi). Sighting rates were not calculated (“NC”) when effort was less than 155 mi.
Sightings Individuals Sightings/1000 mi
Individuals/1000 mi Sightings Individuals Sightings/
1000 miIndividuals/
1000 mi
25 Aug 23 445 46.9 1 1 2.2 2.2 0 0 0.0 0.028 Aug 24 10 1.1 (0) (0) NC NC (0) (0) NC NC29 Aug 24 494 52.0 11 17 22.3 34.4 0 0 0.0 0.030 Aug 25 2 0.2 (0) (0) NC NC (0) (0) NC NC31 Aug 25 47 4.9 (0) (0) NC NC (0) (0) NC NC05 Sep 26 289 34.7 (2) (3) (6.9) (10.4) (0) (0) (0.0) (0.0)06 Sep 27 391 46.8 6 9 15.4 23.0 0 0 0.0 0.009 Sep 28 204 24.4 (0) (0) (0.0) (0.0) (0) (0) (0.0) (0.0)10 Sep 29 238 28.5 (0) (0) (0.0) (0.0) (0) (0) (0.0) (0.0)12 Sep 30 564 67.6 7 9 12.4 16.0 1 1 1.8 1.814 Sep 32 4 0.5 (0) (0) NC NC (0) (0) NC NC18 Sep 33 142 17.0 (1) (1) NC NC (0) (0) NC NC19 Sep 51 136 16.3 (1) (1) NC NC (0) (0) NC NC23 Sep 36 42 5.0 (1) (2) NC NC (0) (0) NC NC24 Sep 52 70 10.5 (2) (3) NC NC (1) (1) NC NC25 Sep 53 143 21.3 (2) (2) NC NC (0) (0) NC NC27 Sep 53 582 86.5 2 2 3.4 3.4 5 13 8.6 22.329 Sep 54 430 64.0 1 1 2.3 2.3 0 0 0.0 0.001 Oct 55 116 17.3 (0) (0) NC NC (0) (0) NC NC02 Oct 56 287 42.6 (1) (1) 3.5 3.5 (0) (0) (0.0) (0.0)06 Oct 57 262 38.9 (0) (0) (0.0) (0.0) (0) (0) (0.0) (0.0)08 Oct 58 90 13.3 (0) (0) NC NC (0) (0) NC NC09 Oct 58 242 35.9 (2) (3) 8.3 12.4 (0) (0) (0.0) (0.0)10 Oct 59 202 30.0 (0) (0) (0.0) (0.0) (0) (0) (0.0) (0.0)11 Oct 60 201 29.8 (0) (0) (0.0) (0.0) (0) (0) (0.0) (0.0)
Total 21 5632 100 40 55 7.10 9.77 7 15 1.24 2.66
Bowhead Whale Beluga Whale
Date Survey No.
Effort (mi)
Percent of Survey
Area

M-18 Monitoring in the Chukchi and Beaufort Seas: Shell Offshore Inc, 2008
05
10152025303540
25 A
ug27
Aug
29 A
ug31
Aug
2 S
ep4
Sep
6 S
ep8
Sep
10 S
ep12
Sep
14 S
ep16
Sep
18 S
ep20
Sep
22 S
ep24
Sep
26 S
ep28
Sep
30 S
ep2
Oct
4 O
ct6
Oct
8 O
ct10
Oct
Date
Sigh
tings
/100
0 m
i
Non-seismicPost-seismicSeismic
* * * * * * * * * * ** + + + + +
FIGURE M.9.11E. Bowhead whale sighting rates from aerial surveys in Harrison Bay from 25 Aug through 11 Oct 2008. Offshore seismic activities at the time of sightings are shown. Days on which effort was conducted but no sightings were recorded are indicated by an asterisk.
TABLE M.9.9E. Bowhead whale sightings and sighting rates during aerial surveys in Harrison Bay by seismic state from 25 Aug through 11 Oct 2008.
Seismic Post-seismic Non-seismic Total
West Sightings 5 1 1 7Individuals 8 2 1 11Sightings/1000 mi 7.1 3.6 1.8 4.6Individuals/1000 mi 11.3 7.2 1.8 7.2
Central Sightings 3 3 19 25Individuals 4 3 26 33Sightings/1000 mi 3.2 5.8 10.3 7.6Individuals/1000 mi 4.3 5.8 14.0 10.0
East Sightings 3 3 2 8Individuals 4 4 3 11Sightings/1000 mi 13.5 12.7 5.9 10.0Individuals/1000 mi 18.1 17.0 8.8 13.8
All areas Sightings 11 7 22 40Individuals 16 9 30 55Sightings/1000 mi 5.9 6.8 8.0 7.1Individuals/1000 mi 8.6 8.7 10.9 9.8

Appendix M: Beaufort Sea Aerial Survey Results M-19
TABLE M.9.10E. Chi–square test comparing differences in number of bowhead whale sightings by seismic state during aerial surveys in Harrison Bay, 25 Aug through 11 Oct 2008.
Seismic Post-seismic Non-seismic χ2 One-tailed P
Sightings (obs.) 11 7 22 0.681 0.711Sightings (exp.) 4 4 5Effort (mi) 1851 1032 2748
TABLE M.9.11E. Chi–square comparison of bowhead whale sighting rates by area within Harrison Bay during aerial surveys, 25 Aug through 11 Oct 2008.
West Central East χ2 One-tailed P
Sightings (obs.) 7 25 8 2.460 0.292Sightings (exp.) 11 23 6Effort (mi) 1536 3297 799
TABLE M.9.12E. Estimated numbers of bowhead whales in the aerial survey area in Harrison Bay, 25 Aug through 11 Oct 2008. Estimates obtained using DISTANCE software for each individual survey. Numbers in parentheses should be interpreted with caution due to low effort (311 mi). Estimates include allowance for f(0) (as calculated by DISTANCE) and g(0) (value of 0.144 from Thomas et al. 2002).
Survey No. Date Effort
(mi) SightingsDensity
(No./1000 mi2)Est. No. Whales
23 25 Aug 445 1 16.5 187 28 123424 28, 29 Aug 504 11 204.1 2319 470 1145025 30, 31 Aug 48 (0) NC NC NC NC26 5 Sep 289 (2) (76.2) (866) (118) (6337)27 6 Sep 391 6 131.7 1496 461 486028 9 Sep 204 (0) (0.0) -- -- --29 10 Sep 238 (0) (0.0) -- -- --30 12 Sep 564 7 39.1 444 151 130432 14 Sep 4 (0) NC NC NC NC33 18 Sep 142 (1) NC NC NC NC51 19 Sep 136 (1) NC NC NC NC36 23 Sep 42 (1) NC NC NC NC52 24 Sep 70 (2) NC NC NC NC53 25, 27 Sep 725 4 30.4 346 120 99554 29 Sep 430 1 17.1 194 29 131755 1 Oct 116 (0) NC NC NC NC56 2 Oct 287 (1) (26) (291) (49) (1715)57 6 Oct 262 (0) (0.0) -- -- --58 08, 09 Oct 332 2 66.5 756 80 716659 10 Oct 202 (0) (0.0) -- -- --60 11 Oct 201 (0) (0.0) -- -- --
95% C.I.
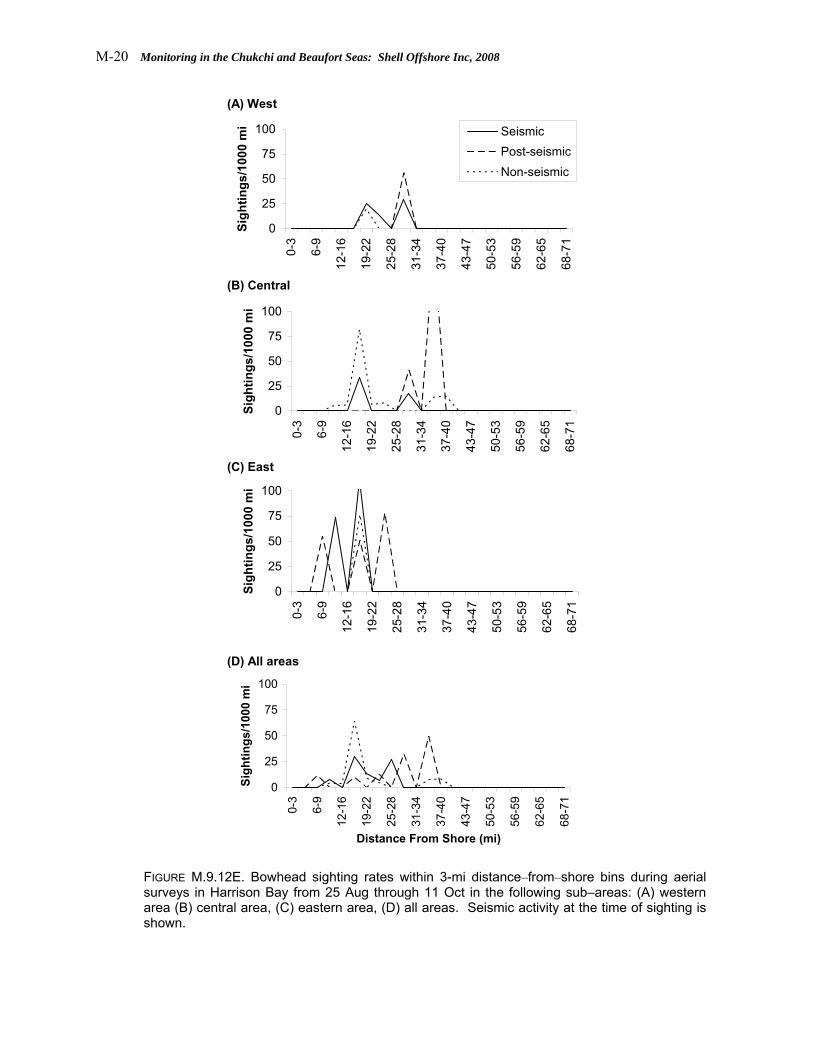
M-20 Monitoring in the Chukchi and Beaufort Seas: Shell Offshore Inc, 2008
(A) West
(B) Central
(C) East
(D) All areas
0
25
50
75
100
0-3
6-9
12-1
6
19-2
2
25-2
8
31-3
4
37-4
0
43-4
7
50-5
3
56-5
9
62-6
5
68-7
1
Sigh
tings
/100
0 m
i SeismicPost-seismicNon-seismic
0
25
50
75
1000-
3
6-9
12-1
6
19-2
2
25-2
8
31-3
4
37-4
0
43-4
7
50-5
3
56-5
9
62-6
5
68-7
1
Sigh
tings
/100
0 m
i
0
25
50
75
100
0-3
6-9
12-1
6
19-2
2
25-2
8
31-3
4
37-4
0
43-4
7
50-5
3
56-5
9
62-6
5
68-7
1
Sigh
tings
/100
0 m
i
0
25
50
75
100
0-3
6-9
12-1
6
19-2
2
25-2
8
31-3
4
37-4
0
43-4
7
50-5
3
56-5
9
62-6
5
68-7
1
Distance From Shore (mi)
Sigh
tings
/100
0 m
i
FIGURE M.9.12E. Bowhead sighting rates within 3-mi distance–from–shore bins during aerial surveys in Harrison Bay from 25 Aug through 11 Oct in the following sub–areas: (A) western area (B) central area, (C) eastern area, (D) all areas. Seismic activity at the time of sighting is shown.

Appendix M: Beaufort Sea Aerial Survey Results M-21
0
5
10
15
20
25
0-16 16-33 33-49 49-66 66-82 82-98 98-115 115-131
131-148
148-164
164-180
Depth (ft)
Num
ber o
f Sig
htin
gs
Non-seismicPost-seismicSeismic
FIGURE M.9.13E. Bowhead sighting rates at 16–ft depth intervals in Harrison Bay from 25 Aug through 11 Oct. Sightings during offshore non–seismic and offshore seismic periods are shown.
TABLE M.9.13E. Mean distance (mi) of bowhead whale sightings from the center of the seismic prospect by seismic state in Harrison Bay, 25 Aug through 11 Oct, 2008. Comparisons were made with a Kruskal-Wallis test.
Sightings Distance from Prospect Center (mi)n Min. Max. Mean
Seismic 11 17.9 62.3 37.3 <0.01Post-seismic 7 22.7 65.1 35.4Non-seismic 22 8.1 52.0 19.7
Two-tailed PSeismic State

M-22 Monitoring in the Chukchi and Beaufort Seas: Shell Offshore Inc, 2008
0
300
600
900
0-3
6-9
12-1
6
19-2
2
25-2
8
31-3
4
37-4
0
43-4
7
50-5
3
56-5
9
62-6
5
Distance From Shore (mi)
Sigh
tings
/100
0 m
i SightingsIndividuals
FIGURE M.9.14E. Beluga whale sighting rates and numbers of individuals by distance from shore during aerial surveys in Harrison Bay from 25 Aug through 11 Oct 2008. Number of sightings/1000 mi and number of individuals/1000 mi are shown.
Sep Surveys in Camden Bay
0
250
500
750
1000
13 Sep
14 Sep
15 Sep
16 Sep
17 Sep
18 Sep
19 Sep
20 Sep
21 Sep
22 Sep
23 Sep
24 Sep
25 Sep
26 Sep
27 Sep
28 Sep
Date
Effo
rt (m
i)
SeismicNon-seismic
FIGURE M.9.15E. Daily survey effort by seismic state in Camden Bay from 13 Sep to 28 Sep. No effort was collected during the post-seismic period.
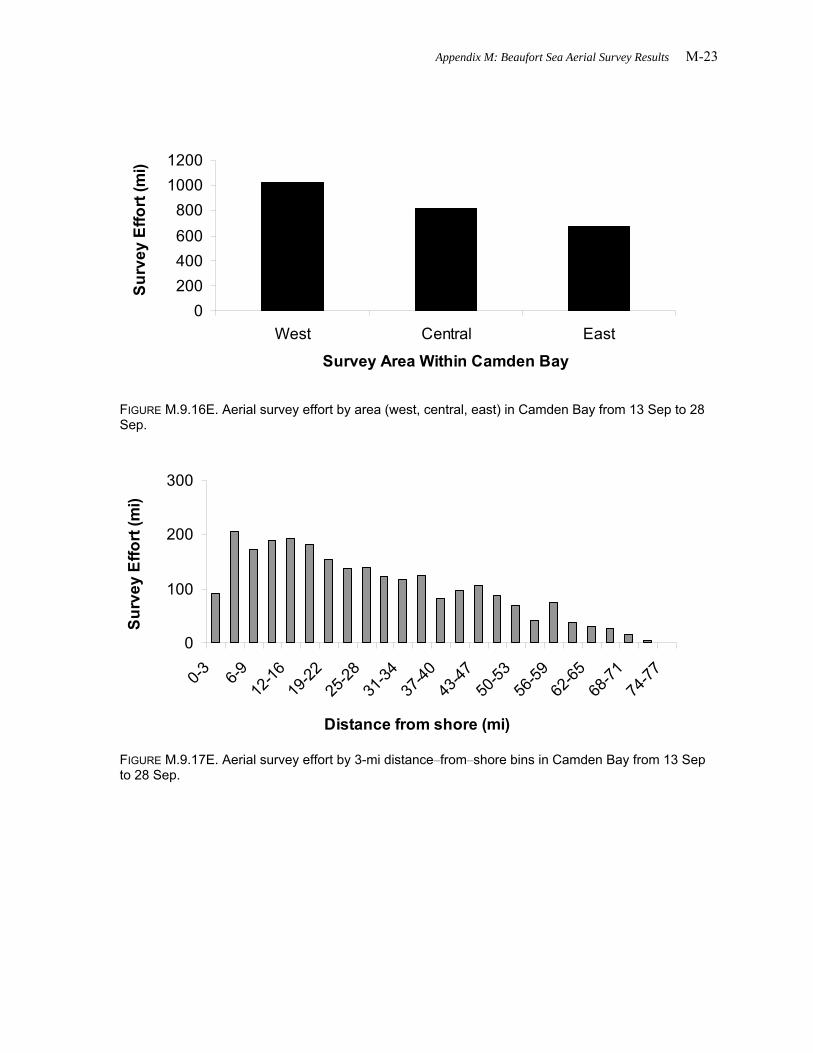
Appendix M: Beaufort Sea Aerial Survey Results M-23
0200400600800
10001200
West Central East
Survey Area Within Camden Bay
Surv
ey E
ffort
(mi)
FIGURE M.9.16E. Aerial survey effort by area (west, central, east) in Camden Bay from 13 Sep to 28 Sep.
0
100
200
300
0-3 6-912
-1619
-2225
-2831
-3437
-4043
-4750
-5356
-5962
-6568
-7174
-77
Distance from shore (mi)
Surv
ey E
ffort
(mi)
FIGURE M.9.17E. Aerial survey effort by 3-mi distance–from–shore bins in Camden Bay from 13 Sep to 28 Sep.

M-24 Monitoring in the Chukchi and Beaufort Seas: Shell Offshore Inc, 2008
TABLE M.9.14E. Summary of aerial survey effort and bowhead whale sighting rates in Camden Bay from 13 Sep to 28 Sep 2008. Values in parentheses are based on less than 500 km (311 mi) of effort and should be viewed with caution. Sighting rates were not calculated (“NC”) when effort was less than 250 km (155 mi).
13 Sep 31 457.8 63 12 17 26.2 37.114 Sep 32 24.1 3 (0) (0) NC NC18 Sep 33 179.0 25 (6) (10) (33.5) (55.9)19 Sep 34 539.2 74 16 24 29.7 44.522 Sep 35 181.5 25 (2) (2) (11.0) (11.0)23 Sep 36 77.8 11 (0) (0) NC NC25 Sep 37 279.1 34 (1) (1) (3.6) (3.6)26 Sep 38 416.7 51 2 2 4.8 4.828 Sep 39 361.7 44 1 2 2.8 5.5
Total 9 2517 100 40 58 15.89 23.04
Date Survey No.
Effort (mi)
Percent of Survey Area Sightings Individuals Sightings/
1000 miIndividuals/
1000 mi
0
10
20
30
40
50
60
13 S
ep
14 S
ep
15 S
ep
16 S
ep
17 S
ep
18 S
ep
19 S
ep
20 S
ep
21 S
ep
22 S
ep
23 S
ep
24 S
ep
25 S
ep
26 S
ep
27 S
ep
28 S
ep
Date
Sigh
tings
/100
0 m
i
Non-seismicSeismic
* *
FIGURE M.9.18E. Daily bowhead whale sightings by seismic state in Camden Bay from 13 Sep to 28 Sep. Days on which effort was conducted but no sightings were recorded are indicated by an asterisk.
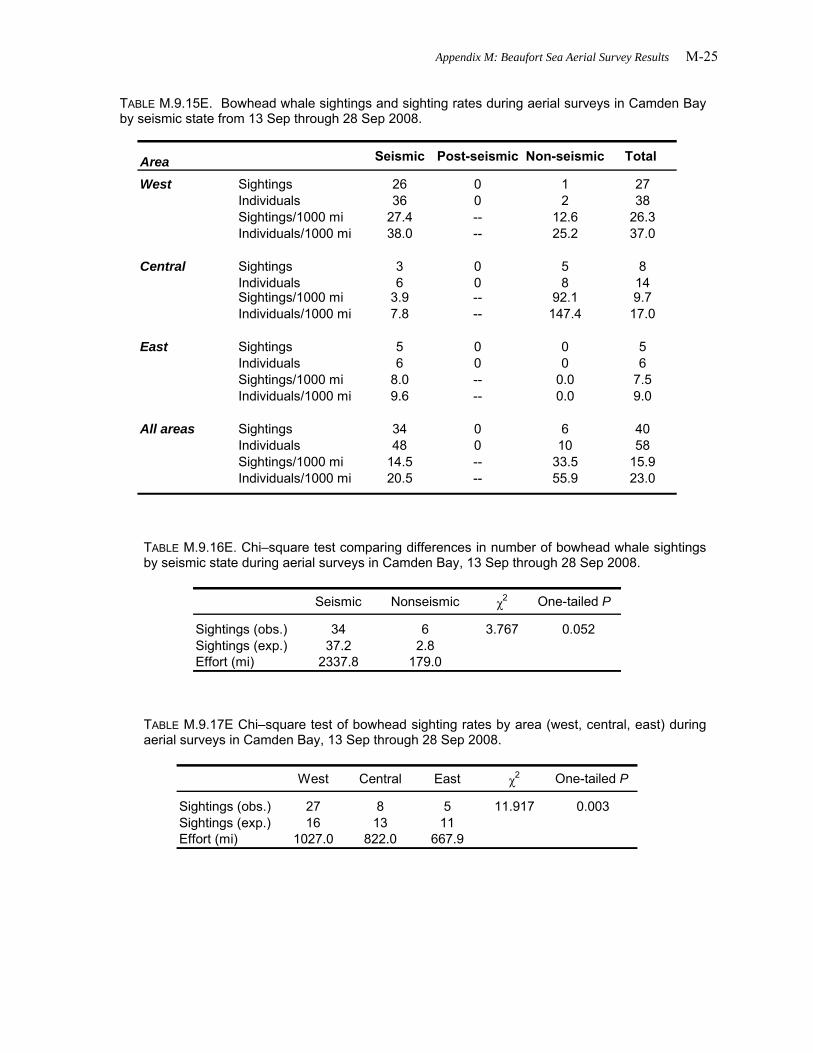
Appendix M: Beaufort Sea Aerial Survey Results M-25
TABLE M.9.15E. Bowhead whale sightings and sighting rates during aerial surveys in Camden Bay by seismic state from 13 Sep through 28 Sep 2008.
Area Seismic Post-seismic Non-seismic Total
West Sightings 26 0 1 27Individuals 36 0 2 38Sightings/1000 mi 27.4 -- 12.6 26.3Individuals/1000 mi 38.0 -- 25.2 37.0
Central Sightings 3 0 5 8Individuals 6 0 8 14Sightings/1000 mi 3.9 -- 92.1 9.7Individuals/1000 mi 7.8 -- 147.4 17.0
East Sightings 5 0 0 5Individuals 6 0 0 6Sightings/1000 mi 8.0 -- 0.0 7.5Individuals/1000 mi 9.6 -- 0.0 9.0
All areas Sightings 34 0 6 40Individuals 48 0 10 58Sightings/1000 mi 14.5 -- 33.5 15.9Individuals/1000 mi 20.5 -- 55.9 23.0
TABLE M.9.16E. Chi–square test comparing differences in number of bowhead whale sightings by seismic state during aerial surveys in Camden Bay, 13 Sep through 28 Sep 2008.
Seismic Nonseismic χ2 One-tailed P
Sightings (obs.) 34 6 3.767 0.052Sightings (exp.) 37.2 2.8Effort (mi) 2337.8 179.0
TABLE M.9.17E Chi–square test of bowhead sighting rates by area (west, central, east) during aerial surveys in Camden Bay, 13 Sep through 28 Sep 2008.
West Central East χ2 One-tailed P
Sightings (obs.) 27 8 5 11.917 0.003Sightings (exp.) 16 13 11Effort (mi) 1027.0 822.0 667.9

M-26 Monitoring in the Chukchi and Beaufort Seas: Shell Offshore Inc, 2008
TABLE M.9.18E. Estimated numbers of bowhead whales in the Camden Bay survey area, 13 Sep through 28 Sep 2008. Estimates obtained using DISTANCE software for each individual survey. Numbers in parentheses are based on less than 311 mi of effort and should be interpreted cautiously. Estimates include allowance for f(0) (as calculated by DISTANCE) and g(0) (value of 0.144 from Thomas et al. 2002).
Survey No. Date Effort
(mi) SightingsDensity
(No./1000 mi2)Est. No. Whales
31 13 Sep 457.8 12 200.6 2229 856 580532 14 Sep 24.1 (0) (0.0) (0) -- --33 18 Sep 179.0 (6) (225.9) (2510) (546) (11532)34 19 Sep 539.2 16 177.1 1968 544 711635 22 Sep 181.5 (2) (36.1) (402) (52) (3094)36 23 Sep 77.8 (0) NC NC -- --37 25 Sep 279.1 (1) (23.5) (261) (28) (2427)38 26 Sep 416.7 2 31.5 350 57 213839 28 Sep 361.7 1 0.0 0 -- --
95% C.I.

Appendix M: Beaufort Sea Aerial Survey Results M-27
(A) Western area
(B) Central area
(C) Eastern area
(D) All areas
0
100
200
300
0-3
6-9
12-1
6
19-2
2
25-2
8
31-3
4
37-4
0
43-4
7
50-5
3
56-5
9
62-6
5
68-7
1
Sigh
tings
/100
0 m
i
SeismicNon-seismic
0
100
200
3000-
3
6-9
12-1
6
19-2
2
25-2
8
31-3
4
37-4
0
43-4
7
50-5
3
56-5
9
62-6
5
68-7
1
Sigh
tings
/100
0 m
i
0
100
200
300
0-3
6-9
12-1
6
19-2
2
25-2
8
31-3
4
37-4
0
43-4
7
50-5
3
56-5
9
62-6
5
68-7
1
Sigh
tings
/100
0 m
i
0
100
200
300
0-3
6-9
12-1
6
19-2
2
25-2
8
31-3
4
37-4
0
43-4
7
50-5
3
56-5
9
62-6
5
68-7
1
Distance From Shore (mi)
Sigh
tings
/100
0 m
i
FIGURE M.9.19E. Bowhead sighting rates within 3-mi distance–from–shore bins during aerial surveys in Camden Bay from 13 Sep through 28 Sep, (A) west area, (B) central area, (C) east area, (D) all areas.

M-28 Monitoring in the Chukchi and Beaufort Seas: Shell Offshore Inc, 2008
01
234
567
89
0-16 16-33 33-49 49-66 66-82 82-98 98-115 115-131 131-148 148-164 164-180
Depth (ft)
Num
ber o
f Sig
htin
gs
Non-seismicPost-seismicSeismic
FIGURE M.9.20E. Number of bowhead sightings during aerial surveys of the central Beaufort Sea by depth (ft) and seismic state. Data were collected from 13 Sep through 28 Sep 2008.
TABLE M.9.19E. Mean distance (mi) of bowhead whale sightings from the center of the seismic prospect by seismic state in Camden Bay, 13 Sep through 28 Sep, 2008. Comparisons were made with a Kruskal-Wallis test.
Sightingsn Min. Max. Mean
Seismic 34 15.1 29.2 63.4 <0.01Non-seismic 6 11.7 17.5 42.2
Two-tailed PDistance from Prospect Center (mi)
Seismic State
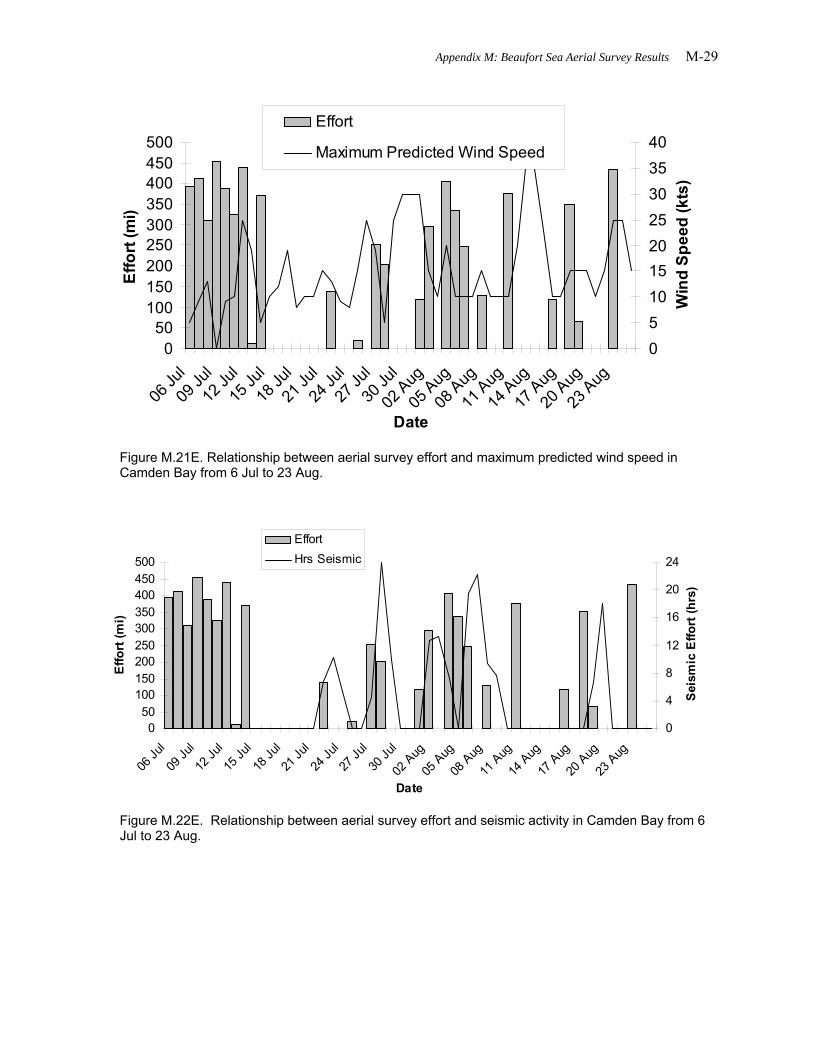
Appendix M: Beaufort Sea Aerial Survey Results M-29
050
100150200250300350400450500
06 Ju
l
09 Ju
l
12 Ju
l
15 Ju
l
18 Ju
l
21 Ju
l
24 Ju
l
27 Ju
l
30 Ju
l
02 Aug
05 Aug
08 Aug
11 Aug
14 Aug
17 Aug
20 Aug
23 Aug
Date
Effo
rt (m
i)
0510152025303540
Win
d Sp
eed
(kts
)
Effort
Maximum Predicted Wind Speed
Figure M.21E. Relationship between aerial survey effort and maximum predicted wind speed in Camden Bay from 6 Jul to 23 Aug.
050
100150200250300350400450500
06 Ju
l
09 Ju
l
12 Ju
l
15 Ju
l
18 Ju
l
21 Ju
l
24 Ju
l
27 Ju
l
30 Ju
l
02 Aug
05 Aug
08 Aug
11 Aug
14 Aug
17 Aug
20 Aug
23 Aug
Date
Effo
rt (m
i)
0
4
8
12
16
20
24
Seis
mic
Effo
rt (h
rs)
EffortHrs Seismic
Figure M.22E. Relationship between aerial survey effort and seismic activity in Camden Bay from 6 Jul to 23 Aug.

M-30 Monitoring in the Chukchi and Beaufort Seas: Shell Offshore Inc, 2008
TABLE M.20E. Sighting rates (sightings/1000 mi) of bowhead whales in 3-mi distance from shore bins by survey area and seismic state in Camden Bay from 6 Jul to 23 Aug. Dashes represent bins in which no effort was collected. Numbers in bold indicate maximum values.
Distance bin Pre Seismic Post Non Pre Seismic Post Non Pre Seismic Post Non Pre Seismic Post Non0-3 0.0 0.0 0.0 0.0 0.0 0.0 0.0 0.0 0.0 0.0 0.0 0.0 0.0 0.0 0.0 0.03-6 0.0 0.0 0.0 0.0 0.0 0.0 0.0 0.0 0.0 0.0 0.0 0.0 0.0 0.0 0.0 0.06-9 0.0 0.0 0.0 0.0 0.0 0.0 0.0 0.0 0.0 41.5 0.0 0.0 0.0 16.4 0.0 0.0
9-12 0.0 0.0 0.0 0.0 0.0 0.0 0.0 0.0 0.0 0.0 0.0 0.0 0.0 0.0 0.0 0.012-16 0.0 0.0 0.0 0.0 0.0 0.0 0.0 0.0 0.0 0.0 0.0 0.0 0.0 0.0 0.0 0.016-19 0.0 0.0 0.0 0.0 0.0 0.0 0.0 0.0 0.0 0.0 0.0 0.0 0.0 0.0 0.0 0.019-22 0.0 0.0 0.0 0.0 0.0 0.0 0.0 43.2 0.0 0.0 0.0 0.0 0.0 0.0 0.0 14.422-25 0.0 0.0 0.0 0.0 0.0 0.0 0.0 16.5 0.0 0.0 0.0 0.0 0.0 0.0 0.0 6.125-28 0.0 0.0 0.0 0.0 0.0 0.0 0.0 0.0 0.0 0.0 0.0 0.0 0.0 0.0 0.0 0.028-31 0.0 0.0 0.0 0.0 0.0 0.0 0.0 0.0 0.0 0.0 0.0 0.0 0.0 0.0 0.0 0.031-34 0.0 0.0 0.0 0.0 0.0 0.0 0.0 0.0 0.0 0.0 0.0 0.0 0.0 0.0 0.0 0.034-37 0.0 0.0 -- 0.0 0.0 0.0 0.0 0.0 0.0 0.0 0.0 0.0 0.0 0.0 0.0 0.037-40 0.0 0.0 0.0 0.0 23.5 0.0 0.0 0.0 112.7 0.0 0.0 0.0 38.6 0.0 0.0 0.040-43 0.0 -- -- 0.0 11.2 0.0 -- 0.0 17.6 0.0 0.0 0.0 12.8 0.0 0.0 0.043-47 0.0 -- -- -- 0.0 0.0 0.0 0.0 0.0 0.0 0.0 0.0 0.0 0.0 0.0 0.047-50 -- -- -- -- 0.0 0.0 -- 0.0 0.0 0.0 0.0 0.0 0.0 0.0 0.0 0.050-53 -- -- -- -- -- -- -- -- 0.0 0.0 0.0 0.0 0.0 0.0 0.0 0.053-56 -- -- -- -- -- -- -- -- 0.0 -- -- -- 0.0 -- -- --
Average 0.0 0.0 0.0 0.0 2.2 0.0 0.0 3.7 7.2 2.4 0.0 0.0 2.9 1.0 0.0 1.2
West Central East All
TABLE M.21E. All bowhead sightings observed during seismic activities in Camden Bay from 6 Jul through 23 Aug.
Date Time Number On/Off Transect
Distance (mi) from center of seismic patch
Heading Start of seismic
Time (hrs) elapsed
since start of seismic
19 Aug 18:45:46 1 On 34.0 150 19-Aug 17:20:37 1.4

Appendix M: Beaufort Sea Aerial Survey Results M-31
0100200300400500600700
25 Aug
28 Aug
31 Aug
03 Sep
06 Sep
09 Sep
12 Sep
15 Sep
18 Sep
21 Sep
24 Sep
27 Sep
30 Sep
03 O
ct
06 O
ct
09 O
ct
Date
Effo
rt (m
i)
051015202530354045
Win
d Sp
eed
(kts
)
EffortMaximum Predicted Wind Speed
FIGURE M.23E. Relationship between aerial survey effort and maximum predicted wind speed in Harrison Bay from 25 Aug to 11 Oct.
0
100
200
300
400
500
600
700
25 Aug
28 Aug
31 Aug
03 Sep
06 Sep
09 Sep
12 Sep
15 Sep
18 Sep
21 Sep
24 Sep
27 Sep
30 Sep
03 O
ct
06 O
ct
09 O
ct
Date
Effo
rt (m
i)
0
4
8
12
16
20
24
Sei
smic
Effo
rt (h
rs)
EffortHrs Offshore seismic
Figure M.24E. Relationship between aerial survey effort and seismic activity in Harrison Bay from 25 Aug to 11 Oct.

M-32 Monitoring in the Chukchi and Beaufort Seas: Shell Offshore Inc, 2008
TABLE M.22E. Sighting rates (sightings/1000 mi) of bowhead whales in 3-mi distance from shore bins by survey area and seismic state in Harrison Bay from 25 Aug to 11 Oct. Dashes represent bins in which no effort was collected. Numbers in bold indicate maximum values.
Distance bin Seismic Post Non Seismic Post Non Seismic Post Non Seismic Post Non0-3 -- -- -- 0.0 0.0 0.0 0.0 0.0 0.0 0.0 0.0 0.03-6 0.0 0.0 0.0 0.0 0.0 0.0 0.0 0.0 0.0 0.0 0.0 0.06-9 0.0 0.0 0.0 0.0 0.0 0.0 0.0 55.1 0.0 0.0 11.7 0.09-12 0.0 0.0 0.0 0.0 0.0 5.4 73.2 0.0 0.0 7.7 0.0 4.2
12-16 0.0 0.0 0.0 0.0 0.0 5.9 0.0 0.0 0.0 0.0 0.0 3.816-19 0.0 0.0 0.0 33.9 0.0 82.0 110.9 50.9 76.4 29.9 9.9 64.219-22 25.4 0.0 19.7 0.0 0.0 6.3 0.0 0.0 0.0 13.6 0.0 8.722-25 13.8 0.0 0.0 0.0 0.0 8.1 0.0 78.0 0.0 6.6 12.9 4.625-28 0.0 0.0 0.0 0.0 0.0 0.0 0.0 0.0 0.0 26.8 0.0 0.028-31 28.8 56.2 0.0 17.3 41.3 0.0 0.0 0.0 0.0 0.0 32.3 0.031-34 0.0 0.0 0.0 0.0 0.0 0.0 0.0 0.0 0.0 0.0 0.0 0.034-37 0.0 0.0 0.0 0.0 162.6 13.8 0.0 0.0 0.0 0.0 49.7 7.537-40 0.0 0.0 0.0 0.0 0.0 14.8 0.0 0.0 0.0 0.0 0.0 8.340-43 0.0 0.0 0.0 0.0 0.0 0.0 0.0 0.0 0.0 0.0 0.0 0.043-47 0.0 0.0 0.0 0.0 0.0 0.0 0.0 0.0 0.0 0.0 0.0 0.047-50 0.0 0.0 -- 0.0 0.0 0.0 0.0 -- 0.0 0.0 0.0 0.050-53 0.0 -- 0.0 0.0 0.0 0.0 0.0 0.0 0.0 0.0 0.0 0.053-56 -- -- -- 0.0 0.0 0.0 0.0 0.0 -- 0.0 0.0 0.056-59 -- -- -- 0.0 0.0 0.0 0.0 -- 0.0 0.0 0.0 0.059-62 -- -- -- 0.0 0.0 0.0 -- -- 0.0 0.0 0.0 0.062-65 -- -- -- -- 0.0 0.0 -- -- -- -- 0.0 0.065-68 -- -- -- 0.0 0.0 -- -- -- -- 0.0 0.0 --68-71 -- -- -- 0.0 -- 0.0 -- -- -- 0.0 -- 0.0
Average 4.2 3.7 1.3 2.3 9.3 6.2 9.7 10.8 4.0 3.8 5.3 4.6
West Central East All
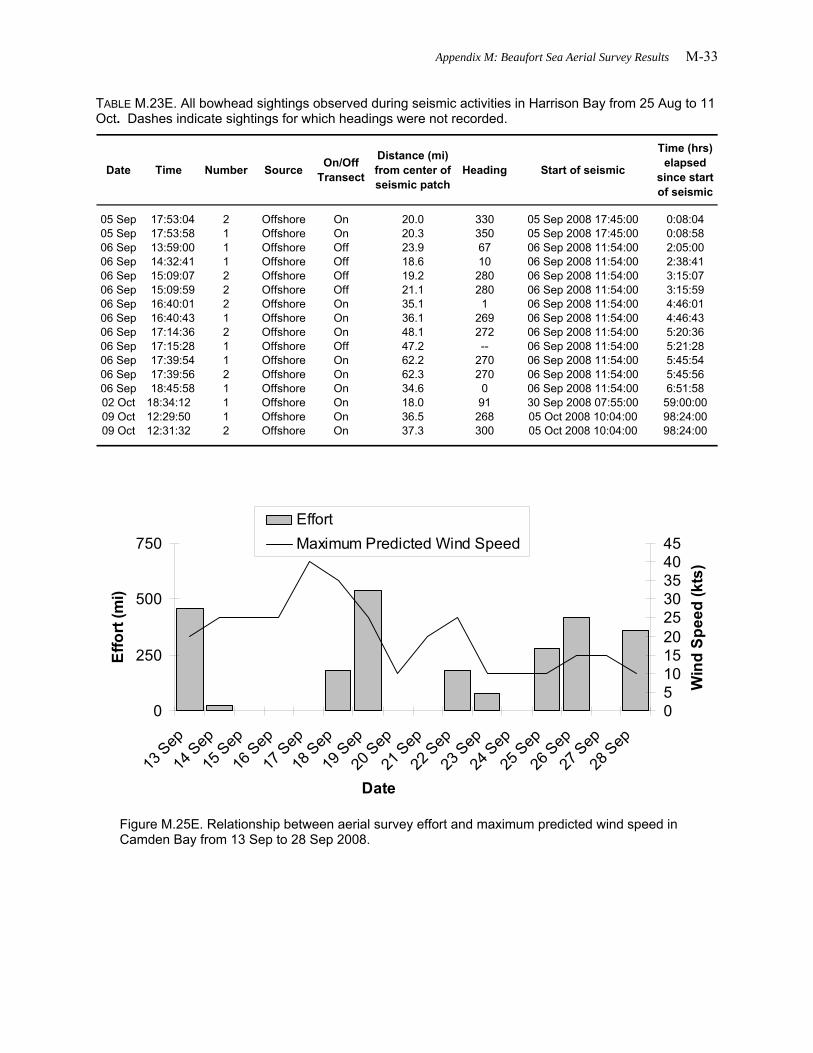
Appendix M: Beaufort Sea Aerial Survey Results M-33
TABLE M.23E. All bowhead sightings observed during seismic activities in Harrison Bay from 25 Aug to 11 Oct. Dashes indicate sightings for which headings were not recorded.
Date Time Number Source On/Off Transect
Distance (mi) from center of seismic patch
Heading Start of seismic
Time (hrs) elapsed
since start of seismic
05 Sep 17:53:04 2 Offshore On 20.0 330 05 Sep 2008 17:45:00 0:08:0405 Sep 17:53:58 1 Offshore On 20.3 350 05 Sep 2008 17:45:00 0:08:5806 Sep 13:59:00 1 Offshore Off 23.9 67 06 Sep 2008 11:54:00 2:05:0006 Sep 14:32:41 1 Offshore Off 18.6 10 06 Sep 2008 11:54:00 2:38:4106 Sep 15:09:07 2 Offshore Off 19.2 280 06 Sep 2008 11:54:00 3:15:0706 Sep 15:09:59 2 Offshore Off 21.1 280 06 Sep 2008 11:54:00 3:15:5906 Sep 16:40:01 2 Offshore On 35.1 1 06 Sep 2008 11:54:00 4:46:0106 Sep 16:40:43 1 Offshore On 36.1 269 06 Sep 2008 11:54:00 4:46:4306 Sep 17:14:36 2 Offshore On 48.1 272 06 Sep 2008 11:54:00 5:20:3606 Sep 17:15:28 1 Offshore Off 47.2 -- 06 Sep 2008 11:54:00 5:21:2806 Sep 17:39:54 1 Offshore On 62.2 270 06 Sep 2008 11:54:00 5:45:5406 Sep 17:39:56 2 Offshore On 62.3 270 06 Sep 2008 11:54:00 5:45:5606 Sep 18:45:58 1 Offshore On 34.6 0 06 Sep 2008 11:54:00 6:51:5802 Oct 18:34:12 1 Offshore On 18.0 91 30 Sep 2008 07:55:00 59:00:0009 Oct 12:29:50 1 Offshore On 36.5 268 05 Oct 2008 10:04:00 98:24:0009 Oct 12:31:32 2 Offshore On 37.3 300 05 Oct 2008 10:04:00 98:24:00
0
250
500
750
13 Sep
14 Sep
15 Sep
16 Sep
17 Sep
18 Sep
19 Sep
20 Sep
21 Sep
22 Sep
23 Sep
24 Sep
25 Sep
26 Sep
27 Sep
28 Sep
Date
Effo
rt (m
i)
051015202530354045
Win
d Sp
eed
(kts
)
EffortMaximum Predicted Wind Speed
Figure M.25E. Relationship between aerial survey effort and maximum predicted wind speed in Camden Bay from 13 Sep to 28 Sep 2008.

M-34 Monitoring in the Chukchi and Beaufort Seas: Shell Offshore Inc, 2008
0
100
200
300
400
500
600
13 Sep
14 Sep
15 Sep
16 Sep
17 Sep
18 Sep
19 Sep
20 Sep
21 Sep
22 Sep
23 Sep
24 Sep
25 Sep
26 Sep
27 Sep
28 Sep
Date
Effo
rt (m
i)
0
4
8
12
16
20
24
Sei
smic
Effo
rt (h
rs)
EffortHrs Seismic
Figure M.26E. Relationship between aerial survey effort and hours of seismic data acquisition in Camden Bay from 13 Sep to 28 Sep 2008.

Appendix M: Beaufort Sea Aerial Survey Results M-35
TABLE M.24E. Sighting rates (sightings/1000 mi) of bowhead whales in 3-mi distance bins by survey area and seismic state in Camden Bay from 13 Sep through 28 Sep 2008. Dashes represent bins in which no effort was collected. Numbers in bold indicate maximum values.
Distance bin Seismic Post Non Seismic Post Non Seismic Post Non Seismic Post Non0-3 0.0 -- 0.0 119.1 -- 0.0 0.0 -- 0.0 25.9 -- 0.03-6 62.8 -- 0.0 0.0 -- 0.0 0.0 -- 0.0 34.9 -- 0.06-9 105.2 -- 232.7 0.0 -- -- 0.0 -- 0.0 44.0 -- 72.79-12 86.1 -- 0.0 21.8 -- 426.9 0.0 -- 0.0 44.1 -- 132.312-16 58.5 -- 0.0 0.0 -- 106.5 26.1 -- 0.0 35.6 -- 39.416-19 0.0 -- 0.0 0.0 -- 0.0 48.9 -- 0.0 12.3 -- 0.019-22 17.5 -- 0.0 0.0 -- 0.0 21.7 -- 0.0 14.7 -- 0.022-25 0.0 -- 0.0 0.0 -- 0.0 19.7 -- -- 8.4 -- 0.025-28 17.1 -- -- 0.0 -- 0.0 0.0 -- -- 7.3 -- 0.028-31 0.0 -- 0.0 0.0 -- -- 0.0 -- -- 0.0 -- 0.031-34 0.0 -- -- 0.0 -- -- 0.0 -- -- 0.0 -- --34-37 0.0 -- -- 0.0 -- -- 0.0 -- -- 0.0 -- --37-40 0.0 -- -- 0.0 -- -- 0.0 -- -- 0.0 -- --40-43 0.0 -- -- 0.0 -- -- 0.0 -- -- 0.0 -- --43-47 0.0 -- -- 0.0 -- -- 0.0 -- -- 0.0 -- --47-50 0.0 -- -- 0.0 -- -- 0.0 -- -- 0.0 -- --50-53 0.0 -- -- 0.0 -- -- 0.0 -- -- 0.0 -- --53-56 0.0 -- -- 0.0 -- -- 0.0 -- -- 0.0 -- --56-59 0.0 -- -- 0.0 -- -- 0.0 -- -- 0.0 -- --59-62 0.0 -- -- 0.0 -- -- 0.0 -- -- 0.0 -- --62-65 -- -- -- 0.0 -- -- 0.0 -- -- 0.0 -- --65-68 -- -- -- 0.0 -- -- 0.0 -- -- 0.0 -- --68-71 -- -- -- 0.0 -- -- 0.0 -- -- 0.0 -- --71-74 -- -- -- 0.0 -- -- -- -- -- 0.0 -- --74-78 -- -- -- 0.0 -- -- -- -- -- 0.0 -- --
Average 17.4 -- 25.9 5.6 -- 66.7 5.1 -- 0.0 9.1 -- 24.5
West Central East All
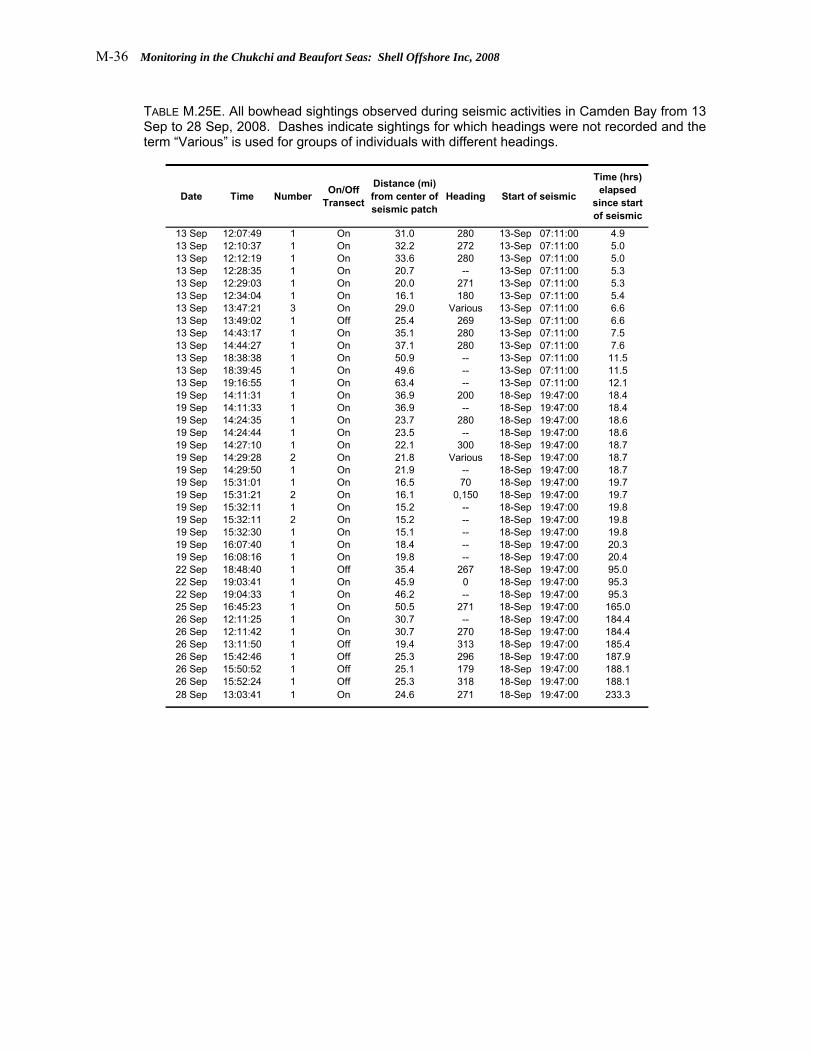
M-36 Monitoring in the Chukchi and Beaufort Seas: Shell Offshore Inc, 2008
TABLE M.25E. All bowhead sightings observed during seismic activities in Camden Bay from 13 Sep to 28 Sep, 2008. Dashes indicate sightings for which headings were not recorded and the term “Various” is used for groups of individuals with different headings.
Date Time Number On/Off Transect
Distance (mi) from center of seismic patch
Heading Start of seismic
Time (hrs) elapsed
since start of seismic
13 Sep 12:07:49 1 On 31.0 280 13-Sep 07:11:00 4.913 Sep 12:10:37 1 On 32.2 272 13-Sep 07:11:00 5.013 Sep 12:12:19 1 On 33.6 280 13-Sep 07:11:00 5.013 Sep 12:28:35 1 On 20.7 -- 13-Sep 07:11:00 5.313 Sep 12:29:03 1 On 20.0 271 13-Sep 07:11:00 5.313 Sep 12:34:04 1 On 16.1 180 13-Sep 07:11:00 5.413 Sep 13:47:21 3 On 29.0 Various 13-Sep 07:11:00 6.613 Sep 13:49:02 1 Off 25.4 269 13-Sep 07:11:00 6.613 Sep 14:43:17 1 On 35.1 280 13-Sep 07:11:00 7.513 Sep 14:44:27 1 On 37.1 280 13-Sep 07:11:00 7.613 Sep 18:38:38 1 On 50.9 -- 13-Sep 07:11:00 11.513 Sep 18:39:45 1 On 49.6 -- 13-Sep 07:11:00 11.513 Sep 19:16:55 1 On 63.4 -- 13-Sep 07:11:00 12.119 Sep 14:11:31 1 On 36.9 200 18-Sep 19:47:00 18.419 Sep 14:11:33 1 On 36.9 -- 18-Sep 19:47:00 18.419 Sep 14:24:35 1 On 23.7 280 18-Sep 19:47:00 18.619 Sep 14:24:44 1 On 23.5 -- 18-Sep 19:47:00 18.619 Sep 14:27:10 1 On 22.1 300 18-Sep 19:47:00 18.719 Sep 14:29:28 2 On 21.8 Various 18-Sep 19:47:00 18.719 Sep 14:29:50 1 On 21.9 -- 18-Sep 19:47:00 18.719 Sep 15:31:01 1 On 16.5 70 18-Sep 19:47:00 19.719 Sep 15:31:21 2 On 16.1 0,150 18-Sep 19:47:00 19.719 Sep 15:32:11 1 On 15.2 -- 18-Sep 19:47:00 19.819 Sep 15:32:11 2 On 15.2 -- 18-Sep 19:47:00 19.819 Sep 15:32:30 1 On 15.1 -- 18-Sep 19:47:00 19.819 Sep 16:07:40 1 On 18.4 -- 18-Sep 19:47:00 20.319 Sep 16:08:16 1 On 19.8 -- 18-Sep 19:47:00 20.422 Sep 18:48:40 1 Off 35.4 267 18-Sep 19:47:00 95.022 Sep 19:03:41 1 On 45.9 0 18-Sep 19:47:00 95.322 Sep 19:04:33 1 On 46.2 -- 18-Sep 19:47:00 95.325 Sep 16:45:23 1 On 50.5 271 18-Sep 19:47:00 165.026 Sep 12:11:25 1 On 30.7 -- 18-Sep 19:47:00 184.426 Sep 12:11:42 1 On 30.7 270 18-Sep 19:47:00 184.426 Sep 13:11:50 1 Off 19.4 313 18-Sep 19:47:00 185.426 Sep 15:42:46 1 Off 25.3 296 18-Sep 19:47:00 187.926 Sep 15:50:52 1 Off 25.1 179 18-Sep 19:47:00 188.126 Sep 15:52:24 1 Off 25.3 318 18-Sep 19:47:00 188.128 Sep 13:03:41 1 On 24.6 271 18-Sep 19:47:00 233.3

