aon benfield analytics | impact...
TRANSCRIPT
Aon Benfield Analytics | Impact Forecasting
Global Catastrophe Recap May 2015
Risk. Reinsurance. Human Resources.
Aon Benfield Analytics | Impact Forecasting
Table of Contents Executive Summary 3
United States 4
Remainder of North America 5
South America 5
Europe 5
Africa 5
Asia 6
Oceania 8
Appendix 9
Contact Information 13
Global Catastrophe Recap: May 2015 2
Aon Benfield Analytics | Impact Forecasting
Executive Summary Record May rainfall and widespread severe weather causes billions (USD) in damage in the U.S.
Dangerous heatwave kills at least 2,500 people in India
Powerful magnitude-7.3 aftershock brings more devastation and casualties to Nepal
The wettest May on record in the U.S. states of Texas and Oklahoma brought major flooding across numerous cities and towns, following frequent powerful thunderstorms that impacted a large section of the country east of the Rockies. A combined 41 people died, with the majority (32) occurring during a stretch from May 23-30 due to the riverine and flash flooding. More than 5,000 homes sustained flood inundation in Texas alone, including in the metro regions of Houston, Austin and Dallas. Hundreds of additional homes sustained flood damage in the Oklahoma metro areas of Tulsa and Oklahoma City.
Beyond the major flooding, severe weather prompted 412 preliminary reports of tornadoes in May by the Storm Prediction Center. This would be the highest number of U.S. tornadoes in a month since April 2011 (758). Up to softball-sized hail and straight-line winds gusting beyond 80 mph (130 kph) also caused damage across the central and eastern U.S.
Total aggregated severe thunderstorm and flood economic losses for May are expected to exceed USD5.0 billion. Overall insured losses exceeded USD2.3 billion, though given low flood insurance penetration in parts of Oklahoma and Texas, the losses could have been even more robust.
Significant flooding also swept across many provincial regions of China. A combined 81 people died as the seasonal Mei-Yu rains arrived in May. Nearly 100,000 homes were damaged or destroyed, with the total combined monthly economic losses estimated beyond USD3.0 billion.
In Australia, an East Coast Low brought record-breaking rainfall to portions of southeastern Queensland and northeastern New South Wales that triggering flash floods and caused widespread damage to property and agricultural interests. The Insurance Council of Australia reported that insurers received at least 27,825 claims with payouts totaling AUD360 million (USD280 million).
Additional flood and severe weather events occurred in New Zealand, Germany, Hong Kong and Taiwan.
An extended and severely intense heatwave impacted multiple states in India during the month, killing at least 2,500 people. This is one of the highest death tolls from a heatwave recorded in recent history. The states of Andhra Pradesh, Telangana, and Odisha (Orissa) were worst affected by temperatures that reached 48.0˚C (118˚F) for consecutive days in several areas.
A major magnitude-7.3 earthquake struck just southwest of Mount Everest on May 12. The event was an aftershock from the main magnitude-7.8 tremor in Nepal that occurred on April 25. At least 131 fatalities were confirmed in Nepal, India, and China, bringing the overall death toll from the April 25 and May 12 earthquakes to nearly 9,000.
Super Typhoon Noul brought torrential rain and strong winds in the Philippines, Yap, and Japan’s Okinawa, killing two people. Losses in Philippines were listed at PHP16.3 million (USD366,000); while crop losses in Okinawa were JPY2.8 billion (USD23.2 million).
Tropical Storm Ana made landfall in the U.S. state of South Carolina though impacts were minimal.
Global Catastrophe Recap: May 2015 3
Aon Benfield Analytics | Impact Forecasting
United States Date Event Location Deaths Structures/
Claims Economic
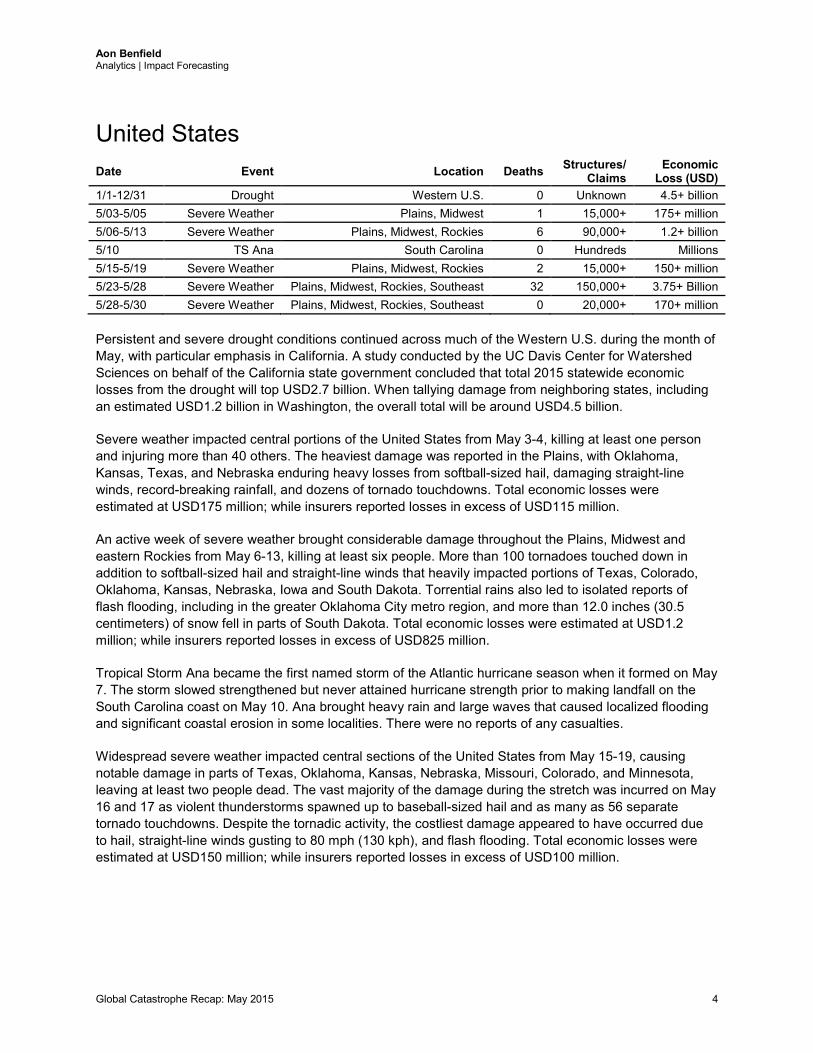
Loss (USD) 1/1-12/31 Drought Western U.S. 0 Unknown 4.5+ billion 5/03-5/05 Severe Weather Plains, Midwest 1 15,000+ 175+ million 5/06-5/13 Severe Weather Plains, Midwest, Rockies 6 90,000+ 1.2+ billion 5/10 TS Ana South Carolina 0 Hundreds Millions 5/15-5/19 Severe Weather Plains, Midwest, Rockies 2 15,000+ 150+ million 5/23-5/28 Severe Weather Plains, Midwest, Rockies, Southeast 32 150,000+ 3.75+ Billion 5/28-5/30 Severe Weather Plains, Midwest, Rockies, Southeast 0 20,000+ 170+ million Persistent and severe drought conditions continued across much of the Western U.S. during the month of May, with particular emphasis in California. A study conducted by the UC Davis Center for Watershed Sciences on behalf of the California state government concluded that total 2015 statewide economic losses from the drought will top USD2.7 billion. When tallying damage from neighboring states, including an estimated USD1.2 billion in Washington, the overall total will be around USD4.5 billion.
Severe weather impacted central portions of the United States from May 3-4, killing at least one person and injuring more than 40 others. The heaviest damage was reported in the Plains, with Oklahoma, Kansas, Texas, and Nebraska enduring heavy losses from softball-sized hail, damaging straight-line winds, record-breaking rainfall, and dozens of tornado touchdowns. Total economic losses were estimated at USD175 million; while insurers reported losses in excess of USD115 million.
An active week of severe weather brought considerable damage throughout the Plains, Midwest and eastern Rockies from May 6-13, killing at least six people. More than 100 tornadoes touched down in addition to softball-sized hail and straight-line winds that heavily impacted portions of Texas, Colorado, Oklahoma, Kansas, Nebraska, Iowa and South Dakota. Torrential rains also led to isolated reports of flash flooding, including in the greater Oklahoma City metro region, and more than 12.0 inches (30.5 centimeters) of snow fell in parts of South Dakota. Total economic losses were estimated at USD1.2 million; while insurers reported losses in excess of USD825 million.
Tropical Storm Ana became the first named storm of the Atlantic hurricane season when it formed on May 7. The storm slowed strengthened but never attained hurricane strength prior to making landfall on the South Carolina coast on May 10. Ana brought heavy rain and large waves that caused localized flooding and significant coastal erosion in some localities. There were no reports of any casualties.
Widespread severe weather impacted central sections of the United States from May 15-19, causing notable damage in parts of Texas, Oklahoma, Kansas, Nebraska, Missouri, Colorado, and Minnesota, leaving at least two people dead. The vast majority of the damage during the stretch was incurred on May 16 and 17 as violent thunderstorms spawned up to baseball-sized hail and as many as 56 separate tornado touchdowns. Despite the tornadic activity, the costliest damage appeared to have occurred due to hail, straight-line winds gusting to 80 mph (130 kph), and flash flooding. Total economic losses were estimated at USD150 million; while insurers reported losses in excess of USD100 million.
Global Catastrophe Recap: May 2015 4
Aon Benfield Analytics | Impact Forecasting
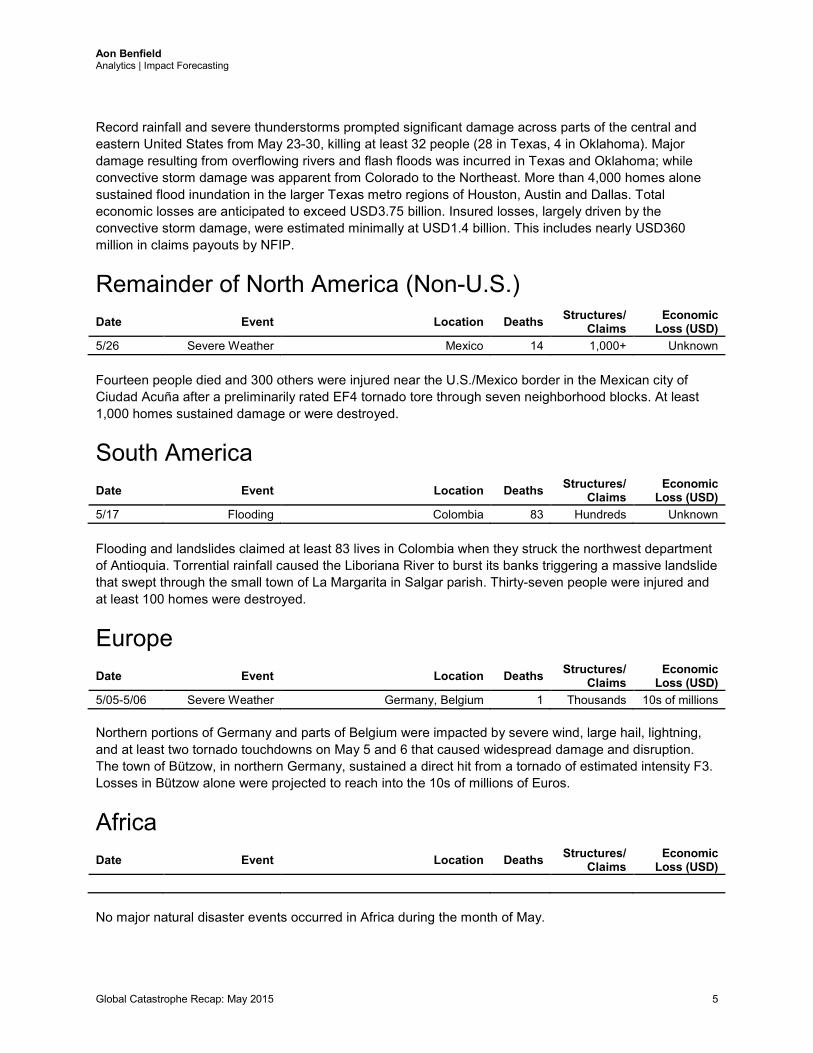
Record rainfall and severe thunderstorms prompted significant damage across parts of the central and eastern United States from May 23-30, killing at least 32 people (28 in Texas, 4 in Oklahoma). Major damage resulting from overflowing rivers and flash floods was incurred in Texas and Oklahoma; while convective storm damage was apparent from Colorado to the Northeast. More than 4,000 homes alone sustained flood inundation in the larger Texas metro regions of Houston, Austin and Dallas. Total economic losses are anticipated to exceed USD3.75 billion. Insured losses, largely driven by the convective storm damage, were estimated minimally at USD1.4 billion. This includes nearly USD360 million in claims payouts by NFIP.
Remainder of North America (Non-U.S.) Date Event Location Deaths Structures/
Claims Economic
Loss (USD) 5/26 Severe Weather Mexico 14 1,000+ Unknown Fourteen people died and 300 others were injured near the U.S./Mexico border in the Mexican city of Ciudad Acuña after a preliminarily rated EF4 tornado tore through seven neighborhood blocks. At least 1,000 homes sustained damage or were destroyed.
South America Date Event Location Deaths Structures/
Claims Economic
Loss (USD) 5/17 Flooding Colombia 83 Hundreds Unknown Flooding and landslides claimed at least 83 lives in Colombia when they struck the northwest department of Antioquia. Torrential rainfall caused the Liboriana River to burst its banks triggering a massive landslide that swept through the small town of La Margarita in Salgar parish. Thirty-seven people were injured and at least 100 homes were destroyed.
Europe Date Event Location Deaths Structures/
Claims Economic
Loss (USD) 5/05-5/06 Severe Weather Germany, Belgium 1 Thousands 10s of millions Northern portions of Germany and parts of Belgium were impacted by severe wind, large hail, lightning, and at least two tornado touchdowns on May 5 and 6 that caused widespread damage and disruption. The town of Bützow, in northern Germany, sustained a direct hit from a tornado of estimated intensity F3. Losses in Bützow alone were projected to reach into the 10s of millions of Euros.
Africa Date Event Location Deaths Structures/
Claims Economic
Loss (USD)
No major natural disaster events occurred in Africa during the month of May.
Global Catastrophe Recap: May 2015 5
Aon Benfield Analytics | Impact Forecasting
Asia Date Event Location Deaths Structures/
Claims Economic
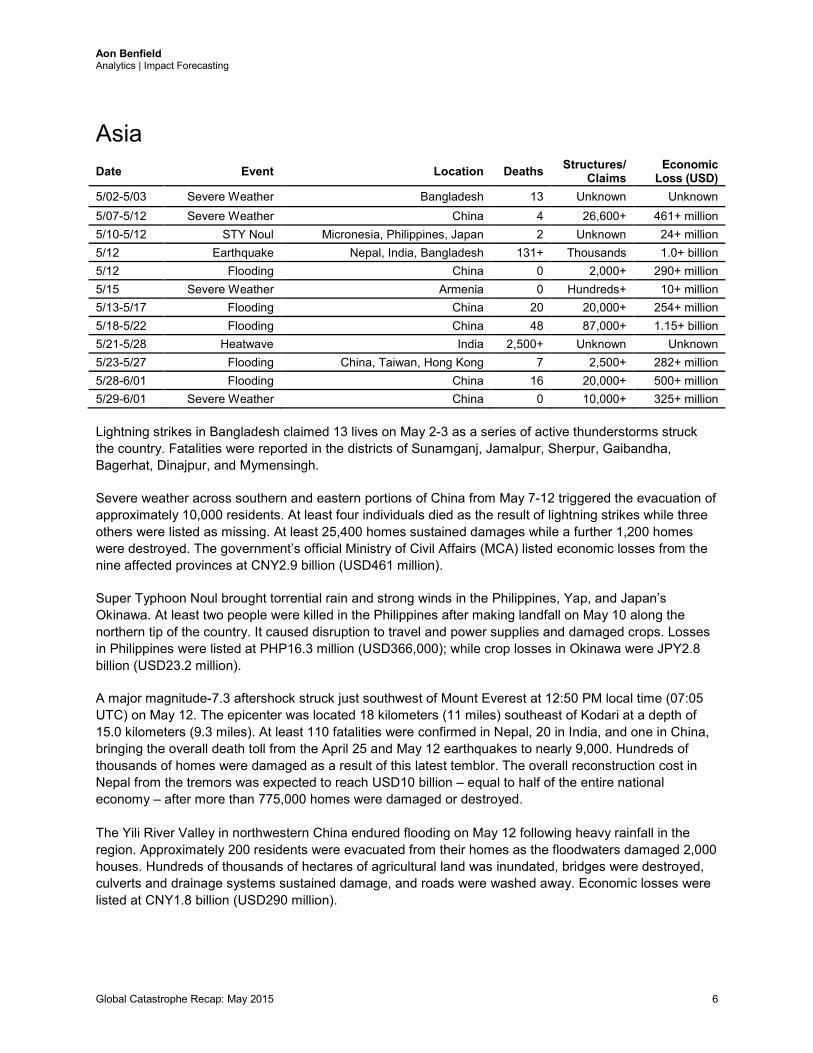
Loss (USD) 5/02-5/03 Severe Weather Bangladesh 13 Unknown Unknown 5/07-5/12 Severe Weather China 4 26,600+ 461+ million 5/10-5/12 STY Noul Micronesia, Philippines, Japan 2 Unknown 24+ million 5/12 Earthquake Nepal, India, Bangladesh 131+ Thousands 1.0+ billion 5/12 Flooding China 0 2,000+ 290+ million 5/15 Severe Weather Armenia 0 Hundreds+ 10+ million 5/13-5/17 Flooding China 20 20,000+ 254+ million 5/18-5/22 Flooding China 48 87,000+ 1.15+ billion 5/21-5/28 Heatwave India 2,500+ Unknown Unknown 5/23-5/27 Flooding China, Taiwan, Hong Kong 7 2,500+ 282+ million 5/28-6/01 Flooding China 16 20,000+ 500+ million 5/29-6/01 Severe Weather China 0 10,000+ 325+ million Lightning strikes in Bangladesh claimed 13 lives on May 2-3 as a series of active thunderstorms struck the country. Fatalities were reported in the districts of Sunamganj, Jamalpur, Sherpur, Gaibandha, Bagerhat, Dinajpur, and Mymensingh.
Severe weather across southern and eastern portions of China from May 7-12 triggered the evacuation of approximately 10,000 residents. At least four individuals died as the result of lightning strikes while three others were listed as missing. At least 25,400 homes sustained damages while a further 1,200 homes were destroyed. The government’s official Ministry of Civil Affairs (MCA) listed economic losses from the nine affected provinces at CNY2.9 billion (USD461 million).
Super Typhoon Noul brought torrential rain and strong winds in the Philippines, Yap, and Japan’s Okinawa. At least two people were killed in the Philippines after making landfall on May 10 along the northern tip of the country. It caused disruption to travel and power supplies and damaged crops. Losses in Philippines were listed at PHP16.3 million (USD366,000); while crop losses in Okinawa were JPY2.8 billion (USD23.2 million).
A major magnitude-7.3 aftershock struck just southwest of Mount Everest at 12:50 PM local time (07:05 UTC) on May 12. The epicenter was located 18 kilometers (11 miles) southeast of Kodari at a depth of 15.0 kilometers (9.3 miles). At least 110 fatalities were confirmed in Nepal, 20 in India, and one in China, bringing the overall death toll from the April 25 and May 12 earthquakes to nearly 9,000. Hundreds of thousands of homes were damaged as a result of this latest temblor. The overall reconstruction cost in Nepal from the tremors was expected to reach USD10 billion – equal to half of the entire national economy – after more than 775,000 homes were damaged or destroyed. The Yili River Valley in northwestern China endured flooding on May 12 following heavy rainfall in the region. Approximately 200 residents were evacuated from their homes as the floodwaters damaged 2,000 houses. Hundreds of thousands of hectares of agricultural land was inundated, bridges were destroyed, culverts and drainage systems sustained damage, and roads were washed away. Economic losses were listed at CNY1.8 billion (USD290 million).
Global Catastrophe Recap: May 2015 6
Aon Benfield Analytics | Impact Forecasting
Strong thunderstorms prompted hail across multiple communities in Armenia on May 15. Some of the most significant damage was noted to local farms, with the Ministry of Agriculture reporting that nearly 1,500 hectares (3,706 acres) of crops damaged. Total losses to crops alone were listed at AMD1.14 billion (USD2.4 million).
Widespread flooding affected parts of southern and eastern portions of China from May 13-17, killing at least 20 people and damaging or destroying 20,000 homes. Portions of five provincial regions were affected by the Mei-Yu rains that triggered the widespread floods. Total economic losses were estimated at CNY1.58 billion (USD254 million).
Significant flooding affected southern China from May 18-22, killing at least 48 people and causing major damage in the provincial regions of Fujian, Jiangxi, Hunan, Guangdong, Guangxi, and Guizhou. Severe flooding, landslides and hail were the primary culprit from seasonal rains that damaged or destroyed an estimated 87,000 homes. More than 100,000 hectares (247,000 acres) of cropland was also inundated. Total economic losses were listed at CNY7.2 billion (USD1.15 billion).
An exceptional heatwave impacted India from May 21-31 prior to the arrival of the annual monsoon. The death toll, one of the highest on record for heat-related casualties, was listed beyond 2,500. The states of Andhra Pradesh, Telangana, and Odisha (Orissa) were worst affected by temperatures that reached 48.0˚C (118˚F) in several areas. Temperatures were so hot that roads literally melted in some areas.
The annual Mei-Yu rains impacted portions of southern China, including Hong Kong, and Taiwan from May 23-27. At least seven people died. While damage was notable in parts of Taiwan and Hong Kong, the most widespread flooding and landslide impacts were felt in China. An estimated 2,500 homes were damaged or destroyed by flood inundation and vast areas of cropland were submerged. China’s MCA listed economic losses at CNY1.75 billion (USD282 million).
Seasonal Mei-Yu rains continued to fall across southern China from May 28 to June 1, killing at least 16 people. Many provincial regions were impacted, including Guizhou, Chongqing, Jiangsu, Fujian, as the MCA noted that as many as 20,000 homes were damaged or destroyed by extensive flooding, hail and high winds. Total economic losses were listed at CNY3.1 billion (USD500 million). Strong thunderstorms tracked across northern China from May 29 to June 1, causing considerable damage to agricultural interests. The provincial regions of Shanxi, Shaanxi, Gansu, Hebei, Jilin, Heilongjiang, and Ningxia were the hardest-hit as hail up to 5.0 centimeters (2.0 inches) in diameter fell. Total economic losses were listed at CNY2.0 billion (USD325 million).
Global Catastrophe Recap: May 2015 7
Aon Benfield Analytics | Impact Forecasting
Oceania (Australia, New Zealand, South Pacific Islands) Date Event Location Deaths Structures/
Claims Economic
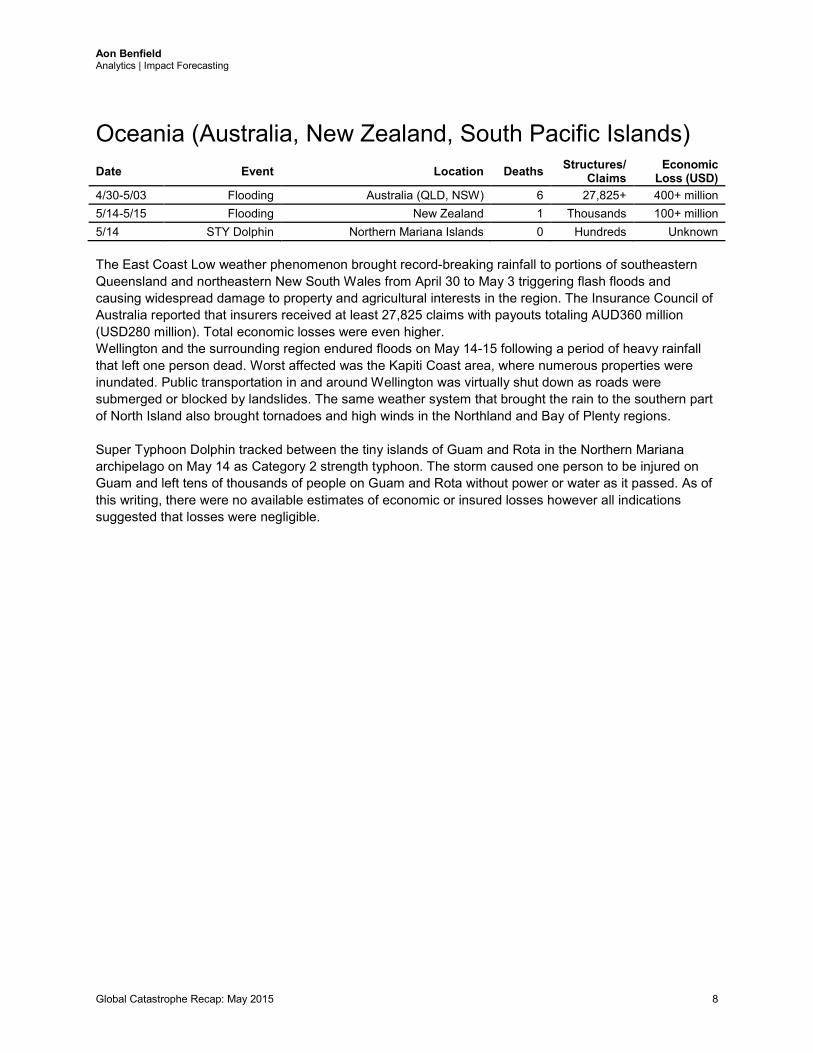
Loss (USD) 4/30-5/03 Flooding Australia (QLD, NSW) 6 27,825+ 400+ million 5/14-5/15 Flooding New Zealand 1 Thousands 100+ million 5/14 STY Dolphin Northern Mariana Islands 0 Hundreds Unknown The East Coast Low weather phenomenon brought record-breaking rainfall to portions of southeastern Queensland and northeastern New South Wales from April 30 to May 3 triggering flash floods and causing widespread damage to property and agricultural interests in the region. The Insurance Council of Australia reported that insurers received at least 27,825 claims with payouts totaling AUD360 million (USD280 million). Total economic losses were even higher. Wellington and the surrounding region endured floods on May 14-15 following a period of heavy rainfall that left one person dead. Worst affected was the Kapiti Coast area, where numerous properties were inundated. Public transportation in and around Wellington was virtually shut down as roads were submerged or blocked by landslides. The same weather system that brought the rain to the southern part of North Island also brought tornadoes and high winds in the Northland and Bay of Plenty regions. Super Typhoon Dolphin tracked between the tiny islands of Guam and Rota in the Northern Mariana archipelago on May 14 as Category 2 strength typhoon. The storm caused one person to be injured on Guam and left tens of thousands of people on Guam and Rota without power or water as it passed. As of this writing, there were no available estimates of economic or insured losses however all indications suggested that losses were negligible.
Global Catastrophe Recap: May 2015 8
Aon Benfield Analytics | Impact Forecasting
Appendix
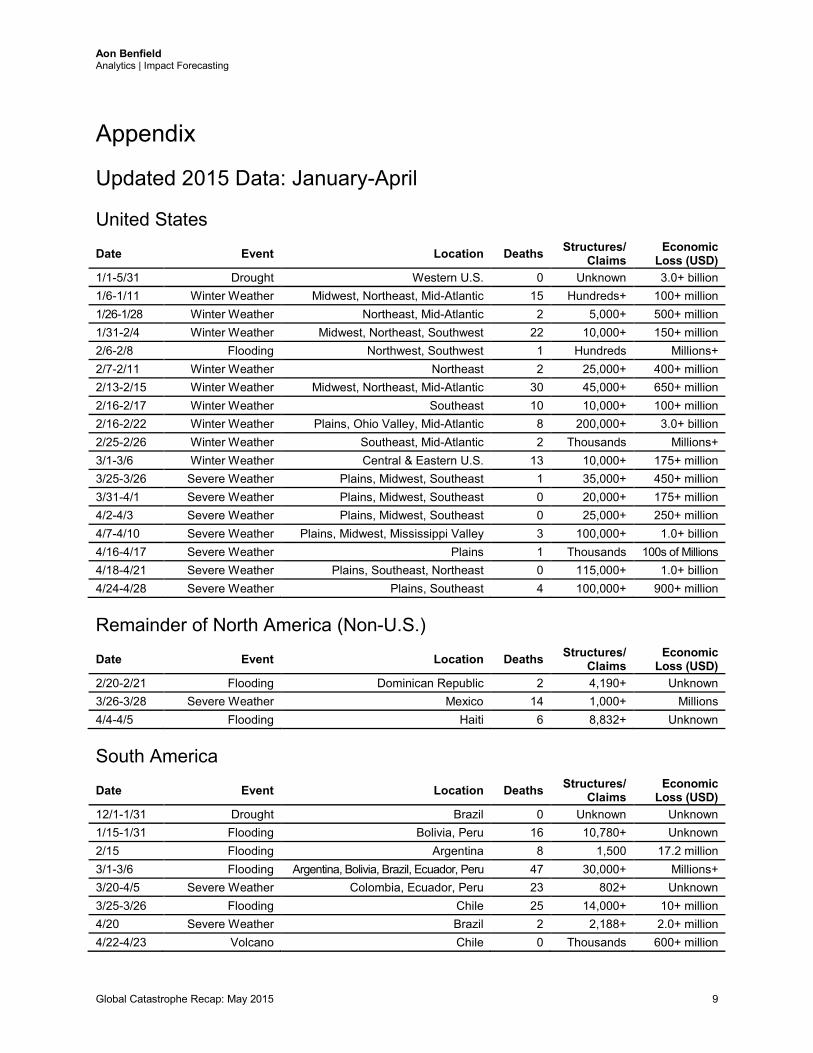
Updated 2015 Data: January-April
United States
Date Event Location Deaths Structures/ Claims
Economic Loss (USD)
1/1-5/31 Drought Western U.S. 0 Unknown 3.0+ billion 1/6-1/11 Winter Weather Midwest, Northeast, Mid-Atlantic 15 Hundreds+ 100+ million 1/26-1/28 Winter Weather Northeast, Mid-Atlantic 2 5,000+ 500+ million 1/31-2/4 Winter Weather Midwest, Northeast, Southwest 22 10,000+ 150+ million 2/6-2/8 Flooding Northwest, Southwest 1 Hundreds Millions+ 2/7-2/11 Winter Weather Northeast 2 25,000+ 400+ million 2/13-2/15 Winter Weather Midwest, Northeast, Mid-Atlantic 30 45,000+ 650+ million 2/16-2/17 Winter Weather Southeast 10 10,000+ 100+ million 2/16-2/22 Winter Weather Plains, Ohio Valley, Mid-Atlantic 8 200,000+ 3.0+ billion 2/25-2/26 Winter Weather Southeast, Mid-Atlantic 2 Thousands Millions+ 3/1-3/6 Winter Weather Central & Eastern U.S. 13 10,000+ 175+ million 3/25-3/26 Severe Weather Plains, Midwest, Southeast 1 35,000+ 450+ million 3/31-4/1 Severe Weather Plains, Midwest, Southeast 0 20,000+ 175+ million 4/2-4/3 Severe Weather Plains, Midwest, Southeast 0 25,000+ 250+ million 4/7-4/10 Severe Weather Plains, Midwest, Mississippi Valley 3 100,000+ 1.0+ billion 4/16-4/17 Severe Weather Plains 1 Thousands 100s of Millions 4/18-4/21 Severe Weather Plains, Southeast, Northeast 0 115,000+ 1.0+ billion 4/24-4/28 Severe Weather Plains, Southeast 4 100,000+ 900+ million
Remainder of North America (Non-U.S.)
Date Event Location Deaths Structures/ Claims
Economic Loss (USD)
2/20-2/21 Flooding Dominican Republic 2 4,190+ Unknown 3/26-3/28 Severe Weather Mexico 14 1,000+ Millions 4/4-4/5 Flooding Haiti 6 8,832+ Unknown
South America
Date Event Location Deaths Structures/ Claims
Economic Loss (USD)
12/1-1/31 Drought Brazil 0 Unknown Unknown 1/15-1/31 Flooding Bolivia, Peru 16 10,780+ Unknown 2/15 Flooding Argentina 8 1,500 17.2 million 3/1-3/6 Flooding Argentina, Bolivia, Brazil, Ecuador, Peru 47 30,000+ Millions+ 3/20-4/5 Severe Weather Colombia, Ecuador, Peru 23 802+ Unknown 3/25-3/26 Flooding Chile 25 14,000+ 10+ million 4/20 Severe Weather Brazil 2 2,188+ 2.0+ million 4/22-4/23 Volcano Chile 0 Thousands 600+ million
Global Catastrophe Recap: May 2015 9
Aon Benfield Analytics | Impact Forecasting
Date Event Location Deaths Structures/ Claims
Economic Loss (USD)
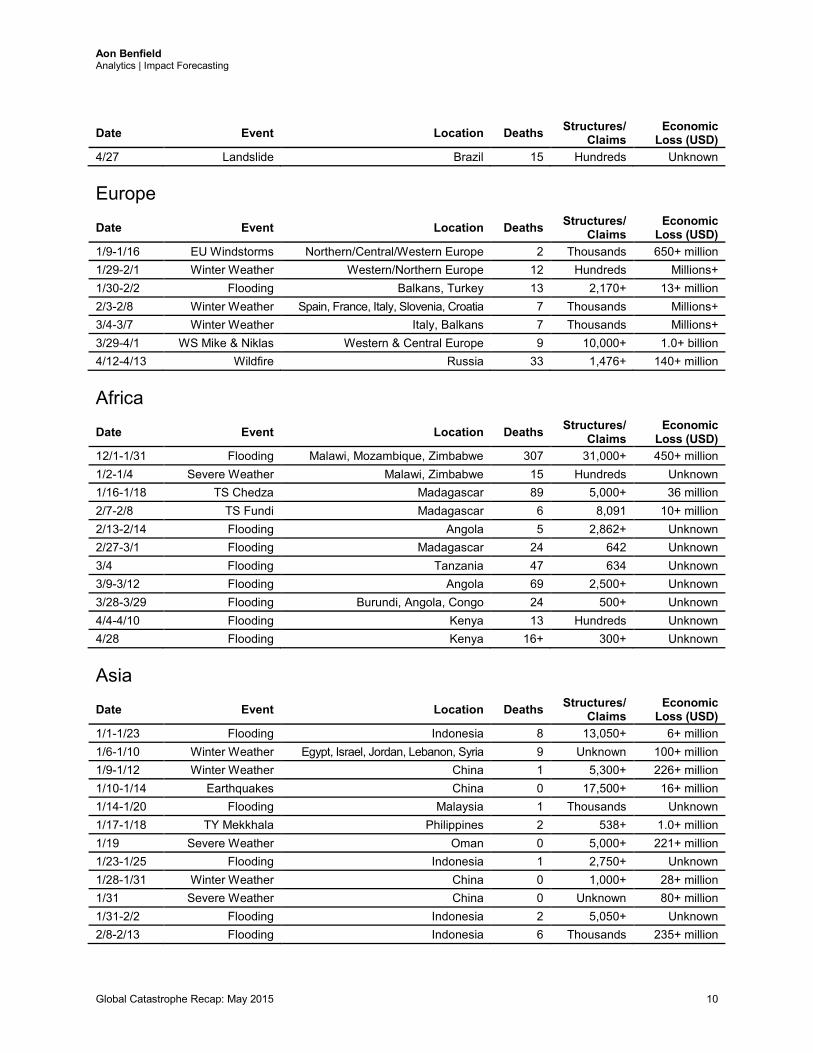
4/27 Landslide Brazil 15 Hundreds Unknown
Europe
Date Event Location Deaths Structures/ Claims
Economic Loss (USD)
1/9-1/16 EU Windstorms Northern/Central/Western Europe 2 Thousands 650+ million 1/29-2/1 Winter Weather Western/Northern Europe 12 Hundreds Millions+ 1/30-2/2 Flooding Balkans, Turkey 13 2,170+ 13+ million 2/3-2/8 Winter Weather Spain, France, Italy, Slovenia, Croatia 7 Thousands Millions+ 3/4-3/7 Winter Weather Italy, Balkans 7 Thousands Millions+ 3/29-4/1 WS Mike & Niklas Western & Central Europe 9 10,000+ 1.0+ billion 4/12-4/13 Wildfire Russia 33 1,476+ 140+ million
Africa
Date Event Location Deaths Structures/ Claims
Economic Loss (USD)
12/1-1/31 Flooding Malawi, Mozambique, Zimbabwe 307 31,000+ 450+ million 1/2-1/4 Severe Weather Malawi, Zimbabwe 15 Hundreds Unknown 1/16-1/18 TS Chedza Madagascar 89 5,000+ 36 million 2/7-2/8 TS Fundi Madagascar 6 8,091 10+ million 2/13-2/14 Flooding Angola 5 2,862+ Unknown 2/27-3/1 Flooding Madagascar 24 642 Unknown 3/4 Flooding Tanzania 47 634 Unknown 3/9-3/12 Flooding Angola 69 2,500+ Unknown 3/28-3/29 Flooding Burundi, Angola, Congo 24 500+ Unknown 4/4-4/10 Flooding Kenya 13 Hundreds Unknown 4/28 Flooding Kenya 16+ 300+ Unknown
Asia
Date Event Location Deaths Structures/ Claims
Economic Loss (USD)
1/1-1/23 Flooding Indonesia 8 13,050+ 6+ million 1/6-1/10 Winter Weather Egypt, Israel, Jordan, Lebanon, Syria 9 Unknown 100+ million 1/9-1/12 Winter Weather China 1 5,300+ 226+ million 1/10-1/14 Earthquakes China 0 17,500+ 16+ million 1/14-1/20 Flooding Malaysia 1 Thousands Unknown 1/17-1/18 TY Mekkhala Philippines 2 538+ 1.0+ million 1/19 Severe Weather Oman 0 5,000+ 221+ million 1/23-1/25 Flooding Indonesia 1 2,750+ Unknown 1/28-1/31 Winter Weather China 0 1,000+ 28+ million 1/31 Severe Weather China 0 Unknown 80+ million 1/31-2/2 Flooding Indonesia 2 5,050+ Unknown 2/8-2/13 Flooding Indonesia 6 Thousands 235+ million
Global Catastrophe Recap: May 2015 10
Aon Benfield Analytics | Impact Forecasting
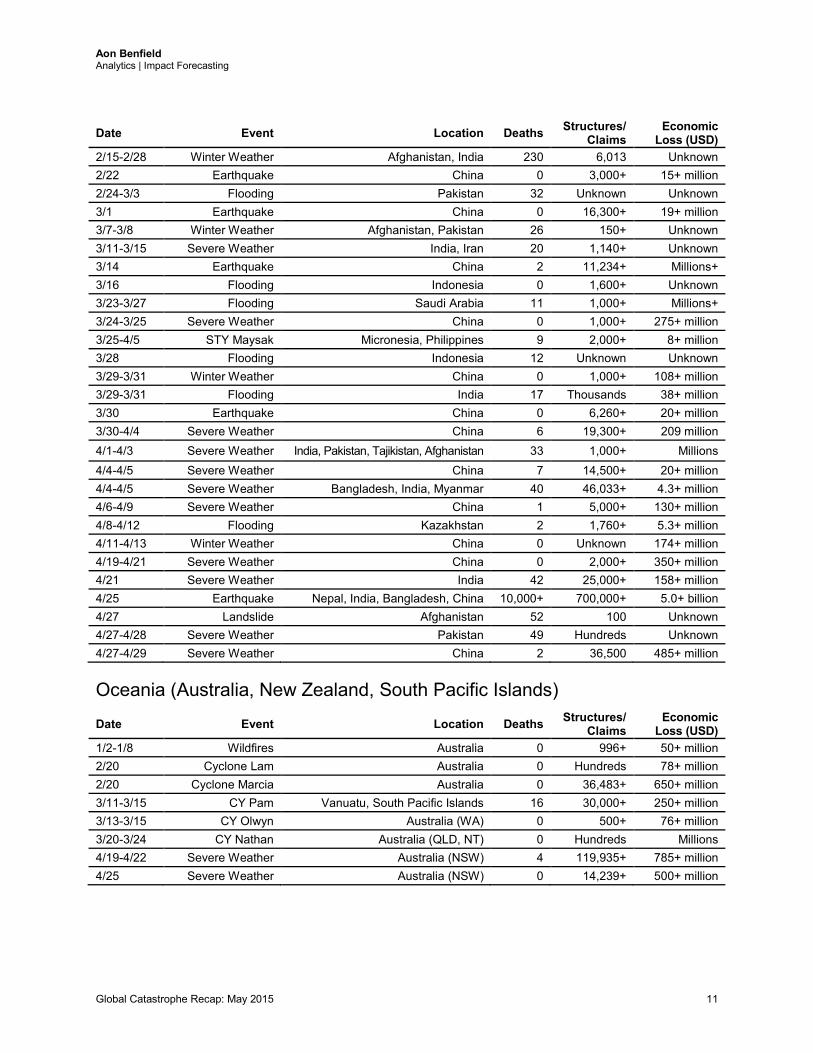
Date Event Location Deaths Structures/ Claims
Economic Loss (USD)
2/15-2/28 Winter Weather Afghanistan, India 230 6,013 Unknown 2/22 Earthquake China 0 3,000+ 15+ million 2/24-3/3 Flooding Pakistan 32 Unknown Unknown 3/1 Earthquake China 0 16,300+ 19+ million 3/7-3/8 Winter Weather Afghanistan, Pakistan 26 150+ Unknown 3/11-3/15 Severe Weather India, Iran 20 1,140+ Unknown 3/14 Earthquake China 2 11,234+ Millions+ 3/16 Flooding Indonesia 0 1,600+ Unknown 3/23-3/27 Flooding Saudi Arabia 11 1,000+ Millions+ 3/24-3/25 Severe Weather China 0 1,000+ 275+ million 3/25-4/5 STY Maysak Micronesia, Philippines 9 2,000+ 8+ million 3/28 Flooding Indonesia 12 Unknown Unknown 3/29-3/31 Winter Weather China 0 1,000+ 108+ million 3/29-3/31 Flooding India 17 Thousands 38+ million 3/30 Earthquake China 0 6,260+ 20+ million 3/30-4/4 Severe Weather China 6 19,300+ 209 million 4/1-4/3 Severe Weather India, Pakistan, Tajikistan, Afghanistan 33 1,000+ Millions 4/4-4/5 Severe Weather China 7 14,500+ 20+ million 4/4-4/5 Severe Weather Bangladesh, India, Myanmar 40 46,033+ 4.3+ million 4/6-4/9 Severe Weather China 1 5,000+ 130+ million 4/8-4/12 Flooding Kazakhstan 2 1,760+ 5.3+ million 4/11-4/13 Winter Weather China 0 Unknown 174+ million 4/19-4/21 Severe Weather China 0 2,000+ 350+ million 4/21 Severe Weather India 42 25,000+ 158+ million 4/25 Earthquake Nepal, India, Bangladesh, China 10,000+ 700,000+ 5.0+ billion 4/27 Landslide Afghanistan 52 100 Unknown 4/27-4/28 Severe Weather Pakistan 49 Hundreds Unknown 4/27-4/29 Severe Weather China 2 36,500 485+ million
Oceania (Australia, New Zealand, South Pacific Islands)
Date Event Location Deaths Structures/ Claims
Economic Loss (USD)
1/2-1/8 Wildfires Australia 0 996+ 50+ million 2/20 Cyclone Lam Australia 0 Hundreds 78+ million 2/20 Cyclone Marcia Australia 0 36,483+ 650+ million 3/11-3/15 CY Pam Vanuatu, South Pacific Islands 16 30,000+ 250+ million 3/13-3/15 CY Olwyn Australia (WA) 0 500+ 76+ million 3/20-3/24 CY Nathan Australia (QLD, NT) 0 Hundreds Millions 4/19-4/22 Severe Weather Australia (NSW) 4 119,935+ 785+ million 4/25 Severe Weather Australia (NSW) 0 14,239+ 500+ million
Global Catastrophe Recap: May 2015 11
Aon Benfield Analytics | Impact Forecasting
Additional Report Details TD = Tropical Depression, TS = Tropical Storm, HU = Hurricane, TY = Typhoon, STY = Super Typhoon, CY = Cyclone Fatality estimates as reported by public news media sources and official government agencies. Structures defined as any building – including barns, outbuildings, mobile homes, single or multiple family dwellings, and commercial facilities – that is damaged or destroyed by winds, earthquakes, hail, flood, tornadoes, hurricanes or any other natural-occurring phenomenon. Claims defined as the number of claims (which could be a combination of homeowners, commercial, auto and others) reported by various insurance companies through press releases or various public media outlets. Damage estimates are obtained from various public media sources, including news websites, publications from insurance companies, financial institution press releases and official government agencies. Damage estimates are obtained from various public media sources, including news websites, publications from insurance companies, financial institution press releases and official government agencies. Economic loss totals include any available insured loss estimates, which can be found in the corresponding event text.
Global Catastrophe Recap: May 2015 12
Aon Benfield Analytics | Impact Forecasting
Contact Information Adam Podlaha Head of Impact Forecasting Aon Benfield Analytics Impact Forecasting +44 (0) 20 7522 3820 [email protected] Steve Bowen Associate Director (Meteorologist) Aon Benfield Analytics Impact Forecasting +1.312.381.5883 [email protected] Claire Kennedy Senior Analyst (Meteorologist) Aon Benfield Analytics Impact Forecasting +65 6645 0110 [email protected]
Global Catastrophe Recap: May 2015 13
Aon Benfield Analytics | Impact Forecasting
About Aon Benfield
Aon Benfield, a division of Aon plc (NYSE: AON), is the world’s leading reinsurance intermediary and full-service capital advisor. We empower our clients to better understand, manage and transfer risk through innovative solutions and personalized access to all forms of global reinsurance capital across treaty, facultative and capital markets. As a trusted advocate, we deliver local reach to the world’s markets, an unparalleled investment in innovative analytics, including catastrophe management, actuarial and rating agency advisory. Through our professionals’ expertise and experience, we advise clients in making optimal capital choices that will empower results and improve operational effectiveness for their business. With more than 80 offices in 50 countries, our worldwide client base has access to the broadest portfolio of integrated capital solutions and services. To learn how Aon Benfield helps empower results, please visit aonbenfield.com. Copyright © by Impact Forecasting® No claim to original government works. The text and graphics of this publication are provided for informational purposes only. While Impact Forecasting® has tried to provide accurate and timely information, inadvertent technical inaccuracies and typographical errors may exist, and Impact Forecasting® does not warrant that the information is accurate, complete or current. The data presented at this site is intended to convey only general information on current natural perils and must not be used to make life-or-death decisions or decisions relating to the protection of property, as the data may not be accurate. Please listen to official information sources for current storm information. This data has no official status and should not be used for emergency response decision-making under any circumstances. Cat Alerts use publicly available data from the internet and other sources. Impact Forecasting® summarizes this publicly available information for the convenience of those individuals who have contacted Impact Forecasting® and expressed an interest in natural catastrophes of various types. To find out more about Impact Forecasting or to sign up for the Cat Reports, visit Impact Forecasting’s webpage at impactforecasting.com. Copyright © by Aon plc.
All rights reserved. No part of this document may be reproduced, stored in a retrieval system, or transmitted in any form or by any means, electronic, mechanical, photocopying, recording or otherwise. Impact Forecasting® is a wholly owned subsidiary of Aon plc.
Global Catastrophe Recap: May 2015 14