antti zhang greg bruno presented 4-7-2011. oligopoly the general economy drives the sales, out of...
TRANSCRIPT

Antti ZhangGreg BrunoPresented 4-7-2011
Oligopoly The general economy drives the sales, out
of company’s control High Fixed COGS Consumer Discretionary: Cyclical Industry Qualities of a Good Company:
◦ Follow the market shift◦ Control Fix cost◦ Steal the market

Market Shift◦ Shift from Truck to Cars◦ Shift from Large to Small◦ Shift from US, Europe to Asia and South America◦ Gas to Hybrid
Over capacity◦ Over capacity 21M in 5 years ◦ US: 96%, Europe 37%
Source: CSMauto.com

Threat to New Entry (Very Low)◦ Require large amount of investment◦ Brand Effect◦ Economic of scale
Threat of Substitute (Low)◦ Mass Transit Service◦ Car Sharing
Competitive Rivalry (High)◦ Some level of product differential◦ Relative easy to switch

The Bargaining power of Supplies (Very Low)◦ Many companies in this industry have their own
factory to produce the components for assembling◦ The raw material is 2nd tier commoditized (Steel,
Tires, Glass, etc)
The Bargaining power of Customers (High)◦ Lots of similar car to choose (GMC vs F150)◦ Not a kind of necessarily goods

Ford is struggling to retain dominance◦ Consumer preferences shifting due to fuel prices◦ High legacy (employee) costs◦ Entrenched management
Bonds downgraded to Junk (2005)◦ Eroding market share◦ Declining margins◦ Reliance on financing for profit

Ford announces restructuring plan in 2006◦ Titled “The Way Forward”
Main Focus◦ Reduce fixed capital costs◦ Special focus on cars & crossover vehicles◦ Profitability across product lines

Reducing Fixed costs◦ Multiple Divestitures◦ Planned closings of 14 plants, 7 which make cars
Reduced Ford’s capacity by 26% by 2008 Eliminates up to 30,000 factory jobs by 2012
Focus on cars & crossover◦ New Product offering of high mileage cars
B-Class subcompact auto platform Crossover vehicles built on Fusion platform Return of the Taurus!
Profitability across product lines◦ Global Product Development system
Reduces cycle times to compete w/ Japanese New vehicle R&D costs reduced by 60% (2005-2008)
Source: Ford 2005 Annual report

Ford (wholly owned)◦ Flagship brand
Lincoln (wholly owned)◦ Luxury Brand; focus of revitalization
Mazda (minority stake)◦ Current ownership of 3.5% stake in Mazda◦ Reduction from 33.4% stake as of 2008
Aston Martin (minority stake)◦ Sold in 2007 at a $925 MM valuation with Ford retaining a $77 MM (8.3%) investment
Jaguar & Land Rover (no stake)◦ Sold to Indian company Tata motors in 2008 for $2.3 Billion (about half of purchase price)
Volvo (no stake)◦ Sold to Geely Auto in 2010 for $1.8 Billion
Mercury (no stake)◦ Discontinued in late 2010
Chairman Bill Ford◦ Commissioned the writing of a restructuring plan◦ Steps down as President and CEO
Alan Mulally◦ Former VP of Boeing and CEO of Boeing
Commercial◦ Engineer credited with BCAs revival in early 2000’s◦ Mortgaged company in 2006 for $23.6 Billion◦ Successful negotiations with UAW
Reduced Labor cost per hour by ~ 28%
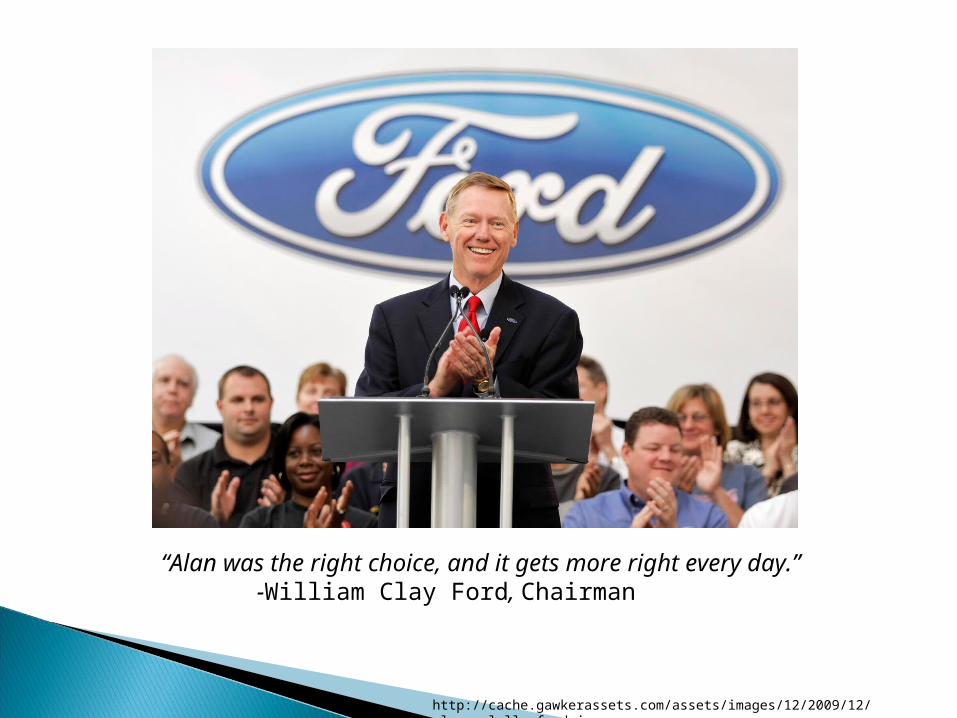
“Alan was the right choice, and it gets more right every day.”-William Clay Ford, Chairman
http://cache.gawkerassets.com/assets/images/12/2009/12/alan_mulally_ford.jpg

Source: Capital IQ
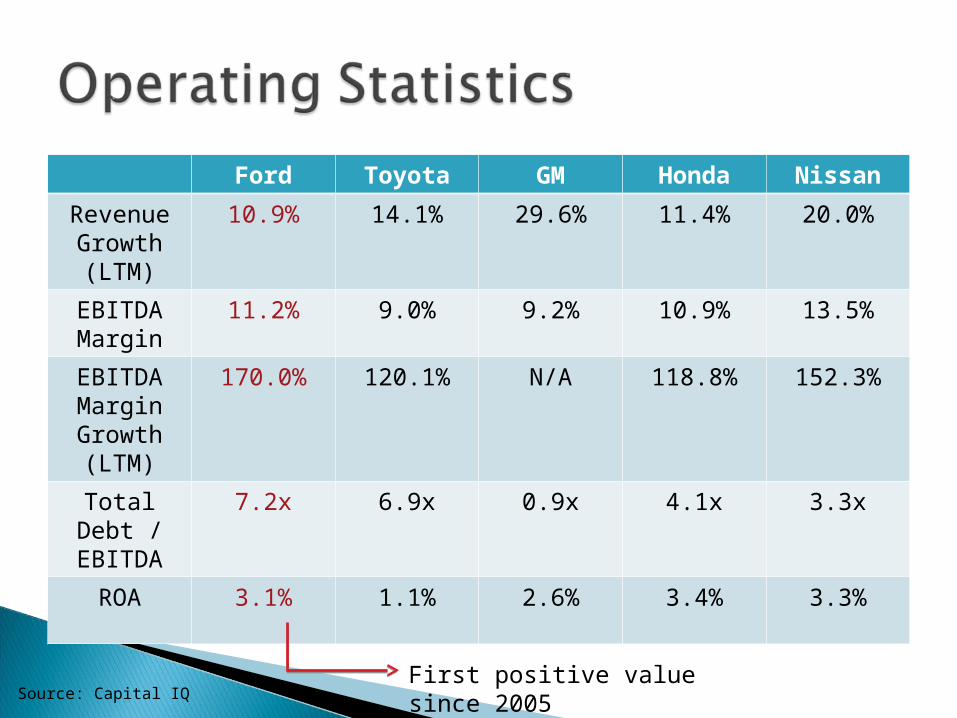
Ford Toyota GM Honda Nissan
Revenue Growth (LTM)
10.9% 14.1% 29.6% 11.4% 20.0%
EBITDA Margin
11.2% 9.0% 9.2% 10.9% 13.5%
EBITDA Margin Growth (LTM)
170.0% 120.1% N/A 118.8% 152.3%
Total Debt / EBITDA
7.2x 6.9x 0.9x 4.1x 3.3x
ROA 3.1% 1.1% 2.6% 3.4% 3.3%
First positive value since 2005Source: Capital IQ

Ford Toyota GM Honda Nissan
P/E 9.49x 20.69 11.37 9.33 10.67
TEV / EBITDA
9.57x 9.79 3.44 7.29 5.36
Mkt Cap / Revenue
0.46x 0.52 0.38 0.58 0.35
P/E TEV/EBITDA P/S
Max 20.69 9.79 0.58
Mean 13.01 6.47 0.46
Min 9.33 3.44 0.35
Source: Capital IQ

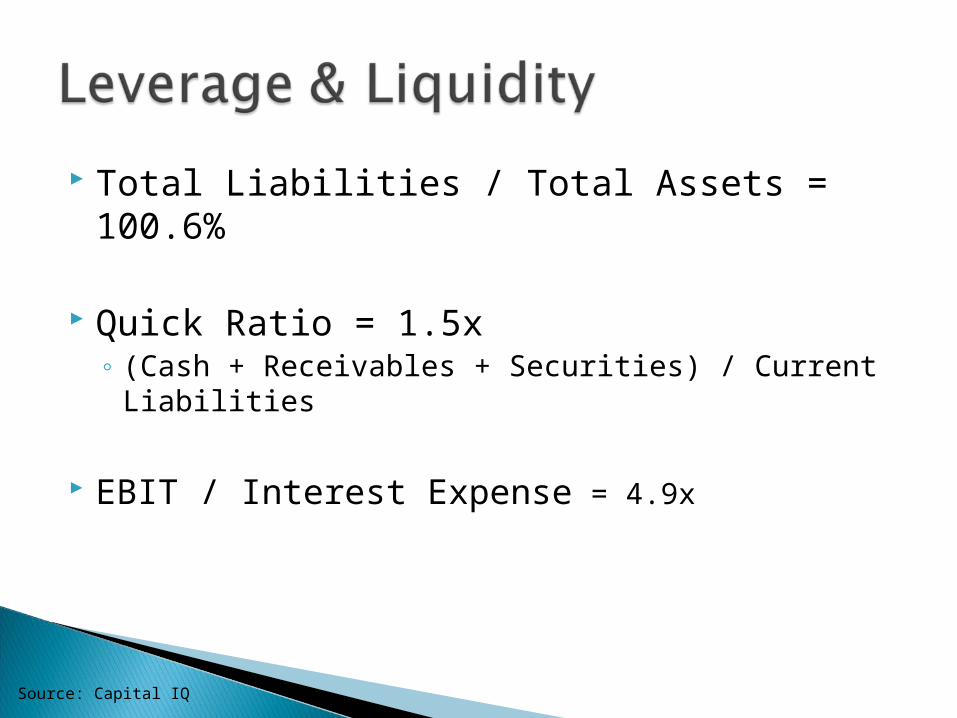
Total Liabilities / Total Assets = 100.6%
Quick Ratio = 1.5x◦ (Cash + Receivables + Securities) / Current
Liabilities
EBIT / Interest Expense = 4.9x
Source: Capital IQ

Breakdown of Debt
Source: Ford 10k

Debt Repayment Schedule
Source: Ford 10k

Potential Market Movers◦ Return to Investment grade debt status◦ Resumption of dividend
Increasing Nationalism◦ Ford is linked to national psyche◦ Highest brand loyalty in the United States
No Bailout◦ Increases goodwill with investors & consumers◦ Proven (or lucky) financiers

Short-Term◦ Supply Chain disrupts production at two plants
Mustang, Super Duty F-Series, Expedition / Navigator Increased costs due to search for new suppliers
Long-Term◦ Provides opportunity to gain and hold market
share in the small car market◦ Loss of sales by competitors could force industry
capacity shrinkage Average car price increases, margins improve

2005 2006 2007 2008 2009US 17.5 17.1 16.5 13.5 10.6Europe 17.6 17.8 18.0 16.6 15.8South America
2.7 3.2 4.1 4.3 4.2
Asia 17.3 18.6 20.4 20.9 24.5
40. 00%
42. 00%
44. 00%
46. 00%
48. 00%
50. 00%
52. 00%
54. 00%
56. 00%
2005 2006 2007 2008 2009
CarTruck
Source: Ford’s 10K
Industry Sales Volume

US: 15.3% Europe: 10.4% South America: Approximately 15% Asia Pacific: 2%
◦ Emphasis of expansion efforts
Source: Ford’s 10K

Source: Ford’s 10K
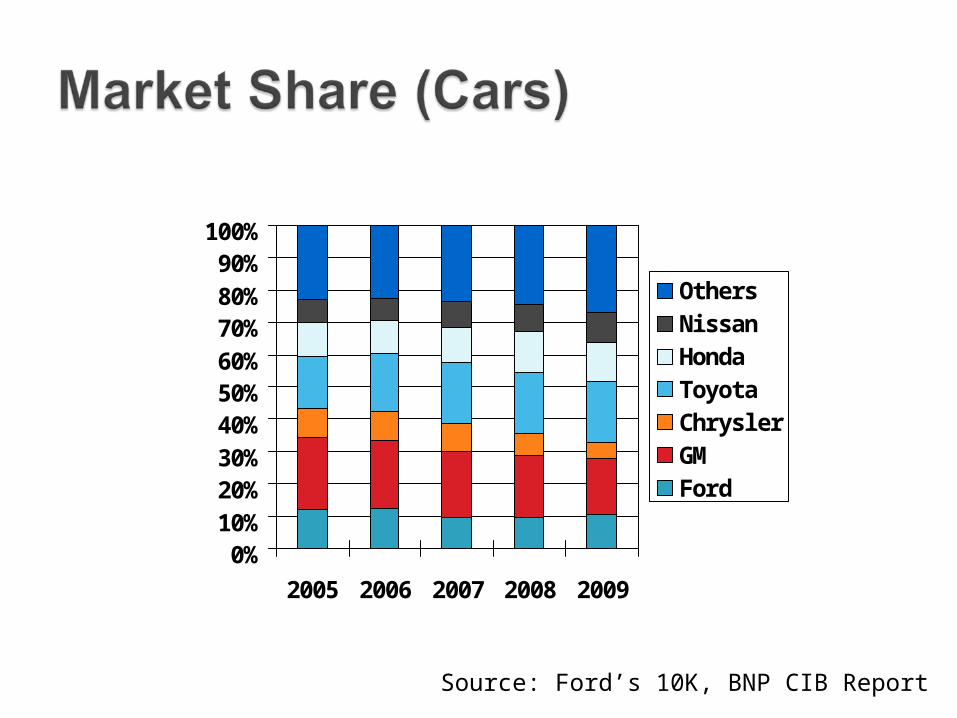
0%10%20%30%40%50%60%70%80%90%
100%
2005 2006 2007 2008 2009
OthersNissanHondaToyotaChryslerGMFord
Source: Ford’s 10K, BNP CIB Report

0%10%20%30%40%50%60%70%80%90%
100%
2005 2006 2007 2008 2009
OthersNissanHondaToyotaChryslerGMFord
Source: Ford’s 10K, BNP CIB Report

3 Parts
1 Long Term Debt: YTM on current issued note
2 Short Term Debt: Revolving loan rate
3 Cost of Equity: CAPM using both raw beta and industry’s beta


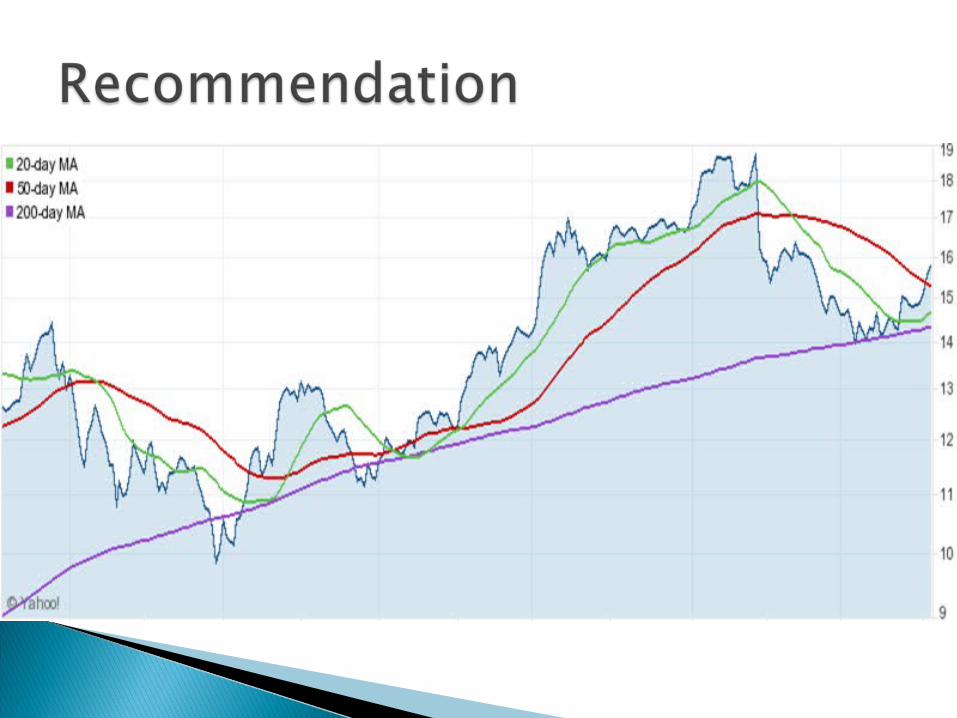
Place order for 300 shares at $14.95◦ Limit, good through 5-3-2011