annual report 2007-qk5 - coventry building society
TRANSCRIPT


CONTENTS1 Performance Highlights2 Chairman’s Statement4 Five Year Highlights5 Chief Executive’s Review10 The Directors and Secretary12 Directors’ Report20 Risk Management Report26 Directors’ Report on Corporate Governance32 Directors’ Remuneration Report37 Statement of Directors’ Responsibilities38 Independent Auditors’ Report40 Income Statements40 Statements of Comprehensive Income 41 Statements of Financial Position42 Statements of Changes in Members’ Interests43 Statements of Cash Flows44 Notes to the Accounts90 Annual Business Statement95 Glossary
ChairmanDavid Harding
Deputy Chairman and Senior Independent DirectorBridget Blow
Chief ExecutiveDavid Stewart
Executive directorsColin Franklin, Sales and Marketing DirectorJohn Lowe, Finance Director
Non-executive directorsRoger BurnellIan GedenIan PickeringFiona SmithGlyn Smith
Secretary and General CounselGill Davidson
Senior ManagementJulian AtkinsPeter ElcockRachel HaworthDarin LandonSally Wrigglesworth
AuditorsErnst & Young LLP1 More London PlaceLondon SE1 2AF
BankersBank of EnglandHSBC plcThe Royal Bank of Scotland plc
Registered OfficeEconomic HousePO Box 9High StreetCoventry CV1 5QN
This document is printed on 9 Lives 80 Silk which isproduced using 80% recovered fibre comprising 10%packaging waste, 10% best white waste, 60% de-inked waste fibre and 20% virgin TCF fibresourced from sustainable forests.

PERFORMANCE HIGHLIGHTS 2011
1
Strongly profitable
£84.6mProfit before FSCS levy and merger related
items increased by 12% over 2010.
(Operating profit after impairments and before exceptional items)
Net interest margin
0.72%Just 0.72%, reflecting the benefit to
members of sector leading cost-efficiency.
(Net interest income/Average total assets)
The most cost-efficient society
0.37%Spending just 37p for every £100 of assets,Coventry is the most cost-efficient building
society reported in the UK.
(Administrative expenses, depreciation and amortisation/Average total assets)
Very low impairments
0.05%Amongst the lowest level reported by any major
bank or building society.
(Impairment losses on loans and advances to customers/Average loans and advances to customers)
Increased lending
£4.0bnGross mortgage lending equivalent to 17%
of all mortgage advances by building societies and mutual lenders.
Supporting homeowners
£1.7bnNet mortgage lending equivalent to 18% of
total growth in mortgage balances in the UK.
Record mortgage market share
£19.2bnCoventry’s share of total UK mortgage stock
has increased by two thirds since 2006.
Growth in member savings
£1.4bnGrowth in 2011 represents double the
Society’s natural market share.
Record savings market share
£19.0bnRecord share of total UK savings, increasing
balances by over 130% since 2006.
Fully funded loans
104%All loans funded by savings and reserves.
Capital resources
£974mMember reserves and other capital
resources increased by £58m, providing security to members.
(Equity, subordinated liabilities and subscribed capital)
The highest capital ratio
22.8%The highest core tier 1 ratio reported by any major high street bank or building
society.

2
Last year I reflected that 2010 might be seen as a period of relative calm before the developing sovereign debt crisisheightened economic uncertainties, bringing about thepossibility of a second credit crunch and a return torecession across Europe.
Unfortunately this concern was well-founded. As we enter2012, Government plans to reduce the UK budget deficit arebeing threatened by weaker economic growth, withreductions in revenue exacerbated by increased welfareexpenditure as unemployment rises.
This difficult domestic environment is compounded by theongoing crisis in the eurozone. At the end of 2011 the risk of sovereign debt default was already restricting thefunctioning of wholesale markets leading to concerns of afurther credit squeeze.
As the economic crisis moves to its next phase, likely to becharacterised by a sustained period of low growth, lowinterest rates and higher levels of unemployment, it isappropriate to review the performance of Coventry BuildingSociety, not only in 2011 but for the five years since the firstonset of the financial crisis in 2007.
The important point is that in 2011, as in the whole of thisperiod, the Society delivered extremely strong results. Thiswas achieved at a time of significant organisational changeas the merger and integration of Stroud & Swindon BuildingSociety was completed on time and within budget. Thisproject has greatly enhanced the service offering tomembers. To achieve this whilst maintaining our normalmortgage and savings activity reflects great credit on thoseinvolved.
The Chief Executive’s Review explains the 2011 performancein detail. I will focus on the longer term performance whichI believe underlines the role that building societies, withsufficient clarity of strategy and excellence in execution, arecapable of playing in the savings and mortgage market.
Over the five years of the credit crisis1, during which timethe new mortgage lending market contracted from £345 billion per annum to £141 billion per annum, theSociety has lent £17.5 billion, maintaining a positive netlending position in every single year. Coventry is the only topten building society to have increased its asset size in eachone of the last five years.
Our share of net advances increased during this periodfrom 0.8% to over 18% simply because we have been able to continue lending at a time when many of our peers orlarger competitors have been unable to do so. As a result,our share of total mortgage stock has increased by twothirds.
The fact that this has been achieved without any diminutionin the quality of lending is shown by the low level of arrearsand defaults on the mortgage book, with 3 month arrearssignificantly less than half the industry average2 andimpairment charges that remain amongst the lowestreported by large mortgage lenders.
In addition, the Society has maintained strong credit ratingsas recognised by major rating agencies, Fitch Ratings (A)and Moody’s (A3). At the end of the period, the Society’s coretier 1 ratio was 22.8%, the highest reported of any majorbuilding society, or indeed large mortgage lender.
The total organic growth in savings balances in the fiveyears from the start of 2007 has been £8.6 billion (excluding£2.2 billion of balances acquired through the merger withStroud & Swindon Building Society).
This performance represents the highest reported rate oforganic growth in market share of any top ten buildingsociety. It is also worth highlighting that the Society’sfunding position has been further strengthened throughoutthe period by repeated success in accessing wholesalemarkets, raising in excess of £2 billion over the last fiveyears, including inaugural covered bond issuances in 2011.
CHAIRMAN’S STATEMENT

3
The Society has continued to invest in its systems, itsbranches and offices and in its people. In 2006 I reportedthat the Society’s cost to mean asset ratio was the lowest inthe building society sector at 0.53%. It is highly significantthat Coventry has continued to be the best-performingsociety in this regard in every subsequent year, with the costto mean asset ratio now lowered to just 0.37%. This is aconsiderable achievement given the substantial investmentwe have made to keep up with the changing requirementsof the financial regulators.
I am particularly pleased that the Society’s remarkableperformance since 2006 has also been marked by anincrease in the support to local communities and nationalcharities alike. The Society has undertaken successfulpartnerships with RNIB, Macmillan Cancer Support, Age UK and The Royal British Legion, supported nationalfundraising events including Children in Need and ComicRelief and, possibly most importantly, provided volunteersand financial help to numerous local community groups.
The Society continues to be active in promoting greaterunderstanding of personal finance amongst localschoolchildren and has extended this support to adults viapartnerships with local advice centres.
The passion and commitment shown by members of staff insupporting these initiatives shows very well the type oforganisation we aim to be.
In my opinion, the Society’s performance throughout thisperiod has been outstanding. The core values in whichCoventry has always believed as a member focusedtraditional building society, providing a safe home forsavings and maintaining a cautious approach to lending, arenow recognised widely as a sound basis for a robustbusiness model. It will come as no surprise, therefore, thatI, and the rest of the Board, remain unanimous in believingthat Coventry should stay an independent mutual buildingsociety.
This outstanding performance over the last five years is alsoa tribute to the executive management. Since 2006 half ofthe 20 largest building societies in the UK have lost theirindependence and some of the largest banks in the countryhave failed. As I consider the cost of these failures in termsof declining competition and choice, in terms of individualuncertainty or the loss of livelihoods, I am struck by theoften understated contribution that Coventry’s successrepresents.
As the UK economy faces further years of low growth andausterity measures – the “lost decade” we see increasinglydiscussed by analysts and media alike – the need for arobust and secure financial organisation, providing a safehaven for savings and mortgages for people to buy andmove home, has never been greater. In this uncertaineconomic environment, I take confidence from the Society’soutstanding record and believe that it remains well placedto serve both its borrowing and savings members.
I should like to thank the executive team and every memberof staff for the commitment and skill they have shown inensuring the continued success of Coventry BuildingSociety.
David HardingChairman
1 From 31 December 2006 to 31 December 2011.2 Council of Mortgage Lenders (CML).

4
FIVE YEAR HIGHLIGHTS1 January 2007 to 31 December 2011
Strongly profitable
£309.7mProfitability remained strong throughout theperiod, adding significantly to the capital and
reserves of the Society.
(Profit before tax for the years ended 2007 to 2011)
Increased mortgage lending
£17.5bnContinued lending as competitors cut back,
increasing the Society’s share of the newmortgage lending market from 0.85% to 2.81%.This resulted in the Society becoming a top tenlender for the first time in 2008, a position it has
retained in each subsequent year.
Growth in mortgage balances
£9.2bnThe Society’s share of UK net lending
increased from 0.8% in 2006 to over 18% in both 2010 and 2011. This resulted inthe largest reported organic increase
in market share of a top ten building society.
Growth in member savings
£10.8bnCoventry grew organically its share of the totalsavings market at a faster rate than any otherlarge building society, with savings balances
rising to a record £19.0 billion.
Growth in assets
£12.2bnCoventry is the only top ten building society to
grow its assets and report a profit in each of the last five years.
Very low impairments
0.08%These continue to be amongst the lowest level
reported by any major bank or building society.
(Five year average of impairment losses on loans and advances to customers/Five year average loans and
advances to customers)
The most cost-efficient society
0.53% to 0.37%Coventry was the most cost-efficient major
building society in each of the last five years,lowering the cost to mean asset ratio from
0.53% to 0.37%. This means we spend 37p for every £100 of assets - the best everperformance reported by any UK building
society.
(Administrative expenses, depreciation andamortisation/Average total assets)
Strengthened capital
£974mThe Society added £240m to its capital
reserves during the period. At 22.8%, Coventryhas the highest reported core tier 1 ratio of any
major high street bank or building societyhighlighting financial strength and high quality
assets.
(Equity, subordinated liabilities and subscribed capital)
Highly rated
‘A’ ratedCoventry Building Society is ‘A’ rated by Moody’s
(A3) and Fitch (A) and has remained sothroughout the period. Its underlying Bank
Financial Strength Rating is second only to onehigh street UK bank and no UK building society
is higher rated using this measure.
Committed to communities
£6.5m plusOver £6.5m has been donated to community and
charitable activities, including £5.6m to The Royal British Legion’s Poppy Appeal.
Investing in people
GoldThe Society has been assessed by Investors in
People at Gold status. Coventry is one of the firstretail financial services organisations to have
received this recognition.
FOS complaints table
0Coventry has not appeared in any of the tables of
complaints published to date by the FinancialOmbudsman Service (FOS), because too few
complaints have been referred. It is the largestUK mortgage lender never to have appeared.

5
I am pleased to report that Coventry Building Societyonce again recorded an outstanding annualperformance, sustaining a track record of success thathas set it apart from its peers since the financial crisisbegan in 2007.
In 2011, the Society continued to operate at levels wellabove its natural market share, recording furthersubstantial growth in mortgages. A similar increase inthe Society’s share of the savings market was achieved,demonstrating our strength in growing retail depositssignificantly in a very competitive environment.
Underlying profitability1 also increased, reflectingcontinued control of costs and low levels of provisions.
When I reflect on the reports I have written sincebecoming Chief Executive I am reminded of theconsistency of their content, during periods that extendfrom favourable conditions to the very difficult times wehave experienced more recently.
This consistency is not to be underestimated. It is a sadfact that in the five years since the credit crisis beganhalf of the top 20 building societies have lost theirindependence.
The outstanding ability of the Society to perform sostrongly in this environment is underpinned by its simplebusiness model and an unequivocal responsibility forserving the interests of its members. I believe that theSociety’s mutual status, and our resolve to manage thebusiness accordingly, has been a key factor in thissuccess.
The aim to retain balance between saving and borrowingmembers, without the demands of externalshareholders to maximise profit, enables a consistentlong-term view and, most importantly, moderates therequirement for risk-taking.
It promotes fairness, security and value as its keyattributes. A focus on cost-efficiency whilst meeting theservice expectations of members supports these goals.
However, it is the successful execution of this businessmodel over many years that underpins Coventry’sstrength and in particular our ability to maintain controlof risk, margin and cost that is the root of our consistentsuccess.
This consistency can be seen clearly in our mortgageperformance. Although our share of the mortgagemarket has increased significantly in the last five yearsto record levels, this is largely the result of maintaininglending volumes in a contracting market.
In 2011, the Society advanced £4.0 billion (2010: £3.5 billion). This equates to around 17% of all buildingsociety and mutual advances, whilst in net lendingterms, the Society achieved over 18% of the total UKmarket, broadly maintaining the share we reported lastyear (2010: 20%).
For the fourth consecutive year, we expect to be one ofthe top ten mortgage lenders in the UK, a performancewhich was achieved for the first time in 2008. Thisposition, for a business that in 2007 had a nominalmarket share of just under 1%, demonstrates veryclearly not only the reduction of lending capacity overthe last few years, but our success in maintaininglending volumes at pre-credit crisis levels.
In these conditions it is critical that we continue to focuson high quality business. In this, the constraintsexperienced by a number of our competitors have beento our advantage and I am pleased to confirm thatCoventry’s lending in 2011 was once again concentratedin low risk sectors.
CHIEF EXECUTIVE’S REVIEW
1 Underlying profitability refers to ‘Operating profit after impairments andbefore exceptional items’.

6
CHIEF EXECUTIVE’S REVIEW (continued)
It is important that our lending remains sustainable andprudent. We have avoided those high risk sectors thathave resulted in significant losses elsewhere. Coventryhas not undertaken commercial or second chargelending, and our exposure to unsecured lending isinsignificant.
This prudent and responsible approach is in the interestof individual borrowers and the Society as a whole. Theresults are shown by an arrears performance whichremains significantly better than for the industry andhas improved in the last 12 months. As at 31 December2011, only 0.79% of mortgage balances were 2.5% ormore in arrears, below the equivalent figure for thecombined Coventry and Stroud & Swindon societies in2010, and below the Coventry figure of 2009.
The corresponding figure for the performance of theenlarged Society judged against the FSA’s latestpublished view of the industry remains 44% of industryaverage (30 September 2011).
It is a similar position when considering numbers ofaccounts rather than balances. Just 0.56% of Coventrymortgages were more than six months in arrears, onceagain very substantially less than the industry averageas reported by the Council of Mortgage Lenders (1.12%).
There were just 94 properties in possession at the end of2011 (2010: 107), from a total population of around185,000 accounts.
The Society’s buy-to-let lending also significantlyoutperforms the industry average and consistentlyperforms as well as owner occupied mortgages of thesame loan to value (LTV). As LTVs for buy-to-let loansare restricted below those we would provide for owner-occupiers, this means that arrears on our buy-to-letlending are lower than for any other class of business.
The quality of the mortgage lending, which is both ameasure of the strength of the Society and ademonstration of the values on which it is based, ishighlighted by the low level of impairments that areamongst the lowest reported by any of the larger UKmortgage lenders. I expect this to continue with anaverage LTV advanced in 2011 of just 55.6%. The averageLTV, as adjusted for changes in house prices, of theoverall mortgage book is just 50%.
The capability to maintain the Society’s lendingperformance relies upon attracting and retaining funds.Coventry has an unrivalled record amongst its peergroup of building societies in achieving significantorganic savings growth throughout the economicdownturn.
In the four years, 2007 to 2010, the Society grew retailsavings balances organically by £7.2 billion, and added afurther £2.2 billion through the merger with Stroud &Swindon Building Society. In 2011, we again performedextremely strongly and grew savings deposits by afurther £1.4 billion.
Another strength of the Society has been our continuedaccess to wholesale funding. We are one of only twobuilding societies that have successfully accessed thesenior public unsecured markets during the creditcrisis. In 2011 we built on the success of unsecuredbond issuances in 2009 and 2010 by launching our firststerling covered bond in April. This long-term bondraised £750 million and was followed in October by ourfirst euro-denominated covered bond for which weissued €650 million.
The pricing on both deals was not only advantageous incomparison with the acquisition of retail funds, butcompetitive when compared with similar transactionscompleted by much larger institutions. The high level ofdemand and the price achieved shows the confidencethat investors have in the Society and in particular thestrength of our financial position.
7
Coventry’s extremely strong funding position, which isbased on the successful acquisition of retail depositssupported by continued access to wholesale investors,brings long-term competitive advantage supporting bothfuture growth and ongoing benefit to members in theform of well-priced savings and mortgages.
A further source of strength stems from our rigorousfocus on cost-efficiency. Undoubtedly our continuedgrowth supports this and I am pleased to report that in2011 we expect to retain our position as the most cost-efficient society in the UK.
In 2011 we completed the full integration of Stroud &Swindon Building Society. It is my belief that completingthe integration more quickly than seems usual in thistype of merger was the right thing for our members. Theintegration has brought practical benefits and minimiseddisruption to services, and also allowed us to return ourfocus to our core activities. It has been very successful,demonstrating the Society’s capability to manage largeprojects whilst still meeting ambitious growth objectivesand reflects great credit on all the staff involved.Improved income and low costs combined to produce anincrease in operating profit before impairments andexceptional items to £94.5 million.
The outcome of this year’s excellent performance is afurther substantial growth in profitability. Discountingthe provision we have made for the Financial ServicesCompensation Scheme to compensate for the mistakesof others, the charitable donation to the Poppy Appealand the exceptional items recorded in 2010 and 2011 asa result of the merger with Stroud & Swindon, theprofits of the Society rose from £75.3 million to £84.6 million, increasing by over 12%.
This is the highest recorded by the Society, exceedingprevious records in 2009 and 2010. The benefits are
clear as, following provisions for tax, we were able totransfer £46.6 million to the Society’s reserves, furtherincreasing our long-term capital strength.
At a time when the capital requirements of financialorganisations remain a subject of some debate, it isworthy of note that Coventry also retains the highestreported core tier 1 ratio of any major high street bankor building society at 22.8%.
We must never forget that the foremost responsibility ofa building society is to protect the interests of membersand, particularly during times of economic turmoil, thismeans providing financial security.
The strong capital position of the Society, reinforced byour ongoing profitability, is central to this. It underscoresthe prudence of our lending and our approach to newopportunities. Our responsibility to the membership willalways be paramount in investigating, and then pursuingor withdrawing from, potential opportunities, whether itis Stroud & Swindon or Northern Rock.
If our member focused approach drives decision-makingacross all the activities of the Society, the judgement onthese decisions is shown by the ratings afforded by thetwo credit agencies that review the building societysector closely.
It has been a significant year in this regard. Theeconomic turmoil continued to focus the attention ofFitch Ratings and Moody’s Investor Services on theinherent strength of organisations and during 2011 alarge number of banks and building societies have beendowngraded.
I am pleased to say that Coventry is not one of them.The Society has maintained its ‘A’ class rating from bothagencies (‘A’ and ‘A3’). Indeed, in 2011 we were one ofjust three major UK banks and building societies not to

8
CHIEF EXECUTIVE’S REVIEW (continued)
have a negative action taken by one or both of theseagencies, and we are the only building society that canmake this claim. This is a significant endorsement of thefinancial strength of the Society based on our excellentasset quality, our ability to fund mortgage growth andour cost-efficiency. We are now seeing the benefit of aconsistent, stable and positive rating which differentiatesus from our competitors and may well influenceindividual savers as well as organisational investors.
Particularly telling was the review conducted by Moody’sin 2011, which in October led to the reduction of uplift toinstitutions’ ratings as a result of assumed systemicsignificance and hence central bank support. This actionled to 12 UK banks and building societies beingdowngraded, with the Society unaffected. If the benefit ofpotential central bank support is removed from ratings,and the underlying Bank Financial Strength Rating(BFSR) compared, only one UK high street bank has ahigher BFSR than Coventry. No building society is higherrated using this measure.
I have talked at length about the strength of theSociety’s financial performance in 2011, based on theconsistent application of a member-focused strategy.This focus drives all aspects of our activities and during2011 we have continued to invest in developing theservice we offer our members.
An important part of this is listening to what memberstell us and acting on what they say. In 2011 wecompleted a rotation of our Members’ Council, thevoluntary committee of members that meets quarterlyto discuss the performance of the Society and givesvaluable input to our ongoing developments.
In the three years the Council has been operating, we have had many useful conversations with the 12inaugural members, who have given their views, goodand bad, on all aspects of the Society from our product
portfolio to the development of our online and telephoneservices.
Whilst it is sensible to recruit new members to theCouncil to broaden the perspective and promotecontinual challenge, I would like to thank all those whohave taken part to date. They have proved the value ofthis forum and have served the Society and their fellowmembers extremely well. I look forward to working withthe new Council in the coming months.
In addition to maintaining our programme of roadshows,which provide an opportunity for members to meet stafffrom the counter to the Board, we have expanded ourcustomer research to encompass surveys of branch,telephone, online and intermediary customers.
The results have been invaluable, particularly as we lookto enhance the efficiency of the way we serve memberswhilst meeting their expectations in the service theyreceive. This has been particularly relevant in thedevelopment of our telephone system which wasreceiving mixed feedback a year ago. As a result wechanged our approach to ensure quick and simpleaccess to an advisor, and this has proved a verywelcome step forward.
I believe this example demonstrates clearly the ethos ofthe Society. If we don’t get something right first time,our aim is to resolve it quickly, to our members’satisfaction.
The proof of this approach lies in our record oncomplaints. The number of complaints per customerreported by the Society is amongst the lowest of anylarge bank or building society.
For those complaints that cannot be resolved to thecustomer’s satisfaction, the Financial OmbudsmanService (FOS), is the final arbiter of disputes and it

9
publishes tables of complaints referred to it. Our aim totreat customers fairly is borne out by the FOS statisticswhich report the number of complaints referred to it in asix month period. Since FOS first published, in 2009, sixmonthly tables of total complaints received, Coventryhas yet to appear. This is because we simply do not haveenough referred complaints to register and we arecomfortably the largest high street bank or buildingsociety to be able to say this.
Naturally the combination of significant business growthand an approach which puts members’ interest at thecentre of our decision-making is also recognised in theindependent awards the Society won in 2011.
The ones that stand out are those that are based on theexperience of customers. I was particularly pleased thatthe Society was named the ‘Best Regional BranchNetwork’ by Your Money, nominated by its readers andjudged by an extensive mystery shopping exercise. Ourbranch network is more than a service channel. It is partof the fabric of our local communities and fulfils anessential role in the lives of thousands of our membersevery week.
Equally it was very good to be recognised for ourmortgage performance by people who know better thanmost how difficult the market has been. Your Mortgageawarded Coventry its ‘Best Building Society’ awardbased on the views of intermediaries and their clients.The Society appreciates very well the role intermediariesplay in helping their customers through the complexitiesof buying and moving home, and we will continue tosupport them by offering competitive products andservice based on fairness and expertise.
Recognising the impact of today’s uncertain economicenvironment on the Society, it is sobering to reflect onthe impact on individuals and communities.
We must do all we can to support the work ofcommunity groups and charities who make such adifference to people’s lives.
In 2011, the Society supported through its maturingprogramme of community activity, around 260 charitiesand community groups. Members of staff gave theirtime, expertise and enthusiasm in raising funds anddirectly volunteering for a wide variety of organisationsranging from local charities to raising over £40,000 forChildren in Need.
We can also use our expertise to support charitiesdirectly through the provision of affinity products. I havetalked about the success of our partnership with TheRoyal British Legion before, but with the total fundsdonated to the Poppy Appeal since 2008 now in excess of£5.6 million, it is clear how important this initiative hasbecome to supporting its vital work.
The need to promote greater understanding of personalfinance has never been more relevant. The work we doto encourage greater financial literacy amongstschoolchildren continues to be a priority and the resultsare proving to be extremely positive.
Helping the next generation to understand and preparefor the difficulties of the current environment providesan interesting challenge as I look forward to the yearsahead.
As the UK and international economies adjust to a newreality reflecting a reduction in the availability ofaffordable credit, organisations and individuals must dothe same. The age of austerity may well be a long-lasting phenomenon.
In such an environment, traditional values count. I havesaid, many times now, that the Society has the rightbusiness model to succeed with its emphasis onprudence, responsibility and fairness.
The performance of the Society over the last five yearshas shown this to be the case and I remain confidentthat it will be able to maintain this outstanding record in2012 and beyond.
David StewartChief Executive

10
THE DIRECTORS AND SECRETARY
BRIDGET BLOW, DEPUTY CHAIRMAN ANDSENIOR INDEPENDENT DIRECTOR (62)Bridget Blow has been a non-executive director since 2007.As an experienced company director, Bridget has a stronginformation technology background, having been ChiefExecutive of ITNET plc. She is a past president of theBirmingham Chamber of Commerce and Industry and a non-executive director of Birmingham Hippodrome.
Bridget was a non-executive director of the Bank of Englandbetween 2000 and 2005.
She is Chairman of Trustmarque Group and HarvardInternational plc.
Bridget became the Society’s Deputy Chairman in 2009. She isalso Senior Independent Director, Chairman of the Society’sRemuneration Committee, a member of the Board AuditCommittee and the Nominations and Governance Committee.
ROGER BURNELL (61)Roger Burnell joined the Board as a non-executive director in2008 and is a Chartered Accountant with over 25 years’senior executive experience. He worked as Finance Directorand Managing Director of several businesses within theThomson Travel Group before becoming Group ChiefOperating Officer in 1998.
Since retiring from his executive roles Roger has continued to work at Board level through a number of non-executivedirectorships, including previously as Chairman ofInternational Life Leisure Group, Chairman of The FirstResort and Chairman of HomeForm Group.
Roger is currently Senior Independent Director of ThomasCook Group plc and a member of the Society’s Board RiskCommittee and the Remuneration Committee.
GILL DAVIDSON, SECRETARY ANDGENERAL COUNSEL (46)Gill Davidson is a qualified solicitor and joined the Society in2011 following over 10 years working in financial services.She started her career at Pinsent & Co. in Birmingham in1987 and has subsequently undertaken a number of differentroles, including Secretary to another building society, beforejoining the Society.
Gill is the principal legal advisor to the Board and is alsoresponsible for compliance oversight of regulatory conductrisk and governance. In addition to her role as a member ofthe senior executive team she serves as Secretary to theBoard and all its Committees and is also Secretary to theTrustees of the Society's pension scheme.
COLIN FRANKLIN (56)Colin Franklin joined the Society over 30 years ago and hasheld line management responsibility for a number of areasincluding the branch network, operations and sales.
Joining the Society’s executive team in 2005, Colin wasappointed to the Board as Director of Sales and Marketing in2009, with responsibility for sales operations, distribution,product development and marketing. He is also ManagingDirector of Godiva Mortgages Limited, the Society’sintermediary lending subsidiary.
IAN GEDEN (58)Ian Geden has been a non-executive director since 2008. Heis a member of the Board Audit Committee and theRemuneration Committee.
Most of his 30 years’ financial services experience has beenin the mutual sector, including NFU Mutual where he wasChief Executive before retiring at the end of 2008. Ian wasalso Vice Chairman of the Association of British Insurers(ABI) and was Chairman of the Association of MutualInsurers. Ian is a non-executive director of The Police Mutual.
DAVID HARDING, CHAIRMAN (64)David Harding joined the Board as a non-executive director in1996, becoming Deputy Chairman in 1999 and Chairman in2005. He is also Chairman of the Nominations & GovernanceCommittee and a member of the Remuneration Committee.
Holding an Economics degree from the University ofNottingham and a Masters degree from NottinghamBusiness School, David is a Fellow of the Chartered Instituteof Management Accountants and has experienced a widecareer in finance. His career included board positions withseveral major listed companies including Railtrack plc,Rugby Group Plc and T&N plc. He was Chairman of PD PortsPlc until 2006.
David is Senior Independent Director of Enterprise Inns plcand a non-executive director of the Royal Mint. He is a localmagistrate and Deputy Chairman of the Bench.

11
JOHN LOWE (39)John Lowe joined Coventry in 2007, initially to manage theCorporate Planning and Product Development functions,before assuming the role of Deputy Finance Director in2009. He has been a member of the Society’s Board since2010 when he was appointed to the role of Finance Director.
A graduate of Oxford University and a CharteredAccountant, having qualified with Deloitte, John has over 15 years’ experience of financial services gained across abroad range of businesses. He is a member of the BoardRisk Committee.
IAN PICKERING (56)Ian Pickering joined the Society’s Board as a non-executivedirector in 2005. He is a qualified Chartered Accountant.
Ian has worked in senior positions in the engineeringindustry for much of the last 25 years and was formerly aChief Executive of Manganese Bronze Holdings plc. Prior tothis he was a director of the Dennis Group plc.
Ian is a non-executive director of Latchways plc andBedford Hospital NHS Trust, whose Audit Committee hechairs, and is a member of the Council of CranfieldUniversity. He is a member of the Auditing Practices Boardof the Financial Reporting Council.
Ian is Chairman of the Society’s Board Risk Committee andChairman of the Models & Ratings Committee. He is also amember of the Board Audit Committee.
FIONA SMITH (53)Fiona Smith joined the Board as a non-executive director in2002. Fiona is a Solicitor and was General Counsel andCompany Secretary of Severn Trent plc from 2006 until2011. Prior to this she was General Counsel and CompanySecretary at National Grid plc, where she worked for 15 years, and then at Transport for London.
Fiona is a member of the Board Risk Committee and theRemuneration Committee.
GLYN SMITH (59)Glyn Smith joined the Board in 2010, following the mergerwith Stroud & Swindon Building Society, where he was alsoa non-executive director. He has over 30 years’ experiencein the financial services sector, most notably as a seniorexecutive at Barclays Bank PLC and as Finance Director ofPortman Building Society.
Glyn is a graduate of the University of Cambridge, aChartered Accountant and member of the examinationsteam for the Institute of Chartered Accountants in Englandand Wales.
Since 2003 he has worked at board level through a numberof non-executive directorships, including Domestic &General Group PLC, Covent Garden Market Authority andtwo Primary Care Trusts.
Glyn is Chairman of the Board Audit Committee and amember of the Board Risk Committee.
DAVID STEWART, CHIEF EXECUTIVE (46)David Stewart is a graduate of Warwick University andqualified as a Chartered Accountant with KPMG. In 2002 hejoined the Board as Finance Director, before assumingBoard responsibility for the Sales and Marketing functionsin 2004. He was appointed Chief Executive in 2006.
Prior to joining the Society, David gained financial servicesexperience at DBS Management plc where he was GroupFinance Director and then Group Chief Executive.
David is Deputy Chairman of the Building SocietiesAssociation and is a member of both the Chairman’s andExecutive Committees of the Council of Mortgage Lenders.
He is a member of the Board Risk Committee and theNominations and Governance Committee.

12
BUSINESS OBJECTIVES AND ACTIVITIESThe Society’s principal objective is the provision of a range ofpersonal financial services including mortgage finance forhouse purchase and improvements, savings, investmentproducts and insurance.
The directors consider that all activities carried out during theyear were within the powers set out in the Memorandum of theSociety.
BUSINESS REVIEWThe Society recorded an excellent performance in 2011,maintaining a record of achievement over a period of sustainedeconomic challenge.
The Society’s ability to enhance its strong funding position, tolend responsibly, to retain its sector-leading cost-efficiency andto remain strongly profitable in each of the five preceding yearsof credit crisis, recession and uncertainty constitutes one of thestrongest performances reported by a UK bank or buildingsociety. The Society is the only top ten UK building society torecord organic mortgage and savings growth each year.
Coventry Building Society has provided a safe and secure homefor its growing membership. The confidence that individualsavers and borrowers have in the Society is reflected by creditrating agencies and the support of institutional investors. TheSociety has been ‘A’ rated throughout the economic downturn(Fitch ‘A’, Moody’s ‘A3’), and Moody’s 2011 review rated its BankFinancial Strength Rating second only to one UK high streetbank with no other building society being more highly rated.
The Society’s business performance is reviewed by theChairman (pages 2 and 3) and the Chief Executive (pages 5 to 9).
External environmentThe brief period of economic recovery witnessed during 2010was reversed in 2011 by the developing sovereign debt crisis inwestern economies.
In the eurozone, a number of interventions were made during2011, intended to stabilise the economies of Portugal, Greece,Italy and Spain.
By the end of 2011 these interventions had failed to restoremarket confidence. Concerns about the prospect of defaultsand the impact on the stability of the financial system continuedto restrict activity in the wholesale markets, whilst the outlookfor economic growth domestically and in Europe worsenedduring the year. As a result the UK Government has beenrequired to extend the timescale to balance the national budgetwhilst further quantitative easing has been initiated by theMonetary Policy Committee. UK unemployment rose during2011 and is forecast to do so in 2012 and, not unexpectedly,public confidence declined through the year.
The Bank of England Base Rate, which had widely beenforecast to rise during 2011, was maintained at 0.50%, andexpectations are now for this to continue throughout 2012 andinto 2013.
The housing market remained subdued. Activity was half thatwitnessed prior to the onset of the initial credit crisis in 2007.Property valuations have been protected by an ongoing shortfallof supply as the UK population continues to grow anddemographic changes lead to more single person households.The low base rate has also helped to support mortgageaffordability. Although more mortgages were offered in themarket at higher loan to values during 2011, lending remainsrestricted, particularly to first-time buyers.
Overall, economic prospects for 2012 remain uncertain.
Impact on Coventry Building SocietyWhilst economic conditions weakened significantly during 2011,the Society once again recorded an extremely strongperformance, showing the benefits of both a straightforwardand consistent business strategy and the excellence inexecution which has set it apart in recent years.
The traditional business model of a mutual building societyrequires it to attract and retain savings balances to fundresponsible lending, adding to capital reserves in the form ofsustainable levels of profitability.
The Society has once again achieved each of these objectives.The core strength which underpins these achievements is thecapability to maintain a balance of savings and lending withoutrecourse to higher levels of risk, in turn supported by sectorleading cost-efficiency.
The Society’s continued success in an increasingly competitiveretail savings market requires financial strength andoperational expertise. Security of funding has been enhancedby continued access to wholesale investors and has ensuredthat the Society has been able to maintain profitable andprudent lending.
The benefits of this responsible approach are evidenced in theform of low levels of arrears and impairments which haveprotected profitability and the transfer of retained profit toregulatory capital reserves.
As well as financial security and the provision of fair long-termvalue in savings and mortgages, we also have an overridingduty to our members to provide products that meet their needs.
During the first half of 2011, the court case concerning the saleof Payment Protection Insurance was completed, and as aresult, a number of lenders have identified millions, in somecases, billions of pounds in additional provisions to cover the
DIRECTORS’ REPORT

13
mis-selling of these products. Coventry was not required tomake any provision as a result of this ruling. The Boardbelieves this example demonstrates how decisions have beentaken in the interests of individual members, in the form ofproduct design and sales processes, that are in the interests ofthe Society as a whole.
The current economic climate presents challenges for allmembers and the Society aims to provide long-term valueacross our portfolio for the benefit of savers and borrowersalike. Around 95% of the variable rate savings products thatwere in existence at the time the Bank of England Base Ratebegan its fall from 5.00% in October 2008 to 0.50% in March2009, have seen interest rates improve relative to the BankBase Rate, and the rate paid on 94% of saving balances is inexcess of Base Rate. This has helped to protect hundreds ofthousands of Coventry savers from the full impact of theunprecedented low interest rates. For example, the averageinterest rate paid on cash ISAs, is over 2%, compared to amarket average of 0.61%.
We have done this whilst maintaining the lowest standardvariable rate of any of our peer group1 of larger buildingsocieties. The Society’s ability to report strong profits andcompete for new business whilst providing long-term value forexisting members underlines the strength of our businessmodel and our commitment to operate in line with our values.
This member-focused approach is also reflected by aresponsible investment strategy. The eurozone crisis hashighlighted the degree of connectivity and hence risk ofcontagion within the financial services sector. Coventry BuildingSociety has just £3.4 million invested in Irish banks as at 29 February 2012, and no exposure to the following eurozonecountries: Portugal, Italy, Greece and Spain.
The Society retained ’A’ ratings from both Moody’s (A3) andFitch (A) credit rating agencies, and notably was not included inthe Moody’s statement in the second half of 2011 whichresulted in the downgrading of 12 UK banks and buildingsocieties.
This performance was achieved during a year of considerableinternal change. Although the merger with Stroud & SwindonBuilding Society was legally completed on 1 September 2010,much of the benefit to the wider membership has beenachieved through the integration of the two societies followingthis date. This work was completed at the end of September2011 to a timescale and level of integration that was morechallenging than in most similar mergers in the buildingsociety sector.
It is worth repeating that the Society has prospered during aperiod of extreme economic uncertainty and challenge. With
these conditions set to continue for the foreseeable future, theBoard believes it retains the right business model, strategy andexpertise to remain financially strong and protect the interestsof current and future members.
In addition to the economic uncertainties, 2011 was alsomarked by developments in the regulatory environment. TheSociety believes that regulation should reflect thecircumstances of individuals and organisations alike, and a ‘one size fits all’ approach may weaken a faltering housingmarket. It is encouraging that the FSA is conducting significantconsultation into the impact of proposed changes, particularlyin regard to the mortgage market and, most importantly, hasdemonstrated a willingness to listen and develop plansaccordingly.
FUTURE DEVELOPMENTSLooking ahead to 2012 it is clear that the economicenvironment will remain uncertain and fast-moving. Whateverthe developments, in the UK or internationally, it can beexpected that the challenges of low economic growth and lowinterest rates will dictate what happens in the housing marketfor the immediate future.
The key for all mortgage lenders will be security of funding andthe cost of this funding, which will be determined by restrictedcredit markets and a crowded retail savings market, willcontinue to present challenges.
Coventry Building Society remains well placed to succeed. Theability to compete effectively in retail markets has been provenfrom the earliest point in the credit crisis, and has been aconsistent source of the Society’s strength in the ensuing fiveyears of economic turmoil. In addition, the Society’s pastperformance and strong ratings position gives confidence that itwill continue to attract institutional investors, securingadditional funding strength.
The Society’s control of costs and margin has ensured asustainable level of profitability, which continues to enhanceexceptionally strong capital ratios (22.8%), that is supported bythe excellent asset quality of its mortgage book and low levelsof impairments.
Coventry Building Society has core strength in thefundamentals of operating a successful savings and mortgagemodel. More importantly it has a track record of decision-making that puts member’s interests first. This combination ofstrong foundations and a prudent member-focused strategyhas been shown to be extremely successful. The Boardcontinues to believe that the Society is well positioned to reportfurther progress in 2012 and beyond.
1 Peer group of larger building societies defined as building societieswith reported assets of between £5 billion and £50 billion.

DIRECTORS’ REPORT(continued)
14
TOTAL LOANS (£bn)• Mortgage market share has increased by two thirds over the
last five years.• This represents the largest reported organic growth in market
share of any top ten building society.• Mortgage assets continue to be of very high quality with an
average indexed loan to value ratio of the overall mortgagebook of just 50%.
KEY PERFORMANCE INDICATORS
TOTAL RETAIL SAVINGS (£bn)• Savings balances have grown by £10.8 billion.• This represents the largest reported organic growth
in market share of any top ten building society.
TOTAL CAPITAL (£m)*
• Consistent financial performance has resulted in an increasein capital resources of £240 million between 1 January 2007 and 31 December 2011.
• Coventry has the highest reported core tier 1 ratio of any UKbuilding society or top ten mortgage lender (22.8%).
* Total capital is comprised of equity, subscribed capital and subordinated liabilities.
COST TO MEAN ASSET RATIO (%)*
• Cost to mean asset ratio is just 0.37%, maintaining theSociety’s class leading efficiency.
• 0.37% represents the lowest ratio ever reported by a UK building society.
* Administrative expenses, depreciation and amortisation/Average total assets.
OPERATING PROFIT BEFORE EXCEPTIONAL ITEMS (£m)• Underlying profits* of the Society have increased to a record
£84.6 million.• Coventry is the only top ten building society to report growth in
assets and a profit in each of the last five years.
* Operating profit after impairments and before exceptional items.
19.217.6
14.113.211.810.0
19.017.6
13.212.410.3
8.2
974916816783787734
0.370.370.380.40
0.480.53
84.675.3
59.563.367.065.5

15
GROUP ACCOUNTSThe Accounts show the consolidated Group results of theSociety and its subsidiaries, and the Society as a single entity.
PROFIT AND CAPITALDiscounting the exceptional items recorded in 2010 and 2011 asa result of the merger with Stroud & Swindon, the contributionmade to the Financial Services Compensation Scheme to meetthe costs of the mistakes of others, and the charitable donationto the Poppy Appeal, the underlying profits of the Society rosefrom £75.3 million to £84.6 million. As a result, the Group’sprofit after tax amounted to £46.6 million (2010: £84.9 million),which was added to reserves.
The Group holds capital to protect its depositors, to coverinherent risks, to support the development of the business andto provide a cushion for unexpected losses. In assessing theadequacy of its capital, the Group considers its risk appetiteand the material risks to which it is exposed. Capital adequacyand capital resources are monitored on the basis of theframework developed by the Basel Committee on BankingSupervision and subsequently implemented in the UK by theUK regulator, the Financial Services Authority (FSA).
Prior to 1 January 2008, the Group followed the requirements ofthe Capital Accord (Basel I). Since 1 January 2008 the Grouphas complied with the EU Capital Requirements Directive(Basel II). From this date the FSA granted the Group permissionto use the Basel II Internal Ratings Based (IRB) approach toretail credit risk and capital management. This allows theGroup to set capital levels using internally developed modelsthat reflect the credit quality of the Group’s mortgage bookrather than through standardised percentages set by the FSA.This permission reflects the Group’s detailed understanding ofits customer base and control of its credit risk profile. In 2010,Coventry Building Society merged with the Stroud & SwindonBuilding Society, which used the standardised approach toretail credit risk management. The Group intends to adopt theIRB approach for these mortgages in due course.
The table overleaf summarises the composition of regulatorycapital for the Group as at 31 December 2011 and 31 December2010. At 31 December 2011, and throughout the year, the Groupcomplied in full with the capital requirements that were inforce. Further information on how the Group manages capitalcan be found on page 25. The Group calculates its capitalrequirement under Basel II using the IRB approach for primeresidential and buy-to-let mortgage exposures (excluding thosetransferred from the Stroud & Swindon merger), and thestandardised approach in calculating the capital requirementsfor other risk areas.

DIRECTORS’ REPORT(continued)
16
Capital structure2011 2010
Notes £m £m
Tier 1General reserve 747.9 704.5Pension fund surplus adjustment 1 (3.9) (7.2)Intangible assets 2 (9.5) (12.2)Deductions from tier 1 capital 3 (9.2) (15.3)
Core tier 1 capital 725.3 669.8Permanent interest bearing shares 4 160.0 160.0
Total tier 1 capital 885.3 829.8
Tier 2Collective provisions for impairment 5 0.4 0.8Subordinated debt 6 67.0 67.0Deductions from tier 2 capital 3 (9.2) (15.3)
Total tier 2 capital 58.2 52.5
Total capital 943.5 882.3
IRB approachCredit risk – Retail exposures 1,920.7 1,522.6Standardised approachCredit risk – Retail exposures 776.7 896.3Credit risk – Liquidity book 199.0 340.0Credit risk – Other 83.9 50.0Operational risk 202.4 235.0
Risk-weighted assets 3,182.7 3,043.9
Core tier 1 ratio (%) 22.8 22.0
1. Pension fund surplus - note 12 (page 57)2. Intangible assets - note 23 (page 66)3. Under Basel II a deduction is made for the excess of expected losses on loans and advances to customers, calculated on an IRB basis, over accounting provisions, and
are allocated 50% to Tier 1 and 50% to Tier 2 capital.4. Permanent interest bearing shares - principal amount outstanding only, note 37 (page 75) 5. Under Basel II collective provisions for impairment relating to loans and advances to customers, calculated on a standardised basis, are included as Tier 2 capital.6. Subordinated debt - principal amount outstanding only, note 36 (page 75).
Core tier 1 ratioThe Society retains a strong capital position with a core tier 1 ratio of 22.8% (2010: 22.0%).
Impact of Basel IIIThe European Commission published its proposal for implementing the provisions of Basel III in July 2011. This proposal (in theform of a draft regulation and directive) is currently under negotiation within the EU. Basel III introduces stricter definitions ofwhat constitutes capital. Current instruments which do not meet the stricter definitions, principally the Society’s PermanentInterest Bearing Shares, will be gradually derecognised for capital purposes over a ten year period starting in 2013.
Basel III had no effect in 2011, and the Society has considered the impact of the introduction of these rules on future levels ofcapitalisation, including under stress testing. The directors consider that the Society will continue to remain well capitalised andthere is no foreseeable requirement to issue additional capital instruments. Nevertheless, the Society is monitoring marketdevelopments and may consider issuing Basel III compliant capital instruments should the market present favourableopportunities to do so.

17
ASSETSAdvances during the year amounted to £4.0 billion,contributing to total loan balances of £19.2 billion.
The assets of the Group increased by £2.2 billion to £24.5 billion at 31 December 2011, representing growth of9.8%. Changes in intangible assets and property, plant andequipment are detailed in notes 23 and 24 to the Accounts.
At 31 December 2011, there were 268 mortgage accounts 12 months or more in arrears (2010: 336). The balances onthese accounts totalled £31.0 million (2010: £38.7 million)and the value of these arrears was £5.0 million (2010: £8.3 million).
CREDITOR PAYMENT POLICYThe Society’s policy is to agree the terms of payment at thestart of trading with the supplier and to pay in accordancewith its contractual and other legal obligations.
CHARITABLE AND POLITICAL DONATIONSThe Society provided for donations of £1.1 million (2010: £1.8 million) to charitable organisations during theyear. This included a provision for £1.0 million (2010: £1.7 million) to The Royal British Legion’s PoppyAppeal and £50,000 (2010: £50,000) to the Coventry BuildingSociety Charitable Foundation.
The amount donated to The Royal British Legion illustratesthe strength of the ongoing relationship with the Legion forwhich the Society has developed a portfolio of products. By31 December 2011, the total support given to the PoppyAppeal since the launch of the first Poppy Bond in October2008 had reached £5.6 million. The number of membersholding accounts which support the Legion now totals closeto 130,000.
No contributions were made for political purposes. However,as a result of the Political Parties, Elections andReferendums Act 2000, time allowed for employees to carryout civic duties and political activity can amount to adonation. The Society supports a very small number ofemployees in this way.
CORPORATE RESPONSIBILITY,ENVIRONMENTAL AND EMPLOYEEFACTORS
StaffThe directors welcome the opportunity to recognise thecommitment and professionalism of all staff in enabling theSociety to record another outstanding performance in 2011.
As the economic challenges develop from year to year, it isunderstandable that the focus should be on the overallfinancial and business performance of the Society in verydifficult circumstances.
However, at such times the reputation of an organisation isparamount, and it is the day-to-day ability of the Society tomaintain the confidence of its members whilst competing inrestricted markets that stands behind the financialperformance.
The ability of the Society to succeed in an increasinglycompetitive savings market has already been noted, as hasthe importance of security of funding. This requires flexibilityand speed of action to be built into the everyday operation ofcustomer-facing and processing operations and placessignificant demands on the members of staff that work inthese areas.
Their experience and skill is vital in managing a flow of workthat can change considerably as the Society identifies andpursues market opportunities, whilst maintaining the qualityof service that our members value and expect.
It is also the case that the financial services industry haschanged rapidly and will continue to do so through regulatorydevelopments, the application of new technologies andongoing innovation. The Society’s ability to protect theinterests of members whilst continuing to grow, requires thedevelopment and application of new skills whilst retainingthe values that have held it in such good stead over the years.
This responsibility is shared by everyone at the Society. Theimportance attached to ‘Putting Members First’, the Society’sguiding principle, is manifest in all aspects of theorganisation from the recruitment of new members of staffand their initial induction, to training and development andthe day-to-day management of activities.
In early 2012, the Society was awarded Gold status byInvestors in People in its triennial review. This respectedindependent award places the Society in the top 3.0% ofaccredited organisations in the UK. This follows a specificreview undertaken in 2011 in which Investors in Peopleassessed the Society's merger with Stroud & SwindonBuilding Society and reported that it was a "model of itskind".
It is clearly understood that the Society’s success, whichrequires a shared understanding of the values of theorganisation, requires the commitment of every member ofstaff. The directors are confident that the performance of theSociety over many years demonstrates this in action andwould like to take this opportunity to thank all staff for theircontribution in 2011.
The Society will continue to invest to provide the rightenvironment and opportunities for members of staff toachieve their potential and meet the expectations of theSociety’s membership.

DIRECTORS’ REPORT(continued)
18
CommunityThe difficult economic conditions have created additionalhardship for many individuals and communities. It is likely that this will be exacerbated as public spending and privateinvestment continues to be withdrawn.
The Society has, over a number of years, developed anestablished programme of support that reflects the corecompetences of the organisation and the needs of localcommunities.
Of particular note has been the ongoing work to enhancefinancial literacy, which now spans a range of initiatives fromsupporting numeracy and literacy in primary schools, toworking with specialist finance academies and tacklingpersonal debt issues amongst adults through partnerships with Citizens Advice Bureaus in Coventry and Stroud. Theseinitiatives are well regarded by the organisations involved, inparticular the consistency of the Society’s support over asustained period.
The directors believe that the Society’s links between its corebusiness activities and supporting vulnerable peopledemonstrates the best of corporate responsibility in action. Anexample during 2011 was a pilot undertaken with CoventryCitizens Advice Bureau and Coventry Law Centre whichextended the Society’s experience in supporting individuals inarrears to a broader audience.
The Society is nearing the end of its three year programme ofsupport for Age UK. During this time almost £150,000 has beenraised, but of equal importance has been the opportunity toincrease awareness amongst staff and members of the workundertaken by Age UK, and the issues faced by the UK’s elderly.It is unfortunately the case that vulnerable people aredisproportionately affected at times of economic hardship,including being targeted by criminal activity. There have been anumber of examples where members of staff have identifiedand protected elderly members from abuse, an understandingthat has been reinforced by the partnership with Age UK.
From this point, the Society will build on the establishedrelationship with The Royal British Legion, supporting it notonly through the established portfolio of Poppy products whichby the end of 2011 had resulted in over £5.6 million beingdonated to the Poppy Appeal, but also as our corporate charity.The directors understand the value and relevance of the workundertaken by The Royal British Legion and also appreciate themany expressions of support received from members since thisrelationship began in 2008.
The final element of the Society’s programme is devoted tosupporting local communities, often through the personalcommitment of members of staff, but also through theactivities of the Coventry Building Society CharitableFoundation, now in its 13th year of operation. It is noticeablethat the number of requests for help have risen in recent years,with nearly 50 small local organisations receiving grants fromthe Foundation in 2011. These now include organisations in the
geographic area previously served by Stroud & SwindonBuilding Society, and the grant available to the Foundation willbe increased in 2012 to accommodate the greater area ofoperation and the rise in demand for help.
The enthusiasm and commitment of members of staff to thecommunity programme continues to be the critical element indetermining success. Whether helping achieve a record-breaking fundraising contribution to Children in Need,committing to long-term reading support for a schoolchild, orvolunteering to help run a local community group, as inprevious years, many staff have chosen to become involved atsome point during 2011.
Supporting the communities we serve is one of the values ofthe Society and it will continue to be an intrinsic part of theservice provided.
EnvironmentThe Society remains committed to reducing the environmentalimpact of its activities, in particular seeking to limit the amountof paper used and to ensure recycling opportunities aremaximised, whilst also aiming to source energy responsiblyand to reduce usage where possible.
The directors understand the close link between these aimsand the objective of the business to maintain an efficient andcost-effective organisation.
During 2011 the Society's continued growth required openingan additional office building in Coventry. The opportunity wastaken to refurbish the building and update key heating, air-conditioning, insulation and lighting systems and controls inaccordance with environmental best practice with the aim ofminimising ongoing energy consumption. The energyperformance of the building has been significantly improvedwith lighting being 36% more efficient, whilst the heating(215%) and cooling (40%) systems are exceptionally energyefficient.
The improvements offered by all of these systems results insubstantially reduced annual carbon dioxide emissions,providing sustainable environmental improvements whilstallowing greater flexibility and control in managing internalworking conditions.
The Society has completed its programme to install smartmeters in branches, complementing similar systems in place inall head office buildings, and is starting to realise the benefitsof this proactive energy management. In addition the Societymaintains a proactive approach to energy procurement whichhas enabled renewable energy to be sourced cost-effectively foruse at head office sites.
Although it has been identified in previous reports, it is worthconfirming that all paper used within Coventry Building Societyis recycled via a secure facility, which results in both anenvironmental and a security benefit. In addition, over 95% ofall literature produced by the Society uses recycled paper.

19
AwardsThe directors are pleased to report that the Society’soutstanding performance in 2011 was once again reinforced bya number of independently assessed awards.
The financial services industry has witnessed a proliferation ofawards intended to enhance consumer knowledge anddecision-making. The Society wins many such awards and it isworth highlighting those that are based on genuine customerperspectives.
One that is particularly pleasing, because it also measures theSociety’s success in managing the integration of Stroud &Swindon Building Society, is the award by Your Money of ‘BestRegional Branch Network’. Coventry Building Societyrecognises that the role of branches often extends beyond asimple transactional sales and service relationship and, as aresult, has invested significantly in developing the capability ofbranch staff and the environment in which they servemembers. The award of ‘Best Regional Branch Network’reflects this investment and is particularly noteworthy becausenominations resulted from the experience of customers, andassessment included independent mystery shopping.
‘Your Mortgage’ magazine awarded Coventry Building Societythe title of ‘Best Building Society’ for 2011. The award wasmade on the basis of information provided by mortgageintermediaries and their clients with the citation acknowledgingthe “long term, good value of its mortgages and savings…coupled with its superlative service”.
Similar recognition was provided by MoneyNet who judged theSociety as the ‘Overall Best Savings Provider’ in 2011, a positionthat has already been retained for 2012 along with an additionalaward for ‘Best Overall Current Account’.
Although not technically an award, the themes of trust and service are also reflected in the ongoing performance ofthe Society in its handling of member issues. As wasmentioned last year, in 2009 the Financial Ombudsman Service(FOS) began publishing details of the complaints that had beenreferred to it, having failed to be resolved by the organisationconcerned. Having had significantly fewer than the minimum 30complaints required for inclusion in the FOS tables in each ofthe reporting periods, the Society is comfortably the largesthigh street bank or building society not to have appeared in thispublication.
GOING CONCERNIn preparing the financial statements the directors must satisfythemselves that it is reasonable for them to conclude it isappropriate to adopt the going concern basis.
The Society meets its day-to-day liquidity requirements,through managing both its retail and wholesale fundingsources and is required to maintain sufficient liquid assets tocomply with regulatory requirements, in order to continue to beauthorised to carry on its business.
The Society’s business activities, together with the factors likelyto affect its future development, performance, position, liquidityand capital structure are set out in the Chairman’s Statement,Chief Executive’s Review and this Directors’ Report. In addition,the Risk Management Report and note 40 to the Accountsincludes further information on the Society’s objectives, policiesand processes for managing its exposure to liquidity, credit,market, operational and business risk, along with details of itsfinancial instruments and hedging activities.
The directors believe that the Society is well placed to manageits business risks, despite the current uncertain economicoutlook. After considering factors including default rates onloans, house price movements and the Society’s capital andliquidity position including the use of stress testing, thedirectors are confident that the Society has adequate resourcesfor the foreseeable future. Accordingly, they continue to adoptthe going concern basis in preparing the Annual Report &Accounts.
PRINCIPAL RISKS AND UNCERTANTIESThe principal risks and uncertainties faced by the Society areset out in the Risk Management Report on pages 20 to 25.
CORPORATE GOVERNANCEThe Directors’ Report on Corporate Governance can be foundon pages 26 to 31.
DIRECTORS’ STATEMENT PURSUANT TOTHE DISCLOSURE AND TRANSPARENCYRULESThe directors confirm that, to the best of each person’sknowledge and belief:
The financial statements, prepared in accordance with IFRSas adopted by the EU, give a true and fair view of theassets, liabilities, financial position and profit of the Groupand Society; and
The management report contained in this Directors’ Reportand the Risk Management Report includes a fair review ofthe development and performance of the business and theposition of the Group and Society, together with adescription of the principal risks and uncertainties that theyface.
AUDITORSFollowing a review by the Board Audit Committee, the Boardhas agreed that a resolution proposing the re-appointment ofErnst & Young LLP as auditors of the Society will be submittedat the Society’s 2012 AGM.
On behalf of the Board
David HardingChairman29 February 2012
RISK MANAGEMENT REPORT
20
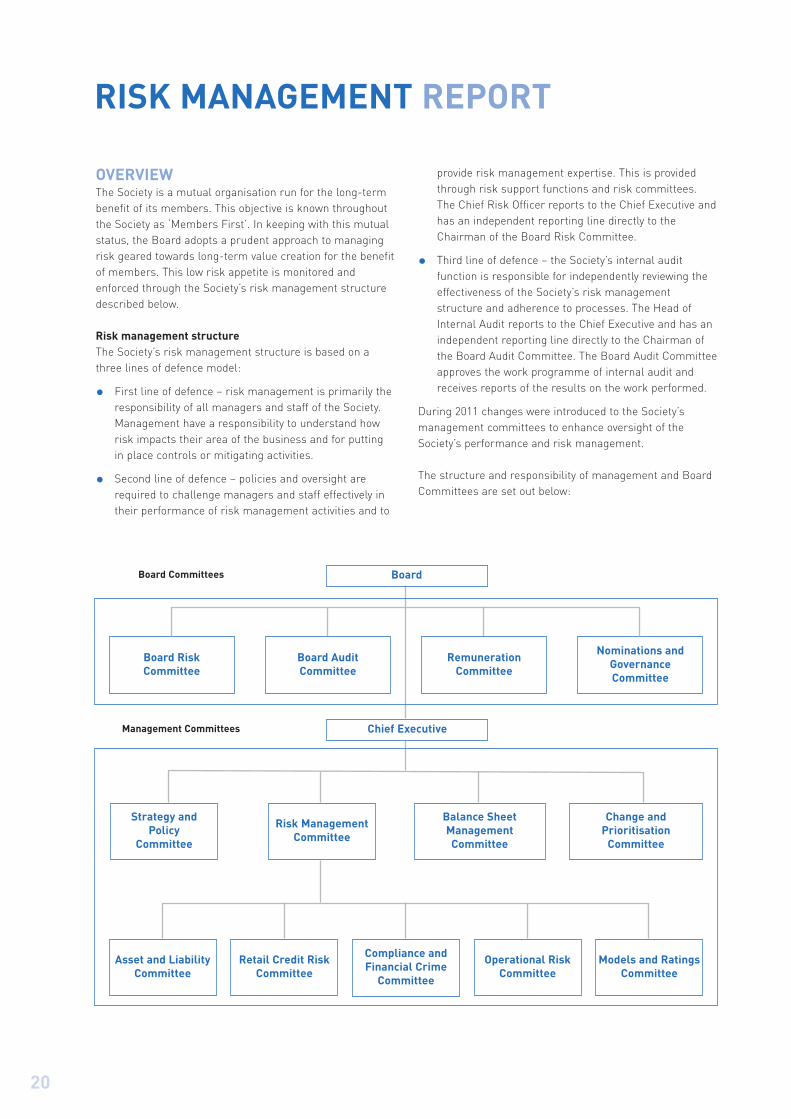
OVERVIEWThe Society is a mutual organisation run for the long-termbenefit of its members. This objective is known throughoutthe Society as ‘Members First’. In keeping with this mutualstatus, the Board adopts a prudent approach to managingrisk geared towards long-term value creation for the benefitof members. This low risk appetite is monitored andenforced through the Society’s risk management structuredescribed below.
Risk management structureThe Society’s risk management structure is based on athree lines of defence model:
First line of defence – risk management is primarily theresponsibility of all managers and staff of the Society.Management have a responsibility to understand howrisk impacts their area of the business and for puttingin place controls or mitigating activities.
Second line of defence – policies and oversight arerequired to challenge managers and staff effectively intheir performance of risk management activities and to
provide risk management expertise. This is providedthrough risk support functions and risk committees.The Chief Risk Officer reports to the Chief Executive andhas an independent reporting line directly to theChairman of the Board Risk Committee.
Third line of defence – the Society’s internal auditfunction is responsible for independently reviewing theeffectiveness of the Society’s risk managementstructure and adherence to processes. The Head ofInternal Audit reports to the Chief Executive and has anindependent reporting line directly to the Chairman ofthe Board Audit Committee. The Board Audit Committeeapproves the work programme of internal audit andreceives reports of the results on the work performed.
During 2011 changes were introduced to the Society’smanagement committees to enhance oversight of theSociety’s performance and risk management.
The structure and responsibility of management and BoardCommittees are set out below:
Board Risk Committee
Nominations andGovernanceCommittee
Board Committees
Management Committees
Board
Chief Executive
Strategy and Policy
Committee
Risk ManagementCommittee
Change and Prioritisation
Committee
Balance SheetManagement Committee
Asset and LiabilityCommittee
Retail Credit RiskCommittee
Compliance andFinancial Crime
Committee
Models and RatingsCommittee
Operational RiskCommittee
Board Audit Committee
RemunerationCommittee

21
GOVERNANCE AND OVERSIGHT
BOARD COMMITTEES Details of the Board Committees can be found in theDirectors’ Report on Corporate Governance on pages 26 to 31.
SENIOR MANAGEMENT COMMITTEESStrategy and Policy CommitteeChaired by the Chief Executive and comprised of theexecutive directors and senior management. This is thesenior executive decision making body representing the keybusiness areas within the Society and oversees thestrategic development, operational and businessperformance of the Society.
Risk Management Committee (RMC)Chaired by the Chief Risk Officer and comprised of theexecutive directors and senior management. ThisCommittee ensures that risk is being identified andmanaged efficiently across the Society and that the Society’sRisk Management Framework remains effective. It keepsunder review the Board’s risk appetite statement, InternalCapital and Liquidity Adequacy Assessments, andrecommends changes to the Board, through the Board RiskCommittee. The minutes of the Committee are presented tothe Board Risk Committee.
The Society also has a number of sub-committees thatreport to the RMC. The details of these Committees are asfollows:
Asset and Liability Committee (ALCO)Chaired by the Finance Director and comprised of theexecutive directors and senior management. TheCommittee oversees the asset and liability risks faced bythe Society, specifically market risk, wholesale creditrisk and liquidity risk. Further it recommends to theBoard, through RMC and the Board Risk Committee, keytreasury policy changes and risk frameworks forapproval. The minutes of the Committee are presentedto the Board Risk Committee.
Retail Credit Risk CommitteeChaired by the Chief Risk Officer and comprised of theexecutive directors and senior management. ThisCommittee monitors the management of retail creditrisk across the Society and its subsidiaries and theperformance of the mortgage books to ensurecompliance with limits approved by the Board. Further itrecommends to the Board, through RMC and the BoardRisk Committee, key lending policy changes andframeworks such as the retail credit risk appetitestatement.
Compliance and Financial Crime CommitteeChaired by the Chief Risk Officer and comprised ofsenior management. This Committee overseesregulatory conduct risk, compliance and financial crimepolicy and risk.
Operational Risk CommitteeChaired by the Head of Marketing and comprised ofsenior management. This Committee monitorsoperational risk, business continuity, safety and securityin the Society. Further it recommends to the Board,through RMC and the Board Risk Committee, theoperational risk appetite statement.
Models and Ratings CommitteeChaired by a non-executive director (Ian Pickering) andcomprised of executive directors and seniormanagement. This Committee monitors theperformance of the Society’s Basel II credit risk ratingsystem.
Balance Sheet Management CommitteeChaired by the Finance Director and comprised of theexecutive directors and senior management. ThisCommittee oversees the balance sheet strategy of theSociety, including product management, pricing and marginmanagement of the retail savings and lending portfolios.
Change and Prioritisation CommitteeChaired by the Chief Executive and comprised of theexecutive directors and senior management. ThisCommittee is responsible for prioritisation and approval ofall projects, including project expenditure, in line with theSociety’s corporate plan.
PRINCIPAL RISKS AND UNCERTAINTIESThe Society seeks to understand and manage the variousrisks that arise from its operations and classifies theprincipal risks it faces according to five broad categories.These are credit risk, market risk, liquidity risk, operationalrisk (including compliance and financial crime) andbusiness risk. The procedures put in place to manage theserisks are described below:
Credit riskCredit risk is the risk that customers or counterparties willnot meet their financial obligations to the Society as they falldue.
Retail credit riskFor a building society, this risk is most likely to presentitself in the potential inability of borrowers to repay their

RISK MANAGEMENT REPORT
22
mortgage. The Society’s exposure to this risk is managed bya specialist department that reports to the Chief RiskOfficer, and in turn to the Retail Credit Risk Committee.
Retail credit risk is managed through a combination of anautomated decision system and statistical modelling(including the use of credit scoring) that seeks to identifythose customers who pose a greater risk of not repayingtheir mortgage, and the Society’s underwriting processwhich seeks to ensure that customers only assume a debtthat they can afford to repay, thereby safeguarding boththemselves and the Society. Retail credit risk is furthermitigated by the application of loan to value (LTV) policyrules which form a key element of mortgage productdesign. This ensures the Society has a prudent margin torepay any given mortgage, even in the event of a fall inproperty values.
Lending policy is monitored by the Retail Credit RiskCommittee, which meets monthly. The Committee is a sub-committee of the RMC and is tasked with ensuring that thequality of new business and overall exposures are within theprudent limits set by the Board, and that the performanceof the book is being monitored and trends identified. In thisrespect, regular stress testing is undertaken that seeks toestablish the extent to which losses may emerge in a varietyof scenarios, including severe stresses. Should a borrowerfind themselves in financial difficulty, the Society hasestablished procedures to ensure that it responds fairly,appropriately and sympathetically. Typically, this involvesworking with the borrower to clear arrears or making otherarrangements commensurate with the borrower’scircumstances. This can include overpayments to cleararrears or providing a temporary concessionaryarrangement to that borrower (defined as ‘forbearance’).Each case is reviewed on its own merits by a specialistdepartment, and we always attempt to work with theborrower in difficulty to resolve matters to our mutualsatisfaction taking into account an individual borrower’sfinancial situation (see note 40 to the Accounts).
The Retail Credit Risk Committee closely monitors the useof forbearance measures and strict policies exist forcircumstances in which the Society will, for example,capitalise arrears. Other measures such as temporarytransfers to interest only payments are regularly reviewedand the Society has seen a reduction in this particularmeasure over the last 12 months.
Should the borrower’s situation deteriorate significantly, theSociety may take possession of the underlying property.Regular reviews of the Society’s arrears managementfunction is undertaken to ensure that borrowers are being
treated fairly and in line with established policies andprocedures.
The Society has recently developed a quantitative andqualitative retail credit risk appetite statement and has alsoenhanced its stress testing framework. Regular stresstesting is undertaken to ensure the Society continues toremain within its retail credit risk appetite.
Wholesale credit riskCredit risk within the treasury function (wholesale creditrisk) arises from the portfolio of liquid assets held, andrepresents the risk that counterparties will fail to repayamounts when due. The Society has a low appetite for thisform of risk. As such, exposures are restricted to goodquality counterparties with a low risk of failure, and limitsand exposures are set accordingly. Treasury exposures andlimits are focused in the main on UK institutions, withadditional limits extended to a small number of highly ratedbanks in Europe and other developed economies. Limits areset in line with a Board approved wholesale credit policy,which sets maximum limits taking into account internalanalysis, external credit ratings, country of domicile and anyother relevant factors. All credit limits require Boardapproval, and are subject to an initial assessment of thecreditworthiness of the counterparty, with the approved limitthen subject to at least an annual review. Exposure isreviewed on a daily basis to ensure that it remains within theapproved limits. Ongoing developments for Treasurycounterparties are closely monitored by a specialist creditteam, and are reported to, and reviewed by, a dedicatedTreasury Credit Committee. This Committee meets weeklyand is chaired by the Chief Risk Officer. The Committee isempowered to take immediate action to reduce limits wherethis is warranted by developments. The Committee reportsthrough ALCO to the RMC and Board Risk Committee.
Details of the Society’s exposure to credit risk are containedin note 40 to the Accounts.
Market riskMarket risk is the risk that the value of income derived fromthe Society’s assets and liabilities may change adversely asa result of changes in interest rates, foreign exchange ratesor house prices. The Society’s policy is to manage theserisks prudently, which is ensured through the setting oflimits by the Board. The Society ensures compliance withthese limits through a combination of matching assets andliabilities with off-setting interest rate or currencycharacteristics, and by the use of derivative financialinstruments such as interest rate swaps and caps, foreignexchange swaps and foreign exchange forward purchasecontracts. Control of market risk exposure is overseen by
(continued)

23
ALCO, which makes reports to the RMC and the Board RiskCommittee. The most significant elements of market risk forthe Society are interest rate risk, foreign currency risk andhouse price risk, each of which are described below.
The Society is further strengthening its second line ofdefence for oversight and independent assessment of thevarious market risks by the establishment of a BalanceSheet Risk Management team reporting to the Chief RiskOfficer.
Interest rate riskInterest rate risk arises from the different interest ratecharacteristics of the Society’s mortgages and savingsproducts and from other financial instruments. In particular,the issue of fixed and capped rate mortgages and fixed ratesavings products exposes an organisation that principallyoperates within a variable rate environment (such as theSociety) to the risk that interest rate fluctuations couldcause either a reduction in interest income or an increase ininterest expense relative to other interest flows.
Where the Society has issued fixed rate mortgages, the riskis that a general increase in interest rates would leave theSociety facing higher interest expense, but without acompensating increase in interest income. In thesecircumstances, the Society would typically take out aninterest rate swap with a counterparty bank under which theSociety’s fixed rate income is exchanged for one based on avariable rate which would be expected to follow the generalpattern of interest rate movements and thereby reduce theSociety’s exposure. Similarly, in cases of issuing fixed ratesavings products, the Society would typically take out aninterest rate swap under which the Society receives a fixedrate of interest and pays a variable rate. With capped ratemortgages, the risk is that if the rates increase above a pre-determined level, the Society will be unable to increase itsmortgage rate on these products to compensate. In thesecircumstances, the Society would typically purchase a ratecap that will pay a variable rate if an agreed index rate (forexample, LIBOR) exceeds a certain level. In addition, theSociety regularly forecasts the impact of movements in theBank of England Base Rate on the Society’s balance sheet toensure any potential adverse impact can be anticipated. Thisinformation is reported to ALCO.
The Society does not trade or take speculative positions onderivatives.
Foreign currency riskForeign currency risk arises as a result of the Society’sactivities in raising funds and making investments in foreigncurrencies. This is undertaken to ensure wholesale fundsare obtained cost-effectively across a wide pool of potentialproviders, but exposes the Society to the risk of anappreciation in the value of foreign currency denominatedliabilities or a deterioration in the value of the foreigncurrency denominated assets if exchange rates change. Therisk is managed through the use of currency swaps andforeign currency forward contracts and also, whereappropriate, by the matching of foreign currency liabilitieswith assets denominated in the same currency.
Details of the Society’s exposure to interest rate and foreigncurrency risk are contained in note 40 to the Accounts.
House price riskHouse price risk is present in two forms. Most significantlythis risk arises from the value of the property forming thesecurity for a mortgage being insufficient to repay the loanin the event of default and subsequent repossession. TheSociety manages this risk through a combination of prudentloan to value limits at inception and ongoing monitoring toensure that bad debt provisions are sufficient to cover thepotential losses that may arise in repossession situations.
With respect to lifetime mortgages, house price risk alsoarises from the ‘no negative equity’ guarantee, whereby theborrower is guaranteed that the amount recoverable by theSociety at the end of the mortgage will not exceed the valueof the property.
Under these loans, the borrower receives an advance butmakes no payments of interest or principal until the loan isredeemed. The interest is added to the loan and recoveredby the Society when the loan is redeemed. The ‘no negativeequity’ guarantee therefore exposes the Society to the riskthat the value of the property at the time of redemption islower than the loan plus accumulated interest. The Societymanages this risk by granting loans only at relatively lowloan to value ratios, subject to the age of the borrower, andthrough the use of statistical modelling to stress potentialexposures within acceptable prudent limits. Only 2% of theSociety’s outstanding mortgage balances have beenadvanced on this type of product. The Society does notcurrently offer these products to new applicants.
The risks presented by house price movements areevaluated through stress testing and monitored by theRetail Credit Risk Committee and ALCO and, through theseCommittees, by the RMC and the Board Risk Committee.

24
RISK MANAGEMENT REPORT(continued)
Liquidity riskLiquidity risk is the risk that the Society will be unable tomeet its financial obligations as they fall due or can do soonly at excessive cost. The risk is managed principally byholding funds in cash accounts and other easily realisableliquid assets. The amount and composition of liquid assetsheld is subject to guidance from the FSA and to theSociety’s regular stress testing programme that ensures itremains adequate. The stress testing programme, andother policies addressing liquidity risk, are set out in theSociety’s annual Individual Liquidity Adequacy Assessment(ILAA). The ILAA considers a range of time horizons fromone day to several years and is compliant with the BIPRU 12regime that was introduced by the FSA in 2010. This hasresulted in a greater proportion of the liquidity book beingrepresented by UK Government securities or invested withthe Bank of England via a current account. Whilst theseassets realise a relatively low yield, this reflects the very lowcredit risk represented by a AAA rated sovereign entity,such as the UK Government, and ensures the assets canreadily be converted into cash to meet liabilities, as they falldue. Day-to-day management of the Society’s liquidityposition is the responsibility of the Liquidity Planning teamworking closely with the Treasury and Balance SheetManagement functions and is monitored by ALCO and,through this Committee, by the RMC and the Board RiskCommittee.
Liquidity risk is also managed through sale and repurchasearrangements (repos). Treasury assets are encumberedthrough repo and stock lending programmes, which ensurethat these assets remain liquid and readily realisable.
Operational riskOperational risk is the risk of loss arising from inadequateinternal processes, people and systems or from externalevents. These risks are managed as an integral part of theoperation of each of the Society’s business units.Management has a responsibility to understand howoperational risk impacts the area of the business for whichthey are responsible, and for putting in place controls ormitigating activities, overseen and challenged by theOperational Risk team which acts as the second line ofdefence. This team also ensures co-ordination of theSociety’s operational risk assessment, risk eventmanagement process, operational risk stress testing,controls design and other associated activities and isoverseen by the Operational Risk Committee, RMC and theBoard Risk Committee.
Key operational risks are considered more broadly in thecontext of potential linkages to reputational risk, regulatoryand compliance risk, change risk, legal risks, informationtechnology and systems risk and business risk. The Societyregularly stress tests such risks better to understand andmanage the impacts of their occurrence and quantificationto support regulatory capital allocation. This educates theSociety’s broader stress testing framework, includingreverse stress testing.
Regulatory and compliance riskThe Society is committed to meeting its legal and regulatoryresponsibilities and has a team dedicated to developingbusiness standards and policy, overseeing regulatorychange and monitoring compliance. In particular theSociety is focused on delivering positive customer outcomesin the development and distribution of its products andservices. These activities are overseen by the Complianceand Financial Crime Committee.
Financial crimeFinancial crime is managed by the Society’s FinancialCrime team which is part of the risk management function,reporting directly to the Chief Risk Officer and overseen bythe Society’s Compliance and Financial Crime Committee.
This reflects the Society’s desire to recognise and structureFinancial Crime as a separate discipline with dedicatedexpertise to respond professionally to the evolving andsubstantial threat to the security and the safe operation ofall financial institutions. Given the rapidly growingdevelopments in technology, cyber-crime andcommunication and social media, the Society pays closeattention to the source, likelihood and impact of financialcrime generally and the various ways in which this couldmanifest itself. As such, the Society continues to increaseinvestment in resourcing its Financial Crime team andmonitoring and control systems to prevent increasinglysophisticated criminal attacks.
Security and safetyThe Society has a duty of care to its staff, members andvisitors whilst present on Society premises. The Society hasin place comprehensive health and safety polices and acompliance regime which includes internal and externalinspection, the maintenance and testing of equipment aswell as appropriate training programmes which are allreviewed regularly. This work is overseen by the Securityand Safety Committee which reports to the Operational RiskCommittee, RMC and Board each month.

25
Business continuityIn addition the Society has developed Business ContinuityPlans to manage situations in which buildings, systems orsignificant staff are unavailable, for example, in the event ofa flu pandemic or the loss of utilities. The Society’sBusiness Continuity Plan is overseen by the BusinessContinuity Committee which reports into the OperationalRisk Committee and is overseen by RMC and the BoardRisk Committee.
Business riskBusiness risk encompasses those aspects of the externalenvironment that have the potential to affect the Society’sbusiness model. This is particularly relevant in the contextof the multiple major regulatory initiatives currently beingproposed or implemented, including ones which coverliquidity, capital, governance, the special resolution regime,reform of the Financial Services Compensation Scheme andconduct of business, including a review of the mortgagemarket and retail distribution. The regulatory agenda isconsidered to be of strategic importance and as such it isactively considered by all directors and senior managementwith the support of the compliance function.
Further details of risk exposures are available in our Pillar 3 Disclosures on the Society’s website:thecoventry.co.uk/pillar3
CAPITALThe Board determines the level of capital required tosupport the Society’s business objectives through itsInternal Capital Adequacy Assessment Process (ICAAP).The ICAAP evaluates the Group’s risk managementframework, together with financial projections contained inthe corporate plan, in order to assess the significant risksto which it is exposed and the capital resources it needs tosupport its risk exposure over a five year horizon.
The ICAAP incorporates expected future capitalrequirements from changes in business volumes, mix ofassets and activities within the context of current andanticipated future risks, and market stress scenarios. TheICAAP is used by the FSA in its Supervisory Review andEvaluation Process (SREP) through which it sets theGroup’s capital requirements as Individual Capital Guidance(ICG). The amount, composition and adequacy of theGroup’s capital requirement is determined by assessing theBasel II minimum capital requirement, the impact of stressand scenario tests and the Group’s ICG.
The ICAAP is reviewed by the Board Risk Committee beforesubmission to the Board for formal approval as part of thecorporate planning process. The Society’s internal auditfunction reviews the accuracy and consistency of thefinancial information included within the ICAAP document.
Capital levels for the Group are reported to and monitoredby the Board on a monthly basis. The Group continues to bestrongly capitalised and manages its capital substantiallyabove the ICG and Basel II transitional floors at all times.The Group’s core tier 1 capital ratio is the highest reportedby any building society.
Further details of the Group’s capital can be found on pages15 and 16.

26
DIRECTORS’ REPORT ON CORPORATE GOVERNANCE
The Board is accountable to the Society’s members for theoperation of the Society and places the highest priority ongood corporate governance.
This report explains how the Board applies the principles ofthe UK Corporate Governance Code, ‘the Code’ (formerlythe Combined Code which was updated in 2010) issued bythe Financial Reporting Council and the BSA Guidance forBuilding Societies on the Code. The Board has consideredthe requirements of the revised Code and will continue tocomply in a manner which is proportionate to the Society’ssize and scale. Where the provisions of the Code and anyrevisions to it, have not been adopted an explanation isprovided below.
THE BOARD OF DIRECTORSThe Society’s Rules detail the appointment process fordirectors and require that the Board comprises not lessthan six, nor more than 12 directors. The Board hasdetermined that its current composition is appropriate. The Board currently comprises a Chairman, six independentnon-executive directors and three executive directors.
The following persons served as directors of the Societyduring the year: Bridget Blow, Roger Burnell, ColinFranklin, Ian Geden, David Harding, John Lowe, IanPickering, Fiona Smith, Glyn Smith, David Stewart and PhilVaughan (resigned 28 April 2011).
No director has any interest in the shares or debentures ofany associated body of the Society.
The Board has a formal schedule of matters that arereserved to it, and it has also delegated authority in othermatters to a number of Board Committees, as describedbelow. The Board has set clear terms of reference for thesecommittees and has clearly documented delegatedauthority to the executive directors and senior managementtogether with reporting systems for financial results, riskexposure and control assessment.
The Board applies principles of good governance byadopting the following procedures:
the Board’s role is to set the Society’s risk appetite,strategy, review performance, risk management andensure that the necessary resources are in place for itto meet its objectives. The Board also has a generalduty to ensure that the Society operates within its Rules,relevant laws, rules and guidance issued by relevantregulatory authorities and that proper accountingrecords and effective systems of internal control areestablished, maintained, documented and audited. Inparticular the Board’s role is to provide overall directionto the Society and to safeguard the interests of itsmembers. Other powers are devolved to the executivedirectors and senior management;
the Board meets monthly (except August), and alsoholds an annual strategy review meeting. The non-executive directors also meet, without executivedirectors present, at least once a year;
the size and composition of the Board and the seniormanagement team is kept under review to ensure thatthere is adequate succession planning for executive andnon-executive directors and that the Board has theappropriate skills and experience for the direction of theSociety’s activities;
directors receive accurate, timely and clear informationand it is the responsibility of the Chairman to ensurethat this information is considered by the Board;
the Chairman also ensures that, on appointment, non-executive directors receive a comprehensive tailoredinduction programme that covers the Society’s businessand regulatory environment. Non-executive directorsupdate their skills, knowledge and familiarity with theSociety through presentations by senior managers andby attending relevant bespoke internal and externalcourses; and
all directors have access to the advice and services ofthe Secretary and General Counsel, whose appointmentis a matter for the Board. The Secretary and GeneralCounsel is responsible for ensuring compliance withBoard procedures and advising the Board, through theChairman, on governance related matters.

27
The Society maintains liability insurance cover for directorsand officers as permitted by the Building Societies Act 1986.
Set out in the table below are details of the directors during2011 and their attendance record at Board meetings andrelevant Board committee meetings during the year.
BOARD COMMITTEES AND MEETINGS 2011
Number of Number of Number of Nominations and Number of
Number of Board Board Governance RemunerationBoard Audit Committee Risk Committee Committee Committee
Name Title Meetings – 14 Meetings – 6 Meetings – 9 Meetings – 1 Meetings – 4
David Harding Chairman 14 9 1 4
Bridget Blow Deputy Chairman 14 51 33 1 4
Roger Burnell Non-executive director 14 22 9 4
Colin Franklin Sales and Marketing 14 43
Director
Ian Geden Non-executive director 13 5 43 3
John Lowe Finance Director 14 9
Ian Pickering Non-executive director 14 6 9 3
Fiona Smith Non-executive director 13 43 4
Glyn Smith Non-executive director 13 6 9 4
David Stewart Chief Executive 14 9 1
Phil Vaughan Chief Operating Officer 34 34
(resigned 28 April 2011)
1 Re-appointed to the Board Audit Committee on 22 June 2011 – maximum number of Board Audit meetings is 5 as previously a member up to May 2011.
2 Retired as a member of the Board Audit Committee on 22 June 2011 – maximum number of Board Audit meetings is 2.
3 Retired as a member of the Board Risk Committee on 22 June 2011 – maximumnumber of Board Risk meetings is 4.
4 Resigned on 28 April 2011 – maximum number of Board and Board Riskmeetings is 4.
NON-EXECUTIVE DIRECTORSIn the opinion of the Board, Bridget Blow, Roger Burnell, IanGeden, Ian Pickering, Fiona Smith and Glyn Smith areindependent in character and judgement. In accordance withthe Code the Board acknowledges that the test ofindependence is not appropriate in relation to the Chairman,David Harding.
Bridget Blow undertakes the duties of Senior IndependentDirector insofar as they are relevant to a mutual organisation.
CHAIRMAN AND CHIEF EXECUTIVEThe roles of the Chairman and Chief Executive are held bydifferent people and are distinct in their purpose.
The Chairman is responsible for leading the Board andensuring that it acts effectively. The Chief Executive hasoverall responsibility for managing the Society and forimplementing the strategies and policies agreed by theBoard.
David Harding and Bridget Blow were re-elected Chairmanand Deputy Chairman respectively on 25 May 2011.
PERFORMANCE EVALUATIONThe performance of the non-executive directors and each ofthe Board Committees is appraised by the Nominations andGovernance Committee, and the Chairman’s performance isreviewed by the rest of the Board, in the absence of theChairman.

28
DIRECTORS’ REPORT ON CORPORATE GOVERNANCE(continued)
The Board also periodically reviews its own performance,and in 2011 the Chairman commissioned Praesta PartnersLLP to undertake an externally facilitated BoardEffectiveness Review to look at the way the Board wasworking, particularly given the FSA's increasingrequirements of building society directors. The Reviewconfirmed that the Board operated effectively and madecertain recommendations as to how the Board Committeestructure might be improved which have been adopted.
In addition, all directors have open and direct access to theChairman and to the Senior Independent Director in orderto raise any issues of concern.
APPOINTMENTS TO THE BOARDThe appointment of new directors is considered by theNominations and Governance Committee which makesrecommendations to the Board. In accordance with Rule 25 ofthe Society’s Rules, all directors are subject to election bymembers at the AGM following their appointment or, whereapplicable, at the next following AGM. In addition, all directorsmust receive approval from the FSA as an approved person inorder to fulfil their controlled function as a director.
In considering appointments to the Board the directorsrecognise and value the contribution that may be made fromindividuals with a broad range of skills and professional andbusiness experience.
Under Rule 26, directors have to submit themselves for re-election at least once every three years.
The directors retiring by rotation are Roger Burnell, Ian Gedenand David Stewart.
David Harding joined the Board in 1996, becoming Chairmanin 2005. Fiona Smith joined the Board in 2002. The Code hasrecommended that non-executive directors should only servea term of more than nine years in exceptional circumstances,although comments in the Walker Review of Governance inBanks and Other Financial Institutions have recognised theimportance of retaining experience in the sector.
In February 2012, the Board, excluding, for this purpose, theChairman, conducted a review to assess David Harding’sperformance as Chairman. They confirmed that he has led theBoard effectively through a period of transition and difficultmarket conditions during which time the Society hasperformed extremely well.
In accordance with the Code, the Chairman, on behalf of theBoard conducted a review of Fiona Smith concluding that sheremained independent and provided effective challenge. In
February 2012, excluding for this purpose Fiona Smith, theChairman reported his conclusions to the Board and theBoard supported Fiona Smith’s re-election for a further periodof 12 months.
The Board has decided unanimously to recommend for re-election by the members at this year’s AGM the followingdirectors:
Roger BurnellIan GedenDavid HardingFiona SmithDavid Stewart
As noted above, although it is not obliged to do so, the Societycomplies with and has regard to the revisions to the Code in2010 insofar as it is appropriate. In this connection the Boardhas considered the provisions of the revised Code and doesnot feel that it would be appropriate, at present, to submit theentire Board for annual re-election by the members. TheBoard will continue to keep under review the appropriatenessof the revised Code’s provisions on the annual election ofdirectors.
In addition to attendance at Board and committee meetings,as detailed below, and meetings with senior management andbranch visits, non-executive directors are required to completea detailed induction programme (on appointment) and toparticipate in a structured programme of director training inorder to keep abreast with new regulatory requirements andsome of the more technical aspects of the role. Non-executivedirectors are also encouraged to engage with the Society’smembers through the AGM process, the Society’s MembersCouncil Meetings and the Society’s programme of memberroadshows.
BOARD COMMITTEESThe Board has established a number of committees that havetheir own terms of reference. Details of the principal BoardCommittees, including their membership, are set out below.
BOARD RISK COMMITTEEThe Board Risk Committee assists the Board in fulfilling itsoversight responsibilities for risk management across theSociety. In particular the Committee undertakes the following:
oversees and advises the Board in relation to currentand potential future risk exposures to the Society,including determination of risk appetite, risk limits andtolerances across the full range of risks to which theSociety may be exposed;

29
satisfies itself on the design and completeness of theSociety’s internal control and assurance frameworkrelative to the risks that it faces including culture, policy,processes, structure and systems;reviews major initiatives, such as acquisitions or changeprojects, and seeks assurance that appropriate duediligence has been carried out and that any associatedmovement in risks to which the Society may be exposedremains within risk appetite.
The Committee meets monthly and the members of theCommittee are:
Ian Pickering (Committee Chairman, appointed 1 December2011, and non-executive director)Roger Burnell (non-executive director) Peter Elcock (Chief Risk Officer)John Lowe (Finance Director)Glyn Smith (non-executive director)Fiona Smith (non-executive director, reappointed as amember of the Committee on 22 February 2012, followingretirement on 22 June 2011)David Stewart (Chief Executive)
David Harding (Board Chairman) served as Committeechairman up to 1 December 2011 and retired as a member ofthe Committee in January 2012. The Society’s Secretary andGeneral Counsel attends Board Risk Committee meetings.
BOARD AUDIT COMMITTEEThe responsibilities of the Committee are in line with theprovisions of the Financial Reporting Council Guidance onAudit Committees. The main function of the Committee is toassist the Board in fulfilling its oversight responsibilities withspecific regard to:
monitoring the integrity of the half-year and annualfinancial statements and any formal announcementsrelating to financial performance, focusing particularly onsignificant financial reporting judgements contained inthem;reviewing the adequacy of systems of internal control andrisk management processes;approving the annual internal audit plan;monitoring the effectiveness of the external audit processand making recommendations to the Board on theappointment, re-appointment and remuneration of theexternal auditors;ensuring that an appropriate relationship between theSociety and the external auditors is maintained, includingreviewing non-audit services which can be provided andfees; andreviewing the effectiveness of the internal audit function.The Committee is responsible for approving theappointment and removal of the Head of Internal Audit.
In 2011, the Committee met six times in the execution of itsresponsibilities and, in particular, considered reports on thefollowing matters:
the Society’s risk management framework and systems ofinternal control;the integrity of financial statements;the activities of internal and external auditors, includingthe effectiveness of the internal audit function and theperformance of the external auditor;the appointment of the external audit firm to undertakenon-audit services;the effectiveness of the Committee; andthe Society’s whistle-blowing arrangements.
Reports were provided by the finance, internal audit,operational risk and compliance functions and the externalauditors.
The Committee also held private discussions with the externalauditors, the Chief Risk Officer and the Head of Internal Audit.The minutes of the Board Audit Committee are distributed tothe Board and the Committee Chairman reports verbally tothe Board meeting immediately following Committeemeetings.
The Committee regularly reviews and monitors the Society’srelationship with the external auditors to ensure that auditorindependence and objectivity is maintained at all times, takinginto consideration relevant UK professional and regulatoryrequirements. The Committee has developed a policy andframework which defines unacceptable non-auditassignments, pre-approval of acceptable non-auditassignments and procedures for approval of other non-auditassignments. This framework ensures that at no time will theexternal auditors audit their own work, make managementdecisions for the Society, create a conflict of interest or findthemselves in the role of advocate for the Society. Further, theSociety's policy and framework requires that the externalauditors should not be appointed if the threat is other thanclearly insignificant, unless appropriate safeguards can beapplied to eliminate or reduce the threat of objectivity to anacceptable level.
During 2011 the Society engaged the external audit firm toprovide significant non-audit services. These engagementsincluded services connected with the merger with Stroud &Swindon Building Society and other regulatory, accountingand taxation advice. Prior to the engagement the Committeeundertook a review, within the terms of the Society's policyand framework, to satisfy itself on the following:
(i) the skills and experience of the audit firm, (ii) the safeguards in place to eliminate or reduce any threat
to objectivity and independence,

30
DIRECTORS’ REPORT ON CORPORATE GOVERNANCE(continued)
(iii) the nature of the non-audit services, (iv) the fees to be incurred for non-audit services, and (v) the criteria which govern the compensation of the
individuals performing the audit.
During 2011 the Committee received advice on its role andresponsibilities to review and monitor the external auditor’sindependence and objectivity and the audit partner, MrWallace, provided assurance to the Committee that he wassatisfied that appropriate safeguards were put in place withinthe audit firm to satisfy the requirements of the AuditingPractices Board Ethical Standard 5. Mr Wallace confirmed tothe Committee that the objectivity of his opinion on theSociety's financial statements would not be impaired. TheCommittee concluded, prior to each engagement for theprovision of non-audit services, that it would be in the bestinterests of the Society to proceed with the appointment of theaudit firm to undertake such services. The Committee keepsnon-audit engagements under review and receives regularreports from the audit partner confirming that adequatesafeguards remain in place. The Society also assignedservices to a number of major accountancy firms during theyear.
Details of the fees paid to the external auditors for audit andnon-audit services are set out in note 9 in the Accounts.
The outcome of the Committee’s monitoring informs theCommittee’s recommendation to the Board on the re-appointment of the external auditors. The final decision on therecommendation to the members is reserved for the Board.
The Committee ran a tender in relation to the Society’sexternal audit work in 2007 and plans to run a similar exerciseby 2014.
The Committee consists of the following non-executivedirectors only:
Glyn Smith (Committee Chairman since 1 December 2011)Ian Pickering (Committee Chairman up to 1 December 2011)Bridget Blow (Reappointed as a member of the Committee on22 June 2011, following retirement in May 2011)Roger Burnell (Retired from the Committee on 22 June 2011)Ian Geden
The Society’s external auditors, the Chief Executive, FinanceDirector, Chief Risk Officer, Secretary and General Counsel,Head of Internal Audit and other senior managers attendmeetings as required by the Committee. In addition, theexternal auditors meet members of the Committee in aprivate session at least annually.
The Chairman of the Committee, Glyn Smith, has recent andrelevant financial experience and is a Chartered Accountant.
The Committee also completed a self appraisal exercise in2011 and considers that it has met its responsibilities andperformed its duties with appropriate levels of care andexpertise.
NOMINATIONS AND GOVERNANCECOMMITTEEThe Committee consists of:
David Harding, Chairman of the Society and CommitteeChairmanBridget Blow, Deputy ChairmanDavid Stewart, Chief Executive
The Committee is responsible for making recommendationsto the Board on matters relating to the composition of theBoard (including Board succession planning, the appointmentof new directors, the re-appointment of retiring directors, theappointment of non-executive and executive directors toCommittees of the Board and senior managementappointments).
In 2011 the Committee met and considered, amongst otherthings, its terms of reference, Board Committee membershipand the appointment of a new Secretary and General Counseland Chief Risk Officer.
Through the AGM process the Society issues a standinginvitation to members to apply for the position of non-executive director. Through this process a number ofcandidates were interviewed by members of the Committee in2011 and previous appointments to the Board through thisprocess include the appointments in 2008 of two new non-executive directors. External consultants and recruitmentspecialists are also employed by the Society in consideringdirector and senior management succession planning.
REMUNERATION COMMITTEESince January 2012 the Committee consists of:
Bridget Blow, Deputy Chairman and Senior IndependentDirector (Committee Chairman)Roger BurnellIan GedenDavid HardingFiona Smith
Throughout 2011 all the non-executive directors weremembers of the Remuneration Committee. Ian Pickering andGlyn Smith retired from the Committee in January 2012.
The Committee is responsible for considering and approvingthe remuneration of executive directors and seniormanagement and also sets targets for the Society’sperformance related bonus scheme in which all staff

31
members participate. During 2011 the Committee hasreviewed the implications of the FSA’s Remuneration Codeand approved the Society’s Remuneration Policy Statement onbehalf of the Board. In 2011 the Committee met four times.Further details of the Committee, the remuneration policy anddirectors’ service contracts can be found in the Directors’Remuneration Report on pages 32 to 36.
The Code states that the Remuneration Committee should setthe remuneration of the Chairman. However, the Boardbelieves that it is more appropriate for the remuneration of theChairman to be set and reviewed in the same manner as thatused to determine the remuneration for the other non-executive directors. It is therefore dealt with by the Board,acting upon a recommendation from the executive directorsand excluding, for this purpose, the Chairman. No directortakes part in the discussion of his/her own remuneration.
The terms of reference of the Board Risk Committee, BoardAudit Committee, the Nominations and GovernanceCommittee and the Remuneration Committee, and the lettersof appointment for non-executive directors, are available onrequest from the Secretary and General Counsel.
INTERNAL CONTROLSResponsibility for implementing sound and effectivesystems of internal control has been delegated by theBoard to senior management. The internal audit functionprovides independent assurance to the Board on theeffectiveness of the systems of internal control through theBoard Audit Committee.
The information received and considered by the Board AuditCommittee provided assurance that, during 2011, therewere no material breaches of control or regulatoryrequirements and that, overall, the Society maintainedadequate systems of internal control.
The Board reviews the effectiveness of systems of internalcontrol through a combination of processes including:
regular reports to the Board, through the Board AuditCommittee, from the internal audit function in respectof their independent audits of risk managementprocesses and the effectiveness of internal controlsacross the Society. The Head of Internal Audit has directaccess to the Chairman of the Board Audit Committee;
regular reports to the Board, through the Board RiskCommittee, from the Risk function on the principaloperational, credit, business and regulatory risks facingthe Society and the strength of the controls in place tomitigate such risks. The Chief Risk Officer has directaccess to the Chairman of the Board Risk Committee;
regular reports and presentations to the Board by theChairmen of the various Board Committees – seeabove; and
reports presented by the Chief Risk Officer at eachBoard meeting.
The Society is committed to internal control and riskmanagement in the operation of the Society and to dealwith areas for improvement, which come to the attention ofexecutive management and the Board promptly. The Societyhas a comprehensive system for reporting business,operational and financial performance to the Board.
The Society has a number of functions including Finance,Risk and Compliance, that establish and monitor theimplementation of policies and processes across theSociety. Each of these functions is subject to review by theinternal audit function.
The internal audit function is responsible for independentlyreviewing and reporting on the adequacy and effectivenessof internal controls operated by management across theSociety, thereby helping to evaluate and improve theeffectiveness of risk management, regulatory compliance,control and governance processes. Through its programmeof work, agreed by the Board Audit Committee, the internalaudit function is able to provide assurance on controleffectiveness.
The Board is satisfied that during 2011 the Societymaintained an adequate system of internal control that metthe requirements of the Code.
RELATIONS WITH MEMBERSThe Society’s members comprise its shareholding investorsand borrowers. The majority of its customers are thereforemembers and the Society encourages feedback from themon all aspects of the Society’s activities.
All members who are eligible are also encouraged toexercise their vote at the AGM either by attending in personor by voting by proxy, for which purpose they are sent aproxy voting form and reply-paid envelope, or they can votein any branch or online. All proxy votes are counted. Allresolutions are taken on a poll and the Chairman indicatesthe level of proxies lodged on each resolution byannouncing the numbers for and against the resolution andthe number withheld. A separate resolution is proposed oneach item including a resolution on the Annual Report &Accounts. The Society employs Electoral Reform ServicesLimited to act as independent scrutineers and ensure thevotes are properly received and recorded.

DIRECTORS’ REMUNERATION REPORT
32
INTRODUCTIONThis report informs members of the policy for theremuneration of both executive and non-executive directorswho are equally responsible in law for directing theSociety’s affairs.
In order to comply with the disclosure requirements of theCapital Requirements Directive (CRD 3), in respect of ‘CodeStaff’, this report also outlines the responsibilities anddecision-making process for determining remunerationpolicy, the link between pay and performance and thedesign and structure of remuneration, including theperformance pay plans.
REMUNERATION DISCLOSUREREQUIREMENTSThe Society is compliant with the FSA’s Remuneration Code,and meets the additional requirements of the FSA’s rulesregarding remuneration disclosure, in compliance with theCRD 3.
These additional disclosures focus on the remunerationpolicies and practices for staff who have a material impacton the Society’s risk profile (‘Code Staff’). Code staff consistof executive directors, non-executive directors and certainsenior managers in control functions (e.g. humanresources, audit, risk and compliance).
Responsibility for the approval and periodic review of theSociety’s remuneration policy, while having due regard tothe FSA’s Remuneration Code, rests with the BoardRemuneration Committee. This includes ensuring that theSociety complies with the FSA remuneration disclosurerequirements.
SOCIETY REMUNERATION POLICY -PRINCIPLESThe Society’s remuneration policy is based on the followingkey principles:
the remuneration of directors and other Code Staff,including staff in control functions, is in line with theFSA’s Remuneration Code;total rewards, subject to satisfactory performance,should be competitive and positioned around the marketmedian for the comparator group;incentive plans, performance measures and targets arestretching and aligned with members’ interests;policy is designed to recruit and retain quality staff at alllevels and to ensure that remuneration packages reflecttheir responsibilities, performance and experience;remuneration promotes sound and effective riskmanagement and does not encourage excessive risktaking;remuneration strategy is in line with the businessstrategy, objectives, values and long-term interests ofthe Society;
remuneration strategy does not result in conflicts ofinterests;remuneration is consistent with the overall financialstability of the Society and does not present materialrisk to this stability;bonus payments will be limited or withdrawn whereindividual or business performance does not meritpayment of a bonus;where staff do not perform to the required standard,under performance will not be rewarded;remuneration of staff in control functions does notaffect their independence in any way;the performance of all staff is reviewed each yearagainst agreed individual and business objectives. The outcome of this review is taken into account whenconsidering pay decisions; andno executive director, senior manager or member ofstaff is involved in the setting of his or her ownremuneration.
REMUNERATION COMMITTEEThe Board has overall responsibility for the Society’sremuneration, which is delegated to the RemunerationCommittee. The Committee consists exclusively of non-executive directors and is chaired by Bridget Blow, DeputyChairman and Senior Independent Director.
The Remuneration Committee is responsible for setting andreviewing the elements that comprise the remunerationpackage for executive directors and senior management.These currently comprise a base salary, performancerelated bonuses, pension arrangements and other benefits.The Committee sets the targets of the Long Term IncentivePlan (LTIP) for executive directors and senior managementand for the Society’s annual performance related bonusscheme in which all staff members participate on the samebasis.
In fulfilling this responsibility, the Remuneration Committeehas taken full account of industry best practice as advisedby the FSA and reviewed the remuneration policies of theSociety’s peer group and other businesses of a similar sizeand complexity.
Independent consultants have been commissioned to reviewthe Society’s remuneration for senior managers, and forexecutive and non-executive directors, including theChairman; Towers Watson provides general salarybenchmarking data to the Society, and KPMG LLP hasprovided advice on matters relating to the remuneration ofexecutive directors and other senior management. In 2011the Remuneration Committee met four times.
POLICY FOR EXECUTIVE DIRECTORSExecutive directors are employed by the Society and arerequired to devote substantially the whole of their time to its

33
affairs. The policy of the Board is to recruit and retain highcalibre executive directors and to ensure that theirremuneration reflects their responsibilities, experience andperformance.
As would be expected, the Remuneration Committee hastaken full account of best practice in executive reward and incorporate governance. The UK Corporate Governance Codestates that “a significant proportion of executive directors’remuneration should be structured so as to link rewards tocorporate and individual performance”. It continues thatperformance related elements should be “stretching anddesigned to promote the long-term success of thecompany”. In doing so, it provides that some bonusarrangements are necessary if the Society is to meet therequirements of the Code.
The Remuneration Committee accepts best practicerecommendations and believes that carefully controlledperformance related bonuses, which enable a flexibleapproach to remuneration, are in the best interests of theSociety and its members. It enables payments to be alignedaccurately to results and ensures that the Society’s costs arereduced if for any reason financial performance deteriorates.
The Committee believe that a combination of short and long-term plans support this objective. However it is essentialthat these payments are not excessive, and added togetherthey are currently limited to a maximum of 60% of fixed pay.In addition, as described further below, all payments aresigned off by the Remuneration Committee which takesaccount of a number of factors to ensure that remunerationis consistent with and promotes effective risk managementand fair treatment of members.
Whilst the Remuneration Committee accepts that bestpractice requires that a significant proportion ofremuneration should be paid by way of variable,performance related pay, it is alert to the risk of excessivebonus payments and therefore it continues to set thepotential for bonuses at levels below those typically availableat similar institutions.
The results of the Society’s annual benchmarking exercise,together with the Society’s remuneration policy, werereviewed by KPMG LLP who confirmed that the potential forvariable pay for the executive directors (comprising theannual performance related bonus and the LTIP) is belowmarket median, as is the level of total remuneration.
The FSA’s Remuneration Code indicates that at least 50% ofany variable remuneration component is to be made inshares, share linked instruments or other equivalent non-cash instruments, subject to an undefined retention periodand the de minimis rules. As a membership owned, mutualinstitution no such instruments currently exist. This sectorwide issue is recognised by the FSA and ways to address
this anomaly are under discussion, with resolution requiredby 1 July 2012. The structure of the Society’s Long TermIncentive Plan meets the FSA’s requirements for part of thevariable element of remuneration to be deferred for certainstaff.
The principal elements of the Society’s remunerationpackages are described in the following sections:
a) Base salaryFor all employed staff, including executive directors, theSociety aims to pay fair and competitive salaries, linkedto individual performance. To ensure this, salaries arecompared to market rates with the aim of paying marketmedian rates for experienced staff who have minimaltraining needs and who are performing to a goodstandard or above.
For each role there is a salary range, which allows forsalaries to increase as individuals become moreexperienced in their role. Some areas of the businesshave accreditation or salary progression schemes whichapply a minimum salary level when certain performancecriteria have been demonstrated consistently.
b) Annual performance related bonusAll eligible staff participate in a discretionary annualperformance related bonus scheme. Eligibility isdependent upon satisfactory individual performance. Itapplies to all staff on the same terms, includingexecutive directors and senior management, Code Staffand staff in control functions. It does not apply to non-executive directors.
The scheme is reviewed each year in the light ofbusiness plans. The target requires that a certain level ofprofit before tax and certain exceptional items isachieved, with the Board retaining the discretion tochange the threshold target in the light of unforeseenevents and the determination of exceptional items. TheRemuneration Committee also takes into account theSociety’s non-financial performance including customersatisfaction before an annual performance related bonusis calculated.
The annual performance related bonus is calculated as apercentage of base annual salary as at 31 Decembereach year, the last day of the scheme year. There is noguarantee that a payment will result.
In line with the FSA’s Remuneration Code, theRemuneration Committee will adjust the annualperformance related bonus in respect of Code Staff if itdeems this to be appropriate, taking into account arange of factors including satisfactory individualperformance, risk management and customer service.

34
c) Long Term Incentive Plan The Remuneration Committee established the LongTerm Incentive Plan (LTIP) to ensure a strong linkbetween the remuneration package of executivedirectors and senior managers and the interests ofmembers through an assessment of the long-termperformance of the Society.
The subsequent provision of the FSA’s RemunerationCode confirmed the requirement for part of the variableremuneration to be deferred for certain staff. The LongTerm Incentive Plan fulfils this requirement.
The primary objective of this plan is to alignremuneration with the longer term goals of the Society.The LTIP also helps the Society to recruit and retainhigh calibre individuals and to ensure that theirremuneration packages reflect their responsibilities,performance and experience.
In 2011, an LTIP grant was made, whereby participantsare eligible to receive a performance related paymentbased on the financial performance of the Society over arolling three year period from 2011-2013. These areaccrued in the accounts over the vesting period.
The plan is designed to make payments in the yearfollowing the end of the three year period provided thatconsistent and strong performance is achieved againstthe three year plan. An on-target performance wouldprovide a 10% of salary payment for executive directorsand a 5% of salary payment for other seniormanagement, with a current maximum of 40%(executive directors) or 20% (senior management) forsubstantial over-performance over the period. This isbelow the 50% of salary maximum currently permittedunder the Society’s Rules. There are currently threeexecutive directors and four senior managers that havebeen awarded grants under one or more of the Society’sLTIP schemes.
The Scheme requires that a certain level of profitabilityis achieved whilst maintaining the competitiveness ofthe Society’s savings and mortgage products asmeasured by the interest rates offered. TheRemuneration Committee reviews all payments and canaward a lower amount if appropriate. To protect theinterests of members, the Committee may amend anypayment if it considers it appropriate in light of eitherthe Society’s overall performance or economic
conditions. In making its assessment the RemunerationCommittee may take into account any one or more ofthe following factors:
market share;customer and member satisfaction;health and safety record;risk management factors;overall financial performance of the Society relative tothe performance of other building societies and in lightof the market conditions prevailing during theperformance period;individual performance; andany other factors the Remuneration Committee feelsare relevant.
All payments under the LTIP are subject to approval bythe Remuneration Committee and are not pensionable.
d) Pension arrangementsCoventry Building Society closed its final salary pensionscheme to all new entrants, including senior managers,in December 2001, replacing it with a definedcontribution pension scheme.
No special arrangements have been put in place for theexecutive directors or senior management since thischange was implemented and consequently the FinanceDirector, who joined subsequent to 2002, is an activemember of the Society’s funded defined contributionpension scheme.
David Stewart left the final salary scheme immediatelybefore being appointed Chief Executive in July 2006, andjoined the defined contribution scheme.
The Sales and Marketing Director, whose long service atthe Society pre-dates 2002 by a number of years,continues to be a member of the Society’s contributoryfinal salary pension scheme.
Full details of executive directors’ pension benefits canbe found in note 11 on pages 55 and 56 to the Accounts.
e) Other benefitsEach executive director is provided with a fully expensedcar or a cash alternative, and personal membership of aprivate medical insurance scheme.
DIRECTORS’ REMUNERATION REPORT(continued)

35
NON-EXECUTIVE DIRECTORSNon-executive directors are independent of the Society’smanagement and are not required to devote the whole oftheir time to its affairs.
A Committee consisting of the Chairman, Chief Executive,Finance Director and Head of Human Resources has beenestablished in 2012, to set and review the elements thatcomprise the remuneration of non-executive directors. Nodirector takes part in the discussion of his or her ownremuneration and recommendations for the remunerationof the Chairman are made by executive management.
Fees of non-executive directors, are reviewed annually inlight of their responsibilities and comparative informationfrom other building societies, and financial institutions.Consistent with the Society’s approach to the remunerationof executive directors, the Society has reviewed fees paid bysimilar institutions and found that those paid at Coventryare typically below those made elsewhere.
Non-executive directors do not participate in anyperformance related pay or bonus scheme, pensionarrangements or other benefits.
Directors emoluments are disclosed in Note 11 to theAccounts, on pages 55 and 56.
DIRECTORS’ SERVICE CONTRACTSIn 2006 the Society entered into a service contract withDavid Stewart (Chief Executive), and is terminable by DavidStewart on six months’ notice and by the Society on oneyear’s notice.
In 2009 the Society appointed Colin Franklin (Sales andMarketing Director) to the Board. A service contract wasentered into which is terminable by Colin Franklin on sixmonths’ notice and by the Society on one year’s notice.
In 2010 the Society appointed John Lowe (Finance Director)to the Board. A service contract was entered into, which isterminable by John Lowe on six months’ notice and by theSociety on one year’s notice.
Phil Vaughan (Chief Operating Officer) resigned from theBoard on 28 April 2011.
AGGREGATE REMUNERATION DATAThe Prudential Sourcebook for Banks, Building Societiesand Investment Firms (BIPRU) requires the Society todisclose aggregate remuneration data for all staff andseparately for all Board directors, senior management andmembers of staff whose actions have a material impact onthe risk profile of the firm (Code Staff). Total fixed pay paidto all employees in 2011 was £46.4 million and variable paywas £4.6 million. Details of remuneration to Code Staff aredetailed on page 36.
2011 ANNUAL PERFORMANCE BONUS –SUMMARY OF PERFORMANCE The Society has performed strongly in 2011, exceeding eachof its key performance targets. Details of this performanceare set out in the Chairman’s Statement (pages 2 and 3),Chief Executive’s Review (pages 5 to 9), Directors’ Report(pages 12 to 19), with highlights also included on page 1.
This outstanding performance gave rise to a calculatedbonus for all 1,749 eligible members of staff equivalent to13% of base salary. The bonus percentage payable to eachof the executive directors is the same as all other eligiblestaff.
2009-2011 LONG TERM INCENTIVE PLAN– SUMMARY OF PERFORMANCE The Society has achieved outstanding results throughoutthe period of assessment, underpinning Coventry’s pre-eminent position in the UK building society sector. TheSociety exceeded substantially each of the targets set in itsplans for the period.
Further information in respect of this performance isprovided in the Chairman’s Statement (pages 2 and 3), ChiefExecutive’s Review (pages 5 to 9) and Directors’ Report(pages 12 to 19). Highlights are also included on page 4.
The Remuneration Committee considers that Coventry’sperformance, during a period of continued economicuncertainty which has resulted in significant challenges forall financial institutions, compares favourably with that ofall major banks and building societies.
Taking into account both overall performance and thatagainst the specific 2009 LTIP targets, the RemunerationCommittee approved a payment for each participantequivalent to 15% of base salary at 1 January 2009.

36
The remuneration relevant to Code Staff, comprising senior management and other material risk takers was as follows for2011 and 2010:
Aggregate remuneration data for Jan-Dec 2011
Number of Fixed pay3 Variable pay4
staff £m £m
Senior managers1 23 2.9 0.5 Other material risk takers2 14 0.9 0.1
Total 37 3.8 0.6
1. Non-executive directors, executive directors and senior managers including Stroud & Swindon executives for period January to May 2011. Non-executivedirectors’ fees are included under fixed pay; no variable pay is awarded to non-executive directors.
2. Other Code Staff to cover those whose actions have a material impact on the risk profile of the Society, including Stroud & Swindon Code Staff.3. Fixed pay includes basic pay, allowances and employer pension contributions.4. Variable pay includes the annual performance related bonus (£0.3m) for 2011 (paid March 2012) and the LTIP 2011-2013 payment granted (not paid) in 2011
(£0.3m). The LTIP payment included above is the maximum possible under the scheme (40% executive directors and 20% senior managers of salary as at theGrant Date); the actual payment will be subject to the performance criteria outlined on page 34.
Aggregate remuneration data for Jan-Dec 2010
Number of Fixed pay3 Variable pay4
staff £m £m
Senior managers1 20 2.3 0.5 Other material risk takers2 13 0.7 0.1
Total 33 3.0 0.6
1. Non-executive directors, executive directors and senior managers including Stroud & Swindon executives for period September to December 2010. Non-executive directors’fees are included under fixed pay; no variable pay is awarded to non-executive directors.
2. Other Code Staff to cover those whose actions have a material impact on the risk profile of the Society, including Stroud & Swindon Code Staff for period September to December 2010.
3. Fixed pay includes basic pay, allowances and employer pension contributions.4. Variable pay includes the annual performance related bonus (£0.3m) for 2010 (paid March 2011) and the LTIP 2010-2012 payment granted (not paid) in 2010 (£0.3m). The LTIP
payment included above is the maximum possible under the scheme (40% of salary as at the Grant Date); the actual payment will be subject to the performance criteriaoutlined on page 34.
On behalf of the Board
Bridget Blow Chairman of the Remuneration Committee
29 February 2012
DIRECTORS’ REMUNERATION REPORT(continued)
37
STATEMENT OF DIRECTORS’RESPONSIBILITIESThe following statement, which should be read in conjunction with the statement of the auditors’ responsibilities on page 38,is made by the directors to explain their responsibilities in relation to the preparation of the Annual Accounts, AnnualBusiness Statement and Directors’ Report.
The directors are responsible for preparing the Annual Report, Annual Business Statement, Directors’ Report and theAnnual Accounts in accordance with applicable law and regulations.
The Building Societies Act 1986 (the Act) requires the directors to prepare Group and Society Annual Accounts for eachfinancial year. Under that law they are required to prepare the Group Annual Accounts in accordance with InternationalFinancial Reporting Standards (IFRS) as adopted by the European Union (EU) and applicable law and have elected to preparethe Society Accounts on the same basis.
The Group and Society Annual Accounts are required by law and IFRS as adopted by the EU to present fairly the financialposition and the performance of the Group and the Society; the Building Societies Act 1986 provides in relation to suchAnnual Accounts that references in the relevant part of that Act to Annual Accounts giving a true and fair view are referencesto their achieving a fair presentation.
In preparing each of the Group and Society Annual Accounts, the directors are required to:
select suitable accounting policies and apply them consistently;make judgements and estimates that are reasonable and prudent;state whether they have been prepared in accordance with IFRS as adopted by the EU; andprepare the Annual Accounts on the going concern basis, unless it is inappropriate to presume that the Group andSociety will continue in business.
In addition to the Annual Accounts, the Act requires the directors to prepare, for each financial year, an Annual BusinessStatement and a Directors’ Report, each containing prescribed information relating to the business of the Group.
The directors are responsible for ensuring that the Group:
keeps proper accounting records that disclose with reasonable accuracy at any time the financial position of the Groupand Society, in accordance with the Act; andtakes reasonable care to establish, maintain, document and review such systems and controls as are appropriate to itsbusiness (in accordance with the rules made by the FSA under the Financial Services and Markets Act 2000).
The directors have general responsibility for safeguarding the assets of the Group and for taking reasonable steps for theprevention and detection of fraud and other irregularities.
The directors are satisfied that the Group has adequate resources to continue in business for the foreseeable future. For thisreason, the Annual Accounts continue to be prepared on the going concern basis.

INDEPENDENT AUDITORS’ REPORT
INDEPENDENT AUDITORS’ REPORT TO THE MEMBERS OF COVENTRY BUILDINGSOCIETYWe have audited the Group and Society financial statements of Coventry Building Society for the year ended 31 December2011 which comprise the Group and Society Income Statements, Group and Society Statements of Comprehensive Income,Group and Society Statements of Financial Position, the Group and Society Statements of Changes in Members’ Interests, theGroup and Society Statements of Cash Flows and the related notes 1 to 42. The financial reporting framework that has beenapplied in their preparation is applicable law and International Financial Reporting Standards (IFRSs) as adopted by theEuropean Union.
This report is made solely to the Society's members, as a body, in accordance with Section 78 of the Building Societies Act1986. Our audit work has been undertaken so that we might state to the Society's members those matters we are required tostate to them in an auditors' report and for no other purpose. To the fullest extent permitted by law, we do not accept orassume responsibility to anyone other than the Society and the Society's members as a body, for our audit work, for thisreport, or for the opinions we have formed.
RESPECTIVE RESPONSIBILITIES OF DIRECTORS AND AUDITORAs explained more fully in the Directors’ Responsibilities Statement set out on page 37, the directors are responsible for thepreparation of the financial statements which give a true and fair view. Our responsibility is to audit and express an opinion onthe financial statements in accordance with applicable law and International Standards on Auditing (UK and Ireland). Thosestandards require us to comply with the Auditing Practices Board’s Ethical Standards for Auditors.
SCOPE OF THE AUDIT OF THE FINANCIAL STATEMENTSAn audit involves obtaining evidence about the amounts and disclosures in the financial statements sufficient to givereasonable assurance that the financial statements are free from material misstatement, whether caused by fraud or error.This includes an assessment of: whether the accounting policies are appropriate to the Group’s and Society’s circumstancesand have been consistently applied and adequately disclosed; the reasonableness of significant accounting estimates made bythe directors; and the overall presentation of the financial statements. In addition, we read all the financial and non-financialinformation in the annual report to identify material inconsistencies with the audited financial statements. If we become awareof any apparent material misstatements or inconsistencies we consider the implications for our report.
OPINION ON FINANCIAL STATEMENTSIn our opinion the financial statements:
give a true and fair view, in accordance with IFRSs as adopted by the European Union, of the state of the Group’s and theSociety’s affairs as at 31 December 2011 and of the Group’s and the Society’s income and expenditure for the year thenended; andhave been prepared in accordance with the requirements of the Building Societies Act 1986 and, as regards the Groupfinancial statements, Article 4 of the IAS Regulation.
38

OPINION ON OTHER MATTERS PRESCRIBED BY THE BUILDING SOCIETIES ACT 1986In our opinion:
the Annual Business Statement and the Directors’ Report have been prepared in accordance with the requirements of theBuilding Societies Act 1986;the information given in the Directors’ Report for the financial year for which the financial statements are prepared isconsistent with the accounting records and the financial statements; andthe information given in the Annual Business Statement (other than the information upon which we are not required to report)gives a true representation of the matters in respect of which it is given.
MATTERS ON WHICH WE ARE REQUIRED TO REPORT BY EXCEPTIONWe have nothing to report in respect of the following matters where the Building Societies Act 1986 requires us to report to you if,in our opinion:
proper accounting records have not been kept by the Society; orthe Society financial statements are not in agreement with the accounting records; orwe have not received all the information and explanations and access to documents we require for our audit.
Peter Wallace (Senior statutory auditor)for and on behalf of Ernst & Young LLP, Statutory AuditorLondon
29 February 2012
39
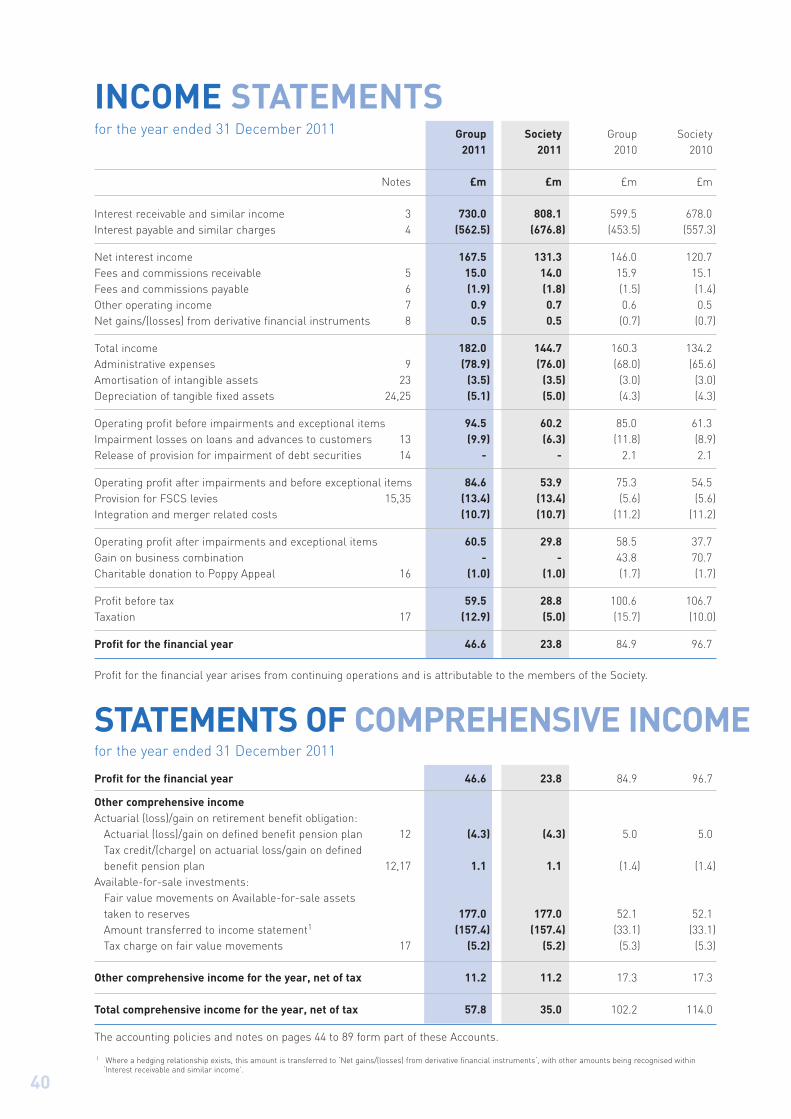
INCOME STATEMENTSGroup Society Group Society
2011 2011 2010 2010
Notes £m £m £m £m
Interest receivable and similar income 3 730.0 808.1 599.5 678.0 Interest payable and similar charges 4 (562.5) (676.8) (453.5) (557.3)
Net interest income 167.5 131.3 146.0 120.7 Fees and commissions receivable 5 15.0 14.0 15.9 15.1 Fees and commissions payable 6 (1.9) (1.8) (1.5) (1.4)Other operating income 7 0.9 0.7 0.6 0.5 Net gains/(losses) from derivative financial instruments 8 0.5 0.5 (0.7) (0.7)
Total income 182.0 144.7 160.3 134.2 Administrative expenses 9 (78.9) (76.0) (68.0) (65.6)Amortisation of intangible assets 23 (3.5) (3.5) (3.0) (3.0)Depreciation of tangible fixed assets 24,25 (5.1) (5.0) (4.3) (4.3)
Operating profit before impairments and exceptional items 94.5 60.2 85.0 61.3 Impairment losses on loans and advances to customers 13 (9.9) (6.3) (11.8) (8.9)Release of provision for impairment of debt securities 14 - - 2.1 2.1
Operating profit after impairments and before exceptional items 84.6 53.9 75.3 54.5 Provision for FSCS levies 15,35 (13.4) (13.4) (5.6) (5.6)Integration and merger related costs (10.7) (10.7) (11.2) (11.2)
Operating profit after impairments and exceptional items 60.5 29.8 58.5 37.7 Gain on business combination - - 43.8 70.7 Charitable donation to Poppy Appeal 16 (1.0) (1.0) (1.7) (1.7)
Profit before tax 59.5 28.8 100.6 106.7 Taxation 17 (12.9) (5.0) (15.7) (10.0)
Profit for the financial year 46.6 23.8 84.9 96.7
Profit for the financial year arises from continuing operations and is attributable to the members of the Society.
STATEMENTS OF COMPREHENSIVE INCOMEProfit for the financial year 46.6 23.8 84.9 96.7
Other comprehensive incomeActuarial (loss)/gain on retirement benefit obligation:
Actuarial (loss)/gain on defined benefit pension plan 12 (4.3) (4.3) 5.0 5.0Tax credit/(charge) on actuarial loss/gain on defined benefit pension plan 12,17 1.1 1.1 (1.4) (1.4)
Available-for-sale investments:Fair value movements on Available-for-sale assets taken to reserves 177.0 177.0 52.1 52.1Amount transferred to income statement1 (157.4) (157.4) (33.1) (33.1)Tax charge on fair value movements 17 (5.2) (5.2) (5.3) (5.3)
Other comprehensive income for the year, net of tax 11.2 11.2 17.3 17.3
Total comprehensive income for the year, net of tax 57.8 35.0 102.2 114.0
The accounting policies and notes on pages 44 to 89 form part of these Accounts.
for the year ended 31 December 2011
for the year ended 31 December 2011
401 Where a hedging relationship exists, this amount is transferred to ‘Net gains/(losses) from derivative financial instruments‘, with other amounts being recognised within
‘Interest receivable and similar income’.
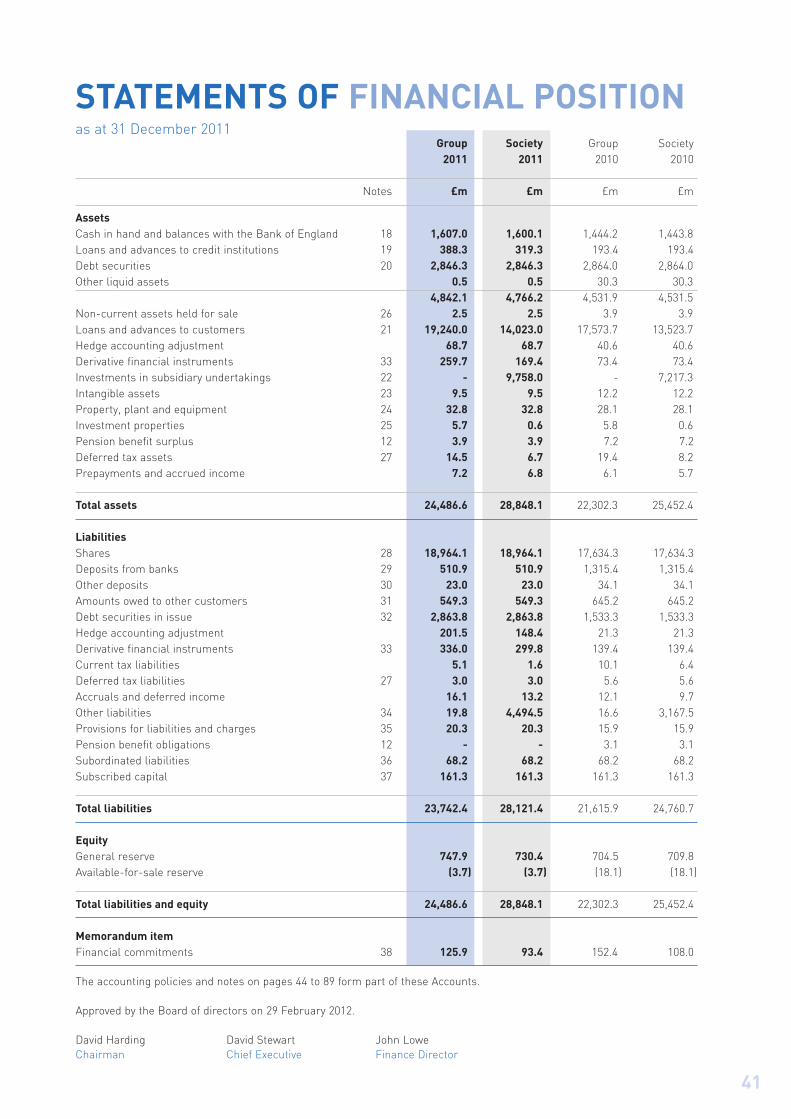
STATEMENTS OF FINANCIAL POSITIONGroup Society Group Society
2011 2011 2010 2010
Notes £m £m £m £m
AssetsCash in hand and balances with the Bank of England 18 1,607.0 1,600.1 1,444.2 1,443.8 Loans and advances to credit institutions 19 388.3 319.3 193.4 193.4Debt securities 20 2,846.3 2,846.3 2,864.0 2,864.0 Other liquid assets 0.5 0.5 30.3 30.3
4,842.1 4,766.2 4,531.9 4,531.5 Non-current assets held for sale 26 2.5 2.5 3.9 3.9 Loans and advances to customers 21 19,240.0 14,023.0 17,573.7 13,523.7 Hedge accounting adjustment 68.7 68.7 40.6 40.6 Derivative financial instruments 33 259.7 169.4 73.4 73.4 Investments in subsidiary undertakings 22 - 9,758.0 - 7,217.3 Intangible assets 23 9.5 9.5 12.2 12.2 Property, plant and equipment 24 32.8 32.8 28.1 28.1 Investment properties 25 5.7 0.6 5.8 0.6 Pension benefit surplus 12 3.9 3.9 7.2 7.2Deferred tax assets 27 14.5 6.7 19.4 8.2 Prepayments and accrued income 7.2 6.8 6.1 5.7
Total assets 24,486.6 28,848.1 22,302.3 25,452.4
LiabilitiesShares 28 18,964.1 18,964.1 17,634.3 17,634.3Deposits from banks 29 510.9 510.9 1,315.4 1,315.4Other deposits 30 23.0 23.0 34.1 34.1Amounts owed to other customers 31 549.3 549.3 645.2 645.2Debt securities in issue 32 2,863.8 2,863.8 1,533.3 1,533.3Hedge accounting adjustment 201.5 148.4 21.3 21.3Derivative financial instruments 33 336.0 299.8 139.4 139.4Current tax liabilities 5.1 1.6 10.1 6.4Deferred tax liabilities 27 3.0 3.0 5.6 5.6Accruals and deferred income 16.1 13.2 12.1 9.7Other liabilities 34 19.8 4,494.5 16.6 3,167.5Provisions for liabilities and charges 35 20.3 20.3 15.9 15.9Pension benefit obligations 12 - - 3.1 3.1Subordinated liabilities 36 68.2 68.2 68.2 68.2Subscribed capital 37 161.3 161.3 161.3 161.3
Total liabilities 23,742.4 28,121.4 21,615.9 24,760.7
EquityGeneral reserve 747.9 730.4 704.5 709.8Available-for-sale reserve (3.7) (3.7) (18.1) (18.1)
Total liabilities and equity 24,486.6 28,848.1 22,302.3 25,452.4
Memorandum itemFinancial commitments 38 125.9 93.4 152.4 108.0
The accounting policies and notes on pages 44 to 89 form part of these Accounts.
Approved by the Board of directors on 29 February 2012.
David Harding David Stewart John LoweChairman Chief Executive Finance Director
as at 31 December 2011
41

STATEMENTS OF CHANGESIN MEMBERS’ INTERESTSfor the year ended 31 December 2011
Available-General for-salereserve reserve Total
Group Notes £m £m £m
As at 1 January 2011 704.5 (18.1) 686.4Profit for the financial year 46.6 - 46.6Actuarial loss on defined benefit pension plan (net of tax) 12,17 (3.2) - (3.2)Net movement in Available-for-sale reserve (net of tax) - 14.4 14.4
As at 31 December 2011 747.9 (3.7) 744.2
As at 1 January 2010 616.0 (31.8) 584.2Profit for the financial year 84.9 - 84.9Actuarial gain on defined benefit pension plans (net of tax) 12,17 3.6 - 3.6Net movement in Available-for-sale reserve (net of tax) - 13.7 13.7
As at 31 December 2010 704.5 (18.1) 686.4
Available-General for-salereserve reserve Total
Society Notes £m £m £m
As at 1 January 2011 709.8 (18.1) 691.7Profit for the financial year 23.8 - 23.8Actuarial loss on defined benefit pension plan (net of tax) 12,17 (3.2) - (3.2)Net movement in Available-for-sale reserve (net of tax) - 14.4 14.4
As at 31 December 2011 730.4 (3.7) 726.7
As at 1 January 2010 609.5 (31.8) 577.7Profit for the financial year 96.7 - 96.7Actuarial gain on defined benefit pension plans (net of tax) 12,17 3.6 - 3.6Net movement in Available-for-sale reserve (net of tax) - 13.7 13.7
As at 31 December 2010 709.8 (18.1) 691.7
The accounting policies and notes on pages 44 to 89 form part of these Accounts.
42

STATEMENTS OF CASH FLOWSfor the year ended 31 December 2011
Group Society Group Society2011 2011 2010 2010
Notes £m £m £m £m
Cash flows from operating activitiesProfit before tax 59.5 28.8 100.6 106.7
Adjustments for:Non-cash items included in profit before tax 42 59.8 57.1 (5.0) (29.8)Changes in operating assets 42 (1,565.8) (395.2) (1,235.6) (407.9)Changes in operating liabilities 42 472.2 476.4 1,545.7 1,546.6 Interest paid on subordinated liabilities (5.1) (5.1) (3.9) (3.9)Interest paid on subscribed capital (12.2) (12.2) (12.3) (12.3)Taxation (19.7) (19.7) (7.1) (7.1)
Net cash flows from operating activities (1,011.3) 130.1 382.4 1,192.3
Cash flows from investing activitiesPurchase of investment securities (7,276.7) (7,276.7) (5,687.0) (5,687.0)Sale and maturity of investment securities 7,468.8 7,468.8 6,796.2 6,796.2 Purchase of property, plant and equipment (8.8) (8.8) (5.6) (5.6)Purchase of intangible assets (3.1) (3.1) (3.1) (3.1)Cash and cash equivalents acquired on transfer of engagements - - 10.8 9.7
Net cash flows from investing activities 180.2 180.2 1,111.3 1,110.2
Cash flows from financing activitiesLoans from connected undertakings - 1,323.8 - 508.6Loans to connected undertakings - (2,540.7) - (1,315.6)Repurchase of subordinated liabilities - - (55.0) (55.0)Repurchase of debt securities (45.0) (45.0) (629.0) (629.0)Issue of debt securities 1,316.5 1,316.5 400.0 400.0
Net cash flows from financing activities 1,271.5 54.6 (284.0) (1,091.0)
Net increase in cash 440.4 364.9 1,209.7 1,211.5 Cash and cash equivalents at start of year 1,537.8 1,537.4 328.1 325.9
Cash and cash equivalents at end of year 42 1,978.2 1,902.3 1,537.8 1,537.4
The accounting policies and notes on pages 44 to 89 form part of these Accounts.
43

NOTES TO THE ACCOUNTS
1. ACCOUNTING POLICIES The following accounting policies have been applied consistently in dealing with items that were considered material in relation tothe Accounts.
BASIS OF PREPARATIONThese Accounts have been prepared in accordance with International Financial Reporting Standards (IFRS) as adopted by the EU;interpretations issued by the International Financial Reporting Interpretations Committee (IFRIC); and with those parts of theBuilding Societies (Accounts and Related Provisions) Regulations 1998 applicable to organisations reporting under IFRS.
The Accounts have been prepared on an historical cost basis, as modified by the revaluation of Available-for-sale debt securitiesand certain financial instruments which are measured at fair value. The carrying values of recognised assets and liabilities that arehedged items in fair value hedges and are otherwise carried at cost are adjusted to record changes in the fair values attributable tothe risks that are being hedged. These hedge accounting adjustments are recorded in the statement of financial position.
BUSINESS COMBINATIONSThe Society merged with Stroud & Swindon Building Society on 1 September 2010. This business combination has been accountedfor using the acquisition method, following the requirements of IFRS 3 (Revised) ‘Business Combinations’ which was endorsed bythe EU in June 2009. Results relating to the merger with Stroud & Swindon Building Society are included within the Society’sresults effective from the date of completion of the merger, 1 September 2010.
CHANGES IN ACCOUNTING POLICYThe following standards and interpretations, relevant to the Group have been adopted during the year:
IFRS 7 Financial Instruments: Disclosures (Amendment)The amendments to IFRS 7 is effective for annual periods beginning on or after 1 January 2011. These amendments requireadditional disclosure in relation to concentrations of risk and on the effect of collateral held as security on the maximum creditrisk exposure (see note 40).
IAS 24 Related Party Disclosures (Amendment)The amended standard became effective for annual periods beginning on or after 1 January 2011. It clarifies the definition of arelated party to simplify the identification of such relationships and to eliminate inconsistencies in its application. The revisedstandard introduced a partial exemption of disclosure requirements for government-related entities. The amendment does nothave a significant impact on the financial statements of the Group.
IFRIC 14 Prepayments of a minimum funding requirement (Amendment)The amendment to IFRIC 14 is effective for annual periods beginning on or after 1 January 2011 with retrospective application. Theamendment provides guidance on assessing the recoverable amount of a net pension asset. The amendment permits an entity totreat the prepayment of a minimum funding requirement as an asset. The amendment does not have a significant impact on thefinancial statements of the Group.
Improvements to IFRSsImprovements to IFRSs was issued in May 2010, containing several small amendments to its existing standards. The Group hasconsidered the impact of these improvements and has made adjustments to the disclosure in the financial statements.
FUTURE ACCOUNTING DEVELOPMENTSThe following standards and interpretations, relevant to the Group, were not effective at 31 December 2011 and have not beenapplied in preparing these financial statements. The anticipated impact of these standards and interpretations are listed below:
IFRS 7 Financial Instruments: Disclosures – Offsetting Financial Assets and Financial Liabilities (Amendment)The amendments to IFRS 7 shall be effective for annual periods beginning on or after 1 January 2013. The amendment requiresnew disclosures for all recognised financial instruments that are set-off in the statement of financial position. Financialinstruments on the Group’s statement of financial position are shown as gross amounts before set-off. The Group does not expectany significant impact on the financial position or performance.
IFRS 9 Financial Instruments: Classification and MeasurementIFRS 9 as issued, reflects the first phase of the International Accounting Standards Board’s (IASB) work on the replacement of IAS 39 Financial Instruments: Recognition and measurement and applies to classification and measurement of financial assetsand financial liabilities as defined in IAS 39. The standard is effective for annual periods beginning on or after 1 January 2015.
44

In subsequent phases, the Board will address hedge accounting and impairment. The adoption of IFRS 9 will have an effect on theclassification and measurement of the Group’s financial assets and financial liabilities. However, the Group has determined thatthe effect will be quantified in conjunction with the other phases when issued, to present a comprehensive picture.
IFRS 10 Consolidated Financial StatementsIFRS 10 reflects the requirements for determining when a reporting entity controls another entity, and the principles applied whenpreparing consolidated financial statements replacing IAS 27 Consolidated and Separate Financial Statements and SIC 12Consolidation – Special Purpose Entities. The standard is effective for annual periods on or after 1 January 2013. Due to thesimple structure of the Group and its subsidiaries, the Group does not expect the adoption of IFRS 10 to have a significant effect onthe entities that are consolidated within the Group.
IFRS 11 Joint ArrangementsIFRS 11 defines the joint arrangements with joint control, and reflects the principles applied when preparing consolidated financialstatements replacing IAS 31 Interest in Joint Ventures and SIC 13 Jointly-controlled Entities – Non-monetary Contributions byVenturers. The standard is effective for annual periods on or after 1 January 2013. The adoption of IFRS 11 is not expected to havean effect on the profit and reserves of the Group as it does not have a joint control arrangement.
IFRS 12 Disclosure of Interests in Other EntitiesIFRS 12 includes all the disclosure requirements for subsidiaries, joint arrangements, associates and structured entities. Thestandard is effective for annual periods on or after 1 January 2013. IFRS 12 is a disclosures-only standard and therefore will haveno effect on profit or loss, or the reserves of the Group.
IFRS 13 Fair Value MeasurementIFRS 13 provides guidance on how to measure the fair value of financial and non-financial assets and liabilities when required orpermitted by IFRS. The standard is effective for annual periods on or after 1 January 2013. The adoption of IFRS 13 is notexpected to significantly affect the fair value of certain assets and liabilities held by the Group, as the valuation methods adopted bythe Group are in line with the principles identified in this new standard.
IAS 1 Presentation of Financial Statements (Amendment)The amendments to IAS 1 require changes to the presentation of the statement of comprehensive income. Items that could bereclassified to profit or loss at a future point in time would be presented separately from items that will never be reclassified. Theeffective date of the standard is 1 January 2013. The adoption of these amendments will only affect the presentation of thestatement of comprehensive income.
IAS 12 Income Taxes (Amendments)The effective date of the amendments is for years beginning 1 January 2012. The amendments to IAS 12 require an entity tomeasure deferred tax relating to an asset depending on whether the entity expects to recover the carrying amount of the assetthrough use or sale. Where assets are measured at fair value, the amendment provides a practical solution to the problem byintroducing a presumption that recovery of the carrying amount will, normally, be through sale. The Group’s assets includeintangible fixed assets and property, plant and equipment and are held with the intention of recovering profits through use, ratherthan the sale of the asset. As the Group adopts the amortised cost model, the Group does not expect the adoption of theseamendments would affect its profit and reserves.
IAS 19 Employee Benefits (Amendments)The amendments to IAS 19 remove the option to defer the recognition of actuarial gains and losses; the corridor approach. Allchanges in the value of defined benefit plans will be recognised in profit or loss and other comprehensive income. The effectivedate of the standard is 1 January 2013. As the Group recognises all actuarial gains and losses immediately, the removal of thecorridor approach will have no impact on the results of the Group.
IAS 27 Separate Financial StatementThe IASB issued a revised standard to complement IFRS 10 Consolidated Financial Statements, IFRS 11 Joint Arrangements, andIFRS 12 Disclosure of Interests in Other Entities. The standard outlines the accounting and disclosure requirements forinvestments in subsidiaries, joint ventures, and associates when an entity prepares separate financial statements. The standardrequires an entity preparing separate financial statements to account for those investments at cost or in accordance with IFRS 9Financial Instruments. The standard is effective for annual periods beginning on or after 1 January 2013.
45

NOTES TO THE ACCOUNTS
1. ACCOUNTING POLICIES (continued)
IAS 28 Investments in Associates and Joint VenturesThis standard prescribes the accounting for investments and associates and sets out the requirements for the application of theequity method when accounting for investments in associates and joint ventures. The standard is effective for annual periodsbeginning on or after 1 January 2013. The Group does not have associates or joint venture investments and therefore, no impact isanticipated from the adoption of this standard.
BASIS OF CONSOLIDATIONThe Group Accounts consolidate the assets, liabilities and results of the Society and all its subsidiary companies.
The financial statements are presented in sterling millions (£m), and are rounded to the nearest hundred thousand except whereotherwise indicated.
Subsidiaries are all entities, including special purpose entities, controlled by the Society. Control exists when the Society has thepower, directly or indirectly, to govern the financial and operating policies of an entity so as to obtain benefits from its activities.
The Society’s investment in its subsidiaries is recognised in the statement of financial position at cost. Intragroup transactions,balances and unrealised gains on transactions between Group companies are eliminated in the consolidated accounts.
INTEREST RECEIVABLE AND INTEREST PAYABLEFor instruments measured at amortised cost the effective interest rate method is used to measure the carrying value of a financialasset or a liability and to allocate associated interest income or expense over the relevant period. The effective interest rate is therate that exactly discounts the estimated future cash payments or receipts through the expected life of the financial instrument or,when appropriate, a shorter period, to the net carrying amount of the financial asset.
In calculating the effective interest rate, the Group estimates cash flows considering all contractual terms of the financialinstrument but does not consider future credit losses. The calculation includes the spread of various incentives, fees and charges,both paid and received by the Group, across the expected life of the loan account. Items spread in this way include:
initial interest rate discounts;cash backs and other customer incentives; andcertain fees and charges paid and received by the Group.
The purpose of using the effective interest rate method is to recognise interest income at a more level yield across the expected lifeof the product than would be obtained by recognising income as it is received.
Discounts received on loans and advances to customers which were acquired as a result of the merger, are recognised over the lifeof the asset, in line with the effective interest rate method and are recognised within interest receivable and similar income.
Interest income on Available-for-sale debt securities is included in interest receivable and similar income.
FEES AND COMMISSIONSFees and commissions receivable and payable that are not spread across expected asset lives under the effective interest ratemethod are taken to income on an accruals basis as services are provided, or on the completion of an act to which the fee relates.
SEGMENTAL REPORTINGThe Group operates solely within the retail financial services sector and within the United Kingdom. As such, no detailed segmentalanalysis is required.
INTANGIBLE ASSETSIntangible assets consist of software development costs and other intangible assets. Software development costs and purchasedsoftware that is not an integral part of a related hardware purchase are recognised as an intangible asset. Amortisation of suchassets is charged to the income statement on a straight line basis over the useful life of the asset. The useful life of computersoftware is between three and eight years.
Other intangible assets arise from retail deposits acquired by the Group. These are amortised using the straight line method overthe estimated useful life of 16 months. The amortisation period is reviewed annually. Other intangible assets were fully amortised asat 31 December 2011.
(continued)
46

LEASES AND CONTRACT PURCHASE AGREEMENTSThe determination of whether an arrangement is, or contains, a lease, is based on the substance of the arrangement and requires an assessment of whether the fulfilment of the arrangement is dependent on the use of a specific asset or assets and thearrangement conveys a right to use the asset.
Where the Group enters into a lease that entails taking substantially all the risks and rewards of ownership of an asset, theagreement is treated as a finance lease. The asset is recorded in the balance sheet within property, plant and equipment and isdepreciated over its estimated useful life. If there is no reasonable certainty that the Group will obtain ownership by the end of thelease term, the asset is depreciated over the shorter of the lease term and its useful life. Future instalments under such leases, netof finance charges, are included within creditors. Rentals payable are apportioned between the finance element, which is charged tothe income statement at a constant annual rate, and the capital element which reduces the outstanding obligation for futureinstalments.
All other leases are accounted for as operating leases and payments are charged to administrative expenses on a straight line basisover the period of the lease. Rents receivable are credited to other operating income on a straight line basis over the period of thelease.
TAXATION INCLUDING DEFERRED TAXIncome tax on the profits for the year comprises current and deferred taxation.
Current tax assets and liabilities are measured at the amount expected to be recovered from or paid to the taxation authorities,based on tax rates and laws that are enacted or substantively enacted by the balance sheet date.
Deferred tax is recognised on temporary differences arising between the tax bases of assets and liabilities and their carryingamounts in the financial statements, with the exception that deferred tax assets are recognised only to the extent that it is probablethat taxable profit will be available against which the deductible temporary differences, carried forward tax credits or tax losses canbe utilised.
Deferred tax assets and liabilities are measured on a non-discounted basis at the tax rates that are expected to apply when therelated asset is realised or liability settled, based on tax rates and laws enacted or substantively enacted by the balance sheet date.
Income tax is charged or credited directly to equity if it relates to items that are credited or charged to equity. Otherwise income taxis recognised in the income statement.
INVESTMENT PROPERTIES, PROPERTY, PLANT AND EQUIPMENTInvestment property is property held to earn rentals or for capital appreciation or for both, rather than for sale or use in thebusiness. The Group recognises investment properties at cost less accumulated depreciation and any accumulated impairment. Thecarrying values of investment properties are reviewed for impairment whenever events or changes in circumstances indicate thatthe carrying value may not be recoverable.
Property, plant and equipment is stated at cost less accumulated depreciation and any accumulated impairment. As permitted byIFRS 1 First-time adoption of International Financial Reporting Standards, the Group treated previous valuations of certainproperties as the deemed cost of those properties on transition to IFRS. The carrying values of property, plant and equipment arereviewed for impairment whenever events or changes in circumstances indicate that the carrying value may not be recoverable.
An asset’s carrying value is written down immediately to its recoverable amount if the asset’s carrying value is greater than itsestimated recoverable amount.
Gains and losses on disposals are determined by comparing the net disposal proceeds with the carrying value of the asset and areincluded within the income statement.
Depreciation is provided on a straight line basis over the anticipated useful life of the asset as follows:
Freehold buildings (including investment properties) Over a period of 50 yearsLeasehold buildings Shorter of remaining term of the lease and useful lifeEquipment, fixtures, fittings and vehicles Three to eight years
47

NOTES TO THE ACCOUNTS
1. ACCOUNTING POLICIES (continued)
NON-CURRENT ASSETS HELD FOR SALEA non-current asset is classified as held for sale if the Group will recover the carrying amount principally through a sale transactionrather than through continuing use. A non-current asset classified as held for sale is measured at the lower of the carrying amountand fair value less costs to sell. If the asset is acquired as part of a business combination it is initially measured at fair value lesscosts to sell. Assets classified as held for sale are shown separately on the face of the statement of financial position.
FINANCIAL ASSETSAll financial assets are measured initially at their fair value plus transaction costs, except in the case of financial assets recordedat fair value through profit or loss. The Group classifies its financial assets at inception into the following categories:
Financial assets at fair value through profit or lossThis category consists of derivative financial assets. Derivative financial assets are carried at fair value. The fair values are quotedmarket prices where there is an active market, or are based on valuation techniques where there is not.
Purchases and sales of financial assets are accounted for at the trade date.
Gains and losses arising from changes in the fair values are recognised in the income statement.
Loans and receivablesLoans and receivables are non-derivative financial assets with fixed or determinable payments that are not quoted in an activemarket. The Group’s residential mortgage loans, unsecured lending and loans to credit institutions are classified as loans andreceivables.
Loans are recognised when the funds are advanced to customers. Loans and receivables are carried at amortised cost using theeffective interest rate method.
Available-for-saleAvailable-for-sale assets are non-derivative financial assets that are designated as such or not classified into either of the twocategories above. Available-for-sale assets are initially measured at fair value. Subsequently, Available-for-sale assets are carried atfair value. The fair values, in the majority of cases, are based on quoted market prices or prices obtained from counterparties. Incases where quoted market prices are not available, discounted cash flow valuations are used.
Unrealised gains and losses arising from changes in the fair values are recognised directly in the Available-for-sale reserve, exceptfor impairment losses and foreign exchange gains and losses, which are recognised in the income statement. Gains and lossesarising on the sale of Available-for-sale assets, including any cumulative gains or losses previously recognised in the Available-for-sale reserve, are recognised in the income statement.
DerecognitionFinancial assets are derecognised when the rights to receive cash flows have expired or where substantially all of the risks andrewards of ownership have been transferred. In respect of the Group’s secured funding structure, the Group sells to another entity,Coventry Building Society Covered Bonds LLP, the right to receive the cash flows arising on the loans which have been transferred.However, other than in a default or insolvency scenario, the Society receives substantially all of the profit of that entity, and henceretains substantially all of the risks and rewards of the transferred loans. Therefore the transferred loans are retained on theSociety’s balance sheet.
HedgingThe impact of hedging on the measurement of financial assets is detailed in the derivatives (page 49) and hedge accounting (page49) policy note.
FINANCIAL LIABILITIES Financial liabilities incorporates shares, bank and other deposits, amounts owed to other customers, debt securities in issue,derivative financial liabilities, subordinated liabilities and subscribed capital. Financial liabilities are initially measured at fair valueplus transaction costs directly attributable to the acquisition or issue.
(continued)
48

Financial liabilities (other than derivatives) are subsequently measured at amortised cost, adjusted for the amortisation of anytransaction costs, premiums and discounts. The amortisation is recognised in interest payable and similar charges using theeffective interest rate method. Derivatives are measured at fair value through profit or loss.
Permanent Interest Bearing Shares (subscribed capital), which are redeemable at specific dates at the option of the Group, areclassed as financial liabilities.
Financial liabilities are derecognised when the obligation is discharged, cancelled or has expired. Financial liabilities that aredesignated as hedged items are subject to measurement under the hedge accounting requirements. The impact of hedging on themeasurement of financial liabilities is detailed in the derivatives (see below) and hedge accounting (see below) policy note.
IMPAIRMENT OF LOANS AND ADVANCES TO CUSTOMERSThe Group assesses its loans and advances to customers for objective evidence of impairment at each balance sheet date. Animpairment loss is recognised if, and only if, there is a loss event (or events) that has occurred after initial recognition and before thebalance sheet date and has a reliably measurable impact on the estimated future cash flows of the loan amount.
Impairment is categorised as either individual impairment (where individual assets have been assessed for loss) or collectiveimpairment (where losses are assessed as being present in a portfolio of loans, but they cannot be attributed to individual accounts).As well as loans that are individually or collectively identified as being impaired, recognition is also made of accounts whereforbearance has been exercised and agreement has been reached with customers in financial difficulty to temporarily forego someelement of the payment due.
If there is objective evidence that an impairment loss on loans and advances to customers has been incurred, the amount of the lossis measured as the difference between the asset’s carrying amount and the present value of the estimated future cash flows(excluding future credit losses that have not been incurred). The carrying amount of the asset is reduced through the use of animpairment provision and the amount of the loss is recognised in the income statement.
When a loan is not collectable, it is written off against the related provision for loan impairment. Such loans are written off after allthe necessary procedures have been completed and the amount of the loss has been determined. Subsequent recoveries ofamounts previously written off are recorded in the income statement.
If, in a subsequent period, the amount of the impairment loss decreases and the decrease can be related objectively to an eventoccurring after the impairment was recognised (such as an improvement in the customer’s credit rating), the previously recognisedimpairment loss is reversed by adjusting the impairment provision. The amount of the reversal is recognised in the incomestatement.
SALE AND REPURCHASE AGREEMENTSSecurities lent or sold subject to a commitment to repurchase them (a ‘repo’) are retained on the balance sheet when substantiallyall the risks and rewards of ownership remain within the Group. The counterparty liability is included separately in the balancesheet, as appropriate. The difference between the sale and repurchase price is accrued over the life of the agreements using theeffective interest rate method.
DERIVATIVE FINANCIAL INSTRUMENTSThe Group holds derivative financial instruments for the purposes of managing the risks associated with its various fixed and cappedrate assets, its fixed rate liabilities and its foreign currency transactions. In accordance with legislation and its treasury policy, theGroup holds derivative financial instruments only for risk management and not for speculative or trading purposes.
All derivative financial instruments are stated in the Accounts at fair value, with movements in fair value taken through the incomestatement under ‘net (losses)/gains from derivative financial instruments’ in the period in which the movement occurred. Fair valuesare calculated by discounted cash flow models using yield curves that are based on observable market data or are based onvaluations from counterparties.
HEDGE ACCOUNTINGAll derivatives entered into by the Group are for the purpose of providing an economic hedge. Full details of hedging activities arecontained in note 33. Hedge accounting is an optional treatment, subject to the satisfaction of specific rules and conditions set out inIAS 39. The Group periodically tests hedge effectiveness and applies fair value hedge accounting, so that changes in the fair value ofthe underlying asset or liability that are attributable to the hedged risk are recorded in the income statement to offset the fair valuemovement of the related derivative.
49

NOTES TO THE ACCOUNTS
1. ACCOUNTING POLICIES (continued)
The Group uses derivative financial instruments to mitigate the interest rate risk and foreign currency risk that arises from theGroup’s lending and funding activities. The Group elects to treat all such derivatives, as fair value hedges and adopting the fair valuehedge accounting provisions of IAS 39. This treatment is consistent with the economic purpose of using the derivative instruments,which is to provide a hedge against the movement in the fair value of fixed rate and foreign currency assets and liabilities. The Grouprecognises movements on the balance sheet in respect of the hedged portion of the fair values of the underlying assets andliabilities that should materially offset the volatility that may arise from recognising the fair value movements of the derivativesthemselves.
PENSION COSTSThe Group operates a defined benefit pension scheme and a defined contribution scheme for members of staff.
Contributions to the defined contribution pension schemes are recognised as an expense in the income statement as incurred, onan accruals basis.
The Group’s net obligation under the defined benefit pension scheme is assessed annually by an independent qualified actuary. Thenet obligation is calculated as the difference between the fair value of the scheme’s assets and the amount of future entitlementsearned by scheme members from service in the current and prior periods, discounted back to present values using a rate based onan index of long-dated AA rated corporate bonds. This calculation allows the net obligations of the scheme to be expressed as eithera surplus or deficit, which is recognised as respectively either an asset or liability in the Group’s Accounts at the balance sheet date.
Pension costs for service in the period are assessed in accordance with advice from a qualified actuary and are recognised in theincome statement. Pension fund actuarial gains or losses are recognised in full in the year they occur in the statement ofcomprehensive income.
FOREIGN CURRENCY TRANSLATIONThe consolidated financial statements are presented in sterling, which is the functional currency of the Group.
Foreign currency transactions are translated into sterling using the exchange rates prevailing at the dates of the transactions.Monetary items denominated in foreign currencies are retranslated at the rate prevailing at the year end. Foreign exchange gainsand losses resulting from the retranslation and settlement of these items are recognised in the income statement.
LIQUID ASSETSLiquid assets consist of cash in hand and balances with the Bank of England, loans and advances to credit institutions, debtsecurities and other liquid assets. Other liquid assets consists of amounts advanced to other non-credit institutions.
The Group uses various debt securities (certificates of deposit, gilts, etc) to maintain its liquidity position. These debt securities areclassified as Available-for-sale under the terms of IAS 39 and, as such, are recorded in the Accounts at fair value, with changes infair value taken to the Available-for-sale reserve within equity reserves.
If debt securities are sold, the gain or loss on sale is measured as the difference between sale proceeds and original cost (net of anydiscount or premium on acquisition). Any fair value adjustments already recognised are released from reserves at the time of thesale and offset against the gain or loss.
When a decline in the fair value of an Available-for-sale financial asset has been recognised directly in equity reserves and there isobjective evidence that the asset is impaired, the cumulative loss recognised in equity reserves is removed and recognised in theincome statement.
CASH AND CASH EQUIVALENTSFor the purposes of the cash flow statement, cash and cash equivalents comprise balances with less than three months’ maturityfrom the date of acquisition, including cash and non-restricted balances with central banks and loans and advances to creditinstitutions.
PROVISIONS AND CONTINGENT LIABILITIESA provision is recognised when there is a present obligation as a result of a past event, it is probable that the obligation will besettled and the amount can be estimated reliably.
Contingent liabilities are potential obligations from past events which shall be confirmed by future events. Contingent liabilities arenot recognised within the balance sheet.
(continued)
50

EXCEPTIONAL ITEMSExceptional items are items of income and expenditure that are disclosed separately on the basis that they are material, either bytheir nature or their size, to the understanding of the Group’s financial performance, and they significantly distort the comparabilityof financial performance between periods. This primarily consists of costs incurred during 2010 and 2011, relating directly to themerger with Stroud & Swindon Building Society, which comprise of deal costs, integration costs, and overhead costs which do notform part of the long-term ongoing business.
‘Gain on business combination’ has been recognised below ‘Operating profit after impairments and exceptional items’, as the gaindoes not form part of operating activities.
2. SIGNIFICANT ACCOUNTING JUDGEMENTS AND ESTIMATES
JUDGEMENTSIn the process of applying the Group’s accounting policies, the directors have made the following judgements and estimatesthat have the most significant effect on the amounts recognised in the financial statements.
Debt securitiesThe Group maintains a portfolio of liquid assets to ensure it has sufficient funds available to meet its financial commitmentsas they fall due. A large part of this portfolio is made up of debt securities, for which there are various accountingtreatments permitted under IAS 39. The Group has adopted the ‘Available-for-sale’ treatment as this most closely matchesthe way debt securities are used within the business, with a portfolio of assets maintained for continuing use, and individualassets available to be sold depending on particular requirements for funding or the maintenance of interest yields. Thistreatment requires that debt securities are recognised at fair value with movements in fair value taken to equity reserves.
The determination of whether Available-for-sale instruments are impaired is assessed based on similar criteria to financialassets carried at amortised cost.
Fair value of financial instrumentsWhere the fair values of financial assets and financial liabilities recorded on the balance sheet cannot be derived from activemarkets, they are determined using interest rate yield curves and other relevant market data. These are judged to be themost appropriate valuation inputs. The valuation of financial instruments, and the associated inputs are disclosed in moredetail in note 40.
Deferred taxThe Group recognises deferred tax on temporary differences arising between the tax bases of assets and liabilities and theircarrying amounts in the financial statements. Deferred tax assets are recognised only to the extent that it is probable thatfuture taxable profits will be available to utilise the asset. The Group considers that sufficient future taxable profit will, infact, be available to utilise all the Group’s deferred tax assets and the Group has therefore recognised deferred tax assetswhere they have arisen.
Pension schemesThe Group’s defined contribution and defined benefit pension schemes are accounted for under the terms of IAS 19. Thestandard requires the calculation of the net assets or liabilities of the defined benefit scheme and their inclusion in the statementof financial position. The result is dependent in part on the interest rate used to discount scheme liabilities back to present value.IAS 19 requires that this should equate to a rate available on an AA rated corporate bond. In practice, the rates available on suchbonds cover a wide range and there is therefore a range of possible outcomes that could be disclosed as the pension scheme’snet position. In order to avoid this uncertainty, the directors have selected a rate from within a narrow range recommended bythe Group’s professional pension scheme advisors. This range has been based on an index of related corporate bond yields. Theimpact of a 0.1% decrease in the rate used to discount the future value of the benefit obligation would be to increase the presentvalue of the liability by £3.2 million. The impact of increasing life expectancy by an additional year, increases the present value ofthe scheme liability by £3.1 million.
ESTIMATION UNCERTAINTYThe key assumptions regarding the future and other key sources of estimation uncertainty at the balance sheet date that have asignificant risk of causing a material adjustment to the carrying amount of assets and liabilities within the next financial year arediscussed below.
51
NOTES TO THE ACCOUNTS
2. SIGNIFICANT ACCOUNTING JUDGEMENTS AND ESTIMATES (continued)
Loan impairment and other provisionsIAS 39 requires that loan losses are only recognised where there is objective evidence of impairment. The Group has applied thisrequirement in determining the level of losses present in its loans and advances to customers, but has been required to applymanagement judgement in determining the financial impact of this impairment. IAS 39 makes a distinction between individualand collective impairment. Individual impairment relates to situations where individual assets are assessed for loss. The Grouphas used this approach on loans in possession and those in arrears. Estimates that have been applied include, assessing thelikelihood of the loan going into possession for those cases currently in arrears, the length of time expected to be required tocomplete the sale of properties in possession, and the expected costs of realisation. Collective impairment relates to cases where losses are assessed as being present in a loan portfolio, but they cannot be identified to individual accounts. Thisapproach has been used to calculate a value of incurred but not reported losses, where statistical analysis has been used todetermine a value for losses where a loss event has already impacted an account, but has not yet manifested itself in arrearsdata. A portfolio approach is also used on sections of the loan book where there are known problems but individual accounts areagain as yet not identifiable. This method has been applied to loans advanced on city centre buy-to-let flats where a problem ofoversupply is having a negative effect on prices and ease of sale, with the result that the Group has made an impairmentprovision against these assets. If future house price movements differ from expectations by 5% (of the expected movement), theimpact on the impairment provision would be £0.1 million.
Estimated asset livesThe Group recognises interest on loans and advances to customers on the basis of their effective interest rate. This is a constantrate that averages out the effect of incentives and fees across the expected life of the loan account. A critical assumption in thecalculation is the expected life, as this determines the assumed period over which customers may be paying variousdifferentiated interest rates. The calculation of the effective interest rate uses assumptions on expected life that are based on thehistoric experience of similar products. These assumptions are monitored to ensure their ongoing appropriateness. Changes inthe amortised cost balance arising from actual product life experience differing from the assumed life, are periodically calculatedand an adjustment made to the loan balance, with a corresponding adjustment to interest income. An increase in theassumption of expected life of 1% would result in an increase to loans and advances to customers of £2.3 million. Also within thecalculations, provision has been made for the uncertainty of the estimates in order to reduce the risk of overstatement of interestincome.
Valuation of derivatives and Available-for-sale assetsThe fair values of derivative financial instruments, Available-for-sale assets, and hedge items for hedge accounting purposes arebased on open market prices, where available. If open market prices are not available, the Group uses valuation techniqueswhich comprise discounted cash flow valuation models. The valuation of caps and floors also take account of the optionalitywithin these instruments. The assumptions in these models are periodically reviewed to ensure that they remain relevant.
FSCS levy provisionThe Society is committed to paying levy charges of the UK Financial Services Compensation Scheme (FSCS) (see note 15).
All deposit-taking institutions who are members of the FSCS are required to contribute to the administrative and capital costs ofthe FSCS in safeguarding the deposits of savers in failed financial institutions. The Society is, and continues to be, a member ofthe FSCS.
Contributions to the FSCS are calculated according to a prescribed formula using the retail savings balances of all deposit-takinginstitutions that are members of the FSCS. The provision for these costs in this year’s Accounts relates to payments to be madein future periods. The actual payments to be made are subject to change because they are based on estimations of therepayments by failed institutions and future interest rates. The impact of a 50bp increase in the interest rate assumption wouldresult in increasing the carrying value of the FSCS provision by approximately £2.2 million.
(continued)
52

53
3. INTEREST RECEIVABLE AND SIMILAR INCOME
Group Society Group Society2011 2011 2010 2010
£m £m £m £m
On loans fully secured on residential property 730.5 501.7 635.6 483.8On other loans
Connected undertakings - 230.9 - 154.1Other 3.9 2.8 5.2 3.8
734.4 735.4 640.8 641.7Interest and other income on debt securities 77.7 77.7 59.4 59.4Interest and other income on other liquid assets 5.8 5.5 4.4 4.4Net expense on hedging instruments (87.9) (10.5) (105.1) (27.5)
Total 730.0 808.1 599.5 678.0
Included within ‘Interest receivable and similar income’ is interest accrued of £8.3 million (2010: £8.7 million) for the Groupand £5.8 million (2010: £6.3 million) for the Society on impaired financial assets.
The Group believes that interest receivable and similar income comprises revenue for the purposes of IAS 1.
4. INTEREST PAYABLE AND SIMILAR CHARGES
Bank and customerSubordinated liabilities 5.1 5.1 3.9 3.9Other 11.6 11.6 21.4 21.4
Debt securities in issue 95.5 74.1 43.8 43.8Other borrowed funds
On shares held by individuals 511.5 511.5 423.1 423.1On other shares 0.1 0.1 0.1 0.1On subscribed capital 12.2 12.2 12.3 12.3On loans from connected undertakings - 46.3 - 26.2
Net (income)/expense from hedging instruments (73.5) 15.9 (51.1) 26.5
Total 562.5 676.8 453.5 557.3
5. FEES AND COMMISSIONS RECEIVABLE
Mortgage related fees 3.6 2.6 3.3 2.5 General insurance fees 6.0 6.0 5.8 5.8 Other fees and commissions 5.4 5.4 6.8 6.8
Total 15.0 14.0 15.9 15.1
6. FEES AND COMMISSIONS PAYABLE
Funding related fees 0.2 0.2 0.6 0.6 Other fees and commissions 1.7 1.6 0.9 0.8
Total 1.9 1.8 1.5 1.4
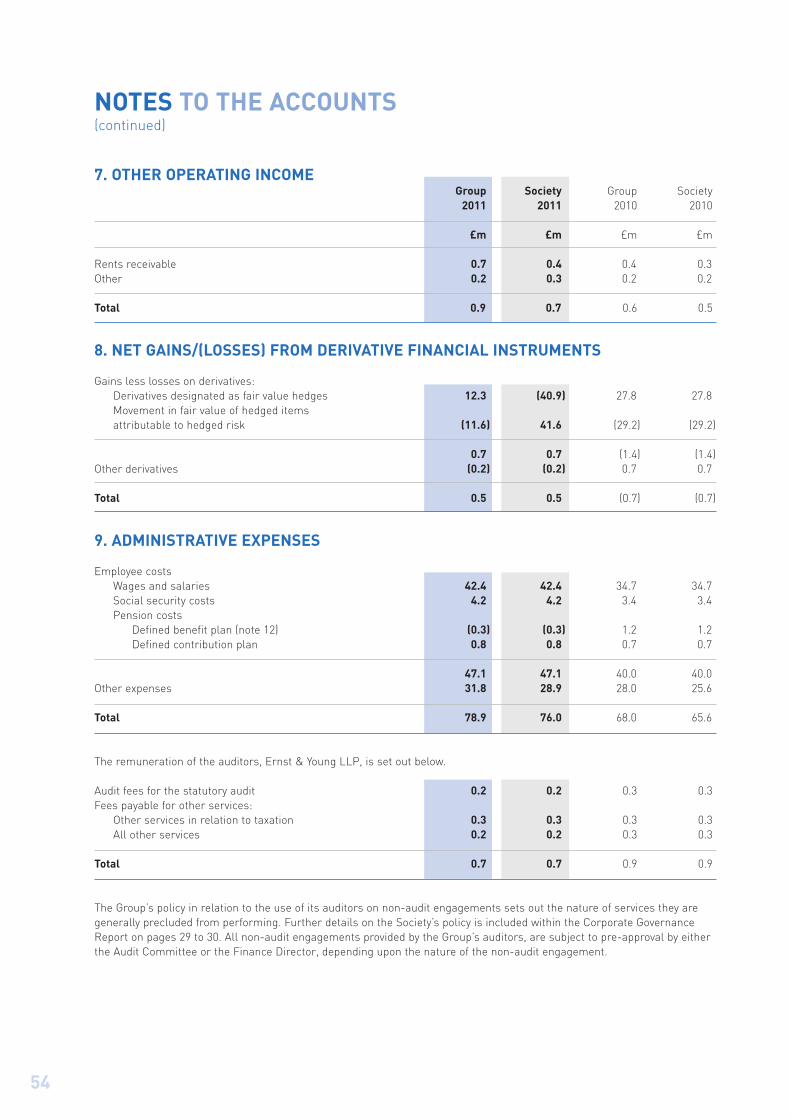
NOTES TO THE ACCOUNTS(continued)
54
7. OTHER OPERATING INCOMEGroup Society Group Society
2011 2011 2010 2010
£m £m £m £m
Rents receivable 0.7 0.4 0.4 0.3 Other 0.2 0.3 0.2 0.2
Total 0.9 0.7 0.6 0.5
8. NET GAINS/(LOSSES) FROM DERIVATIVE FINANCIAL INSTRUMENTS
Gains less losses on derivatives:Derivatives designated as fair value hedges 12.3 (40.9) 27.8 27.8 Movement in fair value of hedged items attributable to hedged risk (11.6) 41.6 (29.2) (29.2)
0.7 0.7 (1.4) (1.4)Other derivatives (0.2) (0.2) 0.7 0.7
Total 0.5 0.5 (0.7) (0.7)
9. ADMINISTRATIVE EXPENSES
Employee costsWages and salaries 42.4 42.4 34.7 34.7 Social security costs 4.2 4.2 3.4 3.4 Pension costs
Defined benefit plan (note 12) (0.3) (0.3) 1.2 1.2 Defined contribution plan 0.8 0.8 0.7 0.7
47.1 47.1 40.0 40.0 Other expenses 31.8 28.9 28.0 25.6
Total 78.9 76.0 68.0 65.6
The remuneration of the auditors, Ernst & Young LLP, is set out below.
Audit fees for the statutory audit 0.2 0.2 0.3 0.3Fees payable for other services:
Other services in relation to taxation 0.3 0.3 0.3 0.3All other services 0.2 0.2 0.3 0.3
Total 0.7 0.7 0.9 0.9
The Group’s policy in relation to the use of its auditors on non-audit engagements sets out the nature of services they aregenerally precluded from performing. Further details on the Society’s policy is included within the Corporate GovernanceReport on pages 29 to 30. All non-audit engagements provided by the Group’s auditors, are subject to pre-approval by eitherthe Audit Committee or the Finance Director, depending upon the nature of the non-audit engagement.
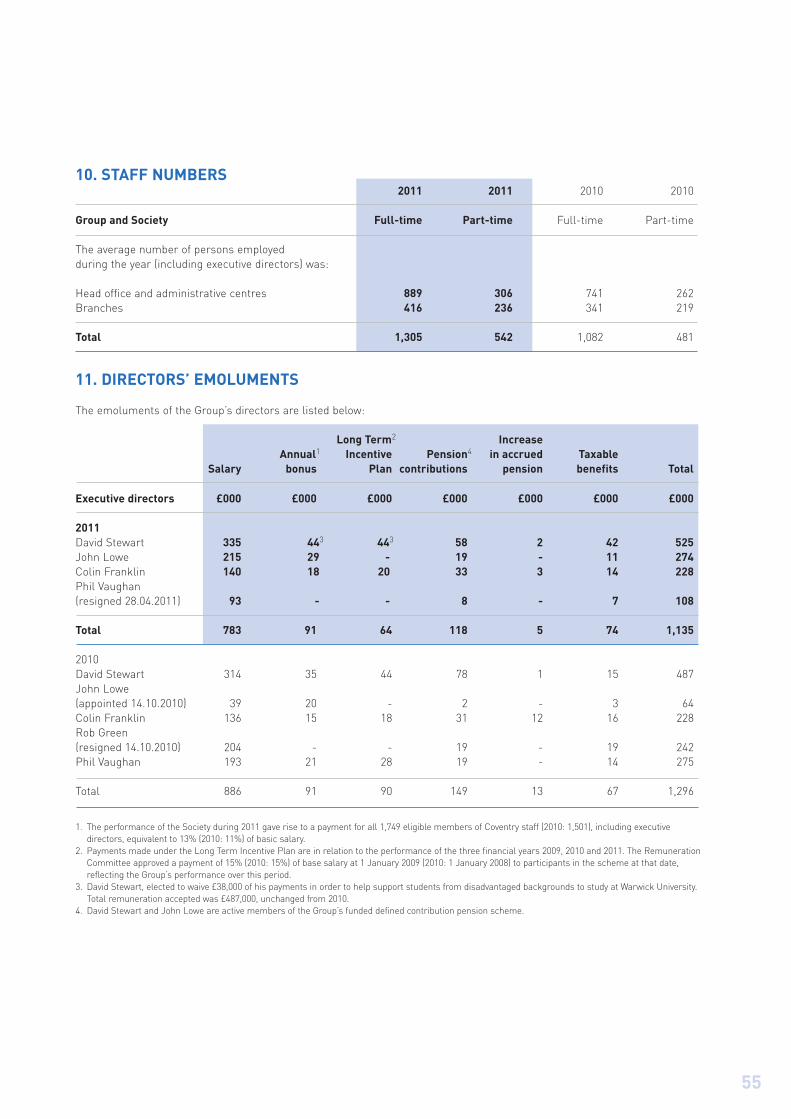
55
10. STAFF NUMBERS2011 2011 2010 2010
Group and Society Full-time Part-time Full-time Part-time
The average number of persons employed during the year (including executive directors) was:
Head office and administrative centres 889 306 741 262Branches 416 236 341 219
Total 1,305 542 1,082 481
11. DIRECTORS’ EMOLUMENTS
The emoluments of the Group’s directors are listed below:
Long Term2 IncreaseAnnual1 Incentive Pension4 in accrued Taxable
Salary bonus Plan contributions pension benefits Total
Executive directors £000 £000 £000 £000 £000 £000 £000
2011David Stewart 335 443 443� 58 2 42 525John Lowe 215 29 -� 19 - 11 274Colin Franklin 140 18 20� 33 3 14 228Phil Vaughan (resigned 28.04.2011) 93 - -� 8 - 7 108
Total 783 91 64 118 5 74 1,135
2010David Stewart 314 35 44 78 1 15 487John Lowe (appointed 14.10.2010) 39 20 - 2 - 3 64Colin Franklin 136 15 18 31 12 16 228Rob Green (resigned 14.10.2010) 204 - - 19 - 19 242Phil Vaughan 193 21 28 19 - 14 275
Total 886 91 90 149 13 67 1,296
1. The performance of the Society during 2011 gave rise to a payment for all 1,749 eligible members of Coventry staff (2010: 1,501), including executive directors, equivalent to 13% (2010: 11%) of basic salary.
2. Payments made under the Long Term Incentive Plan are in relation to the performance of the three financial years 2009, 2010 and 2011. The Remuneration Committee approved a payment of 15% (2010: 15%) of base salary at 1 January 2009 (2010: 1 January 2008) to participants in the scheme at that date, reflecting the Group’s performance over this period.
3. David Stewart, elected to waive £38,000 of his payments in order to help support students from disadvantaged backgrounds to study at Warwick University. Total remuneration accepted was £487,000, unchanged from 2010.
4. David Stewart and John Lowe are active members of the Group’s funded defined contribution pension scheme.

NOTES TO THE ACCOUNTS(continued)
56
11. DIRECTORS’ EMOLUMENTS (continued)
DEFINED BENEFIT SCHEMEPension benefits earned by directors Accrued Transfer value Transfer value Difference
pension per of accrued of accrued in transferDirector's annum benefits benefits value less
contribution at 31.12.2011 31.12.2010 31.12.2011 contributions
£000 £000 £000 £000 £000
David Stewart1 - 41 600 828 228Colin Franklin 11 55 1,114 1,442 317
1. David Stewart is also a deferred member of the Group’s contributory final salary pension scheme, having left the final salary pension scheme immediatelybefore being appointed Chief Executive in July 2006.
Details of the executive directors’ service contracts are contained in section 3 of the Annual Business Statement.
2011 2010
Non-executive directors £000 £000
David Harding (Chairman) 78 77Bridget Blow (Deputy Chairman, Senior Independent Director
and Chair of the Remuneration Committee) 50 50Roger Burnell 40 39Ian Geden 40 39Ian Pickering (Chair of the Board Risk Committee) 50 50Fiona Smith 40 39Glyn Smith (appointed 22.09.2010) (Chair of the Audit Committee appointed 01.12.2011) 41 11
Total 339 305
No pension contributions were made for non-executive directors.
12. PENSION SCHEME
The Group operates a funded defined benefit scheme and a funded defined contribution pension scheme for employees andexecutive directors. The Coventry defined benefit scheme has been closed to new members since December 2001. Thedefined benefit scheme provide benefits based on final pensionable salary with assets held in separate trustee-administeredfunds.
On 31 December 2011, the Coventry Building Society Superannuation Fund merged with Stroud & Swindon Building SocietyRetirement Benefit Plan. As at the 31 December 2010, the two defined benefit schemes were shown separately on thebalance sheet. The Coventry Building Society Superannuation Fund was presented as a defined benefit surplus totalling £7.2 million as at 31 December 2010, and the Stroud & Swindon Building Society Retirement Benefit Plan was presented asa defined benefit obligation of £3.1 million.

57
12. PENSION SCHEME (continued)
The cost of a defined benefit scheme is assessed in accordance with the advice of a qualified actuary on the basis ofvaluations using the projected unit method. The main assumptions used in the valuations were:
i) an investment return pre-retirement of 0.8% (2010: 1.2%) per annum in excess of projected salary increases;ii) for the Coventry Building Society Superannuation Fund an investment return post-retirement of 1.8% (2010: 2.1%)
per annum in excess of guaranteed pension increases in respect of pensionable service accrued prior to 6 April 2006and 2.6% (2010: 3.1%) per annum in excess of guaranteed pension increases in respect of pensionable serviceaccrued after 6 April 2006; and
iii) for the Stroud & Swindon Building Society Retirement Benefit Plan, an investment return post-retirement of 1.8%(2010: 2.5%) per annum in excess of guaranteed pension increases in respect of pensionable service accrued prior to6 April 1997, 1.3% (2010: 1.8%) per annum in excess of guaranteed pension increases in respect of pensionableservice accrued from 6 April 1997 to 31 July 2002, 1.8% (2010: 2.1%) per annum in excess of guaranteed pensionincreases in respect of pensionable service accrued from 1 August 2002 to 5 April 2006 and 2.6% (2010: 3.1%) perannum in excess of guaranteed pension increases in respect of pensionable service accrued after 6 April 2006.
The Group contributed 24.5% (2010: 24.5%) of members’ pensionable salaries over the year to 31 December 2011 into theCoventry Building Society Staff Superannuation Fund. The Group also contributed 28.9% (2010: 28.9%) of members’pensionable salaries until July 2011, and then contributed 25.3% for the remainder of the year to 31 December 2011 into theStroud & Swindon Building Society Retirement Benefit Plan. During 2011, contributions into the merged Coventry BuildingSociety Staff Superannuation Fund totalled £3.8 million. The Group estimates its contribution into the merged fund for thefollowing 12 months to be £3.6 million.
2011 2010
Group and Society £m £m
Present value of funded obligations (142.9) (133.8)Fair value of plan assets 146.8 137.9
Funded status/Pension benefit surplus 3.9 4.1
The amounts recognised in the income statementCurrent service cost 2.1 1.8Interest cost on benefit obligations 7.0 5.9Expected return on plan assets (8.2) (6.5)Gains on curtailment (1.2) -
Total (credit)/charge within administrative expenses (0.3) 1.2
Actual return on plan assets 7.8 11.4
Changes in the present value of the defined benefit obligationsDefined benefit obligation at 1 January 133.8 89.0Acquired on transfer of engagements - 38.9Gains on curtailment (1.2) -Current service cost 2.1 1.8Interest cost 7.0 5.9Employee contributions 0.7 0.7Actuarial losses/(gains) 3.9 (0.2)Benefits paid (3.4) (2.3)
Defined benefit obligation at 31 December 142.9 133.8

NOTES TO THE ACCOUNTS(continued)
12. PENSION SCHEME (continued)
2011 2010
Group and Society £m £m
Changes in the fair value of plan assetsFair value of plan assets at 1 January 137.9 95.9Acquired on transfer of engagements - 30.1Expected return on plan assets 8.2 6.5Actuarial (losses)/gains (0.4) 4.8Contributions by employer 3.8 2.2Employee contributions 0.7 0.7Benefits paid (3.4) (2.3)
Fair value of plan assets at 31 December 146.8 137.9
The amount recognised in the statements of other comprehensive incomeActuarial (loss)/gain (4.3) 5.0Tax credit/(charge) on actuarial loss/gain at 25% (2010: 27%) 1.1 (1.4)
Actuarial (loss)/gain net of tax (3.2) 3.6
As a result of the merger with Stroud & Swindon Building Society, a curtailment gain of £1.2 million was recognised duringthe year.
The major categories of plan assets as a percentage of the fair value of total plan assets, and their expected rates of returnare:
Expected return at Plan assets Expected return at Plan assetsbalance sheet date at 31.12.2011 balance sheet date at 31.12.2010
% % % %
Equities 7.2 19 8.2 25Corporate bonds 4.8 20 5.5 20Government bonds 3.2 33 4.2 21Alternatives 4.9 28 5.7 34
100 100
At 31 December 2011, the Coventry Building Society Superannuation Fund held assets totalling £0.5 million which wereinvested in Coventry Building Society Permanent Interest Bearing Shares (PIBS) (2010: £0.5 million).
To develop the expected long-term rate of return on assets assumption, the Group considered the current level of expectedreturns on risk free investments (primarily Government bonds), the historical level of the risk premium associated with theother asset classes in which the portfolio is invested and the expectations for future returns of each asset class. Theexpected return for each asset class, as shown above, was then weighted based on the asset allocation to develop theexpected long-term rate of return on assets assumption for the portfolio and then a deduction of 0.02% (2010: 0.14%) madefor expenses. This resulted in the selection of 4.8% (2010: 5.8%).
58

59
12. PENSION SCHEME (continued)
The principal actuarial assumptions used are as follows:Weighted average assumptions used to determine benefit obligations at 31.12.2011 31.12.2010
% %
Discount rate 4.8 5.5Rate of pensionable salary increase 4.0 4.3
Weighted average assumptions used to determine net pension cost for the year ended
Discount rate 5.5 5.5Expected long-term return on fund assets 5.8 6.2Rate of pensionable salary increase 4.3 4.6Rates of inflation (Retail Price Index) 3.5 3.2
Weighted average life expectancy for mortality tables used to determine benefit obligations at
31.12.2011 31.12.2010Male Female Male Female
Member age 60 (current life expectancy) 26.2 28.9 26.1 28.8Member age 45 (life expectancy at age 60) 28.3 30.9 28.2 30.8
The assumptions on mortality are determined by the actuarial tables known as S1PXA (YOB) medium cohort 1% underpin forcurrent and future pensioners (2010: S1PXA (YOB) medium cohort for current and future pensioners).
Financial year ending
Fund history 2011 2010 2009 2008 2007
Fair value of fund assets at end of year (£m) 146.8 137.9 95.9 80.4 94.1Benefit obligation at end of year (£m) 142.9 133.8 89.0 71.5 82.5
Surplus (£m) 3.9 4.1 6.9 8.9 11.6
Difference between expected and actual return on fund assets
Amount (£m) (0.4) 4.9 9.5 (20.8) (1.2)Percentage of fund assets (%) (0.3) 3.6 9.9 (25.9) (1.3)
Actuarial losses/(gains) on fund liabilities
Amount (£m) 3.9 (0.2) 12.8 (16.4) (11.1)Percentage of fund liabilities (%) 2.7 (0.1) 14.4 (22.9) (13.5)

NOTES TO THE ACCOUNTS(continued)
13. IMPAIRMENT PROVISIONS ON LOANS AND ADVANCES TO CUSTOMERS
Loans fully secured onresidential Other
property loans Total
Group £m £m £m
At 1 January 2011Individual impairment 14.3 0.6 14.9Collective impairment 5.4 0.8 6.2
19.7 1.4 21.1Charge for the year
Individual impairment 7.8 1.8 9.6Collective impairment 0.7 (0.4) 0.3
8.5 1.4 9.9
Amounts written off individual impairment (8.3) (1.6) (9.9)
At 31 December 2011Individual impairment 13.8 0.8 14.6Collective impairment 6.1 0.4 6.5
Total 19.9 1.2 21.1
Society
At 1 January 2011Individual impairment 10.5 0.5 11.0Collective impairment 3.9 0.6 4.5
14.4 1.1 15.5Charge for the year
Individual impairment 5.8 1.3 7.1Collective impairment (0.4) (0.4) (0.8)
5.4 0.9 6.3
Amounts written off individual impairment (6.5) (1.1) (7.6)
At 31 December 2011Individual impairment 9.8 0.7 10.5Collective impairment 3.5 0.2 3.7
Total 13.3 0.9 14.2
When arriving at the impairment provision, the Group has considered accounts with forbearance indicators. The Group notesthat accounts with forbearance indicators were immaterial in number and value. See page 80, Credit risk – forbearance forfurther details.
60
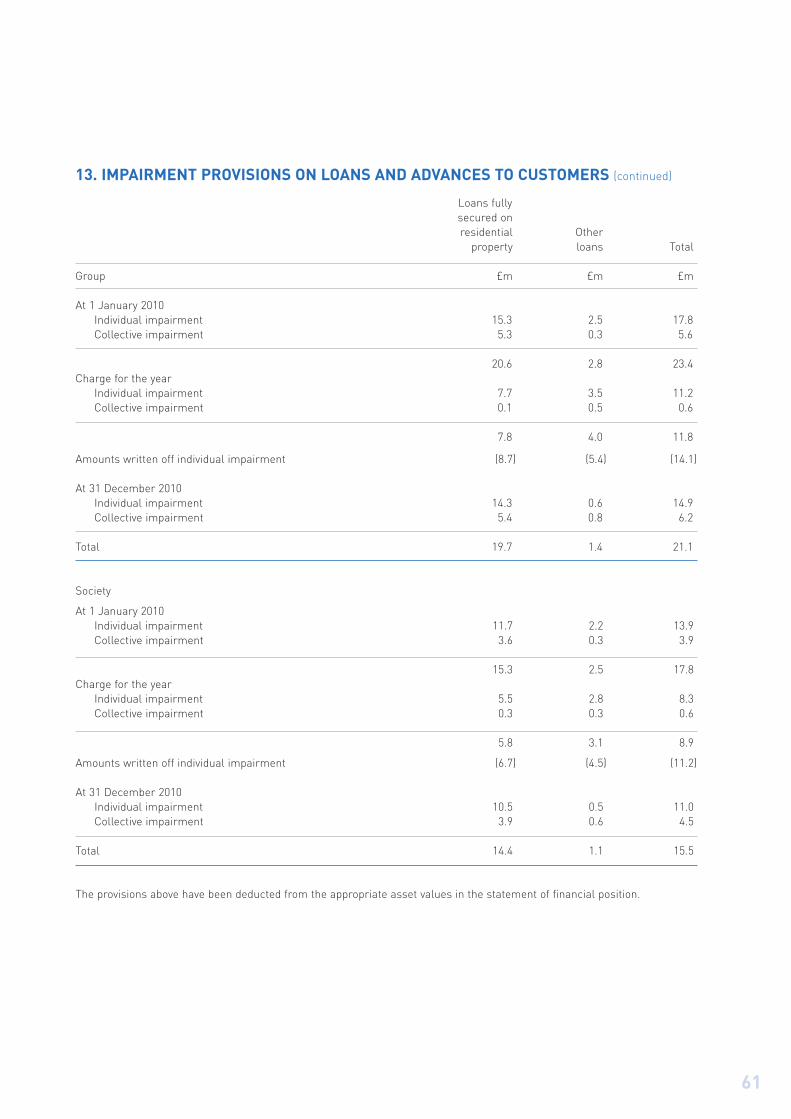
61
13. IMPAIRMENT PROVISIONS ON LOANS AND ADVANCES TO CUSTOMERS (continued)
Loans fully secured onresidential Other
property loans Total
Group £m £m £m
At 1 January 2010Individual impairment 15.3 2.5 17.8 Collective impairment 5.3 0.3 5.6
20.6 2.8 23.4 Charge for the year
Individual impairment 7.7 3.5 11.2 Collective impairment 0.1 0.5 0.6
7.8 4.0 11.8
Amounts written off individual impairment (8.7) (5.4) (14.1)
At 31 December 2010Individual impairment 14.3 0.6 14.9 Collective impairment 5.4 0.8 6.2
Total 19.7 1.4 21.1
Society
At 1 January 2010Individual impairment 11.7 2.2 13.9Collective impairment 3.6 0.3 3.9
15.3 2.5 17.8Charge for the year
Individual impairment 5.5 2.8 8.3Collective impairment 0.3 0.3 0.6
5.8 3.1 8.9
Amounts written off individual impairment (6.7) (4.5) (11.2)
At 31 December 2010Individual impairment 10.5 0.5 11.0Collective impairment 3.9 0.6 4.5
Total 14.4 1.1 15.5
The provisions above have been deducted from the appropriate asset values in the statement of financial position.

NOTES TO THE ACCOUNTS(continued)
14. PROVISION FOR IMPAIRMENT OF DEBT SECURITIES
The Group made a final recovery of £2.1 million from the administrators of Kaupthing, Singer & Friedlander in 2010.
15. PROVISION FOR FSCS LEVIES
All deposit-taking institutions that are members of the UK Financial Services Compensation Scheme (FSCS) are required tocontribute to the costs of the FSCS in safeguarding the deposits of savers in failed financial institutions. The Society is, andcontinues to be, a member of the FSCS.
Contributions to the FSCS are calculated according to a prescribed formula using the retail savings balances of all deposit-taking institutions who are members of the FSCS.
The Group has provided £13.4 million in its 2011 Accounts with respect to the estimated levies for the period 2012/13 andrevisions for the levy estimate for the period 2011/12 previously provided in its 2010 Accounts (2010: £5.6 million for theperiod 2011/12 and revisions for the period 2010/11).
These costs are ‘exceptional’ because they are outside of the Group’s control and are dependent upon the extent of failuresof other deposit-taking institutions who are members of the FSCS.
16. CHARITABLE DONATION TO POPPY APPEAL
During 2011 the Society again partnered with The Royal British Legion to raise funds for the annual Poppy Appeal. The Societyhas provided for a donation of £1.0 million (2010: £1.7 million) to the Poppy Appeal.
17. TAXATIONGroup Society Group Society
2011 2011 2010 2010
£m £m £m £m
Current taxUK corporation tax at 26.5% (2010: 28.0%) 11.9 6.8 15.6 10.4UK corporation tax - adjustment in respect of prior years (2.4) (1.8) (0.6) (0.6)
Total current tax 9.5 5.0 15.0 9.8
Deferred taxCurrent year 4.9 1.6 0.3 (0.2)Adjustment in respect of prior years (1.5) (1.6) 0.4 0.4
Total deferred tax 3.4 - 0.7 0.2
Total 12.9 5.0 15.7 10.0
The effective tax rate for the year is 21.7% for the Group and 17.4% for the Society (2010: 15.6% for the Group and 9.4% forthe Society). Further information relating to deferred tax is presented in note 27.
62

63
17. TAXATION (continued)
The tax on items reported through other comprehensive income is as follows:
Group Society Group Society2011 2011 2010 2010
£m £m £m £m
Statement of comprehensive incomeTax (credit)/charge on actuarial loss/gain on defined benefit
pension plan (1.1) (1.1) 1.4 1.4Tax charge on fair value movements 5.2 5.2 5.3 5.3
Total 4.1 4.1 6.7 6.7
The actual tax charge for the period differs from the UK standard corporation tax rate of 26.5% (2010: 28.0%). The differencesare explained below.
Profit before tax 59.5 28.8 100.6 106.7
Tax at UK standard rate of corporation tax on Profit before tax of 26.5% (2010: 28.0%) 15.8 7.6 28.2 29.9
Adjustments in respect of prior years (3.9) (3.4) (0.2) (0.2)Gain on business combination - - (12.3) (19.8)Effect of rate change 1.0 0.3 (0.1) (0.1)Expenses not deductible for tax purposes - 0.5 0.1 0.2
Total 12.9 5.0 15.7 10.0
On 23 March 2011, the Chancellor announced a further reduction in the standard rate of corporation tax to 25% from the alreadyannounced 27% to 26% from 1 April 2011. The 25% rate was substantively enacted in July 2011. The Group considers that thetemporary differences included in the deferred tax calculation will, for the most part, reverse after 1 April 2012 and therefore thedeferred tax assets and liabilities have been calculated using the 25% rate.
The UK Government also confirmed its intention to reduce the rate further by 1% per annum falling to 23% with effect from 1 April 2014. If the 23% tax rate had already been substantively enacted this would have reduced the net deferred tax as at 31 December 2011 by £0.4 million. We do not expect the proposed reductions in the statutory rate to 23%, once substantivelyenacted, to have a material effect on the Group's current or deferred tax charge.
18. CASH IN HAND AND BALANCES WITH THE BANK OF ENGLAND
Cash in hand and balances with the Bank of England other than mandatory reserve deposits 1,591.1 1,584.2 1,427.9 1,427.5
Mandatory reserve with the Bank of England 15.9 15.9 16.3 16.3
Total 1,607.0 1,600.1 1,444.2 1,443.8
The mandatory reserve deposits with the Bank of England of £15.9 million (2010: £16.3 million) are not available for use in theGroup’s day-to-day operations. All other balances with the Bank of England are not mandatory and are readily accessible.

NOTES TO THE ACCOUNTS(continued)
19. LOANS AND ADVANCES TO CREDIT INSTITUTIONS
Group Society Group Society2011 2011 2010 2010
£m £m £m £m
Loans and advances to credit institutions have remaining maturities as follows:
Accrued interest 0.1 0.1 1.0 1.0Repayable on demand 143.6 143.6 70.6 70.6Other loans and advances by residual maturity repayable
In not more than three months 243.6 174.6 106.0 106.0In more than three months but not more than one year 1.0 1.0 15.8 15.8
Total 388.3 319.3 193.4 193.4
20. DEBT SECURITIES
Available-for-sale:UK Government investment securities 1,781.4 1,781.4 1,019.4 1,019.4 Analysis of transferable debt securities
Listed 786.5 786.5 1,165.2 1,165.2 Unlisted 278.4 278.4 679.4 679.4
Total 2,846.3 2,846.3 2,864.0 2,864.0
Debt securities have remaining maturities as follows:In not more than one year 560.5 560.5 905.3 905.3In more than one year 2,285.8 2,285.8 1,958.7 1,958.7
Total 2,846.3 2,846.3 2,864.0 2,864.0
Movements during the year of transferable securities are analysed below:
At 1 January 2,864.0 2,864.0 3,538.0 3,538.0 Acquired on transfer of engagements - - 398.9 398.9 Additions 7,276.7 7,276.7 5,687.0 5,687.0 Maturities and disposals (7,468.8) (7,468.8) (6,796.2) (6,796.2)Gains from changes in fair value 174.4 174.4 36.3 36.3
At 31 December 2,846.3 2,846.3 2,864.0 2,864.0
64

65
21. LOANS AND ADVANCES TO CUSTOMERSGroup Society Group Society
2011 2011 2010 2010
£m £m £m £m
Loans fully secured on residential property 19,163.4 13,977.1 17,485.7 13,470.2 Other loans
Loans fully secured on land 11.4 1.1 14.5 2.0 Other loans 65.2 44.8 73.5 51.5
76.6 45.9 88.0 53.5
Total 19,240.0 14,023.0 17,573.7 13,523.7
Other loans incorporate £0.9 million (2010: £1.0 million) of loans that are fully secured on residential property and that were madeto corporate bodies such as Housing Associations prior to 1 July 1998, the date upon which the Society became subject to thepowers of the Building Societies Act 1997. Although the classification of these assets is not consistent with similar loans madeafter 1 July 1998 that are included in ‘loans fully secured on residential property’, this treatment has been adopted in order tocomply with the requirements of the Building Societies Act 1997. Other loans also include unsecured personal loans.
Maturity analysisThe remaining maturity of loans and advances to customers at the balance sheet date is as follows:
In not more than one year 104.8 91.7 111.9 91.5 In more than one year 19,156.3 13,945.5 17,482.9 13,447.7
19,261.1 14,037.2 17,594.8 13,539.2
Impairment provision (note 13) (21.1) (14.2) (21.1) (15.5)
Total 19,240.0 14,023.0 17,573.7 13,523.7
The maturity analysis is based on contractual maturity not actual redemption levels experienced by the Group or Society.
Covered bondsThe Society established Coventry Building Society Covered Bonds LLP (LLP) in July 2008, in order to provide security forissues of covered bonds made by the Society to external counterparties. The LLP is consolidated by the Group.
During the year, Coventry Building Society issued two public covered bonds. In April 2011, the Society issued a £750 millionseven year deal and a further €650 million three year deal in October 2011.
Loans and advances to customers include £4,474.7 million (2010: £3,051.7 million) for both the Group and Society for whichthe beneficial interest has been transferred from the Society to the LLP. The loans secure the £2,200.0 million and €650.0 million (2010: £2,000.0 million) of covered bonds issued by the Society. The loans are retained on the Society’s balancesheet as the Society retains substantially all the risks and rewards relating to the loans.
22. INVESTMENTS IN SUBSIDIARY UNDERTAKINGS
TotalShares Loans 2011
Society £m £m £m
Cost and net book valueAt 1 January 13.2 7,204.1 7,217.3Additions - 2,540.7 2,540.7
At 31 December 13.2 9,744.8 9,758.0
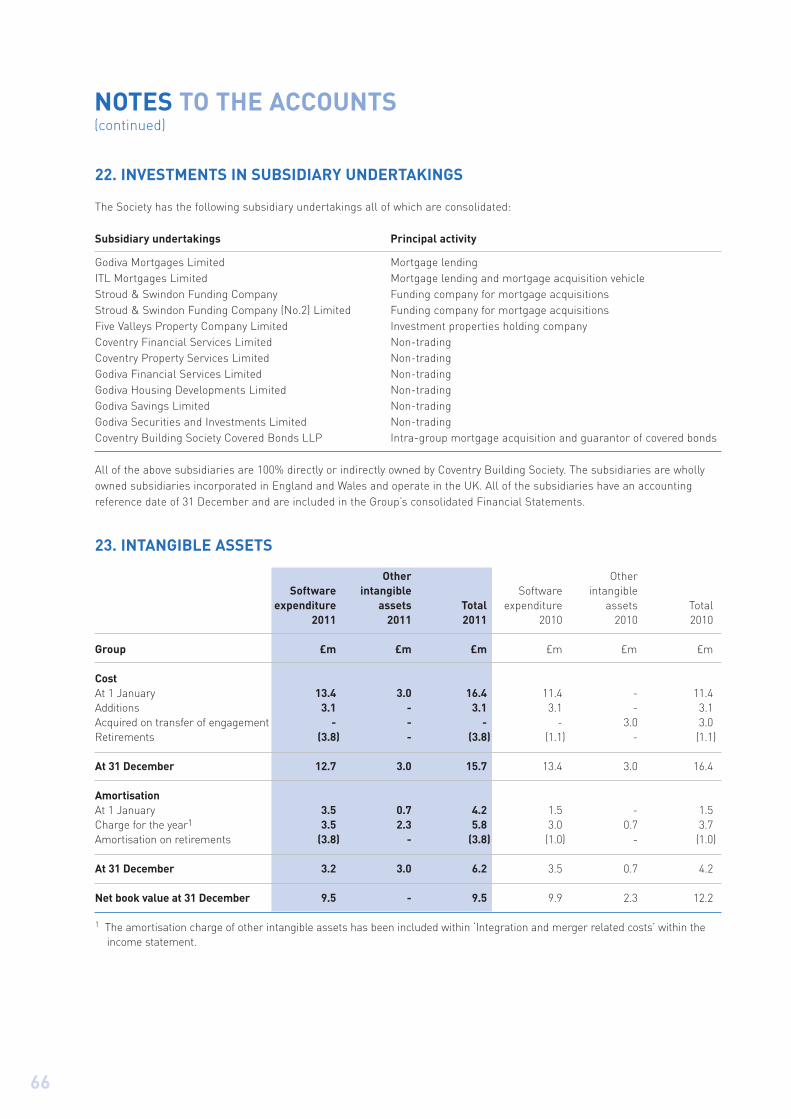
NOTES TO THE ACCOUNTS(continued)
22. INVESTMENTS IN SUBSIDIARY UNDERTAKINGS
The Society has the following subsidiary undertakings all of which are consolidated:
Subsidiary undertakings Principal activity
Godiva Mortgages Limited Mortgage lendingITL Mortgages Limited Mortgage lending and mortgage acquisition vehicleStroud & Swindon Funding Company Funding company for mortgage acquisitionsStroud & Swindon Funding Company (No.2) Limited Funding company for mortgage acquisitionsFive Valleys Property Company Limited Investment properties holding companyCoventry Financial Services Limited Non-tradingCoventry Property Services Limited Non-tradingGodiva Financial Services Limited Non-tradingGodiva Housing Developments Limited Non-tradingGodiva Savings Limited Non-tradingGodiva Securities and Investments Limited Non-tradingCoventry Building Society Covered Bonds LLP Intra-group mortgage acquisition and guarantor of covered bonds
All of the above subsidiaries are 100% directly or indirectly owned by Coventry Building Society. The subsidiaries are whollyowned subsidiaries incorporated in England and Wales and operate in the UK. All of the subsidiaries have an accountingreference date of 31 December and are included in the Group’s consolidated Financial Statements.
23. INTANGIBLE ASSETS
Other OtherSoftware intangible Software intangible
expenditure assets Total expenditure assets Total2011 2011 2011 2010 2010 2010
Group £m £m £m £m £m £m
CostAt 1 January 13.4 3.0 16.4 11.4 - 11.4Additions 3.1 - 3.1 3.1 - 3.1Acquired on transfer of engagement - - - - 3.0 3.0Retirements (3.8) - (3.8) (1.1) - (1.1)
At 31 December 12.7 3.0 15.7 13.4 3.0 16.4
AmortisationAt 1 January 3.5 0.7 4.2 1.5 - 1.5Charge for the year1 3.5 2.3 5.8 3.0 0.7 3.7Amortisation on retirements (3.8) - (3.8) (1.0) - (1.0)
At 31 December 3.2 3.0 6.2 3.5 0.7 4.2
Net book value at 31 December 9.5 - 9.5 9.9 2.3 12.2
1 The amortisation charge of other intangible assets has been included within ‘Integration and merger related costs’ within theincome statement.
66

67
23. INTANGIBLE ASSETS (continued)
Other OtherSoftware intangible Software intangible
expenditure assets Total expenditure assets Total2011 2011 2011 2010 2010 2010
Society £m £m £m £m £m £m
CostAt 1 January 12.9 3.0 15.9 10.9 - 10.9Additions 3.1 - 3.1 3.1 - 3.1Acquired on transfer of engagement - - - - 3.0 3.0Retirements (3.8) - (3.8) (1.1) - (1.1)
At 31 December 12.2 3.0 15.2 12.9 3.0 15.9
AmortisationAt 1 January 3.0 0.7 3.7 1.0 - 1.0Charge for the year1 3.5 2.3 5.8 3.0 0.7 3.7Amortisation on retirements (3.8) - (3.8) (1.0) - (1.0)
At 31 December 2.7 3.0 5.7 3.0 0.7 3.7
Net book value at 31 December 9.5 - 9.5 9.9 2.3 12.2
1 The amortisation charge of other intangible assets has been included within ‘Integration and merger related costs’ within theincome statement.
Other intangible assets are in respect of retail deposits and customer relationships arising on the merger with Stroud & SwindonBuilding Society.
24. PROPERTY, PLANT AND EQUIPMENT
Land and buildings Equipment,fixtures,
Long Short fittings andFreehold leasehold leasehold vehicles Total
Group and Society £m £m £m £m £m
CostAt 1 January 2011 7.9 3.9 3.2 43.0 58.0Additions - - 0.2 8.6 8.8Transferred from non-current assets held for sale 1.4 - - - 1.4Disposals - - - (2.9) (2.9)
At 31 December 2011 9.3 3.9 3.4 48.7 65.3
DepreciationAt 1 January 2011 1.1 0.4 2.1 26.3 29.9Charge for the year 0.2 0.2 0.1 4.5 5.0Depreciation on disposals - - - (2.4) (2.4)
At 31 December 2011 1.3 0.6 2.2 28.4 32.5
Net book value at 31 December 2011 8.0 3.3 1.2 20.3 32.8
Disposals relate to assets that were retired during the year.

NOTES TO THE ACCOUNTS(continued)
68
24. PROPERTY, PLANT AND EQUIPMENT (continued)
Land and buildings Equipment,fixtures,
Long Short fittings andFreehold leasehold leasehold vehicles Total
Group and Society £m £m £m £m £m
CostAt 1 January 20101 6.4 3.5 3.2 40.1 53.2Acquired on transfer of engagements 1.5 0.4 - - 1.9Additions - - - 5.6 5.6Disposals - - - (2.7) (2.7)
At 31 December 2010 7.9 3.9 3.2 43.0 58.0
DepreciationAt 1 January 20101 1.0 0.3 2.0 25.0 28.3Charge for the year 0.1 0.1 0.1 4.0 4.3Depreciation on disposals - - - (2.7) (2.7)
At 31 December 2010 1.1 0.4 2.1 26.3 29.9
Net book value at 31 December 2010 6.8 3.5 1.1 16.7 28.1
1 Freehold property as at 1 January 2010 was restated and excludes freehold property held for investment purposes. See note 25for details on the freehold properties held for investment purposes.
Equipment, fixtures, fittings and vehicles includes assets held under finance leases as follows:
2011 2010
Group and Society £m £m
Net book value 0.9 1.1Accumulated depreciation 0.6 0.7
The net book value of land and buildings occupied by the Group for its own activities is as follows:
Group and Society
At 31 December 11.6 10.5

69
25. INVESTMENT PROPERTIESGroup Society Group Society
2011 2011 2010 2010
£m £m £m £m
CostAt 1 January 5.9 0.7 0.7 0.7Acquired on transfer of engagements - - 5.2 -
At 31 December 5.9 0.7 5.9 0.7
AmortisationAt 1 January 0.1 0.1 0.1 0.1Charge for the year 0.1 - - -
At 31 December 0.2 0.1 0.1 0.1
Net book value at 31 December 5.7 0.6 5.8 0.6
Fair value at 31 December 6.9 1.3 6.5 1.3
Investment properties generally include residential properties and offices ancillary to branch premises which are not occupied bythe Group.
Depreciation is provided by the Group to write off the cost less the estimated residual value of investment properties (excludingland) by equal instalments over their useful economic life of 50 years. Land is not depreciated. Any impairment in the value ofproperties is dealt with through the income statement as it arises.
The investment properties were valued by a qualified chartered surveyor, who is a member of the Royal Institute of CharteredSurveyors (RICS). The properties were valued on the basis of market value, and the valuation was carried out in accordance withthe RICS Appraisal and Valuation Standards. As the investment properties are held at depreciated historical cost, this valuationhas not been reflected in the carrying value of the assets. No impairment of the investment properties was made during the year.
26. NON-CURRENT ASSETS HELD FOR SALE
As at 31 December 2011, non-current assets held for sale comprises one freehold property which was acquired as a resultof the merger with Stroud & Swindon Building Society. The property is expected to be sold in the financial year beginning 1 January 2012.
During the year, a freehold property was transferred from non-current assets held for sale to property, plant and equipmentand was occupied by the Group.
27. DEFERRED TAX
Deferred tax assets and liabilities are attributable to the following items:
Deferred tax assetsProvisions 0.5 0.5 0.3 0.3Pension scheme benefit from special contribution - - 0.1 0.1IFRS transitional fair value adjustments 0.9 0.9 1.3 1.3Excess of depreciation over capital allowances 0.3 0.3 0.1 0.1Defined benefit pension plan deficit - - 0.8 0.8Transfer of engagements - fair value adjustments 12.8 5.0 16.8 5.6
Total 14.5 6.7 19.4 8.2

NOTES TO THE ACCOUNTS(continued)
27. DEFERRED TAX (continued)Group Society Group Society
2011 2011 2010 2010
£m £m £m £m
Deferred tax liabilitiesExcess of capital allowances over depreciation - - 1.0 1.0IFRS transitional fair value adjustments 1.5 1.5 2.0 2.0Defined benefit pension plan surplus 1.0 1.0 2.0 2.0Transfer of engagements - fair value adjustments 0.5 0.5 0.6 0.6
Total 3.0 3.0 5.6 5.6
Statement of other comprehensive incomeTax (credit)/charge on actuarial loss/gain on defined
benefit pension plan (1.1) (1.1) 1.4 1.4
28. SHARES
Held by individuals 18,956.0 18,956.0 17,626.5 17,626.5 Other shares 8.1 8.1 7.8 7.8
Total 18,964.1 18,964.1 17,634.3 17,634.3
Shares are repayable from the balance sheet date in the ordinary course of business as follows:Accrued interest 165.9 165.9 167.6 167.6 Repayable on demand 14,297.0 14,297.0 13,840.0 13,840.0 Shares with residual maturity repayable:
In more than three months but not more than one year 3,596.0 3,596.0 865.0 865.0 In more than one year but not more than five years 905.2 905.2 2,761.7 2,761.7
Total 18,964.1 18,964.1 17,634.3 17,634.3
29. DEPOSITS FROM BANKS
Deposits from banks are repayable from the balance sheet date in the ordinary course of business as follows:Accrued interest 0.8 0.8 0.7 0.7Repayable on demand 3.1 3.1 8.6 8.6Other amounts owed to banks with residual maturity repayable:
In not more than three months 507.0 507.0 1,306.1 1,306.1
Total 510.9 510.9 1,315.4 1,315.4
Deposits from banks include £501 million (2010: £1,294 million) in respect of sale and repurchase agreements.
30. OTHER DEPOSITS
Other deposits are repayable from the balance sheet date in the ordinary course of business as follows:Accrued interest - - 0.1 0.1Amounts owed to depositors with residual maturity repayable:
In not more than three months 23.0 23.0 25.0 25.0In more than three months but not more than one year - - 9.0 9.0
Total 23.0 23.0 34.1 34.1
70

71
31. AMOUNTS OWED TO OTHER CUSTOMERSGroup Society Group Society
2011 2011 2010 2010
£m £m £m £m
Amounts owed to other customers are repayable from the balance sheet date in the ordinary course of business as follows:
Accrued interest 1.9 1.9 2.8 2.8Repayable on demand 25.2 25.2 40.8 40.8Other amounts due to customers with residual maturity repayable:
In not more than three months 451.8 451.8 428.2 428.2 In more than three months but not more than one year 61.3 61.3 159.1 159.1 In more than one year but not more than five years 9.1 9.1 14.3 14.3
Total 549.3 549.3 645.2 645.2
32. DEBT SECURITIES IN ISSUE
Certificates of deposit 192.4 192.4 134.2 134.2Fixed rate notes 2,581.7 2,581.7 1,262.1 1,262.1Floating rate notes 89.7 89.7 137.0 137.0
Total 2,863.8 2,863.8 1,533.3 1,533.3
Debt securities in issue are repayable from the balance sheet date in the ordinary course of business as follows:
Accrued interest 46.0 46.0 12.4 12.4Other debt securities in issue with residual maturity repayable:
In not more than one year 701.6 701.6 178.9 178.9In more than one year 2,116.2 2,116.2 1,342.0 1,342.0
Total 2,863.8 2,863.8 1,533.3 1,533.3
33. DERIVATIVE FINANCIAL INSTRUMENTS
2011 2010Contract/ Fair Fair Contract/ Fair Fair
notional value value notional value valueamount assets liabilities amount assets liabilities
Group £m £m £m £m £m £m
Derivatives designated as fair value hedgesInterest rate swaps 11,854.0 258.6 299.8 9,857.9 71.2 138.3 Interest rate caps 748.0 0.3 - 343.0 0.1 -Cross currency swaps 570.1 - 36.2 - - -
Other derivativesInterest rate floors 40.0 0.8 - 40.0 1.1 -Currency swaps - - - 164.2 1.0 1.1
Total derivatives 13,212.1 259.7 336.0 10,405.1 73.4 139.4
Contract/notional amount indicates the amount outstanding at the balance sheet date and does not represent amounts at risk.

NOTES TO THE ACCOUNTS(continued)
33. DERIVATIVE FINANCIAL INSTRUMENTS (continued)
2011 2010Contract/ Fair Fair Contract/ Fair Fair
notional value value notional value valueamount assets liabilities amount assets liabilities
Group £m £m £m £m £m £m
Derivatives have remaining maturities as follows:In not more than one year 5,006.2 13.9 14.8 3,717.9 13.9 20.3 In more than one year 8,205.9 245.8 321.2 6,687.2 59.5 119.1
Total derivatives 13,212.1 259.7 336.0 10,405.1 73.4 139.4
Society
Derivatives designated as fair value hedgesInterest rate swaps 11,104.1 168.3 299.8 9,857.9 71.2 138.3 Interest rate caps 748.0 0.3 - 343.0 0.1 -
Other derivativesInterest rate floors 40.0 0.8 - 40.0 1.1 -Currency swaps - - - 164.2 1.0 1.1
Total derivatives 11,892.1 169.4 299.8 10,405.1 73.4 139.4
Contract/notional amount indicates the amount outstanding at the balance sheet date and does not represent amounts at risk.
SocietyDerivatives have remaining maturities as follows:
In not more than one year 5,006.2 13.9 14.8 3,717.9 13.9 20.3 In more than one year 6,885.9 155.5 285.0 6,687.2 59.5 119.1
Total derivatives 11,892.1 169.4 299.8 10,405.1 73.4 139.4
HEDGING ACTIVITIES
Fair value hedgesAt 31 December 2011 the Group held the following interest rate derivative contracts which qualify for hedge accounting:
Interest rate swap agreements under which the Group pays a fixed rate of interest and receives interest based on LIBOR.These swaps are used to hedge the exposure to changes in the fair value of fixed rate mortgage assets as a result of changesin market interest rates. These swaps have a nominal principal amount of £3,792.7 million (2010: £3,531.9 million) and a netnegative fair value of £98.2 million (2010: net negative £80.1 million).
Interest rate swap agreements under which the Group receives a fixed rate of interest and pays interest based on LIBOR.These swaps are used to hedge the exposure to changes in the fair value of fixed rate share liabilities as a result of changesin market interest rates. These swaps have a nominal principal amount of £4,465.0 million (2010: £4,180.0 million) and a netpositive fair value of £37.0 million (2010: net positive £12.0 million).
Interest rate swap agreements under which the Group pays a fixed rate of interest and receives interest based on LIBOR.These swaps are used to hedge the exposure to changes in the fair value of fixed rate gilts, Government guaranteed bonds,bonds issued by supranational organisation or covered bonds, purchased in the wholesale market as a result of changes inmarket interest rates. These swaps have a nominal principal amount of £1,448.0 million (2010: £737.0 million) and a netnegative fair value of £196.9 million (2010: net negative £30.0 million).
72

73
33. DERIVATIVE FINANCIAL INSTRUMENTS (continued)
Fair value hedges (continued)Interest rate swap agreements under which the Group receives a fixed rate of interest and pays interest based on LIBOR.These swaps are used to hedge the exposure to changes in the fair value of fixed rate bonds or liabilities issued in thewholesale market as a result of changes in market interest rates. These swaps have a nominal principal amount of £2,148.3 million (2010: £1,409.0 million) and a net positive fair value of £216.9 million (2010: net positive £31.0 million).
Interest rate cap agreements under which the Group pays an initial premium and is subsequently compensated to the extentthat LIBOR exceeds the cap strike rate. These caps are used to hedge changes in the fair value of exposure to the risk thatmarket rates exceed the cap on capped rate mortgage assets. These caps have a nominal principal amount of £748.0 million(2010: £343.0 million) and a net positive fair value of £0.3 million (2010: net positive £0.1 million).
Cross currency swaps under which the Group receives interest at a fixed rate of euros and pays interest based on LIBOR.These swaps are used to hedge the exposure to changes in the fair value of euro denominated bonds issued in the wholesalemarket as a result of changes in market interest rates and exchange rates. These cross currency swaps have a nominalprincipal amount of £570.1 million (2010: £nil) and a net negative fair value of £36.2 million (2010: £nil).
The derivative gains and losses for the year in respect of fair value hedges comprise gains on derivatives of £12.3 million(2010: £27.8 million) and associated losses on hedged items of £11.6 million (2010: £29.2 million).
Hedges not qualifying for hedge accountingInterest rate floor agreements under which the Group pays an initial premium and is subsequently compensated to the extentthat LIBOR falls below the floor strike rate. These floors are used to hedge the risk of long-term low rates of interest. Thesefloors have a nominal principal amount of £40.0 million (2010: £40.0 million) and a net positive fair value of £0.8 million (2010: £1.1 million).
During the year, there was a maturity of the cross currency swap under which the Group received interest at EURIBOR and paidinterest based on LIBOR. This swap was used to hedge exposure to changes in the fair value of euro denominated bonds issuedin the wholesale market as a result of changes in market interest rates and exchange rates. At 31 December 2011, there wereno cross currency swaps not qualifying for hedge accounting (2010: nominal principal of £82.0 million and net positive fair valueof £1.0 million).
During the year, there was also a maturity of the foreign exchange swap under which the Society had sold euros for poundssterling at the exchange rate current to the deal and agreed that at a future date it would sell at an agreed exchange rate poundssterling for the same value of euros that was originally exchanged. This swap was used to hedge exposure to changes in thevalue of future cash flows on euro denominated bonds issued in the wholesale market as a result of changes in exchange rates.At 31 December 2011, there were no foreign exchange swaps not qualifying for hedge accounting (2010: nominal principal of£82.2 million net negative fair value of £1.1 million).
The derivative gains and losses for the year in respect of hedges that do not qualify for hedge accounting comprise losses onderivatives of £0.2 million (2010: gains of £0.7 million).

NOTES TO THE ACCOUNTS(continued)
34. OTHER LIABILITIESGroup Society Group Society
2011 2011 2010 2010
£m £m £m £m
Other liabilities falling due within one year are as follows:
Amounts due to connected undertakings - 4,474.7 - 3,150.9 Tax deducted at source from interest paid 14.3 14.3 11.2 11.2 Other taxation and social security 2.2 2.2 1.8 1.8 Finance leases 0.4 0.4 0.6 0.6 Other creditors 2.4 2.4 2.5 2.5
19.3 4,494.0 16.1 3,167.0
Other liabilities falling due after more than one year but in less than five years:
Finance leases 0.5 0.5 0.5 0.5
Total 19.8 4,494.5 16.6 3,167.5
35. PROVISIONS FOR LIABILITIES AND CHARGES
Other OtherFSCS provisions Total FSCS provisions Total2011 2011 2011 2010 2010 2010
Group and Society £m £m £m £m £m £m
At 1 January 10.5 5.4 15.9 8.8 1.3 10.1 Acquired on transfer of engagement - - - 0.8 - 0.8 Charge for the year 13.4 0.2 13.6 5.6 4.2 9.8 Provisions utilised (5.4) (3.8) (9.2) (4.7) (0.1) (4.8)
At 31 December 18.5 1.8 20.3 10.5 5.4 15.9
The FSCS provision is expected to be utilised in two payments of £7.2 million and £11.3 million in September 2012 andSeptember 2013 respectively, to cover the FSCS levy periods 2011/12 and 2012/13. Further details relating to the FSCScharge are detailed in note 15.
Other provisions have also been recognised in respect of circumstances that may give rise to various customer claims. It isexpected that the liability will mainly crystallise over the next five years.
The Group has no further contingent liabilities to report.
74

75
36. SUBORDINATED LIABILITIESGroup Society Group Society
2011 2011 2010 2010
£m £m £m £m
Subordinated liabilities owed to note holders are as follows:Fixed rate subordinated notes 2016 - 12.25% 7.0 7.0 7.0 7.0Fixed rate subordinated notes 2017 - 8.37% 10.0 10.0 10.0 10.0Fixed rate subordinated notes 2021 - 6.12% 10.1 10.1 10.1 10.1Fixed rate subordinated notes 2022 - 6.469% 15.5 15.5 15.5 15.5Fixed rate subordinated notes 2026 - 6.33% 10.2 10.2 10.2 10.2Fixed rate subordinated notes 2032 - 7.54% 15.4 15.4 15.4 15.4
Total 68.2 68.2 68.2 68.2
All the subordinated liabilities are denominated in sterling. The notes are repayable in the years stated, or earlier in accordancewith their terms at the option of the Society, with the prior consent of the FSA.
The rights of repayment of the holders of the notes are subordinated to the claims of all depositors, creditors and shareholders inthe Society, as regards the principal of the notes and accrued interest.
37. SUBSCRIBED CAPITAL
Subscribed capital owed to permanent interest holding members isas follows:
Permanent interest bearing shares 161.3 161.3 161.3 161.3
Interest is paid in arrears on £40 million permanent interest bearing shares at the rate of 12 1/8% per annum in half-yearlyinstalments, and on £120 million permanent interest bearing shares at the rate of 6.092% per annum in half-yearly instalments.The shares are repayable only in the event of a winding up of the Society or otherwise with the prior consent of the FSA. In awinding up or dissolution of the Society the claims of the holders of permanent interest bearing shares would rank behind allother creditors of the Society and the claims of members holding shares as to principal and interest. The holders of permanentinterest bearing shares are not entitled to any share in any final surplus upon a winding up or final dissolution of the Society.
38. FINANCIAL COMMITMENTS
Undrawn mortgage loan facilities 125.9 93.4 152.4 108.0
Subject to the satisfaction of previously agreed loan to value ratios, the Group is committed to £125.9 million (2010: £152.4 million) of undrawn mortgage loan facilities (Society £93.4 million, 2010: £108.0 million) relating to its lifetimeand flexible mortgage products.

NOTES TO THE ACCOUNTS(continued)
39. CAPITAL AND LEASING COMMITMENTSGroup Society Group Society
2011 2011 2010 2010
£m £m £m £m
Capital commitmentsCapital expenditure contracted for but not provided for in the Accounts 0.2 0.2 1.6 1.6
Leasing commitmentsFuture minimum lease payments under non-cancellable operatingleases relating to land and buildings were as follows:
Amounts falling due:Within one year 3.2 3.2 3.1 3.1 Between one and five years 9.6 9.6 10.3 10.3 After five years 8.7 8.7 9.8 9.8
Total 21.5 21.5 23.2 23.2
Lease payments recognised as an expense in the period 3.7 3.7 3.1 3.1
Leasing payments due as lessorAt the balance sheet date, future minimum sub-leasing payments receivable under non-cancellable subleases 0.7 0.7 1.0 1.0
At the balance sheet date, future minimum lease payments receivable under non-cancellable leases were as follows:
Within one year 0.2 0.2 0.2 0.2Between one and five years 0.4 0.4 0.3 0.3After five years 0.2 0.2 0.2 0.2
Total 0.8 0.8 0.7 0.7
76

77
40. FINANCIAL INSTRUMENTS
Use of financial instrumentsThe risks of the organisation are managed on a Group basis and therefore all risk disclosures in this note have beenpresented on a consolidated basis. The term ‘Group’ is used in the remainder of this note to cover the activities of both theGroup and the Society.
Deposits are accepted from customers at both fixed and variable interest rates for various periods. The Group earns interestmargin on these deposits by investing in mortgages.
The Group holds derivative financial instruments for the purposes of managing the risks associated with its various fixed andcapped rate assets and liabilities and its foreign currency transactions. In accordance with its treasury policy, and theBuilding Societies Act 1986, the Group holds derivative financial instruments only for risk management and not forspeculative or trading purposes.
The Group’s policy is to manage its exposure to these risks within prudent limits. It does this through a combination ofmatching assets and liabilities with offsetting interest rate or exchange rate characteristics and by the use of derivativefinancial instruments such as interest rate swaps, forward rate agreements, interest rate options, cross currency interestrate swaps and foreign exchange contracts.
The accounting policy for derivatives and hedge accounting is described in the Accounting Policies in note 1.
Control and monitoring proceduresThe Asset and Liability Committee (ALCO) sets limits over the use of derivative products for managing exposure to interestrates and foreign exchange rates, sets Group wholesale credit policy and regularly monitors and reviews exposures. ALCOreports through the Risk Management Committee to the Board Risk Committee.
The Retail Credit Risk and Lending Committee sets Group retail credit policy and regularly monitors and reviews exposuresin this area. The Credit Risk and Lending Committee reports through the Risk Management Committee to the Board RiskCommittee.
The principal risks the Group faces are interest rate, credit, foreign currency and liquidity risk. Each risk, and the controlprocedures surrounding its management, are described in detail in the Risk Management Report (see pages 20 to 25).
Interest rate riskThe Group evaluates the impact on margin of various interest rate scenarios to monitor interest rate risk. The Group usesbasis point sensitivity analysis to assess the change in the value of the Group’s balance sheet net worth against a 100 basispoint (1.0%) parallel shock to interest rates.
Details of this sensitivity analysis are set out overleaf. The limits around these scenarios are proposed by ALCO and approvedby the Board. The Group’s approach surrounding the management of interest rate risk are detailed within the RiskManagement Report (see page 23).
All exposures include investment of the Group’s reserves.

NOTES TO THE ACCOUNTS(continued)
40. FINANCIAL INSTRUMENTS (continued)
Interest rate risk (continued)
The following table shows the impact on net worth through the reporting period:
+100bps -100bps +100bps -100bps2011 2011 2010 2010
£m £m £m £m
Impact on equity reserves (13.7) 14.0 (18.7) 18.8
Impact on profit and loss 11.1 (6.4) 11.8 (8.3)
The impact on equity reserves considers movements in the underlying value of assets and liabilities carried at fair value,based on the shift in market interest rates, whereas the impact on profit or loss considers the impact on the Group results inrespect of shift in the return on the Group’s assets and liabilities.
The following table sets out the carrying amount of the Group’s financial instruments that are exposed to interest rate riskand the expected interest reset date of those instruments.
More than More More three than six than
Three months months one year More Non-months less than less than less than than interestor less six months one year five years five years bearing Total
At 31 December 2011 £m £m £m £m £m £m £m
AssetsLiquid assets 2,951 - - 355 1,278 258 4,842Loans and advances to customers 12,652 931 1,051 3,939 621 46 19,240Fixed assets - - - - - 48 48Other assets and adjustments - - - - - 357 357
Total assets 15,603 931 1,051 4,294 1,899 709 24,487
Liabilities and equityShares (9,816) (1,028) (4,780) (2,997) (24) (319) (18,964)Deposits, amounts owed
to customers and debt securities (1,188) (566) (73) (554) (1,500) (66) (3,947)Other liabilities and adjustments - - - - - (603) (603)Subordinated liabilities - - - - (68) - (68)Subscribed capital - - - - (161) - (161)Reserves - - - - - (744) (744)
Total liabilities and equity (11,004) (1,594) (4,853) (3,551) (1,753) (1,732) (24,487)
Derivative financial instruments (2,658) 524 2,904 (761) 142 (151) -
Interest rate sensitivity gap 1,941 (139) (898) (18) 288 (1,174) -
The table above is based on the contractual interest rate reset date, which may differ from the contractual maturity date.
78
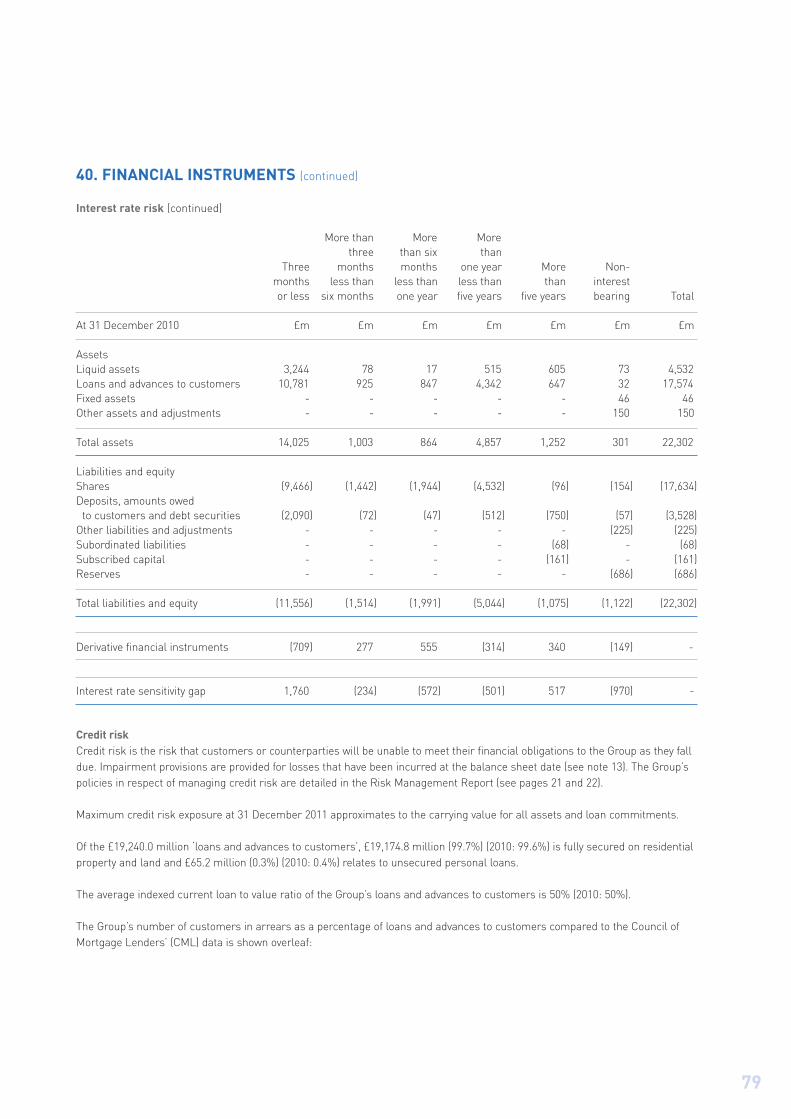
79
40. FINANCIAL INSTRUMENTS (continued)
Interest rate risk (continued)
More than More More three than six than
Three months months one year More Non-months less than less than less than than interestor less six months one year five years five years bearing Total
At 31 December 2010 £m £m £m £m £m £m £m
AssetsLiquid assets 3,244 78 17 515 605 73 4,532 Loans and advances to customers 10,781 925 847 4,342 647 32 17,574 Fixed assets - - - - - 46 46 Other assets and adjustments - - - - - 150 150
Total assets 14,025 1,003 864 4,857 1,252 301 22,302
Liabilities and equityShares (9,466) (1,442) (1,944) (4,532) (96) (154) (17,634)Deposits, amounts owed
to customers and debt securities (2,090) (72) (47) (512) (750) (57) (3,528)Other liabilities and adjustments - - - - - (225) (225)Subordinated liabilities - - - - (68) - (68)Subscribed capital - - - - (161) - (161)Reserves - - - - - (686) (686)
Total liabilities and equity (11,556) (1,514) (1,991) (5,044) (1,075) (1,122) (22,302)
Derivative financial instruments (709) 277 555 (314) 340 (149) -
Interest rate sensitivity gap 1,760 (234) (572) (501) 517 (970) -
Credit riskCredit risk is the risk that customers or counterparties will be unable to meet their financial obligations to the Group as they falldue. Impairment provisions are provided for losses that have been incurred at the balance sheet date (see note 13). The Group’spolicies in respect of managing credit risk are detailed in the Risk Management Report (see pages 21 and 22).
Maximum credit risk exposure at 31 December 2011 approximates to the carrying value for all assets and loan commitments.
Of the £19,240.0 million ‘loans and advances to customers’, £19,174.8 million (99.7%) (2010: 99.6%) is fully secured on residentialproperty and land and £65.2 million (0.3%) (2010: 0.4%) relates to unsecured personal loans.
The average indexed current loan to value ratio of the Group’s loans and advances to customers is 50% (2010: 50%).
The Group’s number of customers in arrears as a percentage of loans and advances to customers compared to the Council ofMortgage Lenders’ (CML) data is shown overleaf:

NOTES TO THE ACCOUNTS(continued)
40. FINANCIAL INSTRUMENTS (continued)
Credit risk (continued)
Group CML1 Group CML2011 2011 2010 2010
% % % %
Greater than three months 1.16 1.98 1.17 2.11Greater than six months 0.56 1.12 0.59 1.23Greater than one year 0.14 0.48 0.18 0.55In possession 0.05 0.12 0.06 0.11
1 Council of Mortgage Lenders’ data (as at 31 December 2011).
Advances to customers are supported by collateral in the form of residential properties. Below is an analysis of the collateralagainst these advances.
Loan to value analysis on advances to customers:New Mortgage New Mortgage
lending balances lending balances2011 2011 2010 2010
Indexed loan to value: % % % %
< 50% 32.48 47.04 35.32 48.8250% to 65% 37.58 20.79 31.45 18.8665% to 75% 17.56 12.99 22.65 11.2275% to 85% 11.07 9.74 9.69 9.3985% to 95% 1.31 5.44 0.89 6.32> 95% - 4.00 - 5.39
Total 100.00 100.00 100.00 100.00
The table below provides further information by payment due status:
2011 2011 2010 2010
£m % £m %
Not impairedNot past due 18,337.2 95.31 16,588.5 94.40Past due up to three months 643.3 3.34 736.7 4.19
ImpairedPast due over three to six months 129.5 0.67 120.2 0.68Past due over six months or in litigation 119.4 0.62 117.2 0.67In possession 10.6 0.06 11.1 0.06
Total 19,240.0 100.00 17,573.7 100.00
The Group held properties valued at £11.6 million (2010: £13.3 million) pending their sale as collateral against loan repossessioncases of £10.6 million (2010: £11.1 million) which are classified in ‘loans and advances to customers’ in the statement of financialposition.
Credit risk - forbearanceCustomers subject to forbearance measures actioned by the collections department as at 31 December 2011 represented 0.34%of the total book by outstanding balance, and 0.30% of the total book by number of cases.
80
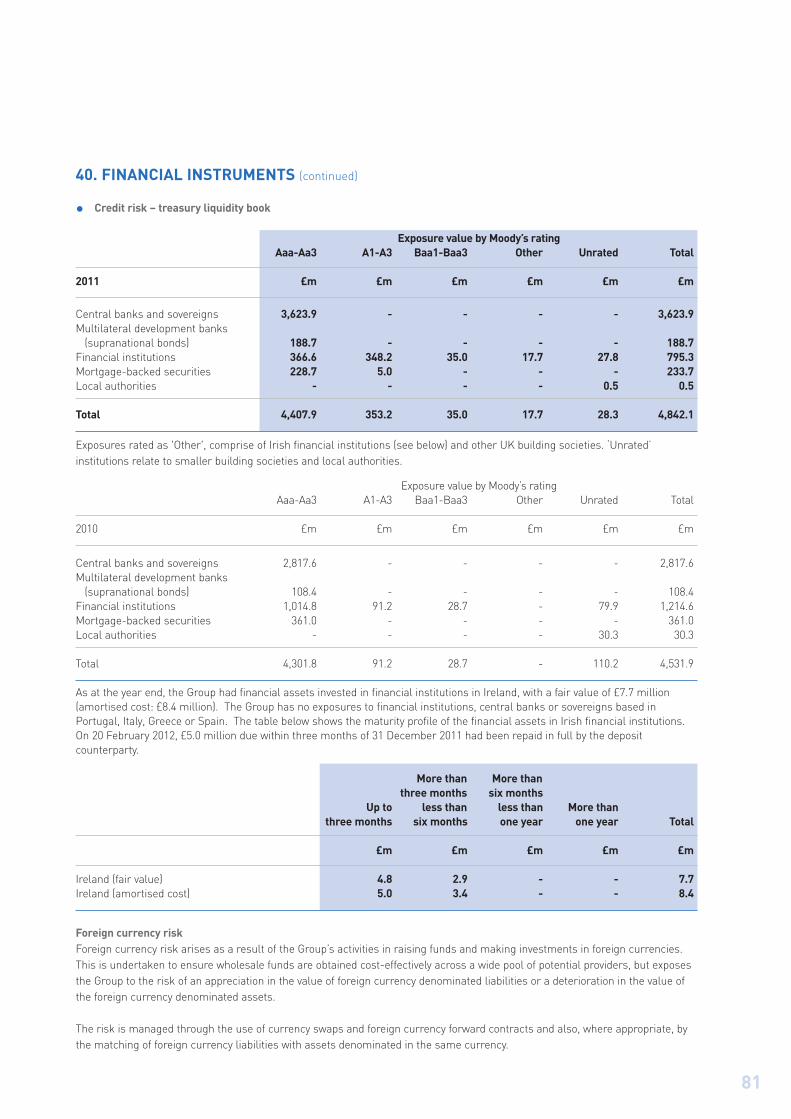
81
40. FINANCIAL INSTRUMENTS (continued)
Credit risk – treasury liquidity book
Exposure value by Moody’s ratingAaa-Aa3 A1-A3 Baa1-Baa3 Other Unrated Total
2011 £m £m £m £m £m £m
Central banks and sovereigns 3,623.9 - - - - 3,623.9Multilateral development banks
(supranational bonds) 188.7 - - - - 188.7Financial institutions 366.6 348.2 35.0 17.7 27.8 795.3Mortgage-backed securities 228.7 5.0 - - - 233.7Local authorities - - - - 0.5 0.5
Total 4,407.9 353.2 35.0 17.7 28.3 4,842.1
Exposures rated as 'Other', comprise of Irish financial institutions (see below) and other UK building societies. ‘Unrated’institutions relate to smaller building societies and local authorities.
Exposure value by Moody’s ratingAaa-Aa3 A1-A3 Baa1-Baa3 Other Unrated Total
2010 £m £m £m £m £m £m
Central banks and sovereigns 2,817.6 - - - - 2,817.6Multilateral development banks
(supranational bonds) 108.4 - - - - 108.4Financial institutions 1,014.8 91.2 28.7 - 79.9 1,214.6Mortgage-backed securities 361.0 - - - - 361.0Local authorities - - - - 30.3 30.3
Total 4,301.8 91.2 28.7 - 110.2 4,531.9
As at the year end, the Group had financial assets invested in financial institutions in Ireland, with a fair value of £7.7 million(amortised cost: £8.4 million). The Group has no exposures to financial institutions, central banks or sovereigns based inPortugal, Italy, Greece or Spain. The table below shows the maturity profile of the financial assets in Irish financial institutions.On 20 February 2012, £5.0 million due within three months of 31 December 2011 had been repaid in full by the depositcounterparty.
More than More than three months six months
Up to less than less than More thanthree months six months one year one year Total
£m £m £m £m £m
Ireland (fair value) 4.8 2.9 - - 7.7Ireland (amortised cost) 5.0 3.4 - - 8.4
Foreign currency riskForeign currency risk arises as a result of the Group’s activities in raising funds and making investments in foreign currencies.This is undertaken to ensure wholesale funds are obtained cost-effectively across a wide pool of potential providers, but exposesthe Group to the risk of an appreciation in the value of foreign currency denominated liabilities or a deterioration in the value ofthe foreign currency denominated assets.
The risk is managed through the use of currency swaps and foreign currency forward contracts and also, where appropriate, bythe matching of foreign currency liabilities with assets denominated in the same currency.
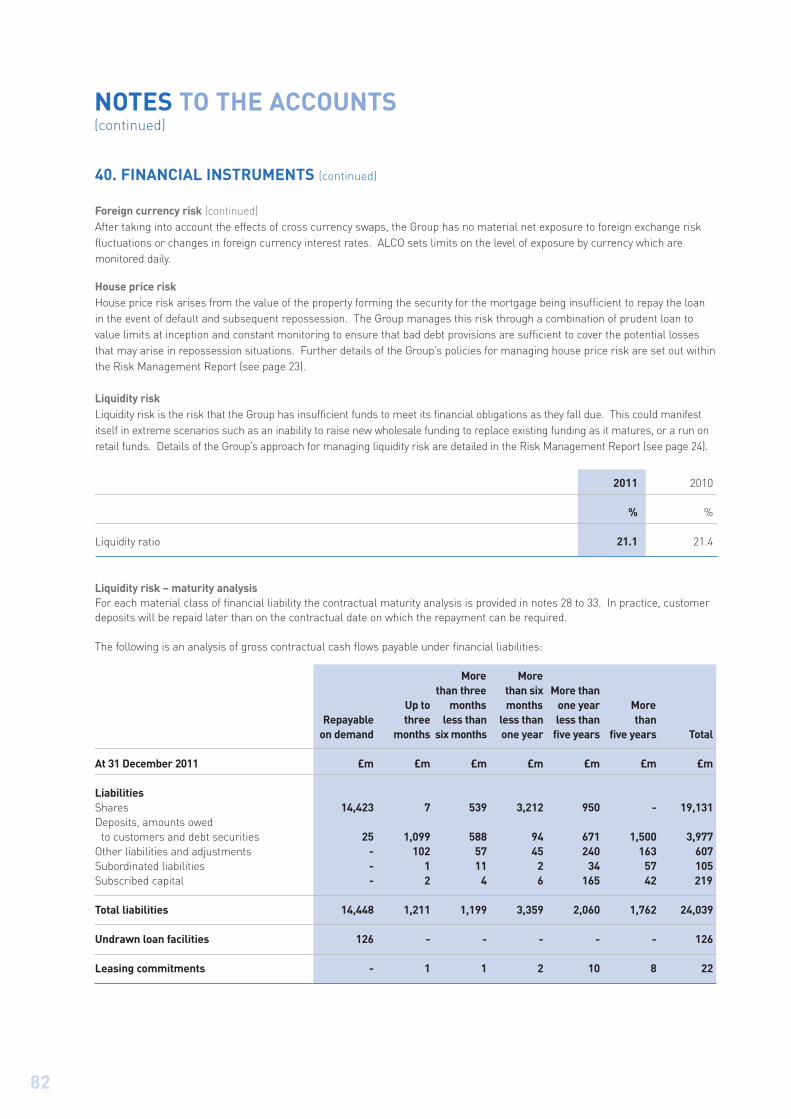
NOTES TO THE ACCOUNTS(continued)
40. FINANCIAL INSTRUMENTS (continued)
Foreign currency risk (continued)After taking into account the effects of cross currency swaps, the Group has no material net exposure to foreign exchange riskfluctuations or changes in foreign currency interest rates. ALCO sets limits on the level of exposure by currency which aremonitored daily.
House price riskHouse price risk arises from the value of the property forming the security for the mortgage being insufficient to repay the loanin the event of default and subsequent repossession. The Group manages this risk through a combination of prudent loan tovalue limits at inception and constant monitoring to ensure that bad debt provisions are sufficient to cover the potential lossesthat may arise in repossession situations. Further details of the Group’s policies for managing house price risk are set out withinthe Risk Management Report (see page 23).
Liquidity riskLiquidity risk is the risk that the Group has insufficient funds to meet its financial obligations as they fall due. This could manifestitself in extreme scenarios such as an inability to raise new wholesale funding to replace existing funding as it matures, or a run onretail funds. Details of the Group’s approach for managing liquidity risk are detailed in the Risk Management Report (see page 24).
2011 2010
% %
Liquidity ratio 21.1 21.4
Liquidity risk – maturity analysisFor each material class of financial liability the contractual maturity analysis is provided in notes 28 to 33. In practice, customerdeposits will be repaid later than on the contractual date on which the repayment can be required.
The following is an analysis of gross contractual cash flows payable under financial liabilities:
More More than three than six More than
Up to months months one year More Repayable three less than less than less than than
on demand months six months one year five years five years Total
At 31 December 2011 £m £m £m £m £m £m £m
LiabilitiesShares 14,423 7 539 3,212 950 - 19,131Deposits, amounts owed
to customers and debt securities 25 1,099 588 94 671 1,500 3,977Other liabilities and adjustments - 102 57 45 240 163 607Subordinated liabilities - 1 11 2 34 57 105Subscribed capital - 2 4 6 165 42 219
Total liabilities 14,448 1,211 1,199 3,359 2,060 1,762 24,039
Undrawn loan facilities 126 - - - - - 126
Leasing commitments - 1 1 2 10 8 22
82

83
40. FINANCIAL INSTRUMENTS (continued)
Liquidity risk – maturity analysis (continued)More More
than three than six More thanUp to months months one year More
Repayable three less than less than less than thanon demand months six months one year five years five years Total
At 31 December 2010 £m £m £m £m £m £m £m
LiabilitiesShares 13,641 102 129 1,086 2,879 - 17,837Deposits, amounts owed
to customers and debt securities 50 1,903 109 105 555 845 3,567Other liabilities and adjustments - 34 27 51 87 11 210Cross currency swaps - - - - 6 1 7Subordinated liabilities - - - 5 28 83 116Subscribed capital - 2 4 6 49 162 223
Total liabilities 13,691 2,041 269 1,253 3,604 1,102 21,960
Undrawn loan facilities 152 - - - - - 152
Leasing commitments - 1 1 2 10 10 24
Repayments of shares which are subject to notice are treated as if the notice were to be given immediately. In practice, depositsin the form of fixed bonds, notice accounts, regular savings accounts and some other transactional accounts are held bycustomers over the longer term and for this reason the table does not reflect the expected cash flows indicated by the Group’sdeposit retention history.
The tables above exclude cash flows beyond five years (other than the repayment of principal) that relate to subscribed capital.
Capital managementThe Group’s approach to capital management is detailed in the Directors’ Report on pages 15 and 16.

NOTES TO THE ACCOUNTS(continued)
40. FINANCIAL INSTRUMENTS (continued)
Fair valuesSet out below is a comparison by category of the carrying amounts and the fair values of all the Group’s, and shown separately,the Society’s, non-derivative financial instruments.
Carrying Fair Carrying Fairamount value amount value
2011 2011 2010 2010
Group £m £m £m £m
Financial assetsCash 1,607.0 1,607.0 1,444.2 1,444.2
Debt securities - Available-for-sale:UK Government investment securities 1,781.4 1,781.4 1,019.4 1,019.4 Analysis of transferable debt securities
Listed 786.5 786.5 1,165.2 1,165.2 Unlisted 278.4 278.4 679.4 679.4
Total 2,846.3 2,846.3 2,864.0 2,864.0
Loans and advances at amortised costLoans and advances to credit institutions 388.3 388.2 193.4 193.5Loans and advances to customers 19,240.0 19,836.5 17,573.7 18,470.9Other deposits 0.5 0.5 30.3 30.3
Total 19,628.8 20,225.2 17,797.4 18,694.7
Financial liabilities at amortised costShares 18,964.1 18,782.0 17,634.3 17,781.5Deposits, amounts owed to customers and debt securities 3,947.0 4,301.3 3,528.0 3,588.2Subordinated liabilities 68.2 92.2 68.2 91.7Permanent interest bearing shares 161.3 238.3 161.3 214.9
Total 23,140.6 23,413.8 21,391.8 21,676.3
Loans and advances to customers - fair valuesThe fair value of loans to customers is assessed as the present value of the expected cash flows. Future cash flows are projectedusing contractual interest payments, contractual repayments and the expected prepayment behaviour of borrowers. Prepaymentbehaviour includes adjustments that are dependent on the expected future interest rate environment and projected marketfactors. These cash flows are then discounted using expected future interest rates adjusted with a risk premium to reflect therisk factors inherent in these cash flows.
84

85
40. FINANCIAL INSTRUMENTS (continued)
Fair values (continued)Carrying Fair Carrying Fair
amount value amount value2011 2011 2010 2010
Society £m £m £m £m
Financial assetsCash 1,600.1 1,600.1 1,443.8 1,443.8
Debt securities - Available-for-sale:UK Government investment securities 1,781.4 1,781.4 1,019.4 1,019.4 Analysis of transferable debt securities
Listed 786.5 786.5 1,165.2 1,165.2 Unlisted 278.4 278.4 679.4 679.4
Total 2,846.3 2,846.3 2,864.0 2,864.0
Loans and advances at amortised costLoans and advances to credit institutions 319.3 319.2 193.4 193.5Loans and advances to customers 14,023.0 14,287.3 13,523.7 14,444.8Other deposits 0.5 0.5 30.3 30.3
Total 14,342.8 14,607.0 13,747.4 14,668.6
Financial liabilities at amortised costShares 18,964.1 18,782.0 17,634.3 17,781.5Deposits, amounts owed to customers and debt securities 3,947.0 4,301.3 3,528.0 3,588.2Subordinated liabilities 68.2 92.2 68.2 91.7Permanent interest bearing shares 161.3 238.3 161.3 214.9
Total 23,140.6 23,413.8 21,391.8 21,676.3
Loans and advances to customers - fair valuesThe fair value of loans to customers is assessed as the present value of the expected cash flows. Future cash flows are projectedusing contractual interest payments, contractual repayments and the expected prepayment behaviour of borrowers. Prepaymentbehaviour includes adjustments that are dependent on the expected future interest rate environment and projected marketfactors. These cash flows are then discounted using expected future interest rates adjusted with a risk premium to reflect therisk factors inherent in these cash flows.
Fair value hierarchyThe Group uses the following hierarchy for determining and disclosing financial instruments which are carried at fair value:
Level 1: quoted prices in active markets for the same instrument;
Level 2: quoted prices in active markets for similar assets or liabilities or other valuation techniques for which all significantinputs are based on observable market data; and
Level 3: valuation techniques for which any significant input is not based on observable market data.

NOTES TO THE ACCOUNTS(continued)
40. FINANCIAL INSTRUMENTS (continued)
Fair values (continued) TotalLevel 1 Level 2 Level 3 fair value
31 December 2011 £m £m £m £m
Financial assetsDerivative financial instruments
Interest rate swaps - 258.6 - 258.6Interest rate caps - 0.3 - 0.3Interest rate floors - 0.8 - 0.8
Total - 259.7 - 259.7
Debt securities - Available-for-sale:UK Government investment securities 1,781.4 - - 1,781.4Analysis of transferable debt securities
Listed 786.5 - - 786.5Unlisted - 278.4 - 278.4
Total 2,567.9 278.4 - 2,846.3
Financial liabilitiesDerivative financial instruments
Interest rate swaps - 299.8 - 299.8Currency swaps - 36.2 - 36.2
Total - 336.0 - 336.0
31 December 2010
Financial assetsDerivative financial instruments
Interest rate swaps - 71.2 - 71.2Interest rate caps - 0.1 - 0.1Interest rate floors - 1.1 - 1.1Cross currency interest rate swaps - 1.0 - 1.0
Total - 73.4 - 73.4
Debt securities - Available-for-sale:UK Government investment securities 1,019.4 - - 1,019.4Analysis of transferable debt securities
Listed 1,165.2 - - 1,165.2 Unlisted - 679.4 - 679.4
Total 2,184.6 679.4 - 2,864.0
Financial liabilitiesDerivative financial instruments
Interest rate swaps - 138.3 - 138.3Currency swaps - 1.1 - 1.1
Total - 139.4 - 139.4
86

87
40. FINANCIAL INSTRUMENTS (continued)
Fair values (continued)
Financial instruments recorded at fair valueThe following is a description of the determination of fair value for financial instruments which are recorded at fair value usingvaluation techniques. These incorporate the Group’s estimate of assumptions that a market participant would make whenvaluing the instruments.
Level 1 - Financial investments - Available-for-saleMarket and counterparty prices have been used to determine the fair value of listed debt securities. The fair values of all otherinstruments have been calculated using valuation models which use discounted cash flow analysis which incorporates observablemarket data including the use of prevailing interest rates and credit valuation adjustments to discount expected future cash flows.
Level 2 - DerivativesDerivative products valued using a valuation technique with observable market inputs are interest rate swaps and currency swaps.The valuation techniques applied are swap models using present value calculations. The models incorporate various assumptionsincluding interest rate curves, foreign exchange spot and forward rates, and the credit quality of counterparties.
41. RELATED PARTY TRANSACTIONS
ULTIMATE CONTROLLING PARTY
The Group is controlled by Coventry Building Society registered in England and Wales, which is also considered to be the ultimateparent.
TRANSACTIONS WITH KEY MANAGEMENT PERSONNEL
Transactions with key management personnel are on the same terms and conditions applicable to members and otheremployees within the Group. The directors are considered to be the only ‘key management’ for the purposes of the related partytransactions disclosures under IAS 24. Key management personnel also incorporates non-executive directors.
In accordance with Section 68 of the Act, the Society maintains a register of loans falling within Section 65 made to directors andconnected persons. A statement containing requisite particulars of such transactions may be inspected by members at theSociety’s AGM or at the Registered Office of the Society during the period 15 days prior to the AGM.

NOTES TO THE ACCOUNTS(continued)
88
41. RELATED PARTY TRANSACTIONS (continued)
TRANSACTIONS WITH KEY MANAGEMENT PERSONNEL (continued)2011 2010
Aggregate loans and deposits of directors £000 £000
Loans payable by directors to the SocietyLoans outstanding at 1 January 1,409.8 1,205.1Loans issued during the year (including existing loans on appointment as director) - 335.4Loan repayments during the year (net of interest) (174.1) (130.7)
Loans outstanding at 31 December 1,235.7 1,409.8
Deposits payable by the SocietyDeposits outstanding at 1 January 2,758.9 2,290.2Deposits issued during the year 1,248.5 1,424.1Deposit repayments during the year (net of interest) (1,089.4) (955.4)
Deposits outstanding at 31 December 2,918.0 2,758.9
Net interest income/(expense)Interest receivable 18.3 28.7Interest payable (47.0) (43.4)
Total (28.7) (14.7)
TRANSACTIONS WITH GROUP COMPANIES
Transactions are entered into with related parties in the normal course of business. These include loans, deposits and thepayment and recharge of administrative expenses. The volumes of related party transactions, outstanding balances at theyear end, and related income and expenses for the year are as follows:
£m £m
Loans payable to the SocietyLoans outstanding as at 1 January 7,204.1 5,313.5Acquired on transfer of engagements - 575.0Loans issued during the year 2,540.7 1,315.6
Loans outstanding as at 31 December 9,744.8 7,204.1
Net interest receivable 329.9 231.7
Fees and expenses paid to the Society 2.7 1.8
Interest on outstanding loans and deposits accrues at a transfer price rate agreed between the Society and its subsidiaries.

89
42. NOTES TO THE STATEMENTS OF CASH FLOWS
Group Society Group Society2011 2011 2010 2010
£m £m £m £m
Non-cash items included in profit before taxNet increase in impairment provisions 9.9 6.3 11.8 8.9 Depreciation and amortisation 10.9 10.8 7.3 7.3 Interest on subordinated liabilities 5.1 5.1 3.9 3.9Interest on subscribed capital 12.2 12.2 12.3 12.3Increase in fair value adjustment of hedged risk 5.0 6.0 9.0 9.0Other non-cash movements 16.7 16.7 (5.5) (0.5)Gain on business combinations - - (43.8) (70.7)
59.8 57.1 (5.0) (29.8)
Changes in operating assetsDecrease in loans to credit institutions and other liquid assets 111.6 111.6 378.8 378.8 Increase in loans and advances to customers (1,676.2) (505.6) (1,621.5) (793.7)(Increase)/decrease in prepayments and accrued income (0.2) (0.2) 1.5 1.5 (Increase)/decrease in other assets (1.0) (1.0) 5.6 5.5
(1,565.8) (395.2) (1,235.6) (407.9)
Changes in operating liabilitiesIncrease in shares 1,331.5 1,331.5 2,113.2 2,113.2 Decrease in deposits and other borrowings (910.6) (910.6) (396.7) (395.9)Increase/(decrease) in debt securities in issue 25.4 25.4 (212.9) (212.9)Increase in accruals and deferred income 35.0 34.5 63.9 62.3Decrease in other liabilities (9.1) (4.4) (21.8) (20.1)
472.2 476.4 1,545.7 1,546.6
Cash and cash equivalentsCash and balances with the Bank of England (note 18) 1,591.1 1,584.2 1,427.9 1,427.5 Due from other banks 387.1 318.1 109.9 109.9
1,978.2 1,902.3 1,537.8 1,537.4
Cash and cash equivalents excludes the balance which the Group is required to maintain with the Bank of England which, at 31 December 2011, amounted to £15.9 million (2010: £16.3 million).

ANNUAL BUSINESS STATEMENTfor the year ended 31 December 2011
1. STATUTORY PERCENTAGES2011 Statutory
% limits %
Lending limit 2.5 25.0Funding limit 17.3 50.0
The above percentages have been calculated in accordance with the provisions of the Building Societies Act 1986 asamended by the Building Societies Act 1997.
The lending limit measures the proportion of the business assets not in the form of loans fully secured on residentialproperty and is calculated as (X-Y)/X where:
X = business assets, being the total assets of the Group plus loan impairment less liquid assets, intangible assets andproperty, plant and equipment. The value of X used is the value at 31 December 2011.
Y = the principal value of, and interest accrued on, loans owed to the Group which are fully secured on residential property.The value of Y used is the value at 31 December 2011.
The funding limit measures the proportion of shares and borrowings not in the form of shares held by individuals and iscalculated as (X-Y)/X where:
X = shares and borrowings, being the aggregate of:
i) the principal value of, and interest accrued on, shares in the Society;
ii) the principal value of, and interest accrued on, the amounts deposited with the Society by banks, credit institutionsand other customers; and
iii) the principal value of, and interest accrued on, the amounts of debt securities of the Society.
Y = the principal value of, and interest accrued on, shares in the Society held by individuals other than bare trustees (or, inScotland, simple trustees) for bodies corporate or for persons that include bodies corporate.
90

91
2. OTHER PERCENTAGES2011 2010
% %
As a percentage of shares and borrowings:
Gross capital 4.25 4.32
Free capital 4.06 4.12
Liquid assets 21.1 21.4
As a percentage of mean total assets:
Profit for the financial year 0.20 0.42
Management expenses 0.37 0.37
The above percentages have been calculated from the Group Accounts.
‘Shares and borrowings’ represents the total of shares, deposits from banks, other deposits, amounts owed to othercustomers and debt securities in issue.
‘Gross capital’ represents the aggregate of reserves, subordinated liabilities and subscribed capital.
‘Free capital’ represents the aggregate of gross capital and collective impairment less intangible assets and property, plantand equipment.
‘Liquid assets’ represent the total of cash in hand and balances with the Bank of England, loans and advances to creditinstitutions, debt securities and other liquid assets.
‘Mean total assets’ represent the average of the 2011 and 2010 total assets.
‘Management expenses’ represent the aggregate of administrative expenses, amortisation of intangible assets anddepreciation of property, plant and equipment.

92
ANNUAL BUSINESS STATEMENT(continued)
3. INFORMATION RELATING TO DIRECTORS AND OTHER OFFICERS
Part 1 - DirectorsDate ofappointment
Name as a director(Date of birth) Occupation Other directorships of the Society
David A Harding, Company Director Enterprise Inns plc 01.10.1996JP, BA, MPhil, FCMA The Royal Mint Limited(Chairman)(29.07.1947)
Bridget P Blow Company Director Birmingham Hippodrome Limited 01.02.2007(Deputy Chairman) Birmingham Hippodrome Theatre Trust Limited(02.06.1949) Bridget Blow Consulting Limited
Harvard International plcKensington Green (Management) LimitedTrustmarque Acquisitions LimitedTrustmarque Group LimitedTrustmarque Intermediary LimitedTrustmarque Solutions Limited
Roger D Burnell, Company Director Thomas Cook Group plc 01.09.2008BSc, FCA Clarence Mansions Management (08.04.1950) Company Limited
Colin T Franklin, Building Society Godiva Mortgages Limited 07.07.2009FCIB Sales & Marketing Five Valleys Property Company Limited(15.06.1955) Director ITL Mortgages Limited
Ian S Geden, Company Director The Police Mutual 01.09.2008FCII(08.07.1953)
John Lowe, Building Society Godiva Mortgages Limited 14.10.2010BA (Oxon), ACA Finance Director Coventry Financial Services Limited(26.10.1972) Coventry Property Services Limited
Godiva Financial Services LimitedGodiva Housing Developments LimitedGodiva Savings LimitedGodiva Securities and Investments LimitedBerry Birch & Noble Management Limited (in liquidation)Stroud and Swindon Funding CompanyStroud and Swindon Funding Company (No. 2) LimitedCoventry Building Society Covered Bonds LLP
Ian Pickering, Company Director Electrocab Limited 01.09.2005MA (Cantab), FCA Bedford Hospital NHS Trust(16.10.1955) Member of the Council of Cranfield University
Member of the Auditing Practices Board of the Financial Reporting CouncilLatchways PLC
Fiona B Smith, Solicitor 01.12.2002LLB(03.01.1959)
Glyn Smith, Company Director Covent Garden Market Authority 22.09.2010MA, (Cantab), FCA Bournemouth & Poole Teaching PCT(15.09.1952) Dorset PCT
Examiner – ICAEWITL Mortgages Limited

93
3. INFORMATION RELATING TO DIRECTORS AND OTHER OFFICERS (continued)
Part 1 - Directors (continued)Date ofappointment
Name as a director(Date of birth) Occupation Other directorships of the Society
David Stewart, Building Society Godiva Mortgages Limited 11.02.2002BA, ACA Chief Executive Coventry Financial Services Limited(18.08.1965) Coventry Property Services Limited
Godiva Financial Services LimitedGodiva Housing Developments LimitedGodiva Savings LimitedGodiva Securities and Investments LimitedStroud and Swindon Funding CompanyStroud and Swindon Funding Company (No. 2) LimitedCoventry Building Society Covered Bonds LLPDeputy Chair of the Building Societies AssociationMember of the Council of Mortgage Lenders Chairman’s CommitteeMember of the Council of Mortgage Lenders Executive Committee
Documents may be served on the above named directors at:C/O Secretary and General Counsel, Oak Tree Court, Binley Business Park, Harry Weston Road, Coventry CV3 2UN.
In 2006 the Group entered into a service contract with David Stewart (Chief Executive) and is terminable by David Stewart onsix months’ notice and by the Group on one year’s notice.
In 2009 the Group appointed Colin Franklin (Sales and Marketing Director) to the Board. A service contract was entered intowhich is terminable by Colin Franklin on six months’ notice and by the Group on one year’s notice.
In 2010 the Group appointed John Lowe (Finance Director) to the Board. A service contract was entered into which isterminable by John Lowe on six months’ notice and by the Group on one year’s notice.
Part 2 – The Secretary
Name Occupation Directorships
Gill Davidson, LLB Secretary and Wrendale Consulting LimitedGeneral Counsel Coventry Building Society Covered Bonds LLP
Part 3 – Senior management team
Name Occupation Directorships
Julian M J Atkins, BSc, MBA, FCIPD, FCIB Head of Human Resources
Peter Elcock, ACIB, DipFS, MBA Chief Risk Officer Cornhill Consulting Limited
Rachel C Haworth, BA, MCIM Head of Marketing Lyng Hall Trust& Communications
Darin J Landon Head of Sales
Sally A Wrigglesworth, MBA, ACIB Head of Customer Service Arab Horse Society

ANNUAL BUSINESS STATEMENT(continued)
4. SUBSIDIARIES CARRYING ON BUSINESS
At 31 December 2011 the Society held (directly or indirectly) a 100% beneficial ownership in the following subsidiarycompanies, incorporated in England and Wales:
Share Share capital capital
authorised issued£ £
Godiva Mortgages Limited 1,000 20Stroud and Swindon Funding Company 11,745,000 11,741,343Stroud and Swindon Funding Company (No. 2) Limited 200,000,000 133,641,371ITL Mortgages Limited 104,000,000 1,473,802Five Valleys Property Company Limited 99,000,000 1
The Society also has an interest in Coventry Building Society Covered Bonds LLP which gives rise to risks and rewards thatare in substance no different than if it was a subsidiary undertaking and therefore is fully consolidated into the GroupAccounts. Coventry Building Society Covered Bonds LLP is registered in England and Wales.
5. SUBSIDIARIES NOT CARRYING ON BUSINESS
At 31 December 2011 the Society held shares in the following directly wholly owned subsidiary companies, all of which areincorporated in England and Wales:
Percentageowned Share
directly capitalby Society issued
% £
Coventry Financial Services Limited 100 20Coventry Property Services Limited 100 20Godiva Financial Services Limited 100 20Godiva Housing Developments Limited 100 20Godiva Savings Limited 100 2Godiva Securities and Investments Limited 100 20
At the same date, the authorised share capital of Godiva Savings Limited was £1,000. The authorised share capital of each ofthe other subsidiary companies was £100.
6. PRINCIPAL OFFICE
Coventry Building Society is a building society, incorporated and domiciled in the United Kingdom. The address of theregistered office is: Economic House, PO Box 9, High Street, Coventry, CV1 5QN.
94
The following glossary defines terminology within the Annual Report & Accounts to assist the reader and to facilitatecomparison with publications by other institutions:
ArrearsThe financial value of unpaid obligations, which arises when contractual payments are not paid when they fall due.
Available-for-sale reserveThe Available-for-sale reserve contains unrealised gains and losses arising from changes in the fair values of non-derivativefinancial assets that are categorised as Available-for-sale.
Basel IIThe recommendations on banking regulation made by the Basel Committee on Banking Supervision, and implemented in the EUvia the Capital Requirements Directive, which came into force on 1 January 2007. The Basel II framework introduced the conceptof three ‘pillars’ for regulation. Pillar 1 sets out the minimum capital requirements for firms, and under Pillar 2 firms will take aview of whether additional capital is required for risks not covered in Pillar 1. Pillar 3 improves market information by requiringfirms to publish details of risks and capital management.
Basel IIIThe Basel Committee on Banking Supervision issued strengthened proposals in response to the recent financial crisis, which arereferred to as Basel III. These proposals are a long-term package of changes that are due to commence on 1 January 2013 withan expected transition period running until 2021.
BIPRUThe Prudential sourcebook for Banks, Building Societies and Investment Firms, which sets out the FSA’s rules regarding risk,capital and liquidity in particular.
BSABuilding Societies Association (BSA) represents mutual lenders and deposit takers across the UK.
BFSRBank Financial Strength Ratings (BFSR) are applied by Moody's Investors Service and reflect their opinion of a financialinstitution’s intrinsic, stand-alone, financial strength relative to all other financial institutions rated by the agency.
Business riskThe risk that the external environment has the potential to affect the Society’s business model.
Buy-to-let (BTL) mortgageA mortgage secured on a residential property that is rented out to tenants.
Charitable donation to Poppy AppealRepresents the value of the donation made by the Society to The Royal British Legion’s Poppy Appeal.
Code StaffA group of employees to which the FSA’s Remuneration Code applies. Code staff consist of executive directors, non-executivedirectors and certain senior managers in control functions (e.g. human resources, audit, risk and compliance) who could have amaterial impact on the firm’s risk profile.
Council of Mortgage Lenders (CML)A trade association for the residential mortgage lending industry.
Contractual maturityThe date in the terms of a financial instrument on which the last payment or receipt under the contract is due for settlement.
Core tier 1 capitalCore tier 1 capital comprising general reserves, less intangible assets, pension surplus and other regulatory deductions.
Core tier 1 ratioCore tier 1 capital as a percentage of risk-weighted assets.
GLOSSARY
95

GLOSSARY
96
(continued)
Covered bondsDebt securities backed by a portfolio of mortgages that are segregated from the issuer's other assets solely for the benefit of theholders of the covered bonds. The Society issues covered bonds as part of its funding activities.
Credit riskThe risk that the customer or wholesale counterparty is unable to honour their obligations as they fall due.
Currency swapAn arrangement in which two parties exchange specific principal amounts of different currencies at inception and subsequentlyexchange interest payments on the principal amounts. Often, one party will pay a fixed interest rate, while the other will pay afloating exchange rate (though there are also fixed-fixed and floating-floating arrangements). At the maturity of the swap, theprincipal amounts are usually re-exchanged.
Debt securitiesTransferable instruments creating or acknowledging indebtedness. They include bonds, certificates of deposit and loan notes.The holder of a debt security is typically entitled to the payment of principal and interest, together with other contractual rightsunder the terms of the issue. Debt securities are generally issued for a fixed term and redeemable by the issuer at the end ofthat term. Debt securities can be secured on other assets or unsecured.
Deferred tax asset/(liability)Income taxes recoverable (or payable) in future periods resulting from temporary or timing differences, between the accountingvalue of assets and liabilities and the tax base of those assets and liabilities.
Defined benefit obligationThe present value of expected future payments required to settle the obligations of a defined benefit plan resulting from pastemployee service.
Defined benefit planPension or other post-retirement benefit plan offering guaranteed benefits usually as a fraction of the final salary.
Defined contribution planPension or other post-retirement benefit plan where the employer's obligation is limited to its contributions to the fund.
Deposits from banksMoney deposited with the Group by banks and recorded as liabilities. They include money-market deposits, and other short-termdeposits.
Derivative financial instrumentA contract or agreement, the value of which reflects changes in an underlying index such as an interest rate, foreign exchangerate or market index. The contract requires either no initial investment, or an initial investment that is smaller than would berequired for other types of contracts with a similar response to market factors. The most common types of derivatives areinterest rate swaps.
Effective interest rate method (EIR)The method used to measure the carrying value of a financial asset or a liability. EIR allocates associated interest income orexpense to produce a level yield, either to maturity or to the next re-pricing date.
EurozoneAn economic and monetary union (EMU) of 17 EU member states that have adopted the euro (€) as their common currency andsole legal tender.
ExposureThe maximum loss that a financial institution might suffer if a borrower or wholesale counterparty fails to meet their obligations.
Fair valueThe amount for which an asset could be exchanged, or a liability settled, between knowledgeable, willing parties in an arm’slength transaction.

97
Financial Services Compensation Scheme (FSCS)The UK’s compensation fund of last resort for customers of authorised financial services firms. The FSCS may pay compensationto customers if a firm is unable, or likely to be unable, to pay claims against it, usually because it has stopped trading or hasbeen declared in default. The FSCS is funded by the financial services industry. Every firm authorised by the FSA is obliged to payan annual levy, which goes towards its running costs and compensation payments.
Fitch RatingsFitch Ratings is a credit rating agency which provides credit ratings and research covering debt instruments and securities forfinancial institutions and governments.
ForbearanceMeasures to assist customers in financial difficulty. Typically, this involves working with the customer to make arrangementswhere some element of contractually due amounts are temporarily forgone by the lender. An example would include temporarytransfers to interest only.
Foreign currency riskThe risk of loss arising as a result of adverse movements in exchange rates on investments in foreign currencies.
Free capital The aggregate of gross capital and provisions for collective impairment losses on loans and advances to customers, less;property, plant and equipment, investment properties, non-current assets held for sale and intangible assets.
Financial Services Authority (FSA)Financial Services Authority (UK) is an independent non-governmental body, given statutory powers by the Financial Services andMarkets Act 2000.
Financial Ombudsman Service (FOS)Financial Ombudsman Service provides an independent and impartial service to resolve individual complaints that consumersand financial institutions have been unable to settle themselves.
General reserveThe general reserve is the accumulation of historic and current year profits and includes actuarial gains and losses on thedefined benefit pension plan (net of tax).
Gross capitalThe aggregate of equity, subscribed capital and subordinated liabilities.
Gross mortgage lendingNew mortgage lending advanced during the year.
IASInternational Accounting Standards. A set of standards stating how particular types of transactions and other events should bereflected in financial statements.
IFRICInternational Financial Reporting Interpretations Committee. IFRIC interpret the application of IASs and IFRSs and provide timelyguidance on financial reporting issues not specifically addressed in IASs and IFRSs, in the context of the International AccountingStandards Board framework.
IFRSInternational Financial Reporting Standards. A set of international accounting standards stating how particular types oftransactions and other events should be reported in financial statements.
Individual Liquidity Adequacy Assessment (ILAA)The Society’s own assessment of the liquidity resources it requires in order to remain within the risk tolerances it has set. Thiswill include an evaluation of potential stresses based on regulatory benchmarks and on Society specific tests.

GLOSSARY
98
(continued)
Impaired loansA loan is impaired if there is objective evidence that an impairment event has occurred, and that the event has an impact on theestimated future cash flows of the loan which can be reliably estimated. Impairment may be caused by a single event, or acombination of events.
Impairment provisionProvisions held against impaired assets on the balance sheet. The provisions represent management’s best estimate of lossesincurred in the loan portfolio at the balance sheet date.
Impairment ratioImpairment losses on loans and advances to customers as a percentage of average loans and advances to customers.
Individual/collectively assessed loan impairment provisionsImpairment is measured individually for assets that are individually identified as at the balance sheet date as being impaired, andcollectively for homogenous asset classes where there is evidence of impairment event(s) but these have not yet manifestedthemselves as individually identified impaired accounts.
Individual Capital Guidance (ICG)Guidance from the FSA on the levels of capital to be held by the Society to meet its minimum regulatory capital requirements.
Interest rate riskThe risk that income received or paid is adversely affected by interest rate fluctuations on the Society’s mortgage and savingsproducts.
Interest rate swapA contract under which two counterparties agree to exchange periodic interest payments based on a predetermined notionalprincipal amount.
Internal Capital Adequacy Assessment Process (ICAAP) The Society’s own assessment of the amount of capital that it needs to hold in respect of its regulatory requirements (for credit,market and operational risks) and for other risks. This assessment includes determination of a capital buffer to be held in caseof potential economic stress.
Internal ratings-based approach (IRB)An advanced approach to measuring capital requirements in respect of credit risk under Pillar 1 of Basel II. The IRB approachmay only be used with permission from the FSA.
International Accounting Standards Board (IASB)An independent standard-setting body of the International Accounting Standards Committee Foundation. The members of theIASB are responsible for the development and publication of International Financial Reporting Standards (IFRS) and for approvinginterpretations of IFRS as developed by the International Financial Reporting Interpretations Committee (IFRIC).
Level 1 fair valuesFair value derived from unadjusted quoted prices in active markets for identical assets or liabilities.
Level 2 fair valuesFair value derived from inputs other than quoted prices that are observable for the asset or liability, either directly (i.e. a price) orindirectly (i.e. derived from prices).
Level 3 fair valuesFair value derived from inputs for the asset or liability that are not based on observable market data.
LIBORLondon Inter-Bank Offer Rate. The interest rate at which banks can borrow funds from other banks. The LIBOR is derived from afiltered average of the interbank deposit rates for large loans with maturities between overnight and one full year.

99
Liquid assetsAssets held in order to be able to generate funds at short notice. This will comprise cash in hand, balances with the Bank ofEngland, debt securities (including gilts), and loans to credit institutions.
Liquidity riskThe risk that the Society cannot meet its financial obligations as they fall due or can secure them only at excessive cost.
Loan to value (LTV)LTV is the amount of mortgage loan as a percentage of the value of the property.
Management expensesThe aggregate of administrative expenses, depreciation and amortisation.
Market riskThe potential losses or decrease in value of the Group balance sheet as a result of adverse market movements. Specific types ofmarket risk include interest rate risk, foreign exchange risk and house price risk.
MemberA person who has a share investment or a mortgage loan with the Society.
Merger and integration related costsPrimarily consists of costs incurred during 2010 and 2011, relating directly to the merger with Stroud & Swindon Building Society.
Moody’s Investor ServicesMoody’s Investor Services is a credit rating agency which provides credit ratings and research covering debt instruments andsecurities for financial institutions and governments.
Net interest incomeThe difference between interest receivable on assets and similar income and interest paid on liabilities and similar charges.
Operational riskThe risk of loss arising from inadequate or failed internal processes, people and systems, or from external events.
Past dueA financial asset such as a loan is past due when the counterparty has failed to make a payment when contractually due.
Permanent interest bearing shares (PIBS)Unsecured, perpetual deferred shares of the Society offering a fixed coupon. These are a form of Tier 1 capital. PIBS rank behindthe claims of all subordinated debt holders, depositors, or creditors of the Society. PIBS are also known as subscribed capital.
Pension fund surplusThe assets in a pension fund that are in excess of its liabilities.
RepoAn agreement to sell a financial security together with a commitment by the seller to repurchase the asset at a specified price ona given date. In substance this forms a secured loan, with the difference between the purchase price and repurchase price beingthe interest rate.
Retail depositsDeposits from individuals, not from corporations, other financial institutions or sovereign entities.
Risk appetiteThe articulation of the level of risk that the Society is willing to take (or not take) in order to safeguard the interests of theSociety’s members, whilst also achieving business objectives.
Risk-weighted assets (RWA)The value of assets, after adjustment to reflect the degree of risk they represent in accordance with the relevant Basel II rules.

100
Senior unsecured marketThe market for bonds, issued by corporate bodies and financial institutions, which are not secured by any collateral and are notsubordinated to any other liabilities of the issuer.
SharesFunds deposited by a person in a retail savings account with the Society. Such funds are recorded as liabilities of the Society.
Standardised approachThe basic method used to calculate capital requirements for credit risk under Basel II. In this approach the risk-weighting usedin the capital calculation are determined by specified percentages.
Subordinated liabilitiesLiabilities which, in the event of insolvency or liquidation of the issuer, are subordinated to the claims of depositors and othercreditors of the issuer.
Subscribed capitalSee permanent interest bearing shares (PIBS).
Tier 1 capitalA component of regulatory capital comprising core tier 1 capital and permanent interest bearing shares (PIBS).
Tier 2 capitalA component of regulatory capital comprising qualifying subordinated debt and eligible collective impairment allowances, lesscertain regulatory deductions.
Transfer of engagementsAssets and liabilities acquired as a result of the merger with Stroud & Swindon Building Society.
UK Corporate Governance Code (the Code)Guidance issued by the Financial Reporting Council (formerly known as the Combined Code which was updated in 2010) on anumber of key components of effective board practice such as: board leadership, remuneration, accountability and reportingtransparency.
Underlying profitOperating profit after impairments and before exceptional items.
Wholesale funding marketThe market for lending and borrowing by large companies, financial institutions and sovereign entities.
GLOSSARY(continued)

