annual offshore statistics and regulatory activity report ... · also produce an annual health and...
TRANSCRIPT
1
ANNUAL OFFSHORE STATISTICS & REGULATORY ACTIVITY REPORT
2013/2014
Date of release: December 2014
2
Preface
HSE is responsible for regulating health & safety matters offshore. The Health and Safety at Work Act 1974 (HSWA), supported by the HSWA (Application outside Great Britain) Order 2013, defines HSE's jurisdiction. HSE works with other regulators under Memorandum of Understandings and agency agreements where there is a potential overlap of responsibilities.
The Department of Energy and Climate Change (DECC) license oil and gas exploration and extraction, taxation and decommissioning. DECC inspectors are responsible for regulating marine pollution and environmental protection.
The Civil Aviation Authority (CAA) CAA has responsibility for aircraft flight safety. HSE has responsibility to ensure that heli-decks on offshore installations are safe.
The Maritime and Coastguard Agency (MCA) MCA has primary responsibility for maritime safety.
This Annual Offshore Statistics & Regulatory Activity Report provides details of offshore accidents, dangerous occurrences and ill health reported to HSE under the Reporting of Injuries, Diseases and Dangerous Occurrences Regulations (RIDDOR) from 1 April 2013 to 31 March 2014 and HSE’s regulatory activity.
The statistical information includes incidents on: offshore installations offshore wells and activities in connection with them offshore pipelines, pipeline works and certain activities in
connection with pipeline works offshore wind farms certain diving operations
The statistical information does not include: incidents arising from marine activities that are not directly
connected with offshore operations (e.g. vessels or rigs in transit) air transport activities (including transport to, from or between
installations), except incidents involving helicopters whilst on an offshore installation
The regulatory activity information includes the number of: Safety cases assessed Installations inspected Investigations completed Notices issued Prosecution cases instituted by HSE in England and Wales, and the
Crown Office and Procurator Fiscal Service (COPFS) in Scotland
Information on air transport incidents can be found on the Civil Aviation Authority website at https://www.caa.co.uk/.
Oil & Gas UK, the leading representative body for the UK Offshore industry, also produce an annual health and safety report, found on their website at www.oilandgasuk.co.uk.
3
Executive Summary Headline statistics for 2013/14:
There was one fatality. In the last five years, there was a total of three fatalities
There were 37 Major/Specified injuries, a rate of 112 per 100,000 workers. Numbers and rates have fluctuated in the past five years, showing no overall trend
There were 112 over 7-day injuries, a rate of 339 per 100 000 workers
There were 393 dangerous occurrences, similar to the number last year
There were 115 hydrocarbon releases, a 20% increase on the previous year. The increase was in reported minor releases
The number of major and significant hydrocarbon releases dropped by around a fifth compared to the previous year
79 safety cases were assessed 161 installations were inspected 75 RIDDOR incidents were investigated 28 improvement notices and five prohibition notices were served There were no prosecution cases instituted. Three cases were
instituted in the past four years
4
CONTENTS
SECTION PAGE
Background
Industry profile 5
Analysis
All injuries 6
Fatalities 6
Major and Specified injuries 7
Over 3-day / Over 7-day injuries 8
Nature of injury 9
Part of body injured 10
Kind of accident 11
Work process 12
Dangerous occurrences (1) - Overall 13
Dangerous occurrences (2) - Hydrocarbon releases 14
Dangerous occurrences (3) – Wells 15
Dangerous occurrences (4) – Pipelines 15
Dangerous occurrences (5) – other incidents 16
Reportable diseases 16
Regulatory activity 17-19
Explanatory notes 20
5
Background
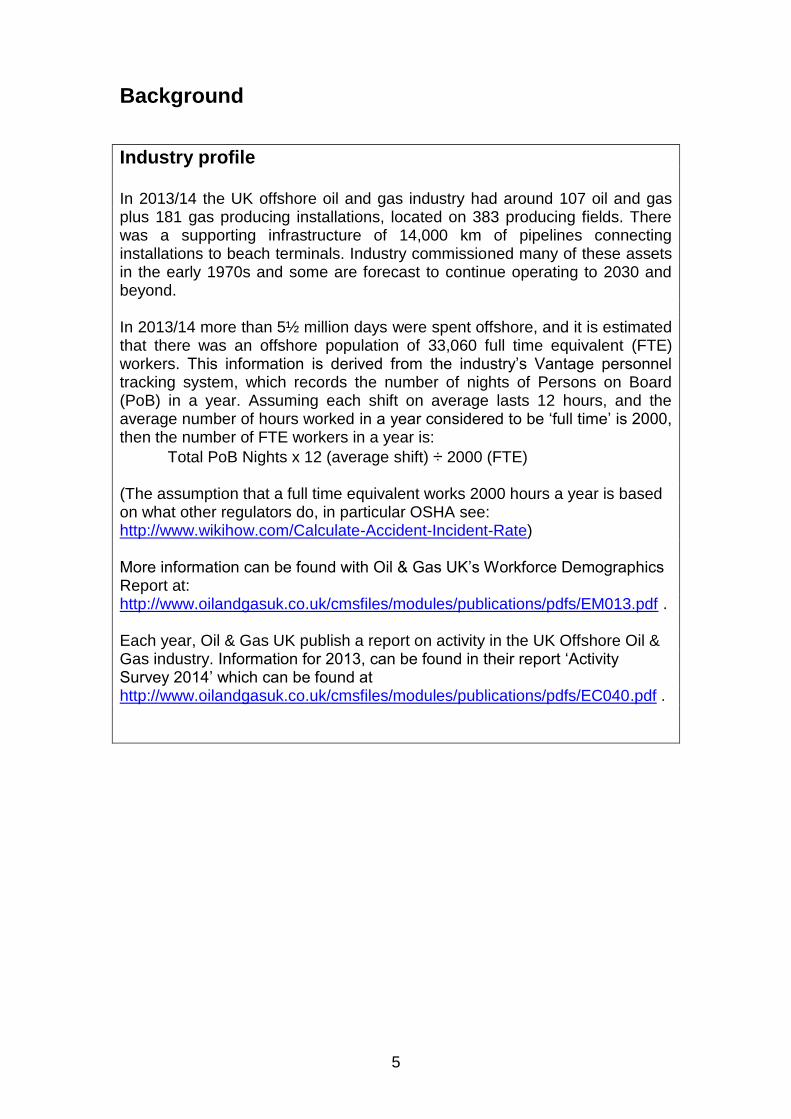
Industry profile In 2013/14 the UK offshore oil and gas industry had around 107 oil and gas plus 181 gas producing installations, located on 383 producing fields. There was a supporting infrastructure of 14,000 km of pipelines connecting installations to beach terminals. Industry commissioned many of these assets in the early 1970s and some are forecast to continue operating to 2030 and beyond. In 2013/14 more than 5½ million days were spent offshore, and it is estimated that there was an offshore population of 33,060 full time equivalent (FTE) workers. This information is derived from the industry’s Vantage personnel tracking system, which records the number of nights of Persons on Board (PoB) in a year. Assuming each shift on average lasts 12 hours, and the average number of hours worked in a year considered to be ‘full time’ is 2000, then the number of FTE workers in a year is:
Total PoB Nights x 12 (average shift) ÷ 2000 (FTE) (The assumption that a full time equivalent works 2000 hours a year is based on what other regulators do, in particular OSHA see: http://www.wikihow.com/Calculate-Accident-Incident-Rate) More information can be found with Oil & Gas UK’s Workforce Demographics Report at: http://www.oilandgasuk.co.uk/cmsfiles/modules/publications/pdfs/EM013.pdf . Each year, Oil & Gas UK publish a report on activity in the UK Offshore Oil & Gas industry. Information for 2013, can be found in their report ‘Activity Survey 2014’ which can be found at http://www.oilandgasuk.co.uk/cmsfiles/modules/publications/pdfs/EC040.pdf .
6
Analysis
All injuries
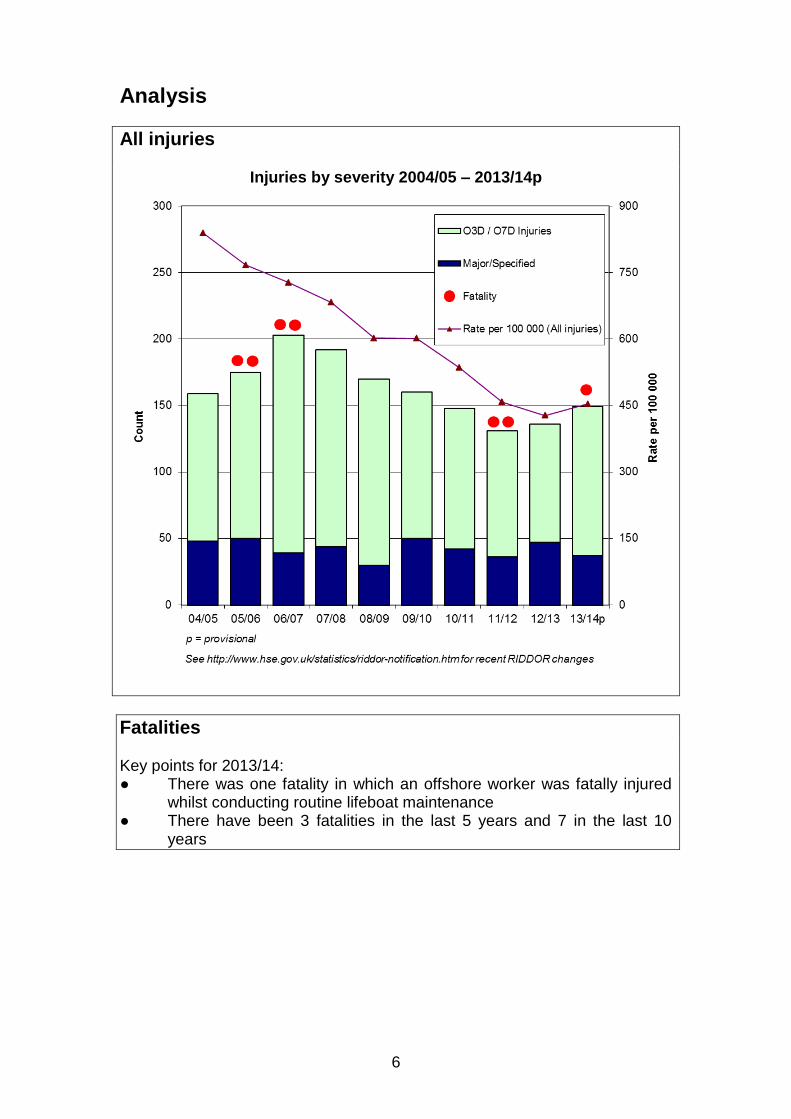
Injuries by severity 2004/05 – 2013/14p
Fatalities Key points for 2013/14: ● There was one fatality in which an offshore worker was fatally injured
whilst conducting routine lifeboat maintenance ● There have been 3 fatalities in the last 5 years and 7 in the last 10
years
7
Major/Specified injuries
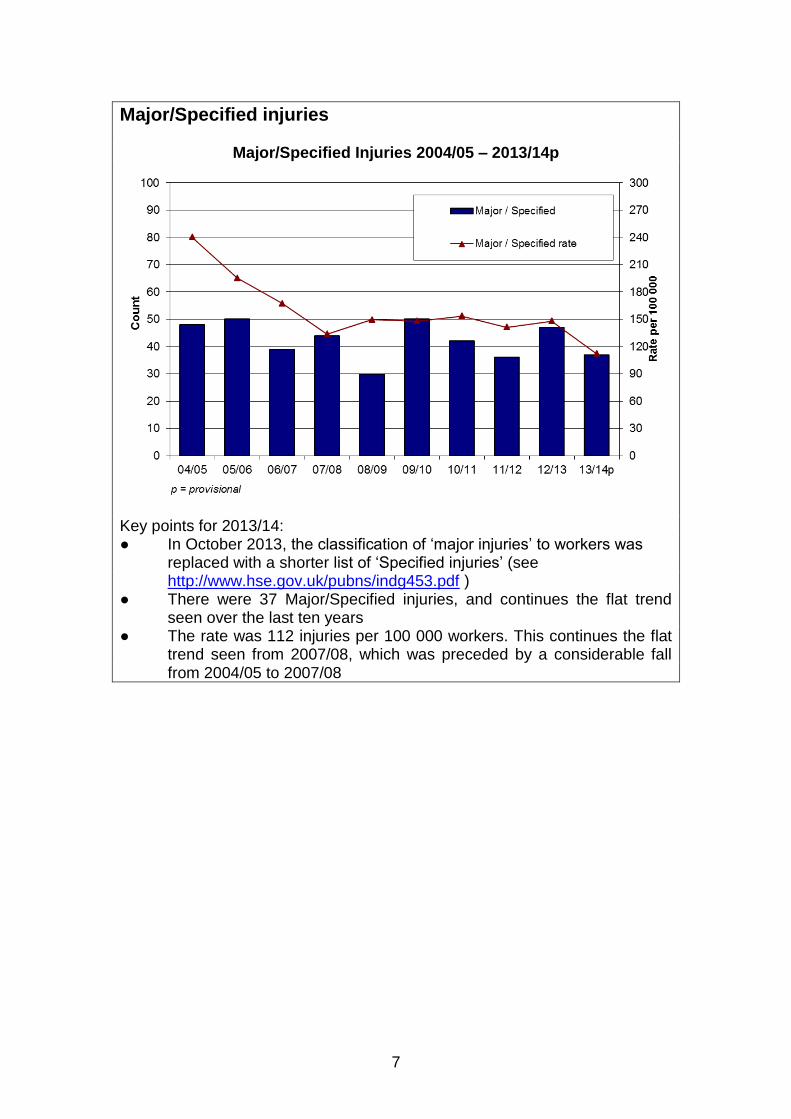
Major/Specified Injuries 2004/05 – 2013/14p
Key points for 2013/14: ● In October 2013, the classification of ‘major injuries’ to workers was
replaced with a shorter list of ‘Specified injuries’ (see http://www.hse.gov.uk/pubns/indg453.pdf )
● There were 37 Major/Specified injuries, and continues the flat trend seen over the last ten years
● The rate was 112 injuries per 100 000 workers. This continues the flat trend seen from 2007/08, which was preceded by a considerable fall from 2004/05 to 2007/08
8
Over 3-day (O3D) & Over 7-day (O7D) Injuries
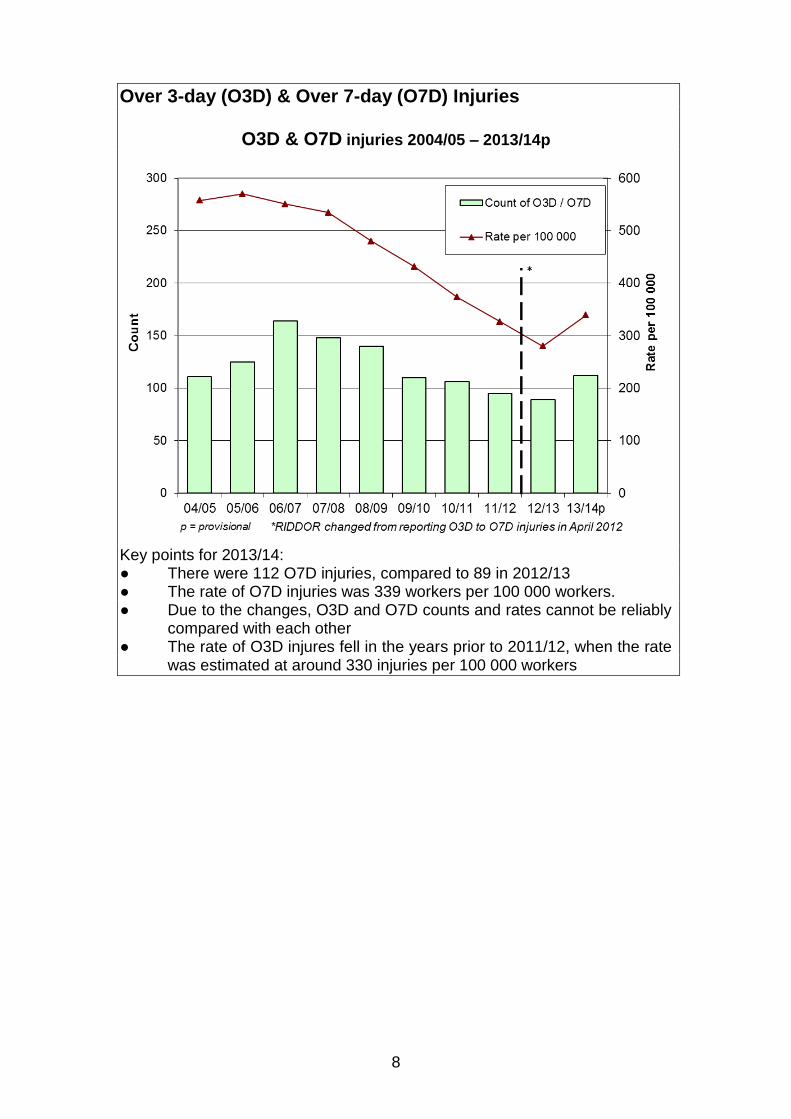
O3D & O7D injuries 2004/05 – 2013/14p
Key points for 2013/14: ● There were 112 O7D injuries, compared to 89 in 2012/13 ● The rate of O7D injuries was 339 workers per 100 000 workers. ● Due to the changes, O3D and O7D counts and rates cannot be reliably
compared with each other ● The rate of O3D injures fell in the years prior to 2011/12, when the rate
was estimated at around 330 injuries per 100 000 workers
9
Nature of injury
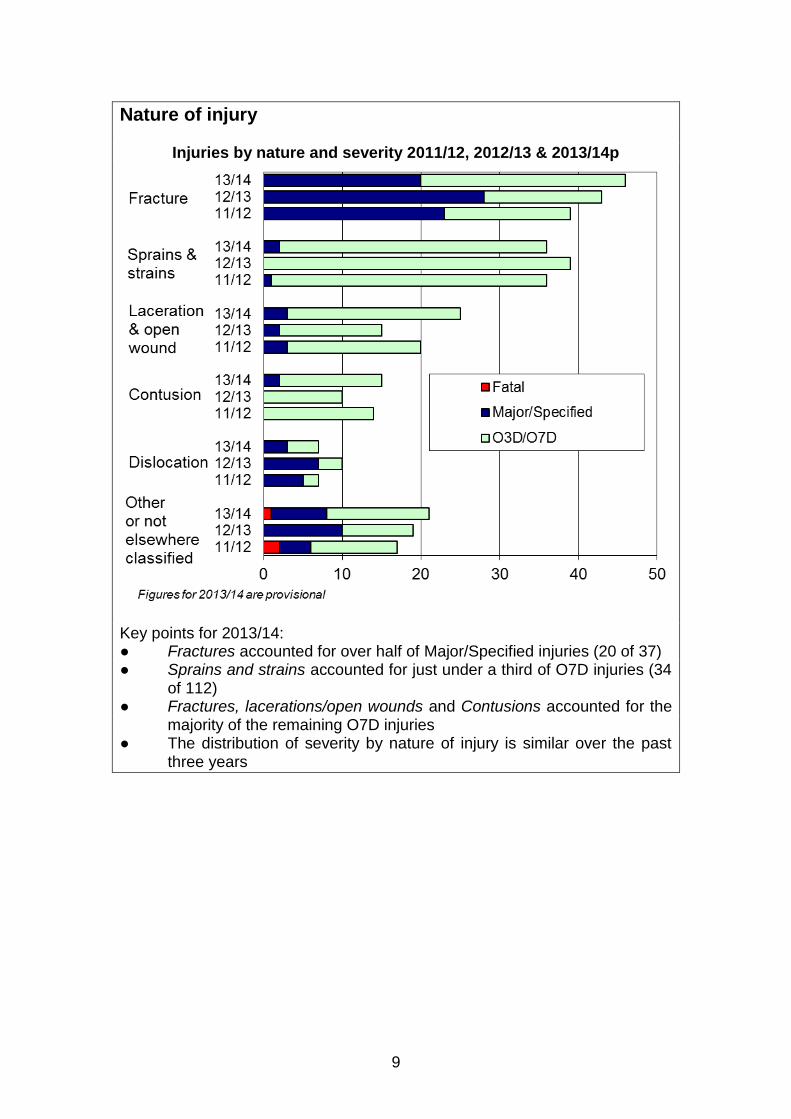
Injuries by nature and severity 2011/12, 2012/13 & 2013/14p
Key points for 2013/14: ● Fractures accounted for over half of Major/Specified injuries (20 of 37) ● Sprains and strains accounted for just under a third of O7D injuries (34
of 112) ● Fractures, lacerations/open wounds and Contusions accounted for the
majority of the remaining O7D injuries ● The distribution of severity by nature of injury is similar over the past
three years
10
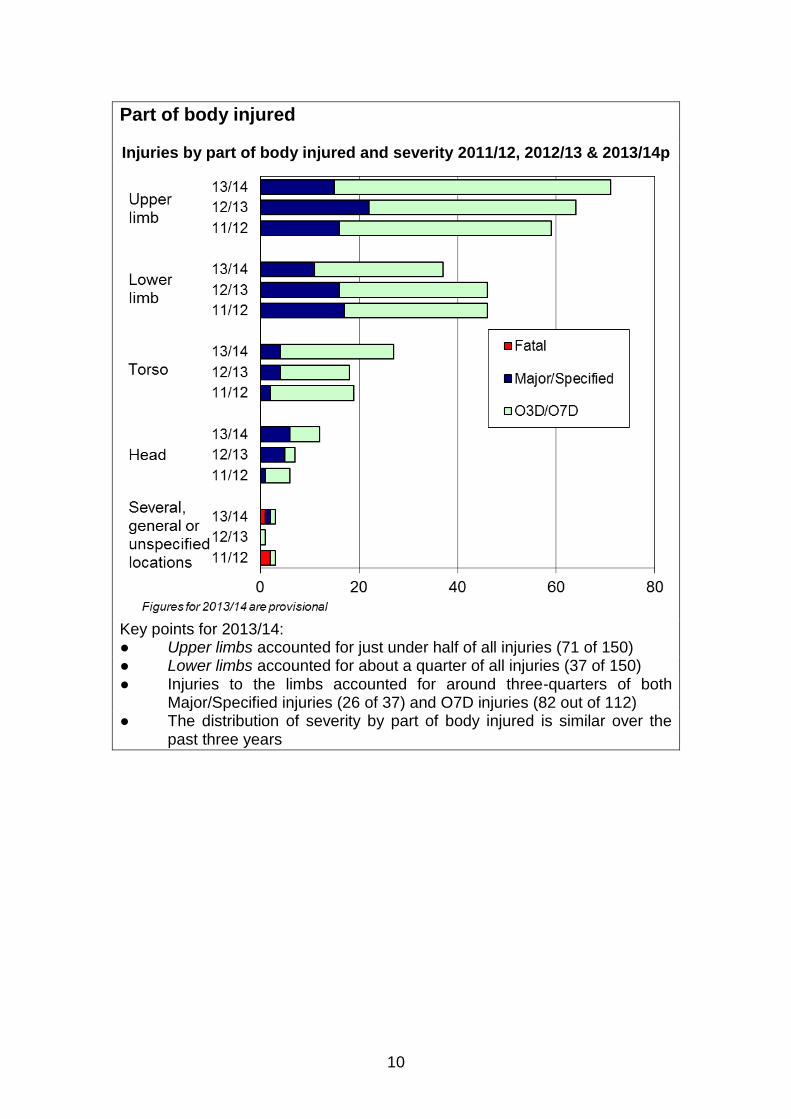
Part of body injured Injuries by part of body injured and severity 2011/12, 2012/13 & 2013/14p
Key points for 2013/14: ● Upper limbs accounted for just under half of all injuries (71 of 150) ● Lower limbs accounted for about a quarter of all injuries (37 of 150) ● Injuries to the limbs accounted for around three-quarters of both
Major/Specified injuries (26 of 37) and O7D injuries (82 out of 112) ● The distribution of severity by part of body injured is similar over the
past three years
11
Kind of accident
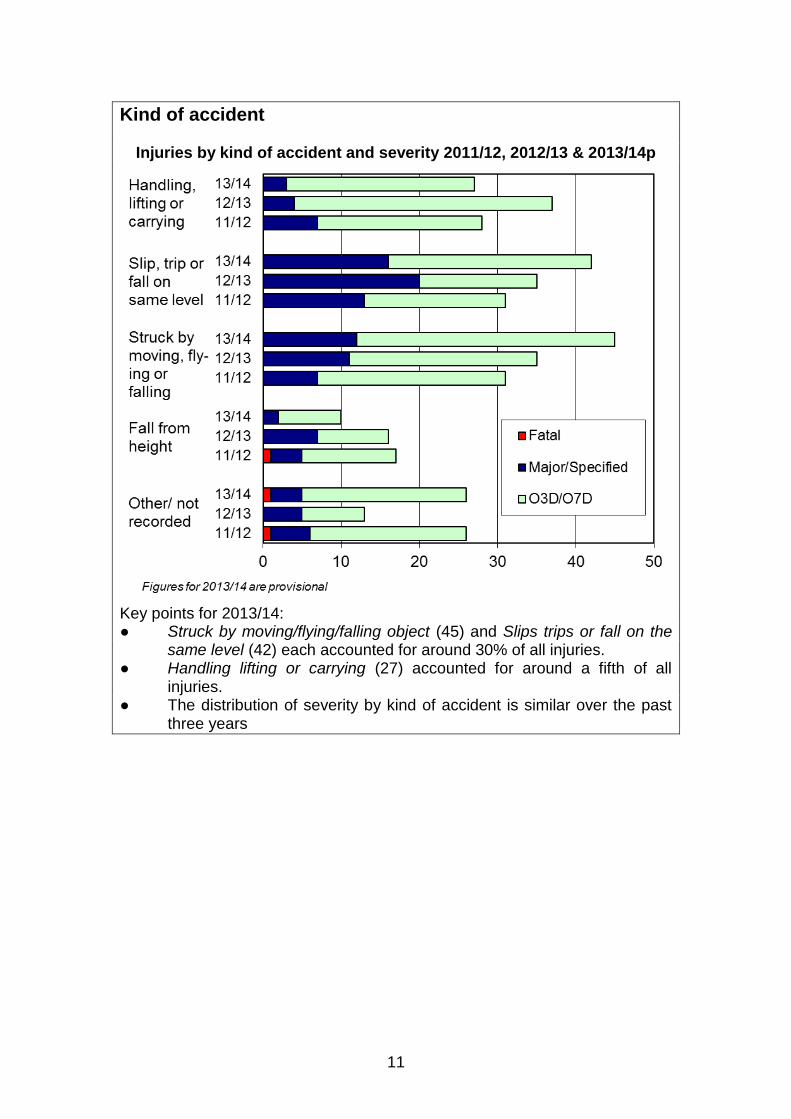
Injuries by kind of accident and severity 2011/12, 2012/13 & 2013/14p
Key points for 2013/14: ● Struck by moving/flying/falling object (45) and Slips trips or fall on the
same level (42) each accounted for around 30% of all injuries. ● Handling lifting or carrying (27) accounted for around a fifth of all
injuries. ● The distribution of severity by kind of accident is similar over the past
three years
12
Work process
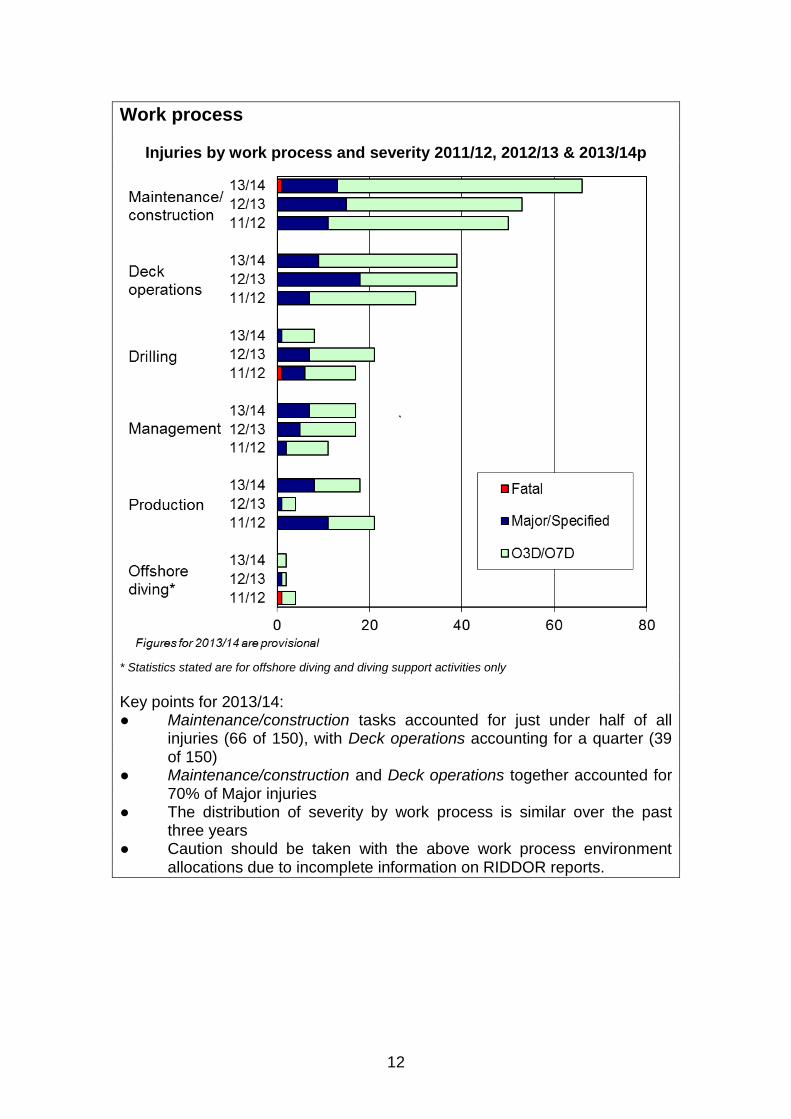
Injuries by work process and severity 2011/12, 2012/13 & 2013/14p
* Statistics stated are for offshore diving and diving support activities only
Key points for 2013/14: ● Maintenance/construction tasks accounted for just under half of all
injuries (66 of 150), with Deck operations accounting for a quarter (39 of 150)
● Maintenance/construction and Deck operations together accounted for 70% of Major injuries
● The distribution of severity by work process is similar over the past three years
● Caution should be taken with the above work process environment allocations due to incomplete information on RIDDOR reports.
13
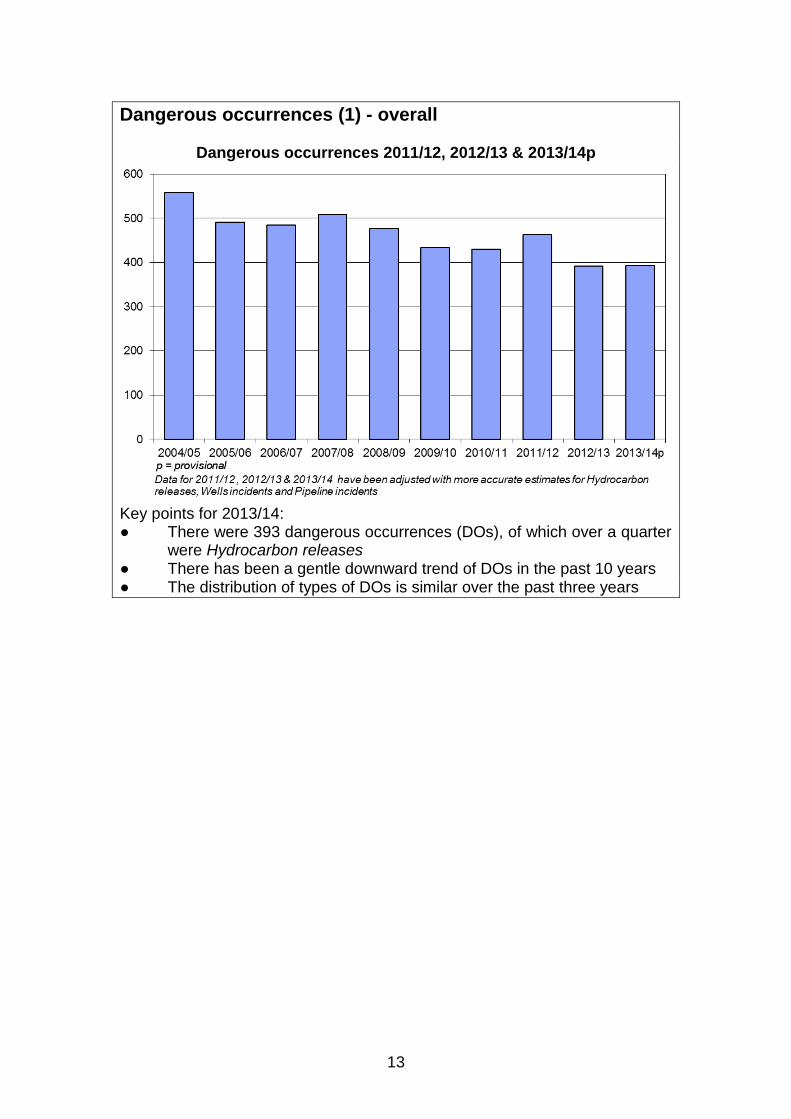
Dangerous occurrences (1) - overall
Dangerous occurrences 2011/12, 2012/13 & 2013/14p
Key points for 2013/14: ● There were 393 dangerous occurrences (DOs), of which over a quarter
were Hydrocarbon releases ● There has been a gentle downward trend of DOs in the past 10 years ● The distribution of types of DOs is similar over the past three years
14
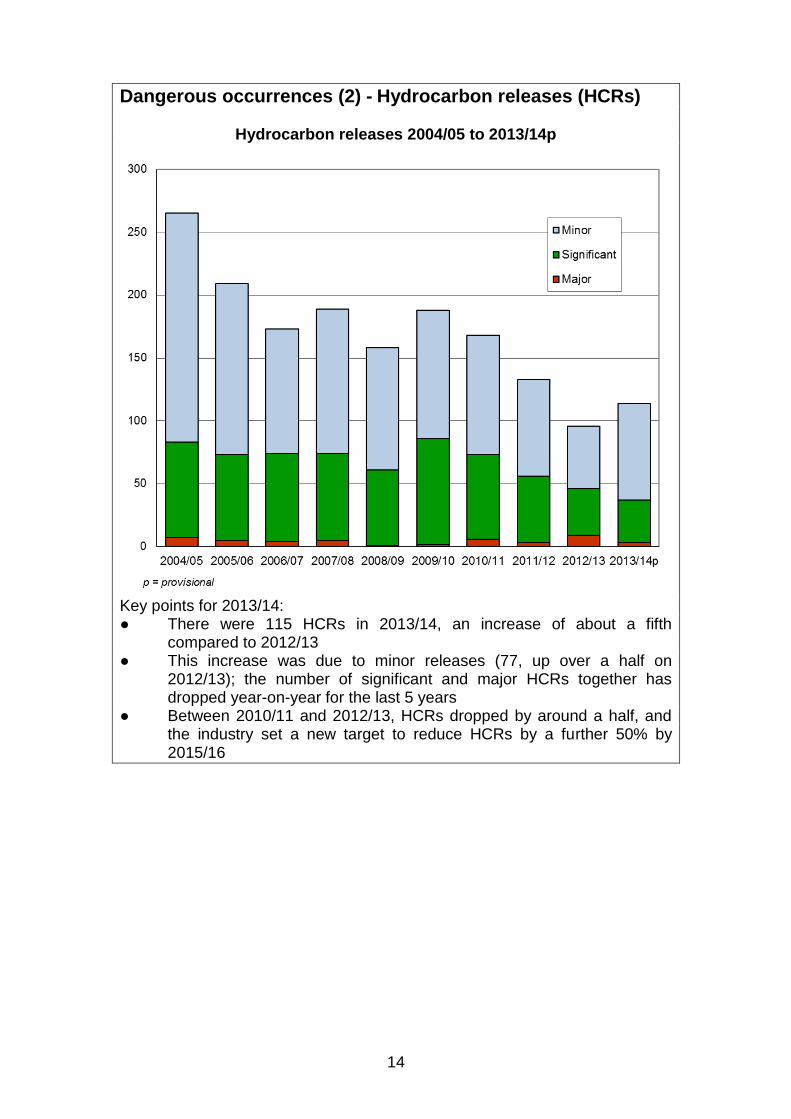
Dangerous occurrences (2) - Hydrocarbon releases (HCRs)
Hydrocarbon releases 2004/05 to 2013/14p
Key points for 2013/14: ● There were 115 HCRs in 2013/14, an increase of about a fifth
compared to 2012/13 ● This increase was due to minor releases (77, up over a half on
2012/13); the number of significant and major HCRs together has dropped year-on-year for the last 5 years
● Between 2010/11 and 2012/13, HCRs dropped by around a half, and the industry set a new target to reduce HCRs by a further 50% by 2015/16
15
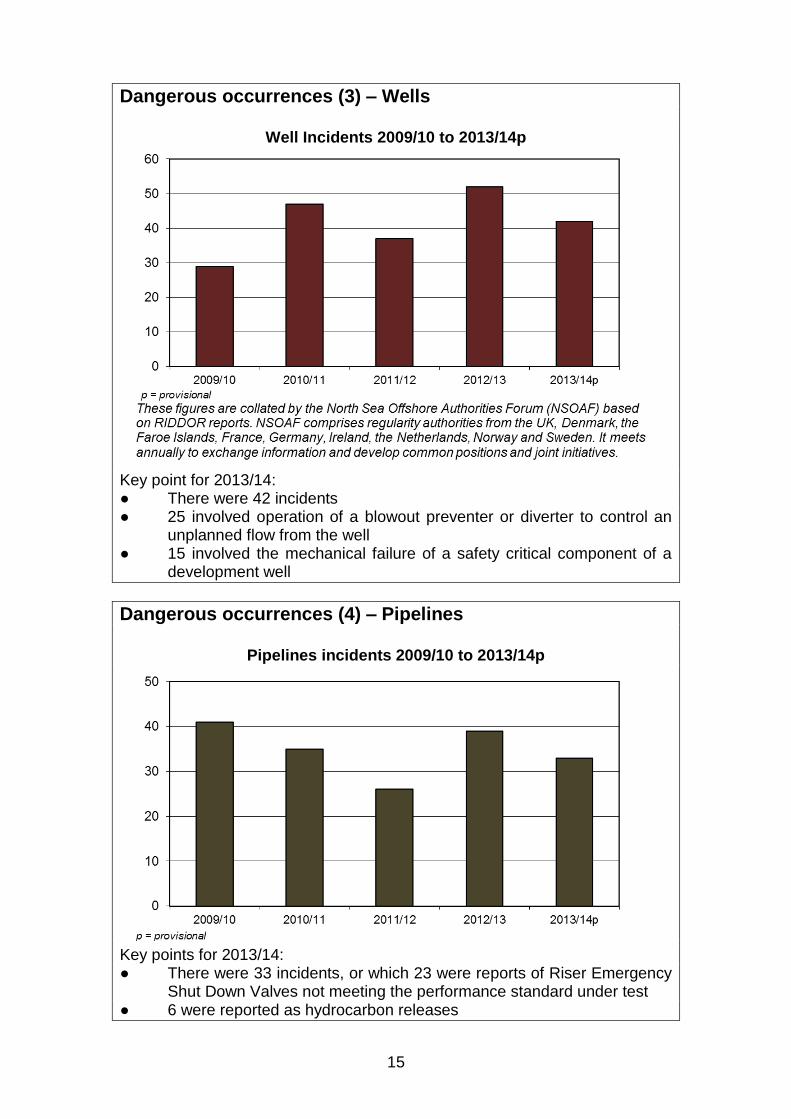
Dangerous occurrences (3) – Wells
Well Incidents 2009/10 to 2013/14p
Key point for 2013/14: ● There were 42 incidents ● 25 involved operation of a blowout preventer or diverter to control an
unplanned flow from the well ● 15 involved the mechanical failure of a safety critical component of a
development well
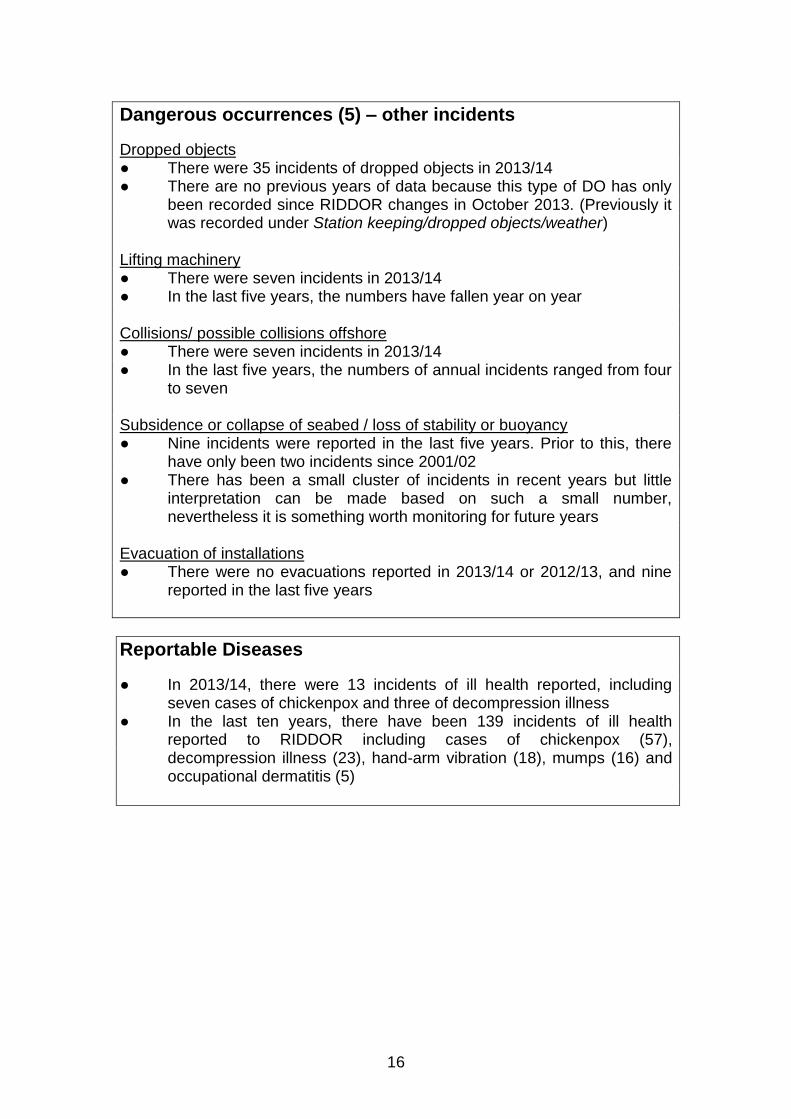
Dangerous occurrences (4) – Pipelines
Pipelines incidents 2009/10 to 2013/14p
Key points for 2013/14: ● There were 33 incidents, or which 23 were reports of Riser Emergency
Shut Down Valves not meeting the performance standard under test ● 6 were reported as hydrocarbon releases
16
Dangerous occurrences (5) – other incidents
Dropped objects ● There were 35 incidents of dropped objects in 2013/14 ● There are no previous years of data because this type of DO has only
been recorded since RIDDOR changes in October 2013. (Previously it was recorded under Station keeping/dropped objects/weather)
Lifting machinery ● There were seven incidents in 2013/14 ● In the last five years, the numbers have fallen year on year Collisions/ possible collisions offshore ● There were seven incidents in 2013/14 ● In the last five years, the numbers of annual incidents ranged from four
to seven Subsidence or collapse of seabed / loss of stability or buoyancy ● Nine incidents were reported in the last five years. Prior to this, there
have only been two incidents since 2001/02 ● There has been a small cluster of incidents in recent years but little
interpretation can be made based on such a small number, nevertheless it is something worth monitoring for future years
Evacuation of installations ● There were no evacuations reported in 2013/14 or 2012/13, and nine
reported in the last five years
Reportable Diseases
● In 2013/14, there were 13 incidents of ill health reported, including seven cases of chickenpox and three of decompression illness
● In the last ten years, there have been 139 incidents of ill health reported to RIDDOR including cases of chickenpox (57), decompression illness (23), hand-arm vibration (18), mumps (16) and occupational dermatitis (5)

17
Regulatory Activity HSE's regulatory programme for the offshore industry seeks to ensure major hazard and personal risks are properly managed in compliance with legislative requirements. Where appropriate, HSE will take formal enforcement action to prevent harm and secure justice in line with its Enforcement Policy. Key regulatory activities are:
Assessing safety cases
Inspecting installations
Investigating incidents
Formal enforcement action such as issuing Notices and prosecution in serious cases
More information can be found in the HSE Business Plan 2012/15 which can be found at http://www.hse.gov.uk/aboutus/strategiesandplans/businessplans/updated-april14-businessplan12-15.pdf . Below are extracts covering the offshore sector.
Assessment
Number of safety cases assessed 2011/12 to 2013/14p
18
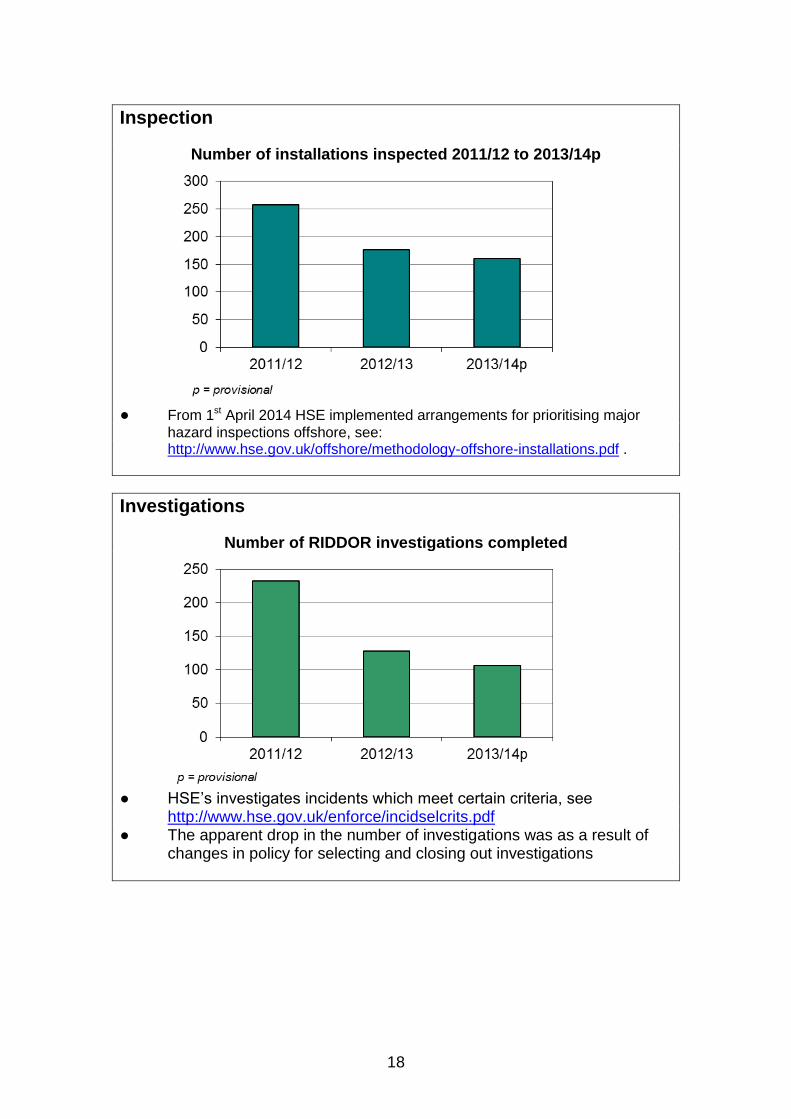
Inspection
Number of installations inspected 2011/12 to 2013/14p
● From 1st April 2014 HSE implemented arrangements for prioritising major
hazard inspections offshore, see: http://www.hse.gov.uk/offshore/methodology-offshore-installations.pdf .
Investigations
Number of RIDDOR investigations completed
● HSE’s investigates incidents which meet certain criteria, see
http://www.hse.gov.uk/enforce/incidselcrits.pdf ● The apparent drop in the number of investigations was as a result of
changes in policy for selecting and closing out investigations
19
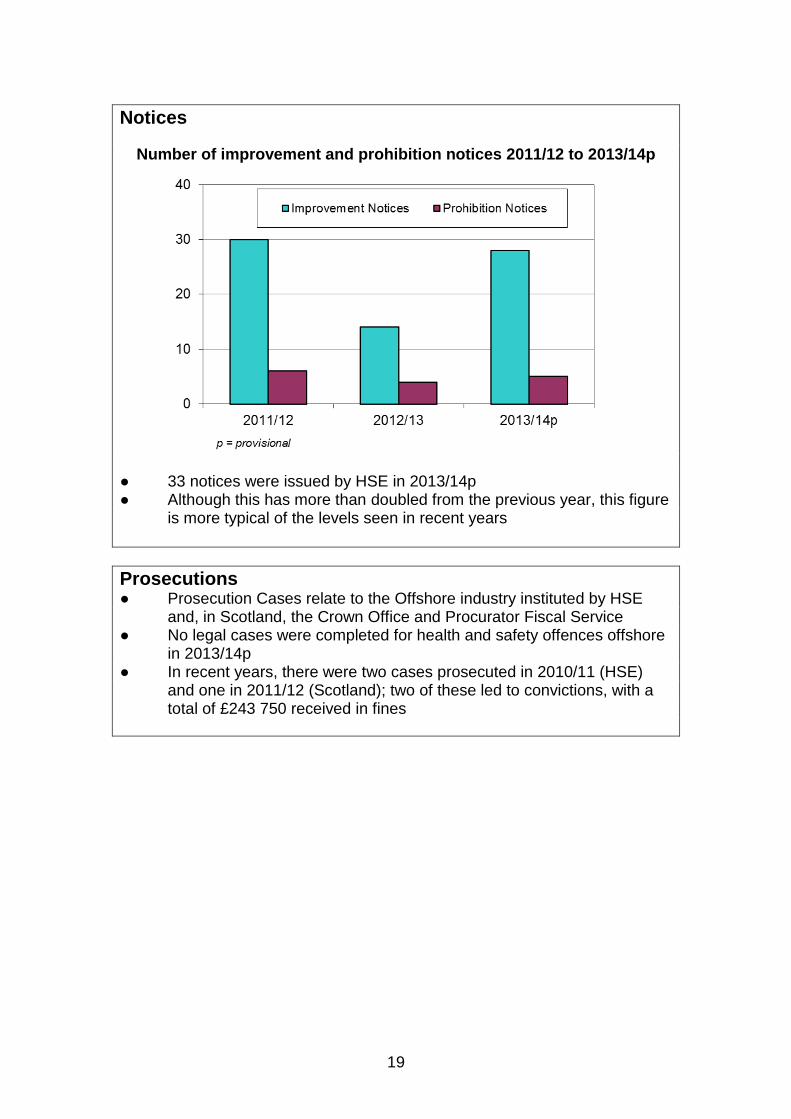
Notices
Number of improvement and prohibition notices 2011/12 to 2013/14p
● 33 notices were issued by HSE in 2013/14p ● Although this has more than doubled from the previous year, this figure
is more typical of the levels seen in recent years
Prosecutions ● Prosecution Cases relate to the Offshore industry instituted by HSE
and, in Scotland, the Crown Office and Procurator Fiscal Service ● No legal cases were completed for health and safety offences offshore
in 2013/14p ● In recent years, there were two cases prosecuted in 2010/11 (HSE)
and one in 2011/12 (Scotland); two of these led to convictions, with a total of £243 750 received in fines
20
Explanatory notes Reporting of Injuries, Diseases and Dangerous Occurrences Regulations (RIDDOR)
RIDDOR places a legal duty on employers and other specified duty holders to report certain workplace incidents to the relevant enforcing authority; further details can be found at http://www.hse.gov.uk/statistics/sources.htm#riddor. Recent changes (including the change from reporting Over 3-day to Over 7-day injures, and from Major to Specified injures) are explained at http://www.hse.gov.uk/statistics/riddor-notification.htm. Injury rates
Injury rates are calculated using offshore population data from the industry’s Vantage personnel tracking system. However, these rates cannot be used to compare Offshore directly with other industries as they use a different denominator (e.g. HSE uses the Annual Population Survey (APS), which is based on the Labour Force Survey (LFS)). Hydrocarbon releases
Hydrocarbon releases (HCRs) are classified as ‘Minor’, ‘Significant’, or ‘Major’ based on severity classification definitions agreed with the offshore industry. Severity Classification guidance for Major, Significant and Minor HCRs can be found on the HSE website at https://www.hse.gov.uk/hcr3/help/help_public.asp.
In these statistics, RIDDOR reportable HCRs include:
unintended releases of petroleum gas or liquids from an offshore installation that either result in fire or explosion or require action to prevent or limit the consequences of a potential fire or explosion if ignited, or which have the potential to cause death or major/specified injury. These are often referred to as ‘process’ HCRs
the unintentional or uncontrolled release or escape of other hydrocarbons (e.g. heli-fuel) from an offshore installation which could cause a significant risk of personal injury. These are often referred to as ‘non-process’ HCRs
HCRs from wells
HCRs from pipelines within 500m of the installation Prosecutions
In Scotland HSE and local authorities investigate potential offences but cannot institute legal proceedings. HSE and local authorities send a report to the Crown Office and Procurator Fiscal Service (COPFS). COPFS makes the final decision whether to institute legal proceedings and which offences are taken. For more information please see www.hse.gov.uk/statistics/sources.htm#enforcement.
Energy Division, Health and Safety Executive Tel: 0115 937 7552 e-mail: [email protected]