annual health care cost trends report ctr 2016 · 2 | 2016 cost trends report index of exhibits...
TRANSCRIPT
CTR2016
Annual Health Care Cost Trends Report
February 2017

CTR2016
Annual Health Care Cost Trends Report

2016 Cost Trends Report | 1
2 Index of Exhibits
4 Index of Acronyms
Section I: Introduction
6 Executive Summary
11 1: Introduction
Section II: Trends in Spending and Care Delivery
13 2: Overview of Trends in Spending and Care Delivery
23 3: The Massachusetts Provider Market: Status And Trends
33 4: Prescription Drug Spending
41 Future Outlook
Section III: Care Delivery Performance: Opportunities to Improve Quality and Efficiency
42 5: Hospital Utilization
51 6: Post-Acute Care
55 7: Variation in Spending by Primary Care Provider Group
Section IV: Progress in aligning incentives for efficient and high quality care
60 8: Alternative Payment Methods
66 9: Demand-Side Incentives
Section V: Recommendations and Dashboard
72 10: Policy Recommendations
80 List of Technical Appendices
81 Acknowledgements
COST TRENDS REPORT 2016

2 | 2016 Cost Trends Report
INDEX OF EXHIBITS
Introduction Exhibit 1.1: Approximate combined health insurance premium and out-of-pocket spending relative to income for a family of three 11
Overview of Trends in Spending and Care DeliveryExhibit 2.1: Annual growth in per capita health care spending, MA and the U.S., 2002-2015 14Exhibit 2.2: Annual growth in health insurance premium spending per enrollee, MA and the U.S., 2005-2015 14Exhibit 2.3: Annual growth in commercial spending per enrollee, by spending category, 2010-2015 15Exhibit 2.4: Growth in per person spending for major public coverage programs in Massachusetts, 2013-2015 16Exhibit 2.5: Original Medicare (FFS) spending per beneficiary in Massachusetts and in the U.S., by category, 2015 16Exhibit 2.6: Share of MassHealth LTSS spending on institutional care and community-based care, MA and the U.S., 2001-2014 18Exhibit 2.7: Average annual family premiums and employee contributions, by wage quartile of employer in Massachusetts, 2015 19Exhibit 2.8: Annual out-of-pocket spending for Massachusetts residents in the lowest and highest income areas in the state, 2014 19Exhibit 2.9: Massachusetts hospitals performance on each component of CMS’ Hospital 5 Star Ratings, 2015 20Exhibit 2.10: Distribution of beds, by nursing facility quality and median zip code income, 2016 21Exhibit 2.11: Percentage of nursing facility beds in four or five star quality facilities, by HPC region, 2016 21
The Massachusetts Provider Market: Status And TrendsExhibit 3.1: Primary care physician primary sites of practice reported to the RPO program, 2015 23Exhibit 3.2: Summary data on the largest Massachusetts provider organizations, 2015 24Exhibit 3.3: Physician employment status among Massachusetts’ largest provider systems, 2015 25Exhibit 3.4: Frequency of providers involved in Material Change Notices consisting of corporate or contracting affiliations, 2013-2016 26Exhibit 3.5: Frequency of provider alignment types for which the HPC received Material Change Notices, 2013-2016 26Exhibit 3.6: Inpatient discharges from the top five networks, 2015 27Exhibit 3.7: Inpatient relative price for one major commercial payer compared to inpatient net patient service revenue per case-mix-adjusted discharge across all payers, 2014 28Exhibit 3.8: Hospital inpatient relative prices in Medicaid Managed Care Organization networks, 2014 29Exhibit 3.9: Number of retail clinics and urgent care centers in Massachusetts, 2008-2016 31
Prescription Drug SpendingExhibit 4.1: Growth in commercial spending categories and proportion of total medical expenses, 2013-2015 33Exhibit 4.2: Flow of payments and prescription medications 34Exhibit 4.3: Prescription drug growth, with and without rebates, 2014-2015 34Exhibit 4.4: Year to year changes in pharmaceutical spending by category (in billions of US$) 35Exhibit 4.5: Average spending and cost sharing for branded and generic drugs, per claim and per member year, 2012-2014 36Exhibit 4.6: Distribution of cost sharing, per claim, 2012-2014 36

2016 Cost Trends Report | 3
Exhibit 4.7: Spending and cost sharing by gender, per claim and per member per year, 2012-2014 37Exhibit 4.8: Average spending and cost sharing, per claim, on Mylan’s EpiPen epinephrine injector in Massachusetts, 2012-2014 38
Hospital UtilizationExhibit 5.1: Hospital use in Massachusetts and the U.S., 2010-2014 42Exhibit 5.2: ED visits per 1,000 population, by type, 2011-2015 43Exhibit 5.3: Median length of stay in the ED, 2015 44Exhibit 5.4: Percent of patients with an ED length of stay of 12 hours or more, 2011-2015 44Exhibit 5.5: Rate of opioid-related ED visits per 100,000 population, by state, 2014 45Exhibit 5.6: Inpatient discharges per 1,000 population, by age category, 2011-2015 46Exhibit 5.7: Thirty-day readmission rates, Massachusetts and the U.S., 2011-2015 47Exhibit 5.8: Share of community appropriate discharges, by hospital type, 2011-2015 49Exhibit 5.9: Discharges at Lahey and Winchester hospitals, by type of discharge, 2012- 2015 49
Post-Acute CareExhibit 6.1: PAC discharges, all DRGs, all payers, 2013 51Exhibit 6.2: Adjusted percentage of discharges to post-acute care, all DRGs, 2010-2015 52Exhibit 6.3: Original Medicare adjusted spending per beneficiary on PAC by setting, 2014 52Exhibit 6.4: PAC discharge destination following joint replacement among Original Medicare patients, 2013 53
Variation in Spending by Primary Care Provider GroupExhibit 7.1: HSA TME, by PCP group, 2012-2015 56Exhibit 7.2: Annual HSA TME growth rate by PCP group, 2012-2015 56Exhibit 7.3: APM uptake and HSA TME growth in the next year, by PCP group, 2013-2015 57Exhibit 7.4: Indexed rates of non-recommended care, by provider group, 2013 58Exhibit 7.5: Rates of non-recommended care for two selected measures, by HPC region, 2013-2014 59
Alternative Payment MethodsExhibit 8.1: Proportion of member months under alternative payment methods (APMs) by insurance category, 2013-2015 61
Demand-Side IncentivesExhibit 9.1: Adjusted premiums by market segment, fully-insured market, 2013-2015 67Exhibit 9.2: Broker fees, per member per month, by group size 68Exhibit 9.3: Plan offerings by firm size in Massachusetts, 2014 69Exhibit 9.4: Full premium costs in Massachusetts compared to other states in the Massachusetts Health Connector (top) and in the small employer-group market (bottom) 70
Policy RecommendationsExhibit 10.1: Dashboard of HPC system performance metrics 78
4 | 2016 Cost Trends Report
INDEX OF ACRONYMS
ACA Affordable Care ActACO Accountable Care Organizations
ADL Activities of Daily Living
AGO Attorney General’s Office
AHRQ Agency for Healthcare Research and Quality
AMC Academic Medical Centers
APCD All-Payer Claims Database
APM Alternative Payment Methods
BCBS Blue Cross Blue Shield
BCPI Bundled Payments for Care Improvement Initiative
BH Behavioral Health
BID Beth Israel Deaconess
BIDCO Beth Israel Deaconess Care Organization
BMC Boston Medical Center
CAUTIs Catheter-associated urinary tract infection
CCT Complex Care Team
CHART Community Hospital Acceleration, Revitalization, and Transformation Investment Program
CHF Congestive Heart Failure
CHIA Center for Health Information and Analysis
CLABSI Central line-associated bloodstream infection
CMIR Cost and Market Impact Reviews
CMS Center for Medicare and Medicaid Services
COPD Chronic Obstructive Pulmonary Disease
CP Community Partners
CPC Comprehensive Primary Care
DSRIP Delivery System Reform Incentive Program
DSTI Delivery System Transformation Initiatives
ED Emergency Department
EHR Electronic Health Record
EHS Health and Human Services
EMR Electronic Medical Record
FFS Fee-For-Service
GE General Electric
GIC Group Insurance Commission
HCV Hepatitis C Virus
HEDIS Healthcare Effectiveness Data and Information Set
HMFP Harvard Medical Faculty Physicians
HMO Health Maintenance Organization
HNE Health New England

2016 Cost Trends Report | 5
HPC Health Policy Commission
HPHC Harvard Pilgrim Health Care
HSA Health Status-Adjusted
IMPACT Improving Medicare Post-Acute Care Transformation
IRF Inpatient Rehabilitation Facility
IVC Inferior Vena Cava
KFF Kaiser Family Foundation
LTCH Long-Term Care Hospital
LTSS Long-Term Services and Supports
MACIPA Mount Auburn Cambridge Independent Practice Association
MACRA Medicare Access and CHIP Reauthorization Act
MCN Notice of Material Change
MCO Managed Care Organization
MedPAC Medicare Payment Advisory Commission
MGH Massachusetts General Hospital
MIPS Merit-Based Incentive Payment System
MRSA Methicillin-resistant staphylococcus aureus
MSSP Medicare Shared Savings Program
NASHP National Academy for State Health Policy
NCPHI Net Cost of Private Health Insurance
NEQCA New England Quality Care Alliance
NHE National Health Expenditure
PAC Post-Acute Care
PBM Pharmacy Benefit Management
PCA Personal Care Attendants
PCC Primary Care Clinician
PCP Primary Care Physician
PCPRI Primary Care Payment Reform Initiative
PMPM Per Member Per Month
PMPY Per Member Per Year
POS Point Of Service
PPO Preferred Provider Organization
PQRS Physician Quality Reporting System
RPO Registration of Provider Organizations
SNF Skilled Nursing Facility
SUD Substance Use Disorder
THCE Total Health Care Expenditures
THP Tufts Health Plan
TME Total Medical Expenditures

6 | 2016 Cost Trends Report
EXECUTIVE SUMMARYSection I: Introduction
Consistent with the statutory mandate of the Massachusetts Health Policy Commission (HPC), the 2016 Cost Trends Report presents an overview of health care spending and delivery trends in Massachusetts, evaluates progress in key areas, and makes recommendations for strategies to increase quality and efficiency in the Commonwealth.
HPC reports have identified four areas of opportunity: foster-ing a value-based market; promoting an efficient, high-quality healthcare delivery system; advancing aligned and effective financial incentives; and enhancing data and measurement for transparency and accountability.
The HPC continues to emphasize these opportunities in its analysis, recommendations, and strategic priorities.
This Executive Summary presents a concise overview of the findings and recommendations detailed in this report.
FINDINGS
TRENDS IN SPENDING AND THE DELIVERY SYSTEMTrends in spending
� Massachusetts exceeded the benchmark in 2015 for the second year in a row, with growth in total health care expenditures (THCE) of 4.1 percent, similar to growth from 2013 to 2014 (4.2 percent).
� Contributors to growth exceeding the benchmark in-cluded prescription drug spending across all sectors (accounting for roughly a third of per capita spending growth for the second year in a row), hospital spend-ing, enrollment changes, and spending on long-term services and supports.
� Even with several years of commercial and Medicare growth rates below national trends, Massachusetts con-tinues to be a high cost health care state. Massachusetts
commercial health care spending is roughly 6-9 percent higher than the national average, with premium costs among the highest in the nation.
� These costs disproportionately impact low-to-middle income residents and result in persistent health care af-fordability concerns for individuals, families, employers, and government in Massachusetts.
� Massachusetts’ level of household health care spend-ing relative to average statewide household income is comparable to national standards, but low and middle income households bear a very high bur-den of spending, as premiums and out-of-pocket spending do not vary significantly by income. The roughly $20,000 premium and cost sharing total for family coverage amounts to 30 percent of household income for family of three living at three times the federal poverty level.
� Recent information suggests rising premium costs in 2016 and beyond. After 12 quarters of growth below 4 percent, the Division of Insurance (DOI) reported base rate increases in the small group and individual markets in Massachusetts of between 5.4 and 8.3 percent from the end of 2015 through the first quarter of 2017.
� Hospital care accounts for a substantial share of total health care spending – and the rate of growth in hos-pital spending is increasing. Spending in this category accounted for 41 percent of total commercial spending growth in 2015, up from 18 percent in 2014.
Trends in provider markets � Analysis of the Registration of Provider Organizations
(RPO) dataset, a first-in-the-nation initiative, shows key features of the eight largest provider systems in the Commonwealth (representing about 85 percent of physicians practicing in Massachusetts), including

2016 Cost Trends Report | 7
Executive Summary ES
practices regarding direct employment of physicians, geographic reach, and organizational structure and corporate complexity.
� The majority of care in the Commonwealth is now provided by a relatively small number of large provider systems. In 2015, the five largest health systems in the state accounted for 59.9 percent of hospital discharges for commercially insured patients, an increase from 54.6 percent in 2012.
� The number of new urgent care centers entering the market in Massachusetts has grown significantly in recent years, from 8 in 2010 to 90 in 2016.
Prescription drugs � While moderating somewhat in 2015, prescription
drug spending continues to grow more rapidly than any other commercial category of service. Continued growth is projected.
� Drug spending has grown faster than overall commer-cial trends in the past three years and now accounts for more than 20 percent of commercial spending in Massachusetts when including medical drugs.
� Generic drugs represent an increasing share of the drug claims prescribed in Massachusetts (82 percent in 2012 to 84 percent in 2014), yet account for a decreasing proportion of the drug spending in the state (30 percent to 27 percent from 2012 to 2014).
� While total commercial drug spending has grown significantly in Massachusetts from 2012 to 2014, out-of-pocket spending decreased 9 percent, from $219 to $198 per member per year.
� A key factor in lower out-of-pocket spending on pre-scription drugs has been the Affordable Care Act’s (ACA) mandate of zero cost sharing for certain preven-tative drugs, including contraception. The percentage of prescription drug claims with no cost sharing among women increased dramatically between 2012 and 2014, from 3.2 percent to 13.4 percent.
� Commercial spending on Mylan’s EpiPen in Massachu-setts jumped over $100 per claim in two years, from $244 in 2012 to $362 in 2014.
� Transparency on pricing trends, rebates, discounts, and pharmaceutical benefit managers is lacking.
CARE DELIVERY PERFORMANCE: OPPORTUNITIES TO IMPROVE QUALITY AND EFFICIENCYHospital utilization
� Hospital use declined in Massachusetts from 2010 to 2014; emergency department (ED) and hospital outpatient visits declined by 2 percent, and inpatient discharges declined by 11 percent. However, Massa-chusetts continues to use hospitals at a higher rate than national averages. Compared to the U.S., in 2014 Massachusetts hospital utilization rates were 50 per-cent higher for hospital outpatient visits, 10 percent higher for ED visits, and 8 percent higher for inpatient discharges.
� While hospital use has steadily declined in Massachusetts in recent years, in 2015 inpatient discharges increased by almost 2 percent. This growth was entirely due to increases in discharges by patients ages 65 and older.
� Massachusetts did not make progress in reaching the HPC target of a 20 percent reduction in all-cause, all-payer 30-day hospital readmissions relative to the 2013 level. The statewide all-payer readmission rate re-mained unchanged from 2013 to 2014 at 15.3 percent and increased to 15.8 percent in 2015.
� Inpatient care that could safely and effectively be pro-vided in community hospitals is increasingly being provided by teaching hospitals. However, the trend is not universal. For example, at Winchester Hospital, following acquisition by the Lahey Health System in 2014, the volume of community appropriate discharg-es increased while community appropriate discharges decreased at Lahey Hospital and Medical Center, the system’s anchor teaching hospital.
� Despite declines in overall ED utilization, the share of visits considered avoidable has remained relatively unchanged since 2011 (42 percent of all visits).
� The number of behavioral health-related ED (includ-ing opioid-related ED use) visits per Massachusetts resident has grown steadily, increasing 13 percent from 2011 to 2015.
� ED “boarding” disproportionately impacts behav-ioral health patients and rates of behavioral-health related ED “boarding” are increasing. In 2015 al-most a quarter of all ED patients with a primary behavioral health-related condition had a length of
8 | 2016 Cost Trends Report
Section I: IntroductionI
stay in the ED of more than 12 hours, compared to only 1 percent of patients without a primary behavioral health-related condition.
Post-Acute Care � Massachusetts continues to discharge patients to insti-
tutional post-acute care (PAC) settings (SNFs, IRFs, LTCHs) at a higher rate than the U.S. average, with 21.8 percent of patients in Massachusetts discharged to institutional care in 2013 compared to 17.1 percent in the U.S. overall.
� Adjusting for changes in patient acuity, institutional discharges remained relatively constant between 2010 and 2015, while discharges to home health increased somewhat over the same period.
� Rates of discharge to PAC following joint replacements have declined substantially in Massachusetts, but remain far higher than in the U.S. overall. In 2013, just 3.5 percent of Medicare joint replacements were discharged to home compared to 20.4 percent nationally.
Primary care provider group spending � Total medical expenses (TME) per patient for the
10 largest provider groups have generally converged between 2012 and 2015, with the exception of Part-ners which has remained high at 7 percent above the next-highest group.
� Across all groups, health status adjusted TME grew 0.4 percent annually between 2012 and 2015, while unadjusted TME grew 3.5 percent annually, as mem-bers were reported to be roughly 3 percent sicker each year on average.
� Higher adoption of APMs is associated with lower TME growth in the subsequent year(s). Those with lower rates of APM adoption in 2013 had spending growth more than double groups with higher rates of APM adoption.
� Rates of non-recommended care, defined as services the medical community agrees provide few benefits to patients, vary in Massachusetts by provider group and by geographic region.
PROGRESS IN ALIGNING INCENTIVES FOR EFFICIENT AND HIGH QUALITY CAREAlternative payment methods (APMs)
� Progress stalled in 2015 among both commercial and public payers in expanding use of APMs. However, there are several potentially promising developments for 2016 and beyond:
� Expansion of APMs into commercial preferred pro-vider organization (PPO) products, with the three largest commercial insurers reporting growth in the numbers of PPO members in global budget contracts in 2016; and expansion of quality and risk-based payments in Medicare with implementa-tion of Medicare Access and CHIP Reauthorization Act (MACRA), adoption of the Next Generation ACO program with higher levels of downside risk than in previous ACO options, and introduction of new bundled payment initiatives.
� Comprehensive payment and delivery system initiatives in MassHealth, with the launch of its global-budget based ACO program in 2016 as a pilot and full program in 2017.
Demand-side incentives � Adoption of tiered network plans was unchanged from
2014 to 2015 (16 percent) and use of limited network plans grew slightly but remained low (3.0 percent to 3.2 percent).
� Fully-insured health insurance premiums varied by market segment, with premiums paid by members of the Group Insurance Commission (GIC) and those obtaining insurance through the Connector lower than those who obtain insurance in group markets. Con-nector premiums in the individual market were below the national average, unlike those in the small group market, which were above national averages.
� Smaller businesses pay higher broker fees and adminis-trative costs for their insurance coverage than do larger businesses, and most do not offer employees a choice of insurance plan (unlike larger businesses). Surveyed small employers stated they were unaware of the Con-nector and that they don’t have enough employees to offer plan choice.
2016 Cost Trends Report | 9
Executive Summary ES
RECOMMENDATIONS
In light of these findings, as well as the HPC’s other analytic and policy work throughout the year, the HPC makes the following recommendations to advance the goal of better care and better health at a lower cost for the people of the Commonwealth.
RECOMMENDATIONS TO FOSTER A VALUE-BASED MARKET
1 Health Care Equity and Affordability: The Com-monwealth should examine how health care costs are differentially allocated to individuals, families, and businesses across Massachusetts, and should further consider opportunities to promote equity and afford-ability, including tracking and monitoring differences in health care spending, insurance costs, and mem-ber cost-sharing across a range of characteristics (e.g., socio-economic profile, employer size and industry, health status, etc.).
2 Prescription Drug Spending: The Commonwealth should take action to reduce increases in drug spend-ing including by enhancing the transparency of drug prices and spending, and payers and providers should consider further opportunities to maximize value.
3 Out-of-Network Billing: Efforts to address out-of-network billing issues continue to gain momentum across the nation. Massachusetts has not taken com-prehensive action on this issue. The Commonwealth should implement safeguards for consumers and im-prove market functioning related to out-of-network billing by enhancing out-of-network billing protec-tions and establishing reasonable reimbursement for services.
4 Provider Price Variation: Extensive variation in prices paid to health care providers for the same sets of services is a persistent issue in the Common-wealth, driving increased health care spending and perpetuating inequities in health care resources. The Commonwealth should take action to reduce un-warranted variation in provider prices by continuing to monitor and analyze price variation, including by factors identified as “warranted” and “unwarranted”.
5 Facility Fees: The Commonwealth should take action to limit newly-licensed and existing sites that can bill as hospital outpatient departments and equalize pay-ments for select services for similar patients between hospital outpatient departments and physician offices.
6 Community-Appropriate Care: The Commonwealth, payers, and providers should work to redirect com-munity-appropriate care to high value, community settings.
RECOMMENDATIONS TO PROMOTE AN EFFICIENT, HIGH-QUALITY HEALTH CARE DELIVERY SYSTEM
7 Unnecessary Hospital Use and Other Institutional Care: The Commonwealth should continue to focus on strengthening partnerships between the health care delivery system and community-based organi-zations in order to reduce the unnecessary utilization of institutional care, including hospital readmissions, behavioral health-related ED visits, and institutional post-acute care.
8 Substance Use Disorder Treatment: The Com-monwealth, payers, and providers should continue to improve treatment of substance use disorder, par-ticularly including opioid use disorder.
9 Adherence to Evidence-Based Care: The Common-wealth, payers, and providers should work to focus on the highest possible adherence to evidence-based care, including putting systems in place to track and reduce the provision of non-recommended care.
RECOMMENDATIONS TO ADVANCE ALIGNED AND EFFECTIVE INCENTIVES10 Adoption of Alternative Payment Methods (APMs):
Payers and providers should continue to focus on increasing the adoption of alternative payment meth-ods (APMs). The Commonwealth should set APM adoption targets for HMO and PPO patients, and MassHealth members.
11 Alignment and Improvement of APMs: Payers should align and improve features of APMs in order to in-crease their effectiveness in promoting high quality, efficient care, including through improving quality measurement, reducing disparities in spending levels, inclusion of behavioral health, and adopting HPC’s ACO certification standards.
10 | 2016 Cost Trends Report
Section I: IntroductionI
12 Demand-Side Incentives: Payers and employers should continue to enhance strategies that empower consumers to make high-value choices, including increasing the transparency of comparative prices and quality to enhance the selection of value-based providers.
RECOMMENDATIONS TO ENHANCE DATA AND MEASUREMENT FOR TRANSPARENCY AND ACCOUNTABILITY13 Data and Measurement: Center of Health Informa-
tion and Analysis (CHIA) should continue to improve and document its data resources and develop key spending measures on drug rebates, Total Medical Ex-penditures (TME) for PPO populations, provider-level measures of spending growth, and ambulatory quality measures. CHIA should also evaluate the impact on the All-Payer Claims Database (APCD) of the expected loss of data due to the Gobielle decision.
2016 Cost Trends Report | 11
INTRODUCTION Section I: Introduction
The Health Policy Commission (HPC), created in 2012, is charged with monitoring health care spending growth in Massachusetts and providing data-driven policy recommen-dations on health care delivery and payment system reform (see Sidebar: “What is the role of the Health Policy Com-mission?”). In this fourth annual Cost Trends Report, the HPC examines key cost and market trends and evaluates the state’s progress in meeting certain cost containment, care delivery, and payment system goals. The Report in-cludes a set of policy recommendations and targets for the Commonwealth to consider in our collective work toward a high-value, well-functioning health system.
The HPC’s work is driven by the following principles:
� Fostering a value-based market in which payers and providers openly compete, and in which providers are supported and equitably rewarded for providing high-quality and affordable services;
� Promoting an efficient, high-quality, health care delivery system that improves health by delivering coordinated, patient-centered health care that accounts for patients’ behavioral, social and medical needs;
� Advancing aligned and effective financial incentives for providers to deliver high-quality, cost effective care and for consumers and employers to make high-value choices for their care and coverage;
� Enhancing transparency through publicly avail-able data and information on health care system performance necessary for providers, payers, patients, employers, and policymakers, including state agencies and the Legislature, to successfully implement reforms and evaluate performance over time.
The context in which this Report is published is one of both challenge and promise. Massachusetts has the lowest rate of uninsured residents in the nation, having under-taken health reform long before the Affordable Care Act was passed. According to the Commonwealth Fund’s state
health system scorecard, Massachusetts ranks among the top five states overall.1
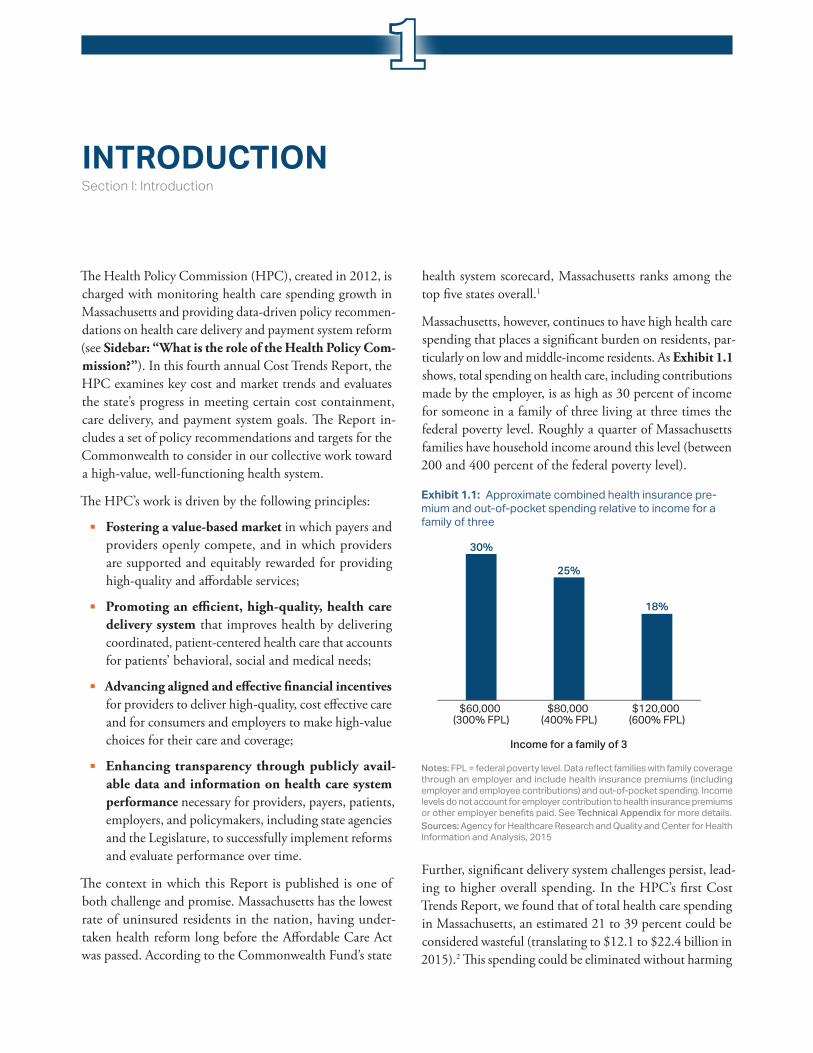
Massachusetts, however, continues to have high health care spending that places a significant burden on residents, par-ticularly on low and middle-income residents. As Exhibit 1.1 shows, total spending on health care, including contributions made by the employer, is as high as 30 percent of income for someone in a family of three living at three times the federal poverty level. Roughly a quarter of Massachusetts families have household income around this level (between 200 and 400 percent of the federal poverty level).
Further, significant delivery system challenges persist, lead-ing to higher overall spending. In the HPC’s first Cost Trends Report, we found that of total health care spending in Massachusetts, an estimated 21 to 39 percent could be considered wasteful (translating to $12.1 to $22.4 billion in 2015).2 This spending could be eliminated without harming
$120,000 (600% FPL)
$80,000 (400% FPL)
$60,000 (300% FPL)
30%
25%
18%
Income for a family of 3
Notes: FPL = federal poverty level. Data reflect families with family coverage through an employer and include health insurance premiums (including employer and employee contributions) and out-of-pocket spending. Income levels do not account for employer contribution to health insurance premiums or other employer benefits paid. See Technical Appendix for more details.Sources: Agency for Healthcare Research and Quality and Center for Health Information and Analysis, 2015
Exhibit 1.1: Approximate combined health insurance pre-mium and out-of-pocket spending relative to income for a family of three
1
12 | 2016 Cost Trends Report
Section I: IntroductionI
consumers or diminishing quality, but Massachusetts has failed to make significant progress and continues to under-perform compared to most states on key efficiency measures. For example, Massachusetts continues to have high hospital use and the Commonwealth Fund ranks Massachusetts 31st in the nation in avoidable hospital use. These performance trends are further detailed in this Report.
Recognizing that excessive health care costs are crowding out spending on other needs for government, households, and businesses alike, Chapter 224 set a statewide target for a sustainable rate of growth of total health care expendi-tures. From 2014 to 2015, the growth in total health care spending in Massachusetts was 4.1 percent, exceeding the state’s benchmark of 3.6 percent. While 2015 marks the second year that the growth in total health care spending exceeded the benchmark, reflecting particular areas of high spending growth, there are areas of marked achievement in lower spending. Through the analyses and research devel-oped for this Report, the HPC seeks to enhance the state’s understanding of spending trends and market dynamics that impacted the Commonwealth’s ability to meet the bench-mark in 2015 and identify opportunities for improving the quality and efficiency of the Commonwealth’s health care system moving forward.
HOW THIS REPORT IS ORGANIZEDThe HPC’s fourth annual Report is informed by annual reports of the Attorney General’s Office (AGO) and the Center for Health Information and Analysis (CHIA), as well as by testimony submitted during the HPC’s 2016 Annual Cost Trends Hearing.
In this Report, Section II: “Trends in spending and the delivery system” (Chapters 2 through 4) compares health care cost growth in 2015 against the Chapter 224 benchmark, discusses trends and levels of health care spending as well as affordability and quality of care in Massachusetts and the nation overall; trends in provider markets and factors driving market performance; trends in prescription drug spending; and provides a brief outlook for future success in meeting the benchmark.
Section III: “Care delivery performance” (Chapters 5 through 7) examines opportunities to improve quality and efficiency of care, highlighting the need to refocus care toward primary and community-based care settings, rather than institutions, including avoidable hospital and emer-gency department utilization, maximize value and quality in
post-acute care, and analyze variation among provider groups in total medical expenses and use of non-recommended care.
Section IV: “Progress in aligning incentives” (Chapters 8 and 9) evaluates progress made in two key areas of focus: improving incentives for providers through alternative pay-ment methods (APMs) and improving the opportunities for employers and consumers to save money by making high-value care choices.
Section V: “Recommendations” (Chapter 10) contains the HPC’s recommendations for accelerating efficiency in health care spending in Massachusetts and improving quality of care, as well as a dashboard summarizing performance in the Commonwealth on key measures.
What Is the role of the Health Policy Commission?The Health Policy Commission (HPC) is an independent state agency that develops policy to reduce health care cost growth and improve the quality of patient care. The HPC’s mission is to advance a more transparent, accountable, and innovative health care system through its independent policy leadership and in-vestment programs. The HPC’s goal is better health and better care – at a lower cost – across the Commonwealth.
The agency’s main responsibilities are led by HPC staff (divided into six departments) and overseen by an 11-member Board of Commissioners. HPC staff and commissioners work together collaboratively to monitor the performance of the health care system, including setting the health care cost growth benchmark; creating standards for care delivery systems that are account-able to better meet patients’ medical, behavioral, and social needs; analyzing the impact of health care market transactions on cost, quality, and access; and investing in community health care delivery and innovations.
REFERENCES1 The Commonwealth Fund. Scorecard on State Health System
Performance: 2015 edition. The Commonwealth Fund; 2016 Dec.
2 Health Policy Commission. 2013 Cost Trends Report. 2016 Jan.

2016 Cost Trends Report | 13
OVERVIEW OF TRENDS IN SPENDING AND CARE DELIVERYSection II: Trends in Spending and Care Delivery
Through Chapter 224 of the Acts of 2012, the Common-wealth established a benchmark against which annual growth in health care spending is evaluated, recognizing that containing spending growth is critical to easing this burden on households, businesses, and the state economy. Chapter 224 directs the Health Policy Commission (HPC) and the Center for Health Information and Analysis (CHIA) to annually monitor health care spending growth relative to the Commonwealth’s economic growth. The benchmark is tied to potential gross state product with the intention of maintaining a roughly constant share of the state economy devoted to health care spending. From 2013 to 2017, the benchmark has been set at 3.6 percent.
This chapter, in keeping with the legislative mandate to monitor spending against the benchmark and the broader mandate to monitor overall health system value and per-formance, discusses the state’s performance relative to the benchmark in 2015, broad trends affecting health care spending in the Commonwealth, and the quality of the Massachusetts health care system overall.
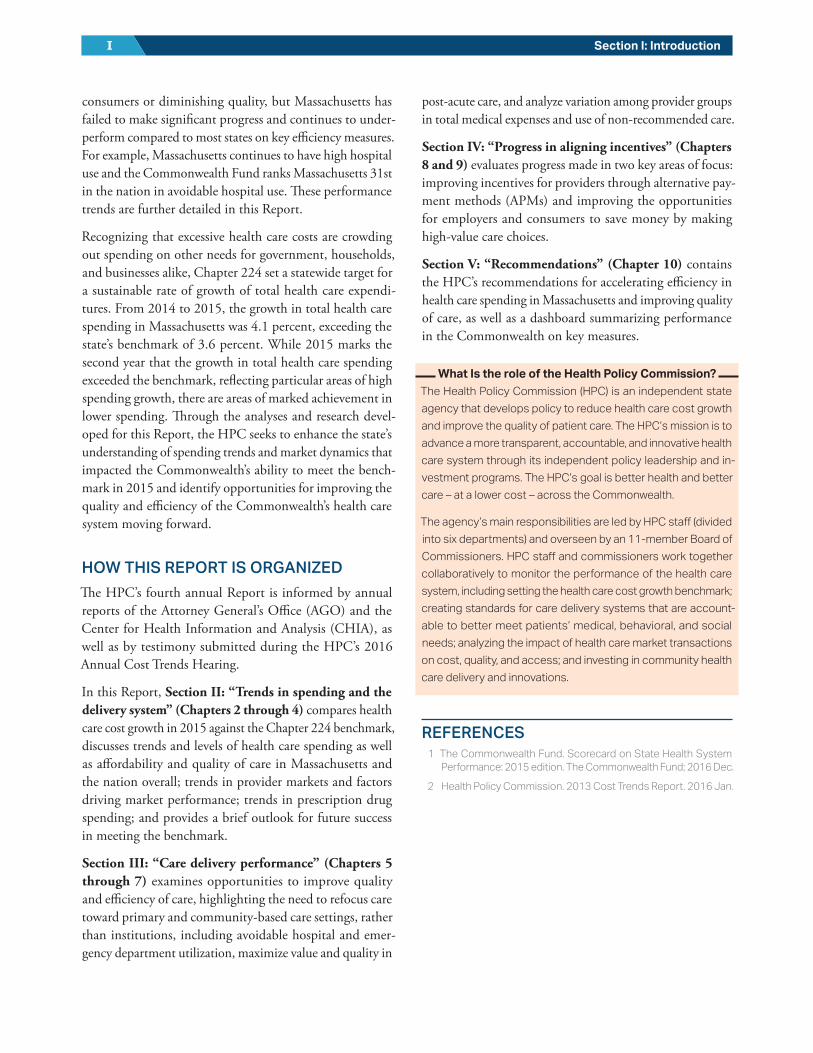
SPENDING GROWTH FROM 2014 TO 2015The measure of spending growth compared to the benchmark is defined as the change in total health care expenditures (THCE, as defined by CHIA) per state resident. THCE includes health care spending incurred by individuals, the state, and the federal government via Medicaid (MassHealth) and Medicare, as well as commercial spending as reported by health insurers to CHIA. CHIA reported initial per capita growth in total spending (THCE) in Massachusetts from 2014 to 2015 to be 4.1 percent, exceeding the state’s
benchmark of 3.6 percent. Total spending increased from $54.8 billion for 2014i to $57.4 billion in 2015,ii while the state’s population was estimated to have grown from 6.76 million to 6.79 million residents over the same time period, resulting in an increase in per capita spending from $8,109 to $8,441. Hospital spending grew faster in 2015 than in 2014 and continues to represent a considerable portion of total commercial spending at 42 percent. Additionally, for the second year in a row, prescription drug spending contributed significantly to spending growth; although prescription drugs account for roughly 14 percent of over-all health care spending in Massachusetts, the increase in prescription drug spending in 2015 accounted for roughly one third of total spending growth between 2014 and 2015 (not factoring in rebates). While exceeding the benchmark, the 4.1 percent increase in spending per Massachusetts resident was below the Center for Medicare and Medicaid Services’ (CMS) estimate of 5.1 percent per capita growth in personal health care spending across the entire U.S. for 2015 (see Exhibit 2.1).iii Overall, health care spending growth per resident in Massachusetts has been similar to or below national spending growth since 2012, after exceeding national growth rates from 2002 to 2008.
i 2013 and 2014 spending were revised from $51.3 billion and $54.0 billion to $52.2 billion and $54.8 billion, respectively, based on new data provided to CHIA from United Healthcare and final settlements between payers and providers, which reduced 2013-2014 growth of THCE per capita from the initially-reported 4.8 percent to 4.2 percent.
ii This figure is preliminary.iii The estimate of 5.1 percent is based on the subset of national health
spending called personal health care expenditures, which is most similar to THCE.
2
14 | 2016 Cost Trends Report
Section II: Trends in Spending and Care DeliveryII
COMMERCIAL SPENDINGThe commercial sector, composed of individuals covered by private health insurance, represents roughly 40 percent of health care spending accounted for by THCE in Massachu-setts. As shown in Exhibit 2.2, annual growth in commercial health insurance premium spending per enrollee in Mas-sachusetts has been roughly 2 percent per year since 2012, significantly below national trend through 2015.iv However, this aggregate figure masks important differences between the individual and employer markets due to a large influx of individual members (e.g. former CommonwealthCare enrollees) who enrolled in low-cost plans in 2015. Exclud-
iv These spending figures exclude out-of-pocket spending but include the net cost of private health insurance, which includes insurer ad-ministrative expenses, prescription drug rebates and other related spending.
ing individual purchasers, fully insured premiums grew 3.6 percent in 2015. More recent premium rate filing data suggest even higher premium growth in late 2015 through 2017. The Massachusetts Division of Insurance reported rate increases for premiums in the small group and individual markets of between 5.4 and 8.3 percent from the end of 2015 through the first quarter of 2017 (see “Future Outlook”).
As in prior years, large commercial payers in Massachusetts reported that spending growth in 2015 was primarily driven by increases in unit costs (prices) rather than by utilization.1
Exhibit 2.1: Annual growth in per capita health care spending, MA and the U.S., 2002-2015
Notes: U.S. data includes Massachusetts. Data show spending growth from previous year to year indicated.Sources: Centers for Medicare and Medicaid Services National Healthcare Expenditure Accounts, Personal Health Care Expenditures Data, and State Healthcare Expenditure Accounts (U.S. 2002-2015 and MA 2002-2009); Center for Health Information and Analysis Annual Report THCE Databook (MA 2009-2015)
2.0%
4.0%
6.0%
8.0%
10.0%
2015
2014
2013
2012
2011
2010
2009
2008
2007
2006
2005
2004
2003
2002
U.S.MA
MA Benchmark
Exhibit 2.2: Annual growth in health insurance premium spending per enrollee, MA and the U.S., 2005-2015
Notes: U.S. data includes Massachusetts. Data show spending growth from previous year to year indicated. Center for Health Information and Analysis data are for the fully-insured market only.Sources: Centers for Medicare and Medicaid Services, State and National Healthcare Expenditure Accounts, Private Health Insurance Expenditures and Enrollment (U.S. and MA 2005-2009); Center for Health Information and Analysis Annual Reports (MA 2009-2015)
MA Benchmark
U.S.MA
2.0%
4.0%
6.0%
8.0%
10.0%
2015
2014
2013
2012
2011
2010
2009
2008
2007
2006
2005

2016 Cost Trends Report | 15
Chapter 2: Overview of Trends in Spending and Care Delivery 2
Overall, lower growth rates in commercial spending per en-rollee over the last several years have brought Massachusetts commercial spending per person closer to the U.S. average. Currently, Massachusetts commercial spending per person is roughly 6 percent above national levels after being 12-13 percent higher in 2009.v Average employer-sponsored premiums for family coverage in Massachusetts are now the fifth highest among states in the U.S. after being the highest in 2009.
By category of commercial spending (see Exhibit 2.3), spending growth for physician and professional services and hospital care remained relatively low and below U.S. averages in 2015. However, growth in hospital spending was faster than in 2014 (2.6 percent versus 1.6 percent); for more information, see Chapter 5: “Hospital Utilization.” Because hospital inpatient and outpatient spending represent a considerable portion of total commercial spending (42 percent), spending in this category contributed 41 percent of total commercial spending growth in 2015, up from 18 percent in 2014.vi
As noted above, growth in prescription drug spending in Massachusetts per commercial enrollee remained relatively high at 8.8 percent, far outpacing the other categories of commercial health care spending in Massachusetts in 2015, and accounting for half of commercial spending growth in 2015, excluding the impact of rebates. Prescription drug spending growth in Massachusetts was similar to growth in the U.S. overall of 6.3 percent in 2015 (prescription drug spending figures in Massachusetts are pre-rebate estimates, while U.S. spending estimates are net of drug rebates).
A more detailed discussion on prescription drug spending appears later in this report in Chapter 4: “Prescription Drug Spending.”
PUBLIC PROGRAM SPENDINGGrowth in spending per enrollee among Medicare beneficia-ries in Massachusetts was higher than in the past few years but still below the benchmark rate of 3.6 percent. Combined growth per enrollee for residents receiving coverage through
v This is based on a comparison of single and family commercial em-ployer-based premiums as estimated by the Agency for HealthCare Research and Quality and an independent assessment provided to the HPC from Milliman actuarial consulting.
vi Physician and professional spending contributed 27 percent of growth. The combined contribution of prescription drug spending, hospital and physician spending is greater than 100 percent because of a substantial decrease in non-claims spending (e.g. settlements with respect to global budgets), which offset spending growth by 20 percent.
Notes: Massachusetts data derive from commercial insurers who report full claims (as opposed to using carve-outs). Prescription drug figures for Massachusetts represent estimates before drug rebates, while U.S. spending estimates are net of drug rebates.Sources: Centers for Medicare and Medicaid Services, private health insurance subset of the personal health care expenditure series and Center for Health Information and Analysis, 2012-2016
Exhibit 2.3: Annual growth in commercial spending per enrollee, by spending category, 2010-2015
U.S.
MA
-6%-4%-2%0%2%4%6%8%
10%12%
20152014201320122011
-6%-4%-2%0%2%4%6%8%
10%12%
20152014201320122011
-6%-4%-2%0%2%4%6%8%
10%12%
20152014201320122011
Hospital
Prescription drugs
Physician and professionalHospital
U.S.
MA
-6%-4%-2%0%2%4%6%8%
10%12%
20152014201320122011
-6%-4%-2%0%2%4%6%8%
10%12%
20152014201320122011
-6%-4%-2%0%2%4%6%8%
10%12%
20152014201320122011
Hospital
Prescription drugs
Physician and professionalPhysician and professional
U.S.
MA
-6%-4%-2%0%2%4%6%8%
10%12%
20152014201320122011
-6%-4%-2%0%2%4%6%8%
10%12%
20152014201320122011
-6%-4%-2%0%2%4%6%8%
10%12%
20152014201320122011
Hospital
Prescription drugs
Physician and professional
Prescription drugs
16 | 2016 Cost Trends Report
Section II: Trends in Spending and Care DeliveryII
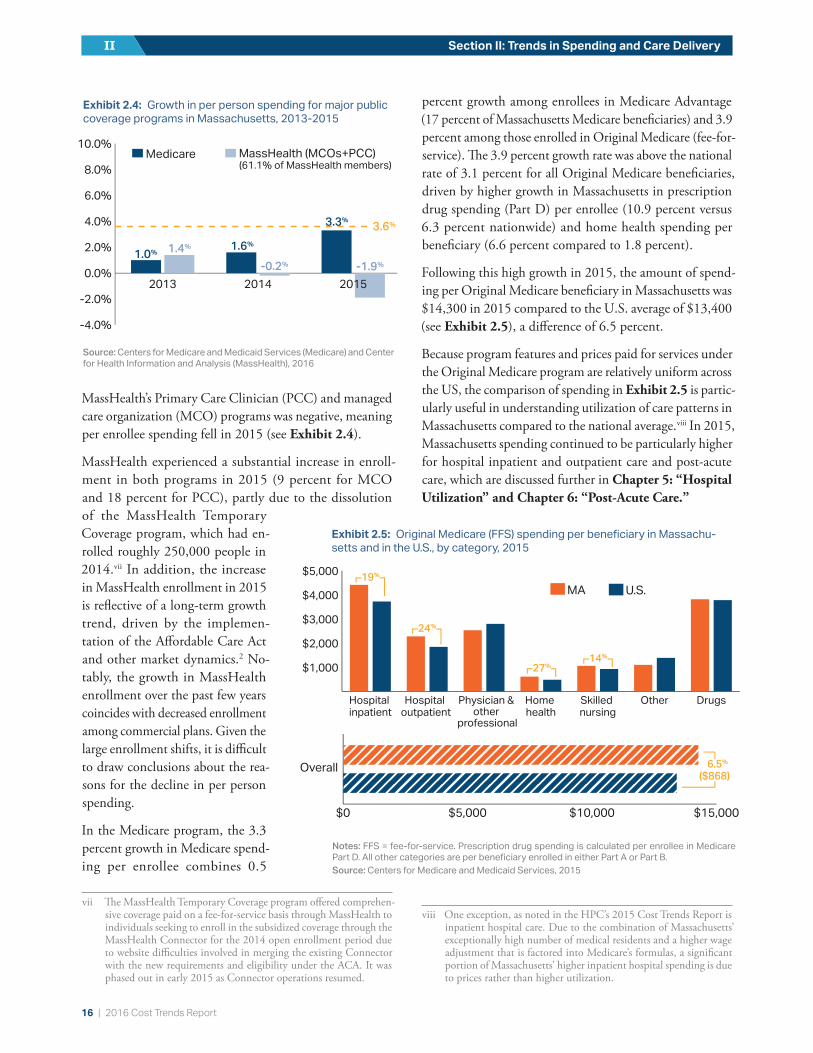
MassHealth’s Primary Care Clinician (PCC) and managed care organization (MCO) programs was negative, meaning per enrollee spending fell in 2015 (see Exhibit 2.4).
MassHealth experienced a substantial increase in enroll-ment in both programs in 2015 (9 percent for MCO and 18 percent for PCC), partly due to the dissolution of the MassHealth Temporary Coverage program, which had en-rolled roughly 250,000 people in 2014.vii In addition, the increase in MassHealth enrollment in 2015 is reflective of a long-term growth trend, driven by the implemen-tation of the Affordable Care Act and other market dynamics.2 No-tably, the growth in MassHealth enrollment over the past few years coincides with decreased enrollment among commercial plans. Given the large enrollment shifts, it is difficult to draw conclusions about the rea-sons for the decline in per person spending.
In the Medicare program, the 3.3 percent growth in Medicare spend-ing per enrollee combines 0.5
vii The MassHealth Temporary Coverage program offered comprehen-sive coverage paid on a fee-for-service basis through MassHealth to individuals seeking to enroll in the subsidized coverage through the MassHealth Connector for the 2014 open enrollment period due to website difficulties involved in merging the existing Connector with the new requirements and eligibility under the ACA. It was phased out in early 2015 as Connector operations resumed.
percent growth among enrollees in Medicare Advantage (17 percent of Massachusetts Medicare beneficiaries) and 3.9 percent among those enrolled in Original Medicare (fee-for-service). The 3.9 percent growth rate was above the national rate of 3.1 percent for all Original Medicare beneficiaries, driven by higher growth in Massachusetts in prescription drug spending (Part D) per enrollee (10.9 percent versus 6.3 percent nationwide) and home health spending per beneficiary (6.6 percent compared to 1.8 percent).
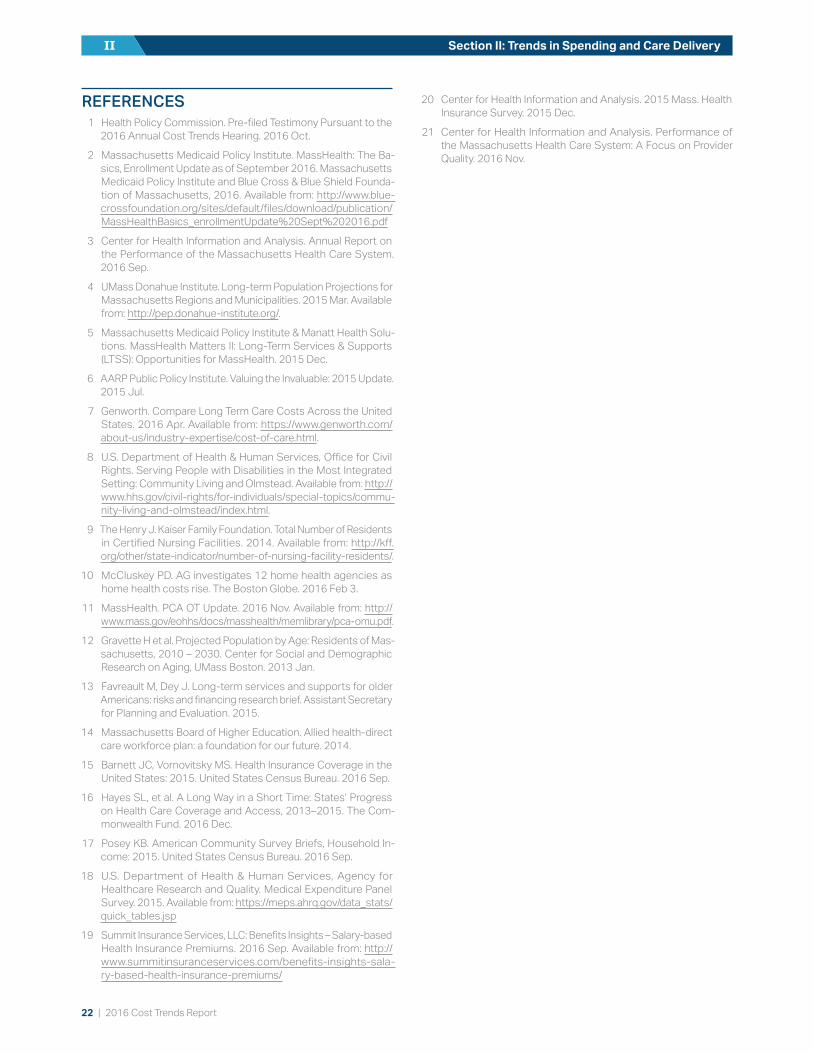
Following this high growth in 2015, the amount of spend-ing per Original Medicare beneficiary in Massachusetts was $14,300 in 2015 compared to the U.S. average of $13,400 (see Exhibit 2.5), a difference of 6.5 percent.
Because program features and prices paid for services under the Original Medicare program are relatively uniform across the US, the comparison of spending in Exhibit 2.5 is partic-ularly useful in understanding utilization of care patterns in Massachusetts compared to the national average.viii In 2015, Massachusetts spending continued to be particularly higher for hospital inpatient and outpatient care and post-acute care, which are discussed further in Chapter 5: “Hospital Utilization” and Chapter 6: “Post-Acute Care.”
viii One exception, as noted in the HPC’s 2015 Cost Trends Report is inpatient hospital care. Due to the combination of Massachusetts’ exceptionally high number of medical residents and a higher wage adjustment that is factored into Medicare’s formulas, a significant portion of Massachusetts’ higher inpatient hospital spending is due to prices rather than higher utilization.
Source: Centers for Medicare and Medicaid Services (Medicare) and Center for Health Information and Analysis (MassHealth), 2016
Exhibit 2.4: Growth in per person spending for major public coverage programs in Massachusetts, 2013-2015
-4.0%
-2.0%
0.0%
2.0%
4.0%
6.0%
8.0%
10.0%
201520142013
Medicare
3.6%
1.0%1.6%
3.3%
1.4%
-0.2% -1.9%
MassHealth (MCOs+PCC)(61.1% of MassHealth members)
-4.0%
-2.0%
0.0%
2.0%
4.0%
6.0%
8.0%
10.0%
201520142013
Medicare
3.6%
1.0%1.6%
3.3%
1.4%
-0.2% -1.9%
MassHealth (MCOs+PCC)(61.1% of MassHealth members)
-4.0%
-2.0%
0.0%
2.0%
4.0%
6.0%
8.0%
10.0%
201520142013
Medicare
3.6%
1.0%1.6%
3.3%
1.4%
-0.2% -1.9%
MassHealth (MCOs+PCC)(61.1% of MassHealth members)
MA U.S.
$1,000
$2,000
$3,000
$4,000
$5,000
DrugsOtherSkilled nursing
Home health
Physician & other
professional
Hospital outpatient
Hospital inpatient
19%
24%
27%14%
$0 $5,000 $10,000 $15,000
Overall 6.5%
($868)
Exhibit 2.5: Original Medicare (FFS) spending per beneficiary in Massachu-setts and in the U.S., by category, 2015
Notes: FFS = fee-for-service. Prescription drug spending is calculated per enrollee in Medicare Part D. All other categories are per beneficiary enrolled in either Part A or Part B.Source: Centers for Medicare and Medicaid Services, 2015

2016 Cost Trends Report | 17
Chapter 2: Overview of Trends in Spending and Care Delivery 2
Overall performance against the state cost growth benchmark in 2015As shown in Exhibits 2.2 and 2.4, despite high rates of growth in spending on prescription drugs, growth in spending per enrollee was below the benchmark rate for Massachusetts’ Medicare, Commercial, and MassHealth PCC and MCO enrollees (as was also the case in 2014). Yet overall, spending growth per Massachusetts resident exceeded the benchmark rate. In 2014, part of the reason for exceeding the benchmark was that, on net, more state residents appeared to be enrolled in any form of coverage (with an implied reduction in the uninsured). This does not appear to be the case in 2015.ix
A number of other factors contributed to spending growth in excess of the benchmark in 2015, some of which are detailed in CHIA’s 2016 Annual Report.3 One factor is an increase in the net cost of private health insurance (NCPHI). Another is enrollment in Medicare; enrollment increased among those in Original Medicare and Medicare Advantage (2 percent, or 22,000 individuals) and in the One Care and Senior Care Options programs, which provide comprehensive care for Medicare benefi-ciaries who are dually eligible for MassHealth and who are non-elderly disabled or elderly, respectively. The increase in Medicare enrollment, amounting to roughly $300 million in additional spending in 2015 if these new beneficiaries are assumed to have similar spending as average beneficiaries, is significant but not unexpected given that the elderly population in Massachusetts is expected to grow by roughly 30,000 individuals each year between now and 2030.4
An additional factor was an increase in spending on long-term services and supports (LTSS). MassHealth provides such additional services to many residents who have primary coverage under Medicare or com-mercial insurance, but this spending is counted under MassHealth and not Medicare or commercial coverage. This category of spending is discussed in Sidebar: “Long-term services and supports.”
ix Although it is not possible to arrive at precise enrollment figures, this conclusion is supported by the drop in the per-centage of emergency department visits in Massachusetts attributable to the uninsured in 2014 (from 8.7 percent to 7.2 percent) followed by a rise in 2015 (to 9.0 percent) based on an HPC analysis of Emergency Department discharge data from the Center for Health Information and Analysis.
Long-term services and supportsMany people living with cognitive or physical disabilities or impairments require supports such as assistance with preparing meals, bathing, and other activities of daily living (ADLs). These long-term services and supports (LTSS) can be delivered in a range of institutional and community settings, including nursing facilities, assisted living facilities, or in a client’s home where nursing providers or other aides assist individuals with these activities.
SpendingMassHealth is the primary payer of LTSS, covering nearly half (45 percent) of LTSS spending in Massachusetts, as neither Medicare nor commercial health insurance covers most long-term services.x, 5 Direct MassHealth spending on LTSS totaled over $4.7 billion in FY 2015, roughly 8 percent of total health care expenditures (THCE) in Massachusetts. In FY2015, MassHealth spent about $2.0 billion on community-based LTSS, $1.5 billion on institution-based LTSS, and $1.3 billion on enrollees in Senior Care Options, PACE, and OneCare.xi, xii This spending represents growth compared to 2014 of 15 percent, -1 percent, and 27 percent, respec-tively. Together, LTSS spending rose 12 percent (about $510 million) in FY 2015, a considerable amount given that total MassHealth spending growth reported by CHIA was $706 million from CY 2014 to 2015.
In the fee-for-service (FFS) program, growth in 2015 was due solely to growth in spending on community-based LTSS, driven by a 37 percent increase in home health spending. Much of the increase in home health spending was due to an increase in users (23 percent growth), but per member spending also increased by about 12 percent in 2015. During the same time period, institutional LTSS spending shrank by about 1 percent. While spending per member rose slightly by about 1 percent, the number of users declined by 3 percent.
LTSS spending growth in 2015 appears to be relatively high compared to prior years. From FY 2009 to 2014, LTSS spending grew an average 7 percent per year, including an 11 percent average annual growth rate in community-based LTSS, an annual decline of 2 percent in institutional LTSS spending, and 23 percent annual growth in Senior Care Options, PACE, and OneCare. Controlling community-based LTSS spending has been a priority for MassHealth since 2015, as described below.
Furthermore, true LTSS spending in Massachusetts is higher than the totals captured by THCE. THCE does not include claims from long-term care insurance nor personal spending on LTSS (not attached to a claim). Personal spending on LTSS is substantial; out-of-pocket expenditures are estimated to account for 17 percent of the spending on LTSS in Massachusetts, in addition to care provided by unpaid caregivers.5 Time spent by informal caregivers in Massachusetts helping adult family mem-bers with activities of daily living is valued at about $11.6 billion annually.6
x Medicare Parts A and B cover home health services designed to assist people who are recovering from an acute care event. While some Medicare benefi-ciaries receive covered home health benefits for prolonged periods, Medicare does not intend for this service to be used as a substitute for long-term services and supports.
xi These managed care programs include LTSS in the capitated rate.xii HPC analysis of data provided by MassHealth.

18 | 2016 Cost Trends Report
Section II: Trends in Spending and Care DeliveryII
Use of community-based versus institutional careNursing facility care is typically more expensive than community-based services, especially in the Commonwealth. In Massachusetts, the median annual cost in 2016 of semi-private nursing facility services (including spending from all payers) was $135,050 versus the national average of $82,125. The median cost of a full time home health aide was $57,200 annually compared to a national me-dian of $46,332, although spending can vary widely based on the hours of care needed.7 However, this difference in cost between nursing facility care and community-based care is moderated by the inclusion of other medical services covered under the nursing home reimbursement.
While some individuals with high care needs require the more intensive services that a nursing facility can offer, many others with lower care needs can continue to live in the community with a lower level of support. MassHealth has made significant efforts in recent years to rebalance the share of LTSS provided in nursing facilities versus in the community. The Supreme Court’s Olmstead v. L.C. ruling in 1999 held that individuals with disabilities have the right to live in the community rather than in institutions when appropriate.8 Since the Olmstead decision, there has been a national shift in Medicaid LTSS spending from institutional to community-based care. Massachusetts was a leader in this trend, with the share of spending devoted to community-based LTSS exceeding the share of in-stitutional spending earlier than in the U.S. overall. In 2014, MassHealth spent 57 cents of every LTSS dollar on community-based services, compared to 53 cents of every LTSS dollar in the U.S. overall (see Exhibit 2.6). From 2010 to 2014, Massachusetts had a 4.2 percent reduction in the number of Massachusetts residents living in nursing homes.9
Some remain concerned that institutional LTSS spending has not declined sufficiently to offset the increase in spending on commu-nity-based care. To ensure sustainability in spending, MassHealth has pursued a number of strategies. Through the new 1115 waiver, MassHealth is enhancing the coordination and integration of LTSS with other health care services (see Chapter 8: “Alternative Payment Methods”). MassHealth has also focused on actions to strengthen program integrity. Following a recent audit that identified nine home health agencies that improperly billed MassHealth for $23 million, MassHealth implemented a moratorium on new home health agencies and established a new process that will require home health agencies to secure authorization from MassHealth before delivering ser-vices.10 MassHealth is also investing in electronic visit verification tools for home health visits. Despite the large growth in home health enrollment, MassHealth members receiving care from personal care attendants contin-ued to outnumber members receiving services through a home health agency (about 24,400 and 18,900, respec-tively). MassHealth has also sought to lower spending growth through estab-lishing an overtime cap for personal care attendants.11 As a result of these efforts, MassHealth estimates reduced community-based LTSS spending growth for FY17 (an estimated 8 per-cent spending growth).
Considerations for future LTSS spending and deliveryA number of considerations will shape the trajectory of LTSS spending and delivery, including the aging of the population and LTSS service capacity. The Massachusetts population is aging faster than the US overall, with the number of seniors expected to grow by 61 percent from 2010 to 2030.12 When combined with medical and technological advances and longer life-span, the number of people with long-term care needs is expected to grow significantly. More than half of all adults turning 65 today are expected to need long-term care services.13 As the population ages, and as an increasing number of seniors in Massachusetts elect to receive care in their homes or community, it will become especially important to ensure that there is a capable and sufficient workforce to pro-vide community-based LTSS. By 2020, it has been estimated that Massachusetts will require 32 percent more direct care workers than were employed in 2010.14 It will be important for stakeholders and state agencies to consider strategies to maintain access to high-quality care for all residents requiring LTSS.
10%
20%
30%
40%
50%
60%
70%
20142013201220112010200920082007200620052004200320022001
MA community-based spendingMA institutional spending
U.S. community-based spendingU.S. institutional spending
30%
53%
47%
43%
57%
38%
62%
70%
Exhibit 2.6: Share of MassHealth LTSS spending on institutional care and community-based care, MA and the U.S., 2001-2014
10%
20%
30%
40%
50%
60%
70%
20142013201220112010200920082007200620052004200320022001
MA community-based spendingMA institutional spending
U.S. community-based spendingU.S. institutional spending
30%
53%
47%
43%
57%
38%
62%
70%
Source: HPC analysis of LTSS expenditures data from Medicaid.gov, FY 2001-2014

2016 Cost Trends Report | 19
Chapter 2: Overview of Trends in Spending and Care Delivery 2
ACCESS TO AND AFFORDABILITY OF CAREMassachusetts continues to perform well compared to other states on some state-wide measures of access to and afford-ability of care, although other states have closed the gap with the coverage expansions due to the Affordable Care Act (ACA). In terms of insurance coverage, Massachusetts continued to have the lowest rate of uninsured in the U.S. at 3 percent in 2015 compared to a national average that dropped from 15 percent in 2013 to 9 percent in 2015.15 The percentage of adults who went without care in the past year because of cost increased from 8 percent to 9 percent in 2015 while the national average dropped from 14 per-cent to 13 percent. The percentage of at-risk adults with a doctor visit in the past two years remained at 93 percent compared to a national average of 87 percent, and the per-centage of individuals under age 65 who spent more than 10 percent of income on out-of-pocket expenses for health care (not including premiums) was 11 percent, compared to 14 percent across the U.S.16
These aggregate measures, however, mask underlying access and affordability problems for many of the state’s residents. Although Massachusetts has higher average income than the nation, Massachusetts also ranks seventh highest among states in the degree of income inequality.17 Approximately one million Massachusetts residents (15 percent of the state) have income levels between the poverty line and twice the poverty line, and another 1.6 million (24 percent of resi-dents) have incomes between twice and four times the poverty level.xiii Importantly, the high costs of health care are felt by low- and high-income residents alike. Average total premiums for employer-based family coverage in Mas-sachusetts were $16,300 per year for employees in firms with the lowest average wages in the state and $19,300 for employees in firms with the highest wages (see Exhibit 2.7).18 Although some employers adjust their required premium contributions so that lower-earning employees pay less for the same coverage, the required employee contributions to premiums on average were actually higher for employees in the lowest-wage firms ($5,500 compared to $4,200 for employees in high-wage firms).19
HPC analysis of out-of-pocket costs from the All-Payer Claims Database found similar annual spending for residents in the lowest-income zip codes in the state (see Exhibit 2.8) as those in the highest-income areas.
xiii Corresponding incomes for a family of two adults and one child are between $20,000 (poverty level) and $80,000 (four times the poverty level).
Employee contribution
Employer contribution
Q4Q3Q2Q1
$5,491
$16,251$17,246
$18,353$19,263
$5,628$4,182 $4,190
Lowest wage Highest wage
34
%
33
%
23
%
22
%
Exhibit 2.7: Average annual family premiums and employee contributions, by wage quartile of employer in Massachu-setts, 2015
Source: Agency for Healthcare Research and Quality, Medical Expenditure Panel Survey, 2015
Employee contribution
Employer contribution
Q4Q3Q2Q1
$5,491
$16,251$17,246
$18,353$19,263
$5,628$4,182 $4,190
Lowest wage Highest wage
34
%
33
%
23
%
22
%
Employee contribution
Employer contribution
Q4Q3Q2Q1
$5,491
$16,251$17,246
$18,353$19,263
$5,628$4,182 $4,190
Lowest wage Highest wage
34
%
33
%
23
%
22
%
$3,000+$1,000 - $3,000$500 - $1,000$250 - $500$0 - $250
20%
40%
60%
80%
100%
Highest income areas
Lowest income areas
1%
13%
15%
18%
52%
15%
16%
17%
50%
2%Annual out-of-pocket spending
Average$560
Average$620
Notes: Spending includes only out-of-pocket spending within insurance benefits (e.g. copays and deductibles) and is conditional on having non-zero spending. Lowest income areas represent the quartile of zip codes in the state with the lowest median household income. Data include only privately insured individuals covered by Blue Cross Blue Shield of Massachusetts, Harvard Pilgrim Health Care, and Tufts Health Plan. Data do not include spending outside of health insurance such as dental care, over-the-counter medications, or privately-paid mental health visits.Source: HPC analysis of Massachusetts All-Payer Claims Database, 2014
Exhibit 2.8: Annual out-of-pocket spending for Massachu-setts residents in the lowest and highest income areas in the state, 2014
$3,000+$1,000 - $3,000$500 - $1,000$250 - $500$0 - $250
20%
40%
60%
80%
100%
Highest income areas
Lowest income areas
1%
13%
15%
18%
52%
15%
16%
17%
50%
2%Annual out-of-pocket spending
Average$560
Average$620
$3,000+$1,000 - $3,000$500 - $1,000$250 - $500$0 - $250
20%
40%
60%
80%
100%
Highest income areas
Lowest income areas
1%
13%
15%
18%
52%
15%
16%
17%
50%
2%Annual out-of-pocket spending
Average$560
Average$620

20 | 2016 Cost Trends Report
Section II: Trends in Spending and Care DeliveryII
As a result, health care costs for a family of three living at 300 percent of the federal poverty level represent 30 percent of their total family income (see Exhibit 1.1 in Chapter 1:
“Introduction”) and 25 percent for a family living at four times the poverty level.xiv
This burden of health care spending can have particularly serious consequences for low and middle income residents, leaving little room for other necessities and increasing finan-cial pressure to make ends meet. Among residents between 138 and 300 percent of the federal poverty level in 2015, (between roughly $28,000 and $60,000 for a family of three), 15 percent reported that out-of-pocket health care spending was more than 5 percent of their income, 24 per-cent reported having difficulty paying medical bills, and 21 percent said someone in their family went without needed medical care due to cost in the past 12 months.20
QUALITY OF CAREThe Commonwealth seeks to contain health care spending while ensuring equal or better quality of care for all resi-dents. The HPC reported previously that Massachusetts providers tend to perform well on technical measures such as mortality rates but not as well on reducing costly and avoidable care such as hospital readmissions and avoidable emergency department (ED) visits. New data collected and summarized by CHIA in its 2016 provider quality report and by CMS in the 2016 hospital quality ratings confirm and extend these earlier findings.
In November 2016, CHIA published its annual report evaluating health system performance on quality of care across three domains: safety, effectiveness and efficiency, and patient-centeredness.21 In the safety domain, which includes measures that are only calculated for hospitals, hospitals improved in an important composite measure of safety (Patient Safety Indicator 90) from 2014 and, in aggregate, performed better than the national average in 2015. On the other hand, hospitals demonstrate a need for improvement in some measures of health care-associated infections. For example, while Massachusetts performed better than the national average for methicillin-resistant Staphylococcus aureus (MRSA) and central line-associated bloodstream infections (CLABSI), Massachusetts performed worse than the national average on Clostridium difficile and
xiv This calculation includes the employer contribution to health insur-ance premiums as health care spending, though it is not counted in the household’s income. Other spending on health care that is not covered by health insurance (for example, spending on non-covered services such as privately-paid long term care or mental health ser-vices or over-the-counter drugs) is not included.
catheter-associated urinary tract infections (CAUTI). In the efficient and effective care domain, which includes measures such as potentially preventable hospitalization, early elective deliveries and all-cause readmissions, Massachusetts provid-ers performed worse, on average, than national benchmarks. Patients rated Massachusetts hospitals and primary care providers highly on how well their doctors communicated with them overall, but rated hospitals poorly on quietness in hospitals and rated primary care providers poorly on ed-ucation about self-management in the primary care setting.
An analysis of CMS’ hospital quality rankings, which assign one to five stars for all hospitals in the U.S., found similar variation across Massachusetts (see Exhibit 2.9). Massa-chusetts hospitals performed well compared to the national average in the mortality and efficient use of medical imaging categories but poorly on measures of readmission and time-liness of care, the latter which includes measures such as ED wait times.xv
xv These measures include the average time patients wait in the ED before leaving, being seen by a health care professional, receiving pain medication for a broken bone, or being admitted to the hospital.
Performed better than
national average
Performed the same
as national average
Performed worse than
national average
Safety 33% 40% 27%
Readmissions 4% 43% 54%
Mortality 55% 45% 0%
Patient experience 33% 38% 29%
Effectiveness of care 29% 56% 15%
Timeliness of care 4% 35% 62%
Efficient use of medical imaging 25% 73% 2%
Notes: Green indicates areas of significantly better performance than the national average; yellow indicates worse performance. Fifty-seven Massachusetts hospitals were included in CMS’s first Hospital Compare release. However, not all hospitals were evaluated in each performance category (categories seen above). Hospitals were excluded from a performance category if they did not meet the minimum reporting threshold in that category of at least 3 measures. The number of hospitals in each category was: safety = 52, readmissions = 56, mortality = 56, patient experience= 55, effectiveness of care = 55, timeliness of care = 55, and efficient use of medical imaging = 52. Hospitals are represented as the combined product of their campuses, e.g. North Shore Medical Center includes both the Union and Salem campuses.Source: Centers for Medicare and Medicaid Services, 2016
Exhibit 2.9: Massachusetts hospitals performance on each component of CMS’ Hospital 5 Star Ratings, 2015Percent of hospitals

2016 Cost Trends Report | 21
Chapter 2: Overview of Trends in Spending and Care Delivery 2
Nursing facility qualityThe HPC also analyzed quality ratings for nurs-ing facilities that are dually-certified by Medicare and Medicaid serving both short-term residents (skilled nursing facility beds) and long-term residents (long-term services and supports beds). While the Commonwealth continues to work toward enabling patients to receive high quality care across the continuum, including a range of post-acute care and long-term care options as needed (see Chapter 6: “Post-Acute Care”), some residents will continue to be most ap-propriately served in nursing facilities. For this population, ensuring access to high quality care remains critical.
As of January 2017, Massachusetts had 417 li-censed nursing facilities, with about 48,000 beds.xvi HPC analysis found substantial variation throughout the state in the quality of nursing facilities. The HPC also found that nursing fa-cility quality varied by community income.xvii In 2016, nursing facility beds located in the lowest income zip codes had an average quality rating of 3.01 on a scale of one to five stars, compared to an average rating of 3.44 in the highest income zip codes (see Exhibit 2.10). In these low-in-come areas, almost 16 percent of beds were in a facility that received one star and 15 percent received five stars; compared to 9 percent and 33 percent, respectively, in the highest income areas.
The quality of nursing facilities also varied by region. Based on HPC regions, the Berkshires and South Shore regions had the highest pro-portion of beds in four or five star facilities (see Exhibit 2.11). The Berkshires had the highest proportion, with 74 percent of regional beds located in four or five star facilities. In the Upper North Shore region, only 11 percent of nursing fa-cility beds were located in four or five star facilities.
xvi From Massachusetts Department of Public Health, Division of Health Care Facility Licensure and Certification.
xvii The statewide facility average is weighted by number of beds per facility. The star rating data is from CMS Nursing Home Compare, which assigns ratings to nursing facilities certified by Medicare and Medicaid based on three criteria: state health inspection ratings, staffing, and quality measures. Composite scores are produced on a scale of one to five stars. The HPC used Nursing Home Compare data in conjunction with CMS Provider of Services data. 2016 data are used for cross-sectional analyses, and data from 2009-2013 are used for time trend analyses, as 2016 scores are not directly com-parable to measures from previous years.
1 star 2 star 3 star 4 star 5 star
5%
10%
15%
20%
25%
30%
35%
Quintile 5Quintile 4Quintile 3Quintile 2Quintile 1Highest incomeLowest income
3.01 3.18 3.01 3.45 3.44Average
Notes: Quintiles are based only on median incomes of zip codes where nursing facilities are located. Quintile1 = less than $48,700; quintile 2 = $48,700-$63,000; quintile 3 = $63,001-$77,420; quintile 4 = $77,421-$93,000; quintile 5= more than $93,000.Source: Centers for Medicare and Medicaid Services, Nursing Home Compare, December 2016
Exhibit 2.10: Distribution of beds, by nursing facility quality and median zip code income, 2016
30-40%<11%
40-50%50-55%>55%
Percent of beds in 4 or 5 star facilities
Berkshires
Cape and Islands
Central Mass
East Merrimack
Fall River
Lower North Shore
Metro Boston
Metro South
Metro West
New Bedford
Norwood/Attleboro
Pioneer Valley/Franklin
So
uth Sho
re
Upper North Shore
West Merrimack/Middlesex
Exhibit 2.11: Percentage of nursing facility beds in four or five star quality facilities, by HPC region, 2016
Source: Centers for Medicare and Medicaid Services, Nursing Home Compare, December 2016
22 | 2016 Cost Trends Report
Section II: Trends in Spending and Care DeliveryII
REFERENCES1 Health Policy Commission. Pre-filed Testimony Pursuant to the
2016 Annual Cost Trends Hearing. 2016 Oct.
2 Massachusetts Medicaid Policy Institute. MassHealth: The Ba-sics, Enrollment Update as of September 2016. Massachusetts Medicaid Policy Institute and Blue Cross & Blue Shield Founda-tion of Massachusetts, 2016. Available from: http://www.blue-crossfoundation.org/sites/default/files/download/publication/MassHealthBasics_enrollmentUpdate%20Sept%202016.pdf
3 Center for Health Information and Analysis. Annual Report on the Performance of the Massachusetts Health Care System. 2016 Sep.
4 UMass Donahue Institute. Long-term Population Projections for Massachusetts Regions and Municipalities. 2015 Mar. Available from: http://pep.donahue-institute.org/.
5 Massachusetts Medicaid Policy Institute & Manatt Health Solu-tions. MassHealth Matters II: Long-Term Services & Supports (LTSS): Opportunities for MassHealth. 2015 Dec.
6 AARP Public Policy Institute. Valuing the Invaluable: 2015 Update. 2015 Jul.
7 Genworth. Compare Long Term Care Costs Across the United States. 2016 Apr. Available from: https://www.genworth.com/about-us/industry-expertise/cost-of-care.html.
8 U.S. Department of Health & Human Services, Office for Civil Rights. Serving People with Disabilities in the Most Integrated Setting: Community Living and Olmstead. Available from: http://www.hhs.gov/civil-rights/for-individuals/special-topics/commu-nity-living-and-olmstead/index.html.
9 The Henry J. Kaiser Family Foundation. Total Number of Residents in Certified Nursing Facilities. 2014. Available from: http://kff.org/other/state-indicator/number-of-nursing-facility-residents/.
10 McCluskey PD. AG investigates 12 home health agencies as home health costs rise. The Boston Globe. 2016 Feb 3.
11 MassHealth. PCA OT Update. 2016 Nov. Available from: http://www.mass.gov/eohhs/docs/masshealth/memlibrary/pca-omu.pdf.
12 Gravette H et al. Projected Population by Age: Residents of Mas-sachusetts, 2010 – 2030. Center for Social and Demographic Research on Aging, UMass Boston. 2013 Jan.
13 Favreault M, Dey J. Long-term services and supports for older Americans: risks and financing research brief. Assistant Secretary for Planning and Evaluation. 2015.
14 Massachusetts Board of Higher Education. Allied health-direct care workforce plan: a foundation for our future. 2014.
15 Barnett JC, Vornovitsky MS. Health Insurance Coverage in the United States: 2015. United States Census Bureau. 2016 Sep.
16 Hayes SL, et al. A Long Way in a Short Time: States’ Progress on Health Care Coverage and Access, 2013–2015. The Com-monwealth Fund. 2016 Dec.
17 Posey KB. American Community Survey Briefs, Household In-come: 2015. United States Census Bureau. 2016 Sep.
18 U.S. Department of Health & Human Services, Agency for Healthcare Research and Quality. Medical Expenditure Panel Survey. 2015. Available from: https://meps.ahrq.gov/data_stats/quick_tables.jsp
19 Summit Insurance Services, LLC: Benefits Insights – Salary-based Health Insurance Premiums. 2016 Sep. Available from: http://www.summitinsuranceservices.com/benefits-insights-sala-ry-based-health-insurance-premiums/
20 Center for Health Information and Analysis. 2015 Mass. Health Insurance Survey. 2015 Dec.
21 Center for Health Information and Analysis. Performance of the Massachusetts Health Care System: A Focus on Provider Quality. 2016 Nov.
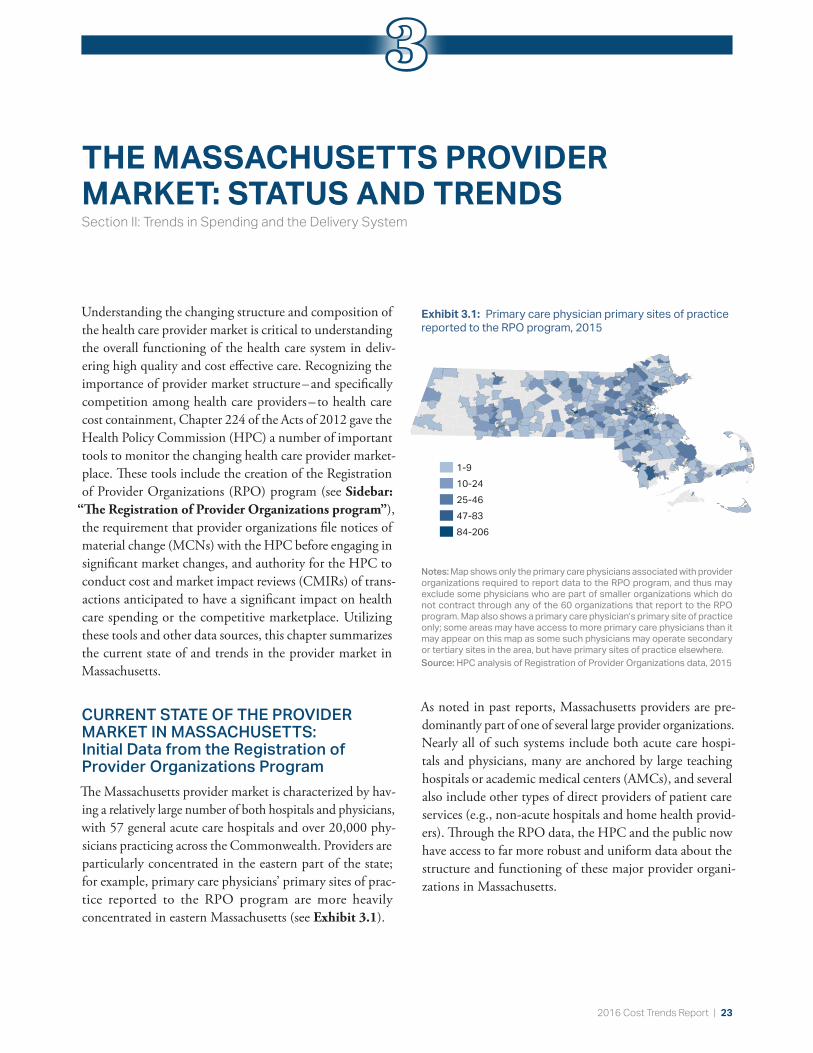
2016 Cost Trends Report | 23
THE MASSACHUSETTS PROVIDER MARKET: STATUS AND TRENDSSection II: Trends in Spending and the Delivery System
Understanding the changing structure and composition of the health care provider market is critical to understanding the overall functioning of the health care system in deliv-ering high quality and cost effective care. Recognizing the importance of provider market structure – and specifically competition among health care providers – to health care cost containment, Chapter 224 of the Acts of 2012 gave the Health Policy Commission (HPC) a number of important tools to monitor the changing health care provider market-place. These tools include the creation of the Registration of Provider Organizations (RPO) program (see Sidebar:
“The Registration of Provider Organizations program”), the requirement that provider organizations file notices of material change (MCNs) with the HPC before engaging in significant market changes, and authority for the HPC to conduct cost and market impact reviews (CMIRs) of trans-actions anticipated to have a significant impact on health care spending or the competitive marketplace. Utilizing these tools and other data sources, this chapter summarizes the current state of and trends in the provider market in Massachusetts.
CURRENT STATE OF THE PROVIDER MARKET IN MASSACHUSETTS: Initial Data from the Registration of Provider Organizations ProgramThe Massachusetts provider market is characterized by hav-ing a relatively large number of both hospitals and physicians, with 57 general acute care hospitals and over 20,000 phy-sicians practicing across the Commonwealth. Providers are particularly concentrated in the eastern part of the state; for example, primary care physicians’ primary sites of prac-tice reported to the RPO program are more heavily concentrated in eastern Massachusetts (see Exhibit 3.1).
As noted in past reports, Massachusetts providers are pre-dominantly part of one of several large provider organizations. Nearly all of such systems include both acute care hospi-tals and physicians, many are anchored by large teaching hospitals or academic medical centers (AMCs), and several also include other types of direct providers of patient care services (e.g., non-acute hospitals and home health provid-ers). Through the RPO data, the HPC and the public now have access to far more robust and uniform data about the structure and functioning of these major provider organi-zations in Massachusetts.
Notes: Map shows only the primary care physicians associated with provider organizations required to report data to the RPO program, and thus may exclude some physicians who are part of smaller organizations which do not contract through any of the 60 organizations that report to the RPO program. Map also shows a primary care physician’s primary site of practice only; some areas may have access to more primary care physicians than it may appear on this map as some such physicians may operate secondary or tertiary sites in the area, but have primary sites of practice elsewhere.Source: HPC analysis of Registration of Provider Organizations data, 2015
Exhibit 3.1: Primary care physician primary sites of practice reported to the RPO program, 2015
1-910-2425-4647-8384-206
1-910-2425-4647-8384-206
3

24 | 2016 Cost Trends Report
Section II: Trends in Spending and the Delivery SystemII
Exhibit 3.2 provides a summary of some key features of these eight largest provider organizations in the Common-wealth, based on information collected through the RPO program in the first year of data collection. Together, these provider organizations account for 84.6 percent of all phy-sicians (primary care physicians and specialists) in the RPO dataset.
As shown in Exhibit 3.2, these systems vary across a num-ber of key features, including their direct employment of physicians, their geographic reach, and their organizational structure and corporate complexity. One particularly nota-ble area of variation between these systems is their patterns of employing (versus creating contracting affiliations with) their physician networks (see Exhibit 3.3).
Characteristic Partners Atrius Steward BIDCO Wellforce Lahey UMass Baystate
Tax-exempt status Yes Yes No No Yes Yes Yes Yes
Corporate affiliates 72 12 41 1 52 42 29 28
Contracting organizations/managed services organizations
5 0 2 1 4 6 1 3
Direct providers of patient care services
31 7 15 0 33 19 15 11
Acute hospital – main sites 8 0 8 0 2 4 5 5
Non-acute hospital – main sites 4 0 1 0 0 0 0 0
Contracting affiliates 12 0 160 15 15 1 0 185
Acute hospital – main sites 3 0 0 9 0 0 0 0
Physicians
Total6,721
(70.4% employed)
859 (80.1%
employed)
2,525 (31.7%
employed)
2,353 (0%
employed)
2,123 (46.6%
employed)
1,018 (69.4%
employed)
1,438 (72.5%
employed)
1,487 (46.4%
employed)
PCPs 1,188
(53.5% employed)
322 (100%
employed)
579 (38.2%
employed)
533 (0%
employed)
555 (32.6%
employed)
209 (80.9%
employed)
381 (63.5%
employed)
404 (34.2%
employed)
Specialists5,724
(73.5% employed)
537 (68.2%
employed)
2,044 (30.1%
employed)
1,898 (0%
employed)
1,644 (50.2%
employed)
838 (67.7%
employed)
1,096 (76.6%
employed)
1,101 (50.8%
employed)
Pediatricians 457 104 93 86 145 27 141 217
Unique primary site of practice zip codes 160 24 166 103 120 54 62 42
Exhibit 3.2: Summary data on the largest Massachusetts provider organizations, 2015
Source: HPC analysis of Registration of Provider Organizations data, 2015
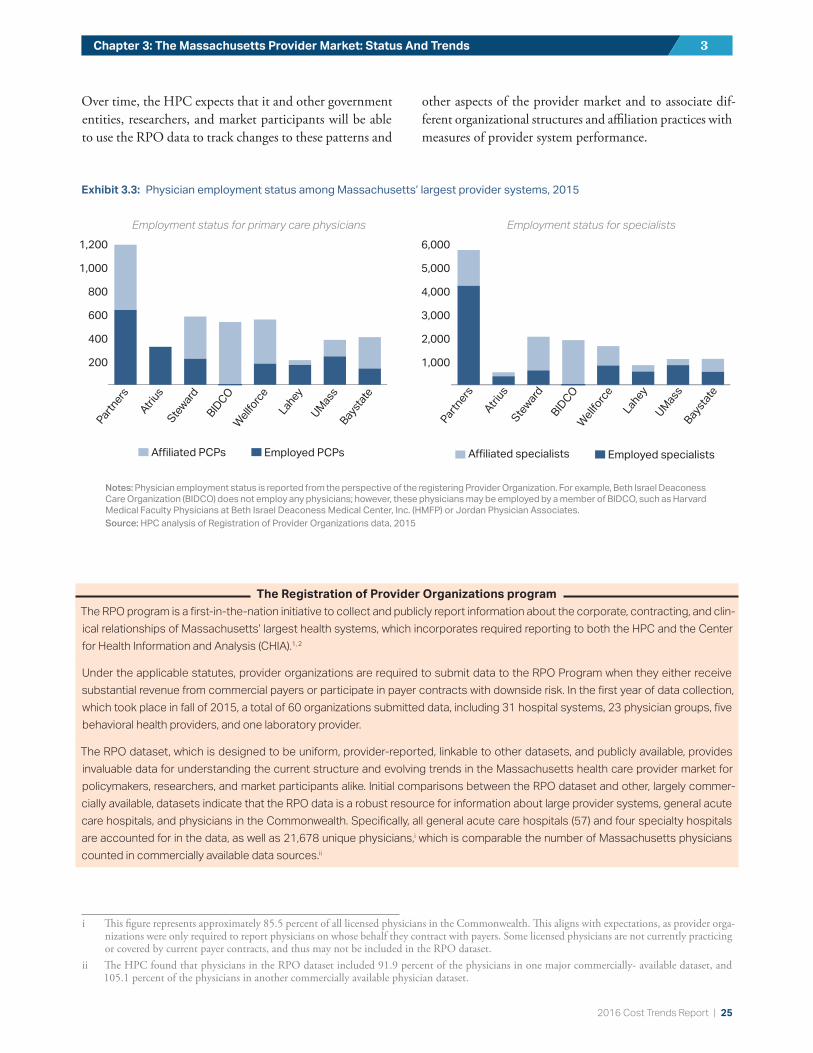
2016 Cost Trends Report | 25
Chapter 3: The Massachusetts Provider Market: Status And Trends 3
Over time, the HPC expects that it and other government entities, researchers, and market participants will be able to use the RPO data to track changes to these patterns and
other aspects of the provider market and to associate dif-ferent organizational structures and affiliation practices with measures of provider system performance.
The Registration of Provider Organizations programThe RPO program is a first-in-the-nation initiative to collect and publicly report information about the corporate, contracting, and clin-ical relationships of Massachusetts’ largest health systems, which incorporates required reporting to both the HPC and the Center for Health Information and Analysis (CHIA).1, 2
Under the applicable statutes, provider organizations are required to submit data to the RPO Program when they either receive substantial revenue from commercial payers or participate in payer contracts with downside risk. In the first year of data collection, which took place in fall of 2015, a total of 60 organizations submitted data, including 31 hospital systems, 23 physician groups, five behavioral health providers, and one laboratory provider.
The RPO dataset, which is designed to be uniform, provider-reported, linkable to other datasets, and publicly available, provides invaluable data for understanding the current structure and evolving trends in the Massachusetts health care provider market for policymakers, researchers, and market participants alike. Initial comparisons between the RPO dataset and other, largely commer-cially available, datasets indicate that the RPO data is a robust resource for information about large provider systems, general acute care hospitals, and physicians in the Commonwealth. Specifically, all general acute care hospitals (57) and four specialty hospitals are accounted for in the data, as well as 21,678 unique physicians,i which is comparable the number of Massachusetts physicians counted in commercially available data sources.ii
i This figure represents approximately 85.5 percent of all licensed physicians in the Commonwealth. This aligns with expectations, as provider orga-nizations were only required to report physicians on whose behalf they contract with payers. Some licensed physicians are not currently practicing or covered by current payer contracts, and thus may not be included in the RPO dataset.
ii The HPC found that physicians in the RPO dataset included 91.9 percent of the physicians in one major commercially- available dataset, and 105.1 percent of the physicians in another commercially available physician dataset.
Exhibit 3.3: Physician employment status among Massachusetts’ largest provider systems, 2015
Employment status for primary care physicians Employment status for specialists
A�liated PCPs
Employed PCPs
200
400
600
800
1,000
1,200
Bays
tate
UM
ass
Lahey
Wellf
orce
BID
CO
Ste
ward
Atr
ius
Partners
A�liated specialists
Employed specialists
1,000
2,000
3,000
4,000
5,000
6,000
Baysta
te
UM
ass
Lahey
Wellf
orce
BID
CO
Ste
ward
Atr
ius
Partners
A�liated PCPs
Employed PCPs
200
400
600
800
1,000
1,200
Bays
tate
UM
ass
Lahey
Wellf
orce
BID
CO
Ste
ward
Atr
ius
Partners
A�liated PCPs
Employed PCPs
200
400
600
800
1,000
1,200
Bays
tate
UM
ass
Lahey
Wellf
orce
BID
CO
Ste
ward
Atr
ius
Partners
A�liated specialists
Employed specialists
1,000
2,000
3,000
4,000
5,000
6,000
Baysta
te
UM
ass
Lahey
Wellf
orce
BID
CO
Ste
ward
Atr
ius
Partners
A�liated specialists
Employed specialists
1,000
2,000
3,000
4,000
5,000
6,000
Baysta
te
UM
ass
Lahey
Wellf
orce
BID
CO
Ste
ward
Atr
ius
Partners
Notes: Physician employment status is reported from the perspective of the registering Provider Organization. For example, Beth Israel Deaconess Care Organization (BIDCO) does not employ any physicians; however, these physicians may be employed by a member of BIDCO, such as Harvard Medical Faculty Physicians at Beth Israel Deaconess Medical Center, Inc. (HMFP) or Jordan Physician Associates.Source: HPC analysis of Registration of Provider Organizations data, 2015

26 | 2016 Cost Trends Report
Section II: Trends in Spending and the Delivery SystemII
KEY PROVIDER MARKET TRENDSContinued Market ConsolidationOne of the key provider market trends that the HPC has highlighted in past Cost Trends Reports is the rapid pace of new provider alignments. The HPC tracks the frequency, type, and nature of these new provider system alignments in the Commonwealth and assesses their potential impact on health care spending, quality, and access through the filing of MCNs. The HPC also engages in a more comprehensive review of particular transactions anticipated to have a sig-nificant impact on health care costs or market functioning through its CMIRs. Through this work over the past year, the HPC found that the trend of provider market consol-idation in Massachusetts is continuing.
From 2013 through December 2016, the HPC received notice of 72 proposed mergers, acquisitions, and affiliations. These notices reveal a rapidly changing health care market-place, with transactions involving physician contracting or corporate affiliations being particularly common (see Exhibit 3.4).
The HPC has also observed that providers are participating in a wide range of different types of transactions, including corporate acquisitions, affiliations between providers for joint contracting, creation of clinical joint ventures, forma-tion of new contracting entities like accountable care organizations (ACOs), and establishment of new
preferred provider arrangements and other clinical affilia-tions (see Exhibit 3.5).iii
Through 2016, nearly half of the transactions (33 of 72) noticed to the HPC involved corporate affiliations, includ-ing mergers and acquisitions between acute care hospitals, physician groups, rehabilitation providers, and visiting nurse associations, as well as one transaction involving a provider organization and a payer. The HPC has also ob-served significant and increasing alignment of both hospitals and physicians through contracting and clinical affiliations, including through the formation and growth of new con-tracting entities like ACOs.
As a result of these and other changes to the health care system over the last several decades, the majority of care in the Commonwealth is now provided by a relatively small number of large provider systems. In 2015, the five largest health systems in the state accounted for 59.9 percent of hospital discharges for commercially insured patients, an increase from 54.6 percent in 2012. However, some of the consolidation of inpatient care into these largest systems appears to have stabilized, or even slightly decreased, from 2014 to 2015 (see Exhibit 3.6).
iii The HPC defines a clinical affiliation in its Final MCN and CMIR Regulation, 958 CMR 7.02, as any relationship between a Provider or Provider Organization and another organization for the purpose of increasing the level of collaboration in the provision of Health Care Services, including, but not limited to, sharing of physician resources in hospital or other ambulatory settings, co-branding, expedited transfers to advanced care settings, provision of inpatient consultation coverage or call coverage, enhanced electronic access and communication, co-located services, provision of capital for service site development, joint training programs, video technology to increase access to expert resources and sharing of hospitalists or intensivists.
Exhibit 3.4: Frequency of providers involved in Material Change Notices consisting of corporate or contracting affiliations, 2013-2016
Source: HPC analysis of Notice of Material Change data, 2013-2016
PayerOther Provider
Acute Hospital
Physician Group
29
20
6
1
Source: HPC analysis of Notice of Material Change data, 2013-2016
33
17
9 85
Formation of contracting entity
Joint venture
Contracting a liation
Clinical a liation
Corporate a liation
Exhibit 3.5: Frequency of provider alignment types for which the HPC received Material Change Notices, 2013-2016

2016 Cost Trends Report | 27
Chapter 3: The Massachusetts Provider Market: Status And Trends 3
The physician market has also seen a significant increase in consolidation in recent years. For example, the HPC found that the share of primary care physicians associated with the eight largest provider systems in Massachusetts grew from 62 percent to 76 percent from 2008 to 2014.3 Available data does not suggest that consolidation in the physician market is slowing. Through 2016, 40 percent of all transactions (29 of 72) reviewed by the HPC have involved physician group acquisitions or contracting affiliations, and almost all of these transactions have increased market concentration for physician services.
Although provider alignments may take a range of forms and may promote more patient-centered, accountable care, many such alignments involve acquisitions and contracting affiliations that can increase overall market concentration. Evidence suggests that increases in market concentration are not typically associated with increased quality of care, and there is strong consensus that hospital mergers lead to higher prices in the vast majority of cases.4, 5, 6 ,7 HPC analysis of the impact of some non-corporate affiliations, including contracting affiliations, has found that even alignments that do not involve corporate acquisition may increase the affil-iating providers’ ability to leverage higher prices and other favorable contract terms.8 In addition, physician contracting and corporate alignments can result in immediate price increases when a physician group joins a provider network that has higher contracted rates,9 and early evidence on the impact of acquisitions of physician practices by hospitals
suggests that such affiliations often lead to higher total spending as the affiliated physicians shift their referrals away from low cost, high quality hospitals and towards the acquiring hospital.10
In examining the impact of provider market consolidation in the Commonwealth, the HPC also found that hospitals with higher market shares and those with certain large sys-tem affiliations tend to have higher inpatient prices that are not tied to increased quality (see Unwarranted Varia-tion in Provider Prices below).11 As discussed in Chapter 5:
“Hospital Utilization,” the HPC has also found that a large and increasing share of patients are being treated at AMCs or teaching hospitals for conditions that could be appropriately treated at lower cost providers, such as com-munity hospitals. In many cases, these patients are referred to AMCs or teaching hospitals for routine care by their primary care physicians, a large and increasing majority of whom are affiliated with the dominant health systems anchored by the AMCs or teaching hospitals to which they are referring. This movement of patients to higher-acuity settings is a consequence of provider consolidation and can significantly increase health care spending.
Despite these findings regarding the negative consequences of market consolidation to date, the HPC has seen some positive trends since the MCN process began in 2013. For example, an increasing number of notices have more robustly described efficiency goals, concrete action plans, and investment strategies to foster high quality, lower-cost, and coordinated care, and an increasing number of notices have included commitments to maintain or increase access to care for underserved populations. The HPC remains hopeful that proposed provider affiliations will increasing-ly include robust plans to improve quality and efficiency without increasing spending (e.g., through higher prices or inefficient referral patterns) that, over time, will show measurable results.
Unwarranted Variation in Provider PricesAs part of the 2015 Cost Trends Report, the HPC reported on the issue of variation in hospital and physician group prices in Massachusetts. The HPC found that, consistent with the work of CHIA and that of the Attorney General’s Office (AGO), extensive variation in provider prices has not diminished over time. The HPC also found that while some variation in pricing may support activities that are beneficial to the Commonwealth (e.g., provision of special-ized services or stand-by capacity), much of the variation in inpatient hospital prices is likely unwarranted and reflects
LaheyStewardUMassBIDCOPartners
10%
20%
30%
40%
50%
60%
70%
2015201420132012
28.5%
7.4% 7.4%
6.7%
6.6%
4.7%
11.1%
6.8%
6.0%
7.4%
10.5%
6.8%
6.1%
7.6%
7.1%
6.9%
4.7%
30.1% 29.6% 28.9%
54.6% 55.6%
60.9% 59.9%
Notes: Discharges include only Massachusetts residents. For additional exclusions, see Technical Appendix.Source: HPC analysis of Center for Health Information and Analysis Hospital Inpatient Discharge Database, 2015
Exhibit 3.6: Inpatient discharges from the top five networks, 2015
LaheyStewardUMassBIDCOPartners
10%
20%
30%
40%
50%
60%
70%
2015201420132012
28.5%
7.4% 7.4%
6.7%
6.6%
4.7%
11.1%
6.8%
6.0%
7.4%
10.5%
6.8%
6.1%
7.6%
7.1%
6.9%
4.7%
30.1% 29.6% 28.9%
54.6% 55.6%
60.9% 59.9%
LaheyStewardUMassBIDCOPartners
10%
20%
30%
40%
50%
60%
70%
2015201420132012
28.5%
7.4% 7.4%
6.7%
6.6%
4.7%
11.1%
6.8%
6.0%
7.4%
10.5%
6.8%
6.1%
7.6%
7.1%
6.9%
4.7%
30.1% 29.6% 28.9%
54.6% 55.6%
60.9% 59.9%
LaheyStewardUMassBIDCOPartners
10%
20%
30%
40%
50%
60%
70%
2015201420132012
28.5%
7.4% 7.4%
6.7%
6.6%
4.7%
11.1%
6.8%
6.0%
7.4%
10.5%
6.8%
6.1%
7.6%
7.1%
6.9%
4.7%
30.1% 29.6% 28.9%
54.6% 55.6%
60.9% 59.9%

28 | 2016 Cost Trends Report
Section II: Trends in Spending and the Delivery SystemII
the leverage of certain providers to negotiate higher prices with commercial insurers. We also found that unwarranted and extensive variation in prices, combined with the large share of patient volume at higher-priced providers, drives increased health care spending and creates inequities in the distribution of health care resources that threaten the viability of lower-priced, high-quality providers.12
In order to inform potential state action to address unwar-ranted price variation, the HPC conducted additional research and analysis and convened stakeholders throughout the spring of 2016 to discuss specific, data-driven policy options. Over three meetings, stakeholders discussed po-tential solutions organized around three main themes: demand-side incentives, supply-side incentives, and direct limits on variation.13
In June 2016, the Massachusetts legislature passed, and the Governor signed, Chapter 115 of the Acts of 2016. Chapter 115 allocated funds to support hospitals, including $45 million to be distributed over five years to hospitals with relative price at or below 120 percent of the statewide
median through a Community Hospital Reinvestment Trust Fund distributed by the Secretary of the Executive Office of Health and Human Services. Chapter 115 also established a special commission to review variation in prices among providers, to be co-chaired by the House and Senate Chairs of the Joint Committee on Health Care Financing. The HPC and CHIA were charged to provide relevant data and analysis necessary for the commission’s work. The special commission began holding regular meetings in September 2016 and is required to submit any recommendations for legislative action by March 15, 2017.
In support of the special commission’s work, the HPC conducted new analyses. First, the HPC examined the re-lationship between hospitals’ commercial inpatient relative price for a given commercial payer and hospitals’ overall net inpatient revenue per discharge across all payers, including supplemental payments from the MassHealth program, ad-justed for patient acuity. As shown in Exhibit 3.7 for one major payer, we found that the commercial price level and overall revenue per discharge across all payers are highly
0.0 0.2 0.4 0.6 0.8 1.0 1.2 1.4 1.6 1.8 2.0 2.20.0
0.2
0.4
0.6
0.8
1.0
1.2
1.4
1.6
1.8
2.0
2.2
Hospitals with below-average relative price, but above-average revenue per discharge
Hospitals with above-average relative price, but above-average revenue per discharge
Hospitals with below-average relative price, but below-average revenue per discharge
Hospitals with above-average relative price, but below-average revenue per discharge
Martha’s Vineyard
HarringtonMarlborough
MEEI
AtholCHA
BMCBaptist
Fairview
Children’s
NWH
Brigham
MetroWest
NSH
Lahey
Winchester
MGHDana Farber
Inpatient Relative Price (THP)
Inp
ati
en
t N
PS
R/C
MA
D (
no
rma
liz
ed
)
Correlation: 0.6258
R2=0.3916
Notes: NPSR = net patient service revenue; CMAD = case mix adjusted discharge; THP= Tufts Health Plan.Source: HPC analysis of Center for Health Information and Analysis Relative Price Data, 2014 and Acute Hospital Data Appendix, 2014
Exhibit 3.7: Inpatient relative price for one major commercial payer compared to inpatient net patient service revenue per case-mix-adjusted discharge across all payers, 2014

2016 Cost Trends Report | 29
Chapter 3: The Massachusetts Provider Market: Status And Trends 3
correlated, with a few outliers. The notable outliers include several hospitals that are paid differently by Medicare and/or Medicaid (e.g., critical access hospitals and those that re-ceive supplemental payments from the Medicaid program).
These findings suggest that in general, commercial relative price is strongly associated with the overall level of resources available to hospitals. It also highlights that for most hospi-tals, higher rates from commercial payers are not off-setting lower rates from public payers or vice versa. Rather, a hos-pital with higher commercial rates tends to also have higher overall revenue across all payers, and a hospital with lower commercial rates may be doubly disadvantaged financially by also having lower overall revenue across all payers.
The HPC also examined provider price variation in the MassHealth Managed Care Organization (MCO) market to supplement the well-documented issue of variation in commercial prices paid to providers. The most recent data demonstrates significant variation in inpatient prices paid by MCOs. As shown in Exhibit 3.8, as of 2014, the high-est-priced hospitals received anywhere from three to nearly eight times the prices of the lowest-priced hospitals.
Recent policy changes aim to reduce this variation in the MassHealth MCO market. For example, under its current contracts with MCOs, MassHealth generally prohibits MCOs from contracting to pay acute care hospitals more than 105 percent of MassHealth fee-for-service rates. If an MCO does contract to pay a higher rate, the MCO must explain its reasons to MassHealth. In addition, as described in the Sidebar: “Update on out-of-network billing is-sues,” in 2017, MassHealth requires hospitals outside an MCO’s network to accept the hospital’s MassHealth fee-for-service rate for both emergency and non-emergency services, unless otherwise negotiated (a similar policy for emergency services has already been in place in 2016).14 In the absence of limits on out-of-network charges such as these, some providers may have the leverage to demand higher rates from payers. If payers exclude that provider from their network, but members nonetheless seek care at the out-of-network provider, the out-of-network provider can demand reimbursement at the charge rates for their out-of-network patients, which are generally far higher than a negotiated rate would be. MassHealth’s policies may have the effect of reducing higher rates paid to some hospitals,
Exhibit 3.8: Hospital inpatient relative prices in Medicaid Managed Care Organization networks, 2014
Source: HPC analysis of Center for Health Information Relative Price Data, 2014
0.4 0.6 0.8 1.0 1.2 1.4 1.6 1.8 2.0 2.2 2.4 2.6 2.8 3.0 3.2 3.4 3.6 3.8
BMC HealthNet
Celticare
Fallon
NHP
Tufts
Relative Price

30 | 2016 Cost Trends Report
Section II: Trends in Spending and the Delivery SystemII
thereby reducing price variation. The HPC will continue to monitor price variation in MCO networks and work to understand any effects from these or other policy changes.
Market Entry and Expansion of Urgent Care CentersWhile much of the HPC’s provider market work has focused on increasing the transparency of the market and mitigating the negative impacts of provider consolidation, the HPC also engages in activities to support a more competitive health care marketplace, such as monitoring innovation and the entry of new market competitors. One important new trend
is that the HPC is monitoring is the entrance of urgent care centers and retail clinics into the health care market.
Since 2008, the number of urgent care centers and retail clinics in Massachusetts has increased dramatically, though growth of retail clinics appears to have leveled off in recent years. As shown in Exhibit 3.9, since 2008, the number of retail clinics grew from 11 locations to 56, while the number of urgent care centers grew from six locations to 90. The majority (88 percent) of urgent care centers are independently owned, with 8 percent owned by physician groups and 3 percent owned by hospitals. Of these inde-pendently owned urgent care centers, 43 percent are owned
Update on out-of-network billing issuesOut-of-network billing continues to be a policy area of interest for the HPC. As outlined in the 2015 Cost Trends Report and the HPC’s Policy Brief on Out-of-Network Billing, out-of-network billing issues can have significant consequences for consumers and the func-tioning of the health care market overall. There are two key situations in which a patient may receive out-of-network care when they did not or could not intentionally choose the provider: (1) emergency care; and (2) when a patient seeks care at an in-network facility or from an in-network provider, but during the course of treatment, the patient is unexpectedly treated by an out-of-network provider (e.g., an anesthesiologist). Such circumstances can result in the patient receiving a balance bill or a “surprise bill,” which can be for a substantial amount.iv In addition to the potential impact on consumers, the absence of balance billing prohibitions and limits on what out-of-network providers may charge for emergency care may also affect provider-insurer negotiations and potentially impact price variation and overall spending.15
Massachusetts policymakers are engaged in this topic. As outlined in the reports cited above, the HPC has made recommendations to the Legislature to augment existing protections around out-of-network billing, which include requiring insurers to hold their members harmless in cases of emergency out-of-network services and prohibiting balance billing, increasing consumer awareness of existing surprise billing protections, and establishing a maximum reasonable price for out-of-network services.16
Efforts to address out-of-network billing issues continue to gain momentum around the nation. In 2016, new laws in Florida and Cal-ifornia establish additional out-of-network billing protections with bipartisan support. California’s comprehensive approach extends balance billing protections to non-emergency care, establishes a default payment rate for out-of-network providers, and institutes a binding dispute resolution process.17 Several other states are engaged in more preliminary efforts to address out-of-network billing issues (e.g., Washington, Pennsylvania).
New research further supports action on this issue. National data estimates that of the 99 percent of emergency department (ED) visits that occurred at in-network hospitals, 22 percent involve out-of-network physicians.18 Another national study on the likelihood of surprise bills in different scenarios suggests that 14 percent of outpatient visits to the ED in 2014 may have led to a surprise bill.19
The HPC conducted stakeholder listening sessions on out-of-network billing issues in 2016 at which stakeholders generally agreed that patients should be protected from emergency and surprise out-of-network bills, payers provided new data regarding the impact of out-of-network payments on total spending,v and stakeholders recognized the need to balance interests in determining provider payment levels. The HPC will continue to engage with stakeholders about these issues and will continue to support efforts to enhance out-of-network billing protections in the Commonwealth.
iv Balance billing refers to when a patient is billed for the difference between the insurer’s payment and the provider’s charges. Surprise billing refers to when a patient receives an unexpected bill from an out-of-network provider after seeking and receiving care at an in-network facility.
v For example, one payer said that out-of-network payments cost $134 million in 2014.
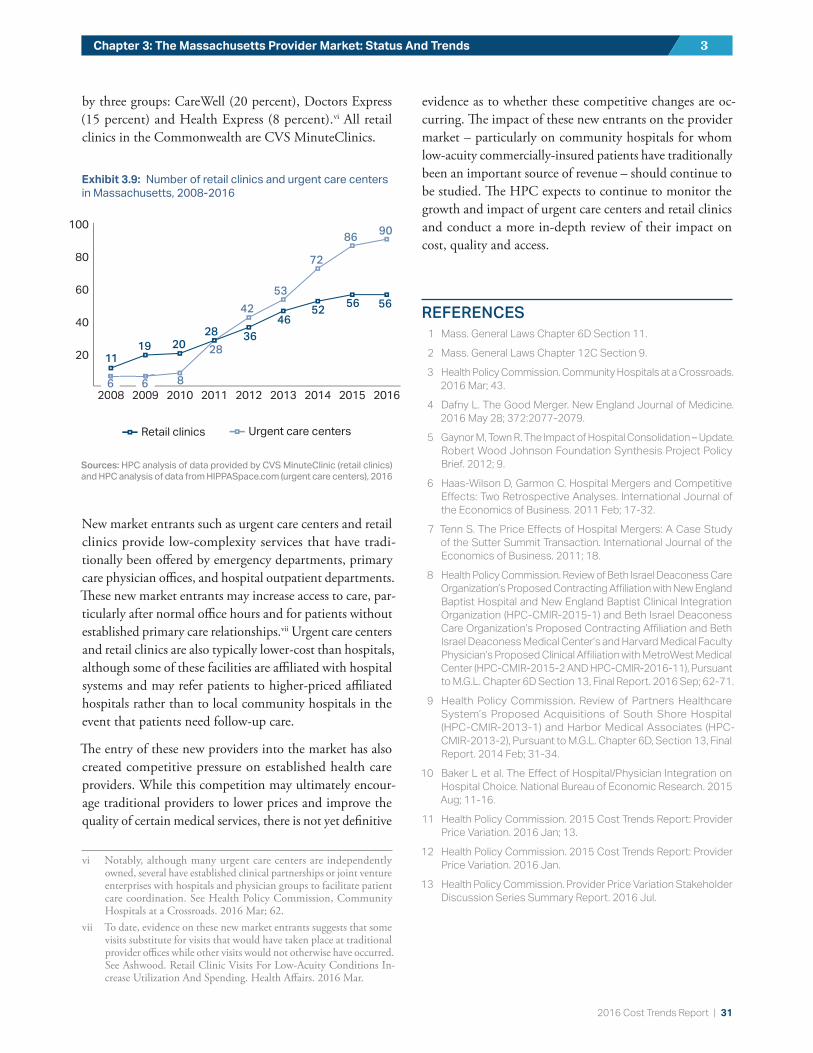
2016 Cost Trends Report | 31
Chapter 3: The Massachusetts Provider Market: Status And Trends 3
by three groups: CareWell (20 percent), Doctors Express (15 percent) and Health Express (8 percent).vi All retail clinics in the Commonwealth are CVS MinuteClinics.
New market entrants such as urgent care centers and retail clinics provide low-complexity services that have tradi-tionally been offered by emergency departments, primary care physician offices, and hospital outpatient departments. These new market entrants may increase access to care, par-ticularly after normal office hours and for patients without established primary care relationships.vii Urgent care centers and retail clinics are also typically lower-cost than hospitals, although some of these facilities are affiliated with hospital systems and may refer patients to higher-priced affiliated hospitals rather than to local community hospitals in the event that patients need follow-up care.
The entry of these new providers into the market has also created competitive pressure on established health care providers. While this competition may ultimately encour-age traditional providers to lower prices and improve the quality of certain medical services, there is not yet definitive
vi Notably, although many urgent care centers are independently owned, several have established clinical partnerships or joint venture enterprises with hospitals and physician groups to facilitate patient care coordination. See Health Policy Commission, Community Hospitals at a Crossroads. 2016 Mar; 62.
vii To date, evidence on these new market entrants suggests that some visits substitute for visits that would have taken place at traditional provider offices while other visits would not otherwise have occurred. See Ashwood. Retail Clinic Visits For Low-Acuity Conditions In-crease Utilization And Spending. Health Affairs. 2016 Mar.
evidence as to whether these competitive changes are oc-curring. The impact of these new entrants on the provider market – particularly on community hospitals for whom low-acuity commercially-insured patients have traditionally been an important source of revenue – should continue to be studied. The HPC expects to continue to monitor the growth and impact of urgent care centers and retail clinics and conduct a more in-depth review of their impact on cost, quality and access.
REFERENCES1 Mass. General Laws Chapter 6D Section 11.
2 Mass. General Laws Chapter 12C Section 9.
3 Health Policy Commission. Community Hospitals at a Crossroads. 2016 Mar; 43.
4 Dafny L. The Good Merger. New England Journal of Medicine. 2016 May 28; 372:2077-2079.
5 Gaynor M, Town R. The Impact of Hospital Consolidation – Update. Robert Wood Johnson Foundation Synthesis Project Policy Brief. 2012; 9.
6 Haas-Wilson D, Garmon C. Hospital Mergers and Competitive Effects: Two Retrospective Analyses. International Journal of the Economics of Business. 2011 Feb; 17-32.
7 Tenn S. The Price Effects of Hospital Mergers: A Case Study of the Sutter Summit Transaction. International Journal of the Economics of Business. 2011; 18.
8 Health Policy Commission. Review of Beth Israel Deaconess Care Organization’s Proposed Contracting Affiliation with New England Baptist Hospital and New England Baptist Clinical Integration Organization (HPC-CMIR-2015-1) and Beth Israel Deaconess Care Organization’s Proposed Contracting Affiliation and Beth Israel Deaconess Medical Center’s and Harvard Medical Faculty Physician’s Proposed Clinical Affiliation with MetroWest Medical Center (HPC-CMIR-2015-2 AND HPC-CMIR-2016-11), Pursuant to M.G.L. Chapter 6D Section 13, Final Report. 2016 Sep; 62-71.
9 Health Policy Commission. Review of Partners Healthcare System’s Proposed Acquisitions of South Shore Hospital (HPC-CMIR-2013-1) and Harbor Medical Associates (HPC-CMIR-2013-2), Pursuant to M.G.L. Chapter 6D, Section 13, Final Report. 2014 Feb; 31-34.
10 Baker L et al. The Effect of Hospital/Physician Integration on Hospital Choice. National Bureau of Economic Research. 2015 Aug; 11-16.
11 Health Policy Commission. 2015 Cost Trends Report: Provider Price Variation. 2016 Jan; 13.
12 Health Policy Commission. 2015 Cost Trends Report: Provider Price Variation. 2016 Jan.
13 Health Policy Commission. Provider Price Variation Stakeholder Discussion Series Summary Report. 2016 Jul.
20
40
60
80
100
201620152014201320122011201020092008
Retail clinics Urgent care centers
11
20086
20096 8
28
42
53
72
8690
19 2028 36
4652
56 56
20
40
60
80
100
201620152014201320122011201020092008
Retail clinics Urgent care centers
11
20086
20096 8
28
42
53
72
8690
19 2028 36
4652
56 56
Exhibit 3.9: Number of retail clinics and urgent care centers in Massachusetts, 2008-2016
Sources: HPC analysis of data provided by CVS MinuteClinic (retail clinics) and HPC analysis of data from HIPPASpace.com (urgent care centers), 2016
32 | 2016 Cost Trends Report
Section II: Trends in Spending and the Delivery SystemII
14 Mass. Executive Office of Health and Human Services, Office of Medicaid. Notice of Final Agency Action: MassHealth: Payment for In-State Acute Hospital Services and Out-of-State Acute Hospital Services, effective October 1, 2016. 2016; 27 . Available from: http://www.mass.gov/eohhs/docs/masshealth/acutehosp/notice-of-final-agency-action-mh-payment-in-state-out-of-state-acute-hospital-services-effective-october-1.pdf.
15 Health Policy Commission. Policy Brief on Out-of-Network Billing. 2016; 4.
16 Health Policy Commission. Policy Brief on Out-of-Network Billing. 2016; 8.
17 California Health and Safety Code Section 1371.9 (in-network cost-sharing limit), Section 1371.31 (out-of-network provider payment determination), and Section 1371.30 (dispute reso-lution process).
18 Cooper Z, Morton F. Out-of-Network Emergency-Physician Bills – An Unwelcome Surprise. New England Journal of Medicine. 2016; 375:1915-18.
19 Garmon C, Chartock B. One in Five Inpatient Emergency Depart-ment Cases May Lead to Surprise Bills. Health Affairs. 2017; 36(1).

2016 Cost Trends Report | 33
PRESCRIPTION DRUG SPENDINGSection II: Trends in Spending and the Delivery System
For the second year in a row, prescription drug spending exceeded historical growth rates in Massachusetts and the U.S., ensuring that drug spending will remain an area of focus for health care cost containment at both the state and federal level in the immediate future.
This chapter focuses on trends in prescription drug spending, including estimates of growth net of rebates, drivers of drug spending growth, trends in consumer out-of-pocket spend-ing, outlook for future spending trends, and discussion of policy efforts to contain drug spending.
TRENDS IN SPENDING GROWTHPrescription drug spending in Massachu-setts grew 10.2 percent in 2015, following 13.5 percent growth in 2014, to $8.1 bil-lion or 14.1 percent of total health care expenditures (THCE). This growth ac-counted for one third of the per capita growth in THCE in 2015.1
In the commercial market, Massachusetts’ total medical expenditures (TME) for pre-scription drugs grew 8.8 percent per capita in 2015. While this growth represents a decrease from the growth rate in 2014 (12.5
percent), prescription drug spending in 2015 exceeded growth in all other categories of service (see Exhibit 4.1). Notably, the THCE and TME drug figures capture spend-ing only for prescription drugs – those obtained through a pharmacy – and do not capture spending for drugs cov-ered under the medical benefit, emphasizing the need for greater tracking of drug spending in this area (see Sidebar:
“Medical benefit drug spending”).
Notes: TME = total medical expenses. Prescription drug figures exclude impact of rebates.Source: HPC analysis of Center for Health Information and Analysis 2016 Annual Report TME Databook
Exhibit 4.1: Growth in commercial spending categories and proportion of total medical expenses, 2013-2015
Change 2013-2014Change 2014-2015
OtherHospital inpatient
Prescription drugs (pharmacy)
Hospital outpatient
Professional physician
1.9%
27.2%
24.8%
17.2
%
17.1
%
13
.7%
1.9%2.9%
12.5%
1.3%2.2%
4.8%
-2.5%
8.8%
1.7%
Share of 2015 TME
4
Medical benefit drug spendingPrescription drug spending figures from the Center of Health Information and Analysis (CHIA) do not include spending for drugs cov-ered under the medical benefit. Medical drugs, such as chemotherapeutic agents and flu vaccine, are administered by providers, and paid for separately under a medical benefit rather than a prescription drug benefit. Medical benefit drug spending accounted for 4.0 percent of all commercial health care spending in the Massachusetts All-Payer Claims Database (APCD) in 2014. In contrast, prescrip-tion pharmacy drugs accounted for about 17 percent of all commercial health care spending. Therefore, including both prescription and medical drugs, drug spending now accounts for more than 20 percent of commercial spending in Massachusetts.
Between 2011 and 2014, medical benefit drug spending in commercial claims grew an average 5.7 percent annually. In addition to those covered by the pharmacy benefit, spending on medical benefit drugs should continue to be monitored.
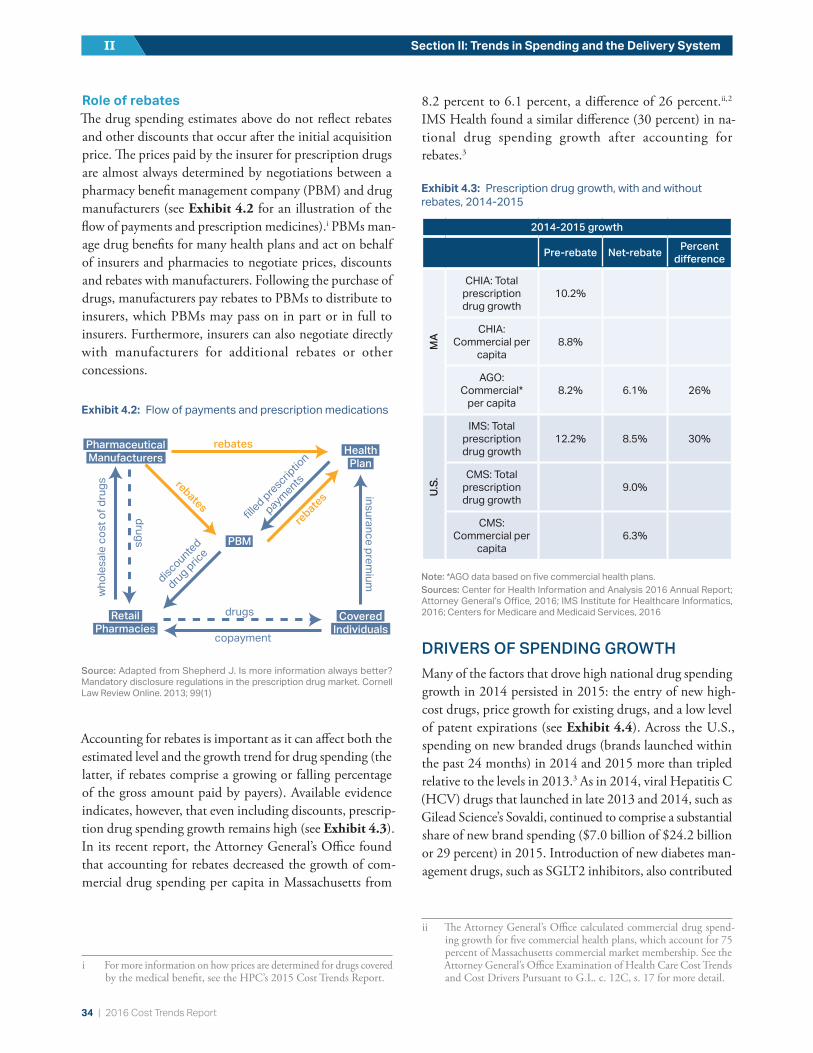
34 | 2016 Cost Trends Report
Section II: Trends in Spending and the Delivery SystemII
Role of rebatesThe drug spending estimates above do not reflect rebates and other discounts that occur after the initial acquisition price. The prices paid by the insurer for prescription drugs are almost always determined by negotiations between a pharmacy benefit management company (PBM) and drug manufacturers (see Exhibit 4.2 for an illustration of the flow of payments and prescription medicines).i PBMs man-age drug benefits for many health plans and act on behalf of insurers and pharmacies to negotiate prices, discounts and rebates with manufacturers. Following the purchase of drugs, manufacturers pay rebates to PBMs to distribute to insurers, which PBMs may pass on in part or in full to insurers. Furthermore, insurers can also negotiate directly with manufacturers for additional rebates or other concessions.
Accounting for rebates is important as it can affect both the estimated level and the growth trend for drug spending (the latter, if rebates comprise a growing or falling percentage of the gross amount paid by payers). Available evidence indicates, however, that even including discounts, prescrip-tion drug spending growth remains high (see Exhibit 4.3). In its recent report, the Attorney General’s Office found that accounting for rebates decreased the growth of com-mercial drug spending per capita in Massachusetts from
i For more information on how prices are determined for drugs covered by the medical benefit, see the HPC’s 2015 Cost Trends Report.
8.2 percent to 6.1 percent, a difference of 26 percent.ii, 2 IMS Health found a similar difference (30 percent) in na-tional drug spending growth after accounting for rebates.3
DRIVERS OF SPENDING GROWTHMany of the factors that drove high national drug spending growth in 2014 persisted in 2015: the entry of new high-cost drugs, price growth for existing drugs, and a low level of patent expirations (see Exhibit 4.4). Across the U.S., spending on new branded drugs (brands launched within the past 24 months) in 2014 and 2015 more than tripled relative to the levels in 2013.3 As in 2014, viral Hepatitis C (HCV) drugs that launched in late 2013 and 2014, such as Gilead Science’s Sovaldi, continued to comprise a substantial share of new brand spending ($7.0 billion of $24.2 billion or 29 percent) in 2015. Introduction of new diabetes man-agement drugs, such as SGLT2 inhibitors, also contributed
ii The Attorney General’s Office calculated commercial drug spend-ing growth for five commercial health plans, which account for 75 percent of Massachusetts commercial market membership. See the Attorney General’s Office Examination of Health Care Cost Trends and Cost Drivers Pursuant to G.L. c. 12C, s. 17 for more detail.
Exhibit 4.2: Flow of payments and prescription medications
Source: Adapted from Shepherd J. Is more information always better? Mandatory disclosure regulations in the prescription drug market. Cornell Law Review Online. 2013; 99(1)
PBM
Health
Plan
Covered
Individuals
Retail
Pharmacies
Pharmaceutical Manufacturers
rebates
rebates
rebate
s insurance premium
who
lesa
le c
ost o
f dru
gs
�lled prescrip
tion
payments
discounted
drug price
drugs
drugs
copayment
2014-2015 growth
Pre-rebate Net-rebate Percent difference
MA
CHIA: Total prescription drug growth
10.2%
CHIA: Commercial per
capita 8.8%
AGO: Commercial*
per capita8.2% 6.1% 26%
U.S.
IMS: Total prescription drug growth
12.2% 8.5% 30%
CMS: Total prescription drug growth
9.0%
CMS: Commercial per
capita 6.3%
Note: *AGO data based on five commercial health plans.Sources: Center for Health Information and Analysis 2016 Annual Report; Attorney General’s Office, 2016; IMS Institute for Healthcare Informatics, 2016; Centers for Medicare and Medicaid Services, 2016
Exhibit 4.3: Prescription drug growth, with and without rebates, 2014-2015

2016 Cost Trends Report | 35
Chapter 4: Prescription Drug Spending 4
to new brand spending growth in 2015 ($4.6 billion). In addition, increased volume (utilization) of existing drugs contributed slightly to the growth in national drug spending in 2015 for the first time since 2007. Growth of spending on branded drugs that have been on the market for over 24 months continued to contribute to drug spending growth in 2015, although rebates and discounts on these drugs moderated the effect. Savings from expiration of patents for branded drugs, which dropped to historically low levels in 2014, grew only slightly in 2015.
DRUG SPENDING AND COST SHARING IN MASSACHUSETTSTo further explore trends in total spending and out-of-pock-et spending on prescription drugs in the Commonwealth, the HPC analyzed data from the APCD between 2012 and 2014. This analysis showed that average annual spending on prescription drugs for those with commercial prescrip-tion drug coverage in Massachusetts increased on average about 9 percent per year from 2012 to 2014, from $876 per member in 2012 to $1,044 in 2014, regardless of whether the member used that coverage.iii , iv For those who used their iii Average spending is defined as the allowed amount, or the amount
recorded in the claims paid by the insurer and the patient.iv Among commercial members, 80 percent have the pharmacy ben-
efit included in their coverage. Approximately 70 percent of these members use their pharmacy benefit at least once within a calendar year (referred to here as “users” of prescription drug coverage). The remaining 30 percent of members defined as non-users do not have any pharmacy claims in the APCD within the year. These numbers include non-users of the pharmacy benefit.
prescription drug coverage at least once in the calendar year, average spending also increased about 9 percent per year, from $1,177 in 2012 to $1,402 in 2014 (see bottom table in Exhibit 4.5).
Average spending for both generics and branded drugs in-creased between 2012 and 2014 (see Exhibit 4.5). While panelists at the 2015 and 2016 Cost Trends Hearings noted substantial increases in prices for certain generic drugs, av-erage spending per claim for generic drugs has risen slowly, increasing just over $1 per claim in two years (a 2 percent average increase per year) to $31 per claim in 2014. In contrast, spending per branded drug claim grew an average 18 percent per year, increasing $126 over the two years to $447 per claim on a pre-rebate basis in 2014. Generic drugs grew from 82 percent of claims in 2012 to 84 percent in 2014, yet have accounted for an increasingly smaller share of prescription drug spending over this time: from 30 percent of spending in 2012 to 27 percent in 2014.v Therefore, the increase in the proportion of generic prescriptions has not offset the increased spending from branded drugs. Under-scoring these findings, panelists at the 2016 Cost Trends Hearing raised concerns about reaching a “saturation point” for savings that can be gained through generic substitution of branded drugs.
v This may be driven by Mass. General Laws c. 112, s. 12D, which mandates that pharmacists substitute brand name drugs with generic drugs, unless otherwise indicated by the prescriber.
Note: Spending includes drugs provided in both pharmacy (prescription) and non-pharmacy (hospital and provider office) settings.Source: IMS Institute for Healthcare Informatics, Medicines Use and Spending in the U.S., 2016
Exhibit 4.4: Year to year changes in pharmaceutical spending by category (in billions of US$)

36 | 2016 Cost Trends Report
Section II: Trends in Spending and the Delivery SystemII
Out-of-pocket spending for prescription drugs averaged $198 per member per year (PMPY) in 2014, comprised of an average $117 PMPY for generic drugs and $81 PMPY for branded drugs. Despite the lower out-of-pocket cost per claim for generic drugs, spending over the course of the year was higher for generic drugs, as commercial members in the Commonwealth fill 5.4 times more generic prescriptions than branded prescriptions.
Whereas total drug spending increased between 2012 and 2014, average patient cost sharing for prescription drugs
decreased. Out-of-pocket spending per year decreased 9 per-cent from 2012 to 2014, from $219 PMPY to $198 PMPY. These trends in the Commonwealth mirror the U.S. trend, for which total out-of-pocket spending on prescription drugs has reached the lowest cost sharing amount since 2004.4 Despite this trend toward lower out-of-pocket spending, a small share of Commonwealth residents continues to have high cost sharing; for claims with over $50 in patient cost sharing, average cost sharing increased $10 in two years, from $98 in 2012 to $108 in 2014 (see Exhibit 4.6).
Generic drugs Branded drugs Total
Average spending per claim
Average cost sharing per claim
Average spending per claim
Average cost sharing per claim
Average spending per claim
Average cost sharing per claim
2012 $30 $11 $321 $36 $83 $15
2013 $30 $10 $358 $36 $85 $14
2014 $31 $10 $447 $36 $97 $14
Generic dugs Branded drugs Total
Average spending (PMPY)
Average cost sharing (PMPY)
Average spending (PMPY)
Average cost sharing (PMPY)
Average spending (PMPY)
Average cost sharing (PMPY)
2012 $349 $126 $829 $93 $1,178 $219
2013 $353 $118 $853 $85 $1,206 $203
2014 $384 $117 $1,018 $81 $1,402 $198
Notes: PMPY = per member per year. Data include privately insured individuals covered by Blue Cross Blue Shield of Massachusetts, Harvard Pilgrim Health Care, and Tufts Health Plan who use the prescription drug benefit at least once in the calendar year. Figures exclude impact of rebates.Source: HPC analysis of Massachusetts All-Payer Claims Database, 2012-2014
Exhibit 4.5: Average spending and cost sharing for branded and generic drugs, per claim and per member year, 2012-2014
2012 2013 2014
$50+$40-$50$30-$40$20-$30$10-$20$0-$10$0
2.2%
54.5%
24.7%
10.5%
1.7%4.4%
2.0% 1.7%3.6%
1.5%
8.8%8.7%
54.4%
21.3%Average cost sharing
for the highest spending bucket:
$98 $108
4x
Notes: Data include privately insured individuals covered by Blue Cross Blue Shield of Massachusetts, Harvard Pilgrim Health Care, and Tufts Health Plan who use the prescription drug benefit at least once in the calendar year. Figures exclude impact of rebates. Source: HPC analysis of Massachusetts All-Payer Claims Database, 2012-2014
Exhibit 4.6: Distribution of cost sharing, per claim, 2012-2014
2012 2013 2014
$50+$40-$50$30-$40$20-$30$10-$20$0-$10$0
2.2%
54.5%
24.7%
10.5%
1.7%4.4%
2.0% 1.7%3.6%
1.5%
8.8%8.7%
54.4%
21.3%Average cost sharing
for the highest spending bucket:
$98 $108
4x
2012 2013 2014
$50+$40-$50$30-$40$20-$30$10-$20$0-$10$0
2.2%
54.5%
24.7%
10.5%
1.7%4.4%
2.0% 1.7%3.6%
1.5%
8.8%8.7%
54.4%
21.3%Average cost sharing
for the highest spending bucket:
$98 $108
4x
2012 2013 2014
$50+$40-$50$30-$40$20-$30$10-$20$0-$10$0
2.2%
54.5%
24.7%
10.5%
1.7%4.4%
2.0% 1.7%3.6%
1.5%
8.8%8.7%
54.4%
21.3%Average cost sharing
for the highest spending bucket:
$98 $108
4x
+19% -9%
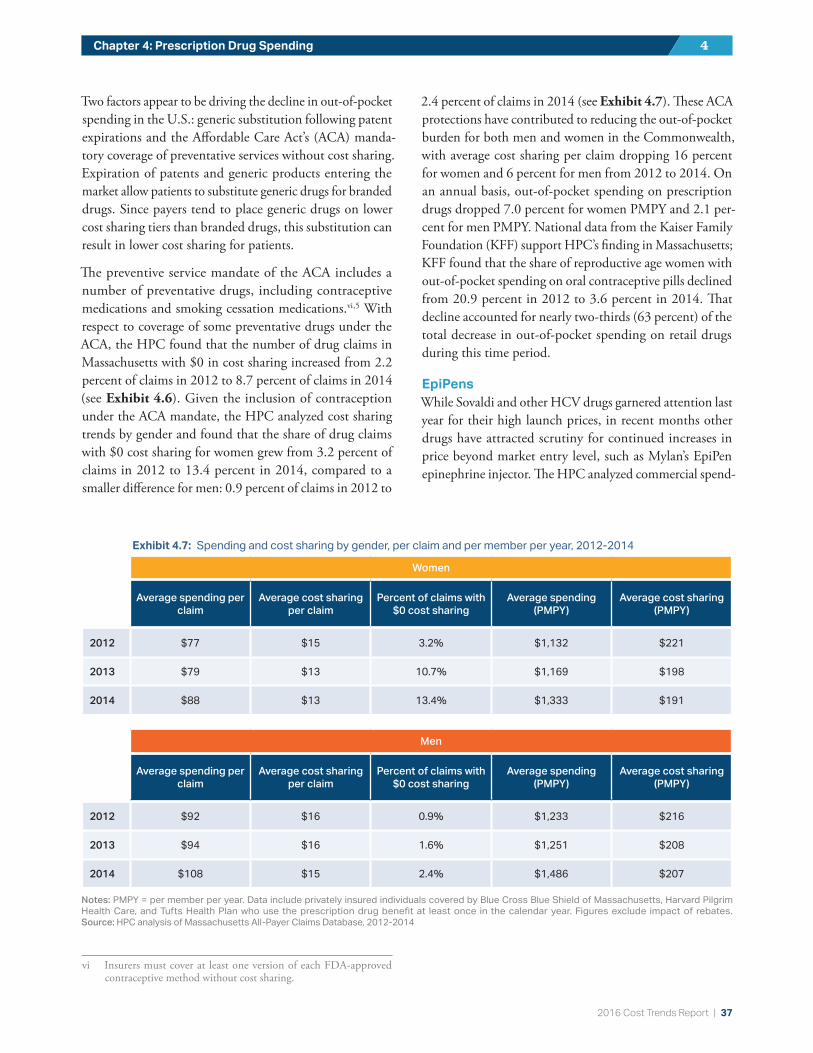
2016 Cost Trends Report | 37
Chapter 4: Prescription Drug Spending 4
Two factors appear to be driving the decline in out-of-pocket spending in the U.S.: generic substitution following patent expirations and the Affordable Care Act’s (ACA) manda-tory coverage of preventative services without cost sharing. Expiration of patents and generic products entering the market allow patients to substitute generic drugs for branded drugs. Since payers tend to place generic drugs on lower cost sharing tiers than branded drugs, this substitution can result in lower cost sharing for patients.
The preventive service mandate of the ACA includes a number of preventative drugs, including contraceptive medications and smoking cessation medications.vi , 5 With respect to coverage of some preventative drugs under the ACA, the HPC found that the number of drug claims in Massachusetts with $0 in cost sharing increased from 2.2 percent of claims in 2012 to 8.7 percent of claims in 2014 (see Exhibit 4.6). Given the inclusion of contraception under the ACA mandate, the HPC analyzed cost sharing trends by gender and found that the share of drug claims with $0 cost sharing for women grew from 3.2 percent of claims in 2012 to 13.4 percent in 2014, compared to a smaller difference for men: 0.9 percent of claims in 2012 to
vi Insurers must cover at least one version of each FDA-approved contraceptive method without cost sharing.
2.4 percent of claims in 2014 (see Exhibit 4.7). These ACA protections have contributed to reducing the out-of-pocket burden for both men and women in the Commonwealth, with average cost sharing per claim dropping 16 percent for women and 6 percent for men from 2012 to 2014. On an annual basis, out-of-pocket spending on prescription drugs dropped 7.0 percent for women PMPY and 2.1 per-cent for men PMPY. National data from the Kaiser Family Foundation (KFF) support HPC’s finding in Massachusetts; KFF found that the share of reproductive age women with out-of-pocket spending on oral contraceptive pills declined from 20.9 percent in 2012 to 3.6 percent in 2014. That decline accounted for nearly two-thirds (63 percent) of the total decrease in out-of-pocket spending on retail drugs during this time period.
EpiPensWhile Sovaldi and other HCV drugs garnered attention last year for their high launch prices, in recent months other drugs have attracted scrutiny for continued increases in price beyond market entry level, such as Mylan’s EpiPen epinephrine injector. The HPC analyzed commercial spend-
Women
Average spending per claim
Average cost sharing per claim
Percent of claims with $0 cost sharing
Average spending (PMPY)
Average cost sharing (PMPY)
2012 $77 $15 3.2% $1,132 $221
2013 $79 $13 10.7% $1,169 $198
2014 $88 $13 13.4% $1,333 $191
Men
Average spending per claim
Average cost sharing per claim
Percent of claims with $0 cost sharing
Average spending (PMPY)
Average cost sharing (PMPY)
2012 $92 $16 0.9% $1,233 $216
2013 $94 $16 1.6% $1,251 $208
2014 $108 $15 2.4% $1,486 $207
Notes: PMPY = per member per year. Data include privately insured individuals covered by Blue Cross Blue Shield of Massachusetts, Harvard Pilgrim Health Care, and Tufts Health Plan who use the prescription drug benefit at least once in the calendar year. Figures exclude impact of rebates. Source: HPC analysis of Massachusetts All-Payer Claims Database, 2012-2014
Exhibit 4.7: Spending and cost sharing by gender, per claim and per member per year, 2012-2014

38 | 2016 Cost Trends Report
Section II: Trends in Spending and the Delivery SystemII
ing and cost sharing for EpiPens between 2012 and 2014. Commercial spending on EpiPens in the Commonwealth jumped over $100 per claim in two years, from $244 per claim (which includes two injectors) in 2012 to $362 per claim in 2014, an average 22 percent increase per year (see Exhibit 4.8). These values are consistent with prices reported nationally, which reached over $600 in 2016.6 Average cost sharing, however, rose just over $2.50 in two years to $36.60 in 2014. These findings suggest that insurers are generally not shifting the cost increases to higher patient cost sharing for this drug, but ultimately, the drug price increase will result in higher premiums for all patients. Furthermore, a small portion of the Massachusetts commercial population pays much or all of Mylan’s EpiPen cost out-of-pocket. About three percent of EpiPen consumers in the APCD paid more than $100 out-of-pocket for an EpiPen in 2014, and more than one percent paid over $300. In 2014, some claims reached over $800 in out-of-pocket costs.
EXPECTATIONS FOR FUTURE SPENDINGEstimates suggest that high cost growth will continue, in the absence of policy changes; data from the first three quarters of 2016 show national drug spending grew 3.5 percent from the previous year.7 CMS’s National Health Expenditure (NHE) data continue to predict high single digit annual spending growth over the next decade (see 2015 Cost Trends Report for more detail on trends likely to influence future spending).8
DEVELOPING POLICY ISSUESSustained growth in drug spending has led states, along with payers and other stakeholders, to consider a number of policy options and initiatives. Although most drug ex-penditure patterns are driven by federal law, interventions are available to states. Recent activity at the state level is highlighted below.
Strategies for cost containmentThe HPC collected information on payers, hospitals and providers’ efforts to address prescription drug spending in written testimony for the 2016 Annual Cost Trends Hearing. Payers in the Commonwealth are already implementing many strategies, including: strengthening utilization man-agement and pre-authorization tools (11 out of 11 payers); adjusting cost sharing tiers and/or placement of certain drugs in specialty tiers (10/11); providing education and infor-mation to prescribers on drug and treatment alternatives, monitoring prescribing variation and conducting outreach, implementing medication adherence strategies and programs, and establishing alternative payment contracts that include accountability for pharmaceutical spending (8/11); and pur-suing exclusive contracts with pharmaceutical manufacturers (7/11). Fewer payers (3/11) are currently implementing value-based price benchmarks in their negotiations with drug manufacturers or shifting billing for specialty drugs from the medical benefit to the pharmacy benefit. Provid-ers in Massachusetts are making similar efforts to manage pharmaceutical spending and utilization responsibly, using many of the strategies listed above as well.vii
Risk-based contractsRisk-based contracting was highlighted in the 2015 Cost Trends Report as an opportunity for insurers to consider value in use of certain pharmaceuticals, such as negotiating price-volume or performance-based models with manu-facturers. During the 2016 Cost Trends Hearing, Harvard Pilgrim Health Care (HPHC) discussed its risk-based con-tract with Amgen for Repatha, a PCSK9 drug for cholesterol management. Under this arrangement, in exchange for ex-clusivity for Repatha in its formulary, HPHC will receive additional rebates if the drug fails to meet certain perfor-mance targets, or if spending on the drug exceeds a certain threshold, especially for use of the drug outside of the target patient population.9 HPHC discussed being in the process of developing more risk-based contracts.
vii The most commonly adopted included providing education and information to prescribers on drug and treatment alternatives and implementing medication adherence/compliance strategies, as well as alternative payment contracts and implementing internal “best practices.”
2012 2013 2014
Average cost sharing per claim
Average total spending per claim
$243.7
$309.3
$362.0
$34.1 $36.5 $36.6
49%
7%
Notes: An EpiPen claim includes two injectors. Data include commercially insured individuals covered by Blue Cross Blue Shield of Massachusetts, Harvard Pilgrim Health Care, and Tufts Health Plan who use the prescription drug benefit at least once in the calendar year. Total spending figure excludes impact of rebates. Source: HPC analysis of Massachusetts All-Payer Claims Database, 2012-2014
Exhibit 4.8: Average spending and cost sharing, per claim, on Mylan’s EpiPen epinephrine injector in Massachusetts, 2012-2014
2012 2013 2014
Average cost sharing per claim
Average total spending per claim
$243.7
$309.3
$362.0
$34.1 $36.5 $36.6
49%
7%

2016 Cost Trends Report | 39
Chapter 4: Prescription Drug Spending 4
One barrier to greater use of risk-based contracting is that rebates in the commercial sector can affect the price for which manufacturers provide drugs for Medicaid programs, under the Medicaid best-price regulations. These regulations specify that manufacturers must provide Medicaid with the largest rebate for branded drugs.viii Therefore, if a risk-based contract results in the largest rebate, the manufacturer must provide this same rebate to all state Medicaid programs. Opportunities to preserve this important protection for Medicaid while allowing for more innovation in value-based contracts among commercial and government payers should be examined at the state and federal level. Furthermore, risk-based contracting is aided by the use of value-based price benchmarks, which continue to be developed by groups such as the Institute for Clinical and Economic Review (ICER) and others.
State-level legislation Many states have responded to drug spending growth with proposed legislation to address various aspects of drug dis-tribution and pricing. In summer 2016, Vermont became the first state to pass drug price transparency legislation.10 Among other measures to improve transparency in the phar-maceutical industry, this law requires Vermont to identify prescription drugs that have become substantially more expensive for the state to purchase. Pharmaceutical man-ufacturers must then justify such price increases. In the 2015 to 2016 legislative season, a number of other states also considered drug price transparency legislation.11 A na-tional measure to establish drug pricing transparency, The Fair Drug Pricing Act, was also introduced in Congress in September 2016 with bipartisan support.12
In recent years, many states have passed legislation regulat-ing aspects of the PBM industry (e.g., registration/licensure, transparency around maximum allowable cost).ix States that took such action in 2016 include Delaware, Kansas, Kentucky, Maine, Mississippi, Missouri, New Hampshire, Rhode Island, South Carolina, Tennessee, Washington, and
viii For branded drugs, manufacturers must provide the greater of 23.1 percent of the Average Manufacturer Price (AMP) per unit or the difference between the AMP and the best price per unit and adjusted by the Consumer Price Index-Urban (CPI-U) based on launch data and current quarter AMP.
ix In general, maximum allowable cost is the upper limit that a payer or PBM will reimburse a pharmacy for multi-source drugs. Maximum allowable cost is determined by the PBM.
Wyoming.x , xi Mississippi extended the regulatory authority of its State Board of Pharmacy to PBMs.xii Several states, such as Delaware and Kentucky, established maximum allowable cost definitions or requirements.xiii Such state laws seek to promote more accountability and provide greater oversight over PBMs, but the effectiveness of such efforts remains uncertain. It will be important for the Commonwealth to work with stakeholders to determine the most effective methods of pharmaceutical cost containment for the state.
In 2016, the National Academy for State Health Policy (NASHP) convened a working group of state government officials from across the U.S., including the HPC, to explore state-based strategies to address pharmacy costs. Informed by this working group, NASHP published a recent re-port outlining potential policy options. Strategies for states to consider include various methods of increasing drug price transparency, utilizing consumer protection laws and protecting patients from misleading marketing, promot-ing purchasing flexibility in Medicaid through regulatory changes, the state acting as a pharmacy benefit manager (negotiating as a unified state purchaser), and implementing return-on-investment pricing structures.13 Some approaches involve direct regulation of the pharmaceutical industry; others involve redesigning how the state acts in the market as a purchaser of drugs. While not all policy options are optimal for each state, the report presents a range of options for states to consider. The HPC will continue its involvement in collaborative discussions with a range of stakeholders, in-cluding other state leaders, to explore innovative state-based approaches to enhance the transparency and accountability of pharmaceutical spending in the Commonwealth.
x Massachusetts requires registration of PBMs as third party admin-istrators (TPAs). The state, however, may not capture PBMs that are not TPAs, such as for fully insured plans. See Code of Mass. Regulations 211 s. 148.02.
xi See Maine Revised Statutes Title 24-A s. 4317(12); Rhode Island Public Law 166; Wyoming Insurance Code Title 26 c. 4, 52; National Conference of State Legislators, Prescription Drug State Database.
xii See Mississippi Legislature Regular Session. H.B. 462, 2016.xiii See Delaware Laws 80 c. 245; Kentucky Acts of 2016 c. 79 (revises
Kentucky’s earlier maximum allowable cost law).
40 | 2016 Cost Trends Report
Section II: Trends in Spending and the Delivery SystemII
REFERENCES1 Center for Health Information and Analysis. 2016 Annual Report
on the Performance of the Mass. Health Care System. 2016 Sep.
2 Office of the Attorney General. Examination of Health Care Cost Trends and Cost Drivers Pursuant to G.L. c. 12C, s. 17. 2016 Oct 7.
3 IMS Institute for Healthcare Informatics. Medicines Use and Spending in the U.S.: A Review of 2015 and Outlook to 2020. 2016 Apr.
4 Cox C et al. Examining high prescription drug spending for peo-ple with employer sponsored health insurance. The Henry J. Kaiser Family Foundation; 2016 Oct 27. Available from: http://www.healthsystemtracker.org/insight/examining-high-pre-scription-drug-spending-for-people-with-employer-spon-sored-health-insurance.
5 The Henry J. Kaiser Family Foundation. Preventive services covered by private health plans under the Affordable Care Act. 2015 Aug 04. Available from: http://kff.org/health-reform/fact-sheet/preventive-services-covered-by-private-health-plans.
6 Parker-Pope T, Peachman RB. EpiPen price rise sparks concern for allergy sufferers. The New York Times; 2016 Aug 22.
7 Altarum Institute. Health Sector Economic Indicators: Insights from Monthly National Health Spending Data Through November 2016. 2017 Jan.
8 Centers for Medicare and Medicaid Services. National Health Expenditure Data. 2016.
9 Weisman R. Harvard Pilgrim strikes ‘pay-for-performance’ deal for cholesterol drug. The Boston Globe; 2015 Nov 08.
10 Vermont Act No. 165 of 2016 (S216).
11 National Academy for State Health Policy. 2015-2016 State Legislative Action on Pharmaceutical Prices. 2016 Sep 1.
12 114th Congress. H.R.6043 - Fair Accountability and Innovative Research Drug Pricing Act of 2016.
13 National Academy for State Health Policy. States and the Rising Cost of Pharmaceuticals: A call to action. 2016 Oct.

2016 Cost Trends Report | 41
FUTURE OUTLOOKSECTION II: Trends in Spending and the Delivery System
The future outlook for health care spending growth in Massachusetts is highly uncertain, in large part due to the likelihood of significant changes to state and federal health policy. However, the spending, utilization, and overall mar-ket trends outlined in this section, and other recent data suggest higher spending growth is likely in subsequent years. For example, health plan testimony indicates con-tinued prescription drug spending growth into 2016. Blue Cross Blue Shield of Massachusetts, Harvard Pilgrim Health Care, and Tufts Health Plan, the three largest commercial insurers in the Commonwealth, estimated commercial prescription drug spending growth per member per year (PMPY) in 2016 to be 15.0 percent, 7.2 percent, and 13.1 percent, respectively.
Overall U.S. health spending has been projected by CMS to grow at a rate of 5.8 percent per year from 2015 to 2025,
and recent developments signal that Massachusetts may be catching up to the U.S. on this measure. The Massachu-setts Division of Insurance has reported rate increases for premiums in the small group and individual markets of between 5.4 and 8.3 percent from the end of 2015 through the first quarter of 2017, after 12 quarters of growth below 4 percent (see Figure below), suggesting higher growth in 2016 and 2017.i
Finally, although uptake of alternative payment methods (APMs) stalled in 2015 (see Chapter 8: “Alternative Pay-ment Methods”), participation is projected to increase in 2016 and 2017 with the expansion of a preferred provider organization (PPO) based APMs in several large provider groups’ commercial contracts and the launch of MassHealth’s new accountable care organization (ACO) program. If suc-cessful, these mechanisms could act to mitigate spending growth in future years.
i Note that these rates are prospective and do not directly correspond to actual realized spending growth reported earlier in this Report. For example, if consumers switch to less expensive plans in response to a rate increase, realized spending growth would be lower.
2%
4%
6%
8%
10%Q
1 '1
7Q
4 '1
6Q
3 '1
6Q
2 '1
6Q
1 '1
6Q
4 '1
5Q
3 '1
5Q
2 '1
5Q
1 '1
5Q
4 '1
4Q
3 '1
4Q
2 '1
4Q
1 '1
4Q
4 '1
3Q
3 '1
3Q
2 '1
3Q
1 '1
3Q
4 '1
2Q
3 '1
2Q
2 '1
2Q
1 '1
2Q
4 '1
1Q
3 '1
1Q
2 '1
1
Note: Increases for Q1 of each year reflect carriers in the individual and small group market combined. Increases for all other quarters reflect small group market renewals only.Source: Massachusetts Division of Insurance, 2011-2017
Announced rate increases for the Massachusetts merged market, 2011-2017

42 | 2016 Cost Trends Report
HOSPITAL UTILIZATIONSection III: Care Delivery Performance: Opportunities to Improve Quality and Efficiency
In previous Cost Trends Reports, the Health Policy Com-mission (HPC) has shown that hospital use in Massachusetts is higher than the national average, and the HPC identified several strategies to curb hospital-based spending growth, including reducing unnecessary hospital use and shifting appropriate inpatient care to community hospitals. Ac-cording to the Commonwealth Fund’s Scorecard on State Health System Performance, in 2015 Massachusetts was ranked 31st in the nation with regard to avoidable hospi-tal use and costs, suggesting this is an area for continued improvement for the state.
This chapter briefly reviews recent trends in hospital use be-fore examining several avoidable hospital utilization measures, particularly avoidable emergency department (ED) use and readmissions, in depth. It concludes with an examination of the Commonwealth’s progress on directing appropriate inpatient care to community hospitals.
TRENDS IN HOSPITAL USE, MASSACHUSETTS AND THE U.S., 2010-2014Given that hospital care accounts for a substantial share of total health care spending in Massachusetts (see Chapter 2:
“Overview of Trends in Spending and Care Delivery”), reducing unnecessary hospital utilization is critical to both controlling statewide spending and growth. It is therefore encouraging that hospital utilization declined in the Com-monwealth from 2010 to 2014; inpatient discharges declined by 11 percent and both hospital outpatient and ED visits declined by 2 percent.
Despite these declines, however, Massachusetts continues to use hospitals at higher rates than national averages. In 2014, inpatient, hospital outpatient, and ED utilization rates per capita in Massachusetts were 8 percent, 50 percent, and 10 percent higher than the national averages, respec-tively (see Exhibit 5.1). These differences have decreased slightly since 2010 when Massachusetts utilization was 11 percent, 58 percent, and 17 percent higher than the national average, respectively.
U.S.
MA
20406080
100120140
20142013201220112010
Inpatient discharges per 1,000 persons
500
1,000
1,500
2,000
2,500
3,000
3,500
20142013201220112010
Hospital outpatient visits per 1,000 persons
100
200
300
400
500
20142013201220112010
ED visits per 1,000 persons
17%
58%
11%
10%
8%
50%
Notes: ED = emergency department. Some non-Massachusetts residents are captured in the Massachusetts discharges. In 2015, non-Massachusetts residents accounted for 5 percent of all inpatient discharges and 4 percent of all ED visits in Massachusetts.Source: Kaiser Family Foundation analysis of American Hospital Association data, 2010-2014
Exhibit 5.1: Hospital use in Massachusetts and the U.S., 2010-2014
U.S.
MA
20406080
100120140
20142013201220112010
Inpatient discharges per 1,000 persons
500
1,000
1,500
2,000
2,500
3,000
3,500
20142013201220112010
Hospital outpatient visits per 1,000 persons
100
200
300
400
500
20142013201220112010
ED visits per 1,000 persons
17%
58%
11%
10%
8%
50%
U.S.
MA
20406080
100120140
20142013201220112010
Inpatient discharges per 1,000 persons
500
1,000
1,500
2,000
2,500
3,000
3,500
20142013201220112010
Hospital outpatient visits per 1,000 persons
100
200
300
400
500
20142013201220112010
ED visits per 1,000 persons
17%
58%
11%
10%
8%
50%
Inpatient discharges per 1,000 persons
U.S.
MA
20406080
100120140
20142013201220112010
Inpatient discharges per 1,000 persons
500
1,000
1,500
2,000
2,500
3,000
3,500
20142013201220112010
Hospital outpatient visits per 1,000 persons
100
200
300
400
500
20142013201220112010
ED visits per 1,000 persons
17%
58%
11%
10%
8%
50%
Hospital outpatient visits per 1,000 persons
U.S.
MA
20406080
100120140
20142013201220112010
Inpatient discharges per 1,000 persons
500
1,000
1,500
2,000
2,500
3,000
3,500
20142013201220112010
Hospital outpatient visits per 1,000 persons
100
200
300
400
500
20142013201220112010
ED visits per 1,000 persons
17%
58%
11%
10%
8%
50%
ED visits per 1,000 person
5

2016 Cost Trends Report | 43
Chapter 5: Hospital Utilization 5
A number of factors likely contribute to the significantly higher per capita volume of hospital-based outpatient care in Massachusetts. One key driver is the number of physi-cians corporately affiliated with hospitals or contracting with payers as part of a hospital-based network. Joint contracting relationships between physicians and hospitals can encourage in-system referral patterns that bypass non-hospital settings in favor of care at in-system hospital outpatient settings. Hospital acquisitions of physician practices can further in-flate the volume of hospital-based outpatient care as hospital ownership of a physician practice may allow the hospital to license the practice as a hospital outpatient department and bill for the practice’s services as outpatient hospital visits rather than physician office visits, which results in higher spending for the same services (for more detail, see the Health Policy Commission’s 2015 Cost Trends Report).
This chapter continues with an in-depth examination of ED visits and inpatient discharges and highlights opportunities to reduce inappropriate utilization and increase efficiency in the delivery system.
ED VISITS IN MASSACHUSETTS, 2015ED visits in Massachusetts continued to decline in 2015, falling from 366.2 per 1,000 population in 2014 to 364 per 1,000 population. To better understand this trend, the HPC used the NYU Billings algorithm to classify ED visits into three visit categories: emergency, avoidable, and behavioral health (BH)-related.i
Emergency ED visits includes two types of visits: visits that required immediate ED care (e.g., injuries) and visits that required immediate ED care, but which could have been prevented with better primary care (e.g., visits for emergency’s related to a chronic condition such as diabetes and asthma). Avoidable ED visits also includes two types of visits: emergency, primary care treatable visits (e.g., vis-its that required medical care within 12 hours, but where care could have been provided by a primary care provider, such as ear or urinary tract infections) and non-emergent visits (e.g., visits for which the complaint did not require immediate medical care within 12 hours, such as a bad sore
i The Billings algorithm provides probabilities that an ED visit with a given primary diagnosis is non-emergent, emergent but primary care treatable, requires ED care but is potentially avoidable, or re-quires ED care and is not potentially preventable. Emergency visits include the Billings categories of requires ED care and is not po-tentially preventable and emergent, ED care preventable; avoidable visits includes the Billings categories of non-emergent and emergent, primary care treatable. All categorizations are based on a patient’s primary diagnosis code and are mutually exclusive.
throat with no fever). Finally, BH-related visits includes both substance use disorders and mental health conditions.
As seen in Exhibit 5.2, the reduction in ED visits from 2014 to 2015 was entirely due to a 2.1 percent decline in emergency ED visits, which have been steadily decreasing since 2011. Though avoidable ED visits steadily declined from 2011 to 2014, in 2015 these visits increased slightly (0.3 percent). Meanwhile, behavioral health-related ED visits have steadily increased since 2011 growing 13 percent. The next sections discuss avoidable and BH-related ED visits in greater detail.
AVOIDABLE ED UTILIZATIONInappropriate and unnecessary use of the ED is problematic from both a cost and quality vantage point. In 2015, of the nearly 2.5 million ED visits in Massachusetts, 42 percent were considered avoidable (22 percent were non-urgent visits and 20 percent were emergent, primary care treatable
Emergency
Avoidable
BH-related
50
100
150
200
250
300
350
2015201420132012201122.9
162.2
166.5
24.5
162.1
167.4
25.4
159.5
163.7
25.6
153.8
159.4
26.0
154.2
156.1
377.8 381.2 375.9 366.2 364.0
Type of visit Emergency
Avoidable
BH-related
50
100
150
200
250
300
350
2015201420132012201122.9
162.2
166.5
24.5
162.1
167.4
25.4
159.5
163.7
25.6
153.8
159.4
26.0
154.2
156.1
377.8 381.2 375.9 366.2 364.0
Type of visit Emergency
Avoidable
BH-related
50
100
150
200
250
300
350
2015201420132012201122.9
162.2
166.5
24.5
162.1
167.4
25.4
159.5
163.7
25.6
153.8
159.4
26.0
154.2
156.1
377.8 381.2 375.9 366.2 364.0
Type of visit
Emergency
Avoidable
BH-related
50
100
150
200
250
300
350
2015201420132012201122.9
162.2
166.5
24.5
162.1
167.4
25.4
159.5
163.7
25.6
153.8
159.4
26.0
154.2
156.1
377.8 381.2 375.9 366.2 364.0
Type of visit
Notes: ED = emergency department; BH = behavioral health. The total ED rate (in orange above the bars) includes all categories of ED visits, including unclassified ED visits which are not shown here. Unclassified visits increased 5.7 percent during this time period. ED categories are based on NYU Billings algorithm categorization of a patient’s primary diagnosis and are mutually exclusive. BH ED visits include any discharge with a primary mental health, substance use disorder, or alcohol-related diagnosis code. Emergency visits include the Billings categories of requires ED care and is not potentially preventable and emergent, ED care preventable; avoidable visits include the Billings categories of non-emergent and emergent, primary care treatable. Some non-Massachusetts residents are included in the number of ED visits. In 2015, non-Massachusetts residents accounted for 4 percent of all ED visits in Massachusetts.Sources: NYU Center for Health and Public Service Research, HPC analysis of Center for Health Information and Analysis Emergency Department Database, 2011-2015
Exhibit 5.2: ED visits per 1,000 population, by type, 2011-2015

44 | 2016 Cost Trends Report
Section III: Care Delivery Performance: Opportunities to Improve Quality and EfficiencyIII
visits).ii Further, while ED visits have gradually declined over time, the share of visits considered avoidable has remained relatively constant since 2012.
The use of EDs to treat conditions that are non-emergent or amenable to primary care can be an indicator of barriers to primary care access, and the high volume of preventable or avoidable ED visits provides insight into the quality and accessibility of the health care system in the surrounding community. Strategies to curb this type of ED overuse include redesigning primary care practices to improve ac-cess (particularly after typical business hours), providing alternative sites for urgent primary care (e.g., retail clinics and urgent care centers), improving care management for chronic disease patients, and aligning patient and provider incentives regarding use of the ED.1
BEHAVIORAL HEALTH-RELATED ED UTILIZATIONAs discussed previously, despite reductions in general ED utilization, BH-related ED utilization increased steadily in recent years. In 2015, patients with a primary BH diagnosis comprised 7 percent of all ED visits. This measure is con-servative as it does not include visits where a BH condition was a secondary diagnosis or where a medical problem may have had a BH condition as its root cause (such as an injury from a motor vehicle accident where the driver was intoxicated). When secondary diagnoses are included, BH conditions in 2015 accounted for 14 percent of all Massa-chusetts ED visits.
BH patients provide unique challenges for EDs, and prompt treatment and discharge of such patients can be particularly difficult. As seen in Exhibit 5.3, BH patients in Massachu-setts have significantly longer lengths of stay in the ED than non-BH patients. In 2015, the median length of stay for patients with a primary BH diagnosis (5.4 hours) was twice as long as for patients without a BH diagnosis (2.6 hours).
Despite accounting for a small portion of all ED visits, BH patients comprised 70.5 percent of all ED boarders, defined as patients with a length of stay in the ED of more than 12 hours from time of registration to time of discharge. In 2015 patients with a primary BH diagnosis were 16.3 times more likely to board than non-BH patient – over a fifth of all BH ED patients (22.8 percent) boarded compared to ii To assess the percentage of visits that are avoidable, the HPC used
the NYU Billings algorithm which classifies the primary diagnosis recorded on ED claims and assigns a probability that each ED visit could have been prevented. The algorithm is intended as a measure of the overall quality of primary care for a population and is not suitable for assessing individual visits or for use in payment.
only 1.4 percent of ED patients without a primary BH diagnosis (see Exhibit 5.4). ED boarding negatively affects the quality of ED care, and BH-related boarding is poten-tially harmful to both patients and staff as external stimuli from busy EDs often increases patient anxiety, agitation, and aggression.2 ED boarding is also associated with leaving the ED before receiving treatment (elopement), which in-creases BH patients’ risk of self-harm and suicide.3 Finally, ED boarding is costly, contributes to overcrowding, and consumes ED resources, delaying treatment for other patients. It is concerning then that, unlike non-BH patients, the share of BH patients that boarded has steadily grown over time, increasing 5.4 percentage points from 2011 to 2015.
1
2
3
4
5
6
Primary BH diagnosis
Non-primary BH diagnosis
No BH diagnosis
All ED
2.7 2.6
3.4
5.4
Ho
urs
sp
en
t in
th
e E
D
Note: ED = Emergency department, BH = behavioral health. BH ED visits identified using NYU Billings algorithm and includes any discharge with a primary “mental health, substance abuse, or alcohol”-related diagnosis code. Hours spent in the ED calculated from time of registration to time of discharge.Sources: NYU Center for Health and Public Service Research, HPC analysis of Center for Health Information and Analysis Emergency Department Database, 2015
Exhibit 5.3: Median length of stay in the ED, 2015
Non-BH patientsBH patients
20152014201320122011
1.3%
17.4%19.1%
21.1% 22.2% 22.8%
1.3% 1.2% 1.2% 1.4%
13
.4x
16
.3x
Notes: ED = emergency department; BH = behavioral health. The categories of BH and non-BH are based on a patient’s primary diagnosis. BH ED visits identified using NYU Billings algorithm and includes any discharge with a primary “mental health, substance abuse, or alcohol”-related diagnosis code. Hours spent in the ED calculated from time of registration to time of discharge.Source: HPC analysis of Center for Health Information and Analysis Emergency Department Database, 2011-2015
Exhibit 5.4: Percent of patients with an ED length of stay of 12 hours or more, 2011-2015
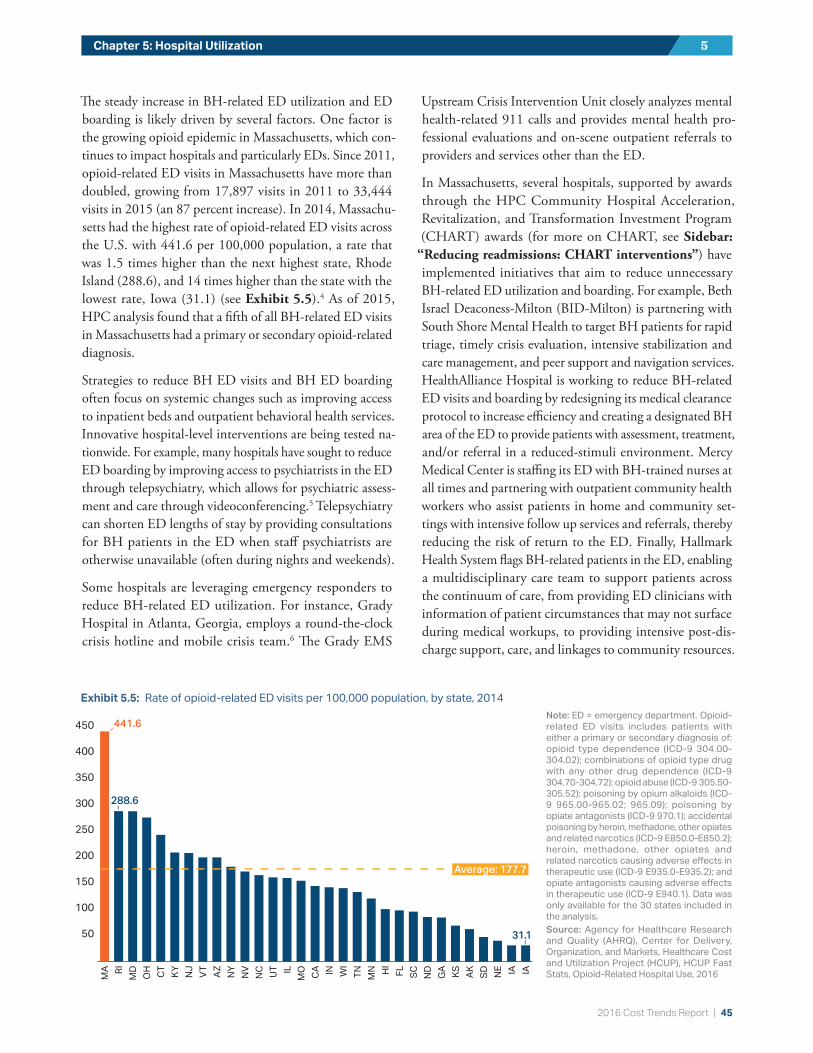
2016 Cost Trends Report | 45
Chapter 5: Hospital Utilization 5
The steady increase in BH-related ED utilization and ED boarding is likely driven by several factors. One factor is the growing opioid epidemic in Massachusetts, which con-tinues to impact hospitals and particularly EDs. Since 2011, opioid-related ED visits in Massachusetts have more than doubled, growing from 17,897 visits in 2011 to 33,444 visits in 2015 (an 87 percent increase). In 2014, Massachu-setts had the highest rate of opioid-related ED visits across the U.S. with 441.6 per 100,000 population, a rate that was 1.5 times higher than the next highest state, Rhode Island (288.6), and 14 times higher than the state with the lowest rate, Iowa (31.1) (see Exhibit 5.5).4 As of 2015, HPC analysis found that a fifth of all BH-related ED visits in Massachusetts had a primary or secondary opioid-related diagnosis.
Strategies to reduce BH ED visits and BH ED boarding often focus on systemic changes such as improving access to inpatient beds and outpatient behavioral health services. Innovative hospital-level interventions are being tested na-tionwide. For example, many hospitals have sought to reduce ED boarding by improving access to psychiatrists in the ED through telepsychiatry, which allows for psychiatric assess-ment and care through videoconferencing.5 Telepsychiatry can shorten ED lengths of stay by providing consultations for BH patients in the ED when staff psychiatrists are otherwise unavailable (often during nights and weekends).
Some hospitals are leveraging emergency responders to reduce BH-related ED utilization. For instance, Grady Hospital in Atlanta, Georgia, employs a round-the-clock crisis hotline and mobile crisis team.6 The Grady EMS
Upstream Crisis Intervention Unit closely analyzes mental health-related 911 calls and provides mental health pro-fessional evaluations and on-scene outpatient referrals to providers and services other than the ED.
In Massachusetts, several hospitals, supported by awards through the HPC Community Hospital Acceleration, Revitalization, and Transformation Investment Program (CHART) awards (for more on CHART, see Sidebar:
“Reducing readmissions: CHART interventions”) have implemented initiatives that aim to reduce unnecessary BH-related ED utilization and boarding. For example, Beth Israel Deaconess-Milton (BID-Milton) is partnering with South Shore Mental Health to target BH patients for rapid triage, timely crisis evaluation, intensive stabilization and care management, and peer support and navigation services. HealthAlliance Hospital is working to reduce BH-related ED visits and boarding by redesigning its medical clearance protocol to increase efficiency and creating a designated BH area of the ED to provide patients with assessment, treatment, and/or referral in a reduced-stimuli environment. Mercy Medical Center is staffing its ED with BH-trained nurses at all times and partnering with outpatient community health workers who assist patients in home and community set-tings with intensive follow up services and referrals, thereby reducing the risk of return to the ED. Finally, Hallmark Health System flags BH-related patients in the ED, enabling a multidisciplinary care team to support patients across the continuum of care, from providing ED clinicians with information of patient circumstances that may not surface during medical workups, to providing intensive post-dis-charge support, care, and linkages to community resources.
50
100
150
200
250
300
350
400
450
IAIANE
SDAKKSGA
NDSCFLH
IM
NTNWI
INCAMOILUTNCNVNYAZVTNJKYCTOH
MDRIMA
Average: 177.7
31.1
288.6
441.6Note: ED = emergency department. Opioid-related ED visits includes patients with either a primary or secondary diagnosis of: opioid type dependence (ICD-9 304.00-304.02); combinations of opioid type drug with any other drug dependence (ICD-9 304.70-304.72); opioid abuse (ICD-9 305.50-305.52); poisoning by opium alkaloids (ICD-9 965.00-965.02; 965.09); poisoning by opiate antagonists (ICD-9 970.1); accidental poisoning by heroin, methadone, other opiates and related narcotics (ICD-9 E850.0-E850.2); heroin, methadone, other opiates and related narcotics causing adverse effects in therapeutic use (ICD-9 E935.0-E935.2); and opiate antagonists causing adverse effects in therapeutic use (ICD-9 E940.1). Data was only available for the 30 states included in the analysis.Source: Agency for Healthcare Research and Quality (AHRQ), Center for Delivery, Organization, and Markets, Healthcare Cost and Utilization Project (HCUP), HCUP Fast Stats, Opioid-Related Hospital Use, 2016
Exhibit 5.5: Rate of opioid-related ED visits per 100,000 population, by state, 2014
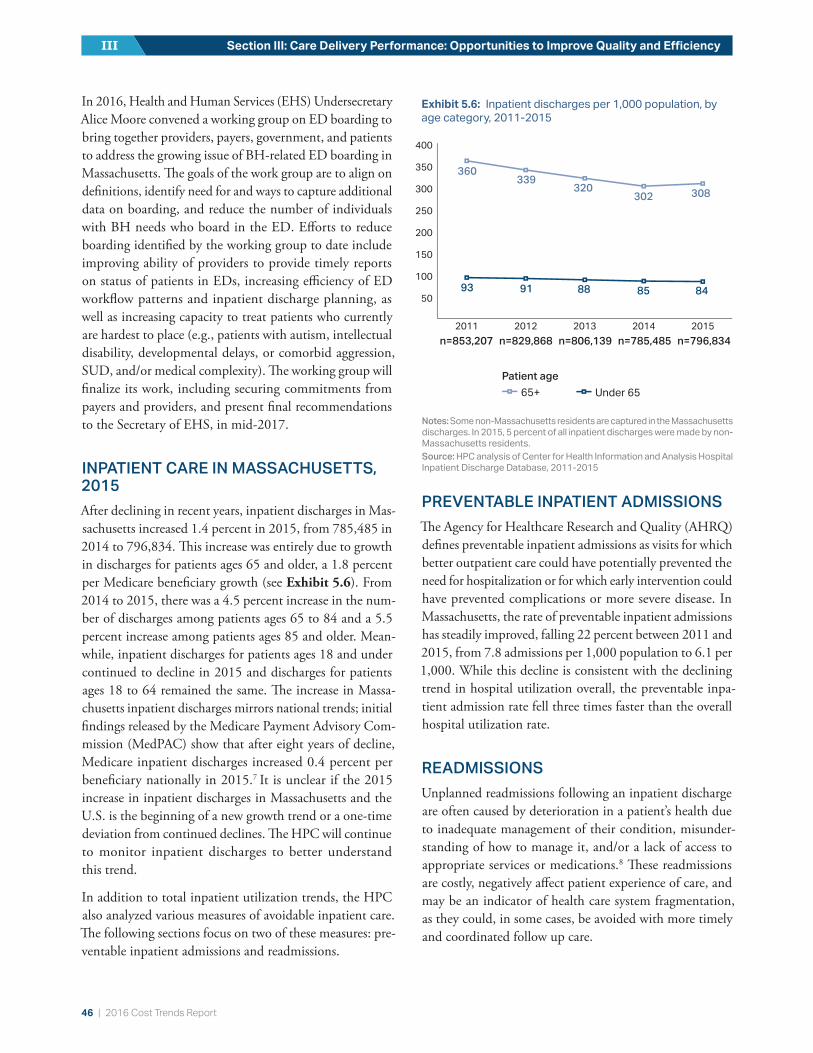
46 | 2016 Cost Trends Report
Section III: Care Delivery Performance: Opportunities to Improve Quality and EfficiencyIII
In 2016, Health and Human Services (EHS) Undersecretary Alice Moore convened a working group on ED boarding to bring together providers, payers, government, and patients to address the growing issue of BH-related ED boarding in Massachusetts. The goals of the work group are to align on definitions, identify need for and ways to capture additional data on boarding, and reduce the number of individuals with BH needs who board in the ED. Efforts to reduce boarding identified by the working group to date include improving ability of providers to provide timely reports on status of patients in EDs, increasing efficiency of ED workflow patterns and inpatient discharge planning, as well as increasing capacity to treat patients who currently are hardest to place (e.g., patients with autism, intellectual disability, developmental delays, or comorbid aggression, SUD, and/or medical complexity). The working group will finalize its work, including securing commitments from payers and providers, and present final recommendations to the Secretary of EHS, in mid-2017.
INPATIENT CARE IN MASSACHUSETTS, 2015After declining in recent years, inpatient discharges in Mas-sachusetts increased 1.4 percent in 2015, from 785,485 in 2014 to 796,834. This increase was entirely due to growth in discharges for patients ages 65 and older, a 1.8 percent per Medicare beneficiary growth (see Exhibit 5.6). From 2014 to 2015, there was a 4.5 percent increase in the num-ber of discharges among patients ages 65 to 84 and a 5.5 percent increase among patients ages 85 and older. Mean-while, inpatient discharges for patients ages 18 and under continued to decline in 2015 and discharges for patients ages 18 to 64 remained the same. The increase in Massa-chusetts inpatient discharges mirrors national trends; initial findings released by the Medicare Payment Advisory Com-mission (MedPAC) show that after eight years of decline, Medicare inpatient discharges increased 0.4 percent per beneficiary nationally in 2015.7 It is unclear if the 2015 increase in inpatient discharges in Massachusetts and the U.S. is the beginning of a new growth trend or a one-time deviation from continued declines. The HPC will continue to monitor inpatient discharges to better understand this trend.
In addition to total inpatient utilization trends, the HPC also analyzed various measures of avoidable inpatient care. The following sections focus on two of these measures: pre-ventable inpatient admissions and readmissions.
PREVENTABLE INPATIENT ADMISSIONSThe Agency for Healthcare Research and Quality (AHRQ) defines preventable inpatient admissions as visits for which better outpatient care could have potentially prevented the need for hospitalization or for which early intervention could have prevented complications or more severe disease. In Massachusetts, the rate of preventable inpatient admissions has steadily improved, falling 22 percent between 2011 and 2015, from 7.8 admissions per 1,000 population to 6.1 per 1,000. While this decline is consistent with the declining trend in hospital utilization overall, the preventable inpa-tient admission rate fell three times faster than the overall hospital utilization rate.
READMISSIONSUnplanned readmissions following an inpatient discharge are often caused by deterioration in a patient’s health due to inadequate management of their condition, misunder-standing of how to manage it, and/or a lack of access to appropriate services or medications.8 These readmissions are costly, negatively affect patient experience of care, and may be an indicator of health care system fragmentation, as they could, in some cases, be avoided with more timely and coordinated follow up care.
Exhibit 5.6: Inpatient discharges per 1,000 population, by age category, 2011-2015
Notes: Some non-Massachusetts residents are captured in the Massachusetts discharges. In 2015, 5 percent of all inpatient discharges were made by non-Massachusetts residents.Source: HPC analysis of Center for Health Information and Analysis Hospital Inpatient Discharge Database, 2011-2015
93
360339
320302 308
91 88 85 84
65+Under 65
Patient age
n=853,207 n=829,868 n=806,139 n=785,485 n=796,834
50
100
150
200
250
300
350
400
20152014201320122011
93
360339
320302 308
91 88 85 84
65+Under 65
Patient age
n=853,207 n=829,868 n=806,139 n=785,485 n=796,834
50
100
150
200
250
300
350
400
20152014201320122011
93
360339
320302 308
91 88 85 84
65+Under 65
Patient age
n=853,207 n=829,868 n=806,139 n=785,485 n=796,834
50
100
150
200
250
300
350
400
20152014201320122011

2016 Cost Trends Report | 47
Chapter 5: Hospital Utilization 5
In the 2015 Cost Trends Report, the HPC recommended the Commonwealth set a target of a 20 percent reduction in all-cause, all-payer 30-day hospital readmissions relative to the 2013 level. Achieving this goal would mean the Com-monwealth attains an all-payer, all-cause readmission rate below 13 percent by 2019. However, rather than decreasing in 2015, the statewide all-payer all-cause readmission rate grew 3 percent from the previous year. While the statewide all-payer all-cause readmission rate initially declined slightly from 16.1 percent in 2011 to 15.2 percent in 2013, it re-mained relatively unchanged in 2014 at 15.3 percent, and increased to 15.8 percent in 2015, as shown by the yellow line in Exhibit 5.7. The Center for Health Information and Analysis (CHIA) found that 60 percent of the 2014 all-payer all-cause readmissions in Massachusetts were pa-tients with BH conditions.iii , 9 Patients with heart failure and a BH comorbidity, for instance, had a 56 percent higher readmission rate than patients with heart failure and no BH comorbidity. These data suggest that hospitals aiming to reduce readmissions should consider targeting BH patients for additional discharge services and supports.
CHIA also found that in 2014, Massachusetts residents covered by either Medicaid or Medicare had higher read-mission rates than commercially insured patients (17.0 and 17.4 percent compared to 10.3 percent, respectively). As with the all-payer all-cause readmission rate, the Com-monwealth initially made progress in lowering its Medicare
iii CHIA’s report focused on patients with a primary and/or second-ary BH-related diagnosis i.e. included patients with a primary BH condition or a BH comorbidity.
readmission rate, decreasing from 18.9 percent in 2010 to 17.4 percent in 2013, yet this encouraging trend reversed in 2014 when the Medicare readmission rate increased to 17.7 percent, and then again in 2015 when it grew to 18.2 percent (orange line in Exhibit 5.7). Unlike Massachusetts, the U.S. Medicare readmission rate continued to decline in 2014 (blue line in Exhibit 5.7). As a result, though Massachusetts had made progress in closing the gap with the national average, in 2014 Massachusetts returned to its 2010 ranking of 43rd in the nation.iv
Massachusetts’ high Medicare readmission rate is an area of concern. Since the Affordable Care Act’s (ACA) readmissions penalties began in 2012, 79 percent of eligible Massachusetts hospitals have been penalized every year. In the most recent fiscal year, 86 percent (49 hospitals) of all eligible hospitals in the state received readmission penalties, compared to 78 percent nationally, making the Commonwealth the fourth highest penalized state in the U.S.10 Some researchers spec-ulate that Massachusetts’ high readmission rates are due in part to an oversupply of hospital beds, which may shape practice patterns towards providing more institutional care.11 HPC will continue to undertake research and analysis and engage with stakeholders to better understand the Com-monwealth’s high readmission rates.
The Commonwealth’s stalled progress on reducing readmis-sions suggests that there are opportunities for providers to improve care, reduce unnecessary readmissions, and po-tentially reduce spending. Reducing readmissions requires interventions that focus on improving both the quality of inpatient care and the transition to ambulatory care by ensuring continuity and coordination between providers and access to follow-up services (see Sidebar: “Reducing readmissions: CHART interventions” for noteworthy examples). Research on the root causes of readmissions also suggests that a variety of non-clinical factors contribute to readmission events, including social determinants of health.12 Hospitals and health systems seeking to offset these factors may provide a variety of enhanced non-clinical services to patients post-discharge, including transportation to follow up care, initial and recurrent 30-day refills on medication, follow-up phone calls, and telemedicine consults.13 Fur-thermore, non-hospital entities in the market increasingly have similar incentives to reduce readmissions. For example, starting in October 2017, skilled nursing facilities will be subject to all-cause, all-condition readmission penalties im-posed by Centers for Medicare and Medicaid Services (CMS).
iv Massachusetts’ 2015 Medicare readmissions rank was not available at the time of publication.
U.S. Medicare MA Medicare MA - All-payer
4041
3943
MA Rank
12%
14%
16%
18%
20%
201920152014201320122011
HPC’s 2019 target all-payer readmission rate
Exhibit 5.7: Thirty-day readmission rates, Massachusetts and the U.S., 2011-2015
Sources: Centers for Medicare and Medicaid Services (Medicare, 2011-2014); Center for Health Information and Analysis (all-payer, MA Medicare 2015)

48 | 2016 Cost Trends Report
Section III: Care Delivery Performance: Opportunities to Improve Quality and EfficiencyIII
Reducing readmissions: CHART interventionsThe HPC’s Community Hospital Acceleration, Revitalization, and Transformation Investment Program (CHART) is a $120 million rein-vestment program funded by an assessment on large health systems and commercial insurers that makes phased investments in community hospitals. Beginning in September 2015, 20 Massachusetts community hospitals received grants under CHART Phase 2. Approximately half of Phase 2 programs specifically aim to reduce readmissions for target populations using innovative approaches.
One noteworthy example is Signature Healthcare Brockton Hospital. Through CHART, Signature Healthcare Brockton Hospital is in-vesting $3.76 million over two years to reduce 30-day readmissions by 20 percent for its target population. Patients with a history of high utilization are served by the multi-disciplinary Complex Care Team (CCT). The CCT provides cross-setting care (across the ED, hospital, skilled nursing facility, and at home) including care planning, case management, palliative care, and medication reconcilia-tion. Patients over the age of 65 with 10 or more medications, or patients with congestive heart failure (CHF) or chronic obstructive pulmonary disease (COPD) diagnoses, are supported by pharmacists in Signature’s medication therapy management program. Phar-macists conduct an initial assessment of medication regimens to ensure safety and cost effectiveness, provide patient and family education, and engage in medication optimization with the overall goal of adherence to treatment. Additionally, patients with CHF or COPD diagnoses are voluntarily enrolled in Signature’s Homeward Bound telemedicine program following an inpatient discharge. Homeward Bound links patients to telehealth nurses and nursing students. Patients use biometric equipment connected to iPads to electronically send weight and blood pressure data directly to Signature’s electronic health record (EHR) on a daily basis. Nursing students (accompanied by an instructor) conduct home visits, as needed, on weekdays and weekends. Approximately one year in to its CHART Phase 2 program, Signature Healthcare Brockton Hospital has meaningfully decreased its readmission rate.
Other notable CHART supported interventions:• Berkshire Medical Center administers intake questionnaires to identify key social determinants of health to improve whole patient
understanding and better address social issues that lead to recurrent acute care utilization. Berkshire Medical Center is also in-creasing access to outpatient programs for those with chronic conditions and/or BH diagnoses using the former North Adams Regional Hospital site.
• Winchester Hospital and Milford Regional Medical Center both provide patients with large-format business cards featuring a photo and direct contact information of the care provider/coordinator that will follow up with them post-discharge to ensure a smooth transition home.
• Beth Israel Deaconess Hospital – Plymouth automatically provides a palliative care consult, as appropriate, for dually-eligible patients in its CHART program with the goal of improving pain management and thus reducing readmissions.
COMMUNITY HOSPITALSAnother strategy to reduce spending on hospital care is to shift clinically appropriate inpatient care to lower cost set-tings, namely from academic medical centers (AMCs) and teaching hospitals to community hospitals.v Some complex care may not be suitable for treatment in community hos-pitals, which may lack the specialized technology or staffing to care for certain high acuity cases, such as organ transplan-tation. Other cases, which are less complex or which can be treated using well-established treatment protocols, can be treated safely in community hospitals, such as routine labor v CHIA defines community hospitals as general acute care hospitals
that do not support large teaching and research programs. Teaching hospitals are defined as hospitals that report at least 25 full-time equivalent medical school residents per one hundred inpatient beds in accordance with Medicare Payment Advisory Commission (MedPAC) guidelines. AMCs are a subset of teaching hospitals characterized by (1) extensive research and teaching programs, (2) extensive resources for tertiary and quaternary care, (3) principal teaching hospitals for their respective medical schools, and (4) full service hospitals with case mix intensity greater than 5 percent above the statewide average.
and deliveries. This section focuses on these less complex cases, referred to as community appropriate discharges.vi
Previous HPC research has shown that many community hospitals in Massachusetts provide care at lower costs to consumers and insurers than AMCs and teaching hospitals, even accounting for differences in complexity of services.14 For example, HPC analysis found that community hospitals have lower median spending for routine labor and deliver-ies ($2,100 lower for caesarian sections and $2,200 lower
vi Discharges that could be appropriately treated in community hos-pitals were determined based on expert clinician assessment of the acuity of care provided, as reflected by the cases’ diagnosis-related groups (DRGs). The HPC chose to exclude cases with DRGs that might be suitable for only some community hospitals or in limited cases depending on clinical circumstances and differences in re-sources. As a result, analyses involving community appropriate care exclude about a third of all discharges, including those for patients receiving routine procedures, but who experienced minor or major complications. The exclusions of these discharges mean that these analyses represent a conservative estimate of the volume of care which might be appropriately provided at community hospitals rather than AMCs or teaching hospitals.

2016 Cost Trends Report | 49
Chapter 5: Hospital Utilization 5
for vaginal deliveries).14 The appropriate use of community hospitals not only lowers costs but also provides patients with convenient local access. For this reason, the HPC considers community hospitals an integral component of creating an efficient, high-quality health care system acces-sible to all residents.
Despite the availability of high quality community hospitals throughout the Commonwealth, however, research has shown that many patients tend to go to AMCs and teaching hospitals for community appropriate discharges.14 Further, while many provider organizations have expressed commit-ment to shifting appropriate cases to community hospitals, the share of community appropriate discharges provided by community hospitals in Massachusetts declined 2 per-centage points over time, from 55.3 percent in 2011 to 53.3 percent in 2015 (see Exhibit 5.8). Teaching hospitals absorbed these community appropriate discharges; in 2011, 16.7 percent of all community appropriate discharges oc-curred at teaching hospitals, but by 2015 the share rose to 18.6 percent.vii
Trends for the Lahey Health System suggest that the shift of community appropriate discharges away from community hospitals is not universal. Lahey Health System acquired Winchester Hospital (Winchester), a community hospital,
vii These figures include some patients for whom an AMC or teach-ing hospital was their local hospital, and for whom travelling to a community hospital would not necessarily have been appropriate. However, the trend findings would not be impacted as this amount is unlikely to change over time.
in 2014.15 Representatives of Lahey Health System provided testimony during the 2015 and 2016 Annual Cost Trends Hearings highlighting the system’s efforts to direct more inpatient care to Winchester and other appropriate com-munity settings rather than to AMCs or teaching hospitals.
As seen in Exhibit 5.9, following Lahey Health System’s acquisition of Winchester, care shifted between Lahey Hos-pital & Medical Center (Lahey HMC), the system’s anchor teaching hospital, and Winchester. Prior to the 2014 acqui-sition, the number of community appropriate discharges at Winchester fell each year. After the merger, however, this trend reversed, and Winchester treated more than 300 more community appropriate discharges in 2015 than in 2014. Meanwhile, despite the overall increase in community ap-propriate discharges at teaching hospitals across the state, the number of community appropriate discharges at Lahey HMC declined after the merger.
The data from the first year following the Winchester ac-quisition show small but promising signs that Lahey HMC may be redirecting more community appropriate inpatient care to Winchester. The HPC will continue to assess changes in community appropriate discharges within Lahey Health System and within other provider systems following new provider affiliations.
Community Teaching Academic medical center
20152014201320122011
55.3%
16.7%
28.1%
54.9%
17.5%
27.7%
54.7%
17.7%
27.6%
53.6%
18.3%
28.1%
53.3%
18.6%
28.2%
Type of hospital
Note: Discharges which could be appropriately treated in community hospitals were determined based on expert clinician assessment of the acuity of care provided, as reflected by the cases’ diagnosis-related groups (DRGs).Source: HPC analysis of Center for Health Information and Analysis Hospital Inpatient Discharge Database, 2011-2015
Exhibit 5.8: Share of community appropriate discharges, by hospital type, 2011-2015
Winchester (community appropriate)
Lahey HMC (community appropriate) Lahey HMC (higher acuity)
6,000
8,000
10,000
12,000
14,000
2015201420132012
Acquisition
Note: Discharges considered “community appropriate” were those that could be appropriately treated in community hospitals, determined based on expert clinician assessment of the acuity of care provided as reflected by the cases’ diagnosis-related groups (DRGs). All other discharges are classified as “higher acuity” for the purposes of this analysis.Source: HPC analysis of Center for Health Information and Analysis Hospital Inpatient Discharge Database, 2011-2015
Exhibit 5.9: Discharges at Lahey and Winchester hospitals, by type of discharge, 2012- 2015
Winchester (community appropriate)
Lahey HMC (community appropriate) Lahey HMC (higher acuity)
6,000
8,000
10,000
12,000
14,000
2015201420132012
Acquisition
Winchester (community appropriate)
Lahey HMC (community appropriate) Lahey HMC (higher acuity)
6,000
8,000
10,000
12,000
14,000
2015201420132012
Acquisition

50 | 2016 Cost Trends Report
Section III: Care Delivery Performance: Opportunities to Improve Quality and EfficiencyIII
In summary, Massachusetts residents continue to use more hospital-based care than the national average. While the Commonwealth has made some progress in curbing overall hospital utilization, progress on reducing hospital use and readmissions has stalled in recent years, and BH-related ED use continues to grow. Returning appropriate care to com-munity hospitals remains a focus for the Commonwealth.
REFERENCES1 New England Healthcare Institute. A matter of urgency: reducing
emergency department overuse. Cambridge (MA): New England Healthcare Institute; 2010 Mar.
2 Hawton JF, Weitzel H. Deliberate self-harm patients who leave the accident and emergency department without a psychiatric assessment: a neglected population at risk of suicide. Journal of Psychosomatic Research. 2001; 50(2): 87–93.
3 Weiss AP, et al. Patient and practice related determinants of emergency department length of stay for patients with psychiatric illness. Annals of Emergency Medicine. 2012; 60(2):162-171.
4 Weiss A, et al. Opioid-related inpatient stays and emergency department visits by state, 2009-2014. HCUP Statistical Brief #219. Agency for Healthcare Research and Quality; 2016 Dec.
5 Williams M, et al. Telepsychiatry in the emergency department: overview and case studies. California Healthcare Foundation. 2009 Dec.
6 Colman M. Innovations: upstream crisis intervention unit. George Washington School of Medicine and Health Sciences. 2013 Dec 19.
7 Gaumer Z, et al. Assessing payment adequacy and updating payments: hospital inpatient and outpatient services. Medicare Payment Advisory Commission. 2016 Dec 8.
8 Silow-Carroll S, Edwards JN, Lashbrook A. Reducing hospital readmissions: lessons from top-performing hospitals. Boston (MA): The Commonwealth Fund; 2011 Apr.
9 Center for Health Information and Analysis. Behavioral health & readmissions in Massachusetts acute care hospitals. Boston (MA): Center for Health Information and Analysis; 2016 Aug.
10 Bouccuti C, Casillas G. Aiming for fewer hospital u-turns: the Medicare hospital readmission reduction program. Kaiser Family Foundation; 2016 Sep.
11 Kowzlczyk L. A revolving door at Mass. Hospitals. The Boston Globe. 2016 Oct 11.
12 Calvillo-King L, et al. Impact of social factors on risk of readmission or mortality in pneumonia and heart failure: systematic review. Journal of General Internal Medicine. 2013; 28(2): 269-282.
13 Massachusetts Hospital Association. State of the state: reducing readmissions in Massachusetts. Massachusetts Health & Hospital Association. 2013 Mar.
14 Health Policy Commission. Community hospitals at a crossroads: findings from an examination of the Massachusetts health care system. 2016 Mar.
15 Health Policy Commission. Review of Lahey Health System’s proposed acquisition of Winchester Hospital (HPC-CMIR-2013-3) final report. 2014 May 22.

2016 Cost Trends Report | 51
POST-ACUTE CARESection III: Care Delivery Performance: Opportunities to Improve Quality and Efficiency
Post-acute care (PAC) services include short-term nursing or rehabilitative care following a hospital discharge. PAC recipients may receive nursing or rehabilitative services at home (home health) or in an institutional setting such as a skilled nursing facility (SNF), inpatient rehabilitation facility (IRF), or long-term care hospital (LTCH). Besides these PAC settings, patients may visit a provider’s office for follow-up care or receive physical therapy outside the home. Different PAC settings have different capabilities, but there is overlap in many of the kinds of patients treated by the various PAC service types (see 2014 Cost Trends Report for overview of settings). The average cost of care differs substantially by setting, and all institutional PAC settings are markedly more costly, on average, than home health. Choosing the appropriate setting of PAC is important in ensuring optimal care and has significant effects on the cost of an episode of care for many patients.1 The choice of PAC setting also has implications for patient experience and over-all quality. Previous HPC research found that Massachusetts has much higher use of both home health and institutional PAC than the U.S. average. This chapter will update trends in utilization and spending for PAC in Massachusetts.
Medicare is the largest payer of PAC services nationally, cov-ering nearly three quarters of all PAC spending.2 In 2014, PAC spending for Original Medicare beneficiaries age 65 and older totaled $54.2 billion nationally, accounting for 16.7 percent of Original Medicare spending.i In Massachu-setts, PAC spending accounted for a somewhat higher share of total Medicare spending for beneficiaries age 65 and older at 18.7 percent, totaling $1.7 billion of $9.0 billion Medicare dollars spent in the Commonwealth.i Particularly given the lack of clinical consensus on best practices for PAC discharge for many types of cases, PAC use varies substan-tially across the U.S. Controlling for population factors, a 2013 Institute of Medicine report found that differences in PAC spending accounted for 73 percent of all regional differences in Medicare spending.3
i Calculated from 2014 CMS Public Use Files for spending on Medi-care Parts A and B for beneficiaries age 65 and older.
Consistent with findings in past reports, the HPC found that PAC use in Massachusetts is higher than the U.S. av-erage for all payer types, not just Medicare. Overall, 40 percent of patients in Massachusetts used some form of PAC following an inpatient stay, compared to only 29 per-cent of patients nationwide in 2013 (the most recent year for which the HPC has national comparator data) (see Exhibit 6.1). (Patients in the “No PAC” category may re-ceive follow-up care in a provider’s office or visit a physical therapist outside the home.) Much of the difference in overall PAC use between Massachusetts and the U.S. is driven by the Commonwealth’s more intensive use of home health; 18.6 percent of all patients discharged in Massachusetts were discharged with home health services compared to 12.2 percent nationwide, over 50 percent higher. Furthermore, in Massachusetts, 21.8 percent of all patients were discharged to an institutional setting (SNF, IRF, or LTCH), compared with 17.1 percent of patients in the U.S. overall in 2013.ii
ii The institutional PAC facilities are distinct and where possible we considered each separately. However, limitations in the site coding of some of the datasets complicate efforts to distinguish between the different institutional sites of care. For this reason, we group SNFs, IRFs, and LTCHs together into one “institutional” category for many of our analyses.
Exhibit 6.1: PAC discharges, all DRGs, all payers, 2013
Source: HPC analysis of HCUP data, 2013
Commercial Medicare Medicaid Total
PAC: institutional PAC: home health No PACDischarge destination
20%
40%
60%
80%
100%
U.S.MAU.S.MAU.S.MAU.S.MA
77.1
14.4
8.5
85.4
37.3
24.9
37.831.3
19.2
49.5
79.3
11.4
9.3 6.35.3
88.4
21.8
18.6
59.6
17.1
12.2
70.8
8.16.5
Commercial Medicare Medicaid Total
PAC: institutional PAC: home health No PACDischarge destination
20%
40%
60%
80%
100%
U.S.MAU.S.MAU.S.MAU.S.MA
77.1
14.4
8.5
85.4
37.3
24.9
37.831.3
19.2
49.5
79.3
11.4
9.3 6.35.3
88.4
21.8
18.6
59.6
17.1
12.2
70.8
8.16.5
6
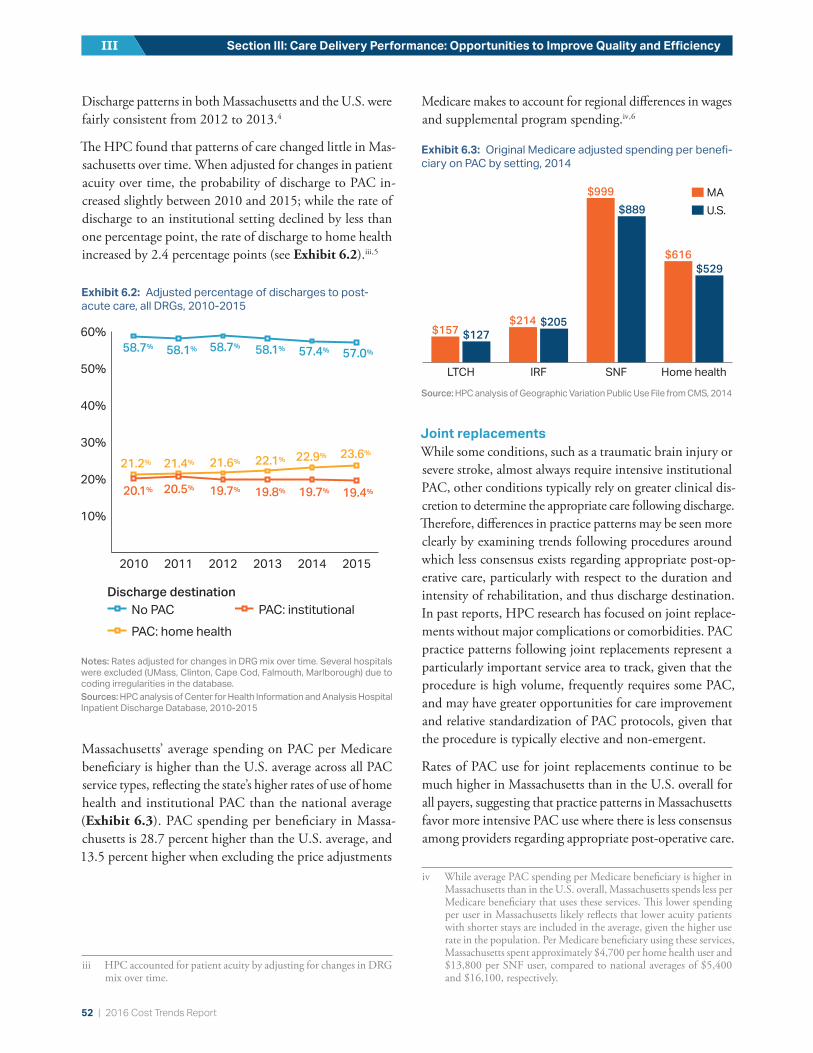
52 | 2016 Cost Trends Report
Section III: Care Delivery Performance: Opportunities to Improve Quality and EfficiencyIII
Discharge patterns in both Massachusetts and the U.S. were fairly consistent from 2012 to 2013.4
The HPC found that patterns of care changed little in Mas-sachusetts over time. When adjusted for changes in patient acuity over time, the probability of discharge to PAC in-creased slightly between 2010 and 2015; while the rate of discharge to an institutional setting declined by less than one percentage point, the rate of discharge to home health increased by 2.4 percentage points (see Exhibit 6.2).iii , 5
Massachusetts’ average spending on PAC per Medicare beneficiary is higher than the U.S. average across all PAC service types, reflecting the state’s higher rates of use of home health and institutional PAC than the national average (Exhibit 6.3). PAC spending per beneficiary in Massa-chusetts is 28.7 percent higher than the U.S. average, and 13.5 percent higher when excluding the price adjustments
iii HPC accounted for patient acuity by adjusting for changes in DRG mix over time.
Medicare makes to account for regional differences in wages and supplemental program spending.iv , 6
Joint replacementsWhile some conditions, such as a traumatic brain injury or severe stroke, almost always require intensive institutional PAC, other conditions typically rely on greater clinical dis-cretion to determine the appropriate care following discharge. Therefore, differences in practice patterns may be seen more clearly by examining trends following procedures around which less consensus exists regarding appropriate post-op-erative care, particularly with respect to the duration and intensity of rehabilitation, and thus discharge destination. In past reports, HPC research has focused on joint replace-ments without major complications or comorbidities. PAC practice patterns following joint replacements represent a particularly important service area to track, given that the procedure is high volume, frequently requires some PAC, and may have greater opportunities for care improvement and relative standardization of PAC protocols, given that the procedure is typically elective and non-emergent.
Rates of PAC use for joint replacements continue to be much higher in Massachusetts than in the U.S. overall for all payers, suggesting that practice patterns in Massachusetts favor more intensive PAC use where there is less consensus among providers regarding appropriate post-operative care.
iv While average PAC spending per Medicare beneficiary is higher in Massachusetts than in the U.S. overall, Massachusetts spends less per Medicare beneficiary that uses these services. This lower spending per user in Massachusetts likely reflects that lower acuity patients with shorter stays are included in the average, given the higher use rate in the population. Per Medicare beneficiary using these services, Massachusetts spent approximately $4,700 per home health user and $13,800 per SNF user, compared to national averages of $5,400 and $16,100, respectively.
10%
20%
30%
40%
50%
60%
201520142013201220112010
58.7%
21.2%
20.1%
21.4%
20.5% 19.7% 19.8% 19.7% 19.4%
21.6% 22.1% 22.9% 23.6%
58.1% 58.7% 58.1% 57.4% 57.0%
PAC: institutional
No PACPAC: home health
Discharge destination
10%
20%
30%
40%
50%
60%
201520142013201220112010
58.7%
21.2%
20.1%
21.4%
20.5% 19.7% 19.8% 19.7% 19.4%
21.6% 22.1% 22.9% 23.6%
58.1% 58.7% 58.1% 57.4% 57.0%
PAC: institutional
No PACPAC: home health
Discharge destination
Exhibit 6.2: Adjusted percentage of discharges to post-acute care, all DRGs, 2010-2015
Notes: Rates adjusted for changes in DRG mix over time. Several hospitals were excluded (UMass, Clinton, Cape Cod, Falmouth, Marlborough) due to coding irregularities in the database. Sources: HPC analysis of Center for Health Information and Analysis Hospital Inpatient Discharge Database, 2010-2015
10%
20%
30%
40%
50%
60%
201520142013201220112010
58.7%
21.2%
20.1%
21.4%
20.5% 19.7% 19.8% 19.7% 19.4%
21.6% 22.1% 22.9% 23.6%
58.1% 58.7% 58.1% 57.4% 57.0%
PAC: institutional
No PACPAC: home health
Discharge destination
Exhibit 6.3: Original Medicare adjusted spending per benefi-ciary on PAC by setting, 2014
Source: HPC analysis of Geographic Variation Public Use File from CMS, 2014
MAU.S.
Home healthSNFIRFLTCH
$157$214
$999
$889
$529
$616
$127$205

2016 Cost Trends Report | 53
Chapter 6: Post-Acute Care 6
For example, among Original Medicare patients, rates of discharge to institutional care following joint replacement were much higher in Massachusetts than the U.S. average; 63.8 percent of Original Medicare patients in Massachusetts were discharged to institutional settings following joint replacement compared to 46.1 percent in the U.S. in 2013 (see Exhibit 6.4). While rates of discharge to institutional care following joint replacement have fallen in Massachu-setts, a wide gap remains between Massachusetts and the U.S.v Furthermore, higher rates of PAC in Massachusetts do not appear to result in higher quality outcomes, with no difference in readmission or complication rates following joint replacements between Massachusetts and the national average.vi Due to the wide variation in costs and practice patterns surrounding the procedure, joint replacement has emerged as a national focus of cost-savings efforts. The Centers for Medicare and Medicaid Services (CMS) has been a leader in promoting bundled payments for joint replacement, in which hospitals are responsible for all costs of care in excess of a previously arranged episodic payment (see Chapter 8: “Alternative Payment Methods” for further information on CMS’ Comprehensive Care for Joint Re-placement payment model).7 Early evidence from one hospital system suggests that bundled payments have reduced the cost of joint replacement by 21 percent, almost half of which was attributable to reduced PAC spending.8
Large employers have also begun to initiate episodic bundling agreements with preferred providers. General Electric Co. (GE), having recently relocated its headquarters to Boston,
v National comparison data are only available through 2013.vi In 2013, readmission rates in Massachusetts following hip or knee
replacements were 5.5 percent, compared to 5.4 percent in the U.S. overall (not statistically different), and complication rates were also not statistically different from the national average of 3.4 percent.
has designated New England Baptist Hospital as a preferred provider of joint replacements for GE employees.9 New England Baptist, an orthopedic specialty hospital, has been found to provide high-value care on the basis of cost and quality and also has one of the lowest rates of discharges to institutional care following joint replacements among Mas-sachusetts hospitals.10 GE will provide a bundled payment to New England Baptist for each joint replacement episode and will waive out-of-pocket costs and travel expenses for employees that elect to use New England Baptist for joint replacement.
In addition to higher costs associated with institutional care, the high use of institutional PAC in Massachusetts is particularly concerning, given the importance of days at home as a patient quality outcome. Previous HPC re-ports have called for greater adoption of planning tools to standardize the discharge process and enable systematic consideration of key factors and have also called for con-sensus guidelines for patient discharge planning.4 At the federal level, the 2014 Improving Medicare Post-Acute Care Transformation (IMPACT) Act requires standardized data collection and sharing on Medicare patient outcomes across all post-acute care settings by 2019.11 IMPACT will require PAC providers to document patient outcomes over a number of quality and resource use metrics including functional status, cognitive changes, hospital readmissions, and discharge to the community, among others.12 Payers and providers in Massachusetts can use this outcomes data to inform high-quality and high-value discharge strategies.
More broadly, providers across primary care, inpatient care, PAC, and specialty care should focus on how to improve the number of patient days at home in the Commonwealth. This focus could drive change in Massachusetts’ high reli-ance on institutional PAC and have important impacts on overall health care quality and spending.
REFERENCES1 Tu T et al. The Right Care for the Right Cost: Post-Acute Care and
the Triple Aim. MHA ACO Network and Leavitt Partners; 2014.
2 Tian W. An All-Payer View of Hospital Discharge to Postacute Care, 2013. Agency for Healthcare Research and Quality, Healthcare Cost and Utilization Project, 2016 Contract No.: 205.
3 Newhouse JP et al., editors, Institute of Medicine. Variation in Health Care Spending: Target Decision Making, Not Geography. The National Academies Press; 2013.
4 Health Policy Commission. 2015 Cost Trends Report. 2016 Jan.
Exhibit 6.4: PAC discharge destination following joint replacement among Original Medicare patients, 2013
Source: HPC analysis of HCUP data, 2013
MAU.S.
No PACPAC: Home healthPAC: Institutional
63.8%
46.1%
33.5%
20.4%
32.7%
3.5%

54 | 2016 Cost Trends Report
Section III: Care Delivery Performance: Opportunities to Improve Quality and EfficiencyIII
5 Hwabejire JO et al. Excessively Long Hospital Stays After Trauma Are Not Related to the Severity of Illness: Let’s Aim to the Right Target! JAMA Surgery. 2013; 148:956-61.
6 Centers for Medicare and Medicaid Services. CMS standardiza-tion methodology for allowed amount – v.2. 2013. Available from: https://www.cms.gov/Research-Statistics-Data-and-Systems/Statistics-Trends-and-Reports/Medicare-Geographic-Variation/Downloads/Geo_Var_PUF_Technical_Supplement.pdf.
7 Centers for Medicare and Medicaid Services. Comprehensive Care for Joint Replacement Model. 2017 Jan. Available from: https://innovation.cms.gov/initiatives/cjr.
8 Navathe AS et al. Cost of Joint Replacement Using Bundled Payment Models. JAMA Internal Medicine. 2017.
9 McCluskey PD. GE cuts deal with New England Baptist to curb health care costs. The Boston Globe. 2016 Dec 19.
10 Health Policy Commission. 2014 Cost Trends Report. 2015 Jan.
11 U.S. Public Law 113-185. IMPACT Act of 2014.
12 Centers for Medicare and Medicaid Services. IMPACT Act of 2014 Data Standardization & Cross Setting Measures. 2016 Sep. Available from: https://www.cms.gov/Medi-care/Quality-Initiatives-Patient-Assessment-Instruments/Post-Acute-Care-Quality-Initiatives/IMPACT-Act-of-2014/IMPACT-Act-of-2014-Data-Standardization-and-Cross-Set-ting-MeasuresMeasures.html.
2016 Cost Trends Report | 55
VARIATION IN SPENDING BY PRIMARY CARE PROVIDER GROUPSection III: Care Delivery Performance: Opportunities to Improve Quality and Efficiency
Variation in provider prices, spending, and clinical practice patterns is well documented in Massachusetts. The Health Policy Commission (HPC) has previously highlighted variation in episode spending for specific diagnoses and procedures across hospital, post-acute, and specialty care (for example, in the areas of hip or knee replacements and maternal care). In this chapter, the HPC examined variation in primary care provider group spending.
Primary care providers (PCPs) who manage a patient’s care across the continuum of care have considerable influence over where a patient decides to seek secondary care, includ-ing specialist visits, diagnostic testing, and hospitalization. This chapter presents data on variation in patient spending by PCP group using health status-adjusted total medical expenses (HSA TME) as reported by the Center for Health Information and Analysis (CHIA). HSA TME includes all categories of medical expenses (including patient copays and deductibles) and all non-claims payments to providers, including payments based on spending and quality per-formance, and is adjusted to account for the acuity of the patient population (i.e., health status-adjusted).i HSA TME by PCP group encompasses spending only for members of health maintenance organization (HMO) or point of service (POS) plans who have an assigned PCP in that PCP group.ii This measure includes a patient’s spending at any provider or site of care, including hospitals or specialists which may not be affiliated with the PCP group, capturing variation due to differences in utilization and prices.
PCP groups in Massachusetts are increasingly participat-ing in alternative payment methods (APMs), which hold
i TME excludes prescription drug rebates and thus reflects the gross amounts paid to pharmacies for prescription drugs, rather than the net amounts paid. Most payers use similar risk-adjustment software that is driven by provider-recorded diagnoses.
ii Some payers already do this assignment based on claims (for example, the Medicare program does for ACOs) for enrollees in preferred provider organizations (PPOs), and future data reporting by CHIA will likely report TME for PPO members.
providers accountable for TME as well as clinical quality, including patient outcomes (for more see Chapter 8: “Al-ternative Payment Methods”). For this reason, the HPC also explored the relationship between the percent of a pro-vider’s population that is covered by an APM (APM uptake) and TME among the patients of the Commonwealth’s ten largest PCP groups.iii Though the HPC did not conduct causal analyses, high-level patterns provide directional ev-idence about the effectiveness of APMs.
The final section of this chapter explores spending varia-tion for patients attributed to these PCP groups in one particular subcategory of spending: services that are not evidence-based or recommended by physician specialty societies for certain populations. Based on a framework from the Choosing Wisely campaign the HPC examined rates of “non-recommended care” by provider group to determine if certain organizations used these services and procedures at lower rates.iv
VARIATION IN HSA TMEThe measure of TME in this chapter combines spending for patients attributed to PCP groups who are covered under any of Massachusetts’ three largest commercial payers: Blue Cross Blue Shield of Massachusetts (BCBS), Harvard Pil-grim Health Care (HPHC), and Tufts Health Plan (THP) for the years 2012 to 2015 (see Technical Appendix for
iii The ten largest PCP groups defined by member months. The HPC aggregated local provider groups to the ‘parent’ level – that is, groups working under the same managing corporate or contracting umbrella as defined by CHIA. Some groups have had significant changes in membership or populations over this period, which can affect their TME or number of members under APMs.
iv In 2012, the American Board of Internal Medicine (ABIM) launched the Choosing Wisely campaign with the goal of avoiding wasteful or unnecessary medical tests, treatments and procedures. Medical societies developed lists of tests, treatments or services that each specialty commonly overuses and submitted them to ABIM. As of February 2013, there were 135 recommendations targeting a range of procedures to either question or avoid without special consideration.
7

56 | 2016 Cost Trends Report
Section III: Care Delivery Performance: Opportunities to Improve Quality and EfficiencyIII
details). The HPC calculated HSA TME for patients of the ten largest PCP groups in the Commonwealth to ensure large enough patient populations to make comparisons meaningful. As seen in Exhibit 7.1, HSA TME for these PCP groups has been converging somewhat over time, with the exception of Partners Community Physicians Organi-zation (Partners). Of the ten largest PCP groups, Partners had the highest HSA TME in 2015 at $497 per member per month (PMPM), which was $36 PMPM (7.2 percent) higher than the next highest provider group (New England Quality Care Alliance, or NEQCA) and $39 PMPM above the average HSA TME. Baycare Health Partners (Baycare) had the lowest HSA TME ($422 PMPM) in 2015, 15 per-cent below that of Partners. Further, Atrius Health (Atrius) and Mount Auburn Cambridge Independent Physician As-sociation (MACIPA) moved from being high-cost provider groups in 2012 to average or below in 2015.
As illustrated in Exhibit 7.1, growth in HSA TME over time for most groups was generally low, between 2.3 percent growth for Boston Medical Center Management Services (BMC) and a 2.3 percent reduction for MACIPA. Com-paring HSA TME and TME unadjusted for health status changes (see Exhibit 7.2) over time shows that these reported growth rates were low partly because payers and providers reported large increases in patient acuity each year from 2012 to 2015. For example, between 2012 and 2015, unadjusted TME grew 3.5 percent per year, on average, for all provider groups in Exhibit 7.1, but these groups also reported that patient acuity increased by 3.1 percent per year, resulting in HSA TME growth of merely 0.4 percent. Whether the
reported increase in patient acuity is due to worsening member health or, for example, changes in coding practices will be the subject of continued investigation.v
v Providers and payers often face incentives to report higher patient acuity. For example, the Affordable Care Act’s (ACA) risk adjustment methodology redistributes funds from plans with lower-risk enrollees to plans with higher-risk enrollees in the individual and small group markets. Additionally, provider groups in Massachusetts may be subject to Performance Improvement Plans under Chapter 224, the criteria of which are largely based on health status-adjusted changes in TME.
Notes: TME = total medical expenses; PCP = primary care provider. HSA TME is the combined normalized health status adjusted TME weighted across the three largest commercial payers (see Technical Appendix for details). Analysis includes the ten largest PCP groups as identified by CHIA in terms of member months: Partners Community Physicians Organization (Partners); New England Quality Care Alliance (NEQCA), a corporate affiliate of Wellforce; Beth Israel Deaconess Care Organization (BIDCO); Steward Health Care Network (Steward); Atrius Health (Atrius); Lahey Clinical Performance Network (Lahey); Mount Auburn Cambridge Independent Physician Association (MACIPA); UMass Memorial Medical Group (UMass Memorial); Boston Medical Center Management Services (BMC); and Baycare Health Partners (Baycare).Source: HPC analysis of Center for Health Information and Analysis 2016 Annual Report TME Databook
Exhibit 7.1: HSA TME, by PCP group, 2012-2015
BMC
BIDCO
Atrius
MACIPA
Lahey
Baystate
Partners
NEQCA
UMass Memorial
Steward
Primary care provider group
average$
45
8
aver
age
$4
53
$350
$400
$450
$500
2015201420132012
BMC
BIDCO
Atrius
MACIPA
Lahey
Baystate
Partners
NEQCA
UMass Memorial
Steward
Primary care provider group
average$
45
8
aver
age
$4
53
$350
$400
$450
$500
2015201420132012
Exhibit 7.2: Annual HSA TME growth rate by PCP group, 2012-2015
Notes: TME = total medical expenses; HSA = health status-adjusted; PCP = primary care provider. The measure of TME shown is the combined normalized HSA TME weighted across the three largest commercial payers (see Technical Appendix for details). Analysis includes the same PCP groups used in Exhibit 7.1.Source: HPC analysis of Center for Health Information and Analysis 2016 Annual Report TME Databook
Average annual growth in reported risk (acuity) scores
Average annual growth in health status
adjusted (HSA) TME
Average annual growth in (unadjusted) TME for all 10 provider
groups
0.5%
1.0%
1.5%
2.0%
2.5%
3.0%
3.5%
4.0%
3.1%
0.4%
3.5%

2016 Cost Trends Report | 57
Chapter 7: Variation in Spending by Primary Care Provider Group 7
VARIATION IN APM UPTAKE AND HSA TMEAcross the ten largest PCP groups, APM uptake (the percent of a provider group’s HMO and POS members covered by APMs) increased 14.7 percentage points from 2013 to 2015, from an average of 69.3 to an average of 84.0 per-cent. However, APM uptake varied significantly by provider group in 2015, with a low of 55.5 percent (Boston Medical Center) and a high of 95.9 percent (Atrius). Because many APMs are designed to reward providers for lower total TME in subsequent contract years, the HPC analyzed the relationship between APM uptake and TME growth rate in the following year.
Exhibit 7.3 suggests that provider groups with high APM uptake in one year did indeed tend to have low TME growth rates in the following year.vi This tendency appeared stronger in 2014-2015 (correlation of -.7) compared to 2013-2014 (correlation of -.3), which is consistent with the possibility that APMs may grow in effectiveness over time as providers gain more experience with them.vii
To further the analysis, the HPC divided provider groups into two categories: those with high APM uptake in 2013
vi This is a correlational analysis unable to prove causality.vii This effect was found in BCBS’ Alternative Quality Contract in
Massachusetts. See Song Z, et al. Changes in health care spending and quality 4 years into global payment. New England Journal of Medicine. 2014: 371.18; 1704-1714. Nevertheless, conclusions are highly tentative as CHIA’s spending data reported for 2015 is preliminary (some of the finalized numbers include additional set-tlement payments between payers and providers related to APMs) and because of the limited statistical power of this analysis.
(more than 74 percent of their HMO or POS members were in APMs) and those with low APM uptake in 2013. The HPC found that provider groups with high APM up-take had average HSA TME growth of 0.9 percent per year between 2013 and 2015, while provider groups with low APM uptake had average HSA TME growth of 2.6 percent across the three years (see Exhibit 7.3).
VARIATION IN NON-RECOMMENDED CARENon-recommended care, defined as services that medical communities agree provide few benefits to patients, is one example of unnecessary medical spending. Such care can lead to additional procedures and downstream costs, further contributing to wasteful medical spending. For this reason, several initiatives have been launched to reduce non-rec-ommended care, such as the American Board of Internal Medicine Foundation’s Choosing Wisely campaign. Rates of non-recommended care measures have also been used as quality measures to set shared savings or deficit amounts in APMs.viii
Using 16 measures from the Choosing Wisely campaign, for which researchers had developed algorithms to identify in claims data, HPC analyzed commercially-insured pa-tients insured with either BCBS, HPHC, or THP in the Massachusetts All-Payer Claims Database.1 , 2 Identifying instances of non-recommended care in claims data has a
viii For example, one of the measures, imaging for back pain, is also a Healthcare Effectiveness Data and Information Set (HEDIS) measure and has been monitored and reported on by CHIA in its Annual Re-port on the Performances of the Massachusetts Health Care System.
Exhibit 7.3: APM uptake and HSA TME growth in the next year, by PCP group, 2013-2015
Notes: TME = total medical expenses; HSA = health status-adjusted; APM = alternative payment methods; PCP = primary care provider. High APM uptake defined as providers with more than 74 percent of their members under APMs. TME is the combined normalized health status-adjusted TME weighted across the three largest commercial payers (see Technical Appendix for details). Analysis includes the same PCP groups included in Exhibit 7.1.Sources: HPC analysis of Center for Health Information and Analysis 2016 Annual Report APM and TME Databooks40% 50% 60% 70% 80% 90% 100%
-5%
0%
5%
10%
Pe
rce
nt
HS
A T
ME
gro
wth
Percent of members in APMs
2014 APM uptake/2014-2015 TME growth2013 APM uptake/2013-2014 TME growth
1%
2%
3%
Low APM uptake
High APM uptake
0.9%
2.6%
Percent HSA TME growth, 2013-2015
APM uptake vs TME growth in the next year
40% 50% 60% 70% 80% 90% 100%-5%
0%
5%
10%
Pe
rce
nt
HS
A T
ME
gro
wth
Percent of members in APMs
2014 APM uptake/2014-2015 TME growth2013 APM uptake/2013-2014 TME growth
1%
2%
3%
Low APM uptake
High APM uptake
0.9%
2.6%
Percent HSA TME growth, 2013-2015
APM uptake vs TME growth in the next yearAPM uptake vs TME growth in the next year Percent HSA TME growth, 2013-2015

58 | 2016 Cost Trends Report
Section III: Care Delivery Performance: Opportunities to Improve Quality and EfficiencyIII
number of limitations, including that some patients may have unique needs, history or predisposition not captured in claims records.3 Nevertheless, rates of many of these mea-sures are now routinely reported in the Medicare program (and in commercial populations) as important indicators of program efficiency; recent research has found, for example, that Medicare beneficiaries in Pioneer ACOs had lower rates of non-recommended care than other beneficiaries.4
The non-recommended care measures the HPC examined can be grouped into three main categories: screening mea-sures, imaging, and general procedures and surgeries. For a list of specific measures, see Technical Appendix. Over-all, Massachusetts had a rate of non-recommended care of two instances per 100 patientsix in 2013 and 2014 (which translates to 192,176 instances of low-value care performed in 2013 and 185,543 in 2014), with considerable variation
ix This measure accounts only for patients considered in-scope for the given service. That is, the denominator includes not all patients in Massachusetts, but is specific to each service and includes only patients with a given condition or a given age group for whom the service could have been provided, but is not recommended.
across measures. In 2013, imaging and lab tests represented some of the highest rates of non-recommended care use, for example imaging for plantar fasciitis (38.3 per 100 eligible patients) and back imaging for non-specific lower back pain (24.4 per 100 eligible patients).x Conversely, surgeries and invasive procedures had lower rates of non-recommended care, such as inferior vena cava (IVC) filters (0.01 per 100 eligible patients) and renal artery stenting (0.03 per 100 eligible patients).
The HPC also analyzed rates of non-recommended care by geographic region, income, gender, payer and PCP group, the latter using the HPC’s Registry of Provider Organiza-tions (RPO) data to attribute care to specific PCP groups (see Chapter 3: “The Massachusetts Provider Market” for more detail on the RPO).xi While rates of non-recommend care did not appear to vary consistently by payer or commu-
x These rates were also higher than rates for similar commercial pop-ulation in a recent analysis undertaken in Oregon. However, the populations and data specifications were not perfectly comparable. See Charlesworth CJ, et al. Comparison of Low-Value Care in Medicaid vs Commercially Insured Populations. JAMA Internal Medicine. 2016; 998-1004.
xi Claims were attributed to PCP groups using the referring provider noted on the claim, the provider rendering the service if no referring physician was indicated, and the billing provider if neither were indi-cated. Physicians were matched to their larger provider organizations using the RPO dataset. See Technical Appendix for additional details.
Exhibit 7.4: Indexed rates of non-recommended care, by provider group, 2013
Notes: PCP = primary care provider. Analysis includes the same PCP groups used in Exhibit 7.1, with the exception of New England Quality Care Alliance (NEQCA). Data include only privately insured individuals covered by Blue Cross Blue Shield of Massachusetts, Harvard Pilgrim Health Care, and Tufts Health Plan. Rates of each measure of non-recommended care by provider group are shown relative to the statewide average (indexed to 1.0 for each measure). Each dot represents one measure. A smaller subset of measures is used in this analysis (compared to the regional and payer-level analyses) due to small cell sizes in some cases. If a majority of provider groups did not meet the reporting threshold of >10 instances for a given measure, the measure was excluded from the analysis. Additionally, some measures were reported for some PCP groups, but not others.Sources: HPC analysis of Massachusetts All-Payer Claims Database, 2013 and Registry of Provider Organizations, 2016
0.0 0.5 1.0 1.5 2.0Lahey
Partners
Steward
Baystate
UMass Memorial
BIDCO
Atrius
MACIPA
BMC
Screening Surgeries & invasive procedures Imaging and lab tests
Index Rate
0.0 0.5 1.0 1.5 2.0Lahey
Partners
Steward
Baystate
UMass Memorial
BIDCO
Atrius
MACIPA
BMC
Screening Surgeries & invasive procedures Imaging and lab tests
Index Rate0.0 0.5 1.0 1.5 2.0Lahey
Partners
Steward
Baystate
UMass Memorial
BIDCO
Atrius
MACIPA
BMC
Screening Surgeries & invasive procedures Imaging and lab tests
Index Rate0.0 0.5 1.0 1.5 2.0Lahey
Partners
Steward
Baystate
UMass Memorial
BIDCO
Atrius
MACIPA
BMC
Screening Surgeries & invasive procedures Imaging and lab tests
Index Rate0.0 0.5 1.0 1.5 2.0Lahey
Partners
Steward
Baystate
UMass Memorial
BIDCO
Atrius
MACIPA
BMC
Screening Surgeries & invasive procedures Imaging and lab tests
Index Rate0.0 0.5 1.0 1.5 2.0Lahey
Partners
Steward
Baystate
UMass Memorial
BIDCO
Atrius
MACIPA
BMC
Screening Surgeries & invasive procedures Imaging and lab tests
Index Rate
0.0 0.5 1.0 1.5 2.0Lahey
Partners
Steward
Baystate
UMass Memorial
BIDCO
Atrius
MACIPA
BMC
Screening Surgeries & invasive procedures Imaging and lab tests
Index Rate0.0 0.5 1.0 1.5 2.0
Lahey
Partners
Steward
Baystate
UMass Memorial
BIDCO
Atrius
MACIPA
BMC
Screening Surgeries & invasive procedures Imaging and lab tests
Index Rate
0.0 0.5 1.0 1.5 2.0Lahey
Partners
Steward
Baystate
UMass Memorial
BIDCO
Atrius
MACIPA
BMC
Screening Surgeries & invasive procedures Imaging and lab tests
Index Rate

2016 Cost Trends Report | 59
Chapter 7: Variation in Spending by Primary Care Provider Group 7
nity income, HPC did observe persistent variation by PCP group and by geographic region. As seen in Exhibit 7.4, several PCP groups had consistently low rates of non-rec-ommended care across measures. For example, BMC and MACIPA were below the state average for all of the measures, and Atrius performed below the state-wide rate for most measures. Most groups had either similarly low or similar-ly high rates across all measures in both 2013 and 2014.xii
A recent analysis of rates of non-recommended care within the Medicare program similarly found that provider groups tended to be consistent across measures and over time.5 Ex-amples of best practices shared by PCP groups with lower rates include leveraging their electronic medical record (EMR) systems to provide alerts to physicians who may be about to perform a non-recommended service (which is also recently noted in the literature as an important strate-gy),6 incorporating these and other measures into monthly quality report cards, using clinically-respected physician champions to disseminate best practices on measures within their expertise, and in one case, leveraging grant funding from MassHealth’s Delivery System Transformation Initia-tives (DSTI) to improve adherence to the Choosing Wisely recommendations.
Finally, rates of non-recommended care also varied by HPC region (see Exhibit 7.5). Rates were similar for the two measures displayed in Exhibit 7.5 and were higher in the Upper North Shore, Central Massachusetts, Fall River, and New Bedford, while lower in the Metro Boston and Berk-shires regions. Further analyses on this topic are necessary to examine whether variation in rates results from differences in provider practice patterns or patient characteristics.
xii 2014 results are preliminary, but suggest that rates for provider systems were similar to those in 2013. Rates of lower-back pain imaging in 2014 were compared to HEDIS rates for the same measure calculated by Massachusetts Health Quality Partners and reported in CHIA’s 2015 Report on Provider Quality. Rates were similar across PCP groups between both analyses.
REFERENCES1 Colla CH, et al. Choosing wisely: prevalence and correlates of
low-value health care services in the United States. Journal of General Internal Medicine. 2014; 221-228.
2 Schwartz AL, et al. Measuring low-value care in Medicare. JAMA Internal Medicine. 2014; 1067-1076.
3 de Vries EF, et al. Are low-value care measures up to the task? A systematic review of the literature. BMC Health Services Re-search. 2016.
4 Schwartz AL, et al. Changes in low-value services in year 1 of the Medicare Pioneer Accountable Care Organization Program. JAMA Internal Medicine. 2015; 1815-1825.
5 Schwartz AL, et al. Low‐Value Service Use in Provider Organiza-tions. Health Services Research. 2016.
6 Rumball-Smith J, et al. Using the electronic health record to understand and minimize overuse. JAMA. 2017; 317(3):257-258.
Exhibit 7.5: Rates of non-recommended care for two select-ed measures, by HPC region, 2013-2014
Notes: Data include privately insured individuals covered by Blue Cross Blue Shield of Massachusetts, Harvard Pilgrim Health Care, and Tufts Health Plan.Source: HPC analysis of Massachusetts All-Payer Claims Database, 2013 and 2014 data combined
21-2323-2525+
Per 100 eligible patients
Back imaging for non-speci�c back pain
Imaging for diagnosis of plantar fasciitis
31-3535-4040-4545+
Per 100 eligible patients
Back imaging for non-specific back pain
21-2323-2525+
Per 100 eligible patients
Back imaging for non-speci�c back pain
Imaging for diagnosis of plantar fasciitis
31-3535-4040-4545+
Per 100 eligible patients
Imaging for diagnosis of plantar fasciitis
21-2323-2525+
Per 100 eligible patients
Back imaging for non-speci�c back pain
Imaging for diagnosis of plantar fasciitis
31-3535-4040-4545+
Per 100 eligible patients
21-2323-2525+
Per 100 eligible patients
Back imaging for non-speci�c back pain
Imaging for diagnosis of plantar fasciitis
31-3535-4040-4545+
Per 100 eligible patients

Section IV: Progress in aligning incentives for efficient and high quality care
60 | 2016 Cost Trends Report
ALTERNATIVE PAYMENT METHODSSection IV: Progress in aligning incentives for efficient and high quality care
ROLE OF ALTERNATIVE PAYMENT METHODSChapter 224 calls for a transition to alternative payment methods (APMs) as a key strategy to promote high-quality, efficient care and reduce health care costs. Traditional fee-for-service (FFS) payments reward providers for maximizing services rendered. In contrast, APMs, such as bundled pay-ments or global-budget contracts, seek to reward providers for keeping patients healthy, reducing unnecessary utiliza-tion, and producing high quality treatment outcomes. At the same time, evidence from a variety of sources highlights the need for improvement in extending the reach of APMs and in designing APMs in a manner that consistently and equitably reinforces quality and efficiency.1, 2, 3 While APMs hold promise, nearly half of the provider systems testifying as part of the 2016 Annual Cost Trends Hearings report-ed barriers to increasing APM adoption, such as lack of infrastructure, provider reluctance, and inadequate size to take on financial risk. This chapter reviews the progress of APMs in Massachusetts and elsewhere and comments on opportunities to advance their use.
TARGETS FOR APMS IN MASSACHUSETTSChapter 224 requires commercial health plans to reduce the use of FFS payments to the maximum extent feasible and requires all health plans (both commercial and public) to report their use of APMs.i The Massachusetts Health Connector, the Group Insurance Commission (GIC), and MassHealth are also required to implement APMs to the maximum extent possible.
In the 2015 Cost Trend Report,4 the HPC noted that the expansion of APM coverage had stalled in the commercial sector and called for payers and providers to continue to
i Section 280(c): Private health plans shall to the maximum extent feasible reduce the use of fee-for-service payment mechanisms in order to promote high-quality, efficient care delivery.
focus on increasing the adoption and effectiveness of APMs, identifying two specific goals:
� APMs for HMO patients. All commercial payers should increase the use of global APMs to pay for at least 80 percent of their health maintenance organiza-tion (HMO)-covered lives in 2017.
� APMs for PPO patients. Market participants should begin introducing APMs for preferred provider orga-nization (PPO) products with the goal of reaching at least 33 percent of their PPO lives in 2017.
In addition, the HPC encouraged payers and providers to develop and adopt arrangements to include behavioral health spending in APM budgets, to agree on and institute a common methodology for risk adjustment, and to develop a coordinated quality strategy that is aligned across public agencies and market participants.
LEVELS AND TRENDS OF APMS IN MASSACHUSETTSAPM coverage in 2015In Massachusetts, the overall rate of residents covered by APMs in 2015 declined to 36 percent from 38 percent in 2014 (see Exhibit 8.1). Virtually all of the commercial and Medicare Advantage members covered under APMs were covered by global budget contracts (as opposed to other types of APMs).ii
The rate of all commercial members covered by APMs decreased to 35 percent in 2015 from 37 percent in 2014, after increasing between 2013 and 2014. Across commer-cial plans, APM coverage within HMOs fell to 58 percent
ii CHIA tracks several categories of APMs including those using bun-dled payments, global budgets, and limited budget models. These other categories make up a tiny minority among all APMs. For more information on APM coverage in Massachusetts, see CHIA’s 2016 Annual Report on the Performance of the Massachusetts Health Care System.
8

2016 Cost Trends Report | 61
Chapter 8: Alternative Payment Methods 8
in 2015, two percentage points below the HPC’s target of 60 percent by 2016. The decrease in APM coverage within HMOs was driven largely by a decrease in the percentage of HMO members covered by APMs in Blue Cross Blue Shield of Massachusetts (BCBS) (91 percent in 2014 to 86 percent in 2015) and Tufts Health Plan (THP) (60 percent in 2014 to 47 percent in 2015). As a result, it appears un-likely the market overall will accomplish the HPC’s target of 80 percent APM coverage of commercial HMOs by 2017 without substantial effort on the part of payers and provid-ers. The commercial PPO market’s APM coverage rate of 1 percent in 2015 reflects the many challenges associated with introducing APMs for PPO products. Payers, however, report recent progress in this area, as discussed below.
Despite its drop from 2014, BCBS has 86 percent of HMO members seeking care from a provider under an APM. As of 2015, CHIA reports that three of the six largest Massa-chusetts-based commercial payers – BCBS, Harvard Pilgrim Health Care (HPHC) and Health New England (HNE) – met the HPC’s target of covering 60 percent of HMO members in global-budget payment models.iii , 5 Among the
iii The six largest MA-based commercial payers include Blue Cross Blue Shield of Massachusetts, Harvard Pilgrim Health Care, Tufts Health Plan, Fallon Health, Neighborhood Health Plan, and Health New England.
six largest Massachusetts-based commercial payers, APM adoption across all members ranged from 28.7 percent (Fallon Health) to 69.8 percent (HNE) in 2015 – though these rates are strongly affected by the percentage of each payer’s business that is made up of HMO products versus PPO products.
Across public payers, APM coverage among MassHealth managed care organization (MCO) and primary care cli-nician (PCC) plans remained relatively stable in 2015 at 32 and 23 percent, respectively. MassHealth launched an APM program to support accountable care organizations (ACOs) starting in 2016 with six pilot ACOs and rolling out more broadly at the end of 2017, as described in the section below. APM coverage among Original Medicare and Medicare Advantage plans decreased slightly in 2015, with 38 and 58 percent of their members covered by APMs, respectively. Rates of APM coverage in Original Medicare in Massachusetts are still substantially higher than in the U.S. overall. In Original Medicare nationwide, ACO participation increased to 20 percent in 2015 from 16 percent in 2014.iv
iv This trend reflects a decrease in participation in the Pioneer ACO program and an increase in MSSP participation in the U.S. overall. In Massachusetts, two Pioneer ACOs terminated their involvement in the Pioneer program in 2015: Steward Healthcare and Mount Auburn Cambridge Independent Practice Association dropped out of the Pioneer ACO program in 2015. Steward Healthcare joined the Next Generation ACO model in 2016.
Exhibit 8.1: Proportion of member months under alternative payment methods (APMs) by insurance category, 2013-2015
Note: *2015 results for Original Medicare include an estimate for certain populations. See Technical Appendix. Sources: Centers for Medicare & Medicaid Services, 2014-2016; Center for Health Information and Analysis, 2016
2013 20152014
TotalMedicare Advantage
MassHealth MCO
MassHealth PCC
Original Medicare
Commercial PPO
Commercial HMO
All commercial
33%
37%
35%
57%
35%
40%
38%*
14%
22% 23%
43%
31%32%
63%
35%38%
36%
62%
58%
1% 2%1%
64%
58%
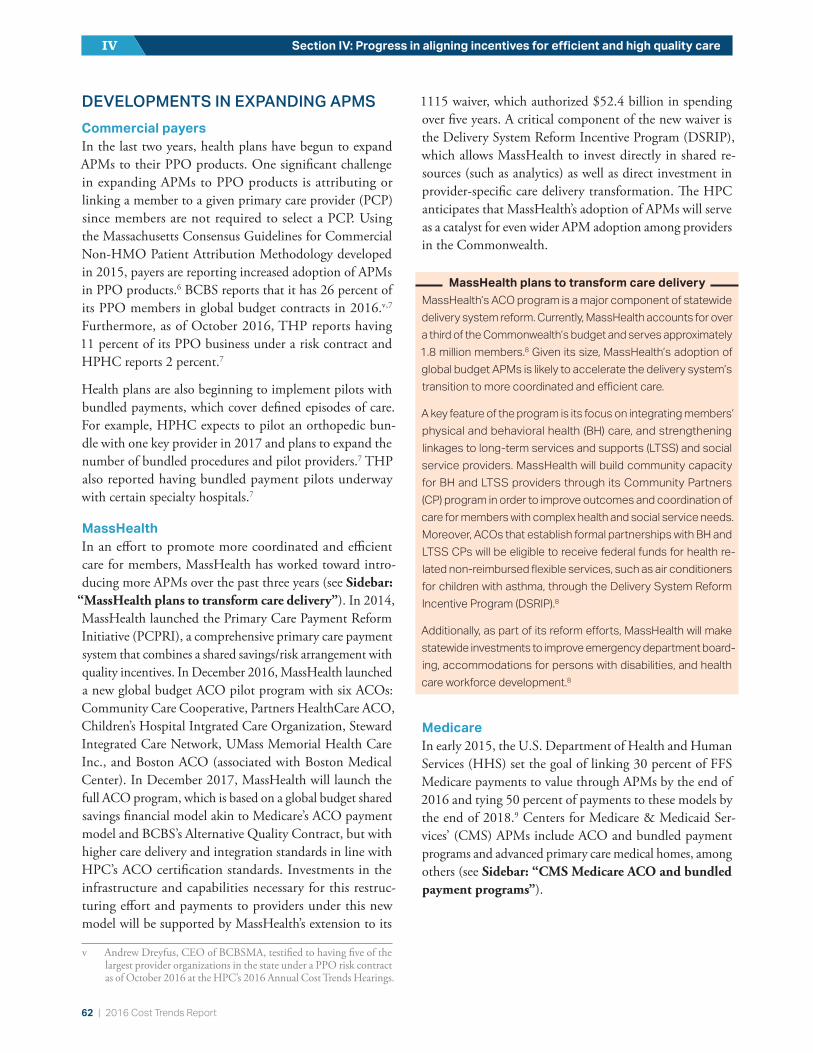
62 | 2016 Cost Trends Report
Section IV: Progress in aligning incentives for efficient and high quality careIV
DEVELOPMENTS IN EXPANDING APMSCommercial payersIn the last two years, health plans have begun to expand APMs to their PPO products. One significant challenge in expanding APMs to PPO products is attributing or linking a member to a given primary care provider (PCP) since members are not required to select a PCP. Using the Massachusetts Consensus Guidelines for Commercial Non-HMO Patient Attribution Methodology developed in 2015, payers are reporting increased adoption of APMs in PPO products.6 BCBS reports that it has 26 percent of its PPO members in global budget contracts in 2016.v , 7 Furthermore, as of October 2016, THP reports having 11 percent of its PPO business under a risk contract and HPHC reports 2 percent.7
Health plans are also beginning to implement pilots with bundled payments, which cover defined episodes of care. For example, HPHC expects to pilot an orthopedic bun-dle with one key provider in 2017 and plans to expand the number of bundled procedures and pilot providers.7 THP also reported having bundled payment pilots underway with certain specialty hospitals.7
MassHealthIn an effort to promote more coordinated and efficient care for members, MassHealth has worked toward intro-ducing more APMs over the past three years (see Sidebar:
“MassHealth plans to transform care delivery”). In 2014, MassHealth launched the Primary Care Payment Reform Initiative (PCPRI), a comprehensive primary care payment system that combines a shared savings/risk arrangement with quality incentives. In December 2016, MassHealth launched a new global budget ACO pilot program with six ACOs: Community Care Cooperative, Partners HealthCare ACO, Children’s Hospital Intgrated Care Organization, Steward Integrated Care Network, UMass Memorial Health Care Inc., and Boston ACO (associated with Boston Medical Center). In December 2017, MassHealth will launch the full ACO program, which is based on a global budget shared savings financial model akin to Medicare’s ACO payment model and BCBS’s Alternative Quality Contract, but with higher care delivery and integration standards in line with HPC’s ACO certification standards. Investments in the infrastructure and capabilities necessary for this restruc-turing effort and payments to providers under this new model will be supported by MassHealth’s extension to its
v Andrew Dreyfus, CEO of BCBSMA, testified to having five of the largest provider organizations in the state under a PPO risk contract as of October 2016 at the HPC’s 2016 Annual Cost Trends Hearings.
1115 waiver, which authorized $52.4 billion in spending over five years. A critical component of the new waiver is the Delivery System Reform Incentive Program (DSRIP), which allows MassHealth to invest directly in shared re-sources (such as analytics) as well as direct investment in provider-specific care delivery transformation. The HPC anticipates that MassHealth’s adoption of APMs will serve as a catalyst for even wider APM adoption among providers in the Commonwealth.
MassHealth plans to transform care deliveryMassHealth’s ACO program is a major component of statewide delivery system reform. Currently, MassHealth accounts for over a third of the Commonwealth’s budget and serves approximately 1.8 million members.8 Given its size, MassHealth’s adoption of global budget APMs is likely to accelerate the delivery system’s transition to more coordinated and efficient care.
A key feature of the program is its focus on integrating members’ physical and behavioral health (BH) care, and strengthening linkages to long-term services and supports (LTSS) and social service providers. MassHealth will build community capacity for BH and LTSS providers through its Community Partners (CP) program in order to improve outcomes and coordination of care for members with complex health and social service needs. Moreover, ACOs that establish formal partnerships with BH and LTSS CPs will be eligible to receive federal funds for health re-lated non-reimbursed flexible services, such as air conditioners for children with asthma, through the Delivery System Reform Incentive Program (DSRIP).8
Additionally, as part of its reform efforts, MassHealth will make statewide investments to improve emergency department board-ing, accommodations for persons with disabilities, and health care workforce development.8
MedicareIn early 2015, the U.S. Department of Health and Human Services (HHS) set the goal of linking 30 percent of FFS Medicare payments to value through APMs by the end of 2016 and tying 50 percent of payments to these models by the end of 2018.9 Centers for Medicare & Medicaid Ser-vices’ (CMS) APMs include ACO and bundled payment programs and advanced primary care medical homes, among others (see Sidebar: “CMS Medicare ACO and bundled payment programs”).

2016 Cost Trends Report | 63
Chapter 8: Alternative Payment Methods 8
CMS Medicare ACO and bundled payment programsAccountable Care Organizations (ACOs)The CMS ACO models remain voluntary for provider organizations to participate in and provider organizations may discontinue par-ticipation at any time.
• Pioneer ACO. Medicare’s first ACO demonstration program launched in 2011 for a five-year term, offering downside risk oppor-tunities to large provider organizations. In 2016, the final year of the program, there were three Pioneer ACOs in Massachusetts (Atrius Health, Beth Israel Deaconess Care Organization, and Partners HealthCare).
• Medicare Shared Savings Program (MSSP). Medicare’s lower-risk ACO program, which launched in 2013, initially offered provider organizations three tracks with increasing levels of upside risk and included a downside option when the program was revised in 2015. There are eleven Massachusetts-based MSSP provider organizations with another five located in neighboring states with operations in Massachusetts.
• Next Generation ACO. CMS introduced this program in 2015, offering provider organizations higher levels of downside risk, as well as new beneficiary engagement tools such as a financial reward for staying within the ACO network. Steward Health System and Pioneer Valley Accountable Care (Baystate Health System) joined this program in 2016. Steward and Pioneer Valley had previously participated in Pioneer ACO and MSSP, respectively.
Bundled payment initiatives• The Bundled Payments for Care Improvement Initiative (BCPI) is a voluntary program that began in 2013. Participating providers
choose to receive a bundled payment for one or more episodes of care, ranging from diabetes to joint replacement, and also choose the extent of the bundle (inpatient only, inpatient plus post-acute care [PAC], PAC only, inpatient plus professional).10, 11 Massachusetts providers participating in BCPI include Hebrew Senior Life, Steward Health System, and UMass Memorial Health Care. Early results of the BPCI program’s impact on cost and quality are mixed, but orthopedic bundle results were more positive.12
• The Comprehensive Care for Joint Replacement payment model requires hospitals in 67 geographic regions to accept bundled payments for inpatient hip and knee replacements for five years starting January, 2016. However, none of the mandatory service areas for this bundle are in Massachusetts.
• CMS introduced a mandatory bundle for cardiac episodes, specifically bypass surgeries and heart attacks. The five-year demon-stration will go into effect in July, 2017, with 98 geographic regions, including one in Massachusetts.13, 14
Under the Medicare Access & CHIP Reauthorization Act (MACRA) of 2015 and CMS’s implementing regulations, Medicare physician payments will now be linked more closely to quality performance. Replacing the patchwork system of Medicare quality reporting programs (i.e., PQRS, Meaningful Use, and Value-Based Modifier), the regulations provide two paths for payment. The first is the Merit-Based Incentive Payment System (MIPS), through which provid-ers earn a performance-based payment adjustment of their FFS revenue based on their performance on a number of self-selected quality measures in 4 categories: quality, improvement activities, advancing care information, and cost/resource use. The second is the Advanced Alternative Payment Models (Advanced APMs) path, through which providers that participate in the Next Generation ACO, Shared Savings programs, or CPC+ are eligible for the quality bonus, further incentivizing health systems to enter into ACO programs. MACRA goes into effect in 2019 and will be based on performance in the 2017 calendar year.
PRIORITY AREAS FOR FURTHER DEVELOPMENT: REFINING APMS While payers and providers have made considerable progress in implementing APMs across the Commonwealth, this progress has resulted in a variety of contractual arrange-ments using disparate approaches to ACO definition, risk adjustment, attribution, and measuring and rewarding the quality of care, as well as expectations for care delivery. Opportunities exist to improve each of these components to realize the quality improvement and cost containment goals of APMs.
Care delivery standards for ACOsAs payers enter into APMs with providers, they need to make decisions about the financial and clinical readiness of provider systems to be accountable for patient outcomes and costs across the care continuum. Chapter 224 requires the HPC to set care delivery standards for ACOs and in 2017, the HPC will launch the ACO certification program. The certification program puts forth a set of standards for how ACOs organize and govern themselves, provide inte-

64 | 2016 Cost Trends Report
Section IV: Progress in aligning incentives for efficient and high quality careIV
grated care for their populations across the continuum, and perform under quality-based risk contracts. The program is designed to promote transparency about ACOs to pro-mote learning of best practices. MassHealth requires ACOs participating in its global budget model to be certified by the HPC. Other payers looking to enter into or expand APM arrangements with provider organizations may also use the HPC certification program as a validated approach to assess organizational capabilities that will help lead to success under risk contracts.
Quality measurement evolutionWritten testimony from both payers and providers demon-strates a consensus that alignment and improvement in quality measurement is critical.7 Massachusetts providers reported that they are tracking over 300 quality measures, some of which vary across risk contracts. Many of these measures focus on processes of care, such as cancer screenings or chronic disease management tests, and not health out-comes or metrics that may be more meaningful to patients such as functional status after a surgery. Payers use different measure specifications, reporting methods and timelines, and benchmarking approaches to these measures.7 Several provider organizations reported that the lack of alignment in quality measurement contributes to physician burnout alongside other administrative issues such as new coding requirements and electronic medical record implementa-tions. The variety of quality measures used in each APM may undermine the collective ability to improve patient care and outcomes.
A majority of quality measures in APMs today focus on processes of care because these measures are more easily calculated from administrative data such as claims, while outcome measures require clinical data or patient reported data that must be reported by providers to payers in order to calculate performance. There is a growing interest in using outcome measures to evaluate population health and health system performance, yet these measures often require clinical chart reviews and are burdensome to collect and measure.15 Presently, provider systems have to report clinical data for the outcomes measures in their risk contracts individual-ly to each payer. The reporting mechanisms vary widely in sophistication from secure file transfer to easier-to-use websites to linkages with electronic medical record systems. At the 2016 Annual Cost Trends Hearing and in testimony, providers and payers called for a centralized method for reporting clinical outcome measures that would offer both providers and payers timely access to this data. Providing more timely and actionable data, particularly on an aligned
set of patient outcomes, for which data are derived from, clinical data sources, would greatly improve provider systems’ ability to drive quality improvement.
Improving risk adjustmentThe majority of payers have achieved alignment around risk adjustment methodologies, as most are using industry-stan-dard approaches that adjust risk based on patient claims using algorithms such as the DxCG predictive modeling software. Current risk adjustment methods, however, do not typically account for sociodemographic risk factors and other social determinants of health. Furthermore, methods are presently based on patients’ age, sex, and clinical his-tory, and may not work as well for certain subpopulations, such as children. Accounting for all potential risk factors is important as research has found that socio demographic factors can have a substantial impact on health, spending and health outcomes; not accounting for these can penal-ize a provider organization that takes on financial risk for disadvantaged populations.16 MassHealth has proposed a new risk adjustment methodology for their ACO payment model that will account for members’ social risk factors.
Integration of behavioral health and long-term services and supports in APMsAnother area for improvement of APMs is the integration of behavioral health (BH). With the exception of BCBS and THP, many commercial payers exclude BH from risk contracts and subcontract with managed BH organizations to process BH claims. This exclusion results in structures and incentives that may weaken efforts to foster provider accountability for total cost of care and to properly integrate BH and medical care. At the same time, many providers may find it difficult to assume financial accountability for BH care, given the gaps in the delivery system and the short-comings of the available data.vi Efforts to develop APMs that include BH are integral to delivery system integration efforts for patients with BH needs.
Relatedly, promoting linkages between medical teams, BH providers, long-term services and supports (LTSS) providers and social services is fundamental to successfully improve population health. MassHealth seeks to drive progress in this area through the Community Partners (CP) program, which will certify BH and LTSS providers and require Mass-Health ACOs to partner with CPs, as described above. One of the main barriers to integrating care across these entities is the lack of infrastructure to coordinate care and facilitate
vi Federal privacy regulation imposes some limits on the use and dis-tribution of behavioral health data to providers, most notably data on substance use disorder diagnosis and treatment.

2016 Cost Trends Report | 65
Chapter 8: Alternative Payment Methods 8
data sharing between organizations/providers. MassHealth’s DSRIP program will make targeted investments to better develop this infrastructure to share data.
Improving financial methodologies to address price variationFinally, financial benchmarking methodologies generally employ historic spending rates to set the budget and targets for risk contracts, perpetuating unwarranted variation in payment rates (see sidebar in Chapter 3: “The Massachu-setts Provider Market: Status and Trends”) and, under most global budget arrangements, most payers reimburse providers on a FFS basis with a settlement after the perfor-mance year ends.17 Provider groups that enjoy larger budgets can invest in building capabilities required to be successful in global contracts. Revisiting how global budgets are de-termined is critical to expand APMs and enable provider organizations to succeed in these contracts, while ensuring sufficient incentives to encourage efficient care delivery.
REFERENCES1 Malinak J et al. Principles for provider incentives in CMS’s alter-
native payment models. Healthcare. 2016 May.
2 Baicker K, Chernew ME. Alternative Alternative Payment Models. JAMA Internal Medicine. 2017 Jan 3.
3 Zuvekas SH, Cohen JW. Fee-for-service, while much maligned, remains the dominant payment method for physician visits. Health Affairs. 2016 Mar 1;35(3):411-4.
4 Health Policy Commission. 2015 Cost Trends Report. 2016 Jan.
5 Center for Health Information and Analysis. Performance of the Massachusetts Health Care System: Annual Report. 2016 Sep.
6 Mariotti, M. Consensus Guidelines for Commercial Non-HMO Patient Attribution Methodology. Atrius Health. 2015 Aug.
7 Health Policy Commission. Pre-filed Testimony Pursuant to the 2016 Annual Cost Trends Hearing. 2016 Oct.
8 MassHealth Restructuring Summary. 2016 Apr 14.
9 Burwell SM. Setting value-based payment goals—HHS efforts to improve U.S. health care. New England Journal of Medicine. 2015; 372:897-9.
10 Zezza MA, et al. The Bundled Payment for Care Improvement Initiative: achieving high-value care with a single payment. The Commonwealth Fund. 2012 Jan.
11 Centers for Medicare & Medicaid Services. Bundled Payments for Care Improvement (BPCI) Initiative: General Information. 2017 Jan. Available from: https://innovation.cms.gov/initiatives/bun-dled-payments.
12 The Lewin Group. CMS Bundled Payments for Care Improvement (BPCI) Initiative Models 2-4: Year 1 Evaluation & Monitoring Annual Report. 2015 Feb.
13 Centers for Medicare and Medicaid Services. Notice of proposed rulemaking for bundled payment models for high-quality, coor-dinated cardiac and hip fracture care. 2016 Jul.
14 Centers for Medicare & Medicaid Services. Proposed Rules. 2016 Aug 2. Available from: http://f.datasrvr.com/fr1/016/35672/81_Fed_Reg_-_pgs_50817-50827.pdf.
15 Safran DG, et al. Accelerating and Aligning Population-Based Payment Models. Health Care Payment Learning & Action Net-work. 2016 April 22.
16 Galea S et al. Estimated Deaths Attributable to Social Factors in the United States. American Journal of Public Health. 2011 Aug; 101 no. 8:1456–1465.
17 Health Policy Commission. Provider Price Variation Stakeholder Discussion Series Summary Report. 2016 Jul.

66 | 2016 Cost Trends Report
DEMAND-SIDE INCENTIVESSection IV: Progress in Aligning Incentives for Efficient and High Quality Care
In the 2015 Cost Trends Report, the Health Policy Commis-sion (HPC) examined developments toward a value-based health care market with improved market competition, innovative insurance products, and supportive tools. The Board’s recommendations included encouraging employers to offer plan choice and reward employees for choosing high-value plans, encouraging payers to expand use of tiered and limited products as well as expand the utility of price and quality websites, and encouraging all purchasers of care to consider tools such as cash-back incentives and reference pricing to foster high-value provider choices. This chapter updates progress in Massachusetts in the use of these tools, products, and market changes.
USE OF DEMAND-SIDE TOOLS AND PRODUCTS IN 2016Chapter 224 of the Acts of 2012 required Massachusetts health insurers to develop websites with accessible price infor-mation about proposed treatments and services by October, 2014. While all of the major payers had established such sites, with the exception of Aetna, the health plan websites had not been extensively used by enrollees by early 2015. In 2016, however, Harvard Pilgrim Health Care (HPHC) reported a notable increase in use (from 19,500 views in the first two quarters of 2015 to 24,200 in the first two quarters of 2016) and Blue Cross and Blue Shield of Massachusetts (BCBS) reported an increase from 645 views in the first two quarters of 2015 to almost 15,000 in the first two quarters of 2016.1 Of note, BCBS launched an online cost estima-tion tool at the end of 2015, which likely accounts for the substantial increase in inquiries.
The use of cash-back incentives, whereby members receive direct cash rebates when they use high-value providers, has been limited. Notably, UniCare adopted this strategy for its members covered under the Group Insurance Commission (GIC) in 2016. The program’s vendor has claimed reduc-tions in total health care spending (and market shifts toward
lower cost providers in some cases) when implemented for state employees in New Hampshire, although a rigorous evaluation of the program’s impact has not been performed.2
Uptake of tiered network products (which assign higher cost-sharing to higher-cost providers) in Massachusetts re-mained steady at 15.9 percent in 2015 (versus 16.0 percent in 2014), while the proportion of the state’s commercial mem-bers in limited network products (which exclude coverage to non-network providers) inched upward from 3.0 percent in 2014 to 3.2 percent in 2015. Nationally, limited network products have been a popular choice in the Affordable Care Act (ACA) exchanges, which place intense pressure on plans to offer low premiums due to the lower incomes of enrollees and fixed-dollar tax credits.1 , 2 The share of Massachusetts Health Connector enrollees in limited network plans was 4 percent in 2015, which is below national figures.i
MARKET STRUCTURE: THE SMALL AND MID-SIZED GROUP MARKETIn 2015, the HPC also recommended improvements to the structure of the employer-based health insurance market to impact the competitiveness of the health care system. In particular, improvements can be made in markets serving small employers.3 This section describes health insurance costs and offerings by market segment, focusing on the small employer (fewer than 50 employees) market, which accounts for 11 percent of all commercial health insurance enroll-ees in Massachusetts, and 28 percent of the fully-insured market. Almost all small firms are fully-insured, meaning they purchase health insurance for a fixed premium and the
i Limited network products made up 7 percent of the Massachusetts individual market in 2013 but just 4 percent in 2015 (compared to 3 percent outside of the individual market). The drop is largely attributable to the inclusion of a large number of members from former Commonwealth Care plans (such as the Tufts Public Health Plan) in 2015 in the individual market totals. The Tufts plan, like many others available through the Massachusetts Health Connector, is a low-premium plan and excludes most providers in the Partners HealthCare System, but is not considered a limited network plan.
9
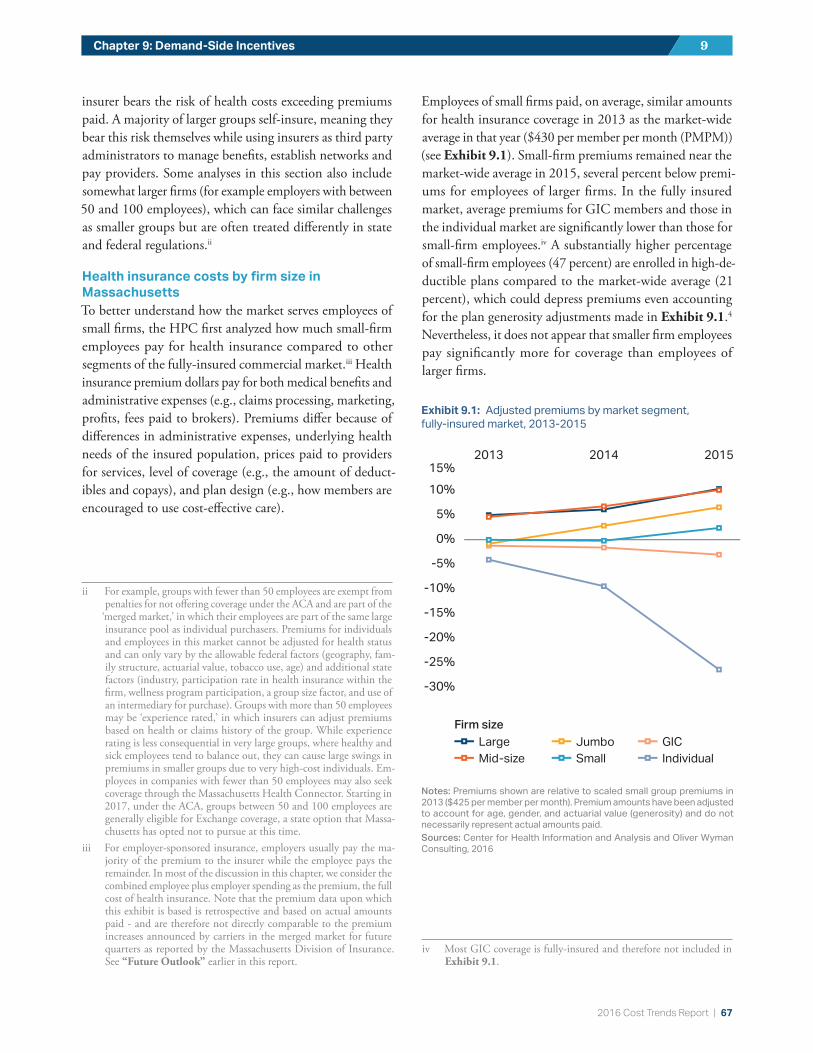
2016 Cost Trends Report | 67
Chapter 9: Demand-Side Incentives 9
insurer bears the risk of health costs exceeding premiums paid. A majority of larger groups self-insure, meaning they bear this risk themselves while using insurers as third party administrators to manage benefits, establish networks and pay providers. Some analyses in this section also include somewhat larger firms (for example employers with between 50 and 100 employees), which can face similar challenges as smaller groups but are often treated differently in state and federal regulations.ii
Health insurance costs by firm size in MassachusettsTo better understand how the market serves employees of small firms, the HPC first analyzed how much small-firm employees pay for health insurance compared to other segments of the fully-insured commercial market.iii Health insurance premium dollars pay for both medical benefits and administrative expenses (e.g., claims processing, marketing, profits, fees paid to brokers). Premiums differ because of differences in administrative expenses, underlying health needs of the insured population, prices paid to providers for services, level of coverage (e.g., the amount of deduct-ibles and copays), and plan design (e.g., how members are encouraged to use cost-effective care).
ii For example, groups with fewer than 50 employees are exempt from penalties for not offering coverage under the ACA and are part of the
‘merged market,’ in which their employees are part of the same large insurance pool as individual purchasers. Premiums for individuals and employees in this market cannot be adjusted for health status and can only vary by the allowable federal factors (geography, fam-ily structure, actuarial value, tobacco use, age) and additional state factors (industry, participation rate in health insurance within the firm, wellness program participation, a group size factor, and use of an intermediary for purchase). Groups with more than 50 employees may be ‘experience rated,’ in which insurers can adjust premiums based on health or claims history of the group. While experience rating is less consequential in very large groups, where healthy and sick employees tend to balance out, they can cause large swings in premiums in smaller groups due to very high-cost individuals. Em-ployees in companies with fewer than 50 employees may also seek coverage through the Massachusetts Health Connector. Starting in 2017, under the ACA, groups between 50 and 100 employees are generally eligible for Exchange coverage, a state option that Massa-chusetts has opted not to pursue at this time.
iii For employer-sponsored insurance, employers usually pay the ma-jority of the premium to the insurer while the employee pays the remainder. In most of the discussion in this chapter, we consider the combined employee plus employer spending as the premium, the full cost of health insurance. Note that the premium data upon which this exhibit is based is retrospective and based on actual amounts paid - and are therefore not directly comparable to the premium increases announced by carriers in the merged market for future quarters as reported by the Massachusetts Division of Insurance. See “Future Outlook” earlier in this report.
Employees of small firms paid, on average, similar amounts for health insurance coverage in 2013 as the market-wide average in that year ($430 per member per month (PMPM)) (see Exhibit 9.1). Small-firm premiums remained near the market-wide average in 2015, several percent below premi-ums for employees of larger firms. In the fully insured market, average premiums for GIC members and those in the individual market are significantly lower than those for small-firm employees.iv A substantially higher percentage of small-firm employees (47 percent) are enrolled in high-de-ductible plans compared to the market-wide average (21 percent), which could depress premiums even accounting for the plan generosity adjustments made in Exhibit 9.1.4 Nevertheless, it does not appear that smaller firm employees pay significantly more for coverage than employees of larger firms.
iv Most GIC coverage is fully-insured and therefore not included in Exhibit 9.1.
-30%
-25%
-20%
-15%
-10%
-5%
0%
5%
10%15%
201520142013
LargeMid-size
SmallJumbo
IndividualGIC
Firm size
-30%
-25%
-20%
-15%
-10%
-5%
0%
5%
10%15%
201520142013
LargeMid-size
SmallJumbo
IndividualGIC
Firm size
-30%
-25%
-20%
-15%
-10%
-5%
0%
5%
10%15%
201520142013
LargeMid-size
SmallJumbo
IndividualGIC
Firm size
-30%
-25%
-20%
-15%
-10%
-5%
0%
5%
10%15%
201520142013
LargeMid-size
SmallJumbo
IndividualGIC
Firm size
Exhibit 9.1: Adjusted premiums by market segment, fully-insured market, 2013-2015
Notes: Premiums shown are relative to scaled small group premiums in 2013 ($425 per member per month). Premium amounts have been adjusted to account for age, gender, and actuarial value (generosity) and do not necessarily represent actual amounts paid.Sources: Center for Health Information and Analysis and Oliver Wyman Consulting, 2016
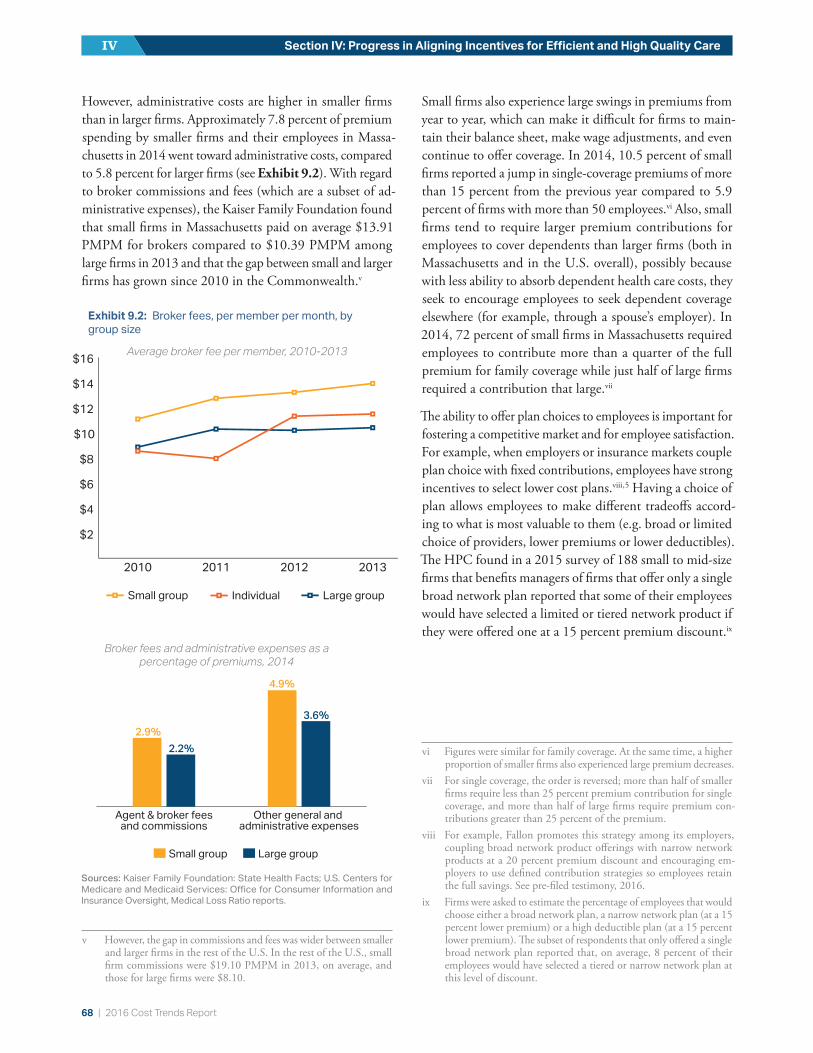
68 | 2016 Cost Trends Report
Section IV: Progress in Aligning Incentives for Efficient and High Quality CareIV
However, administrative costs are higher in smaller firms than in larger firms. Approximately 7.8 percent of premium spending by smaller firms and their employees in Massa-chusetts in 2014 went toward administrative costs, compared to 5.8 percent for larger firms (see Exhibit 9.2). With regard to broker commissions and fees (which are a subset of ad-ministrative expenses), the Kaiser Family Foundation found that small firms in Massachusetts paid on average $13.91 PMPM for brokers compared to $10.39 PMPM among large firms in 2013 and that the gap between small and larger firms has grown since 2010 in the Commonwealth.v
v However, the gap in commissions and fees was wider between smaller and larger firms in the rest of the U.S. In the rest of the U.S., small firm commissions were $19.10 PMPM in 2013, on average, and those for large firms were $8.10.
Small firms also experience large swings in premiums from year to year, which can make it difficult for firms to main-tain their balance sheet, make wage adjustments, and even continue to offer coverage. In 2014, 10.5 percent of small firms reported a jump in single-coverage premiums of more than 15 percent from the previous year compared to 5.9 percent of firms with more than 50 employees.vi Also, small firms tend to require larger premium contributions for employees to cover dependents than larger firms (both in Massachusetts and in the U.S. overall), possibly because with less ability to absorb dependent health care costs, they seek to encourage employees to seek dependent coverage elsewhere (for example, through a spouse’s employer). In 2014, 72 percent of small firms in Massachusetts required employees to contribute more than a quarter of the full premium for family coverage while just half of large firms required a contribution that large.vii
The ability to offer plan choices to employees is important for fostering a competitive market and for employee satisfaction. For example, when employers or insurance markets couple plan choice with fixed contributions, employees have strong incentives to select lower cost plans.viii , 5 Having a choice of plan allows employees to make different tradeoffs accord-ing to what is most valuable to them (e.g. broad or limited choice of providers, lower premiums or lower deductibles). The HPC found in a 2015 survey of 188 small to mid-size firms that benefits managers of firms that offer only a single broad network plan reported that some of their employees would have selected a limited or tiered network product if they were offered one at a 15 percent premium discount.ix
vi Figures were similar for family coverage. At the same time, a higher proportion of smaller firms also experienced large premium decreases.
vii For single coverage, the order is reversed; more than half of smaller firms require less than 25 percent premium contribution for single coverage, and more than half of large firms require premium con-tributions greater than 25 percent of the premium.
viii For example, Fallon promotes this strategy among its employers, coupling broad network product offerings with narrow network products at a 20 percent premium discount and encouraging em-ployers to use defined contribution strategies so employees retain the full savings. See pre-filed testimony, 2016.
ix Firms were asked to estimate the percentage of employees that would choose either a broad network plan, a narrow network plan (at a 15 percent lower premium) or a high deductible plan (at a 15 percent lower premium). The subset of respondents that only offered a single broad network plan reported that, on average, 8 percent of their employees would have selected a tiered or narrow network plan at this level of discount.
Broker fees and administrative expenses as a percentage of premiums, 2014
Small group Large group
Other general and administrative expenses
Agent & broker fees and commissions
2.9%
4.9%
2.2%
3.6%
$2
$4
$6
$8
$10
$12
$14
$16
2013201220112010
Large group
Small groupIndividual
$2
$4
$6
$8
$10
$12
$14
$16
2013201220112010
Large group
Small groupIndividual
$2
$4
$6
$8
$10
$12
$14
$16
2013201220112010
Large group
Small groupIndividual
$2
$4
$6
$8
$10
$12
$14
$16
2013201220112010
Large group
Small groupIndividual
Sources: Kaiser Family Foundation: State Health Facts; U.S. Centers for Medicare and Medicaid Services: Office for Consumer Information and Insurance Oversight, Medical Loss Ratio reports.
Exhibit 9.2: Broker fees, per member per month, by group size
Average broker fee per member, 2010-2013

2016 Cost Trends Report | 69
Chapter 9: Demand-Side Incentives 9
Among employees of small firms (fewer than 50 employees) that offer health insurance, only 31 percent were offered more than one plan to choose from, while almost half of employees who were only offered one plan were offered a high deductible plan. In contrast, a majority (60 percent) of employees of mid-sized firms (50-100 employees) were offered a choice of plans, and nearly three quarters of em-ployees of larger firms were offered at least two plans (see Exhibit 9.3).
Furthermore, few firms of any size that offered multiple plans used fixed-contribution methods (where the employer pays the same amount regardless of the plan selected by the employee). As a result, most employers contributed more of the premium when employees chose more expensive plans, reducing the incentive for employees to choose a high-value plan.
Small firms face challenges in offering multiple plan options to employees. In the HPC survey of 188 predominately small and mid-sized employers, HPC staff asked benefits managers why they did not offer plan choices to their em-ployees. Of those that offered only one plan, nearly a quarter of respondents said that offering multiple plans would be too administratively complicated, while 57 percent said that they had too few employees to offer multiple plans. Among those that did offer plan choices, when asked why they did
not use fixed dollar contributions, 58 percent stated there was no particular reason. When asked why they did not offer tiered or limited network plans, 30 percent noted that they offered only one plan and felt it should be broad, 22 percent were unaware of tiered and limited options, and 18 percent felt that they were too complicated. In a follow-up focus group with 10 of the small firm benefits managers, many expressed frustration with the complexity of offering and managing health benefits and helping employees un-derstand their benefits.
EXCHANGESHealth insurance exchanges are designed to overcome many of the challenges of the small group market. Massachusetts has two examples of robust public exchanges: the GIC, which uses an exchange for more than 400,000 state and local employees and retirees, and the Massachusetts Health Connector. Representing most of the individual market, the Health Connector is a particularly effective public exchange, with a notably low premium trend as shown in Exhibit 9.1. Established in 2006 by Chapter 58 of the Acts of 2006, the Health Connector has been in operation for longer than other state exchanges created under the ACA, and uses a number of strategies to foster high-quality, low-cost plans, most notably in its ConnectorCare program for lower-in-come individuals and families earning up to 300 percent of the Federal Poverty Level. In addition to offering a wide array of comparable choices to potential ConnectorCare enrollees, the Health Connector offers seven carriers through its ConnectorCare program (no more than five in any given region) to compete in each region for its significant volume of more than 180,000 enrollees. Until 2017, Massachusetts had made additional contributions to minimize premium differences for enrollees of the most expensive plans, but the Health Connector changed its subsidy structure for 2017 plans so that the highest level of subsidization is only available for the most competitively-priced plans.x
x This change appears to have led to significant movement away from Neighborhood Health Plan, which, as one of the more expensive plans offered, had benefited from this additional subsidy. It was also the only Health Connector plan that offered coverage of all providers in the Partners HealthCare System. See Board of Director’s Meeting Dec 8, 2016, “Open Enrollment 2017 Status,” Massachusetts Health Connector.
Fewer than 50 50-99 100+Number of employees
Multiple plansOne plan, otherOne plan, HDHP
31.3%29.7%
39.0%
59.6%
19.4% 21.1%
74.4%
11.7% 14.0%
Exhibit 9.3: Plan offerings by firm size in Massachusetts, 2014
Notes: Number of plans offered to employees by size of their company. The definition of multiple plans could include more than one plan type from a single carrier.Source: HPC analysis of the Center for Health Information and Analysis’ Massachusetts Employer Survey, 2014

70 | 2016 Cost Trends Report
Section IV: Progress in Aligning Incentives for Efficient and High Quality CareIV
In part because of the health plan competition, premiums on the Health Connector are relatively low by national standards. Monthly non-group premiums for a 40-year old non-smoking male (a single plan) for the Silver metallic tier (approximately 70 percent actuarial value) were $250 per month in 2016, below a national median of $278 (see Exhibit 9.4). Comparatively, single premiums for small firm employees in Massachusetts were significantly above the U.S. median ($485) at $520 per month in 2015.
In Massachusetts, as in other states, the Connector also offers small firms the ability to enroll their employees in dozens of ACA-compliant plans either with or without assistance from brokers. Few small firms have taken advantage of the opportunity at the Connector to date. Roughly 6,000 workers and dependents were enrolled as of 2016. There may be several reasons for this limited enrollment. First, some small employers find it convenient to use a single vendor for health insurance and other benefits such as long-term and disability insurance and retirement benefits, though these are not available with the Massachusetts Health Connector. There may also be a lack of awareness of the Connector’s offerings. For example, the Health Connector offers a 15 percent premium discount for firms that enroll employees in the Health Connector’s wellness program, but in the HPC survey of employers noted above, only 28
percent were aware of this benefit. More broadly, only 30 percent of eligible employers considered using the Health Connector to offer insurance. Among those who considered the Connector but opted not to use it, 25 percent did not believe they were eligible, 26 percent cited administrative difficulty, and 16 percent pointed to website malfunctions and technical problems.
Some of these issues may be resolved by a forthcoming redesign of the Health Connector’s small group website. Other recent developments at the state and federal level may also expand the Health Connector’s employer market and allow more Massachusetts employees to purchase insurance through the exchange. The Health Connector is currently considering strategies to implement the “employee choice” model allowed under the ACA as part of a refreshed group market platform. In contrast to the standard model wherein a small employer selects one plan or one carrier for all em-ployees, the employee choice approach allows employees to select from a wide variety of plans for which the employer makes a benchmark contribution. This approach: (a) allows employees of small businesses to pick the best plan to meet their individual needs; (b) allows the employer to predict their own costs year-over-year with greater predictability; and (c) enhances competitive dynamics between carriers in the small group market by promoting the same shop-
$200
$400
$600
$800
Massachusetts$250New Mexico
$186
Alaska$719
Monthly premium for second-lowest-cost exchange plan, single coverage
14
$200
$400
$600
$800Massachusetts
$520Mississippi$398
Alaska$770
Average monthly premium for small groups, single coverage
38
$200
$400
$600
$800
Massachusetts$250New Mexico
$186
Alaska$719
Monthly premium for second-lowest-cost exchange plan, single coverage
14
$200
$400
$600
$800Massachusetts
$520Mississippi$398
Alaska$770
Average monthly premium for small groups, single coverage
38
Monthly premium for second-lowest-cost exchange plan, single coverage
Average monthly premium for small groups, single coverage
Exhibit 9.4: Full premium costs in Massachusetts compared to other states in the Massachusetts Health Connector (top) and in the small employer-group market (bottom)
Notes: Data from the Health Connector represent the Boston metro area and are compared to premiums for the largest metro area in each of the states.Sources: Kaiser Family Foundation and U.S. Agency for Healthcare Research and Quality
2016 Cost Trends Report | 71
Chapter 9: Demand-Side Incentives 9
ping behavior exhibited by individual Exchange shoppers. Essentially, this option allows smaller firms to mimic the pro-competitive features of the individual and larger group markets.
In addition, the recently-passed federal 21st Century Cures Act could also attract more small businesses to the Con-nector in 2017.The Cures Act will give employees of small businesses access to the full functionality of the Health Connector, while allowing employers to continue to make a pre-tax contribution to their employees’ non-group pre-miums (not currently allowed) without facing penalties for not offering coverage.6
For larger firms (ineligible to use the Health Connector), private exchanges offer many of the same benefits as public exchanges, while charging a fee for the services they pro-vide. Private exchanges are growing in popularity nationally. While only 2 percent of employees in firms of more than fifty employees received coverage through a private exchange in 2016, 18 percent of employers reported that they were considering offering benefits through a private exchange.7 These exchanges often offer additional benefits beyond what may be available on public exchanges such as health and wellness benefits and other forms of insurance cover-age.8 Data on private exchanges in Massachusetts will be available in 2017 with the release of CHIA’s Massachusetts Employer Survey.
REFERENCES1 Health Policy Commission. Pre-filed Testimony Pursuant to the
2016 Annual Cost Trends Hearing. 2016 Oct.
2 Rice C. Could cash back get patients to shop smart for health-care? AthenaInsight. 2017 Jan. Available from: https://insight.ath-enahealth.com/cash-back-get-patients-shop-smart-healthcare.
3 Long M, et al. A Comparison of the Availability and Cost Cov-erage for Workers in Small Firms and Large Firms: Update from the 2015 Employer Health Benefits Survey. The Henry J. Kaiser Family Foundation. 2016 Feb.
4 Brot-Goldberg ZC. What Does a Deductible Do? The Impact of Cost-Sharing on Health Care Prices, Quantities, and Spending Dynamics. National Bureau of Economic Research. 2015.
5 Enthoven AC. The history and principles of managed competition. Health Affairs. 1993; 12:24-48.
6 Mandelbaum R. New law eases small business health care burden (but may make repealing Obamacare harder). Forbes. 2016 Dec.
7 The Kaiser Family Foundation and Health Research & Educational Trust. Employer Health Benefits: 2016 Annual Survey. p. 246-247.
8 The Kaiser Family Foundation. Examining Private Exchanges in the Employer-Sponsored Insurance Market. 2014 Sep.

72 | 2016 Cost Trends Report
POLICY RECOMMENDATIONSSection V: Recommendations and Dashboard
In light of the findings presented in this Report, as well as our other analytic and policy work throughout the year, the HPC has developed recommendations for market par-ticipants, policy makers, and government agencies. These recommendations reflect both prior and new areas of focus. The HPC has also updated its set of measures to track health system performance (see Exhibit 10.1 on page 78).
RECOMMENDATIONS
In order to constrain health care spending growth and create an affordable, accessible, and high quality system of care for all residents of the Commonwealth, we recommend that the Commonwealth take action across the following four primary areas:
1 Fostering a value-based market in which payers and providers openly compete, and in which providers are supported and equitably rewarded for providing high-quality and affordable services;
2 Promoting an efficient, high-quality, health care delivery system that improves health by delivering coordinated, patient-centered health care that accounts for patients’ behavioral, social and medical needs;
3 Advancing aligned and effective financial incentives for providers to deliver high-quality, cost effective care and for consumers and employers to make high-value choices for their care and coverage; and
4 Enhancing transparency through publicly avail-able data and information on health care system performance in order for providers, payers, patients, employers, and policymakers, including state agencies and the Legislature, to successfully implement reforms and evaluate performance over time.
FOSTERING A VALUE-BASED MARKETA transparent and competitive health care market that sup-ports and equitably rewards high-value providers, and which enables consumers and employers to afford high quality care, is essential to creating a financially sustainable health care system. To advance the goal of a more value-based market in 2017, the HPC recommends:
1 The Commonwealth should examine how health care costs differentially impact individuals, families, and businesses in Massachusetts, and should further con-sider opportunities to promote equity, affordability, and sustainability. The state should continue to track and analyze differences in health care spending, health insurance costs, and member cost-sharing across a range of dimensions, including by certain socio-demograph-ic characteristics (e.g., household income), employer characteristics (e.g., employer size, employee wages), and health status characteristics (e.g., behavioral health co-morbidity) in order to identify inappropriate dis-parities. Policies should be developed to address those disproportionately burdened by the high cost of health care in Massachusetts. For example, the cost of any given insurance product represents a larger share of total income for lower earning employees compared to higher earning employees. Employers should explore options to promote affordability for their lower-earning employees, including through salary-based employee premium contributions.
2 The Commonwealth should take action to reduce increases in drug spending including enhancing the transparency of drug prices and spending, and payers and providers should consider further opportunities to maximize value. Given the current national regulatory framework, many aspects of drug spending are outside the direct control of the state, payers, and providers in Massachusetts; significant reforms may require Federal action. However, some levers for action are available at
10
2016 Cost Trends Report | 73
Chapter 10: Policy Recommendations 10
the state level. Specifically, to address spending growth associated with pharmaceuticals:
a Require increased transparency: Building on action in other states and prior efforts in Massachusetts, the Legislature should require increased transparency in drug pricing and manufacturer rebates and use this information to enhance accountability for manufac-turers in cases where drug pricing is deemed excessive and unjustified. Increased transparency should apply to manufacturers and pharmacy benefit managers.
b Expand witness list for Cost Trends Hearing: The Legislature should add pharmaceutical and medical device manufacturers to the list of mandatory mar-ket participant witnesses at the HPC’s annual Cost Trends Hearing.
c Advocate for negotiating drug prices and feder-al regulatory review: State and federal lawmakers should advocate for legislation to allow Medicare to negotiate prescription drug prices, and for Federal review of regulations to encourage competition and value-based contracting.
d Use value-based benchmarks: Payers should pursue the use of value-based benchmarks when negotiat-ing prices, and consider opportunities for the use of risk-based contracting with manufacturers and other value-based strategies.
e Treatment protocols and guidelines: Payers and providers should work together to develop and use treatment protocols and guidelines that make appro-priate use of lower-cost drugs when available and to achieve consensus on appropriate use when new high cost drugs enter the market.
f Provide education and monitor prescribing pat-terns: Providers should disseminate information to prescribers on drug and treatment alternatives, invest in system technology to alert prescribers to alterna-tives and support adoption of treatment protocols, and support other educational activities. Providers should also monitor prescribing patterns, particularly for identification of outlier behavior, to help ensure that prescribing is consistent with value-based and evidence-based guidelines.
3 The Commonwealth should enhance out-of-network protections to implement safeguards for consumers, enhance the viability of limited and tiered network products, and address unwarranted provider price variation. Consumers and insurers may face high charges from out-of-network hospitals and physicians in certain circumstances where consumers do not have the ability or information to select an in-network provider, including in emergency situations and when services are received at in-network facilities but provided by out-of-network providers without the consumer’s informed agreement. These high out-of-network charges can create financial burdens for consumers and, when such costs are borne by insurers, they impair tiered and limited network products and increase overall spending. Drawing on models from other states (such as Connecticut, California and New York), the Legislature should require providers to inform consumers whether they are in- or out-of-network before services are delivered. The Legislature should also require that insurers hold their members harmless in cases of out-of-network emergency services and enhance consumer awareness of existing “surprise billing” protections. Finally, the Legislature should es-tablish a maximum reasonable price for such services to enhance the viability of limited and tiered network products, facilitate value-driven payer and provider rate negotiations, and ensure that out-of-network protections for consumers do not increase overall spending.
4 The Commonwealth should take action to reduce unwarranted variation in provider prices. Extensive variation in prices paid to health care providers for the same sets of services is a persistent issue in the Com-monwealth, driving increased health care spending and perpetuating inequities in the distribution of health care resources. However, unwarranted variation in provider prices is not likely to decrease absent direct policy ac-tion. The HPC will continue to monitor the extent of provider price variation in the commercial market and looks forward to working with the Special Commission on Provider Price Variation, policymakers and other stakeholders to advance specific, data-driven policies to address this pressing issue in the coming year.

74 | 2016 Cost Trends Report
Section V: Recommendations and DashboardV
5 The Commonwealth should take action to equalize payments for the same services for similar patients between hospital outpatient departments and phy-sician offices. In some cases, the same service can be provided both at hospital outpatient sites and at physician offices, but hospital outpatient department rates and cost-sharing can be substantially higher than those of physician offices for the same service due to the addition of hospital “facility fees.” This ability to receive higher reimbursement at hospital outpatient sites encourages hospitals to acquire and license physician practices as hospital outpatient sites and to provide services in hos-pital outpatient departments unnecessarily. Policymakers and payers should act to limit both newly licensed and existing sites that can bill as hospital outpatient depart-ments and implement site neutral payments for select services for similar patients, both to reduce inappropri-ate health care spending and to reduce confusion for patients who can face increased cost sharing at hospital outpatient sites.
6 The Commonwealth, payers, and providers should work to redirect community-appropriate care to high value, community settings. Specifically:
a Identify appropriate patients: Provider organizations should develop systems to identify patients who could safely receive care in community hospitals, and develop or enhance case management and patient education programs to direct community appropriate care to high-value community providers. This could include the development of referral and transfer protocols so that patients are served more often at community hospitals when clinically appropriate, instead of aca-demic medical centers (AMCs) or teaching hospitals.
b Develop information resources: Payers and pro-viders should work together to improve information resources necessary to better track and manage pa-tients across settings of care, including across provider organizations, especially to support referrals of com-munity-appropriate care to community hospitals.
c Incentivize high-value choices: Payers should encourage the use of community hospitals for com-munity-appropriate care, through consumer-focused incentives, such as specific tiering for low-acuity pro-cedures, as well as provider-focused incentives, such as rewarding providers for appropriate referral for community-appropriate care.
PROMOTING AN EFFICIENT, HIGH-QUALITY, HEALTH CARE DELIVERY SYSTEMOver its history and in the current report, the HPC’s research has highlighted Massachusetts’ high levels of spending and above average use of institutional care relative to the nation. Within the state, the HPC has also identified variation in provider practice patterns as well as health care spending in different communities.
To advance the goal of a community-based, accountable, and integrated care delivery system, the HPC recommends:
7 The Commonwealth should continue to focus on strengthening partnerships between the health care delivery system and community-based organizations in order to reduce the unnecessary hospital use and other institutional care. As part of this focus, the HPC sets the following targets:
a Reduce all-cause 30-day hospital readmissions: The Commonwealth should achieve a 20 percent reduction in all-cause, all-payer 30-day hospital readmissions relative to the 2013 level, attaining an all-payer re-admission rate below 13 percent by 2019.
b Increase the integration of behavioral health in primary care: The Commonwealth should aim to increase the number of patients cared for in an inte-grated setting. To ensure better access to integrated primary care, 25 more practices should achieve HPC PCMH PRIME certification in 2017, bringing the total number of certified practices to 53.
c Reduce the rate of discharge to institutional care following hospitalization: The Commonwealth should achieve a 5 percentage point reduction in the rate of discharge to institutional post-acute care to meet the national average (22% in MA, 17% na-tional) by 2020.
d Reduce the rate of behavioral health (BH) related ED utilization: The Commonwealth should reverse the upward trend of BH-related ED visits, consistent with success realized in reducing all other types of ED utilization.

2016 Cost Trends Report | 75
Chapter 10: Policy Recommendations 10
8 The Commonwealth, payers, and providers should continue to improve tracking and treatment of sub-stance use disorder (SUD). Because of the growing burden of opioid use disorder in the Commonwealth (opioid related ED visits increased by 87 percent between 2011 and 2015), the state should continue to track the impact of SUD on the health care system and also test, evaluate, and scale innovative care models for treatment. Investments in care delivery models that enable rapid engagement in care (e.g., in emergency settings) and integration efforts that increase availability of pharma-cological treatment of opioid use disorder in primary care will help the Commonwealth achieve the goal of making timely SUD treatment available and improve patient care.
9 The Commonwealth, payers, and providers should work to focus on the highest possible adherence to evidence-based care, including reducing provision of non-recommended care. Provider groups should track and put systems in place to reduce provision of non-rec-ommended care such as alerts embedded into electronic health records. The HPC will continue to expand evalu-ation of provider system-level trends and practice pattern variation, including referrals to institutional care and rates of non-recommended and recommended care.
ADVANCING ALIGNED AND EFFECTIVE FINANCIAL INCENTIVESAlternative payment methodsEffective APMs offer incentives that support value-based, accountable, patient-centered care. To advance the goal of more value-based care and expanded adoption of effective APMs in 2017, the HPC recommends:
10 Payers and providers should continue to focus on in-creasing the adoption of alternative payment methods (APMs). Market participants should set the follow-ing targets:
a APMs for HMO patients. All commercial payers should increase the use of APMs with the goal of having 80 percent of the state HMO population in APMs by 2017.
b APMs for PPO patients. Commercial payers should also seek to increase the use of APMs for members en-rolled in PPO plans, with the initial goal of having one third of the state PPO population in APMs by 2017.
c APMs for MassHealth members. Consistent with the target set in the state’s Medicaid 1115 waiver, at least 30 percent of eligible MassHealth members should be enrolled in an APM model by the end of 2018. A majority of provider systems in the Commonwealth should apply for participation in MassHealth’s ac-countable care organization (ACO) program in 2017.
d Bundled payments. As a complement to global pay-ment and a core strategy to reduce post-acute care utilization, payers and providers should continue to implement bundled payments for common and costly episodes of care such joint replacement, cardiac care, cancer treatment, and maternity stays.
11 Payers should align and improve features of APMs in order to increase their effectiveness in promoting high quality, efficient care.
a Quality measurement. The Commonwealth should convene stakeholders to develop consensus recom-mendations on alignment and improvement of quality measures for use in global-budget APMs. The rec-ommendations should lead to an agenda for moving toward patient-reported outcome measures and an aligned set of measures to reduce provider burden.
b Disparities in spending levels. As part of a strategy to reduce spending, payers should develop plans to lessen the unwarranted disparity in global budgets paid to different providers by establishing stricter targets for spending growth for highly paid providers or by moving away from historical spending as the basis of global budgets.
c Inclusion of behavioral health. Payers should include behavioral health services in their global budget mod-els or work with carve-outs to better align incentives toward accountability for overall patient care.
d Certification standards. As the HPC launches the ACO certification program in early 2017, pay-ers and purchasers (including the Group Insurance Commission) should require provider organizations in risk-based contracts to meet HPC certification standards to ensure a consistent set of care delivery capabilities for ACOs across the Commonwealth. Statewide standards for ACOs as well as regular trans-parent monitoring of performance will focus providers’ transformation efforts for all patients and improve the likelihood of success of these care models.

76 | 2016 Cost Trends Report
Section V: Recommendations and DashboardV
Demand-side incentivesEffective demand-side incentives that provide consumers and purchasers with relevant information and meaning-ful options and that reward them for making high-value coverage and care choices are critical to creating a more affordable health care system. To advance these goals, the HPC recommends:
12 Payers and employers should continue to enhance strategies that empower consumers to make high-val-ue choices, including increasing the transparency of comparative prices and quality. Specifically:
a Employers should incentivize employees to choose high-value plans: Employers should further encour-age selection of high-value plans by contributing the same premium amount regardless of the plan chosen or by offering greater premium sharing for higher value plans. Additionally, employers should consider purchasing health insurance through the Massachu-setts Health Connector, which provides employees the opportunity to shop among a range of product options at very competitive market rates. The Health Connector should continue efforts to increase ease of use for employers and implement “employee choice”.
b Encourage value-based provider choices: Employers should also explore options to encourage employees to make value-based provider choices, including us-ing provider cost and quality information, rewarding employees directly for choosing high-value providers, or by contracting directly with particular high-value providers.
c Improve design of tiered and limited plans: Payers should continue to improve value-oriented products such as tiered and limited plan designs that create incentives, such as financial rewards, for choosing high-value services and providers through strate-gies including:
i Using transparent, aligned methods to evaluate quality and cost in order to tier providers.
ii Increasing the cost-sharing differentials between preferred and non-preferred tiers to better reflect value-based differences among providers.
iii Improving educational and outreach efforts to help health insurance brokers, employers, and employees better understand the range of products available and their benefits and tradeoffs.
iv Exploring limited network products that are asso-ciated with one or more high performing ACOs.
d Increase availability of price and quality infor-mation to enhance the selection of value-based providers: Payers should increase the availability of information on price and quality at the point of referral to allow patients and providers to make better-in-formed decisions about treatment options.
ENHANCING DATA AND MEASUREMENT FOR TRANSPARENCY AND ACCOUNTABILITYTransparency and data availability are critical to realizing quality improvement and cost containment goals for the Commonwealth’s health system. Data are essential to all as-pects of system transformation, including setting priorities, harnessing the power of consumer choice, strengthening care delivery, designing and succeeding in new payment models, and monitoring progress.
To advance the goal of greater transparency and data avail-ability in 2017, the HPC recommends:
13 Recognizing CHIA’s substantial progress on the rec-ommendations from the 2015 Cost Trends Report, CHIA should continue to improve and document its data resources and develop key spending measures. Specifically:
a Data on drug rebates. CHIA should continue efforts to collect and report aggregate drug rebate amounts and reflect this information in estimates of total health care expenditures.
b The All-Payer Claims Data Base (APCD). The APCD is a critical tool for evaluating and monitor-ing system performance and represents a significant investment on the part of the state’s payers. To enhance the return on this asset, CHIA should:
i Implement a master provider crosswalk to link providers to organizations in connection with the Massachusetts Registration of Provider Organiza-tion Program.
2016 Cost Trends Report | 77
Chapter 10: Policy Recommendations 10
ii Continue to improve and validate methods to at-tribute patients to primary care providers within the APCD both for HMO and PPO populations
iii Seek to minimize loss of employer-based claims due to the Gobeille decision and to evaluate the impact of expected loss on the representativeness of the data that remain.
c Total Medical Expenditures for PPO populations. CHIA should continue to work on ensuring that payers report total medical expenditure measures for PPO populations.
d Provider-level measures of spending growth. In 2017, CHIA and the HPC should seek to finalize their development and implementation of measures of spending for hospitals, specialist physician groups and other provider types as necessary and feasible.
e Ambulatory quality measures. CHIA should con-tinue efforts to collect and report on measures of healthcare quality for services provided in the com-munity including measures of patient experience and outcomes.
CONCLUSIONIn the coming year, the HPC will pursue the activities not-ed above and work collaboratively with the Baker-Polito Administration, the Legislature, Massachusetts health care industry, employers, consumers, and other stakeholders to advance the goals of a more affordable, effective, account-able, and transparent health care system in Massachusetts.

78 | 2016 Cost Trends Report
Section V: Recommendations and DashboardV
Key area Measure MA time trend
Comparison
U.S. Target
Benc
hmar
k an
d sp
endi
ng
1. Growth of THCE per capita (performance assessed relative to 3.6% benchmark)
4.2% (2013-2014)
4.1% (2014-2015)
5.1% (2014-2015) < 3.6%
2. Growth in commercial premiums
1.4% (2013-2014)
1.6% (2014-2015)
5.2% (2014-2015)
2a. Level of commercial premiums
Family: $17,702 Single: $6,348
(2014)
Family: $18,454 Single: $6,519
(2015)
Family: $17,322 Single: $5,963
(2015)
3. Individuals with high out-of-pocket spending relative to income
11% (2013-2014)
11% (2014-2015)
14% (2014-2015)
Key area Measure MA time trend
Comparison
U.S. Target
Effici
ent,
high
-qua
lity
care
del
iver
y
4. Readmission rate (Medicare)
17.7% (2014)
18.2% (2015)
MA ranked 43rd of 51 (US = 16.8%)
(2014)
4a. Readmission rate (All payer)”
15.3% (2014)
15.8% (2015) N/A < 13% by 2019
5. ED utilization (per 1,000 persons)
366 (2014)
364 (2015)
MA ranked 24th of 51 (2015)
5a. BH-related ED utilization (per 1,000 persons)
25.6 (2014)
26.0 (2015)
MA = 25.4 U.S. = 17.8 (2013)
6. Percentage of inpatient discharges to institutional PAC
19.7% (2014)
19.4% (2015)
MA = 21.8% U.S. = 17.1%
(2013)
7. At-risk adults without a doctor visit
7% (2014)
7% (2015)
13% (2015)
8. Number of PCPs practicing in certified PCMHs
2,024 25.3% of all PCPs
(2015)
2,347 28.6% of all PCPs
(2016)
16.3% of all PCPs (2016)
33% by 2017; 20% in Prime
practice by 2017
9. Hospital inpatient days in last 6 months of life (Medicare 65+)
8.1 (2013)
7.9 (2014)
7.9 (2014)
10. Of decedents who used hospice, percent who used hospice for 7 days or less
N/A30.9% (2012)
(Medicare 65+)
35.5% (2012)
(All decedents)
Better performanceSimilar performanceWorse performanceProjected worse performance
Exhibit 10.1: Dashboard of HPC system performance metrics

2016 Cost Trends Report | 79
Chapter 10: Policy Recommendations 10
Key area Measure MA time trend
Comparison
U.S. Target
APM
s
11. Percentage of beneficiaries in Original Medicare covered by APMs
40% (2014)
38% (2015)
20% (2015)
12. Percentage of commercial HMO patients in APMs
64% (2014)”
58% (2015) N/A 80% by 2017
13. Percentage of commercial PPO patients in APMs
2% (2014)
1% (2015) N/A 33% by 2017
14. Percentage of MassHealth members in APMs
PCC: 22% MCO: 31%
(2014)
PCC: 23% MCO: 32% (2015)
N/A
Key area Measure MA time trend
Comparison
U.S. Target
Valu
e-ba
sed
mar
kets
15. Enrollment in tiered and limited network products
19.1% (2014)
19.1% (2015) N/A
16. Percentage of discharges in top 5 networks
60.9% (2014)
59.9% (2015) N/A
17. Percentage of community appropriate discharges from community hospitals
53.6% (2014)
53.3% (2015) N/A
Notes: THCE = total health care expenditures; ED = emergency department; PAC = post-acute care; PCP = primary care physicians; PCMH = patient-centered medical home; HMO = health maintenance organization; PPO = preferred provider organization; APM = alternative payment method. For additional notes, see Technical Appendix.Sources:Measure 1-MA: Centers for Health Information and Analysis 2016 Annual ReportMeasure 1-U.S.: Centers for Medicare and Medicaid Services National Health Expenditure Accounts, Personal Health Expenditures Data, 2015Measure 2-MA: Center for Health Information and Analysis 2016 Annual Report Private Commercial Enrollment DatabookMeasure 2-U.S.: Centers for Medicare and Medicaid National Health Expenditure Data, 2016Measure 2a: Agency for Healthcare Research and Quality, Medical Expenditure Panel Survey, Insurance Component, 2013-2015Measure 3: Hayes SL, et al. A Long Way in a Short Time: States’ Progress on Health Care Coverage and Access, 2013–2015. The Commonwealth Fund. 2016 Dec.Measure 4: Centers for Medicare and Medicaid Services Geographic Variation Data Files, 2016Measure 4a: Center for Health Information and Analysis Hospital-Wide Adult All-Payer Readmissions in Massachusetts: SFY 2011-2015 (Report)Measures 5, 5a-MA: HPC analysis of Center for Health Information and Analysis Emergency Department Data Base, 2011-2015Measure 5-U.S.: Kaiser Family Foundation State Health Facts, 2016Measure 5a-U.S.: HPC analysis of Healthcare Cost and Utilization Project (HCUP) Emergency Department Database, 2013Measure 6-MA: HPC analysis of Center for Health Information and Analysis Hospital Discharge Database, 2014-2015Measure 6-MA and U.S. comparison: HPC analysis of Healthcare Cost and Utilization Project (HCUP) Nationwide Inpatient Sample Survey and Massachusetts State Inpatient Database, 2013Measure 7: Hayes SL, et al. A Long Way in a Short Time: States’ Progress on Health Care Coverage and Access, 2013–2015. The Commonwealth Fund. 2016 Dec.Measure 8: HPC analysis of National Commission on Quality Assurance Clinician Directory, 2016, and of American Association of Medical Colleges State Physician Workforce Database, 2014-2015Measure 9: The Dartmouth Atlas, 2012Measure 10-MA: HPC analysis of Massachusetts All-Payer Claims Database, 2012Measure 10-U.S.: National Hospice and Palliative Care Organization, Facts and Figures Hospice Care in America, 2013Measure 11: HPC analysis of Centers for Medicare and Medicaid Services ACO performance data, 2013-2015Measures 12, 13, and 14: HPC analysis of Center for Health Information and Analysis 2016 Annual Report Alternative Payment Methods DatabookMeasure 15: HPC analysis of Center for Health Information and Analysis 2016 Annual Report Private Commercial Enrollment DatabookMeasure 16: HPC analysis of Center for Health Information and Analysis Hospital Discharge Database, 2012-2015Measure 17: HPC analysis of Center for Health Information and Analysis Hospital Inpatient Discharge Database, 2014-2015

80 | 2016 Cost Trends Report
LIST OF TECHNICAL APPENDICES
A: Acute Care Hospitals in Massachusetts by Type of Hospital B1: Overview of Trends in Spending and Care Delivery
B2: Massachusetts Provider Market: Status and Trends
B3: Prescription Drug Spending
B4: Hospital Utilization
B5: Post-Acute Care
B6: Variation in Spending by Primary Care Provider Group
B7: Alternative payment methods
B9: Demand-Side Incentives
B9: Dashboard
C: Data Sources

2016 Cost Trends Report | 81
COMMISSIONERSDr. Stuart Altman, Chair
Dr. Wendy Everett, Vice Chair
Dr. Carole Allen
Dr. Donald Berwick
Mr. Martin Cohen
Dr. David Cutler
Mr. Tim Foley
Ms. Kristen Lepore, Secretary of Administration and Finance
Mr. Rick Lord
Mr. Ron Mastrogiovanni
Ms. Marylou Sudders, Secretary of Health and Human Services
ACKNOWLEDGEMENTS
EXECUTIVE DIRECTORMr. David Seltz
The HPC’s Research and Cost Trends staff led the analy-sis and preparation for the annual cost trends report: Dr. David Auerbach, Rose Kerber, Lyden Marcellot, Natasha Reese-McLaughlin, Sara Sadownik, Rachel Salzberg, and Cory Stasko. Guidance was provided by Executive Director David Seltz, Dr. David Cutler, Chair of the Board’s Cost Trends and Market Performance Committee, Dr. Stuart Altman, Board Chair, and Dr. Wendy Everett, Board Vice Chair. Other commissioners provided recommendations and guidance.
Many HPC staff contributed significantly to the preparation of this report from each of the HPC’s departments: Execu-tive/Chief of Staff (led by Coleen Elstermeyer), Legal (led by Lois H. Johnson), Accountable Care (led by Katie Shea Barrett), Market Performance (led by Kate Scarborough Mills), and Strategic Investment (led by Kathleen Connolly). Ashley Johnston designed the report. We would also like to thank our fellows and interns, Ben Bigelow, Evelyn Brand, Joshua Hollabaugh, Wilna Paulemon, and Shane Visram.
The HPC acknowledges the significant contributions of other government agencies in the development of this report, including the Center for Health Information and Analysis (CHIA); the Office of MassHealth and the Department of Public Health within the Commonwealth’s Executive Office of Health and Human Services (EOHHS); the Executive Office of Elder Affairs; the Massachusetts Health Connector; the Massachusetts Attorney General’s Office (AGO); and the federal Centers for Medicare & Medicaid Services (CMS).
HPC staff received valuable assistance from many others in government, industry, and the research community, includ-ing Dr. Marian V. Wrobel. The HPC would like to thank its Advisory Council and other market participants and stake-holders for insightful input and comments. We gratefully acknowledge our contractor, Mathematica Policy Research, for assistance with the All-Payer Claims Database (APCD).

MASSACHUSETTS HEALTH POLICY COMMISSION50 Milk Street, 8th FloorBoston, MA 02109www.mass.gov/HPC