2021 annual health care cost trends report
TRANSCRIPT

2021 ANNUAL HEALTH CARE COST TRENDS REPORT
SEPTEMBER 2021

2021 COST TRENDS REPORTHEALTH POLICY COMMISSION
ABOUT THE MASSACHUSETTS HEALTH POLICY COMMISSIONThe Massachusetts Health Policy Commission (HPC) is an independent state agency charged with monitoring health care spending growth in Massachusetts and providing data-driven policy rec ommendations regarding health care delivery and payment system reform. The HPC’s mission is to advance a more transparent, accountable, and equitable health care system through its independent policy leadership and innovative investment programs. The HPC’s goal is better health and better care – at a lower cost – for all resi-dents across the Commonwealth.
The agency’s main responsibilities are led by HPC staff and overseen by an 11-member Board of Commissioners. Key activities include setting the health care cost growth benchmark; monitoring provider and payer performance relative to the health care cost growth benchmark; creating standards for care delivery systems that are accountable to better meet patients’ medical, behavioral, and health-related social needs; analyzing the impact of health care market transactions on cost, quality, and access; and investing in community health care delivery and innovations.
SUGGESTED CITATION:Massachusetts Health Policy Commission. 2021 Cost Trends Report. Sept. 2021. Available at: https://www.mass.gov/doc/2021-health-care-cost-trends-report/download.

2021 COST TRENDS REPORTHEALTH POLICY COMMISSION
TABLE OF CONTENTSCHAPTER 1: INTRODUCTION � � � � � � � � � � � � � � � � � � � � � � � � � � � � � � � � � � � � � � � � � � � � � � � � � � � � � � � � � 2
Exhibit 1�1� Annual growth in total health care expenditures per capita in Massachusetts
CHAPTER 2: TRENDS IN SPENDING AND CARE DELIVERY � � � � � � � � � � � � � � � � � � � � � � � � � � � � � � � � � � � � � � 6Exhibit 2�1� Annual growth in total health care expenditures per capita in Massachusetts
Exhibit 2�2 Change in enrollment and per-enrollee spending by major market segment, 2018-2019
Exhibit 2�3� Percentage annual growth in spending per commercial enrollee, 2016-2019
Exhibit 2�4� Annual growth in total health care spending per capita in Massachusetts and the U.S.
Exhibit 2�5� Annual growth in per capita commercial health care spending, Massachusetts and the U.S.
Exhibit 2�6� Medicare spending growth per Medicare beneficiary by service category, Massachusetts and the U.S., 2018-2019
Exhibit 2�7� Medicare spending per Medicare beneficiary by service category, Massachusetts and the U.S., 2019
Exhibit 2�8� Aggregate commercial payments for hospital outpatient services relative to what the hospital would have received from Medicare, 2016 – 2018
Exhibit 2�9� Number of hospital outpatient visits (all payer) by hospital cohort, FY2015-FY2019
Exhibit 2�10� Average annual family health insurance premium in Massachusetts and cost of a new compact car
CHAPTER 3: UNDERSTANDING PATTERNS OF HEALTH CARE SPENDING, UTILIZATION, AFFORDABILITY, AND ACCESS FOR COMMERCIALLY-INSURED MASSACHUSETTS RESIDENTS WITH LOWER INCOMES � � � � � � � 14
Exhibit 3�1� Percentage of individuals with zero medical spending, by decile of community income
Exhibit 3�2� Percent of health care spending by category and income for commercially-insured adults by lowest- and highest- income quintile, 2018
Exhibit 3�3� Emergency department utilization rates by income quintile, 2018
Exhibit 3�4� Total professional spending, combined inpatient and emergency department spending, and average risk score by community income decile
Exhibit 3�5: Characteristics of commercially-insured adults by household income, 2019
Exhibit 3�6: Percent of commercially-insured adults who experienced affordability issues by household income, 2019
Exhibit 3�7: Percent of commercially-insured adults with problems paying family medical bills and services that resulted in difficulty paying medical bills by household income, 2019
Exhibit 3�8: Percent of commercially-insured adults who went without needed care because of cost and types of care avoided due to cost by household income, 2019
Exhibit 3�9: Reasons commercially-insured adults avoided needed care because of cost by household income, 2019
Exhibit 3�10: Percent of commercially-insured adults whose last Emergency Department visit was avoidable, by household income and unmet health care needs, 2019
CHAPTER 4: POLICY RECOMMENDATIONS � � � � � � � � � � � � � � � � � � � � � � � � � � � � � � � � � � � � � � � � � � � � � � 24
CHAPTER 5: DASHBOARD OF HPC PERFORMANCE METRICS � � � � � � � � � � � � � � � � � � � � � � � � � � � � � � � � � � 30Exhibit 5�1 Dashboard of HPC performance metrics
LIST OF TECHNICAL APPENDICES � � � � � � � � � � � � � � � � � � � � � � � � � � � � � � � � � � � � � � � � � � � � � � � � � � � � 33
ACKNOWLEDGMENTS � � � � � � � � � � � � � � � � � � � � � � � � � � � � � � � � � � � � � � � � � � � � � � � � � � � � � � � � � � � � 34

CHAPTER 1:
INTRODUCTION

HEALTH POLICY COMMISSION - 2 - 2021 COST TRENDS REPORT
CHAPTER 1: INTRODUCTIONMassachusetts has long sought to foster a health care system that is affordable, high quality, and accessible for all. While the Com-monwealth has been a leader in health care coverage and innovation, cost containment, affordability, and health equity have continued to be challenges. In an effort to restrain rapidly increasing health care costs, the Legislature passed comprehensive health care reform in 2012 and set a first-in-the-nation, statewide target for sustainable growth in total health care spending (3.6 percent for the first five years, lowered to 3.1 percent in 2018). The same legislation established the independent Massachusetts Health Policy Commission (HPC) to help monitor and guide this ambitious effort (see Sidebar: What is the Massachusetts Health Policy Commission?). In the years since, the HPC has reported progress towards health care cost containment in the Commonwealth on an annual basis. Since the health care cost growth benchmark was established, the state’s health care spending has grown at an average annual rate of 3.59 percent. In the most recent data, from 2018 to 2019, the state’s preliminary health care spending growth was 4.3 percent, exceeding the benchmark target of 3.1 percent set by the HPC (Exhibit 1.1). Despite exceeding the benchmark, Massa-chusetts total health care spending growth (including both public and private payers) has remained at or below national growth rates for ten consecutive years, a reversal from trends prior to the passage of the 2012 legislation and the creation of the HPC.
In this annual report, the HPC presents new research to enhance the collective understanding of health care spending trends and cost drivers in the Commonwealth and evaluates the state’s progress in meeting several cost containment, care delivery, and payment system goals set by the Commonwealth and the HPC. This year’s report focuses on insights from the health care system before the Coronavirus Disease 2019 (COVID-19) pandemic, which has left a deep impact on Massachusetts and its health care system. Learning from the pandemic is critical, and the HPC is currently undertaking a separate analysis of the impact of COVID-19 on the health care system.1
Based on findings from this and other HPC research and programs, the report also includes five policy recommendations for lawmak-ers, providers, payers, employers, and other health care market participants to create a more affordable and accessible high-quality health care system. These recommendations include specific steps the Commonwealth must take to address the intersecting chal-lenges of cost containment, affordability, and health equity
— the seriousness and urgency of which have been underscored both by the pandemic and recent spending trends — to improve outcomes and lower costs for all.
2018-20192017-20182016-20172015-20162014-20152013-20142012-2013
2.4%
4.2%
4.8%
3.0%
2.8%
3.6%
4.3%
BENCHMARK: 3.1%
BENCHMARK: 3.6%
2012 – 2017
Notes: 2018-2019 spending growth is preliminary.Sources: Center for Health Information and Analysis, Annual Reports 2013-2020
Exhibit 1�1� Annual growth in total health care expenditures per capita in Massachusetts

HEALTH POLICY COMMISSION - 3 - 2021 COST TRENDS REPORT
CH
APTER 1
SIDEBAR: WHAT IS THE ROLE OF THE MASSACHUSETTS HEALTH POLICY COMMISSION?The Massachusetts Health Policy Commission (HPC) is an independent state agency that develops policy to reduce health care cost growth and improve the quality of patient care. The HPC’s mission is to advance a more transparent, accountable, and equitable health care system through independent policy leadership and innovative investment programs. The HPC’s goal is better health and better care – at a lower cost – for all residents across the Commonwealth.
The HPC’s staff and Board of Commissioners work col-laboratively to monitor and improve the performance of the health care system. Key activities include setting the health care cost growth benchmark; setting and mon-itoring provider and payer performance relative to the health care cost growth benchmark; creating standards for care delivery systems that are accountable to better meet patients’ medical, behavioral, and social needs; ana-lyzing the impact of health care market transactions on cost, quality, and access; investing in community health care delivery and innovations; and safeguarding the rights of health insurance consumers and patients regarding coverage and care decisions by health plans and certain provider organizations.
FOCUS ON AFFORDABILITY AND HEALTH EQUITYPersistent disparities in health outcomes exist among communi-ties with lower incomes, people of color, LGBTQIA+ individuals, and other populations, despite Massachusetts’ long-standing commitments to inclusive health care reform and access to care. This year’s report expands on previous work on affordability of care and the impact of affordability on health equity.
Affordability challenges are not evenly distributed. Based on data from the Commonwealth Fund’s scorecard on state health system performance, 6.1 percent of adults under age 65 in Massachusetts have high out-of-pocket spending on health care relative to income, lower than the national average of 8.3 percent.2 However, the comparison looks less favorable when considering disparities by income. Among adults with low incomes in Massachusetts, 20 percent had high out-of-pocket spending as compared to the
national average of 19.3 percent.i In fact, Massachusetts ranks in the bottom half of states (31st) for the disparity between adults with low incomes and those with high incomes on this measure. The new research in this report examines the relationship between high costs of care and patients going without needed care, empha-sizing the impact of affordability of care on health.
Similarly, as highlighted in the report’s dashboard, Massachusetts’ health status ranks high among states. Yet substantial disparities in health exist by income and by race/ethnicity. Based on data from the Commonwealth Fund, 23 percent of adults under age 65 with low incomes report fair or poor health as compared to 6 percent of Massachusetts adults under age 65 with high incomes. The rate of mortality amenable to health care is 54 percent higher in the Black population than in the White population in Massachusetts (87.3 deaths versus 56.6 deaths per 100,000 population), and infant mortality is substantially higher in Black and Hispanic populations than in White populations (7.4, 4.6, and 2.7 deaths per 1,000 live births).
Given these challenges, achieving the goals of better health, better care, and lower costs for all residents of the Common-wealth requires multi-faceted strategies, including new tools and enhanced accountability for the health care system to improve affordability and achieve equitable access to care and affordability
— both key areas of focus in this report.
HOW THE REPORT IS ORGANIZEDThe report includes material presented in a narrative report and a graphical chartpack. Select material is also available in an interac-tive Tableau format on the HPC’s website. This report is informed by the research of the Center for Health Information and Analysis (CHIA), as well as by presentations and testimony submitted during the HPC’s 2020 Annual Health Care Cost Trends Hearing.
Chapter 2 of the report compares health care cost growth in 2019 to the state’s health care cost growth benchmark and discusses trends and levels of health care spending in Massachusetts and the nation overall. Chapter 3 examines differences by patient income in service use, affordability, and access to care among patients with commercial insurance, organized in two sections: differences in health care service use and spending based on claims data, and an exploration of factors driving these differences based on survey data. Chapter 4 presents the HPC’s policy recommen-dations for controlling health care costs, increasing affordability, and advancing equity in Massachusetts. Chapter 5 contains a
i Low-income is defined as household income under 200% of the federal poverty level (FPL). High-income is defined as 400%+ FPL.

HEALTH POLICY COMMISSION - 4 - 2021 COST TRENDS REPORT
dashboard summarizing performance on key measures, which includes a new section on measures of health equity.
The chartpack presents updated results and trends previously reported on by the HPC. This year, the HPC has added a new section analyzing prices and price growth across a range of ser-vices. Other topics include areas for improvement in care delivery performance, such as decreasing avoidable hospital inpatient and emergency department utilization and maximizing value in post-acute care, and progress in aligning incentives, including expanding the use of alternative payment methods. The chart-pack also explores variation in practice patterns and spending by provider organization, including use of low-value care services.
REFERENCES1 Massachusetts Health Policy Commission. Impact of COVID-19
on the Massachusetts Health Care System: Interim Report. April 2021. Available at: https://www.mass.gov/doc/impact-of-covid-19-on-the-massachusetts-health-care-system-interim-report/download
2 Radley DC, Collins SR, Baumgartner JC. 2020 Scorecard on state health system performance. The Com-monwealth Fund. September 2020. Available at: https://www.commonwealthfund.org/publications/scorecard/2020/sep/2020-scorecard-state-health-system-performance

CHAPTER 2: TRENDS IN
SPENDING AND CARE DELIVERY

- 6 -HEALTH POLICY COMMISSION 2021 COST TRENDS REPORT
CHAPTER 2: TRENDS IN SPENDING AND CARE DELIVERY
i This figure is preliminary.ii This practice may change in future years, as the reporting timeline has been modified to allow for a longer claims settlement period.iii This difference in preliminary and final THCE per capita growth was driven primarily by upward spending trends within the commercial partial insurance
category. For more details on the initial and final 2018 THCE, see CHIA’s Annual Report published in March 2021.
The Commonwealth’s landmark health care cost containment law, Chapter 224 of the Acts of 2012,1 establishes a benchmark for sustainable growth in health care spending, recognizing that containing spending growth is critical to easing the burden of health care spending on government, households, and businesses. Chapter 224 directs the Massachusetts Health Policy Commission (HPC) and the Center for Health Information and Analysis (CHIA) to monitor health care spending growth annually relative to the benchmark, which is indexed to a projection of the Common-wealth’s long-term economic growth.
From 2013 to 2017, the benchmark for annual health care spending growth was set at 3.6 percent. From 2018 to 2022, the bench-mark was set by law to equal potential gross state product minus 0.5 percent, or 3.1 percent, but the HPC has limited authority to increase it to as high as 3.6 percent. On April 25th, 2018, the HPC’s board voted unanimously to maintain the benchmark at 3.1 percent for the 2019 calendar year as compared to 2018 – the period of focus for much of the data presented in this chapter. This chapter also describes broader trends in health care spending, value, and performance in the Commonwealth in 2019 (see Sidebar: Factors underlying health care spending). As stated in the introduction, this year’s Cost Trends Report does not discuss the impact of the COVID-19 pandemic on the Massachusetts health care system and the residents of the Commonwealth. However, the spending trends preceding the pandemic set an important foundation for understanding the financial impact of the pandemic on the health
care system and residents and will inform health policy discussions as the Commonwealth rebuilds in 2021 and beyond.
SPENDING GROWTH FROM 2018-2019The Commonwealth examines health care spending growth against the benchmark by calculating the change in Total Health Care Expenditures (THCE) per state resident. CHIA calculates THCE using data from the state and federal government as well as data reported by health insurers. THCE includes health care spending by individuals (e.g., co-payments, co-insurance, and insurance deductibles), health insurers (e.g., claims, administrative expenses, incentive payments), the state (e.g., MassHealth), and the federal government (e.g., MassHealth and Medicare). CHIA reported that from 2018 to 2019, the per capita growth in THCE in Massachusetts was 4.3 percent, exceeding the health care cost growth benchmark of 3.1 percent set by the HPC.2 Total spending increased from $61.3 billion in 2018 to $64.1 billion in 2019i while the state’s population grew at 0.1 percent over the same time period, resulting in an increase in per capita spending from $8,908 to $9,294.
To meet statutory timelines, CHIA reports an initial assessment of THCE and a final assessment with more complete data from insurersii one year after the initial assessment. The final assessment of 2017-2018 THCE per capita growth was revised upward from 3.1 percent to 3.6 percent, greater than the 3.1 percent benchmark set by the HPC in 2017.iii Overall, for the seven years since the passage of Chapter 224 for which THCE growth has been evaluated (2012-2019), the average annual spending growth rate has been 3.59 percent (Exhibit 2.1).
SIDEBAR: FACTORS UNDERLYING HEALTH CARE SPENDINGTotal health care spending is a function of the price of health care services as well as the utilization of those services. Utili-zation, in turn, is affected by both the number of people receiving health care services and the frequency, type, care setting, and intensity of the services provided. The HPC’s Cost Trends Report examines the latest available changes in both price and utilization in Massachusetts, as well as factors that may explain and contextualize these recent trends in health care spending. This report largely focuses on aspects of the health care system that can be influenced by policymakers, government agencies, and market participants in the state, instead of population health factors such as aging of the population and other underlying changes in health status.

- 7 -HEALTH POLICY COMMISSION 2021 COST TRENDS REPORT
CH
APTER 2
SPENDING GROWTH BY MARKET SEGMENTWhile there were differences in per-formance by market segment (see Exhibit 2.2), spending growth per member was near or over the benchmark for all major sectors in 2019. In the com-mercial sector, spending grew 4.5 percent in total while enrollment grew slightly, resulting in spending growth per enrollee of 4.1 percent. Growth in commercial spending per enrollee would have been 4.9 percent were it not for the fact that insurer administrative costs dropped significantly in 2019.iv For MassHealth enrollees who receive full coverage through the Primary Care Clinician (PCC) program, managed care organizations (MCO)v, or the Accountable Care Orga-nization (ACO) program, total enrollment declined by 2.9 percent while spending per enrollee grew 6.2 percent. In the Medi-care program, spending per enrollee also increased substantially faster than the benchmark (4.3 percent) for the roughly three-fourths of Massachusetts Medicare beneficiaries enrolled in traditional (fee-for-service) Medicare, while spending growth per enrollee was just below the benchmark (3.0 percent) for enrollees in privately administered Medicare Advan-tage, which also saw a 5.3 percent growth in enrollment.
The increase in Medicare spending per enrollee contrasts with prior years in which spending growth per enrollee had been below the benchmark and even neg-ative in some years (that is, a reduction in spending).
iv The reverse occurred in 2018. Commercial spending per enrollee, absent insurer administrative costs, grew 4.0 percent; but growth was 4.6 percent when including these costs.
v This excludes, for example, disabled or other enrollees receiving coverage on a fee-for-service basis and enrollees who are dually eligible for Medicare coverage and MassHealth benefits.
2018-20192017-20182016-20172015-20162014-20152013-20142012-2013
2.4%
4.2%
4.8%
3.0%
2.8%
3.6%
4.3%
BENCHMARK: 3.1%
BENCHMARK: 3.6%
2012 – 2017
Spending per enrollee Enrollment
-4%
-2%
0%
2%
4%
6%
8%
Medicare FFSMedicare
Advantage
MassHealth
(MCO+PCC+ACO)
Commercial
4.1%
6.2%
0.4%
5.3%
4.3%
0.5%
-2.9%
3.0%
4.5%
3.1%
8.4%
X%
4.6%
Change in total spending
Exhibit 2�1� Annual growth in total health care expenditures per capita in Massachusetts
Notes: 2018-2019 spending growth is preliminary.Sources: Center for Health Information and Analysis, Annual Reports 2013-2020
Exhibit 2�2 Change in enrollment and per-enrollee spending by major market segment, 2018-2019
Notes: Commercial spending includes insurer administrative spending. Commercial spending and enrollment growth include enrollees with full and partial claims. MassHealth includes only full coverage enrollees in the Primary Care Clinician (PCC), Accountable Care Organization (ACO-A, ACO-B), and Managed Care Organization (MCO) programs. Figures are not adjusted for changes in health status.Sources: Center for Health Information and Analysis Annual Report, March 2021

- 8 -HEALTH POLICY COMMISSION 2021 COST TRENDS REPORT
SPENDING GROWTH BY CATEGORY OF SERVICEAnalysis of spending growth by category of service shows that spending on services in hospital outpatient departments was the fastest-growing service category for the Massachusetts commercial market in 2019, where per enrollee spending grew 7.6 percent (see Exhibit 2.3). Spending on physician and other professionals was another key driver of Massachusetts commercial spending growth, increasing 6.1 percent in 2019.vi
COMPARISON TO NATIONAL TRENDSDespite exceeding the benchmark, the Massachusetts total health care spending growth rate of 4.3 percent per capita in 2019 was below the U.S. rate of 4.7 percent. This represents a continued trend since 2010, in which spending growth in Mas-sachusetts has generally been lower than growth nationwide (0.6 percentage points per year less, on average) while following a similar pattern of year-to-year variation (see Exhibit 2.4).
vi Fees going directly to physicians and other professionals for services performed in inpatient or outpatient hospital facilities are counted as “Physician and Other Profession-als” spending for this purpose.
MA
U.S.
0%
2%
4%
6%
8%
10%
20
19
20
18
20
17
20
16
20
15
20
14
20
13
20
12
20
11
20
10
20
09
20
08
20
07
20
06
20
05
20
04
20
03
20
02
20
01
20
00
2016-2017 growth 2017-2018 growth 2018-2019 growth
-6%
-4%
-2%
0%
2%
4%
6%
8%
Non-ClaimsOther
Medical
PharmacyPhysician
and Other
Professionals
Hospital
Outpatient
Hospital
Inpatient
1.8%
4.3%
4.0%
7.6%
6.4%
1.9%
1.1%
3.1% 3.1%
7.1%
6.0%
-2.0%
-3.7%
-5.3% -5.2%
6.1%
4.4%
4.1%
Notes: Pharmacy spending is net of rebates. Hospital spending includes facility spending only. Profes-sional spending associated with hospital care is included in “Physician and other professionals.” “Other medical” includes home health care, dental, and several other smaller spending categories. Non-claims spending represents capitation-based payments.Sources: Payer reported TME data to CHIA and other public sources; HPC analysis of data from Center for Health Information and Analysis Annual Report, March 2021.
Exhibit 2�3� Percentage annual growth in spending per commercial enrollee, 2016-2019
Notes: U.S. data include Massachusetts. MA 2018-2019 spending growth estimate is preliminary.Sources: Centers for Medicare and Medicaid Services, National Healthcare Expenditure Accounts Personal Health Care Expenditures Data, 2014-2019 and State Healthcare Expenditure Accounts, 1999-2014; Center for Health Information and Analysis, Total Health Care Expenditures, 2014-2019.
Exhibit 2�4� Annual growth in total health care spending per capita in Massachusetts and the U.S.

- 9 -HEALTH POLICY COMMISSION 2021 COST TRENDS REPORT
CH
APTER 2
In the commercial health insurance sector, per member spending growth rates also continued to be below the national average (see Exhibit 2.5).vii Cumulatively from 2013 to 2019, these lower growth rates amount to commercial spending that was $9.3 bil-lion lower than would have been the case if growth rates matched the national average. If per member spending growth rates in Mas-sachusetts had matched average national rates, cumulative commercial spending would have been $9.3 billion higher.
It is particularly illustrative to compare Massachusetts spending for Medicare fee-for-service (FFS) beneficiaries to that of other states since the benefits and prices paid for services are similar across the country. The historically high spending growth in 2019 for Massachusetts Medicare FFS beneficiaries was higher than the U.S. average (4.3 percent versus 3.0 percent) and was driven by higher growth in hospital and prescription drug spending (see Exhibit 2.6). While Massa-chusetts per beneficiary spending on skilled nursing facilities and home health services dropped in absolute terms, and to a greater extent than the U.S. average, per enrollee Medicare spending for hospital outpatient services increased by 7.3 percent in Massa-chusetts in 2019, double the national rate.
vii The measure of commercial spending in Exhibit 2.5 includes only members for whom
“full-claims” data are submitted to CHIA, thus excluding the roughly one-third of the commer-cial market with carve-outs (“partial-claim”). A “carve-out” means that an insurer has con-tracted with a third party to manage and accept risk for certain services, such as prescription drugs or behavioral health care. Claims for these carve-out services are often not reported back to the health insurer and are not submit-ted to CHIA. Spending grew faster for these partial-claim members in 2019 than for full-claims members (and their proportion of the commercial market also grew) – and thus, total commercial spending growth per enrollee as shown in Exhibit 2.2 (which includes estimates of what their full spending would have been if the carved-out services were included) is higher than as shown in Exhibit 2.4.
MA
U.S.
0%
2%
4%
6%
8%
10%
20
19
20
18
20
17
20
16
20
15
20
14
20
13
20
12
20
11
20
10
20
09
20
08
20
07
20
06
CHAPTER 224
MA U.S.
-4%
-2%
0%
2%
4%
6%
8%
Home
health
Skilled
nursing
Prescription
drugs
Physician
and other
professionals
Hospital
outpatient
Hospital
inpatient
2.5%
1.0%
3.5%
4.4%
7.6%
4.0%
-0.8% -0.6%
-3.5%
7.3%
3.7%
-2.2%
Notes: Spending reflects fee-for-service (Original Medicare) beneficiaries only. U.S. data includes Massachusetts. Prescription drug spending is calculated per enrollee in Medicare Part D and does not factor in rebates. All other categories of spending reflect growth per beneficiary in either Part A or Part B.Sources: Centers for Medicare and Medicaid Services, 2019, special data request.
Exhibit 2�6� Medicare spending growth per Medicare beneficiary by service category, Massachusetts and the U.S., 2018-2019
Notes: Massachusetts 2018-2019 spending growth estimate is preliminary and includes full-claims members only. Commercial spending is net of prescription drug rebates and excludes net cost of private health insurance.Sources: Centers for Medicare and Medicaid Services, National Healthcare Expenditure Accounts Personal Health Care Expenditures, 2014-2019 and State Healthcare Expenditure Accounts 2005-2014; Center for Health Information and Analysis, Total Health Care Expenditures, 2014-2019.
Exhibit 2�5� Annual growth in per capita commercial health care spending, Massachusetts and the U.S.

- 10 -HEALTH POLICY COMMISSION 2021 COST TRENDS REPORT
That high growth rate translates to hos-pital outpatient spending of $2,879 per Massachusetts Medicare FFS beneficiary in 2019, 29.1 percent higher than the national aver-age (see Exhibit 2.7). Conversely, spending on physician and other professional services (such as care provided by a nurse practitioner or psychologist) in Massachusetts was $2,748 per enrollee in 2019 (10.8 percent lower than the U.S. average), suggesting that some of the hospital outpatient spending growth in Mas-sachusetts may be due to greater utilization of hospital outpatient departments for care that would otherwise be provided in physician offices.
DRIVERS OF SPENDING GROWTH: PRICES VERSUS UTILIZATIONGrowth in health care spending can generally be divided into growth in prices for a given service and growth in the number of services provided (utilization). Commercial spending growth in Massachusetts, in all categories, has been pri-marily driven by an increase in prices (amount paid per service) in recent years. Data reported by the three largest Massachusetts insurers from 2015 to 2018 show that price increases accounted for more than half of overall spend-ing growth over this period.3 A separate analysis by the Health Care Cost Institute found that price growth accounted for two-thirds of total spending growth for Massachusetts commer-cially insured residents from 2014 to 2018.4
An increase in average price per service can result from higher payment to a given provider for a given service (i.e., a change in “unit price”) or a shift from a low-priced provider to a high-priced provider for the same service (i.e., a change in
“provider mix”), both of which were documented in the 2019 HPC Annual Cost Trends Report.5 The latter source of price growth is only possible when there is significant variation in provider prices. Data from a large employer-led transpar-ency initiative on health care prices found that prices paid by commercial health plans for hospital outpatient services varied threefold across Massachusetts hospitals in 2016-2018 and often well exceeded Medicare rates (see Exhibit 2.8). This degree of price variation,
$0
$1,000
$2,000
$3,000
$4,000
$5,000
Home
health
Skilled
nursing
Prescription
drugs
Physician
and other
professionals
Hospital
outpatient
Hospital
inpatient
$4
,62
9 $3
,86
5
$2
,87
9 $2
,23
0
$2
,74
8
$3
,08
0
$4
,40
6
$4
,22
6
$8
36
$8
32
$6
18
$4
63
MA U.S.
$0
$1,000
$2,000
$3,000
$4,000
$5,000
Home
health
Skilled
nursing
Prescription
drugs
Physician
and other
professionals
Hospital
outpatient
Hospital
inpatient
$4
,62
9 $3
,86
5
$2
,87
9 $2
,23
0
$2
,74
8
$3
,08
0
$4
,40
6
$4
,22
6
$8
36
$8
32
$6
18
$4
63
MA U.S.
$0
$1,000
$2,000
$3,000
$4,000
$5,000
Home
health
Skilled
nursing
Prescription
drugs
Physician
and other
professionals
Hospital
outpatient
Hospital
inpatient
$4
,62
9 $3
,86
5
$2
,87
9 $2
,23
0
$2
,74
8
$3
,08
0
$4
,40
6
$4
,22
6
$8
36
$8
32
$6
18
$4
63
MA U.S.
0%
50%
100%
150%
200%
250%
300%
Bri
gh
am
An
d W
om
en
s H
os
pit
al
Ma
ss
ac
hu
se
tts
Ge
ne
ral H
os
pit
al
Ca
pe
Co
d H
os
pit
al
Fa
lmo
uth
Ho
sp
ita
l
Be
rks
hir
e M
ed
ica
l C
en
ter
Co
ole
y D
ick
inso
n H
os
pit
al
No
rth
Sh
ore
Me
dic
al C
en
ter
Tu
fts
Me
dic
al C
en
ter
Um
as
s M
em
ori
al M
ed
ica
l C
en
ter
La
he
y C
lin
ic H
os
pit
al In
c.
Fa
ulk
ne
r H
os
pit
al
Ne
wto
n W
elle
sle
y H
os
pit
al
So
uth
Sh
ore
Ho
sp
ita
l
Ha
llm
ark
He
alt
h S
ys
tem
Be
th Is
rae
l D
ea
co
ne
ss
Me
dic
al C
en
ter
Ha
rrin
gto
n M
em
ori
al H
os
pit
al In
c
Stu
rdy
Me
mo
ria
l H
os
pit
al
Na
sh
ob
a V
alle
y H
os
pit
al
Ste
wa
rd N
orw
oo
d H
os
pit
al
Ma
rth
as
Vin
eya
rd H
os
pit
al
Ca
mb
rid
ge
He
alt
h A
llia
nc
e
Ba
ys
tate
Me
dic
al C
en
ter
Mo
un
t A
ub
urn
Ho
sp
ita
l
Ste
wa
rd S
t. A
nn
es
Ho
sp
ita
l
Sa
int
Vin
ce
nt
Ho
sp
ita
l
Ste
wa
rd H
oly
Fa
mily
Ho
sp
ita
l
He
nry
He
yw
oo
d M
em
ori
al H
os
pit
al
Win
ch
es
ter
Ho
sp
ita
l
Em
ers
on
Ho
sp
ita
l
Lo
we
ll G
en
era
l Ho
sp
ita
l
Milfo
rd R
eg
ion
al M
ed
ica
l C
en
ter
In
c
Bo
sto
n M
ed
ica
l C
en
ter
La
wre
nc
e G
en
era
l H
os
pit
al
Me
tro
we
st
Me
dic
al C
en
ter
Ma
ss
Eye
& E
ar
In�
rma
ry
Ste
wa
rd S
t. E
liza
be
ths
Me
dic
al C
tr
An
na
Ja
qu
es
Ho
sp
ita
l
So
uth
co
as
t H
os
pit
als
Gro
up
Bro
ck
ton
Ho
sp
ita
l In
c.
Ne
w E
ng
lan
d B
ap
tis
t H
os
pit
al
Go
od
Sa
ma
rita
n M
ed
ica
l C
en
ter
Mo
rto
n H
os
pit
al
Be
ve
rly
Ho
sp
ita
l
Ba
ys
tate
No
ble
Ho
sp
ita
l
Th
e M
erc
y H
os
pit
al
%%
DOUBLE MEDICARE’S PAYMENT
EQUIVALENT TO MEDICARE
Notes: Spending reflects fee-for-service (Original Medicare) beneficiaries only. U.S. data includes Massachusetts. Prescription drug spending is calculated per enrollee in Medicare Part D and does not factor in rebates.Sources: Centers for Medicare and Medicaid Services, 2019, special data request
Notes: Data represent aggregate spending from 2016-2018. Analysis based on commercial claims-level data contributed by self-insured employers and private health plans. Authors simulated Medicare payments using 3M software that applied Medicare payment rules to claims data. Data based on more than 100,000 services provided in Massachusetts hospitals. Hospitals excluded from figure if they provided fewer than 250 services.Sources: HPC analysis of supplemental data files from the report “Nationwide Evaluation of Health Care Prices Paid by Private Health Plans: Findings from Round 3 of an Employer-Led Transparency Initiative” by Christopher Whaley et al, available at: https://www.rand.org/pubs/research_reports/RR4394.html.
Exhibit 2�8� Aggregate commercial payments for hospital outpatient services relative to what the hospital would have received from Medicare, 2016 – 2018
Exhibit 2�7� Medicare spending per Medicare beneficiary by service category, Massachusetts and the U.S., 2019

- 11 -HEALTH POLICY COMMISSION 2021 COST TRENDS REPORT
CH
APTER 2
along with price increases of 20 percent or more, are quite common in Massachusetts in recent years across settings and catego-ries of care (see Chartpacks).
While price growth has been the primary driver of health care spending growth in the state, growth in volume of services is also an important driver. An increase in utilization was a particular factor in hospi-tal outpatient spending growth in 2019. An all-payer analysis shows that from FY 2018 to 2019, the total number of hospital out-patient visits at Massachusetts hospitals increased 3.7 percent. Importantly, more than 70 percent of the growth in hospital outpatient visits occurred among aca-demic medical centers (see Exhibit 2.9), which are generally higher priced than other hospital types, contributing to price growth through changes in provider mix as described above.
IMPLICATIONS FOR AFFORDABILITYOverall, spending growth in Massachu-setts exceeded the benchmark in 2019 and, after revision, in 2018 as well. Continued spending over the benchmark exacerbates the problem of affordability of health care in Massachusetts. The average commercial health insurance premium for Massa-chusetts families now exceeds $21,000 annually, almost triple what it was in the year 2000 and higher than the average price of a new compact car in the U.S. (see Exhibit 2.10).
Not only is the average privately-insured Massachusetts family, along with their employer, purchasing the equivalent of a new compact car each year in health insurance premiums, but they also pay thousands of dollars in out-of-pocket spending. Furthermore, both premiums and out-of-pocket spending are rising faster than earnings (from 2017 to 2019,
New compact car Family health insurance premium
$0
$5,000
$10,000
$15,000
$20,000
$25,000
20
19
20
18
20
17
20
16
20
15
20
14
20
13
20
12
20
11
20
10
20
09
20
08
20
07
20
06
20
05
20
04
20
03
20
02
20
01
20
00
$20,830
$21,424$20,356
$7,341
Notes: Data are in normal dollars of the year shown.Sources: Family health insurance premiums for Massachusetts are from the Agency for Health Care Quality – Medical Expenditure Panel Survey, Insurance Component. Car cost information is based on car-specific inflation from the Bureau of Labor Statistics and the compact car price index from Kelly Blue Book.
Exhibit 2�10� Average annual family health insurance premium in Massachusetts and cost of a new compact car
Exhibit 2�9� Number of hospital outpatient visits (all payer) by hospital cohort, FY2015-FY2019
0
1,000
2,000
3,000
4,000
5,000
6,000
20192018201720162015
1,113
1,324
2,544
5,152
5,642
16%
-2%
-5%
8%
22%
% CHANGE
FROM
2015�2019
INCREASE IN ALL VISITS
FROM 2018�2019
5,232
4,860
2,668
1,222
910
Academic Medical CenterCommunity High Public Payer Hospital
Community HospitalSpecialty Hospital
Teaching Hospital
Nu
mb
er
of
vis
its
, in
th
ou
sa
nd
s
3.7%
Notes: Outpatient visits are reported by the hospitals.Sources: Data from the Massachusetts Center for Health Information and Analysis, Acute Hospital Profiles, 2015-2019.
- 12 -HEALTH POLICY COMMISSION 2021 COST TRENDS REPORT
premiums grew 8 percent and cost-sharing rose 9 percent, faster than the 6 percent average wage growth), increasing financial pressure for families.2 As indicated in this report’s Dashboard, one-third of middle-class families in Massachusetts saw more than a quarter of all earnings go to health care spending, up from 28 percent several years ago.viii
For families with lower incomes, the challenges stemming from rising health care spending are exacerbated. The next chapter highlights these challenges using a combination of spending and direct survey data collected in 2019.
viii Earnings calculation includes employer premium contribution in both health care payments and in earnings total. See Massachusetts HPC 2019 Annual Cost Trends Report (p.15) for details.
REFERENCES1 187th Massachusetts Senate. Chapter 224 Of The Massachusetts
Acts Of 2012: An Act Improving The Quality Of Health Care And Reducing Costs Through Increased Transparency, Efficiency And Innovation. Commonwealth of Massachusetts. Jul. 30, 2012. Avail-able at: https://malegislature.gov/Laws/SessionLaws/Acts/2012/Chapter224.
2 Center for Health Information and Analysis. Performance of the Massachusetts Health Care System, Annual Report. Mar 2021. Available at: http://www.chiamass.gov/annual-report/.
3 Health Policy Commission. Hearing on the Potential Mod-ification of the Health Care Cost Growth Benchmark Mar. 11, 2021. Slide 17. Available at: https://www.mass.gov/doc/presentation-benchmark-hearing-march-11-2020/download.
4 Health Care Cost Institute. 2018 Health Care Cost and Utilization Report, State Spending Trends. Available at: https://healthcostinsti-tute.org/interactive/2018-health-care-cost-and-utilization-report.
5 Health Policy Commission. 2019 Cost Trends Report. Feb. 2020. Available at: https://www.mass.gov/doc/2019-health-care-cost-trends-report/download.
CHAPTER 3: UNDERSTANDING PATTERNS OF
HEALTH CARE SPENDING, UTILIZATION, AFFORDABILITY, AND ACCESS
FOR COMMERCIALLY-INSURED MASSACHUSETTS RESIDENTS WITH
LOWER INCOMES

- 14 -HEALTH POLICY COMMISSION 2021 COST TRENDS REPORT
CHAPTER 3: UNDERSTANDING PATTERNS OF HEALTH CARE SPENDING, UTILIZATION, AFFORDABILITY, AND ACCESS FOR COMMERCIALLY-INSURED MASSACHUSETTS RESIDENTS WITH LOWER INCOMESAlthough Massachusetts has the lowest rate of uninsured residents among states (3 percent) and a relatively high proportion of its population covered by private health insurance (55.9 percent, the sixth highest in the U.S.), residents with private coverage who have lower incomes face challenges with equitable access, affordability, and experience of care.1 The Massachusetts Health Policy Com-mission (HPC) has documented, for example, that 33 percent of middle-class families in Massachusetts with employer-sponsored insurance devoted more than a quarter of all income to health care (see Dashboard). Meanwhile, the Center for Health Information and Analysis (CHIA) has also documented a rapid rise in high-de-ductible health plans, comprising more than 60 percent of plans held by employees of small- and mid-sized firms (which tend to employ workers with lower incomes) in 2019 and, separately, that a majority of residents with low incomes with high-deductible plans experience affordability issues with their coverage.2, 3
Although literature on the experiences of commercially-insured populations with lower incomes is limited, available studies suggest that care use patterns differ by income among people with com-mercial insurance. A 2016 report from the Massachusetts Attorney General’s Office found that commercially-insured adults residing in lower income communities had lower total health spending than residents of higher income communities in Massachusetts, even after adjusting for health status.4 Research aimed at improving the MassHealth risk adjustment formulas to account for social determinants of health similarly found that residents with lower incomes had lower health care spending.5 Another research study found that commercially-insured adults with employer-sponsored insurance (ESI) had both lower spending and different patterns in use of health care by employee wage level, including less preventive care, more inpatient stays, and more emergency department (ED) visits for those with the lowest wages.6 These differential patterns of spending based on income are concerning because preventive care and regular office-based visits can improve health outcomes and reduce downstream hospital use.7, 8
Using commercial claims data from the Massachusetts All-Payer Claims Database (APCD) and survey data from CHIA’s Mas-sachusetts Health Insurance Survey (MHIS), the HPC sought to identify potential differences in utilization and spending for commercially-insured adults with lower incomes and to then
examine factors that might drive these differential patterns in use of care. Section 3A explores health care spending patterns by community income level using the APCD. Section 3B explores drivers of spending patterns and several key implications and consequences of these patterns in households with higher and lower incomes using the 2019 MHIS.
SECTION 3A: COMMERCIAL SPENDING AND UTILIZATION BY INCOME
VARIATION IN PATTERNS OF TOTAL SPENDING BY INCOMEThe HPC first grouped commercially-insured residents observed in the APCD based on the income of their communities (zip code, see technical appendix) either by quintiles or deciles. Overall, consistent with other studies, the HPC found lower total spending (the combined amounts paid by the insurer and the patient) for those residing in communities with lower incomes. Commer-cially-insured adults from the communities in the lowest income quintile in Massachusetts had 11 percent lower annual health spending than adults in communities with the highest income in 2018 ($5,786 compared to $6,494, respectively).
This difference in average spending has concerning implications. First, while individuals with lower incomes have lower average health care spending, they do not tend to receive commensurate benefit by paying lower health insurance premiums. In fact, the reverse is often the case. Employees of low-wage firms contribute more, on average, toward their health insurance premiums than employees in higher-wage firms.9 Therefore, overall, individuals with lower incomes are cross-subsidizing the premiums of indi-viduals with higher incomes.
Second, the difference is suggestive of potential avoidance of care and barriers to access for individuals in communities with lower incomes.i Part of the difference in spending is likely explained by individuals in communities with higher incomes going to providers who receive higher prices for the same care, as found in the Attor-ney General’s Office analysis.10 While the HPC’s analysis supports
i The differences could also be explained by better health status among individuals in communities with lower incomes. Data provided later in this chapter suggests this is not the case.

- 15 -HEALTH POLICY COMMISSION 2021 COST TRENDS REPORT
CH
APTER 3
this finding as well, it appears to explain less than half of the spending difference.ii Much of the remaining difference appears to be related to different patterns of use of care. For example, part of the difference in average spending is due to the fact that individuals with lower incomes were more likely to not use any medical services for all of 2018 (note: prescription drug spending was excluded from this analysis). Overall, 15.7 percent of individuals living in the low-est-income decile communities had zero medical spending compared to 8.8 percent of individuals in the highest-income decile (see Exhibit 3.1).
VARIATION IN TYPES OF CARE USED BY COMMUNITY INCOMETo shed further light on these spending differences, the HPC analyzed patterns of spending by category of care for indi-viduals in communities with lower- and higher-income who had any health care spending during the year. Exhibit 3.2 dis-plays the percentage of total spending by category for individuals living in commu-nities in the lowest-income quintile versus the highest-income quintile.
The HPC found that residents living in communities with higher-income had higher proportions of spending for pro-fessional and outpatient services while residents from communities with lower-in-come had higher proportions of spending for prescription, inpatient, and ED services. These results could indicate less use of routine, office-based care, which could lead to exacerbation of health problems leading to ED and hospital visits. Further
ii For example, individuals in communities in the highest-income decile had approximately 25% more professional spending than those in the lowest-income decile, while the average amount paid for a standard office visit (99213) for a primary care or specialist physician was 10% higher.
Professional
(All other)
OutpatientProfessional
(O�ce and
preventive)
OtherEmergency
Department
InpatientPrescription
drug
23.5%
21.1%
15.3%
13.4%
4.4%
2.7%
1.1% 1.1%
9.8% 10.6%
23.7%25.3%
22.2%
25.8%
Lowest-income quintile Highest-income quintile
10
Highest income
987654321
Lowest income
15.7%
13.8%
13.2%
11.8%
10.4%11.2%
9.5%
9.0%
8.0%8.8%
Notes: Prescription drug spending is excluded from this analysis. Results are reported according to community income level linked to zip code tabulation area. Population includes commercially-insured adults age 18-64 with full coverage in 2018. Results are adjusted for differences in age, sex, and risk score. The risk score information herein contained has been processed by software called The Johns Hopkins ACG® System © 1990, 2017, Johns Hopkins University. All Rights Reserved.Sources: HPC analysis of Massachusetts All-Payer Claims Database, 2018
Notes: Results are reported according to community income level linked to zip code tabulation area. Population includes commercially-insured adults age 18-64, with full coverage in 2018. Individuals with zero medical spending are excluded. Results are adjusted for differences in age, sex, and risk score by income quintile. The risk score information herein contained has been processed by software called The Johns Hopkins ACG® System © 1990, 2017, Johns Hopkins University. All Rights Reserved. Professional spending is defined as all spending paid to physicians or other professionals regardless of setting.Sources: HPC analysis of Massachusetts All-Payer Claims Database, 2018
Exhibit 3�2� Percent of health care spending by category and income for commercially-insured adults by lowest- and highest-income quintile, 2018
Exhibit 3�1� Percentage of individuals with zero medical spending, by decile of community income

- 16 -HEALTH POLICY COMMISSION 2021 COST TRENDS REPORT
evidence for this possibility is that individ-uals living in the lowest-income quintile were 15 percent less likely to have a pre-ventive care visit in the past year.
At the same time, although their total spending was lower, residents living in communities with lower-income had higher rates of total ED utilization, potentially avoidable ED visits, and mental health-related ED visits.iii Rates of ED utilization for residents living in the lowest-income quintile were 1.7 times that of residents living in the highest-in-come quintile (27.7 versus 16.7 ED visits per 100 members, respectively), and 2.3 times greater for avoidable ED utiliza-tion (8.9 versus 3.9 potentially avoidable ED visits per 100 members, respectively) (Exhibit 3.3).
When data on patient spending are fur-ther disaggregated according to the decile of community income, a clear pattern emerges – as patients’ community income increases, professional spending increases and ED and inpatient spending decreases (Exhibit 3.4). The risk scores, as shown in the Exhibit, further suggest that the patterns are not due to differences in health status.
Overall, the HPC’s findings from anal-yses of claims data are consistent with prior studies finding that residents with lower incomes have lower total health care spending overall, with lower spending on professional and preventive care, but higher spending on ED and hospital care.
iii Potentially avoidable ED visits are based on the Billings algorithm, which classifies an ED visit into the following categories: Emer-gent–ED care needed and not avoidable; Emergent–ED care needed but avoidable; Emergent–primary care treatable; and Non-emergent–primary care treatable.
“Potentially avoidable” is defined here as ED visits that were emergent–primary care treat-able or non-emergent–primary care treatable.
$0
$500
$1,000
$1,500
$2,000
$2,500
$3,000
10987654321
Av
era
ge
Sp
en
din
g P
er
Me
mb
er
Pe
r Y
ea
r
Ris
k S
co
re
1.0
1.5
2.0
2.5
3.0
Professional Inpatient and ED Average risk score
LOWEST INCOME HIGHEST INCOME
1 - Lower income 5 - Higher income2 3 4
0.0
5.0
10.0
15.0
20.0
25.0
30.0
MH-related ED visit
rate per 1,000 members
Avoidable ED visit
rate per 100 members
ED visit rate per
100 members
27.7
16.7
8.9
3.9
7.2 6.6
1 - Lower income 5 - Higher income2 3 4
0.0
5.0
10.0
15.0
20.0
25.0
30.0
MH-related ED visit
rate per 1,000 members
Avoidable ED visit
rate per 100 members
ED visit rate per
100 members
27.7
16.7
8.9
3.9
7.2 6.6
Notes: Results are reported according to community income level linked to zip code tabulation area. Population includes commercially-insured adults age 18-64, with full coverage in 2018. Individuals with zero medical spending are excluded. Results are adjusted for differences in age, sex, and risk score by income quintile. The risk score information herein contained has been processed by software called The Johns Hopkins ACG® System © 1990, 2017, Johns Hopkins University. All Rights Reserved. MH = mental health.Sources: HPC analysis of Massachusetts All-Payer Claims Database, 2018
Notes: Results are reported according to community income level linked to zip code tabulation area. Population includes commercially-insured adults age 18-64, with full coverage in 2018. Individuals with zero medical spending are excluded. Results are adjusted for differences in age, sex, and risk score by income quintile. The risk score information herein contained has been processed by software called The Johns Hopkins ACG® System © 1990, 2017, Johns Hopkins University. All Rights Reserved.Sources: HPC analysis of Massachusetts All-Payer Claims Database, 2018
Exhibit 3�3� Emergency department utilization rates by income quintile, 2018
Exhibit 3�4� Total professional spending, combined inpatient and emergency depart-ment spending, and average risk score by community income decile

- 17 -HEALTH POLICY COMMISSION 2021 COST TRENDS REPORT
CH
APTER 3
SECTION 3B: HEALTH CARE ACCESS AND AFFORDABILITY BY HOUSEHOLD INCOMETo better understand what underlies the patterns described in the previous section, the HPC utilized CHIA’s 2019 Massachusetts Health Insurance Survey (MHIS), a statewide population-based survey of Massachusetts residents who are not institutionalized. With this data, the HPC evaluated possible differences in health care access and affordability for commercially-insured adults with self-reported household incomes above or below 400 percent of the Federal Poverty Level (FPL) (for a family of four in 2019, 400 percent of FPL is $103,000). Importantly, the survey asks individuals their own household income, allowing more accurate identification of differences by income than is possible in the claims data, which must use community income as a proxy.
Exhibit 3.5 displays the underlying demographic and health char-acteristics of commercially-insured adults in the study population by household income. When compared to adults in households with higher income (≥400 percent FPL), adults in households with lower income (<400 percent FPL) were more likely to be people of color (31 percent in lower-income households versus 18 percent in higher-income households) and less likely to have a four-year college
degree (42 percent versus 65 percent). Health status was similar across income groups, consistent with the claims data analysis above. The average income for households with lower-income was $53,780, compared to an average $166,682 among higher-income households.
DIFFERENCES IN AFFORDABILITYDifferences in some measures of potential access to care did not differ markedly by income group – for example, 9 percent of the lower-income group reported not having a usual source of care compared to 6 percent of the higher-income group. Yet the potential availability of care does not necessarily imply that individuals are able to access that care when needed. For example, there may be significant wait times, as well as difficulties with transportation to care and ability to take time off work or care-taking responsibilities.
In particular, evidence from CHIA and others is suggestive of significant financial barriers in accessing care. To investigate this possibility further, the HPC examined differences in the ability to afford care as a factor that could impact the different health care spending and utilization patterns found in the claims data. Research has found that unaffordable out-of-pocket costs and insufficient insurance coverage can lead to individuals going without needed care, particularly preventive care and office visits.11
Exhibit 3�5: Characteristics of commercially-insured adults by household income, 2019
Notes: Results are reported according to self-reported income. Population includes commercially-insured adults age 18-64, with 12-months contin-uous coverage as of survey timeframe in 2019. * indicates statistical significance at the P < 0.05 level. Differences between the income groups are significant for percentage White, non-Hispanic (P = 0.000), having a 4-year college degree (P = 0.000), and self-reported health status as good, very good, or excellent (P = 0.02). All findings from the MHIS shown here and in subsequent exhibits use survey weights to ensure representativeness of the Massachusetts commercially-insured population.Sources: HPC analysis of CHIA 2019 MHIS Survey
4-YEAR COLLEGE DEGREE*
SELF-REPORTED HEALTH STATUS AS GOOD, VERY GOOD, OR EXCELLENT*
BLACK, HISPANIC: 4% | 8%
HISPANIC OR LATINO: 5% | 9%
OTHER RACE/ETHNICITY: 9% | 14% AVERAGE AGE
AVERAGE INCOME
PERCENTAGE WHITE, NON-HISPANIC*
82% 69%43 40
65%
42%
95% 91%
$53,780
$166,682
AT LEAST ONE CHRONIC HEALTH CONDITION
47% 49%
HIGHER INCOME (≥400% FPL) LOWER INCOME (<400% FPL)

- 18 -HEALTH POLICY COMMISSION 2021 COST TRENDS REPORT
For example, one recent study found that Medicare beneficiaries with high health care needs often discontinued taking chronic medications when they reached the portion of their prescription drug ben-efit in which they had to pay the full price of their prescription drugs (the “doughnut hole”); these beneficiaries had a 33 percent increased rate of mortality as a result.12
The MHIS asked respondents about four types of affordability challenges: paying off medical bills over time, having problems paying family medical bills, spending a high share of family income on out-of-pocket health care spending, and experiencing unmet health care needs due to cost. Adults with lower incomes were significantly more likely than adults with higher incomes to report experiencing each of these four affordability issues (Exhibit 3.6).
With respect to problems paying medical bills, which adults with lower incomes reported as a much more significant prob-lem, the survey next asks respondents which types of medical care resulted in the problematic bills (Exhibit 3.7). Among individuals who had a problem paying a medical bill, both adults with higher and lower incomes cited “medical tests and surgical procedures” most frequently as the source of this challenge (63 percent of adults with lower incomes and 61 percent of adults with higher incomes). However, adults with lower incomes were substan-tially more likely to report difficulty paying medical bills for prescription drugs, dental care, ongoing treatment for a chronic con-dition, and emergency care.
Furthermore, while 41 percent of adults with higher incomes who reported problems paying bills only reported one type of bill as the source of the problem, 71 percent of adults with lower incomes struggling to pay medical bills reported having more than one medical service that resulted in difficulty.
Notes: Results are reported according to self-reported income. Population includes commercially-insured adults age 18-64, with 12-months continuous coverage as of survey timeframe in 2019. * indicates statistical significance at the P < 0.05 level. Differences between the income groups are significant for having medical bills being paid over time (P=0.001), having problems paying family medical bills (P=0.001), spending a high share of family income on out-of-pocket costs (P=0.000), having any unmet health care needs for family (P=0.006), and experiencing any of the four affordability issues (P=0.000).Sources: HPC analysis of CHIA 2019 MHIS Survey
Notes: Results are reported according to self-reported income. Population includes commercially-insured adults age 18-64, with 12-months continuous coverage as of survey timeframe in 2019. * indicates statistical significance at the P < 0.05 level. Differences between the income groups are significant for problems paying family medical bills (P=0.001).Sources: HPC analysis of CHIA 2019 MHIS Survey
Exhibit 3�7: Percent of commercially-insured adults with problems paying family medical bills and services that resulted in difficulty paying medical bills by household income, 2019
Exhibit 3�6: Percent of commercially-insured adults who experienced affordability issues by household income, 2019
Household income under 400% FPL Household income at or more than 400% FPL
Any of the
four a�ordability
issues*
Any unmet health
care needs for
family*
High share of
family income
on out-of-pocket*
Problems paying
family medical
bills*
Medical bills
being paid
over time*
26.0%
16.0%
21.0%
12.4%
17.8%
3.5%
36.1%
26.8%
38.2%
59.3%
Problems paying family medical bills*
SERVICES THAT RESULTED IN DIFFICULTY PAYING MEDICAL BILLS
LOWER
INCOME
HIGHER
INCOME
Medical test or
surgical procedure
Ongoing treatment
Emergency care
Dental care
Prescription drugs
Medical test or
surgical procedure
Ongoing treatment
Emergency care
Dental care
Prescription drugs
79.0%21.0%
87.6%12.4%
34.7%
48.2%
48.4%
48.8%
62.8%
26.6%
33.1%
38.6%
35.2%
60.6%
LOWER INCOME
HIGHER INCOME

- 19 -HEALTH POLICY COMMISSION 2021 COST TRENDS REPORT
CH
APTER 3
LOWER INCOME
HIGHER INCOME
23.5%
Went without needed care due to cost*
TYPES OF NEEDED CARE FORGONE DUE TO COST
LOWER
INCOME
HIGHER
INCOME
68.6%31.4%
76.9%23.1%
Dental or vision care*
Doctor, specialist,
prescription or
mental health care*
Dental or vision care*
Doctor, specialist,
prescription or
mental health care*
20.5%
12.8%
15.6%
AVOIDING CAREDifficulty paying medical bills can have downstream effects on individuals’ future use of health care, including potential avoid-ance of necessary care. Overall, adults with lower incomes were more likely than adults with higher incomes to go without needed health care because of cost (31 percent versus 23 percent, see Exhibit 3.8). When asked about specific types of care they went without due to cost, adults with lower incomes were much more likely to go without needed doctor, specialist, prescrip-tion drug, or mental health care because of cost (21 percent versus 13 percent). In addi-tion, nearly one in four adults with lower incomes (24 percent) reported going with-out needed dental or vision care because of cost, compared to 16 percent of adults with higher incomes. Commercial health plans typically have limited coverage for routine dental and vision care; in particular, going without dental care can negatively impact health and lead to avoidable ED visits.13
The survey data provided additional insight into why adults go without care because of cost. Among adults who reported avoid-ing care due to cost, adults with lower incomes were significantly more likely than adults with higher incomes to cite unaffordable cost-sharing as a reason. Among adults who reported avoiding care due to cost, 51 percent of adults with lower incomes reported avoiding care because the co-payment or co-insurance was too high, compared to 33 percent of adults with higher incomes (Exhibit 3.9).
That finding suggests that adults with lower incomes may be particularly harmed by high-deductible plans, which can present a significant financial barrier to seeking needed care when members are in the deductible phase of their coverage year. Indeed, the disparity in avoiding needed doctor, specialist, mental health, or pre-scription drug care due to cost was even
Notes: Results are reported according to self-reported income. Population includes commercially-insured adults age 18-64, with 12-months continuous coverage as of survey timeframe in 2019.. * indicates statistical significance at the P < 0.05 level. Differences between the income groups are significant for having gone without needed care due to cost (P=0.012), going without needed doctor, specialist, prescription drug, or mental health care due to cost (P=0.003), and going without needed dental or vision care because of cost (P=0.008).Sources: HPC analysis of CHIA 2019 MHIS Survey
Notes: Results are reported according to self-reported income. Population includes commercially-insured adults age 18-64, with 12-months continuous coverage as of survey timeframe in 2019. * indicates statistical significance at the P < 0.05 level. Differences between the income groups are significant for avoiding care because the copayment or coinsurance was too high (P=0.009), lack of confidence that specialist care would be covered (P=0.01), and choosing the ED over urgent care because of surety that health insurance would cover an ED visit (P =0.04). Sources: HPC analysis of CHIA 2019 MHIS Survey and 2019 MHIS Recontact Survey
Household income under 400% FPL Household income at or more than 400% FPL
Would choose ED over urgent care
because sure that health insurance
would cover an ED visit*
Lack of con�dence that
specialist care would be covered*
Avoided care because
co-payment / co-insurance was too high* 50.8%
56.4%
58.6%
75.6%
32.6%
35.1%
Exhibit 3�9: Reasons commercially-insured adults avoided needed care because of cost by household income, 2019
Exhibit 3�8: Percent of commercially-insured adults who went without needed care because of cost and types of care avoided due to cost by household income, 2019
- 20 -HEALTH POLICY COMMISSION 2021 COST TRENDS REPORT
larger for individuals with high-deductible plans. While the percent-age of adults avoiding these types of care due to cost was 21 percent among adults with lower incomes and 13 percent among adults with higher incomes, as reported in Exhibit 3.8, these percentages grew to 29 percent and 19 percent, respectively, for individuals in high-deductible plans. Among adults with low incomes in high-de-ductible plans, the percentage was yet higher (33 percent) for people of color (Black, Hispanic, or reported other or multiple races), compared to White adults (28 percent).
Uncertainty regarding cost and coverage were other reasons cited for avoiding care by adults with both higher and lower incomes. Among people who reported avoiding care due to cost, 25 percent of adults with lower incomes reported that they did so because they were not sure how much the care would cost, compared to 22 percent of adults with higher incomes. As shown in Exhibit 3.9, adults with lower incomes were more likely to report that they were not confident that insurance would cover specialist care if needed, compared to adults with higher incomes (56 percent versus 35 percent) and were more likely to say that they would favor using the ED over an urgent care center because they were certain that care in the ED would be covered (76 percent to 59 percent). This uncertainty about cost and coverage is likely impacted by the time and resources needed to navigate the complexity of com-mercial insurance design, coupled with the lack of transparency in health care prices. Commercially-insured individuals with lower incomes may also experience a higher rate of unexpected bills. When asked if they or anyone in their household had received an unexpected medical bill in the prior 12 months, 55 percent of
iv Prior to adjustment, 44% of adults with lower incomes and 28% of adults with higher incomes reported that their last visit to the ED was avoidable (P=0.043). Post-adjustment, 46% of adults with lower incomes and 28% of adults with higher incomes reported that their last visit to the ED was avoidable (P=0.000).
adults with lower incomes said they had, compared to 39 percent of adults with higher incomes.
CONSEQUENCES OF CARE AVOIDANCELack of access to needed care – whether barriers to such care are from availability, cost, or coverage design – may lead to higher ED use if ambulatory care is avoided and a condition develops or exac-erbates to the point of needing emergency services. Lack of access to needed care may also lead to an increase in avoidable ED visits if the ED is used as the source of care in place of ambulatory care, such as a doctor’s office, urgent care center, or retail clinic. Avoid-able ED visits increase total health care spending, usually involve greater cost-sharing, and can lead to added suffering and stress than if individuals had sought care when symptoms were milder.14
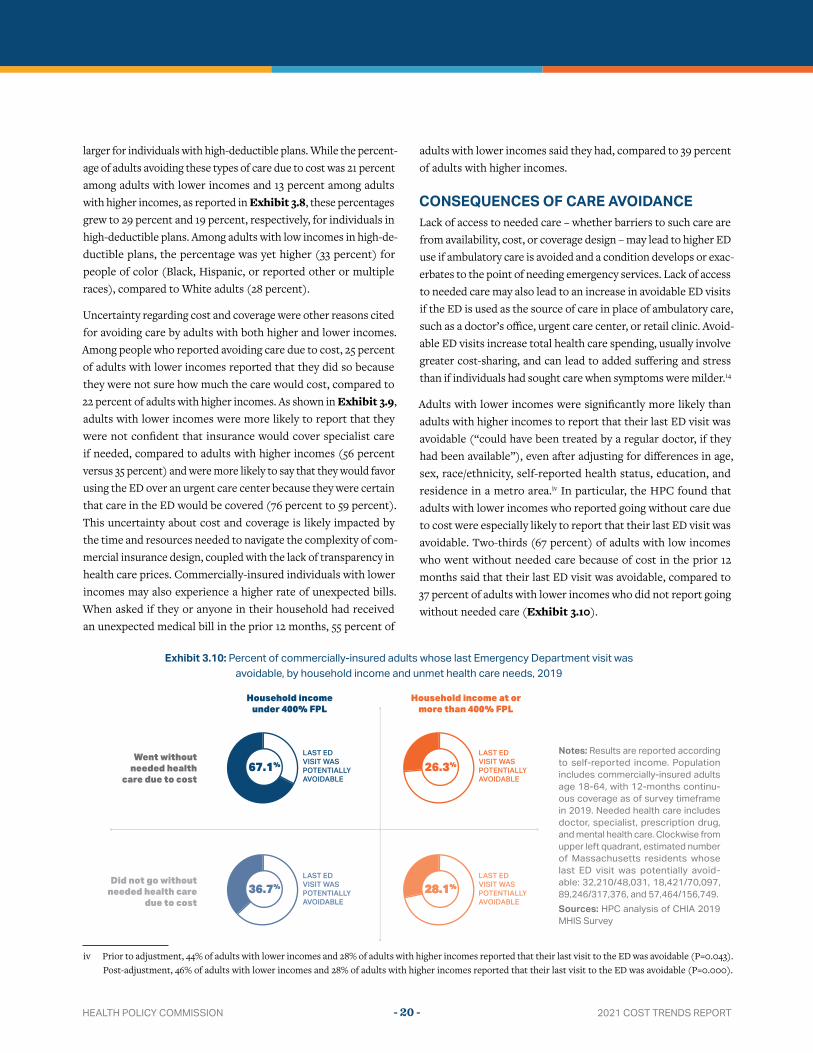
Adults with lower incomes were significantly more likely than adults with higher incomes to report that their last ED visit was avoidable (“could have been treated by a regular doctor, if they had been available”), even after adjusting for differences in age, sex, race/ethnicity, self-reported health status, education, and residence in a metro area.iv In particular, the HPC found that adults with lower incomes who reported going without care due to cost were especially likely to report that their last ED visit was avoidable. Two-thirds (67 percent) of adults with low incomes who went without needed care because of cost in the prior 12 months said that their last ED visit was avoidable, compared to 37 percent of adults with lower incomes who did not report going without needed care (Exhibit 3.10).
LAST ED
VISIT WAS
POTENTIALLY
AVOIDABLE
Household income under 400% FPL
Household income at or more than 400% FPL
Went without needed health
care due to cost
Did not go without needed health care
due to cost
LAST ED
VISIT WAS
POTENTIALLY
AVOIDABLE
LAST ED
VISIT WAS
POTENTIALLY
AVOIDABLE
LAST ED
VISIT WAS
POTENTIALLY
AVOIDABLE
67.1% 26.3%
36.7% 28.1%28.1%
Notes: Results are reported according to self-reported income. Population includes commercially-insured adults age 18-64, with 12-months continu-ous coverage as of survey timeframe in 2019. Needed health care includes doctor, specialist, prescription drug, and mental health care. Clockwise from upper left quadrant, estimated number of Massachusetts residents whose last ED visit was potentially avoid-able: 32,210/48,031, 18,421/70,097, 89,246/317,376, and 57,464/156,749.Sources: HPC analysis of CHIA 2019 MHIS Survey
Exhibit 3�10: Percent of commercially-insured adults whose last Emergency Department visit was avoidable, by household income and unmet health care needs, 2019

- 21 -HEALTH POLICY COMMISSION 2021 COST TRENDS REPORT
CH
APTER 3
CONCLUSIONThese findings suggest that, despite wide commercial insurance coverage in the Commonwealth, affordability concerns may impact use of needed health care, especially for individuals with lower incomes. Massachusetts adults living in lower income commu-nities were more likely to use no health care services, but when they did use health care services, they were more likely to use higher-intensity care settings (inpatient and ED) and less likely to use preventive care. Massachusetts adults living in households with lower income were more likely to report that they had prob-lems paying medical bills resulting from medical tests, surgical procedures, and ongoing treatment for chronic health conditions, as well as avoiding care due to concerns about cost. Notably, those who have lower incomes and went without needed care because of cost were much more likely to report that their last visit to the ED was avoidable.
The findings of differential health care use and spending by income may reflect a number of factors. For example, people with lower incomes may face greater financial difficulties with cost-sharing, especially if they are enrolled in high-deductible plans, and may face greater concerns about high or unexpected medical bills, leading to avoidance of needed care. In addition, alternatives to the ED are not equally available – for example, prior HPC research found that the majority of urgent care centers were located in communities with higher income.15 Furthermore, insurers are responding to high prices in the health care system with high cost-sharing products, limited provider networks, and complex benefit designs. Individuals with lower incomes, for whom a single uncovered service or unexpected bill can lead to a financial catastrophe, are often harmed by such plan designs16 – sometimes to the point of avoiding needed care. Paradoxically, this care avoidance can further increase costs (and therefore premiums) and worsen suffering as conditions exacerbate and lead to use of high-cost hospital care. Differences in health care spending and the access barriers associated with them point to significant health equity challenges to be addressed.

- 22 -HEALTH POLICY COMMISSION 2021 COST TRENDS REPORT
REFERENCES1 Kaiser Family Foundation State Health Facts. Data Source: KFF
estimates based on the 2008-2019 American Community Survey, 1-Year Estimates. Available at: https://www.kff.org/statedata/
2 Center for Health Information and Analysis. Annual Report on the Performance of the Massachusetts Health Care System: 2021. Mar. 2021. Available at: https://www.chiamass.gov/assets/2021-an-nual-report/2021-Annual-Report.pdf
3 Center for Health Information and Analysis. An Inside Look: Affordability Issues are More Common in High Deductible Health Plans. Mar. 2021. Available at: https://www.chiamass.gov/assets/docs/r/pubs/2021/Inside-Look-High-Deductible-Plans.pdf
4 Commonwealth of Massachusetts Office of the Attorney General. Examination of Health Care Cost Trends and Cost Drivers Pursu-ant to G.L. c. 12C, § 17: Report for Annual Public Hearing Under G.L. c. 6D, § 8.. Oct.2016. Available at: https://www.mass.gov/doc/2016-examination-of-market-health-care-cost-trends-and-cost-drivers/download
5 Ash AS, Mick EO, Ellis RP, Kiefe CI, Allison JJ, Clark MA. Social Determinants of Health in Managed Care Payment Formu-las. JAMA Intern Med. 2017;177(10):1424–1430. doi:10.1001/jamainternmed.2017.3317
6 Sherman BW, Gibson TB, Lynch WD, Addy C. Health Care Use and Spending Patterns Vary By Wage Level In Employer-Spon-sored Plans. Health Affairs. 2017; 36:2, 250-257. doi:10.1377/hlthaff.2016.1147
7 Chandra A, Gruber J, McKnight R. 2010. Patient Cost-sharing and Hospitalization Offsets in the Elderly. American Economic Review. 2010; 100(1):193-213. https://doi.org/10.1257/aer.100.1.193
8 Chernew ME, Fendrick AM, Glied S, Ignagni K, Parente S, Robinson J, Wilensky GR. Benefit Design to Promote Effective, Efficient, and Affordable Care: A Vital Direction for Health and Health Care. NAM Perspectives. Discussion Paper, National Academy of Medicine, Washington, DC. 2016. https://doi.org/10.31478/201609h
9 Center for Health Information and Analysis. The Benefits Divide: Workers at Lower-Wage Firms and Employer-Sponsored Insurance in Massachusetts. Aug. 2017. Available at: https://www.chiamass.gov/assets/docs/r/pubs/17/mes-research-brief-august-2017.pdf
10 Commonwealth of Massachusetts Office of the Attorney General. Examination of Health Care Cost Trends and Cost Drivers Pursu-ant to G.L. c. 12C, § 17: Report for Annual Public Hearing Under G.L. c. 6D, § 8.. Oct.2016. Available at: https://www.mass.gov/doc/2016-examination-of-market-health-care-cost-trends-and-cost-drivers/download
11 Agarwal R, Mazurenko O, Menachemi N. High-Deductible Health Plans Reduce Health Care Cost and Utilization, Including Use of Needed Preventive Services. Health Affairs. 2017; 36.10: 1762-1768. https://doi.org/10.1377/hlthaff.2017.0610
12 Chandra A, Flack E, Obermeyer Z. The Health Costs of Cost-Shar-ing. National Bureau of Economic Research Working Paper Series. No. 28439. Feb. 2021. 10.3386/w28439
13 Health Policy Commission. HPC Policy Brief: Oral Health Care Access and Emergency Department Utilization for Avoidable Oral Health Conditions in Massachusetts. Aug. 2016. Available at: https://www.mass.gov/doc/oral-health-brief/download
14 Health Policy Commission. HPC DataPoints, Issue 8: Urgent Care Centers and Retail Clinics. Aug. 2018. Available at : https: / /www.mass.gov/info-detai ls/hpc-datapoints-issue-8-urgent-care-centers-and-retail-clinics
15 Health Policy Commission. HPC DataPoints, Issue 19: Persistently High Out-of-Pocket Costs Make Health Care Increasingly Unaf-fordable and Perpetuate Inequalities in Massachusetts. Jan. 2021. Available at: https://www.mass.gov/info-details/hpc-datapoints-issue-19-persistently-high-out-of-pocket-costs-make-health-care
16 Andrews M. A $10,322 Tab for a Sleep Apnea Study is Enough to Wreck One Patient’s Rest. WBUR. May 2021. Available at: https://www.wbur.org/npr/1000494207/a-10-322-tab-for-a-sleep-apnea-study-is-enough-to-wreck-one-patients-rest

CHAPTER 4:
POLICY RECOMMENDATIONS

- 24 -HEALTH POLICY COMMISSION 2021 COST TRENDS REPORT
CHAPTER 4: POLICY RECOMMENDATIONS
AREAS OF FOCUS
1 2 3 4 5Strengthen
Accountability for Excessive Spending
Constrain Excessive
Provider Prices
Make Health Plans Accountable for
Affordability
Advance Health Equity for All
Implement Targeted Strategies
and Policies
In 2012, Massachusetts adopted an innovative approach to reduce health care costs by establishing an annual cost growth benchmark and providing oversight authority to a new independent state agency in the Health Policy Commission (HPC). Despite several years of notable progress, spending has grown in excess of the benchmark for the past two years. Unless urgently addressed, these concerning trends will result in a health care system that is increasingly unaffordable for Massachusetts residents and businesses and will deepen long-standing health inequities.
As the Commonwealth approaches the ten year anniversary of this nation-leading effort, it is critical that lawmakers take action this session to strengthen and enhance the state’s strategy for addressing the intersecting challenges of cost containment, affordability, and health equity to improve outcomes and lower costs for all.
With that opportunity in mind, the HPC recommends the Com-monwealth take the following immediate actions:
1. STRENGTHEN ACCOUNTABILITY FOR EXCESSIVE SPENDING. Recognizing that statewide spending growth has exceeded the benchmark, the Commonwealth should strengthen the mechanisms for holding providers, payers, and other health care actors responsible for spending performance. The Legis-lature should take action to improve the annual performance improvement plan (PIP) process by allowing the Center for Health Information and Analysis (CHIA) to use metrics other than health status adjusted total medical expense growth to identify entities contributing to concerning spending. These measures should hold providers accountable for spending for all of their patients (not only their primary care patients), should include a broader range of provider types than primary care groups (e.g., hospitals), and should address the impact of medical coding efforts which can both
increase spending and mask spending increases in health status adjusted measures. The PIPs process can be further strengthened by increasing financial penalties for above-benchmark spending or non-compliance. Finally, the Legislature should consider addi-tional tools that ensure that the benchmark reflects and responds to underlying variation in the relative level of provider prices.
2. CONSTRAIN EXCESSIVE PROVIDER PRICES. Prices continue to be a primary driver of health care spending growth in Massachusetts, and the significant variation in prices for Massa-chusetts providers (without commensurate differences in quality) continues to divert resources away from smaller, less competitive community providers toward generally larger and more well-re-sourced systems. For example, shifts in volume from lower-priced to higher-priced hospitals, combined with commercial price levels which can be three times as high as Medicare prices, were a key reason Massachusetts failed to meet the benchmark in 2018 and 2019. Many market initiatives have attempted to address these pricing failures (e.g., tiered and narrow network products, price transparency, risk contracting), but have failed to meaningfully restrain provider price growth or reduce unwarranted variation in provider prices. Accordingly, the HPC recommends the fol-lowing actions:
A. Establish Price Caps for the Highest-Priced Providers in Massachusetts. The Legislature should take action to cap prices for the highest-priced providers (i.e., limiting the highest, service-specific commercial prices with the greatest impact on spending) and limit price growth (e.g., limiting annual service-, insurer-, and provider-specific price growth). Such price caps, targeted specifically at the highest-priced providers in Massachusetts, would be an important complement to the health care cost growth benchmark, which is not designed to
- 25 -HEALTH POLICY COMMISSION 2021 COST TRENDS REPORT
CH
APTER 4
directly address prices. Such caps would reduce unwarranted price variation and promote equity by ensuring that future price increases can accrue appropriately to lower-priced providers, including many community hospitals and other providers that care for populations facing the greatest health inequities, ensuring the viability of these critical resources.
B. Limit Facility Fees. In many cases, the same services can be provided in both hospital outpatient departments and non-hospital settings such as physician offices. Nevertheless, Massachusetts residents disproportionately use hospital outpa-tient settings, on average, utilizing hospital outpatient services 40 percent more than residents of other states do. Prices and patient cost-sharing are generally substantially higher at hos-pital outpatient sites due to the addition of hospital “facility fees.” In many cases, patients may not realize that pricing can be substantially higher at some sites (those licensed as hospital outpatient departments), unknowingly facing higher costs as a result. In order to improve market functioning and consumer protections, policymakers should take action to require site-neutral payments for certain common ambulatory services (e.g., basic office visits) and limit the cases in which both newly-licensed and existing sites can bill as hospital outpatient departments. Additionally, outpatient sites that charge facility fees should be required to conspicuously and clearly disclose this fact to patients, prior to delivering care.
C. Enhance Scrutiny and Monitoring of Provider Expan-sions and Ambulatory Care. Recognizing that the cost of care can vary substantially among different providers, with significant implications for health equity and affordability, the Commonwealth should continue to closely examine the impact of plans for major expansions of services or new facilities, particularly for higher-priced providers. These examinations should evaluate the impact on health care costs, quality, access, and market competition, and ensure that any such expansions are well informed by health equity considerations and aligned with community need. In addition, given the particular impor-tance of outpatient care in driving spending and utilization trends and the likelihood of ambulatory and hospital outpatient care expansions, the Commonwealth should improve data col-lection on ambulatory care across different sites and settings, including urgent care, hospital main campus and off-campus sites, and non-hospital-licensed ambulatory sites. Enhanced data will better enable the HPC and others to analyze the impact of shifts in patient care between lower- and higher-priced sites on health care costs, quality, and access, particularly for underserved populations.
D. Adopt Default Out-of-Network Payment Rate. As a con-straint on the spending and market impact of excessive prices charged by out-of-network providers, the Legislature should enact the default out-of-network payment rate for “surprise billing” situations recommended by the Executive Office of Health and Human Services in its Report to the Massachusetts Legislature: Out-of-Network Rate Recommendations.
3. MAKE HEALTH PLANS ACCOUNTABLE FOR AFFORD-ABILITY. As both health insurance premiums and consumer cost-sharing growth continued to outpace increases in total claims spending, wage growth, and inflation between 2017 and 2019, the Commonwealth should require greater accountability of health plans for delivering value for consumers and ensure that any savings that accrue to health plans (e.g., from provider price caps as described above) are passed along to consumers.
A. Set New Affordability Targets and Affordability Stan-dards. To both complement and bolster the health care cost growth benchmark, the Commonwealth should set measurable goals that target affordability of care for Massachusetts res-idents. This measurement strategy should identify and track improvement on indicators of affordability, including mea-sures that capture the differential impact of both health plan premiums and consumer out-of-pocket spending by income, geography, market segment, and other factors. Such targets should inform the development of new health plan affordability standards which prioritize the public’s interest in equitable access to quality care.
B. Improve Health Plan Rate Approval Process. The Legisla-ture should require that the health plan affordability standards discussed above be a key factor in the Division of Insurance’s review and approval of health plan rate filings. In addition, there should be greater transparency and public participation in the rate approval process by including, at a minimum, a public comment period, and written justifications for approvals of rate increases.
C. Reduce Administrative Complexity. Administrative com-plexity that does not add value permeates the Massachusetts health care system, from the wide array of plan options that are not easily comparable for consumers and employers, to differ-ing rules for claims submission and prior authorization which consume significant provider time and divert attention away from patient care, to non-standard alternative payment method (APM) contract terms which may ultimately undermine efforts to shift away from the historic fee-for-service pricing model.

- 26 -HEALTH POLICY COMMISSION 2021 COST TRENDS REPORT
This lack of standardization across health plans creates unnec-essary costs for all health care actors and for the Massachusetts residents and businesses and their employees who pay for this complexity in the form of higher premiums, cost-sharing, and confusion in navigating the health care system. The Legislature should require greater cross-payer standardization of policies, programs, and processes to reduce administrative complexity, enhance affordability, and improve equity.
D. Improve Benefit Design and Cost-Sharing. As the number of Massachusetts consumers with high-deductible health plans has sharply increased, the HPC has documented increasing challenges to affordability, equitable access, and experience of care, particularly for employees with lower incomes. Even in traditional health plans, cost-sharing can disproportionately impact individuals with lower income. Health plans should work with employers to develop alternatives to high-deduct-ible health plans and other benefit designs that can impede access and perpetuate inequities. In particular, to put equity at the forefront, health plans and employers should revise plan designs that require set contributions for all members regardless of income and all medical services regardless of value (such as by waiving co-payments or deductibles for high-value medical care) and by structuring premium contributions to reflect different employee wage levels.
E. Alternative Payment Methods (APMs). Health plans should continue to promote the increased adoption and effectiveness of APMs, especially in the commercial market where expan-sion has stalled (e.g., increased use of primary care capitation, APMs for preferred provider organization (PPO) populations, episode bundles, and two-sided risk models).
4. ADVANCE HEALTH EQUITY FOR ALL. The Common-wealth and all actors in the health care system should be held accountable in efforts to achieve health equity for all.
A. Set New Health Equity Targets. To ensure that all residents of the Commonwealth have the opportunity to attain their full health potential without being disadvantaged from achieving that potential because of socioeconomic status or socially-as-signed circumstance (e.g., race, ethnicity, language, disability status, sexual orientation, and gender identity), the Common-wealth should set measurable goals to advance health equity. Such goals should focus on eliminating disparities that manifest in both health and health care and be developed through a collaborative approach that is guided by the perspectives of individuals and communities most affected by these disparities.
B. Address Social Determinants of Health. The Common-wealth should continue to examine and address the social determinants of health (SDOH) that can lead to poor health outcomes for individuals and communities. Policymakers should consider making investments in affordable housing, food security, transportation systems, and other community resources. Health care providers, as anchor institutions, can play a critical role in supporting community-led efforts to improve these and other SDOH. At the same time, providers should enhance their efforts to address the health-related social needs of individual patients through collaborative relationships with community-based social service agencies to ensure a holistic response to patients’ medical, behavioral, and social needs. Payers and providers should continue to offer and adopt APMs that enable the investments in care coordination, integrated technology, and performance measurement that support such relationships.
C. Improve Data Collection. Data collection improvement is a critical and fundamental first step in the work to dismantle racism and other long-standing inequities that, in the context of the health care delivery system, result in profound dispar-ities, such as maternal health outcomes for people of color. Collaboration among all stakeholders, including policymakers, providers, and payers, is foundational to ensure the collection of reliable patient data on race, ethnicity, language, disability status, sexual orientation, and gender identity to inform the integration of equity considerations into quality improvement, cost-control, and affordability efforts.
5. IMPLEMENT TARGETED STRATEGIES AND POLICIES. To further advance cost containment, affordability, and health equity, the Commonwealth should adopt the following additional strategies and policies.
A. Examine Increases in Medical Coding Intensity and Improve Patient Risk Adjustment. The HPC and other researchers have documented that recent increases in patient risk scores and acuity are better explained by changes in payer and provider documentation and coding behavior than by changes in actual patient health status. While there are benefits to more complete and accurate coding, increased coding inten-sity impairs accurate performance measurement, absorbs and attracts resources and personnel, and has resulted in millions in additional spending for Massachusetts payers, employers, and residents. The Commonwealth should continue to investigate medical coding and risk adjustment trends and incentives

- 27 -HEALTH POLICY COMMISSION 2021 COST TRENDS REPORT
CH
APTER 4
and take action to mitigate the impact of changes in clinical documentation practices on spending and performance mea-surement. Specific areas of action should include adoption of risk adjustment methods for accountability and payment purposes that are not based primarily on patient diagnoses or severity, more frequent updates to clinical classification software to better align payments with actual resource use, mechanisms to offset coding-related spending impacts, and continued development of alternative risk adjustment methods and performance metrics less sensitive to coding-based acuity.
B. Reduce Pharmaceutical Drug Spending, Align Pricing with Value, and Improve Affordability. The Commonwealth should take action to reduce drug spending growth and improve affordability for patients. High-cost specialty drugs represent an increasing share of drug spending, and the large number of new specialty drugs expected to enter the market over the next decade brings not only the promise of improvement to patients’ lives but also significant concerns about the impact on health care spending. Recent discussions about the clinical benefits of newly-approved high-cost medications have also underscored the need for greater focus on value to ensure that drug costs are aligned with the benefits such drugs provide to patients and society. Massachusetts should build on its current successful initiatives to reduce drug spending growth. For example, MassHealth continues to demonstrate the ability to reduce pharmacy costs without restricting consumer access. This is one model that should be replicated by authorizing the expansion of the HPC’s drug pricing review authority to include drugs with a financial impact on the commercial market in Massachusetts. The state should further increase oversight and transparency for the full drug distribution chain, including of pharmacy benefit managers’ (PBMs) purchasing and pricing practices. Payers and providers should pursue strategies to maximize value and enhance access by using risk-based con-tracts and value-based benchmarks when negotiating prices, distributing clinical decision tools, monitoring prescribing patterns, and developing plan designs that minimize financial barriers to high-value drugs.
C. Improve Primary and Behavioral Health Care. There is considerable evidence that health care delivery systems oriented toward primary care tend to have lower costs, higher quality, and a more equitable distribution of health care resources. Better management of behavioral health condi-tions has also been found to lower overall health care spending
and improve quality of life. The ongoing novel coronavirus pandemic (COVID-19) has underscored the importance of equitable access to both types of care. Specific areas of focus should include:
i. Focus Investment in Primary Care and Behavioral Health Care. Payers and providers should increase spending devoted to primary care and behavioral health while adhering to the Commonwealth’s total health care cost growth benchmark. These spending increases should prioritize non-claims-based spending such as capitation, infrastructure, and workforce investments. CHIA and the HPC should continue to track and report on primary care and behavioral health care spending trends annually and hold entities accountable for meeting improvement targets if they fall short of established targets.
ii. Improve Access to Behavioral Health Services. In response to increased need for behavioral health services as a result of the pandemic — in particular among children, young adults, and people of color — payers and providers should take steps to increase access to behavioral health services appropriate for and accessible to these populations. This must include a redoubling of the Commonwealth’s efforts to provide resources and support to individuals and families suffering from the effects of the opioid epi-demic, notably Black men, a population that has recently experienced a significant increase in overdoses. The Com-monwealth can advance these goals and additional efforts to increase needed access to behavioral health care by imple-menting the Executive Office of Health and Human Services’ Roadmap for Behavioral Health Reform: Ensuring the right treatment when and where people need it.
D. Support Efforts to Reduce Low-Value Care. HPC research shows that Massachusetts residents continue to receive a sig-nificant amount of care that does not provide value, and the provision of such care by provider organizations varies widely. The Commonwealth should act to reduce the incidence of low-value care. Toward this end, payers, providers, and purchasers should convene to develop strategies, incentives, and action steps to eliminate low-value care. Employers can also play a role in assisting employees and their families in accessing information useful in making high-value treatment decisions.
- 28 -HEALTH POLICY COMMISSION 2021 COST TRENDS REPORT
THE IMPACT OF COVID-19This report is issued in the context of the ongoing response to COVID-19, which has indelibly changed the lives of Massachusetts residents and the health care system that serves them. As vaccine administration efforts and the response to new variants continue, recovery for residents, the health care system, and health care workers will be a long-term process. To help guide this recovery, policymakers, health care leaders, and community partners should look to lessons from the pandemic to inform opportunities for rebuilding sustainable, resilient, and equitable systems of care. In this context, the Legislature has charged the HPC with studying the impact of COVID-19 on the health care delivery system. An Interim Report was released in April 2021, and a Final Report from the HPC is due in 2022. While many of the topics will be more fully examined in the Final Report, the HPC recommends that the Commonwealth take immediate steps to sustain the successful innovations made during the pandemic including, for example, expanded access to telehealth, workforce flexibilities, and innovative care models. The HPC stands ready to support these efforts with data insights and independent policy leadership.

CHAPTER 5:
DASHBOARD OF HPC PERFORMANCE
METRICS

- 30 -HEALTH POLICY COMMISSION 2021 COST TRENDS REPORT
MASSACHUSETTS TIME TREND U� S� COMPARISON
Previous Most Recent
Perf
orm
ance
Most Recent
Com
paris
on
HEA
LTH
EQ
UITY
AN
D A
FFO
RDAB
ILIT
Y
1 Individuals under age 65 with high out-of-pocket spending relative to income DISPARITY N/A 6.1%
(2017-2018) N/A 8.3% (2017-2018)
2 Share of middle class families that are spending more than 1/4 of total compensation on health care
27.8% (2013-2015)
32.9% (2016-2018)
27.6% (2016-2018)
3 Adults who went without care because of cost in the past year DISPARITY 9% (2016) 9% (2018) 13% (2018)
4 Rate of uninsurance among non-elderly adults with income less than 200% FPL 5.9% (2018) 6.5% (2019) 18.1% (2019)
5 Adults without all age- and gender-appropriate cancer screenings DISPARITY 23% (2014) 24% (2018) 32% (2018)
6 Infant mortality (per 1,000 live births) DISPARITY 3.9 (2016) 3.7 (2017) 5.8 (2017)
7 Mortality amenable to health care (deaths per 100,000 population) DISPARITY 59.9
(2014-2015)57.4
(2016-2017)84.5
(2016-2017)
8 Adults ages 18–64 who report fair or poor health DISPARITY 14% (2017) 13% (2018) 17% (2018)
9 Share of population living in a food insecure household 8.9% (2018) 8.2% (2019) 10.9% (2019)
10 Share of population living in a health professional shortage area N/A 7.7% (2020) N/A 24.8% (2020)
MEASURE HIGH INCOME
LOW INCOME
DISPARITY (PPT)
STATE RANK ON DISPARITY
Individuals under age 65 with high out-of-pocket spending relative to income 0.7% 20.0% +19�3 31
Adults who went without care because of cost in the past year 5% 18% +13 12
Adults without all age- and gender-appropriate cancer screenings 21% 28% +7 7
Adults ages 18-64 who report fair or poor health 6% 23% +17 4
MEASURE RATE DISPARITY
Infant mortality (per 1,000 live births)
White 2.7 –Hispanic 4.6 +1�9
Black 7.4 +4�7
Mortality amenable to health care (deaths per 100,000 population)
Other race / ethnicity 31.9 –Hispanic 54.2 +22�3
White 56.6 +24�7
Black 87.3 +55�4
DISPARITIES BY INCOME
DISPARITIES BY RACE / ETHNICITY
Better performance
Similar performance
Worse performance
Exhibit 5�1 Dashboard of HPC performance metrics
CHAPTER 5: DASHBOARD OF HPC PERFORMANCE METRICS

- 31 -HEALTH POLICY COMMISSION 2021 COST TRENDS REPORT
MASSACHUSETTS TIME TREND U� S� COMPARISON
Previous Most Recent
Perf
orm
ance
Most Recent
Com
paris
on
ALTE
RNAT
IVE
PAYM
ENT
MET
HO
DS 11 Percentage of Original Medicare beneficiaries covered
by APMs 43.3% (2018) 40.4% (2019) 33.4% (2019)
12 Percentage of commercial HMO patients in APMs 54.5% (2018) 50.9% (2019) N/A N/A
13 Percentage of commercial PPO patients in APMs 23.5% (2018) 26.6% (2019) N/A N/A
14 MassHealth managed care member months under APMs 67.4% (2018) 84.6% (2019) N/A N/A
BEN
CHM
ARK
AND
SPE
ND
ING 15 Growth of THCE per capita (performance assessed
relative to 3.1% benchmark) 3.6% (2018) 4.3% (2019) 4.7% (2019)
16Growth in commercial health care spending per capita, full claims (performance assessed relative to 3.1% benchmark)
3.3% (2018) 3.5% (2019) 4.8% (2019)
17Employer-based health insurance premiums, single coverage (performance assessed relative to 3.1% benchmark)
$7,443 (2018) $7,540 (2019) $6,972 (2019)
18Benchmark premium for second-lowest-cost exchange plan, single coverage (performance assessed relative to 3.1% benchmark)
$3,792 (2018) $3,984 (2019) $5,736 (2019)
EFFI
CIEN
T, H
IGH
-QUA
LITY
CA
RE D
ELIV
ERY
19 Readmission rate (Medicare) 18.3% (2017) 18.4% (2018) 16.8% (2018)
20 Readmission rate (All payer) 15.4% (2017) 15.4% (2018) N/A N/A
21 ED utilization (per 1,000 persons) 357 (2018) 351 (2019) MA = 491 U.S. = 437 (2019)
22 BH-related ED utilization (per 1,000 persons) 28 (2018) 27 (2019) N/A N/A
23 Avoidable ED utilization (per 1,000 persons) 143 (2018) 142 (2019) N/A N/A
24 Percentage of inpatient discharges to institutional PAC 18.1% (2018) 17.2% (2019) MA = 17.6% U.S. = 15.4% (2017)
25Asthma medication ratio: percentage of members age 5–64 with persistent asthma who had a ratio of controller medications to total asthma medications of ≥0.50
71% (2014)
75% (2018) N/A N/A
26
Follow-up after hospitalization for mental illness (30 day): percentage of members age 6 and older who were hospitalized for treatment of selected mental disorders or intentional self-harm and who had a follow-up visit by a mental health provider within 30 days after discharge
N/A 79% (2018) N/A N/A N/A
27
Well care visits for adolescents: percentage of adolescents age 12–21 who had one or more well-care visits with a primary care provider or OB/GYN during the measurement year
79% (2014)
80% (2018) N/A N/A
VALU
E-BA
SED
M
ARKE
TS
28 Share of hospital care in top 5 networks 53.2% (2018) 60.9% (2019) N/A N/A
29 Share of newborn deliveries in community hospitals 50.4% (2018)
49.7% (2019) N/A N/A
30 Share of discharges from hospitals with relative price above 1�2
27.1% (2018)
27.6% (2019) N/A N/A
Better performance
Similar performance
Worse performance
Exhibit 5�1 Dashboard of HPC performance metrics cont.

- 32 -HEALTH POLICY COMMISSION 2021 COST TRENDS REPORT
Sources:1 Radley et al. “2020 Scorecard on State Health System Performance.”
Commonwealth Fund. September 2020. Available at: https://2020score-card.commonwealthfund.org/.
2 HPC analysis of Medical Expenditure Panel Survey (MEPS), CPS Annual Social and Economic Supplement (ASEC), BEA Regional Price Parities (RPP) and General Social Survey (GSS) data. See Massachusetts HPC 2019 Annual Cost Trends Report (p.15) for details.
3 Radley et al. “2020 Scorecard on State Health System Performance.” Commonwealth Fund. September 2020.
4 KFF State Health Facts. “Health Insurance Coverage of the Nonelderly (0-64) with Incomes below 200% Federal Poverty Level (FPL).” Kaiser Family Foundation. Available at: https://www.kff.org/other/state-indicator/nonelderly-up-to-200-fpl/
5 Radley et al. “2020 Scorecard on State Health System Performance.” Commonwealth Fund. September 2020.
6 Radley et al. “2020 Scorecard on State Health System Performance.” Commonwealth Fund. September 2020.
7 Radley et al. “2020 Scorecard on State Health System Performance.” Commonwealth Fund. September 2020.
8 Radley et al. “2020 Scorecard on State Health System Performance.” Commonwealth Fund. September 2020.
9 Map the Meal Gap 2020. “Food Insecurity in Massachusetts.” Feeding America. Available at: https://map.feedingamerica.org/district/2018/overall/massachusetts
10 KFF State Health Facts. “Primary Care Health Professional Shortage Areas (HPSAs).” Kaiser Family Foundation. Available at: https://www.kff.org/other/state-indicator/primary-care-health-professional-shortage-areas-hpsas
11 Center for Health Information and Analysis. Annual Report on the Perfor-mance of the Massachusetts Health Care System: 2021 Annual Report APM Databook. March 2021. Available at: http://www.chiamass.gov/annual-report/.
12 Center for Health Information and Analysis. Annual Report on the Perfor-mance of the Massachusetts Health Care System: 2021 Annual Report APM Databook. March 2021.
13 Center for Health Information and Analysis. Annual Report on the Perfor-mance of the Massachusetts Health Care System: 2021 Annual Report APM Databook. March 2021.
14 Center for Health Information and Analysis. Annual Report on the Perfor-mance of the Massachusetts Health Care System: 2021 Annual Report APM Databook. March 2021.
15 MA - Center for Health Information and Analysis. Annual Report on the Performance of the Massachusetts Health Care System, Total Health Care Expenditures Databook. March 2021. Available at: http://www.chiamass.gov/annual-report/; US - Centers for Medicare and Medicaid Services National Health Expenditure Data. 2020. Available from: https://www.cms.gov/research-statistics-data-and-systems/statistics-trends-and-reports/nationalhealthexpenddata/.
16 Centers for Medicare and Medicaid Services, National Healthcare Expen-diture Accounts Personal Health Care Expenditures Data, 2014-2019 and State Healthcare Expenditure Accounts, 1999-2014; Center for Health Information and Analysis, Total Health Care Expenditures, 2014-2019
17 Agency for Healthcare Research and Quality. 2019 Medical Expenditure Panel Survey, Insurance Component, Table II.C.1 and II.D.1. Available at: https://meps.ahrq.gov/survey_comp/Insurance.jsp
18 Kaiser Family Foundation. State Health Facts, Health Reform, Health Insurance Marketplaces, Marketplace Average Benchmark Premiums. 2019. Available at: https://www.kff.org/health-reform/state-indicator/marketplace-average-benchmark-premiums/.
19 Centers for Medicare and Medicaid Services. Geographic Variation Public Use File: State Table— Beneficiaries 65 And Older. 2011-2018. Available at: https://www.cms.gov/Research-Statistics-Data-and-Sys-tems/Statistics-Trends-and-Reports/Medicare-Geographic-Variation/GV_PUF.html.
20 Center for Health Information and Analysis. Hospital-Wide Adult All-Payer Readmissions In Massachusetts: SFY 2011-2018. 2019 Dec. Available at: https://www.chiamass.gov/hospital-wide-adult-all-payer-readmis-sions-and-revisits-in-massachusetts/.
21 HPC analysis of Center for Health Information and Analysis Emergency Department Database, 2018-2019.
22 HPC analysis of Center for Health Information and Analysis Emergency Department Database, 2018-2019.
23 HPC analysis of Center for Health Information and Analysis Emergency Department Database, 2018-2019.
24 HPC analysis of Center for Health Information and Analysis Hospital Inpatient Discharge Database, 2018-2019 and Health Healthcare Cost and Utilization Project, Nationwide Inpatient Sample Survey, 2017.
25 Center for Health Information and Analysis analysis based on NCQA HEDIS 2019 specifications. “A Focus on Provider Quality: Selected Clinical Measures, 2018.” Available at: https://www.chiamass.gov/a-fo-cus-on-provider-quality-selected-clinical-measures/; https://www.ncqa.org/hedis/measures/
26 Center for Health Information and Analysis analysis based on NCQA HEDIS 2019 specifications. “A Focus on Provider Quality: Selected Clinical Measures, 2018.”
27 Center for Health Information and Analysis analysis based on NCQA HEDIS 2019 specifications. “A Focus on Provider Quality: Selected Clinical Measures, 2018.”
28 HPC analysis of Center for Health Information and Analysis Hospital Cost Reports, 2018-2019.
29 HPC analysis of Center for Health Information and Analysis Hospital Inpatient Discharge Database, 2018-2019.
30 Center for Health Information and Analysis. Provider Price Variation in the Massachusetts Commercial Market, CY2019. March 2021. Available at: https://www.chiamass.gov/relative-price-and-provider-price-variation/

- 33 -HEALTH POLICY COMMISSION 2021 COST TRENDS REPORT
LIST OF TECHNICAL APPENDICES
1 Acute Care Hospitals in Massachusetts by Type of Hospital
2 Understanding Patterns of Health Care Spending, Utilization, Affordability, and Access for Commercially-Insured Massachusetts Residents with Lower Incomes
3 Commercial Price Trends
4 Hospital Utilization
5 Post-Acute Care
6 Alternative Payment Methods
7 Provider Organization Performance Variation

- 34 -HEALTH POLICY COMMISSION 2021 COST TRENDS REPORT
ACKNOWLEDGMENTS
COMMISSIONERSDr. Stuart Altman Chair
Mr. Martin Cohen Vice Chair
Dr. Donald Berwick
Ms. Barbara Blakeney
Dr. David Cutler
Mr. Timothy Foley
Mr. Michael Heffernan Secretary of Administration and Finance
Ms. Patricia Houpt
Dr. John Christian Kryder
Mr. Renato “Ron” Mastrogiovanni
Ms. Marylou Sudders Secretary of Health and Human Services
EXECUTIVE DIRECTORMr. David Seltz
The HPC’s Research and Cost Trends staff, led by Dr. David Auer-bach, conducted the analyses and prepared the annual cost trends report. They are as follows: Dr. Sasha Albert, Sweya Gaddam, Yue Huang, Hannah James, Justin Kiel, Lyden Marcellot, Dr. Laura Nasuti, Sara Sadownik, and Diana Sanchez.
Ashley Johnston designed the report. Many additional HPC staff contributed significantly to the preparation of this report from each of the HPC’s departments: Office of the Chief of Staff (led by Coleen Elstermeyer), Office of the General Counsel (led by Lois Johnson), Health Care Transformation and Innovation (led by Kelly Hall), and Market Oversight and Transparency (led by Kate Scarborough Mills). The HPC received input and guidance from a number of clinical experts, including Michael Barnett MD, MS, Assistant Professor, Department of Health Policy and Management at Harvard T.H. Chan School of Public Health; Ateev Mehrotra, MD, MPH, Associate Professor of Health Care Policy, Department of Health Care Policy, Harvard Medical School and
Associate Professor of Medicine and Hospitalist, Beth Israel Dea-coness Medical Center; and Kao-Ping Chua, MD, PhD, Assistant Professor of Health Management and Policy and of Pediatrics, University of Michigan. We gratefully acknowledge Rob Rosofsky for assistance with the All-Payer Claims Database (APCD).
The HPC acknowledges the significant contributions of other government agencies in the development of this report, includ-ing the Center for Health Information and Analysis (CHIA); the Office of MassHealth and the Commonwealth’s Executive Office of Health and Human Services (EOHHS); and the federal Centers for Medicare & Medicaid Services (CMS).
HPC staff received valuable assistance from many others in gov-ernment, industry, and the research community. The HPC would like to thank its Advisory Council and other market participants and stakeholders for insightful input and comments.

MASSACHUSETTS HEALTH POLICY COMMISSION
50 MILK STREET, 8TH FLOOR
BOSTON, MA 02109
WWW.MASS.GOV/HPC