examination of health care cost trends and cost · pdf filei. massachusetts prescription drug...
TRANSCRIPT
Examination of Health Care Cost Trends and Cost Drivers
Pursuant to G.L. c. 12C, § 17Report for Annual Public Hearing Under G.L. c. 6D, § 8
CO
MM
ON
WEALTH OF MASSACH
USE
TT
S
OFF
ICE
OF THE ATTORNEY GENER
AL
October 7, 2016

Examination of Health Care Cost Trends and Cost Drivers Pursuant to G.L. c. 12C, § 17

Examination of Health Care Cost Trends and Cost Drivers Pursuant to G.L. c. 12C, § 17
Table of Contents
Table of Contents
Executive Summary ................................................................................................ 1
I. Massachusetts Prescription Drug Cost Trend Continues to Show Substantial Increases Year over Year, Even Net of Rebates. ................5
II. The Health Plans Examined Reimburse for Specialty Prescription Drugs in Very Different Ways. .......................................................................9
A. Traditional Reimbursement for Pharmaceuticals .............................................................9
B. Reimbursement Arrangements for Specialty Drugs by Massachusetts Health Plans in 2016 ........................................................................................................................... 10
III. Case Study: Among Prescription Drugs Used to Treat Multiple Sclerosis, Prices Have Risen Significantly, With Little Variation in Price Among Plans. ........................................................................................14
A. Multiple Sclerosis and FDA Approved Disease Modifying Therapies ..................... 14
B. MS Drugs Show Consistent Price Increases and Little Price Variation Across Plans .......................................................................................................................................... 16
C. The Impact of a Single Generic Alternative on MS Drug Spending is Unclear. ....25
IV. Conclusions and Recommendations ....................................................... 28
Acknowledgements ........................................................................................... 30

Examination of Health Care Cost Trends and Cost Drivers Pursuant to G.L. c. 12C, § 17

Examination of Health Care Cost Trends and Cost Drivers Pursuant to G.L. c. 12C, § 17
Executive SummaryThis is the Office of the Attorney General’s 2016 report of its examination1 of pharmaceutical cost trends conducted pursuant to Section 17 of Chapter 12C of the Massachusetts General Laws.
At the close of our September 2015 Cost Trends Report, we noted a concerning trend: if commercial prescription drug spending grew at the same rate in 2015 as in 2014, Massachusetts health care cost growth would exceed the benchmark unless spending growth for all other medical expenses was no more than 1.8%.2 Since the release of that report, the continued rise in prescription drug spending has been the subject of widespread discussion among public leaders and policymakers, in the media, and by consumers and their advocates in the Commonwealth and throughout the United States. We have continued to see prominent examples where the growth in prescription drug costs has impacted patient access to medications, including treatments for diabetes,3 anaphylaxis,4 Hepatitis C,5 and rheumatoid arthritis.6
While the growth rate for prescription drug spending reported to the Center for Health Information and Analysis (“CHIA”) abated from 13.5% in 2014 to 10.1% in 2015, it has continued to significantly outpace overall health care spending growth.7 This steady increase in spending on prescription drugs has had economic consequences for employers, governments, and other health care purchasers, and has directly impacted patients, both through higher insurance premiums and an increase in the share of drug expenses paid directly through deductibles and other consumer cost-sharing.8
Others have underscored the urgency of controlling prescription drug spending growth. For example, the Health Policy Commission’s 2015 Cost Trends Report explained that prescription drug spending grew 12.5% per commercial enrollee in 2014, which exceeded the 10% growth seen nationally and followed two years in which growth in prescription drug spending had
1 This report relies on information obtained through civil investigative demands issued to health plans, pharmacy benefit managers, and pharmacies pursuant to Mass. Gen. Laws c. 12C, § 17. We reviewed detailed information on pharmaceutical contracting, claims, prices, and utilization and consulted with pharmaceutical experts, health plans, providers, consumer advocates, pharmaceutical manufacturer groups, and other key stakeholders. To assist in its review, the AGO engaged experts with extensive experience in economic and health care data analysis.
2 OFFICE OF ATT’Y GEN. MAURA HEALEY, EXAMINATION OF HEALTH CARE COST TRENDS & COST DRIVERS PURSUANT TO G.L. C. 12, § 11N, REPORT FOR ANNUAL PUB. HEARING 25-26 (Sept. 18, 2015).
3 See Kasia Lipska, Break Up the Insulin Racket, N.Y. TIMES (Feb. 20, 2016).4 See Tara Parker-Pope & Rachel Rabkin Peachman, Epipen Price Rise Sparks Concern for Allergy Sufferers, N.Y. TIMES (Aug. 22,
2016).5 See Peter Loftus, High Cost of New Hepatitis C Drugs Strains Prison Budgets, Locks Many Out of Cure, WALL ST. J. (Feb. 20,
2016).6 See Katie Thomas, A Push to Lower Drug Prices That Hit Insurers and Employers the Hardest, N.Y. TIMES (Sept. 8, 2016).7 CENTER FOR HEALTH INFO. & ANALYSIS, PERFORMANCE OF THE MASSACHUSETTS HEALTH CARE SYSTEM, ANNUAL
REPORT 2016 3-4 (Sept. 2016) [hereinafter “CHIA 2016 REPORT”].8 Though consumers (and their employers) ultimately bear the costs of prescription drugs, the decisions of many other market
participants shape those costs, from the health care providers who determine which drugs are prescribed and purchased, to the manufacturers, health plans, pharmacy benefit managers, and pharmacies whose negotiations determine drug prices.
Executive Summary -1-

Examination of Health Care Cost Trends and Cost Drivers Pursuant to G.L. c. 12C, § 17
-2- Executive Summary
been less than 2% in Massachusetts.9 With this increase, pharmacy spending accounted for 13.5% of total health care expenditures in Massachusetts in 2014.10 Further, four of the five therapeutic areas that the HPC reported11 most contributed to 2014 drug spending growth in Massachusetts – oncology, non-HIV antivirals, anti-arthritics, and neurological disorders – all utilize specialty drugs. This is in line with various national studies during the same period, which show that annual growth in specialty drug spending increased more than 25%.12
The AGO’s 2016 examination focused on commercial spending on specialty pharmaceuticals13 covered through health plans’ pharmacy benefit.14 We focused on specialty drugs for several reasons. First, as noted above, this category has been one of the leading drivers of pharmaceutical spending growth (and health care spending growth more broadly) over the last two years. In absolute terms specialty drug spending now constitutes more than one-third of total pharmacy spending for one national pharmacy benefit manager (PBM),15 while accounting for only one percent of all prescriptions.16 At the same time, specialty drugs are not only a collection of orphan drugs17 for extremely rare, isolated diseases. They are vitally important medicines that encompass spending on a wide variety of chronic, complex conditions, including cancer, rheumatoid arthritis, Hepatitis C, HIV, and multiple sclerosis, among others. We also found it useful to analyze specialty drugs as a distinct category because that is how market participants themselves approach contracting for and managing these drugs – as a separate category distinct from other more traditional branded and generic drugs.
9 COMMONWEALTH OF MASSACHUSETTS HEALTH POLICY COMMISSION, 2015 COST TRENDS REPORT 16 (Jan. 1, 2016) [hereinafter “HPC 2015 COST TRENDS REPORT”].
10 HPC 2015 COST TRENDS REPORT at 29.11 Id. at 34.12 IMS INST. FOR HEALTHCARE INFORMATICS, MEDICINES USE AND SPENDING SHIFTS: A REVIEW OF THE USE OF MEDICINES
IN THE U.S. IN 2014 8 (Apr. 6, 2015) (26.5%), The EXPRESS SCRIPTS LAB, THE 2014 DRUG TREND REPORT 11 (Mar. 2015) (30.9%); CVS HEALTH, INSIGHTS: ADVANCING THE SCIENCE OF PHARMACY CARE 5 (Spring 2015) (32.4%).
13 The term “specialty drug” does not have a single, widely-accepted meaning. Nevertheless, it is commonly used to describe high-cost prescription medications used to treat complex, chronic conditions. Specialty drugs usually include those drugs that require special handling and administration, but many expensive medications that do not require such care are also deemed specialty drugs by prescription drug payers.
14 Prescription drugs may be covered through a health plan’s pharmacy benefit (which covers prescriptions filled in retail or mail pharmacies) or through its medical benefit (which covers drugs administered by a health care provider in a hospital, outpatient setting, or home infusion setting). This examination focuses on prescription drugs filled through health plans’ pharmacy benefit, rather than the half of specialty drug spending reimbursed through the medical benefit. See CATALYST FOR PAYMENT REFORM, SPECIALTY PHARMACY: WHAT PURCHASERS NEED TO KNOW 10 (Nov. 2015), http://www.catalyzepaymentreform.org/images/SpecialtyPharmacy_Paper_FINAL.pdf. We did so for two reasons. First, there are categorical differences between the pharmacy benefit and the medical benefit in terms of the market participants involved in negotiating prices and the approaches taken by health plans in managing spending. This focus on the pharmacy benefit allowed us to conduct a more in-depth examination of one ecosystem for reimbursing pharmaceuticals than we otherwise would have been able to do. Second, the vast majority of claims in the case study we selected for our examination (multiple sclerosis drugs) were paid for through health plans’ pharmacy benefit. This further confirmed our decision to focus on the pharmacy benefit in this examination. As a result of this focus, our findings and recommendations may not be applicable to market dynamics and potential strategies for managing prescription drug spending through health plans’ medical benefit.
15 The EXPRESS SCRIPTS LAB, EXPRESS SCRIPTS 2015 DRUG TREND REPORT 27 (Mar. 2016) (“Specialty medications contributed 37.7% of total drug spend in 2015.”).
16 U.S. Rx Spending Increased 13.1% in 2014, EXPRESS SCRIPTS (Mar. 10, 2015), http://lab.express-scripts.com/lab/insights/industry-updates/us-rx-spending-increased-13-percent-in-2014.
17 “Orphan” drugs are those that treat a disease or condition that “affects such small numbers of individuals residing in the United States that the disease and conditions are considered rare in the United States.” Orphan Drug Act, 21 CFR § 316, Congressional Findings (2016). Generally, a “rare disease or condition” is one that affects fewer than 200,000 people in the United States. 21 CFR § 526(a)(2) (2016).

Examination of Health Care Cost Trends and Cost Drivers Pursuant to G.L. c. 12C, § 17
Through the AGO’s unique authority to issue civil investigative demands (“CIDs”), we sought to examine the actual cost to health plans – after accounting for rebates – of paying for prescription drugs for their members. Some market participants have claimed that rebates mitigate the widely observed upward trend in prices for pharmaceuticals.18 Yet, reliable data concerning rebates, and therefore, the true cost of prescription drugs, has not been previously available because market participants have treated this information as confidential.19 Using the AGO’s CID authority, we examined the claim that rebates substantially mitigate observed spending trends. We also examined the process by which prices for specialty drugs in Massachusetts are determined, including by analyzing the contractual relationships among health plans, PBMs, pharmacies, and manufacturers to assess whether particular approaches used by plans to pay for specialty drugs have been more or less effective at controlling price increases. Finally, we conducted a case study of drug prices paid in Massachusetts for one clinically important therapeutic area – multiple sclerosis (“MS”). We chose to examine MS drugs in detail because there are more than a dozen drugs approved to treat the symptoms and progression of the disease, which may suggest there would be price competition among the treatments, yet prices for these products appear to have steadily increased over many years. We sought to ascertain whether prices net of rebates were in fact rising substantially and, if so, to explain the factors contributing to this growth.
Throughout our examination, we studied spending by the same five health plans – four regional and one national – that together account for approximately 75% of Massachusetts commercial market membership. Although we focused our examination on commercial (private) pharmacy spending, this topic has relevance for pharmaceutical spending by public programs as well. For example, reimbursements for prescription drug benefits under Medicare Part D are determined through the negotiations of private payers who administer the Part D plans, and Medicaid reimbursements are determined through a statutory formula that depends, in part, on the prices paid by private payers.
Part I of the Report presents our findings regarding pharmaceutical spending trends from 2013 to 2015, in total and for specialty drugs alone, including, for the first time for Massachusetts, spending data net of all discounts and manufacturer rebates. Part II details the variety of contractual relationships the health plans use to pay for specialty drugs, identifying the particular approaches used to attempt to control spending. Part III details the results of our in-depth examination of the prices paid for multiple sclerosis drugs in Massachusetts, in which we sought to identify whether the differences identified in Part II impacted prices paid for MS drugs. We conclude in Part IV by offering recommendations for next steps.
18 See, e.g., Robert Zirkelbach, The Five Essential Truths About Prescription Drug Spending, PHRMA (Mar. 10, 2015), http://catalyst.phrma.org/the-five-essential-truths-about-prescription-drug-spending; Robert Langreth, Michael Keller and Christopher Cannon, Decoding Big Pharma’s Secret Drug Pricing Practices, BLOOMBERG (June 29, 2016), http://www.bloomberg.com/graphics/2016-drug-prices/.
19 CHIA 2016 REPORT at 14.
Executive Summary -3-

Examination of Health Care Cost Trends and Cost Drivers Pursuant to G.L. c. 12C, § 17
The key findings of our examination are the following:
1. Applying first-of-its-kind analysis, we found that pharmaceutical spending by the health plans, particularly for specialty drugs, grew at significant rates over each of the past two years, even after applying all discounts and rebates received by the plans.
2. The five health plans studied, each of which has a different market profile, use a variety of approaches to negotiate prices and reimburse for specialty pharmaceuticals; a range of entities (manufacturers, health plans, pharmacy benefit managers, and specialty pharmacies) are responsible for establishing specialty drug price discounts and rebates and for developing and implementing strategies to manage pharmaceutical spending.
3. Despite their different market profiles and the variety of negotiation approaches they employed, the health plans did not pay meaningfully different net prices (prices net of all discounts and rebates) for the multiple sclerosis drugs in our case study. Moreover, the health plans generally experienced similar growth in net prices for these drugs over the period studied.
Based on these findings, below are our principal conclusions and recommendations:
1. To facilitate understanding of actual spending on prescription drugs, require reporting of aggregated, standardized information on drug rebates to CHIA.
2. Continue fostering competitive pharmaceutical markets by promoting the availability of generic and biosimilar drugs. Efforts may include reducing the time and expense for regulatory approval of new generics and biosimilars, especially where a manufacturer is seeking approval of the first generic of a particular molecule.
3. Improve measurement and transparency of the comparative efficacy of different drugs that treat the same disease.
a) Where different drugs are demonstrated to be similarly efficacious, consider broader implementation of strategies that spur competition on behalf of consumers affecting net prices. Such strategies could include favorable formulary placement for lower-cost, equally effective drugs or forms of reference pricing where purchasers would pay the difference for higher cost drugs with equal or lower efficacy.
b) By contrast, where access to all drugs in a therapeutic class is strongly valued by prescribers and patients, we should not expect market forces on their own to moderate prices. One way to enhance patient value in such circumstances could be to rely on increased transparency in comparative efficacy to encourage research, development, and spending on the highest value drugs. We can also explore innovative reimbursement approaches, such as outcomes-based contracts, that provide incentives to develop substantial improvements over existing therapies. We acknowledge that implementing comparative value analysis is a significant shift from current market practices and would require a shared commitment among all stakeholders to implement well.
The Office of the Attorney General looks forward to continued collaboration with the Legislature, sister agencies, health care market participants, and all stakeholders in understanding the drivers of prescription drug spending and promoting the affordability and accessibility of these treatments for all Massachusetts residents.
-4- Executive Summary

Examination of Health Care Cost Trends and Cost Drivers Pursuant to G.L. c. 12C, § 17
Section I -5-
I. Massachusetts Prescription Drug Cost Trend Continues to Show Substantial Increases Year over Year, Even Net of Rebates.
Analyses of pharmaceutical spending under the pharmacy benefit typically examine list prices or invoice prices, and are frequently criticized for failing to incorporate the full range of discounts and rebates available to health plans and other payers.20 For example, in reporting that prescription drug spending in Massachusetts grew 12.5% per commercial enrollee in 2014, compared to 11.6% per capita in the U.S. overall, the HPC noted that these estimates do not reflect rebates and other discounts that occur after the initial acquisition price.21 The HPC also stated that the value of rebates can be significant, recouping 19% of Medicare Part D’s spending on brand-name drugs and 45% of Medicaid’s spending on brand-name drugs.22 The IMS Institute for Healthcare Informatics (“IMS”) has reported that total spending on an invoice price basis in the U.S. grew 12.2% in 2015, and, after adjusting for “estimated rebates and other price concessions by manufacturers,” net spending grew 8.5% over 2014 levels.23 To date, market participants have not been required to report rebate data that would allow for meaningful analysis of the true cost of pharmaceuticals to payers after accounting for rebates and other available cost savings.
Using our cost containment CID authority, we obtained both point-of-sale spending and rebate data (resulting in spending “net of rebates”) for calendar years 2013-2015 from four regional health plans and one national plan. The data showed the plans’ aggregate pharmaceutical spending (both before and after rebates), as well as spending on generic, brand, and specialty drugs.
Rebates will not slow the rate of increase in net-rebate spending compared to the rate of increase in pre-rebate spending unless the rate of increase in rebates is higher than the rate of increase in pre-rebate spending. Our examination found that, in most instances, rebates did not substantially alter the rate of increase in aggregate spending net-rebate. In fact, for at least one health plan, the increase in rebates did not keep up with pre-rebate spending increases, resulting in a higher rate of increase net-rebate than pre-rebate.
20 See supra, note 18.21 HPC 2015 COST TRENDS REPORT at 29.22 Id.23 IMS INSTITUTE FOR HEALTHCARE INFORMATICS, MEDICINES USE AND SPENDING IN THE U.S. 1 (Apr. 2016) (“Invoice price
spending” in the IMS report refers to the “amounts paid to distributors by their pharmacy or hospital customers. . . [I]t does not relate directly to either the out-of-pocket costs paid by a patient or the amount health plans play for the medicines.” “Net price spending” is an “estimate of the amount received by pharmaceutical manufacturers and therefore reflects rebates, off-invoice discounts and other price concessions made by manufacturers to distributors, health plans and intermediaries.”). Because the IMS report analyzed amounts received by pharmaceutical distributors and manufacturers, its reported figures should not be expected to match precisely to figures obtained in analyses of spending by health plans.
Examination of Health Care Cost Trends and Cost Drivers Pursuant to G.L. c. 12C, § 17
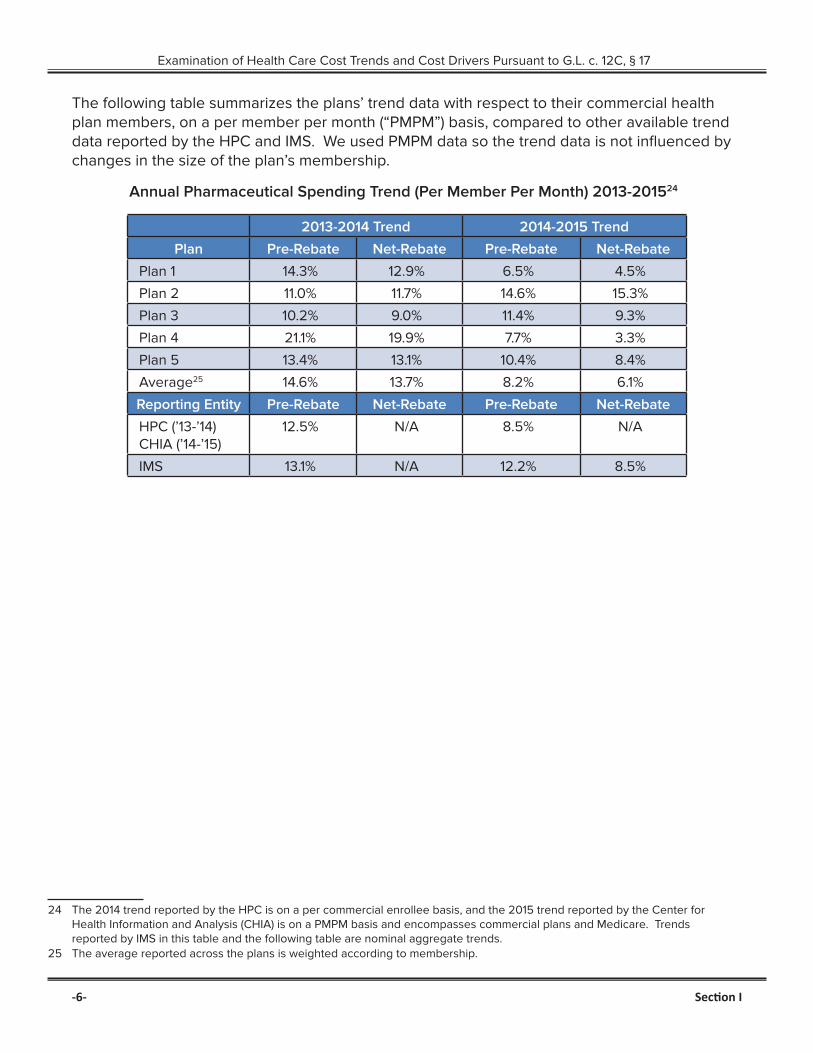
The following table summarizes the plans’ trend data with respect to their commercial health plan members, on a per member per month (“PMPM”) basis, compared to other available trend data reported by the HPC and IMS. We used PMPM data so the trend data is not influenced by changes in the size of the plan’s membership.
Annual Pharmaceutical Spending Trend (Per Member Per Month) 2013-201524
2013-2014 Trend 2014-2015 Trend
Plan Pre-Rebate Net-Rebate Pre-Rebate Net-Rebate
Plan 1 14.3% 12.9% 6.5% 4.5%
Plan 2 11.0% 11.7% 14.6% 15.3%
Plan 3 10.2% 9.0% 11.4% 9.3%
Plan 4 21.1% 19.9% 7.7% 3.3%
Plan 5 13.4% 13.1% 10.4% 8.4%
Average25 14.6% 13.7% 8.2% 6.1%
Reporting Entity Pre-Rebate Net-Rebate Pre-Rebate Net-Rebate
HPC (’13-’14) CHIA (’14-’15)
12.5% N/A 8.5% N/A
IMS 13.1% N/A 12.2% 8.5%
24 The 2014 trend reported by the HPC is on a per commercial enrollee basis, and the 2015 trend reported by the Center for Health Information and Analysis (CHIA) is on a PMPM basis and encompasses commercial plans and Medicare. Trends reported by IMS in this table and the following table are nominal aggregate trends.
25 The average reported across the plans is weighted according to membership.
-6- Section I
Examination of Health Care Cost Trends and Cost Drivers Pursuant to G.L. c. 12C, § 17
Section I -7-
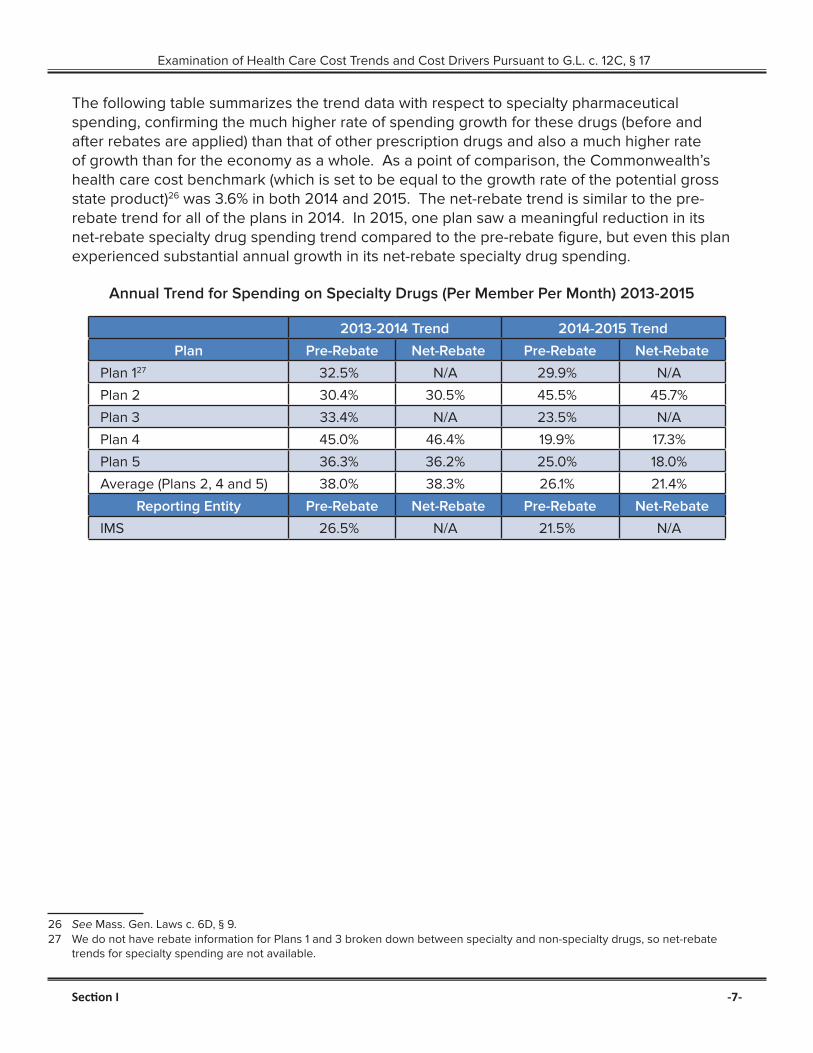
The following table summarizes the trend data with respect to specialty pharmaceutical spending, confirming the much higher rate of spending growth for these drugs (before and after rebates are applied) than that of other prescription drugs and also a much higher rate of growth than for the economy as a whole. As a point of comparison, the Commonwealth’s health care cost benchmark (which is set to be equal to the growth rate of the potential gross state product)26 was 3.6% in both 2014 and 2015. The net-rebate trend is similar to the pre-rebate trend for all of the plans in 2014. In 2015, one plan saw a meaningful reduction in its net-rebate specialty drug spending trend compared to the pre-rebate figure, but even this plan experienced substantial annual growth in its net-rebate specialty drug spending.
Annual Trend for Spending on Specialty Drugs (Per Member Per Month) 2013-2015
2013-2014 Trend 2014-2015 Trend
Plan Pre-Rebate Net-Rebate Pre-Rebate Net-Rebate
Plan 127 32.5% N/A 29.9% N/A
Plan 2 30.4% 30.5% 45.5% 45.7%
Plan 3 33.4% N/A 23.5% N/A
Plan 4 45.0% 46.4% 19.9% 17.3%
Plan 5 36.3% 36.2% 25.0% 18.0%
Average (Plans 2, 4 and 5) 38.0% 38.3% 26.1% 21.4%
Reporting Entity Pre-Rebate Net-Rebate Pre-Rebate Net-Rebate
IMS 26.5% N/A 21.5% N/A
26 See Mass. Gen. Laws c. 6D, § 9.27 We do not have rebate information for Plans 1 and 3 broken down between specialty and non-specialty drugs, so net-rebate
trends for specialty spending are not available.
Examination of Health Care Cost Trends and Cost Drivers Pursuant to G.L. c. 12C, § 17
-8- Section I
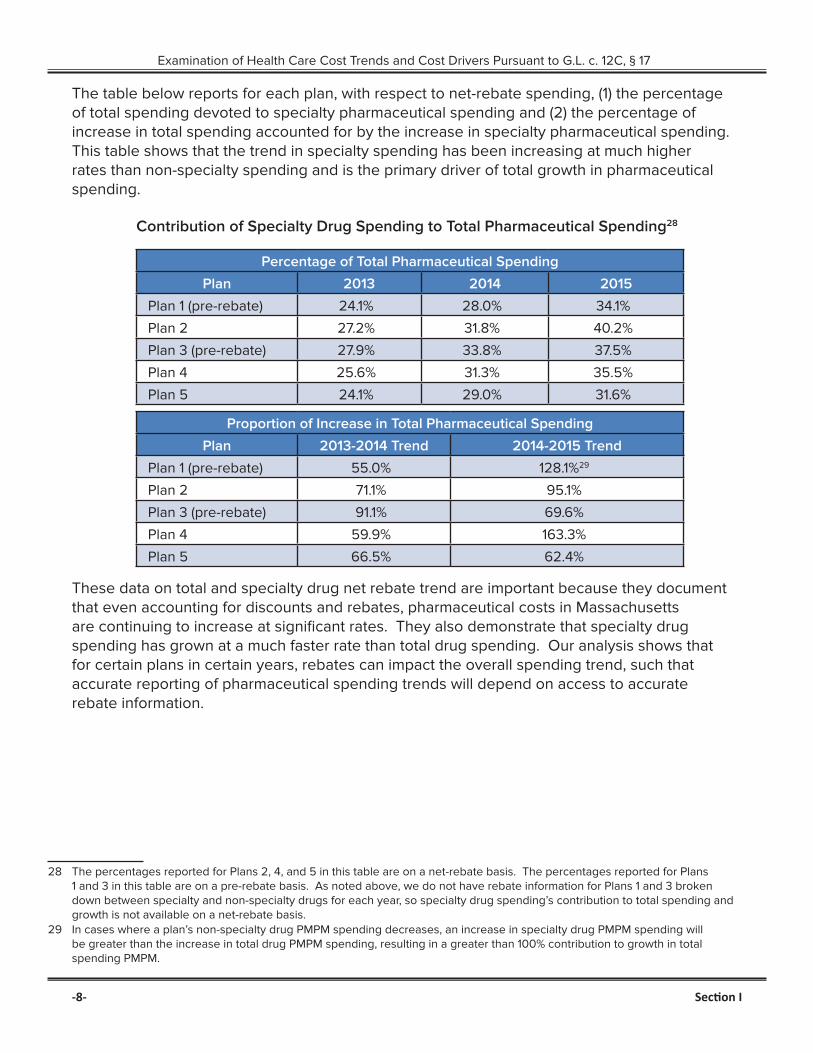
The table below reports for each plan, with respect to net-rebate spending, (1) the percentage of total spending devoted to specialty pharmaceutical spending and (2) the percentage of increase in total spending accounted for by the increase in specialty pharmaceutical spending. This table shows that the trend in specialty spending has been increasing at much higher rates than non-specialty spending and is the primary driver of total growth in pharmaceutical spending.
Contribution of Specialty Drug Spending to Total Pharmaceutical Spending28
Percentage of Total Pharmaceutical Spending
Plan 2013 2014 2015
Plan 1 (pre-rebate) 24.1% 28.0% 34.1%
Plan 2 27.2% 31.8% 40.2%
Plan 3 (pre-rebate) 27.9% 33.8% 37.5%
Plan 4 25.6% 31.3% 35.5%
Plan 5 24.1% 29.0% 31.6%
Proportion of Increase in Total Pharmaceutical Spending
Plan 2013-2014 Trend 2014-2015 Trend
Plan 1 (pre-rebate) 55.0% 128.1%29
Plan 2 71.1% 95.1%
Plan 3 (pre-rebate) 91.1% 69.6%
Plan 4 59.9% 163.3%
Plan 5 66.5% 62.4%
These data on total and specialty drug net rebate trend are important because they document that even accounting for discounts and rebates, pharmaceutical costs in Massachusetts are continuing to increase at significant rates. They also demonstrate that specialty drug spending has grown at a much faster rate than total drug spending. Our analysis shows that for certain plans in certain years, rebates can impact the overall spending trend, such that accurate reporting of pharmaceutical spending trends will depend on access to accurate rebate information.
28 The percentages reported for Plans 2, 4, and 5 in this table are on a net-rebate basis. The percentages reported for Plans 1 and 3 in this table are on a pre-rebate basis. As noted above, we do not have rebate information for Plans 1 and 3 broken down between specialty and non-specialty drugs for each year, so specialty drug spending’s contribution to total spending and growth is not available on a net-rebate basis.
29 In cases where a plan’s non-specialty drug PMPM spending decreases, an increase in specialty drug PMPM spending will be greater than the increase in total drug PMPM spending, resulting in a greater than 100% contribution to growth in total spending PMPM.

Examination of Health Care Cost Trends and Cost Drivers Pursuant to G.L. c. 12C, § 17
Section II -9-
II. The Health Plans Examined Reimburse for Specialty Prescription Drugs in Very Different Ways.
To determine what impact, if any, health plans’ contractual arrangements and relationships might have on the prices that they pay for specialty drugs, we analyzed the approaches the five plans discussed above used to obtain and pay for specialty drugs for their members. We sought to understand the extent to which each health plan conforms to the traditional model (described below) for reimbursement of specialty drugs. We also wanted to understand how health plans structure their relationships with other market participants and whether particular approaches appear more or less effective at controlling spending increases than alternative approaches.
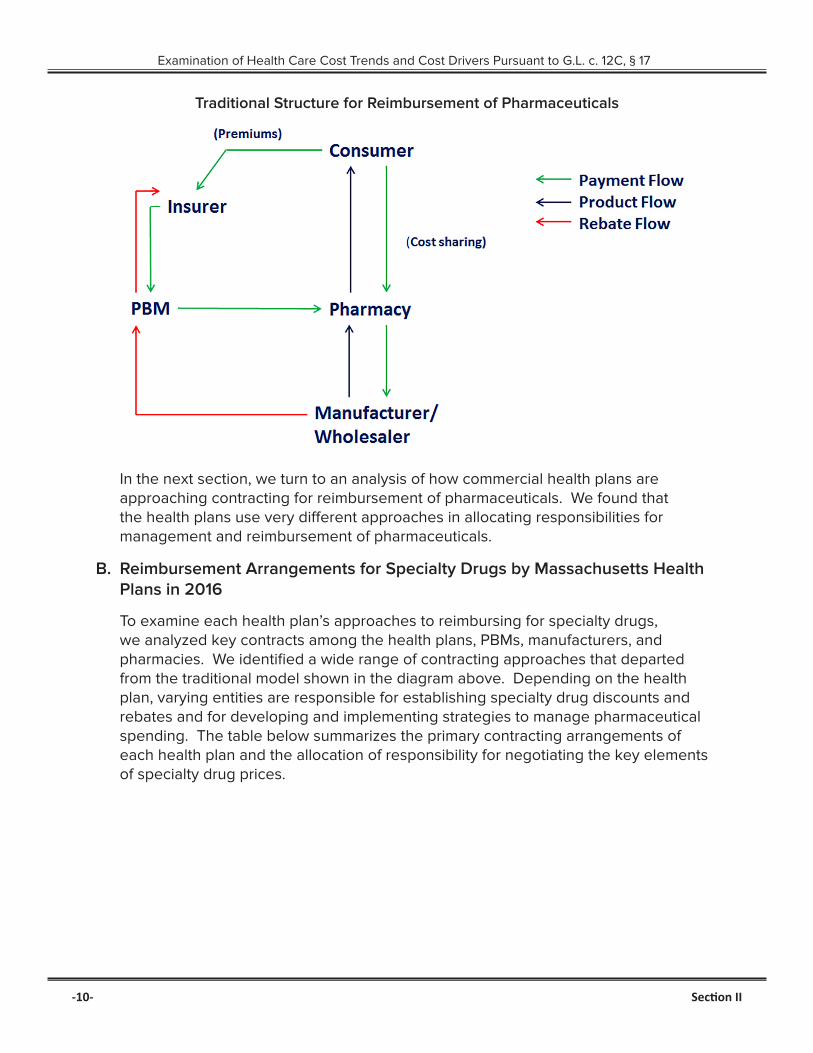
A. Traditional Reimbursement for Pharmaceuticals
For many years, health plans have contracted with PBMs to process and manage reimbursement for prescription drug claims. A health plan’s contract with a PBM generally established the prices that the health plan would pay for drugs, as well as the structure and amount of rebates that the health plan would receive. The PBM would generally provide various administrative services related to the plan’s pharmacy benefit, including claims processing, claims administration, establishing pharmacy networks, drug utilization review, and formulary management.30 The diagram following on the next page shows this traditional arrangement among a consumer, health plan, PBM, pharmacy, and manufacturer or wholesaler, which has been well understood for the last decade.31
30 CONG. BUDGET OFF., PRESCRIPTION DRUG PRICING IN THE PRIVATE SECTOR 10-13. (Jan. 2007) [hereinafter “CBO REPORT”].
31 See CBO REPORT at 11; HPC 2015 COST TRENDS REPORT at 30.
The price that a commercial health plan pays for a branded prescription drug is generally a function of the following three elements: (1) the list price (set by the manufacturer), (2) a discount from that list price, negotiated between the PBM and pharmacy, and (3) any rebates negotiated between the PBM and manufacturer. For example, if a drug has a list price of $100 per prescription, a PBM may negotiate a 12% discount on all purchases from the pharmacy. At the point of sale, therefore, the PBM would pay (on behalf of the health plan) $88. If the PBM has separately negotiated with the manufacturer to receive a rebate of 10% from list price for each prescription of the drug it paid for, the PBM would then receive $10 from the manufacturer, meaning the PBM (and the plan if the PBM provides the plan with the full rebate) paid a net price of $78 for each prescription of this drug.
Examination of Health Care Cost Trends and Cost Drivers Pursuant to G.L. c. 12C, § 17
-10- Section II
Traditional Structure for Reimbursement of Pharmaceuticals
In the next section, we turn to an analysis of how commercial health plans are approaching contracting for reimbursement of pharmaceuticals. We found that the health plans use very different approaches in allocating responsibilities for management and reimbursement of pharmaceuticals.
B. Reimbursement Arrangements for Specialty Drugs by Massachusetts Health Plans in 2016
To examine each health plan’s approaches to reimbursing for specialty drugs, we analyzed key contracts among the health plans, PBMs, manufacturers, and pharmacies. We identified a wide range of contracting approaches that departed from the traditional model shown in the diagram above. Depending on the health plan, varying entities are responsible for establishing specialty drug discounts and rebates and for developing and implementing strategies to manage pharmaceutical spending. The table below summarizes the primary contracting arrangements of each health plan and the allocation of responsibility for negotiating the key elements of specialty drug prices.

Examination of Health Care Cost Trends and Cost Drivers Pursuant to G.L. c. 12C, § 17
Section II -11-
For Specialty Pharmaceuticals, Health Plan Contracts Directly with:
Plan PBM for discounts
Manufacturers for discounts
Pharmacy for discounts
PBM for rebates
Manufacturer for rebates
PBM for up-front price, with rebate
guarantee
Plan A ✓ ✓
Plan B ✓ ✓
Plan C ✓ ✓
Plan D ✓ ✓
Plan E ✓ ✓
All five health plans contract with a PBM to administer the plans’ pharmacy benefits, including processing payment of pharmaceutical claims. However, with regard to determining the two key components of specialty drug pharmaceutical pricing – up-front discounts and rebates – the five health plans have very different relationships with their PBMs.
Plan A
Only one of the health plans structures its reimbursement for specialty drugs in a way that follows the traditional model. This plan has a contract with a national PBM that sets the price the plan pays for each drug, determined as a percentage discount from list price. The PBM obtains rebates based on the utilization of certain specialty drugs through negotiations with a third-party rebate aggregator that negotiates with drug manufacturers. The PBM passes through to Plan A all of the rebates that it obtains as a result of claims paid by the plan. The PBM also has a specialty pharmacy that Plan A’s members are generally required to use for filling specialty prescriptions.32
Plan B
Plan B has contractual arrangements for each therapeutic class with one of several specialty pharmacies to be the exclusive provider of that class of drugs to its members. The contract establishes the discount from list price for each drug, and Plan B generally requires its members to use the specialty pharmacy with which it has contracted for the drug at issue. Plan B takes one of three approaches to obtain rebates on specialty drugs depending on the circumstances. First, rarely, this plan may negotiate directly with a manufacturer to obtain a rebate. Second, the plan contracts with a third-party rebate aggregator and may opt-in to receive rebates for any particular drug for which the rebate aggregator
32 The health plans in our examination have contractual relationships (either directly or through their PBMs) with preferred or exclusive specialty pharmacies where they have negotiated specific discounts for specialty products. Although we did not observe significant pricing differences between the preferred specialty pharmacies and other pharmacies, the plans emphasized that they enter into these relationships for a number of reasons in addition to price, including services such as assisting patients with drug regimen adherence; responding to patient questions; peer-to-peer services with providers regarding dosing and formulary structure; better coordination and reporting with plans on care management; and proper handling of complex drug products.

Examination of Health Care Cost Trends and Cost Drivers Pursuant to G.L. c. 12C, § 17
-12- Section II
has negotiated a rebate. Third, as was the case with the multiple sclerosis drugs that are the subject of our case study in Part III, the plan obtains rebates from its PBM that the PBM has negotiated with the manufacturer and passes through in full to the plan.
Plan C
Plan C negotiates reimbursement rates for specialty drugs jointly with its PBM calculated as a discount from list price and established through a competitive bid process with a network of specialty pharmacies. This plan receives rebates from its PBM in the form of a point-of-sale discount from list price in addition to other up-front discounts negotiated with its PBM, with a guarantee that the aggregate value of the additional point of sale discounts will include nearly all of the rebates that the PBM receives.
Plan D
Plan D carves out specialty drugs from its PBM contract, which stipulates that the PBM will process claims for specialty drugs at the rates the plan has agreed to with its specialty pharmacy. Under separate agreements with its specialty pharmacy, Plan D has agreed that the pharmacy will be its preferred pharmacy for certain specialty drugs and the pharmacy agrees to offer the covered drugs at discounted prices. Separately, this plan contracts directly with pharmaceutical manufacturers for rebates on specialty drugs based on the plan’s utilization of each drug.
Plan E
Plan E contracts directly with its own in-house specialty pharmacy and other specialty pharmacies to determine reimbursement rates for specialty drugs. For the substantial majority of its specialty pharmacy business, the plan, through its specialty pharmacy, negotiates directly with manufacturers to obtain discounts off of list price on specialty drugs that it purchases. Plan E also negotiates rebates directly with drug manufacturers.
Finally, two of the five plans have entered into outcomes-based rebate contracts, pursuant to which the amount of the rebate varies depending on the clinical outcomes of patients taking the drug.
Our examination shows that the largest Massachusetts commercial health plans use a variety of strategies to negotiate the rebates, discounts, and prices that underlie prescription drug spending. The examination also shows the types of organizations that are (and are not) involved in negotiating prices for these drugs. For example, while PBMs are involved in negotiating discounts for two plans and rebates for two plans, PBMs seemingly play no role in negotiating prices for specialty drugs for two other plans. It is also noteworthy that traditional retail (and mail order) pharmacies do not play a substantial role in specialty drug reimbursements, which are handled largely by separate specialty pharmacies.

Examination of Health Care Cost Trends and Cost Drivers Pursuant to G.L. c. 12C, § 17
Section II -13-
These findings have implications for efforts related to prescription drug cost transparency and cost containment. For example, in considering further transparency on drug rebates, reporting requirements would best be placed on those organizations that have the most complete and accurate data. This, depending on the circumstances, may be the PBM, health plan, or specialty pharmacies. Similarly, pursuit of a given cost containment strategy will likely also require close attention to and effective coordination among the various roles of each of these market participants.

Examination of Health Care Cost Trends and Cost Drivers Pursuant to G.L. c. 12C, § 17
III. Case Study: Among Prescription Drugs Used to Treat Multiple Sclerosis, Prices Have Risen Significantly, With Little Variation in Price Among Plans.
To delve more deeply into the outcomes associated with different contracting approaches, we examined net spending by Massachusetts health plans in a category of specialty drugs that treat a single condition – disease modifying therapies for multiple sclerosis. We chose this therapeutic class because it contains multiple drugs that are approved to treat relapsing-remitting MS and, yet, has seen steady increases in list prices even as new drugs entered the market.33 Given the presence of multiple drugs with the same FDA-approved indication, we wanted to investigate, first, whether the net prices increased similarly to the list prices, and, if so, why prices for some or all of these drugs had not moderated given the multiple drugs in the class. Our analysis shows that the net prices paid for the drugs in this therapeutic class have been steadily and substantially increasing since 2011 and that, despite a variety of contracting approaches for negotiating prices, Massachusetts commercial plans pay very similar prices to obtain these drugs for their members. We also observed that there have not been comprehensive head-to-head clinical studies on the comparative efficacy of the MS drugs, which makes it difficult to predict which drugs will work best for particular patients and impacts efforts to assess the comparative value of the drugs.
A. Multiple Sclerosis and FDA Approved Disease Modifying Therapies
Multiple Sclerosis is an incurable disease involving an “immune-mediated process in which an abnormal response of the body’s immune system is directed against the central nervous system” (the brain, spinal cord, and optic nerves).34 As a result of this abnormal response, “nerve impulses traveling to and from the brain and spinal cord are distorted or interrupted, producing a wide variety of symptoms,”35 including fatigue, numbness or tingling, weakness, dizziness, and pain, among many others.36
MS patients receive medications to modify the disease course, treat relapses, and manage symptoms.37 At the start of our examination, there were fourteen disease modifying medications approved by the FDA to treat MS.38 All of these medications are categorized as specialty drugs by plans and PBMs due to their high cost and, in some cases, their complexity and route of administration. As shown in the following table, three of these drugs are administered orally, eight are injectable, and three
33 See Daniel M. Hartung, et al., The Cost of Multiple Sclerosis Drugs in the US and the Pharmaceutical Industry: Too Big To Fail, AM. ACAD. OF NEUROLOGY (May 26, 2015).
34 Definition of MS, NAT’L MULTIPLE SCLEROSIS SOC’Y, http://www.nationalmssociety.org/What-is-MS/Definition-of-MS.35 Id.36 MS Symptoms, NAT’L MULTIPLE SCLEROSIS SOC’Y, http://www.nationalmssociety.org/Symptoms-Diagnosis/MS-Symptoms.37 Medications, NAT’L MULTIPLE SCLEROSIS SOC’Y, http://www.nationalmssociety.org/Treating-MS/Medications.38 On May 27, 2016, the FDA approved Zinbryta, an injectable disease-modifying therapy.
-14- Section III

Examination of Health Care Cost Trends and Cost Drivers Pursuant to G.L. c. 12C, § 17
Section III -15-
require in-office (or at home) infusions and are often covered under plans’ medical benefit rather than the prescription drug benefit. Because our analysis is focused on the prescription drug benefit, we did not include the last category of infused drugs in our analyses; we also excluded Extavia because its utilization was substantially lower than the other medications. Another distinction is that the injectable and oral drugs are considered first-line treatments39 while the infused drugs (for a variety of reasons including serious side effects) are generally recommended for use only after other treatment options have failed or are otherwise not an option for a patient.40 All of these drugs have side effects and are prescribed to slow the progression of the disease and minimize symptoms during relapses or flare-ups; there is no cure for MS.
MS Disease Modifying Drugs as of May 1, 2016
Administration Drug Active Ingredient Approval
Injection
Avonex* Interferon beta-1a May 1996
Betaseron* Interferon beta-1b July 1993
Copaxone 20mg* Glatiramer acetate Dec. 1996
Copaxone 40mg* Glatiramer acetate Jan. 2014
Glatopa (Copaxone 20mg generic)* Glatiramer acetate Apr. 2015
Extavia Interferon beta-1b Aug. 2009
Plegridy* Peginterferon beta-1a Aug. 2014
Rebif* Interferon beta-1a Mar. 2002
Oral
Aubagio* Teriflunomide Sept. 2012
Gilenya* Fingolimod Sept. 2010
Tecfidera* Dimethyl furnarate Mar. 2013
Infusion
Lemtrada Alemtuzumab May 2001
Novantrone Mitoxantrone Oct. 2000
Tysabri Natalizumab Nov. 2004
*Drugs included in our analyses
Doctors determine which disease modifying therapy to prescribe to a patient based on a number of variables, including hoped-for efficacy for that patient, stage of disease, safety considerations, likelihood of adherence, and tolerance of side effects.41 There have not been comprehensive head-to-head clinical studies on the comparative efficacy of the MS drugs, so it can be difficult to predict which drugs
39 Disease Modification in Multiple Sclerosis, NAT’L MULTIPLE SCLEROSIS SOC’Y 1 (Jan. 2, 2013), http://www.nationalmssociety.org/NationalMSSociety/media/MSNationalFiles/Brochures/Paper-Cavallo-Treatment-Update.pdf.
40 Id.41 Best Practices For Therapeutic Selection in Relapsing Remitting Multiple Sclerosis, THERAPEUTIC DECISION MAKING IN
MULTIPLE SCLEROSIS, 16 INT’L J. OF MS CARE (SUPPLEMENT 6) 6-11 (2014), http://ijmsc.org/doi/pdf/10.7224/1537-2073-16.S6.1.

Examination of Health Care Cost Trends and Cost Drivers Pursuant to G.L. c. 12C, § 17
will work best for particular patients.42 Providers who treat MS patients and patients themselves strongly value broad access to the disease modifying therapies and are hesitant to switch away, for financial or other non-clinical reasons, from a drug that is working.43 Plans, as evidenced by those in our examination, tend to cover all or substantially all of the drugs that have been approved for the treatment of relapsing and remitting MS.
B. MS Drugs Show Consistent Price Increases and Little Price Variation Across Plans
We found that despite a variety of market profiles and negotiating approaches, Massachusetts commercial plans pay very similar prices for the MS drugs they obtain for their members, and all have experienced steady and substantial increases in these net prices since 2011. For our study, we analyzed claims and rebate data for ten drugs used for treating multiple sclerosis.44
Below, we chart the average net price that each plan paid45 for each of the ten MS drugs for each quarter from January 1, 2011 through December 31, 2015. The trends across the plans and the drugs are similar – steady and substantial increases in the net price paid and limited variation among the prices paid by each plan. Indeed, the net price for a monthly supply of each drug is similar at any given time. For example, in 2011, each of the MS drugs included in our examination and on the market at that time had net prices of approximately $3,000 per month, while by the end of 2015, the net price paid by each of the health plans for these drugs was approximately $5,000-$6,000 per month. This is so despite differences in the plans’ formulary design, contracting structure, size, and market share in Massachusetts and nationally.46
42 Disease Modifying Therapies for MS, NAT’L MULTIPLE SCLEROSIS SOC’Y (July 2016), http://www.nationalmssociety.org/NationalMSSociety/media/MSNationalFiles/Brochures/Brochure-The-MS-Disease-Modifying-Medications.pdf; Best Practices For Therapeutic Selection in Relapsing Remitting Multiple Sclerosis, supra, note 41, at 4, 7 (noting “a general lack of head to head comparative efficacy data” and “a paucity of evidence or biomarker data indicating that a particular agent will provide the greatest chance of efficacy for patients with specific biological or disease characteristics”).
43 MS COALITION, USE OF DISEASE-MODIFYING THERAPIES IN MULTIPLE SCLEROSIS: PRINCIPLES AND CURRENT EVIDENCE (July 2016), http://www.nationalmssociety.org/getmedia/5ca284d3-fc7c-4ba5-b005-ab537d495c3c/DMT_Consensus_MS_Coalition_color (“None of these medications are curative and the efficacy of any given medication varies considerably from one individual to another and for any given individual at different points in time. In addition, people with MS differ in their tolerance for different routes of administration and side effects, and clinicians and patients vary in their tolerance for risk, with risk tolerance likely undergoing shifts as the disease progresses…[A]ccess to the full range of options is essential in order to optimize the ability of people with MS and their clinicians to make optimal treatment decisions.”).
44 We obtained data from four regional and one national health plan, three PBMs, and three pharmacies from January 1, 2011 through December 31, 2015. The claims data generally showed the (a) dates the drug was dispensed and paid for; (b) name, National Drug Code (“NDC”), and quantity of the drug dispensed; (c) ingredient cost and any dispensing fees paid for the drug; (d) pharmacy that dispensed the drug; (e) entity that paid and/or was paid for the drug; (f) cost-sharing or other expenses paid by the patient; and (g) total allowed amount of the claim. Regarding rebate data, we obtained the (a) date the drug was dispensed and the date the rebate was paid; (b) name, NDC, and quantity of the drug dispensed; (c) rebate received and/or paid for the drug; and (d) entity that paid the rebate.
45 The price paid by each plan is the full allowed amount for each claim, which includes both the portion paid by the plan, as well as any cost sharing (i.e. copay, deductible, or coinsurance) paid by the patient.
46 The charts are ordered by market share for each drug (highest to lowest) from 2011-2015 among the five plans included in our examination.
-16- Section III

Examination of Health Care Cost Trends and Cost Drivers Pursuant to G.L. c. 12C, § 17
Net Price of Copaxone 20 mg and Glatopa 20 mg (Q3-Q4 2015 only)47
47 Notes on data used in the graphs and tables in this section:
(1) Data for drugs that were approved after the first quarter of 2011 (i.e. Aubagio, Glatopa, Copaxone 40 mg, Plegridy, and Tecfidera) appear on the graphs as of the date that these drugs entered the market;
(2) For Plan II, the rebate data provided was not complete from the first quarter of 2014 through the first quarter of 2015, hence we estimated rebates during this period by taking the average of the ratio of Plan II’s rebate per cost in the fourth quarter of 2013 and in the second quarter of 2015;
(3) For Plans III and IV, the rebate data provided did not go beyond the third quarter of 2015, so the graphs and tables do not include data for the fourth quarter of 2015 for these plans;
(4) For Plan V, the rebate data consisted of a single aggregate rebate amount for each drug in each calendar year. We allocated this rebate among the four quarters of each year based on the number of claims in each quarter; and
(5) For Plans III and V, the rebate data for Copaxone did not distinguish between rebates paid for Copaxone 20 mg and Copaxone 40 mg for those quarters after Copaxone 40 mg came onto the market. We allocated the Copaxone rebates pro rata for these two products based on the number of claims for each product in these quarters.
Section III -17-

Examination of Health Care Cost Trends and Cost Drivers Pursuant to G.L. c. 12C, § 17
Net Price of Avonex
Net Price of Tecfidera
-18- -18- Section III

Examination of Health Care Cost Trends and Cost Drivers Pursuant to G.L. c. 12C, § 17
Net Price of Rebif
Net Price of Gilenya
Section III -19-

Examination of Health Care Cost Trends and Cost Drivers Pursuant to G.L. c. 12C, § 17
Net Price of Copaxone 40 mg
Net Price of Betaseron
-20- Section III

Examination of Health Care Cost Trends and Cost Drivers Pursuant to G.L. c. 12C, § 17
Net Price of Aubagio48
Net Price of Plegridy
48 As is evident in this chart, Plan V received an increased rebate for Aubagio in 2015. This drug had a comparatively small market share over the period 2011-2015 (see chart on p. 26 showing a market share of between 1.8% and 3.1% across the plans and drugs studied). Although Plan V was the only plan in our study to receive this increased rebate, a comparable rebate was available to other plans if certain formulary conditions were met.
Section III -21-

Examination of Health Care Cost Trends and Cost Drivers Pursuant to G.L. c. 12C, § 17
To quantify the steady increase in these net prices since 2011, we calculated the annual growth rate for each plan’s prices for these ten drugs from January 1, 2011 through December 31, 2015. We then blended the ten growth rates for each plan into a single average rate of growth based on the mix of drugs dispensed to that plan’s members over the period, shown below.
Plan Average Annual Growth Rate in Net Prices for 10 MS Drugs49
Plan 1 12.1%
Plan 2 11.6%
Plan 3 15.0%
Plan 4 11.7%
Plan 5 10.2%
As another way of showing growth in net prices over this period, in the chart below, we set the average prices paid by the plans in the first quarter of 2011 to the same base price of 1.00 and then plotted the rate of increase through the end of 2015. As seen in the growth rates in the charts above and chart below, four of the five plans had almost identical rates of increase while one plan had a higher trend for the subject drugs.
Relative Price Increase Net of Rebates for MS Drugs: 2011-2015
49 The average annual price growth rate was calculated as follows: (1) the year-over-year percentage price increase was calculated for each drug and averaged across all years; (2) a weighted average of those prices was taken across all drugs based on each drug’s share of total cost.
-22- Section III

Examination of Health Care Cost Trends and Cost Drivers Pursuant to G.L. c. 12C, § 17
Net prices paid by the plans also vary minimally when compared against the mean net prices paid among this cohort of plans, as shown in the following table. The coefficient of variation (“CV”) is the ratio of the standard deviation to the mean. It shows the extent of variability in relation to the mean of the population being studied (here, the five plans). Low percentages indicate that there is minimal variation from the mean across all payers over the time span studied. For example, if a particular drug had a mean price of $100 in a fiscal quarter and a CV of 2.5%, then two-thirds of all of the data points (assuming that the data follow a normal distribution) in that quarter would be within a range of $97.50 to $102.50. We calculated the average weighted price for each drug from 2011 through 2015 across the five plans and provide here the CV over this period:
Coefficient of Variation Across Plans’ MS Prices: 2011-201550
Drug Cross-Plan, Net-Rebate CV
Aubagio 4.9%
Avonex 4.5%
Betaseron 5.2%
Copaxone 20 mg 1.9%
Copaxone 40 mg 4.8%
Gilenya 1.9%
Glatopa 3.7%
Plegridy 2.8%
Rebif 4.3%
Tecfidera 3.3%
The data in this table indicate that two-thirds of the prices paid by the plans for each of the drugs in our examination were within only 1.9%-5.2% of the mean price paid in Massachusetts across all of the plans. Put another way, all of the plans in our study paid close to the same price, net of rebate, that their competitors paid.
50 The CV was calculated as follows: (1) a unit-weighted average price was calculated for each drug for each plan across the entire time period; and (2) the CV (i.e. the standard deviation divided by the mean of the unit-weighted average prices) was calculated for each drug.
Section III -23-

Examination of Health Care Cost Trends and Cost Drivers Pursuant to G.L. c. 12C, § 17
The chart below turns to examining relative spending across the plans for the ten drugs studied. As shown, across the plans, there is strong correspondence in the proportion of total MS spending represented by each drug. This similarity is evidence that, in practice, the plans do not meaningfully restrict access to these ten drugs. This is likely due to the clinical view shared by providers and plans that the various drugs are tolerable and effective for different patients, it is difficult to predict which of the drugs will be most beneficial for which patient, that individual patients need to switch among medications as the disease progresses, and patients’ response to a treatment can change over time.
Proportion of Plan Spending on Subject MS Drugs from 2011-2015 Broken Out By Each Subject Drug
-24- Section III

Examination of Health Care Cost Trends and Cost Drivers Pursuant to G.L. c. 12C, § 17
C. The Impact of a Single Generic Alternative on MS Drug Spending is Unclear.
Policy recommendations for moderating pharmaceutical costs often include improving price competition by encouraging the entry of more generic and biosimilar drugs.51 On average, the cost of a generic drug is 80 to 85 percent lower than the brand name product and the use of FDA-approved generics saves the U.S. hundreds of billion dollars annually.52 The entry of generic drugs can also have the effect of moderating price increases in branded drugs over time.53 In specialty drug markets, however, there have been only a few generics and biosimilars so it is not yet clear whether entry of generics and biosimilars in this space will impact specialty drug prices in the same way generic drugs have impacted prices for traditional branded drugs.54
In the MS therapeutic class, the first generic alternative, Glatopa, became available in April 2015. Glatopa is a generic version of the 20 mg daily Copaxone injection. In 2014, a year before Glatopa’s release, a 40 mg Copaxone injection, which does not have a generic equivalent, was released. Copaxone 40 mg offers the benefit that patients inject it three times per week rather than daily as required for Copaxone 20 mg.55 In analyzing the impact of Glatopa’s entry, we examined the utilization of Copaxone 20 mg, Copaxone 40 mg, and Glatopa (20 mg) before and after the entry of Glatopa. We also analyzed the net price of Copaxone 20 mg and Glatopa (20 mg) before and after the entry of Glatopa.
Regarding utilization, the chart below shows the total monthly prescriptions of Copaxone (20 mg and 40 mg) and Glatopa (20 mg) from January 1, 2011 through December 31, 2015 across the health plans included in our examination. By the time that Glatopa (20 mg) entered the market, almost 70% of patients had moved from Copaxone 20 mg to Copaxone 40 mg, substantially reducing the market for Copaxone 20 mg. In other words, the market for this drug – the only MS market segment in which head-to-head competition by a generic has emerged –substantially shrank shortly before the generic’s introduction. Given the now limited market for the 20 mg version of the drug, the impact of the generic’s entry on overall MS spending remains unclear. Aggregate data suggests that patients who had moved to Copaxone 40 mg did not return to the 20 mg injection when the generic became available, at least during the time period for which data was available.
51 See, e.g., Richard G. Frank, Medicare Drug Prices and the Deficit, 365 NEW ENG. J. MED. 1657, 1658 (2011) (“Competition in drug markets works best when there are multiple competing products aimed at treating the same conditions – including both so-called therapeutic substitutes and generic substitutes.”); see also Geoffrey F. Joyce & Neeraj Sood, Clinton and Trump Are Both Wrong About Medicare’s Ability to Negotiate Drug Prices, STAT (Aug. 12, 2016), https://www.statnews.com/2016/08/12/hillary-clinton-donald-trump-medicare/ (“The FDA could enhance competition in specialty medicines by approving more biosimilar drugs.”).
52 Facts About Generic Drugs, U.S. FOOD & DRUG ADMIN. (June 28, 2016), http://www.fda.gov/drugs/resourcesforyou/consumers/buyingusingmedicinesafely/understandinggenericdrugs/ucm167991.htm.
53 See Richard G. Frank, The Ongoing Regulation of Generic Drugs, 357 N. ENGL. J. MED. 1993 (2007) (“[generic drugs’] expanded role has been linked to an attenuation of overall price increases for prescription drugs.”).
54 See IMS INST. FOR HEALTHCARE INFORMATICS, MEDICINES USE AND SPENDING IN THE U.S. 24 (Apr. 2016), https://morningconsult.com/wp-content/uploads/2016/04/IMS-Institute-US-Drug-Spending-2015.pdf (“Lack of FDA guidance on interchangeability [for biosimilars] creates a different uptake environment than for the small molecule generic market, whereby biosimilars will need to compete with brands to be first choice by providers.”).
55 3-Times-A-Week Copaxone 40 MG, COPAXONE, https://www.copaxone.com/about-copaxone/copaxone-40-mg, (last visited Sept. 20, 2016).
Section III -25-

Examination of Health Care Cost Trends and Cost Drivers Pursuant to G.L. c. 12C, § 17
Copaxone and Glatopa Total Monthly Prescriptions – All Plans
The graph below shows that the introduction of Copaxone 40 mg affected utilization by members of the examined health plans similarly. One health plan agreed to use Copaxone 20 mg exclusive of Glatopa (20 mg), and one health plan agreed to use Glatopa (20 mg) exclusive of Copaxone 20 mg, but all health plans experienced a marked preference for Copaxone 40 mg over either of the daily injection alternatives during the two quarters for which data was available.
Market Share: Glatopa (20 mg), Copaxone 20 mg & Copaxone 40 mg 2015Q3 - 2015Q4
-26- Section III

Examination of Health Care Cost Trends and Cost Drivers Pursuant to G.L. c. 12C, § 17
The following chart shows the net price each health plan paid for Copaxone 20 mg, depicted in blue, and Glatopa (20 mg), depicted in red. Because the time period available for study is only two quarters (and a third quarter for two plans) it is not yet clear what impact the entry of a single generic will have on the prices paid for this drug (although other studies suggest that the entry of a single generic is not likely to have a significant impact on price).56 If, despite the relatively small market remaining for Copaxone 20 mg and Glatopa, other companies become interested in introducing their own generic alternatives for this drug, this market could experience more price competition57 Continuing to follow developments in prices and utilization in connection with the introduction of more generic equivalents will provide further insight into the impact of generics in the specialty drug market.
Net Price of Copaxone 20 mg and Glatopa 20 mg
56 Generic Competition and Drug Prices, U.S. FOOD & DRUG ADMIN. (May 13, 2015), http://www.fda.gov/AboutFDA/CentersOffices/OfficeofMedicalProductsandTobacco/CDER/ucm129385.htm (“On average, the first generic competitor prices its product only slightly lower than the brand-name manufacturer.”).
57 Moreover, there is the possibility that generic versions of Copaxone 40 mg may come to market in the near future and, if so, will likely provide further insight into the impact of generic entry into this market. See Tracy Staton, One, Two, Three, Gone: Teva Loses Third Patent on New Copaxone Formula, FIERCEPHARMA (Sept. 1, 2016), http://www.fiercepharma.com/pharma/one-two-three-gone-teva-loses-third-patent-new-copaxone-formula.
Section III -27-

Examination of Health Care Cost Trends and Cost Drivers Pursuant to G.L. c. 12C, § 17
IV. Conclusions and RecommendationsOur examination showed that health plans with very different market profiles, using various approaches to negotiating discounts and rebates, have not constrained increases in net prices among MS drugs. We believe this finding illustrates that a key impediment to containing the growth of prescription drug spending in certain areas is a lack of price competition. Currently, there are at least two different scenarios in which competition affecting prices occurs in drug markets.
First, entry of generic or biosimilar drugs will often create direct competition with branded versions on list (or invoice) price. Under our patent system, the brand manufacturer has exclusive rights to sell its product without generic competition for twenty years after filing, reflecting Congress’s policy to promote innovation. Even after one or more treatments in a therapeutic class are no longer patent-protected, however, introduction of a single generic drug may not substantially impact overall costs. The impact of a single generic may be even less where, as we found in our case study, utilization of the branded drug had fallen substantially prior to the generic’s entry in favor of a new branded drug for which there was no generic.
Second, different manufacturers may each sell distinct branded drugs that treat the same disease, but that have sufficiently similar efficacy such that payers can exclude coverage of one or more of these drugs without adverse clinical outcomes. Although these drugs are composed of different active ingredients, they may compete with each other through the use of rebates for formulary placement in a particular therapeutic class, which may result in lower net prices for some payers. Overall, both of these scenarios are at work in the pharmaceutical sector today, with generic entry (after patent expiration) and similarly efficacious therapeutic alternatives effectively fostering competition among many drugs.
Our examination explored a third scenario, one in which there are multiple drugs to treat a disease, but patients and providers strongly value access to all or substantially all of the drugs in the therapeutic class. Here, manufacturers may still compete for market share, but there may be little to no competition on rebates or list price. Indeed, our findings suggest we cannot count on competition among branded drugs to discipline prices in every instance where there are multiple available drugs in a therapeutic class. While there may be some diseases where different brand drugs effectively compete with each other on rebates, there are other diseases where there is sufficient demand for access to all (or nearly all) drugs such that payers cannot meaningfully negotiate on formulary placement or the rebates that lower net prices.
This third scenario is evident in at least one therapeutic class today (MS drugs) and is likely relevant to other classes we did not study. For example, there are a number of therapeutic areas, like inflammatory conditions and oncology, which (like MS) include incurable diseases where there is not clear evidence that one drug is superior to another in the management of the disease, its symptoms, or side effects and different treatments appear effective for different patients and to different degrees. In these circumstances, it is not unexpected that patients and providers view broad access to all drugs in a class as important. Further, biopharmaceutical research continues to advance toward personalized or “precision” medicine
-28- IV. Conclusion and Recommendations

Examination of Health Care Cost Trends and Cost Drivers Pursuant to G.L. c. 12C, § 17
where each individual’s treatment is differentiated.58 Given these types of advances, we suggest existing modes of fostering consumer value in pharmaceutical spending may prove poorly matched to an innovative future in which drugs are highly personalized and less interchangeable. Those existing modes, such as use of formularies, tiered cost-sharing, prior authorization, and step therapies, all to a greater or lesser extent depend on some interchangeability among treatments to discipline prices and encourage utilization of those treatments that are most cost-effective. Since there are areas of drug spending where we cannot count on price competition to develop, we suggest it is important to continue innovating in how we foster consumer value in those areas of spending, such as considering more widespread evaluation and dissemination of information on the comparative efficacy of different drugs in the same class.
Based on our findings and observations, and focusing especially on actions that Massachusetts stakeholders are positioned to undertake, we make the following recommendations.
1. To facilitate understanding of actual spending on prescription drugs, require reporting of aggregated, standardized information on drug rebates to CHIA.
2. Continue fostering competitive pharmaceutical markets by promoting the availability of generic and biosimilar drugs. Efforts may include reducing the time and expense for regulatory approval of new generics and biosimilars, especially where a manufacturer is seeking approval of the first generic of a particular molecule.
3. Improve measurement and transparency of the comparative efficacy of different drugs that treat the same disease.
a) Where different drugs are demonstrated to be similarly efficacious, consider broader implementation of strategies that spur competition on behalf of consumers affecting net prices. Such strategies could include favorable formulary placement for lower-cost, equally effective drugs or forms of reference pricing where purchasers would pay the difference for higher cost drugs with equal or lower efficacy.
b) By contrast, where access to all drugs in a therapeutic class is strongly valued by prescribers and patients, we should not expect market forces on their own to moderate prices. One way to enhance patient value in such circumstances could be to rely on increased transparency in comparative efficacy to encourage research, development, and spending on the highest value drugs. We can also explore innovative reimbursement approaches, such as outcomes-based contracts, that provide incentives to develop substantial improvements over existing therapies. We acknowledge that implementing comparative value analysis is a significant shift from current market practices and would require a shared commitment among all stakeholders to implement well.
The Office of the Attorney General looks forward to continued collaboration with the Legislature, sister agencies, health care market participants, and all stakeholders in understanding the drivers of prescription drug spending and promoting the affordability and accessibility of these treatments for all Massachusetts residents.
58 See, e.g., Youming Zhang and Xiaodan Yao, The Recent Advances and Future Perspectives of Personalized Medicine, J. OF GENETIC SYNDROMES & GENE THERAPY 5:e125 (2014).
IV. Conclusion and Recommendations -29-

Examination of Health Care Cost Trends and Cost Drivers Pursuant to G.L. c. 12C, § 17
AcknowledgementsExamination and Report by Attorney General Healey’s Health Care Division: Assistant Attorneys General Eric Gold, Stephen Vogel, and David Brill, Division Chief Karen Tseng, and Legal Analyst Tara Ruttle, with expert assistance from Greylock McKinnon Associates, Inc.
The Attorney General’s Office thanks the health plans, pharmacy benefit managers, and pharmacies who provided information for this examination for their courtesy and cooperation.
-30- Acknowledgements

Examination of Health Care Cost Trends and Cost Drivers Pursuant to G.L. c. 12C, § 17

Office of Attorney General Maura Healey
One Ashburton Place
Boston, MA 02108
(617) 727-2200
www.mass.gov/ago/