annual activity report - europarl.europa.eu · 3 regio_aar_2012_annexes annex 1: statement of the...
TRANSCRIPT

1
regio_aar_2012_annexes
2012
Annual Activity Report
DG Regional and
Urban Policy
Annexes

2
regio_aar_2012_annexes
TABLE OF CONTENTS
ANNEX 1: STATEMENT OF THE RESOURCES DIRECTOR ....................................... 3
ANNEX 2: HUMAN AND FINANCIAL RESOURCES BY ABB ACTIVITY ................. 4
ANNEX 3: DRAFT ANNUAL ACCOUNTS AND FINANCIAL REPORTS .................... 5
ANNEX 4: ASSESSMENT OF RISK AND MATERIALITY CRITERIA ..................... 14
ANNEX 5: INTERNAL CONTROL TEMPLATE FOR BUDGET IMPLEMENTATION (ICT) ............................................................................................... 17
ANNEX 6: IMPACT AND RESULTS INDICATORS ...................................................... 20
ANNEX 7: FOLLOW-UP OF THE 2012 OPERATIONAL PRIORITIES AS DEFINED IN THE MANAGEMENT PLAN 2012 ............................................................ 33
ANNEX 8: MEMBER STATES / DG REGIONAL AND URBAN POLICY AUDIT OPINIONS 2012 ................................................................................................................... 39
ANNEX 9: ERROR RATES 2012 ....................................................................................... 40
ANNEX 10: ANNUAL SUMMARIES COVERING 2012................................................. 41
ANNEX 11: 2011 RESERVATIONS CARRIED OVER TO AAR 2012 .......................... 42
ANNEX 12: 2007 - 2013 (ERDF / COHESION FUND / IPA) - WARNINGS, INTERRUPTIONS AND PRE-SUSPENSIONS ................................................................ 43
ANNEX 13: INTERRUPTIONS AND SUSPENSIONS - 2012 BY MEMBER STATE .................................................................................................................................. 47

3
regio_aar_2012_annexes
ANNEX 1: STATEMENT OF THE RESOURCES DIRECTOR
I declare that in accordance with the Commission’s communication on clarification of the responsibilities
of the key actors in the domain of internal audit and internal control in the Commission1, I have reported
my advice and recommendations to the Director-General/Head of Service on the overall state of internal
control in the DG/service.
I hereby certify that the information provided in Parts 2 and 3.1 of the present AAR and in its annexes 2 to
13 is, to the best of my knowledge, accurate and exhaustive.
Brussels, 27 March 2013
Vittoria Alliata di Villafranca
"Signed"
1 SEC(2003)59 of 21.01.2003.

4
regio_aar_2012_annexes
ANNEX 2: HUMAN AND FINANCIAL RESOURCES BY ABB ACTIVITY
Code ABB Activity ABB Activity Human Resources by ABB Activity
Establishment Plan posts
External Personnel
Total
13 03 European Regional Development Fund and other regional operations
226 51 277
13 04 Cohesion Fund 97 30 127
13 05 Pre-accession operations related to the structural policies
12 32 44
13 AWBL-01 Administrative support for the Directorate-General for Regional Policy
36 15 51
13 AWBL-02 Control related to cohesion policy pre-accession
80 15 95
13 AWBL-03 Policy strategy, coordination and evaluation for the Directorate-General for Regional Policy
154 29 183
Total 605 172 777
There are no substantial differences between the original planning and actual occupation as of 31 December 2012.
IMPLEMENTATION OF THE GLOBAL ENVELOPE (IN EUROS)
BUDGET LINES CONCERNED: 13 01 02 11 00 01 TO 13 01 02 11 00 06
2012
BUDGET LINE* BUDGET LINE DESCRIPTION
AVAILABLE APPROPRIATIONS
COMMITMENTS PAYMENTS
13.010211.00
13.010211.00.01.10 Mission expenses 2,627,562 2,100,847
13.010211.00.01.30 Representation expenses 4,000 1,844
13.010211.00.02.20 Meeting costs 70,000 21,665
13.010211.00.02.40 Conference costs 80,000 60,308
13.010211.00.03 Meetings of committees 100,000 81,822
13.010211.00.06 Further training and management training
233,525 141,576
TOTAL 3,150,748 3,115,087 2,408,062
5
regio_aar_2012_annexes
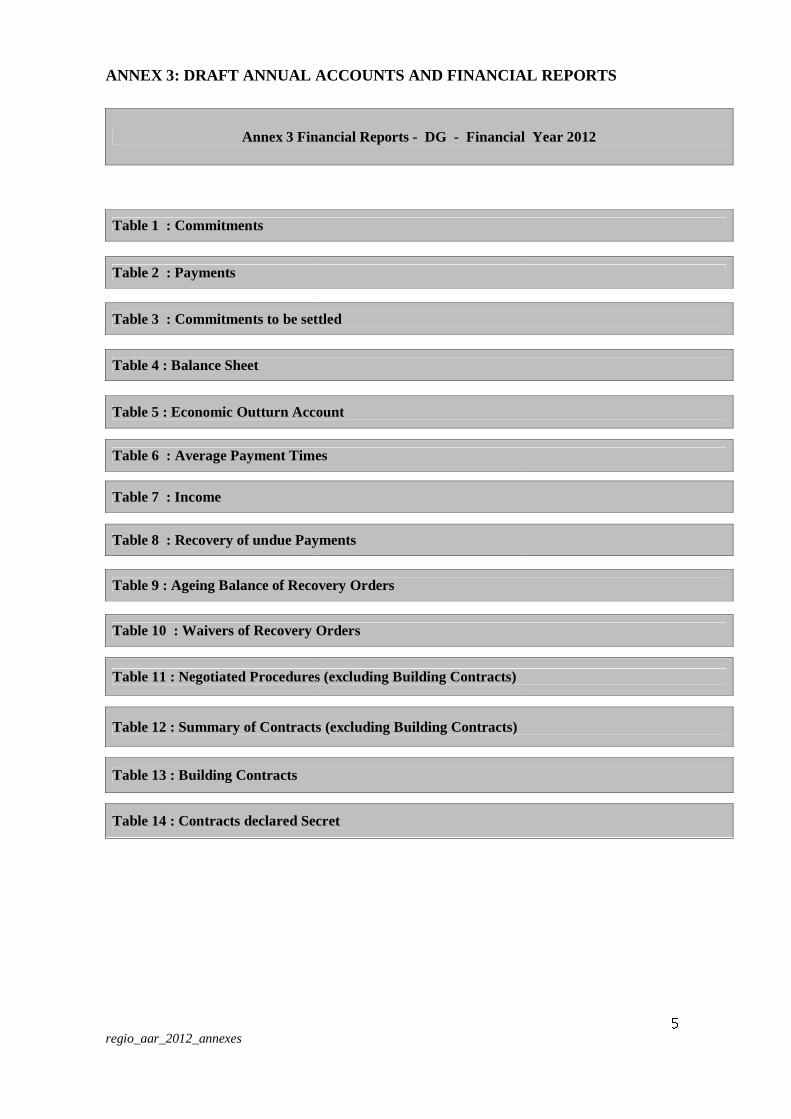
ANNEX 3: DRAFT ANNUAL ACCOUNTS AND FINANCIAL REPORTS
Annex 3 Financial Reports - DG - Financial Year 2012
Table 1 : Commitments
Table 2 : Payments
Table 3 : Commitments to be settled
Table 4 : Balance Sheet
Table 5 : Economic Outturn Account
Table 6 : Average Payment Times
Table 7 : Income
Table 8 : Recovery of undue Payments
Table 9 : Ageing Balance of Recovery Orders
Table 10 : Waivers of Recovery Orders
Table 11 : Negotiated Procedures (excluding Building Contracts)
Table 12 : Summary of Contracts (excluding Building Contracts)
Table 13 : Building Contracts
Table 14 : Contracts declared Secret

6
regio_aar_2012_annexes
Additional comments

7
regio_aar_2012_annexes
TABLE 1: OUTTURN ON COMMITMENT APPROPRIATIONS IN 2012 (in Mio €)
Commitment appropriations
authorised
Commitments made
%
1 2 3=2/1
Title 13 Regional policy
13 13 01 Administrative expenditure of the `Regional policy' policy area
24.61 22.40 91.01 %
13 03 European Regional Development Fund and other regional operations
29,499.59 29,490.08 99.97 %
13 04 Cohesion Fund 11,787.31 11,785.94 99.99 %
13 05 Pre-accession operations related to the structural policies
555.34 555.34 100.00 %
13 06 Solidarity Fund 726.23 726.23 100.00 %
Total Title 13 42,593.09 42,580.00 99.97%
Total DG REGIO 42,593.09 42,580.00 99.97 %
* Commitment appropriations authorised include, in addition to the budget voted by the legislative authority, appropriations carried
over from the previous exercise, budget amendments as well as miscellaneous commitment appropriations for the period (e.g. internal
and external assigned revenue).
TABLE 2: OUTTURN ON PAYMENT APPROPRIATIONS IN 2012 (in Mio €)
Chapter Payment appropriations authorised *
Payments made
%
1 2 3=2/1
Title 13 Regional policy
13 13 01 Administrative expenditure of the `Regional policy' policy area
33.12 20.03 60.46 %
13 03 European Regional Development Fund and other regional operations
27,465.31 27,465.23 100.00 %
13 04 Cohesion Fund 9,622.19 9,622.18 100.00 % 13 05 Pre-accession operations related to the
structural policies 363.63 353.89 97.32 %
13 06 Solidarity Fund 726.23 726.23 100.00 % Total Title 13 38,210.49 38,187.55 99.94%
Total DG REGIO 38,210.49 38,187.55 99.94 %
* Payment appropriations authorised include, in addition to the budget voted by the legislative authority, appropriations carried over
from the previous exercise, budget amendments as well as miscellaneous payment appropriations for the period (e.g. internal and
external assigned revenue).

8
regio_aar_2012_annexes
Commitments to be settled from
Total o f commitments to be
settled at end
Total of commitments to be set t led at end
Commitments 2012
Payments 2012 RAL 2012 % to be settled financial years previous to 2012
of f inancial year 2012(incl corrections)
of f inancial year 2011(incl.
correct ions)
1 2 3=1-2 4=1-2/1 5 6=3+5 7
13 13 01 21.85 12.64 9.21 42.13 % - 9.21 8.51
13 03 29,490.08 579.04 28,911.04 98.04 % 49,676.75 78,587.79 76,728.97
13 04 11,785.94 91.17 11,694.77 99.23 % 19,964.57 31,659.34 29,694.51
13 05 555.34 - 555.34 100.00 % 1,491.74 2,047.08 1,977.85
13 06 726.23 726.23 - 0.00 % - - -
42,579.45 1,409.10 41,170.35 96.69% 71,133.06 112,303.41 108,409.84
42,579.45 1,409.10 41,170.35 96.69 % 71,133.06 112,303.41 108,409.84
European Regional Development Fund and other regional operations
Cohesion Fund
Pre-accession operations related to the structural policies
Solidarity Fund
Total Title 13
Total DG REGIO
TABLE 3 : BREAKDOWN OF COMMITMENTS TO BE SETTLED AT 31/12/2012 (in Mio €)
2012 Commitments to be settled
Chapter
Title 13 : Regional policy
Administrative expenditure of the `Regional policy' policy area
0.00
10,000.00
20,000.00
30,000.00
40,000.00
50,000.00
60,000.00
70,000.00
80,000.00
90,000.00
13 01 13 03 13 04 13 05 13 06
="Breakdown of Commitments remaining to be settled (in Mio EUR)"

9
regio_aar_2012_annexes
It should be noted that the balance sheet and economic outturn account presented in Annex 3 to this Annual Activity Report, represent
only the (contingent) assets, (contingent) liabilities, expenses and revenues that are under the control of this Directorate General.
Significant amounts such as own resource revenues and cash held in Commission bank accounts are not included in this Directorate
General's accounts since they are managed centrally by DG Budget, on whose balance sheet and economic outturn account they
appear. Furthermore, since the accumulated result of the Commission is not split amongst the various Directorates General, it can be
seen that the balance sheet presented here is not in equilibrium.
Additionally, the figures included in tables 4 and 5 are provisional since they are, at this date, still subject to audit by the Court of
Auditors. It is thus possible that amounts included in these tables may have to be adjusted following this audit.
2012 2011
27,072,521,945.35 27,676,578,127.64
A. 1,361,243.92 1,361,243.92
27,071,160,701.43 27,675,216,883.72
3,033,755,379.10 2,546,238,054.22
A. 1,902,838,716.17 1,861,493,773.83
1,130,916,662.93 684,751,291.70
- (7,011.31)
AS 30,106,277,324.45 30,222,816,181.86
(18,107,688,630.60) (17,888,426,558.34)
P. (18,107,688,630.60) (17,888,426,558.34)
LIA (18,107,688,630.60) (17,888,426,558.34)
11,998,588,693.85 12,334,389,623.52
(18,038,580.44) (18,038,580.44)
(11,980,550,113.41) (12,316,351,043.08)
- -
P.I.2. Accumulated Surplus / Deficit
Non-allocated central (surplus)/deficit*
TOTAL
LIABILITIES
NET ASSETS (ASSETS less LIABILITIES)
A.II.2. Short-term Pre-Financing
A.II.3. Short-term Receivables
A.II.5. Cash and Cash Equivalents
ASSETS
P.III. CURRENT LIABILITIES
P.III.4. Accounts Payable
BALANCE SHEET
A.I. NON CURRENT ASSETS
A.I.1. Intangible Assets
A.I.5. LT Pre-Financing
A.II. CURRENT ASSETS
TABLE 4 : BALANCE SHEET

10
regio_aar_2012_annexes
It should be noted that the balance sheet and economic outturn account presented in Annex 3 to this Annual Activity Report, represent
only the (contingent) assets, (contingent) liabilities, expenses and revenues that are under the control of this Directorate General.
Significant amounts such as own resource revenues and cash held in Commission bank accounts are not included in this Directorate
General's accounts since they are managed centrally by DG Budget, on whose balance sheet and economic outturn account they
appear. Furthermore, since the accumulated result of the Commission is not split amongst the various Directorates General, it can be
seen that the balance sheet presented here is not in equilibrium.
Additionally, the figures included in tables 4 and 5 are provisional since they are, at this date, still subject to audit by the Court of
Auditors. It is thus possible that amounts included in these tables may have to be adjusted following this audit.
ECONOMIC OUTTURN ACCOUNT 2012 2011
II.1 SURPLUS/ DEF. FROM OPERATING ACTIVT 38,437,834,513.94 35,817,847,548.60
II.1.1. OPERATING REVENUES (152,731,788.96) (12,210,918.52)
II.1.1.1. Other operating revenue (152,731,788.96) (12,210,918.52)
II.1.2. OPERATING EXPENSES 38,590,566,302.90 35,830,058,467.12
II.1.2.1. Administrative Expenses 5,227,559.37 9,967,817.48
II.1.2.2. Operating Expenses 38,585,338,743.53 35,820,090,649.64
II.2. SURPLUS/DEF. NON OPERATING ACTIVIT 2,355.32 640.94
II.2. FINANCIAL OPERATIONS 2,355.32 640.94
II.2.2. Financial expenses 2,355.32 640.94
ECONOMIC OUTTURN ACCOUNT 38,437,836,869.26 35,817,848,189.54
TABLE 5 : ECONOMIC OUTTURN ACCOUNT

11
regio_aar_2012_annexes
PercentageAverage Payment
Times (Days)
Nbr of Late Payments
Percentage
97.02 % 12.58 21 2.98 %
89.23 % 21.52 7 10.77 %
82.51 % 25.95 273 17.49 %
87.08 % 301 12.92 %
21.32
PercentageAverage Payment
Times (Days)
Nbr of Late Payments
Percentage
84.85 % 12.46 5 15.15 %
67.96 % 15.84 736 32.04 %
68.20 % 741 31.80 %
15.78
% of Total Number
Total Number of Payments
Amount of Suspended Payments
% of Total Amount
15.02 % 2330 5,419,234,051.21 14.20 %
DG REGIO 65010100 Interest on late payment of charges New FR 2,355.32
2,355.32
0 103 350 38,156,768,658.04
Late Interest paid in 2012
DG GL Account Description Amount (Eur)
Suspensions
Average Report
Approval Suspension
Average Payment
Suspension Days
Number of Suspended Payments
Total Paid Amount
Total Number of Payments
2330 1589
Average Payment Time
40.69 94.11
30 2297 1561 94.53
Target Payment
Time (Days)
Total Number of Payments
Nbr of Payments
within Target Time
Average Payment Times (Days)
20 33 28 32.60
Average Payment Time
40.69 171.27
Target Times
Total Number of Payments
2330 2029
45 65 58 75.14
60 1561 1288 179.97
Maximum Payment
Time (Days)
Total Number of Payments
Nbr of Payments
within Time Limit
Average Payment Times (Days)
30 704 683 90.10
TABLE 6: AVERAGE PAYMENT TIMES FOR 2012 - DG REGIO
Legal Times

Outstanding
Chapter Current year RO Carried over RO Total Current Year RO Carried over RO Total balance
1 2 3=1+2 4 5 6=4+5 7=3-6
61 REPAYMENT OF MISCELLANEOUS EXPENDITURE 70,516,346.76 3,009,099.74 73,525,446.50 53,660,958.03 3,009,099.74 56,670,057.77 16,855,388.73
65 FINANCIAL CORRECTIONS 21,980,417.37 1,724,555.85 23,704,973.22 19,160,563.22 1,724,555.85 20,885,119.07 2,819,854.15
66 OTHER CONTRIBUTIONS AND REFUNDS - 41,012.00 41,012.00 - - - 41,012.00
92,496,764.13 4,774,667.59 97,271,431.72 72,821,521.25 4,733,655.59 77,555,176.84 19,716,254.88
TABLE 7 : SITUATION ON REVENUE AND INCOME IN 2012
Revenue and income recognized Revenue and income cashed from
Total DG REGIO
INCOME BUDGET RECOVERY
ORDERS ISSUED IN 2012
Year of Origin (commitment)
Nbr RO Amount Nbr RO Amount Nbr RO Amount
Sub-Total
EXPENSES BUDGET
Nbr Amount Nbr Amount Nbr Nbr Nbr Amount Nbr Amount
INCOME LINES IN INVOICESNON ELIGIBLE IN COST CLAIMS
CREDIT NOTES
Sub-Total
GRAND TOTAL
TOTAL RC(incl. non-qualified % Qualified/Total RC
Amount Amount
Error Irregularity OLAF Notified TOTAL Qualified
TABLE 8 : RECOVERY OF UNDUE PAYMENTS(Number of Recovery Contexts and corresponding Transaction Amount)
TOTAL Qualified TOTAL RC(incl. non-qualified) % Qualified/Total RC
Nbr RO Amount

13
No data to be reported
Number at 01/01/2012
2005 1
2011 8
2012
9 3 -66.67 % 4,774,667.59 1,577,432.88 -66.96 %
-100.00 % 4,733,655.59 -100.00 %
2 1,536,420.88
Number at 31/12/2012
EvolutionOpen Amount
(Eur) at 01/01/2012
Open Amount (Eur) at 31/12/2012
Evolution
1 0.00 % 41,012.00 41,012.00 0.00 %
TABLE 9: AGEING BALANCE OF RECOVERY ORDERS AT 31/12/2012 FOR REGIO
Waiver Central Key
Linked RO Central Key
Comments
Number of RO waivers
Total DG
TABLE 10 : RECOVERY ORDER WAIVERS IN 2012 >= EUR 100.000
RO Accepted Amount (Eur)
LE Account GroupCommission
Decision
Negotiated Procedure Legal base Number of Procedures Amount (€)
Total
TABLE 11 : CENSUS OF NEGOTIATED PROCEDURES - DG - YEAR 2012

14
Total number of contracts :
Total amount :
Legal baseContrac
t Number
TABLE 13 : BUILDING CONTRACTS
Contractor Name Description Amount (€)
Internal procedures > € 60,000 2011 2012
Contract Class Count Amount (€) Count Amount (€)
Service 13. 37,974,763.00 11. 15,692,344.72
TOTAL 13. 37,974,763.00 11. 15,692,344.72 Internal procedures > € 60,000 2011 2012
Procedure Type Count Amount (€) Count Amount (€)
(FR2007) Open Procedure (Art. 122.2 IR) 13. 37,974,763.00 10. 15,567,369.72
(FR2007) Restricted Procedure involving a call for expressions of interest (AMI) (Art. 128 IR)
1. 124,975.00
TOTAL 13 37,974,763.00 11 15,692,344.72
External procedures > € 10,000
Contract Class Count Amount (€)
TOTALExternal procedures > € 10,000
Procedure Type Count Amount (€)
TOTAL
TABLE 12 : SUMMARY OF PROCEDURES OF DG EXCLUDING BUILDING CONTRACTS
Total Number of Contracts :
Total amount :
Legal baseContract Number
Contractor NameType of contract
Description Amount (€)
TABLE 14 : CONTRACTS DECLARED SECRET

15
ANNEX 4: ASSESSMENT OF RISK AND MATERIALITY CRITERIA
Assessment of management and control systems in the Member States and for the programming period 2007-13
All programmes are assessed against audit opinions at national and Commission level based on audits carried out on systems and [representative] samples of operations. In addition, operational line managers and authorising officers by sub-delegation also assess the level of assurance. The assessment is based on three elements as follows:
1. The first element is the assessment of the functioning of management and control systems carried out by the audit directorate/sector. This assessment is complemented at the Directorate general level taking into account elements received by the operational managers/units and the regular contacts with [regional and] national programme authorities.
2. The second element is the [projected] error rate reported by [programme/national] audit authorities in the Annual Control/Audit Reports, based on expenditure for the year preceding the reporting year. The Directorate General assesses the reliability of the projected error rates for each programme, on the basis of all available information and audit results, including on-the-spot missions, and uses this information as the best estimate of the possible risk for expenditure in the reporting year. In case the [projected] error rates are not available, not accurate or found not to be reliable, the audit directorate either recalculates them when it has sufficient information to do so or, alternatively, replaces them by flat rates in line with the results of the assessment of the functioning of management and control systems. This results in an error rate validated by management2 for each programme for the reporting year. This is the best estimate expressed as a percentage of the value of the [interim] payments made in the reporting year of expenditure which is not in full conformity with contractual or regulatory provisions.
3. The third element is the consideration of the multi-annual impact of the validated error rates calculated since the beginning of the programming period, on the corresponding [interim] payments made during that same period, after deduction of the recoveries and withdrawals reported for each year as well as pending recoveries at the end of the reporting year and withdrawals accepted by Certifying Authorities and recorded in their accounts prior to the date of signature the AAR.
The application of this third element results in a cumulative residual risk/error rate for each programme, expressed as a percentage of the value of the cumulative [interim] payments made for the programming period, up to the date of signature the AAR. This is the DG best estimate of expenditure which is not in full conformity with contractual or regulatory provisions and which have not been corrected at the date the report is signed.
The assessment of the relevant reports, data and other information available requires the application of professional judgement, namely when weighting contradictory information or considering abnormal statistical results. When taking into account reported corrections, the authorising officer by delegation also assesses that they effectively mitigate the risks identified and that they result in a reduction in the level of the error that remains uncorrected in the population.
Materiality criteria and reservations
• Materiality can be assessed first at the level of the ABB activity by calculating the [weighted average] cumulative residual risk/error rate and comparing the result with the 2% materiality threshold. An average cumulative residual risk/error rate higher than 2 % should lead to a reservation, but this would need in any case to be further analysed by operational programme.
For that purpose, the Directorate-General assesses each operational programme in order to identify reservations and corrective measures to be applied at this lower level than the ABB activity, in accordance with the legal basis for cohesion policy.
2 See Annex 1 of the AAR.

16
At programme level, reservations are made in respect of significant weaknesses in the management and control systems in the Member States where the resulting risk to the Community budget is material. Following the approach set out, reservations are made as a general rule for all programmes for which the cumulative residual risk/error rate exceeds 2%. Exceptions, if any, are clearly reported and explained in the body of the Annual Activity Report. In some cases, reservations may be made at a sub-programme level (priority axis or implementing bodies) when the systemic deficiencies only affect a specific management and control system, not used for the other activities under the same programme.3
• In addition, in the event that the monitoring and supervisory controls reveal deficiencies of a qualitative nature (e.g. significant systemic deficiencies or major control failures) which have a significant impact on the reputation of the Commission, a reservation is made on a reputational basis.
Estimation of the amount at risk
The amount at risk is calculated by applying the validated error rate to the amount of interim payments made during the reporting year for each programme. In case no payments have been made in the year concerned for a programme under reservation, the reservation could still apply, but on a reputational/qualitative basis, rather than on a quantitative one.
For transparency purposes, the estimation of the amount at risk is presented by Member State classifying the programmes in four categories levels of assurance in accordance with the assurance they provide as to the legality and regularity of [interim] payments made during the reporting year:
- Reasonable assurance means that there is no material deficiency in key elements of the systems (only minor improvements may be needed in some cases) and the validated error rate and the cumulative residual risk are below 2%;
- Reasonable assurance with low risk of irregularities covers programmes with the existence of minor deficiencies in key elements of the systems and/or with a validated error rate below 5% but with a cumulative residual risk below 2%;
- Limited assurance with medium risk of irregularities covers programmes with the existence of some deficiencies in key elements of the systems and/or with a validated error rate below 5% and a cumulative residual risk above 2%;
- Limited assurance with high risk of irregularities covers programmes with material deficiencies in several key elements of the systems and/or with a validated error rate above 5% and a cumulative residual risk above 2% 3.
3 [In case the risk of error is high (exceeds 5%) and in application of the principle of prudence, the DG would not take into account recoveries and withdrawals implemented on a multiannual basis for the decision to make a reservation].

17
ANNEX 5: INTERNAL CONTROL TEMPLATE FOR BUDGET IMPLEMENTATION (ICT)
ICT: European Regional Development Fund and Cohesion Fund (mainly shared management)
Management mode: Mainly shared management – national and regional programmes managed by Member States, which select operations for funding; Commission has supervisory role. 2000-2006 programming period : Grant period: Disbursed over a 9-year period for a 7-year programme Grant basis: Co-financing with Member States (maximum EU contribution between 25% and 85%)4 Number of programmes (Operational Programmes/Single Programming Documents/Community Initiatives programmes): 379 Average amount of ERDF (estimate) managed by OP: EUR 340 million
2007-2013 programming period : Grant period: Disbursed over a 9-year period for a 7-year programme Grant basis: Co-financing with Member States (maximum EU contribution between 50% and 85%, depending on Member State and Fund) Number of programmes (Operational Programmes, including ERDF & CF): 317 Average amount (estimate) managed by OP: EUR 850 million
Management and control systems: stages and main actors - Characteristics of the Directorate General's policy environment
Summary: DG Regional and Urban Policy funds, mainly through the European Regional Development Fund and the Cohesion Fund, infrastructure, business investment, environmental and other projects contributing to regional development carried out by national, regional and local government bodies in the Member States.
Key inherent risks in this environment:
- Multiplicity of organisations, systems, operations and beneficiaries; - Many different types of projects and programmes; - Detailed eligibility requirements at Community and national levels which can lead to complexity and risk of misinterpretation. Given the scope and the multi-annual nature of the structural instruments, the number of systems, and the audit resources available to the Directorate General, it is not possible to audit all significant areas each year.
Preventive measures:
Negotiation and approval of programmes, including main elements of management and control systems in Member States
• For 2000-2006 programmes the Commission negotiated programme content and management arrangements which were communicated in the programme documentation sent by the Member States to the Commission. The Member States designated a managing authority per programme as the body responsible for execution of the programme and the first level controls of expenditure and a paying authority to certify payment claims to the Commission.
• For the 2007-13 programmes, establishment of a satisfactory system architecture (managing authority, certifying authority, intermediate bodies and audit authority) was a condition of programme approval. The Commission ensured that existing relevant information about weaknesses in the systems for the 2000-2006 period was used to improve the systems so that the weaknesses do not recur in the new programme period, 2007-2013.
Preventive and supervisory measures:
Compliance assessment of set-up of management and control systems
• For the 2000-06 period, the Member States sent a description of the management and control system to the Commission, including details of the organisation of the managing and paying authorities, intermediate bodies reporting to them, the audit services and the body issuing the winding-up declaration. Between 2001 and 2003 the Commission carried out a desk check of all the system descriptions and recommended changes where necessary. It also performed on-the-spot audits of a sample of systems in the Member States to verify the descriptions.
• For the 2007-2013 period to strengthen the scrutiny of systems, the
4 See Article 29 of Council regulation(EC) n° 1260/1999

18
Member States assess the compliance of their management and control systems. They submit a description of the systems, the results of an independent assessment of the set-up of the systems and an independent report and opinion on their compliance within 12 months of the approval of each operational programme and before the submission of the first interim application for payment. The Commission examines the documents submitted to satisfy itself that there is reliable assurance on the set up of the systems.
• Where there are reservations in the opinion or the Commission has particular observations, the Commission ensures that corrective measures concerning key elements of the systems have been taken before confirming that interim payments can be made.
Preventive and supervisory measures:
Supervisory and central checks and monitoring during the initial phases of the programme
Throughout the implementation period the operational units of DG Regional and Urban Policy hold regular meetings with Member States managing authorities, including the annual meetings to review the annual implementation reports; the financial unit maintains contacts with certifying authorities by accepting each payment claim; and the audit directorate with responsible audit bodies through annual bilateral and multilateral meetings. Issues in managing and controlling Community funds are also discussed with Member States in the management committees composed of representatives of the Commission and Member States (Committee for the Coordination of Funds). By these means DG Regional and Urban Policy provides advice and formal guidance on issues such as management checks and sampling for audits to establish benchmarks and spread good practices.
Detective and corrective controls:
Primary level verification by managing authority of correctness of expenditure declared from financed operations and their compliance with grant conditions; reporting to the Commission on interim payments and key milestones
Throughout the implementation period the managing authorities in Member States are required to carry out the following checks: − Ensure compliance of projects with selection criteria and beneficiary’s
understanding of the terms and conditions; − Desk checks of all expenditure based on supporting documents, including
progress reports, etc.; − On-the-spot visits to a significant number of projects selected on a risk
based analysis to verify delivery of the project outputs (investment, services) and reality and eligibility of expenditure declared;
− Correcting irregular expenditure and recovery of EU funds as appropriate; − Drawing up of annual reports on implementation and a final report
summarising the implementation of the entire programme which are scrutinised by the Commission.
Detective and corrective controls : Secondary level verification by paying/certifying authority, including reporting of irregularities and recoveries
Each periodic statement of expenditure is checked and certified as correct by the paying/certifying authority. The assurance is based on its own desk checks and, if necessary, on-the-spot-verifications and the information on checks performed by the managing and audit authorities. The paying/certifying authority also monitors and reports to the Commission information on irregularities and suspected fraud and recoveries made.
Supervisory and corrective controls:
Audits by the audit authority
• For the 2007-2013 period the responsible audit body performs systems audits and carries out substantive testing of projects to cover 5% of expenditure by programme closure; it reports findings on systems weaknesses and irregular expenditure to the managing authority and to the paying/certifying authority for correction; it issues an annual control report on the work carried out and conclusions drawn.
• For the 2007-2013 period the audit authority for each programme provides an annual audit opinion on the functioning of systems along with the annual control report, based on its programme of systems audits and substantive testing on a representative sample of operations.
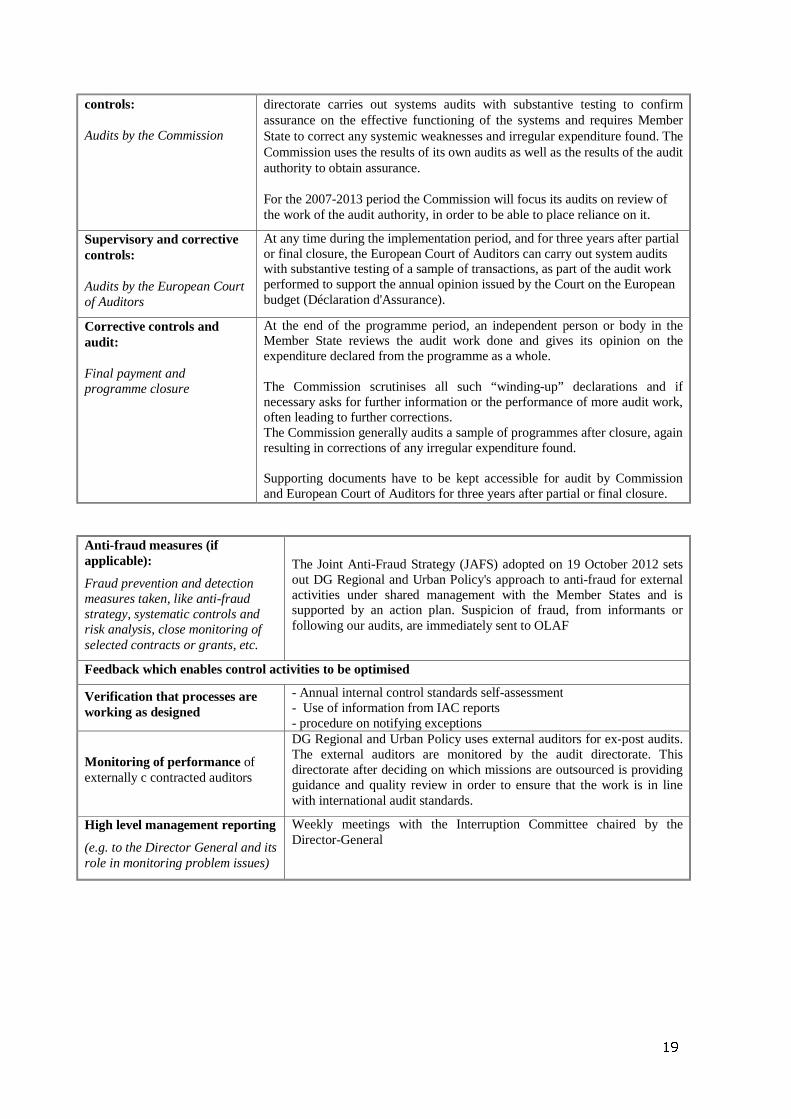
Supervisory and corrective Throughout the implementation period DG Regional and Urban Policy's audit
19
controls:
Audits by the Commission
directorate carries out systems audits with substantive testing to confirm assurance on the effective functioning of the systems and requires Member State to correct any systemic weaknesses and irregular expenditure found. The Commission uses the results of its own audits as well as the results of the audit authority to obtain assurance. For the 2007-2013 period the Commission will focus its audits on review of the work of the audit authority, in order to be able to place reliance on it.
Supervisory and corrective controls:
Audits by the European Court of Auditors
At any time during the implementation period, and for three years after partial or final closure, the European Court of Auditors can carry out system audits with substantive testing of a sample of transactions, as part of the audit work performed to support the annual opinion issued by the Court on the European budget (Déclaration d'Assurance).
Corrective controls and audit:
Final payment and programme closure
At the end of the programme period, an independent person or body in the Member State reviews the audit work done and gives its opinion on the expenditure declared from the programme as a whole. The Commission scrutinises all such “winding-up” declarations and if necessary asks for further information or the performance of more audit work, often leading to further corrections. The Commission generally audits a sample of programmes after closure, again resulting in corrections of any irregular expenditure found. Supporting documents have to be kept accessible for audit by Commission and European Court of Auditors for three years after partial or final closure.
Anti-fraud measures (if applicable):
Fraud prevention and detection measures taken, like anti-fraud strategy, systematic controls and risk analysis, close monitoring of selected contracts or grants, etc.
The Joint Anti-Fraud Strategy (JAFS) adopted on 19 October 2012 sets out DG Regional and Urban Policy's approach to anti-fraud for external activities under shared management with the Member States and is supported by an action plan. Suspicion of fraud, from informants or following our audits, are immediately sent to OLAF
Feedback which enables control activities to be optimised
Verification that processes are working as designed
- Annual internal control standards self-assessment - Use of information from IAC reports - procedure on notifying exceptions
Monitoring of performance of externally c contracted auditors
DG Regional and Urban Policy uses external auditors for ex-post audits. The external auditors are monitored by the audit directorate. This directorate after deciding on which missions are outsourced is providing guidance and quality review in order to ensure that the work is in line with international audit standards.
High level management reporting
(e.g. to the Director General and its role in monitoring problem issues)
Weekly meetings with the Interruption Committee chaired by the Director-General

20
ANNEX 6: IMPACT AND RESULTS INDICATORS
General Objectives of the "Cohesion Policy"
1. Convergence: stimulate the growth potential and employment of the least-developed Member States and regions
Impact indicators5 Latest known result Target (result)
Additional real GDP growth thanks to the implementation of the period 2007-2013
Estimated overall increase in the level of GDP as compared to a scenario without Cohesion Policy: - baseline in 2006 - by 2009: 1.3% - by 2010: 2.3% - by 2011: 3.6% - by 2012: 5.1%6 Estimated GDP increased by 12.6%7 by 2012 due to the programming period 2000-20068
Expected overall increase in the level of GDP as compared to a scenario without Cohesion Policy9: - by 2016 by 12 % - by 2020 by 15.6%
Net jobs created thanks to the implementation of the period 2007-2013
Estimated increase in employment as compared to a scenario without Cohesion Policy - baseline in 2006 - by 2009: 1.3 million - by 2010: 2.2 million - by 2011: 3.2 million - by 2012: 4.3 million6 Estimated 6.0 million7 net job years were created by 2012 due to the programming period 2000-200610
Expected increase in employment as compared to a scenario without Cohesion Policy: - by 2016 by 9.5 million - by 2020 by 11.5 million
Lisbon index10 48.2 (2006) 50.7 (2007) 52.6 (2008) 51.7 (2009) 52.7 (2010) for all regions eligible for the Convergence objective
Index 60 for all regions eligible for the Convergence objective by 2015
5 The first two indicators are based on estimates produced by the HERMIN model run by DG Regional and Urban Policy.
Unless specified otherwise, the three indicators cover all the Member States eligible to the Cohesion Fund (including Spain) as well as Eastern Germany and Southern Italy. Note that the HERMIN results are in principle robust also in times of economic downturn. However, the current crisis does make projecting economic variables in the future more uncertain. Therefore, these figures should be interpreted with some caution.
6 This implies that, between 2007 and 2012, GDP and employment in the main beneficiaries would have been on average respectively 0.84 % and 0.81% lower in the absence of the 2007-2013 cohesion policy programmes. This is not inconsistent with the fact that GDP and employment have recorded limited or even negative growth in recent years. In such case, GDP and employment would have fallen (by 0.84% and 0.81%) more without cohesion policy. Note also that the simulation is based on allocation and not on actual expenditure. Hence, it does not take possible absorption problems into account.
7 Identically, the yearly annual impact of the 2000-2006 programmes between 2000 and 2012 is estimated at 12.6%/13 years = 0.97% for GDP and 0.62% for employment.
8 For the period 2000-2006, the indicators cover the Member States eligible to the Cohesion Fund, i.e. the ten Member States who joined in 2004, Spain, Portugal, Ireland, Greece as well as Eastern Germany, and Southern Italy.
9 In this model, the current economic downturn affects the baseline situation, but the percentage of increase due to EU Cohesion Policy remains unchanged.
10 See Fifth report on economic, social and territorial cohesion, November 2010

21
2 Regional competitiveness and employment: strengthen regions' competitiveness and attractiveness as well as employment by helping them to anticipate economic and social changes
Impact indicators Latest known result Target (result)
Jobs created (gross) 71,000 in 21 MS, 2007-200911 757,000 gross jobs to be created in 2007-2013 in 21 MS12
Lisbon index 79.6 (2006) 80.9 (2007) 81.7 (2008) 80.6 (2009) 82.9 (2010) for all regions eligible for the Regional competitiveness objective
Index 90 for all regions eligible for the Regional competitiveness objective by 2015
3 European territorial cooperation: promote stronger integration of the EU to support balanced and sustainable development
Impact indicators Latest known result Target (result)
Average GDP/head disparities between border regions of EU15 and EU1213
1.54 (2004) 1.52 (2005) 1.52 (2006) 1.47 (2007) 1.42 (2008) 1.45 (2009)
1.40 in 2013
4 Pre-accession: assist candidate countries as well as potential candidate countries in their progressive alignment with the standards and policies of the European Union, including cross-border cooperation
Impact indicators Latest known result Target (result)
Improved capacity of candidate countries; monitoring of the recommendations of the reports
Situation of each country as assessed in the 2008 progress reports published in November 2009.
Progress as reported in the annual progress reports of the Commission on candidate countries
Comments
The impact of the crisis can be observed in the Lisbon index. In the 2009, the Lisbon index dropped both for the convergence regions as for the regional competitiveness and employment regions. The Lisbon index in 2010 in the convergence regions was almost identical to that of 2008, indicating a fairly quick return to the 2008 on averages.
The regional competitiveness and employment regions bounced back faster with the 2010 index significantly higher than the 2008 value. Nevertheless, the impact of the crisis is likely to delay progress towards the Lisbon index of 60 and 90 respectively beyond the implementation of the current programming period.
As a consequence of the crisis the border disparities in GDP per head increased in 2009, after following a consistently downward trend between 2004 and 2008. Nevertheless, progress so far seems to be sufficient to ensure that the 1.4 target can be reached by 2013.
11 Source: 2009 AIR for AT, BE, BG, CZ, DE, EE, EL, FI, FR, HU, IT, LU, NL, PL, PT, RO, SE,
SI, UK. Please note that this figure refers to both objectives 12 Based on 100 OPs (AT, BE, BG, CZ, DE, FI, FR, EE, EL, HU, IT, LU, MT, NL, PL, PT, RO, SE SI, SK and UK) 13 Source: Eurostat, REGIO calculations. Values for earlier changed slightly due to data changes.

22
[Disclaimer: the data below are based on the Annual Implementation Report 2011 submitted by the Member States mid-2012 and refer to the situation as end of 2011, also reported in the Management Plan 2013.14 Data on the situation as end of 2012 will be available mid-2013.]
Specific Objectives of the "European Regional Development Fund" (ERDF)
SPECIFIC OBJECTIVE 1
Supporting the generation of smart and sustainable growth and jobs through investments and services, including development of financing instruments, raising productivity, competitiveness and innovation capacities of enterprises, in particular of SMEs
Result indicators Latest known result15 Target (result) for 2007-2013 Number of SMEs receiving support and amounts provided to/invested by SMEs
€ 22.1 billion of ERDF support to SMEs over the period 2000-2008, additional € 9.8 billion on support for innovation and RTD16 131.9 thousand SMEs supported in 2007-2011 in 18 MS17
€ 44.8 billion ERDF funds to support RTD, innovation, information society actions and entrepreneurship in SMEs18 198.7 thousand SMEs supported in 18 MS17
Setting up of enterprises Number of start-ups supported in 2007-2011: 52 thousand in 21 MS19
Number of start-ups supported: 70.1 thousand in 21 MS19
SPECIFIC OBJECTIVE 2 Improving accessibility and attractiveness of the regions and cities, through development of Research and Technological Development, communication (digital agenda) and energy, transport, environmental and social infrastructure
TRANSPORT20 Accessibility gain
Results for 2007-2011: Km of new road: 1.1 thousand in 10 MS21 Km of reconstructed road: 11.5 thousand in 14 MS22 Km of new rail: 302 in 10 MS21 Km of reconstructed rail: 737 in 12 MS23
Km of new road: 6.5 thousand in 10 MS21 Km of reconstructed road: 21 thousand in 14 MS24 Km of new rail: 812 in 10 MS21 Km of reconstructed rail: 6.3 thousand in 12 MS23
ENVIRONMENT25 Additional population served by new/renovated:
Result 2007-2011: 2.16 million in 10 MS26 16.2 million in 10 MS26
14 The data cover only those countries which reported on both achievements and targets in the AIRs. 15 Data are presented in this table for both "latest known results" and "target" columns when they are sufficiently consistent.
Due to the practical constraints for data collection, as described in the 2010 Annual Report of the Court of Auditors (Chapter 8), it is often difficult to keep exactly the same parameters for the results mentioned. However, the Commission always presents the latest data for the most representative Member States.
16 Source: Certified expenditure as available from REGIO databases ( expenditure codes 16 and 324) 17 Source: 2011 AIRs for BE, CZ, DE, ES, FR, GR, IE, IT, LV, LT, NL, PL, PT, RO, SI, SE, SK, UK 18 Source: programme documents, expenditure codes 1,2,3,4,6,7,9 (mainly ERDF expenditures for these categories). In
addition to the target above, €15.2 billion ERDF funds for the information society should be mentioned. Source: programme documents, expenditure codes 10-15 (mainly ERDF expenditures for these categories)
19 Source: 2011 AIRs for AT, BE, CZ, DE, DK, ES, FR, GR, IE, IT, LV, LT, MT, NL, PL, PT, RO, SI, SE, SK, UK 20 The indicators on time savings are no longer disclosed on an annual basis, as their data are not considered to be sufficiently
reliable. 21 Source: 2011 AIRs for BG, CZ, DE, ES, HU, IT, PL, PT, SI, SK 22 Source: 2011 AIRs for BG, CZ, DE, ES, GR, HU, IE, IT,LT, MT, PL, PT, SI, SK 23 Source: 2011 AIRs for BG, CZ, ES, GR, FR, HU, IT, LT, PL, PT, SI, SK. 24 Source: 2011 AIRs for BG, CZ, DE, ES, GR, HU, IE, IT, LT, MT, PL, PT, SI, SK. 25 The indicator on reduction in greenhouse gas emissions is no longer disclosed on an annual basis, as its data are not
considered to be sufficiently reliable. 26 Source: 2011 AIRs for CZ, ES, FR GR, IT, LV, PL, PT, SI, SK

23
-Water projects
Additional population served by new/renovated: -Wastewater projects
Result 2007-2011: 3 million in 13 MS27 23 million in 13 MS27
Additional capacity of renewable energy production (MW)
Result for 2007-2011: 491thousand in 17 MS28
3.7 million in 17 MS28
ENVIRONMENTAL PROTECTION and RISK PREVENTION Number of people benefiting from flood protection measures
Result for 2007-2011: 3.4 million in 11 MS29 10.1 million in 11 MS29
Number of people benefiting from forest fire protection and other protection measures
Result for 2007-2011: 12.6 million in 6 MS30 28.5 million in 6 MS30
INFORMATION SOCIETY, RESEARCH and INNOVATION Research jobs created 12.6 thousand (2007-2011) in 17 MS31 56 thousand in 17 MS31 Additional population covered by broadband access
2.5 million (2007-2011) in 14 MS32 20.3 million in 14 MS32
SOCIAL INFRASTRUCTURES Number of benefiting students33 3.4 million benefiting students (2007-2011) in11
MS34 5.9 million in 11 MS benefiting students (2007-2013)34
SPECIFIC OBJECTIVE 3
Developing regional and local potential through encouraging integrated development approach, capacity building, cross border and transnational cooperation and supporting networking, exchange of experience and cooperation between regions, towns and relevant social, economic and environmental actors
Number of transnational co-operation projects developing RTD and innovation networks33
35 (2007-2011) 44 ( 2007-2013)
Number of people participating in joint education or training activities33
576.3 thousand (2007-2011) 13 thousand (2007-2013)35
SPECIFIC OBJECTIVE 4 Supporting cross-border, transnational and interregional cooperation (European territorial cooperation) including cross-border cooperation between Member States and candidate or potential candidate countries
Number of people getting employment on the other side of the border (result of Cross-Border-Cooperation project)
2 thousand (2007-2011)36 22.9 thousand (2007-2013)36
Number of projects respecting two of the following criteria: joint development, joint implementation, joint staffing, joint financing
1.4 thousand (2007-2011) 37 3 thousand (2007-2013)37
Comments:
1. The slow start of implementation of programmes means that fewer projects than might have been expected were completed by the end of 2011, which is the period covered by the latest Annual Implementation Reports (AIRs).
27 Source: 2011 AIRs for BG, CZ, DE, ES, GR, HU, IE, IT, LT, PL, PT, SI, SK. 28 Source: 2011 AIRs for AT, BG, CZ, DE, FR, GR, HU, IT, LU, LV, LT, PL, PT, RO, SI, SK, UK 29 Source: 2011 AIRs for AT, DE, FR,HU, IT, PL, PT, RO, SI, SK, UK 30 Source: 2011 AIRs for AT, FR, GR, IT, PL, PT 31 Source: 2011 AIRs for AT, BE, BG, CZ, DE, FR, IE, IT, LU, LV, LT, PL, PT, RO, SE, SK, UK. 32 Source: 2011 AIRs for AT, BE, BG, ES, FR, GR, IE, IT, PL, PT, RO, SI, SE, SK. 33 Name of the core indicator updated to reflect the 2011 AIRs report data 34 Source: 2011 AIRs for BE, BG, DE, ES, FR, GR, IT, MT, PL, PT, SK. 35 The significant overachievement of the target is due to under-estimation of the target value at the beginning of the period. 36 Source: 2011 AIRs report 37 Source: 2011 AIRs, where information is available; the amount includes projects respecting also three and four of the
following criteria: joint development, joint implementation, joint staffing, joint financing.

24
However, the significant increase in achievements reported in 2011 compared to 2010 shows that implementation speeded up considerably in this year.
2. The reports against the indicators in the AIRs demonstrate the marked differences that exist between Member States in the progress in implementing programmes up to the end of 2011.
3. The changes in the aggregate target values for the indicators in the tables above, compared to target values of the last year reporting, may be the result of the re-programing exercises. In fact, following encouragement from the European Council and the European Commission and with a view to counter the effects of the economic crisis, several MS proceeded to modify their programmes to target support on SMEs and youth unemployment.
4. In some cases, the seeming under achievements of the targets are due to the fact that Member States do not report achievements in the AIR. In addition, it should be noted that the targets were stated in Operational programmes in 2007. Some of them may become unrealistic due to the effects of the crisis on certain Member States. If necessary, the Directorate General might review these targets with Member States in 2013.
5. It is clear that outputs are below target in relation to most transport and environmental infrastructure projects. However, this is normal in view of the long lead time to the delivery of infrastructure. The reconstructed road figure is high, suggesting either low target setting or, indeed, that the nature of the intervention changed and less intensive reconstruction took place.
6. The environmental and risk prevention figures show high achievements, but this includes some double counting between regional and national OPs in Portugal in particular which the Portuguese authorities are aware of and can filter in their reporting, while the Commission cannot. In addition, it is often in the nature of such projects that the population benefits from the beginning of the project rather than outputs being delivered progressively over time.
7. In a few cases, the ‘latest known result’ and/or the ‘target values’ show a decrease compared to last year reporting. This may be due to the fact that figures were corrected by the Member States in the subsequent Annual Implementation Report or due to the re-programming exercise carried out by the Member States.
Policy outputs foreseen in 2012 Management Plan Policy Outputs in 2012 (Actual) • Annual Report on the implementation of Structural Funds in 2011
(COM(2012) 633) adapted on 31/10/2012 23rd Annual Report on Implementation of Structural Funds (2011)
ERDF Operational / Expenditure-Related Outputs in 2012 Management Plan, and actual results38
Closure of the 2000-2006 ERDF programmes Target: 95% (+-)Partially achieved.
By the end of 2012 66% of ERDF programmes related to the past programming period were closed (250 out of 379 programmes). By the end of February 2013, a further 7 programmes were closed, bringing the total of closed programmes up to 68% of total amounts allocated. All closure letters were sent except for 2 programmes (status as of March 2013).
Assessment of major projects applications 2007-2013 submitted by Member States
Target: 80% adopted in less than one year (--)Not achieved.
In 2012, the Commission approved 110 major projects (ERDF/CF) while 8 projects were declared non-admissible for reasons of incomplete applications and a Member State withdrew 1 project for quality reasons. The target of 80% major projects decisions adopted in less than one year was not achieved and the DG had adopted in December 2012 a robust action plan to tackle also this delay.
JASMINE activities (micro-credit potential development) in 2012: providing support to about 30 additional micro-credit providers.
Target: Final target by 2013 is 85 micro-credit providers (+) On track
During the year, 30 JASMINE beneficiaries were selected through calls for expression of interest launched by the EIF (in the framework of the Contribution agreement), but 1 was renounced. In 2010, 14 beneficiaries were selected, and 11 in 2011, so currently there are 54 active beneficiaries. A call of interest had been launched to select beneficiaries for 2013, although the total number to be selected cannot yet be determined, the DG is confident that at least 30 will be selected.
38 Legend for the achievement of the targets : (++)achieved; (+) nearly achieved or on track, (-+) partially achieved,(-) not achieved but progress recorded; (--) not achieved

25
New JEREMIE-type and JESSICA–type instruments. Target: at least 10 (++)Achieved.
Total number of Financial Engineering Instruments (FEIs) for enterprises reported by MS in 2012 amounts to 531 which represent an increase of 101 funds in comparison to the voluntary reporting exercise in 2011, and those managed by the EIF reported 8 set up between January and October 2012. More information to be received at the end of June 2013, upon receipt of Annual Implementation Reports from Member States. At the end of 2011 (supplementary information to last year's reporting):
� FEIs for urban development (JESSICA-type instruments): a total of EUR 1.5 billion of OP contributions were paid to 28 specific funds in 10 Member States of which 25 were implemented through 18 Holding Funds
� FEIs for energy efficiency and renewable energies: EUR 345 million of OP contributions were paid to 12 specific funds in 5 Member States, out of which 3 were implemented through holding funds
Thematic meetings with Member States on quality of implementation, absorption, administrative capacity
Target: At least 2 per MS and 1 per OP for ETC (++)Achieved
Thematic meetings held throughout the year with each Member State, and in most cases far exceed the target. In addition to meetings, workshops, conferences, seminars and advisory services were held in support of thematic issues.
Tripartite meetings between DG Regional and Urban Policy, Member State and JASPERS on implementation of major projects in sectors of transport, environment, energy and productive investments
Target: 14 meetings (++)Achieved
Total number of tripartite meetings held with Member States and JASPERS on implementation of Major Projects concerning transport, environment, energy and productive investments far exceed the target. For all concerned Member States, at least one meeting was held, except for one Member State when the last meeting took place in 2010 and one is planned for 2013.
Assessment of ERDF programme modifications submitted by Member States
Target: 80 % adopted in less than 6 months (+)Achieved in most Member States
In most Member States where modification requests were submitted, a majority had been dealt with within 3 to 6 months, most countries reporting between 80%-100% adoption within 6 months.
Assessment of annual implementation reports submitted by Member States
Target: 80% approved on time (+)Nearly Achieved
Approval of Annual Implementation Reports (AIRs) were carried out timely except for 9 MS, where there rate of approval varies between 43% and 75%. Some reasons for the delays are: Inadmissibility of AIR due to lack of information on FEIs, inconsistencies of data and report in SFC 2007, variances in categorisation of expenditure.
Launch and monitoring of studies financed through technical assistance appropriations as defined in the financing decision
Target: 10 thematic studies/expert reports launched in the field of smart, sustainable and inclusive growth studies, results of which to be delivered under the form of guides to MA for the next programming period – Launch and monitoring of the Smart Specialisation Strategies platform, including OECD Study, to promote regional growth strategies with stakeholders. (++) Achieved
More than 10 between Guides for MA on smart and sustainable growth issues and thematic studies on issues such as smart specialisation, green public procurement criteria, urban development, governance, SME support, Energy and R&D, etc. were conducted.
Launch and implementation of pilot projects and preparatory actions as defined in the EU budget for 2012
Target: > 95% committed (++)Achieved
95.93% Committed (EUR 7,865,948 committed out of EUR 8,200,000 budgeted). PP/PA 2012
Budget Amount committed
Preparatory action "Enhancing regional and local cooperation through the
promotion of EU regional policy on a global scale" 2,000,000.00 2,000,000.00
Preparatory action "The definition of governance model for the European
Union Danube Region — better and effective coordination" 1,500,000.00 1,262,948.00*

26
Pilot project "Towards a common regional identity, reconciliation of
nations and economic and social cooperation including a Pan-European
Expertise and Excellence Platform in the Danube macro-region"
2,000,000.00 1,974,000.00*
Preparatory action: Supporting Mayotte, or any other territory potentially
affected, with the switchover to outermost-region status 2,000,000.00 2,000,000.00
Preparatory action: Erasmus for the locally and regionally elected" 700,000.00 629,000.00
Total: 8,200,000.00 7,865,948.00
*amounts committed in early 2013, as part of carry over procedure
Specific Objectives of the "Cohesion Fund" (CF)
SPECIFIC OBJECTIVE 1
Strengthen the economic and social cohesion of the Community in the interests of promoting sustainable development by: Developing the trans-European transport networks and in particular strategic projects with high European added value
Result indicators Latest known result Target (result)
TRANSPORT39
Km of Road (new and reconstructed) 936 Km of new road in 8 MS40
11.2 thousand Km of reconstructed road in
11 MS41
6.2 thousand Km of new road (2007-2013) in 8
MS40
20.3 thousand Km of reconstructed road (2007-
2013) in 11 MS41
Km of Rail (new and reconstructed) 66 Km of new rail in 8 MS42
415 Km of reconstructed rail in 10 MS43
701 Km of new rail (2007-2013) in 8 MS42
4.8 thousand Km of reconstructed rail in 10
MS43
SPECIFIC OBJECTIVE 2
Strengthen the economic and social cohesion of the Community in the interests of promoting sustainable development by: Supporting actions of Member States related to the environment and sustainable development clearly presenting environmental benefits (renewable energy, energy efficiency, clean urban transport…)
SUSTAINABLE DEVELOPMENT44
Additional population served by
new/renovated:
-Water projects
1.75 million in 8 MS45 14.9 million in 8 MS45
Additional population served by
new/renovated:
-Wastewater projects
2.4 million in 10 MS46 19.5 million in 10 MS46
Additional population served with
improved urban transport
Please see the footnote47 Please see the footnote 48
39 The indicators on time savings are no longer disclosed on an annual basis, as their data are not considered sufficiently reliable. 40 Source: 2011 AIRs for BG, CZ, ES, HU, PL, PT, SI, SK. 41 Source: 2011 AIRs for BG, CZ, ES, GR, HU, LT, MT, PL, PT, SI, SK 42 Source: 2011AIRs for BG, ES, HU, LV, PL, PT, SI, SK. 43 Source: 2011 AIRs in BG, CZ, ES, GR, HU, LT, PL, PT, SI, SK. 44 The 2007-2013 period was enlarged compared to previous to also include new priority such as renewable energy, energy
efficiency and clean urban transport. Therefore, there are no results expected on these areas for the 2000-2006 period. 45 Source: 2011 AIRs in CZ, ES, GR, LV, PL, PT, SI, SK. 46 Source: 2011 AIRs for BG, CZ, ES, GR, HU, PL, PT, SI, SK, LT. 47 Only 2 Member States reported on achievements in the 2011 AIR, PL and PT, amounting to 1,500,000 additional
population. 48 Following plausibility checks, the target value was dropped because considered not plausible. Source: 2011 AIR in BG,
CZ, GR, HU, LV, LT, PL, PT, SK.

27
Comments (see ERDF)
The points made in for ERDF are equally valid for the Cohesion Fund. The expected outputs and results reported here relate both to the ERDF and the Cohesion Fund. A significant increase in outputs and results was reported by Member States in 2011. However, infrastructure projects which are co-financed by the Cohesion Fund are complex and take longer to complete than ERDF projects in other sectors, so in general Cohesion Fund results will be slower than ERDF.
Policy outputs foreseen in 2012 Management Plan Policy Outputs in 2012 (Actual)
• Annual Report on the Cohesion Fund in 2011 (COM(2012)642) adapted on 07/11/2012
CF Operational / Expenditure-Related Outputs in 2012 Management Plan, and actual results
Cohesion Fund projects (2000-2006) to be closed in 2012 including, if possible, through flat rate financial corrections for systemic issues
Target: 180 closed in 2012; 55% closed in total (+)Nearly achieved for the 180 target (++) Achieved for the main target (55%)
In 2012, 160 projects were closed (leading to a cumulative total of 53% projects closed) - an increase of 58% over the total in 2011. Budget constraints were met end of 2012, funds having been depleted by November 2012. Agreements with Czech and Spanish authorities to accommodate corrections were the main contributors to the increase in closure rates, since significant open projects were tied to these two countries.
Assessment and adoption of Cohesion Fund major projects submitted by MS
Target: 80% adopted in less than one year
See section ERDF on major projects
Starting preparation of projects for the post-2013 programming period with JASPERS assistance in all concerned MS (qualitative indicator)
(+)On track.
JASPERS key priorities for 2012 were to support major projects for the 2007-2013 programming period with a view to maximising the efficient use of EU funds. First steps were taken to begin support for the 2014-2020 period but, in advance of an agreed budget, Regulation and priorities for operational programmes for the forthcoming period, very little activity was possible in relation to individual projects. The initial steps in 2012 concerned strategy and prioritisation;

28
Specific Objectives of "IPA / ISPA"
SPECIFIC OBJECTIVE 149 To assist candidate countries in building capacity for management of pre-accession assistance aiming to prepare for Structural Funds (for IPA regional component and IPA-cross border cooperation component).
Result indicators Latest known result Target (result) Full use of the financial resources available and projects (of 2007-2013 multi-annual operational programmes) fully operational Timely adoption of the Operational programme for Montenegro
7 multi-annual operational programmes adopted by the Commission, covering investments in "environment", "transport", and "regional competitiveness" amended in 2012 in order to add resources for 2012 and 2013. De-commitment of 2008 funds for 5 programmes. Operational Programme for Montenegro adopted on 7.12.2012
100% absorption of committed amount 70% of Major Projects decision adopted within one year By end 2012
Extension of multi-annual operational programmes to cover two additional years (2012-2013)
Financing agreements (triggering implementation of programmes) signed with all candidate countries for years 2007-2011; Adoption of 7 Commission Decisions for the extension of resources for 2012-2013
Signature of 7 amended Financing Agreements a to match the extension of 2007-2011 programmes with additional resources covering years 2012 and 2013
Decentralised implementation system under IPA component III in place and fully operational Progress with the accreditation process in Montenegro to be able to confer management powers
Conferral of (decentralised) management powers decided by the Commission November 2008 for HR, July 2009 for MK and July 2009 and January 2011 regarding the operating structures in candidate countries responsible for the implementation of the programmes. Amended Decision for the Environment, Transport and Regional Competitiveness Operational Programme for in TR.
Compliance with public procurement and sound financial management (as verified by follow-up audits and monitoring activities) Conferall Management Decision adopted by end of first quarter 2013
Signature of financing agreement with candidate countries for IPA-cross border cooperation (CBC) programmes with Member States for the remaining allocation of 2012 and 2013
10 Financing Agreements signed by DG to be forwarded to beneficiary countries for their signatures. Two financing Agreements will not be signed in the future (for the cross-border programmes Greece-Turkey and Cyprus-Turkey, which are not functional).
Signature of 10 financing agreements for IPA-CBC programmes for period 2012 and 2013 allocations.
Joint Management Structures in place for the cross-border programmes (Joint Technical Secretariat, Joint Monitoring Committee and National Authority, National Contact Point, Group of Auditors) fully operational
All structures already set-up and all of them operational. Difficulties in absorption of funds. N+3 will not be met for all programmes
achievement of the initial objectives set in the IPA cross-border programmes under shared management system (which is very similar to the ERDF cross-border management system)
SPECIFIC OBJECTIVE 2
To assist candidate countries to develop pipeline of mature projects to implement the strategy/priorities agreed in the multi-annual development programmes A. Enhancing transport infrastructure, in particular interconnection and interoperability with trans-European networks; B. Improvement of environment infrastructure, to promote compliance with the EU environment acquis, particularly waste management, water supply and urban waste water; C. Enhancing regional competitiveness and productive environment to achieve social and economic development and creation of sustainable employment.
Result indicators Latest known result50 Target (result) 51
Rail sector
49 The formulation of the indicators and related targets under Specific Objective n°1 was updated in the frame of the Management Plan 2013 in order to make the indicators more measurable and target(s) more quantified. Reporting on latest results was adjusted accordingly. 50 The first set of projects is still under implementation, it is not yet possible to report results at this stage. 51The target results presented in the table are provided until 2014.

29
Croatia (IPA transport):
increased average train speed on the corridor X
70 km/h 103 km/h (by 2014)
Turkey (IPA transport):
Completion high speed rail line Ankara/Istanbul
0 56 km additional (by 2014)
Road sector
Former Yugoslav Republic of Macedonia:
Km of new motorway completed 0 28.2 km (by 2014) 52
Environment
Croatia (IPA environment):
population served by the new waste management centres
0 (baseline value 2007) 975,5 thousand (by 2014)
population served by the waste water treatment plants
0 (baseline value 2007) 165 thousand (direct and indirect effect) (by 2014)
Turkey (IPA environment):
number of municipalities benefiting from drinking water network services;
3,159 (baseline value 2004) 3,163 (by 2014)
number of municipalities benefiting from improved wastewater services;
319 (baseline value 2004) 328 (by 2014)
additional population served by drinking water projects;
0 (baseline value 2004) 1.5 million (by 2014)
additional population benefiting from improved wastewater services;
0 (baseline value 2004)
2 million (by 2014)
additional population receiving integrated solid waste management systems
0 (baseline value 2004) 3.9 million (by 2014)
Former Yugoslav Republic of Macedonia
population served by waste water treatment plant
0 (baseline value 2007) 167 thousand P.E. (designed capacity by 2014)
Regional competitiveness:
Croatia:
number of implemented projects for business related infrastructure development
0 30 (by 2014)
Turkey:
Number of SMEs benefiting from shared service facilities established or supported under the IPA funded Regional Competitiveness programme
0 1.1 thousand (additional by 2014)
Number of new enterprises established industrial sites
0 730 (additional by 2014)
IPA-cross border programmes: Programme "Slovenia-Croatia":
Number of projects developing joint use of infrastructure
17
5
Number of projects encouraging and improving the joint protection and management of the environment
18
40
Programme "Bulgaria-Serbia": Assistance for project preparation – Feasibility studies
0
10
Assistance for project preparation – Preliminary and detailed design work
0 7
52 The original target values had to be increased in order to be in line with the values in the Commission decision, taken in 2011.
30
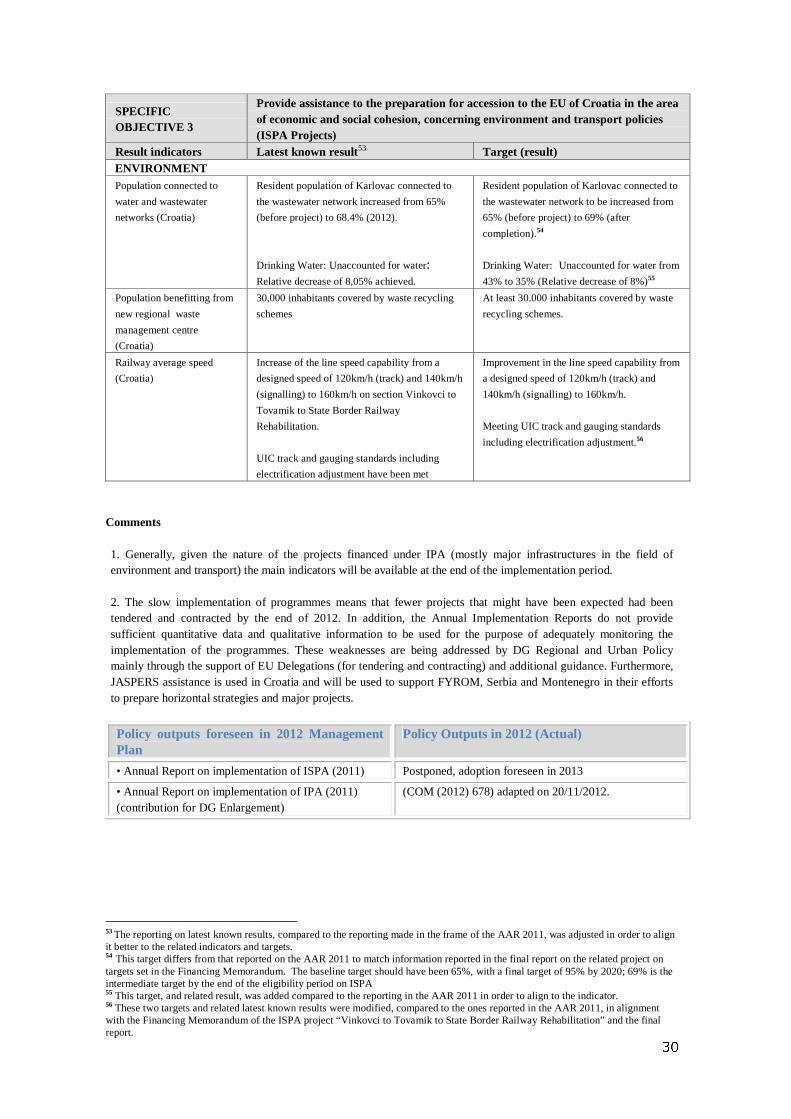
SPECIFIC OBJECTIVE 3
Provide assistance to the preparation for accession to the EU of Croatia in the area of economic and social cohesion, concerning environment and transport policies (ISPA Projects)
Result indicators Latest known result53 Target (result) ENVIRONMENT
Population connected to
water and wastewater
networks (Croatia)
Resident population of Karlovac connected to
the wastewater network increased from 65%
(before project) to 68.4% (2012).
Drinking Water: Unaccounted for water: Relative decrease of 8,05% achieved.
Resident population of Karlovac connected to
the wastewater network to be increased from
65% (before project) to 69% (after
completion).54
Drinking Water: Unaccounted for water from
43% to 35% (Relative decrease of 8%)55
Population benefitting from
new regional waste
management centre
(Croatia)
30,000 inhabitants covered by waste recycling
schemes
At least 30.000 inhabitants covered by waste
recycling schemes.
Railway average speed
(Croatia)
Increase of the line speed capability from a
designed speed of 120km/h (track) and 140km/h
(signalling) to 160km/h on section Vinkovci to
Tovamik to State Border Railway
Rehabilitation.
UIC track and gauging standards including
electrification adjustment have been met
Improvement in the line speed capability from
a designed speed of 120km/h (track) and
140km/h (signalling) to 160km/h.
Meeting UIC track and gauging standards
including electrification adjustment.56
Comments
1. Generally, given the nature of the projects financed under IPA (mostly major infrastructures in the field of environment and transport) the main indicators will be available at the end of the implementation period.
2. The slow implementation of programmes means that fewer projects that might have been expected had been tendered and contracted by the end of 2012. In addition, the Annual Implementation Reports do not provide sufficient quantitative data and qualitative information to be used for the purpose of adequately monitoring the implementation of the programmes. These weaknesses are being addressed by DG Regional and Urban Policy mainly through the support of EU Delegations (for tendering and contracting) and additional guidance. Furthermore, JASPERS assistance is used in Croatia and will be used to support FYROM, Serbia and Montenegro in their efforts to prepare horizontal strategies and major projects.
Policy outputs foreseen in 2012 Management Plan
Policy Outputs in 2012 (Actual)
• Annual Report on implementation of ISPA (2011) Postponed, adoption foreseen in 2013
• Annual Report on implementation of IPA (2011) (contribution for DG Enlargement)
(COM (2012) 678) adapted on 20/11/2012.
53 The reporting on latest known results, compared to the reporting made in the frame of the AAR 2011, was adjusted in order to align it better to the related indicators and targets. 54 This target differs from that reported on the AAR 2011 to match information reported in the final report on the related project on targets set in the Financing Memorandum. The baseline target should have been 65%, with a final target of 95% by 2020; 69% is the intermediate target by the end of the eligibility period on ISPA 55 This target, and related result, was added compared to the reporting in the AAR 2011 in order to align to the indicator. 56 These two targets and related latest known results were modified, compared to the ones reported in the AAR 2011, in alignment with the Financing Memorandum of the ISPA project “Vinkovci to Tovamik to State Border Railway Rehabilitation” and the final report.

31
IPA/ISPA Operational / Expenditure-Related Outputs in 2012 Management Plan, and actual results
Modifications of 7 IPA operational programmes for the last two years (2012-2013) of the programming period
Target: 80% adopted in less than 6 months (++)Achieved
IPA All 7 amendments to operational programmes (TR, HR, fYROM) were adopted by the final deadline of 2012. In addition, the operational programme for Montenegro was adopted in December. 100% achieved within 10 months.
Assessment and approval of IPA major projects submitted in 2011
Target: 50% in less than one year (--)Not achieved.
The 7 IPA Major Projects adopted in 2012 were submitted in 2009 and 2010. 1 MP submitted in 2011 not yet adopted.
Closures of 3 ISPA projects in Croatia is expected to take place in 2012 and a 4th in 2013
Target: 3 ISPA projects closed in 2012 (+)Nearly achieved
2 TA projects closed in 2012; another 1 project is in the process of being closed.
Implementation of JASPERS in Croatia started in 2011 and plans to launch in the other Candidate Countries in 2012.
(++)Achieved
The implementation of JASPERS was negotiated in 2012 in FYROM, Montenegro and Serbia, to be launched in 2013.
Specific Objectives of the "EU Solidarity Fund" (EUSF)
SPECIFIC OBJECTIVE
To grant assistance to Member States or countries negotiating their accession to the EU in the event of a major natural disaster with serious repercussions on living conditions, the natural environment or the economy for the financing of emergency operations undertaken by the public authorities in support of the affected population
Result indicators Latest known result Target (result) Number of population helped in overcoming a crisis situation where their living conditions have been affected
Inhabitants helped by the EUSF interventions in 2012: of grants for "regional disasters" of 2011 to: IT (for 2 cases), ES for recovery measures in the areas of basic infrastructures mainly for transport (road, rail) and water management (securing of flood protection constructions), energy, cleaning up operations. The combination of these measures covers 100% of the affected population. In terms of numbers, a cumulated total of over 1.14 million people were directly affected in the two beneficiary countries of 2012 (Italy and in Spain).
57
100% of population affected and eligible under the EUSF Regulation 58 upon the Member States' request
Size of disaster-stricken area where rehabilitation has been assisted
Aid available for 100% of affected areas (choice of supported operations up to the beneficiary state)
100% of areas affected by the disaster and eligible under the EUSF Regulation upon the Member States' request
Comments:
1 Two result indicators have been chosen to measure the direct impact of EUSF interventions on population and territories affected by major natural disasters: the number and percentage of population helped in overcoming a crisis situation, and the percentage of the disaster-stricken area assisted through rehabilitation.
2. In 2012, payment of grants for "regional disasters" of 2011 were made to Italy (for two cases: Veneto & Liguria & Tuscany flooding), and Spain (Lorca earthquake) for recovery measures in the areas of basic infrastructures mainly for transport (road, rail) and water management (securing of flood protection constructions), energy, cleaning up operations. In 2012, there was only one major disaster relating to the earthquake in the area of Emilia-Romagna (Italy). The application from Italy for this disaster was accepted and the Commission decided to grant financial aid of over EUR 670 million to Italy. Once the amending budget procedure was completed and the implementation agreement with Italy is signed, the grant was paid out.
57 As described in the MS application files 58 Council Regulation (EC) No 2012/2002 of 11 November 2002 establishing the European Union Solidarity Fund

32
Policy outputs foreseen in 2012 Management Plan Policy Outputs in 2012 (Actual)
• Annual Report on the Solidarity Fund 2011 (COM(2012)523) adopted on 20/9/2012
• Possibly presentation of a legislative proposal to amend the Solidarity fund Regulation (to be decided)
Postponed to 2013
EUSF Operational / Expenditure-Related Outputs in 2012 Management Plan, and actual results
Decision of Solidarity Fund applications
Follow-up the Management Plan 2012: Two applications received during the second half of 2011 (IT – Veneto flooding and ES – Lorca earthquake) were decided in November 2011. Following the adoption of the amending budget by Parliament and the Council, grants could be paid out early in 2012. In the case of the Cyprus naval base explosion of July 2011 – a disaster of non-natural origin - the Cypriot application was rejected. In the course of 2012, 7 applications were received: IT "snow and frost" was rejected, ES "Malaga fires" was withdrawn by the MS, IT "Emilia-Romagna earthquake" accepted and paid, while a decision remains pending for four cases - IT "severe weather conditions", ES "Valencia forest fires", ES "Canary Island fires", and RO "drought".
Monitoring visits to beneficiary countries for 2011 cases (PL, SK, CZ, HR, SI, IT, ES).
Target: At least 7 (+) Achieved except in Spain.
In total, 5 missions were undertaken to 6 countries (PL, SK, CZ, HR/SI and IT).
Closure of EUSF operations (DE "Kyrill", IT "Abruzzo", FR "Dean", FR "Klaus", SI "flooding").
2 out of 5 named operations closed (+ -)
FR" storm Dean 2007" and SI "floods 2007" as indicated above had been closed; in addition, 2 older operations were closed: RO "spring floods 2005" and ES "Prestige 2003".

33
ANNEX 7: FOLLOW-UP OF THE 2012 OPERATIONAL PRIORITIES AS DEFINED IN THE MANAGEMENT PLAN 2012
Priority
achieved/achieved
with actions to be
continued
Priority nearly
achieved /
nearly achieved
with actions to
be continued/
on track
Priority
partially
achieved
/partially
achieved
with actions
to be
continued
/modified
Priority not
achieved but
some progress
recorded
/postponed
Priority not
launched / not
achieved
Priority to be
reported in
AAR 2013
TOTAL
(++) (+) (+/-) (-) (--) (n.a.)
14.5 10.5 10.5 1.5 1 1 39
Multiannual priority 1: To achieve the sound and efficient use of Structural Funds / Pre-accession Funds to channel investments for growth and jobs in turbulent time of recession and debt crisis59
1.1 To monitor and facilitate the timely and effective implementation of the agreed programmes in partnership with the Member States and the Regions as well as with the candidate countries
(++) Achieved, with actions to be continued
The implementation of the programmes was continuously and regularly monitored in a timely and effective manner via technical meetings, programme monitoring committee, workshops, seminars, thematic networks, conferences and regular dialogues with Member States' Managing and Certifying authorities. Targeted meetings were also held to discuss and closely monitor issues for programmes/countries experiencing more difficulties in implementation. Taking Greece as an example, the DG, in collaboration with the Task Force for Greece applied a concrete hands-on policy through frequent contacts, technical and political meetings in order to boost capacity and accelerate the implementation of Cohesion Policy 2007-2013 programmes. For Candidate countries, the efforts of the DG continued to focus on the preparation, selection of operations, pushing forward implementation and enhancing the capacity of implementing structures.
1.2 To quickly adopt the reprogramming of OP as a possible response to the economic and public debt crisis while contributing to a lasting effect on smart, sustainable and inclusive growth (Europe 2020 strategy), in line with the differentiated growth-friendly fiscal consolidation
(++) Achieved, with actions to be continued
In 2012, reprogramming continued with varying degrees across Member States and programmes. In 2012, Member States submitted 136 requests for programme modifications. DG Regional and Urban Policy approved 145 modifications, including 57 submitted before 2012. DG Regional and Urban Policy thoroughly assessed the adequacy of the proposals for programme modifications submitted by Member States and made efforts to adopt them timely. Modifications of programmes occurred in order to: adapt to the current socio-economic circumstances and budgetary restrictions while taking also into account the EU 2020 priorities (e.g. in Spain); concentrate resources on strategic priorities (e.g. in Italy); transfer funds from delayed priorities (e.g. in Romania); better correspond to new circumstances (e.g in United Kingdom); re-allocate priorities within the programmes (e.g. in Hungary) or transfer funds from underperforming programmes to better performing ones (e.g. in Slovakia). In Poland, the reprogramming was mainly limited to more technical adjustments within priority axes of OPs to better align them with the priorities of the EU2020 strategy. In the frame of the “Barroso Initiative”, some countries underwent important reprogramming exercises, such as Portugal, Italy and Slovakia and Greece.
1.3 To cooperate with Member States to close at least 95% of the 2000-2006 ERDF programmes and 55% of the 2000-2006 Cohesion fund projects including possible flat rate corrections for common systemic problems, and assess their results
(+/-) Partially achieved for ERDF and (++) achieved for CF with actions to be continued
In 2012, the DG made significant progress in closing the 2000-2006 ERDF programmes, with the exception of few programmes with pending issues, primarily regarding unfinished projects. The closure of Cohesion Fund projects had also considerably accelerated. This lead to:
� ERDF: a total of 66% programmes (250 out of a total of 379) were closed at the end 2012 and Commission proposals of closure were sent out for all but 6 programmes, meaning that the target of 95% was close to be reached.
� Cohesion Fund: a cumulative total of 53% of projects was closed (160 projects closed in 2012). Agreements being reached with Spain and Czech Republic on the implementation of financial corrections had contributed to unblock some situations and close a significant number of
59 Legend for the achievement of the priorities: (++) Achieved or achieved with actions to be continued (+) Nearly achieved or nearly achieved with actions to be continued or priority on track (+/-) partially achieved with actions to be continued or priority modified (-) priority not achieved but some progress recorded or priority postponed (--) Priority not launched / not achieved

34
projects.
1.4 To intensify the assistance on the ground to foster administrative capacity and good governance for the Structural Funds in Bulgaria, Greece, Romania.
(++) Achieved, with actions to be continued
In cooperation with other Commission services, the DG has undertaken considerable efforts to foster administrative capacity and good governance in these countries, despite the difficulties encountered on the ground. Example of targeted measures are: Romania: (1) intensive internal preparation on the launch of a Commission initiative on administrative capacity building and the set-up of an inter-DGs working group to monitor public procurement in collaboration with the national authorities; (2) Close monitoring of the implementation of the ‘Barroso initiative’ and of the simplification and capacity building measures foreseen in the Priority Action Plan to increase absorption; (3) drafting of an internal non-paper on administrative capacity on how to address capacity and governance weaknesses. Bulgaria: (1) Signature of the Memoranda of Understanding in January 2012 between Bulgaria, the EIB and the World Bank, aiming to assist Bulgaria in the planning and implementation of projects and increase their administrative capacity; (2) high quality trainings were given to Audit and Certifying Authorities, and training for over 3,000 employees of municipalities in EU projects management and public procurement. Greece: in very close collaboration with the Task Force Greece, regular meetings were held in order to achieve simplification of procedures and guidance to the administration dealing with the Structural Funds. In addition, in the frame of DG re-organisation, a competence centre dedicated to administrative capacity had been set up in the last quarter of 2012.
1.5 To encourage the Member States to accelerate the submission of the major project applications and to improve their quality. To agree on guidelines to deal with issues regarding the EU added-value of pending applications for major projects; to speed up the adoption of major projects by screening and clearing the backlog of applications pending for more than a year
(+/-) partially achieved, with actions to be continued
In 2012, the rate of submission of Major Projects increased with 169 applications received, while the rhythm of adoption could not be speeded up. 110 major projects were approved compared to 140 in 2011. At the end of 2012 more than 100 projects were still pending a decision with a delay of more than a year. The lower number of decisions was due to several factors: (1) new case law in state aid required changes in the notification process, (2) continuous problems of implementation of the environmental acquis in a number of countries, (3) maturity of a number of projects and (4) quality problems particularly for those projects already completed before application was made. In general, the quality of the applications submitted did not improve, leading to interruptions of a considerable number of projects during the year. For this reason, the DG had adopted in December 2012 a robust action plan to progress in this field. First effects were visible in December with over 20 decisions taken and blockages systematically reduced. Memorandi of understanding were initiated with DG Competition and DG Environment in order to speed up procedures and seek more efficiency.
1.6 To address the gaps in terms of knowledge and implementation capacity at Member State level and to use the new reporting requirements to better monitor the use of financial engineering instruments
(+) Nearly achieved, with actions to be continued
In order to address the gaps in terms of knowledge and implementation capacity at Member State level, seminars and workshops dedicated to Financial Instruments were organised for some Managing Authorities. Guidance and advice were also provided through follow up and technical meetings. 2012 was the first year of compulsory reporting on FIs by Member States in the frame of the Annual Implementation Reports. Consultations and guidance were provided to the MAs regarding these new reporting requirements. DG Regional and Urban Policy prepared a summary report (situation as of 31 December 2011) on the progress made in financing and implementing FEIs co-funded by Structural Funds in the programming period 2007-2013 on the basis of Member States’ reporting. . The report identifies the financial engineering instruments in place and its use in Member States. Some cases raise some concerns such as in Greece where, despite the important allocations to these funds, very little funding has reached the final beneficiaries.
1.7 To ensure an immediate implementation for the six concerned Member States of the 'top-up' of co-financing rates measures as well as the risk sharing instrument (loans or guarantees) upon approval of the necessary legislative changes to continue helping all Member States / candidate countries facing major difficulties
(++) Achieved
Implementation of the 'top-up' payments (increasing co-financing rates up to 95%) was made to operational programmes for the six concerned Member States, Greece, Ireland, Latvia, Portugal, Romania and Hungary In total, EUR 1.2 billion was paid out since the entry into force of Regulation (EU) No 1311/2011. Following negotiation by the Commission with the Council and European Parliament on the amendment of the General Regulation to open-up the possibility of creation of a new risk-sharing mechanism with ERDF and CF resources available to countries under EU/IMF adjustment programme, DG Regional and Urban Policy worked intensively to set up this new mechanism. However, in 2012 there were no requests from eligible MS to apply for this measure.
1.8 To monitor and reduce the risk of de-commitment, in particular at the end of 2013, for the Member States concerned by the cumulative effect of the n+2/n+3 rules
(+) On track, with actions to be continued
Risk of de-commitment was closely monitored throughout the year, through regular contacts, meetings and identification of problems related to programme implementation especially for those programmes which were falling behind in absorbing funds.
1.9 To assess the effectiveness of DG Regional and Urban Policy preventive mechanisms for sound financial management (capacity building, guidance and training), in particular for programmes in the Czech Republic and in Italy, while monitoring progress made in 2011 in Spain. Efficient and timely use of the interruption procedure as an impetus to improve the management and control systems, thereby reducing the errors (occurrence, rate) and the need for financial corrections.
(-) Not achieved for the first part of the priority, (+) on track for the second part with first encouraging results
In 2012, the DG pursued and further sharpened its policy of interruption/warning/ (pre-) suspension used as leverage to improve the management and control systems. First results were encouraging, although effects are still to be seen. In parallel, the DG continued assisting Member States by providing extensive guidance and trainings in order to strengthen the administrative capacity. Support was provided and several meetings/seminars were organised in order to improve the managing and control system in Czech Republic, Italy and Spain as well as in other Member States. However, much work is still needed.
� In Italy: support was provided within the framework of the Cohesion Action Plan and two task forces set up for two problematic regional programmes; a meeting with the audit authorities as well as a specific technical meeting on audit sampling was held;
� In Czech Republic: an action plan was prepared and submitted to Czech Republic with the main purpose of strengthening the quality if the MCS of the EUSF programmes and a public procurement seminar focusing on additional works was held. In addition, several meetings were held in the framework of the interruptions / remedial action plans in order to improve the managing and control system.
� In Spain: two seminars were organised, one focusing on different audit issues and on the preparation and results of the ACR, and one on the

35
revenue-generating projects
1.10 To be in a position to conclude in 2013 on the residual error rate for the 2000-2006 ERDF programmes following an audit of sample of closed programmes in order to eliminate any remaining irregular expenditure and to be able to conclude that there is low risk after closure.
(+/-) partially achieved – modified
The DGs concerned with Structural Funds decided not to perform additional audits to determine a residual error rate for the 2000-2006 ERDF programmes. In response to the Parliament's request to ensure legality and regularity when closing 2000-06 programmes and in agreement with the discharge Rapporteur, the DG is planning to report on the state of play of the closure process and on the rate of financial corrections imposed by the Commission to all Member States during the period and up to closure, in order to demonstrate its corrective capacity in the first quarter of 2013.
1.11 To rely more on better performing audit authorities - single audit approach – in order to focus resources on thematic audits and performance audits (Article 73 applied for a critical mass of audit authorities by end of 2012)
(+/-) partially achieved, with actions to be continued
In accordance with its audit strategy, the DG continued to review the work of the most risky audit authorities covering 96% of ERDF/CF allocations for 2007-13. Up to end 2012, the DG issued article 73 letters to formally rely on the audit work of 15 audit authorities. However, the concerned Audit Authorities received art 73 status covering 51 programmes, amounting to 17% of ERDF/CF allocations.
1.12 To obtain budgetary discharge for the years 2010 and 2011, by providing evidence to the Parliament and the Council of sound and efficient use of the funds.
(++) Achieved
Discharge 2010 was obtained. The analysis on errors and on actions undertaken by the DG to address risks was provided to the European Parliament and to the Council. Discharge 2011 is prepared with a DAS 2011 contradictory procedure, which led to a substantial reduction in the error rate for Regional policy compared to previous years.
Multiannual priority 2: To enhance the added-value and effectiveness of Cohesion policy 2.1 To further provide evidence on the results of Cohesion policy programmes 2007-2013, through the expert evaluation network and the reports against core indicators
(+/-) partially achieved, with actions to be continued
In 2012, the DG continued to invest in evaluation work, especially through the Expert Evaluation Network which submitted its final draft report in December 2012. Findings on the performance of Cohesion Policy up to the end of 2011 suggest that Member States achieved progress in the implementation of projects on the ground compared to 2010; however, there is still a substantial lack of implementation occurring in some countries. 2011 was the third year of reporting against the core indicators by Member States in their Annual Implementation Reports. Although reporting against core indicators is undertaken on a voluntary basis by Member States and the quality and reliability of data can still be improved, this reporting has become increasingly important in the context of the shift towards more results-oriented policies, particularly in the proposals for the future of the Cohesion Policy.
2.2 To start the preparation of the second Strategic Report, to be adopted by Commission early 2013 after having guided and supported Member States to send high quality contributions
(+) Nearly achieved
The preparation of the 2nd Strategic Report, due in 2013 started in 2012. Guidance on content and structure of the Strategic Report was provided to Member States and disseminated within the DG. The Strategic Report is drawn on the basis, inter alia, of the analysis of the strategic reports submitted by the Member States in 2012.
2.3 To publish and disseminate the 8th progress report on economic, social and territorial cohesion (-) Postponed to 2013
The publication of the 8th Progress Report is planned for the end of May 2013.
2.4 To communicate and diffuse the results and good practices of programmes, highlight individual projects at local/regional/national level and encourage Member States to do the same
(+) Nearly Achieved, with actions to be continued
The results and good practices of programmes were shared and promoted mainly within the INFORM network responsible for communicating ERDF and Cohesion Fund investments in the 27 Member States. The results of projects were also highlighted through the use of Twitter and other social media (e.g. Yammer). Moreover, all major projects are being added to the project data base on Inforegio website press releases are being prepared since the end of 2012.
In addition, the RegioStars awards and several conferences organised or co-organised by DG Regional and Urban Policy in 2012 represented occasions to promote good practices and share results. Among the most important events organised in 2012: the RegioStars 2013 Award Ceremony (400 participants) and the Open Days- the European Week of Regions and Cities (6000 participants).
Multiannual priority 3: To prepare the implementation of Cohesion policy post-2013 in the integrated vision for the Europe 2020
3.1 To work towards the adoption in 2012 of the legislative proposals for EU Cohesion Policy 2014-2020 taking into account the new role of the European Parliament; to adopt the Communication on the Common Strategic Framework and to draft the relevant delegated and implementing acts also in 2012
(+) Nearly achieved
DG Regional and Urban Policy has cooperated closely with the co-legislators to advance as far as possible with the negotiations on the legislative package for 2014-2020. A first provisional political agreement was reached by the co-legislators in December 2012 on provisions related to programming.
In order to guide Member States and Regions with their preparations for the next programming period, "Common Strategic Framework" (CSF)60 will provide strategic direction on how to achieve an integrated development approach using the European Structural and Investment Funds (ESIF) coordinated with other Union policies and instruments in order to achieve the objectives and targets of the Europe 2020 strategy. In September 2012, the Commission modified its proposed Common Provisions Regulation (CPR) with a view to including the CSF as an Annex.
60 The CSF will be adopted in final form only once the legislative package on Cohesion Policy Funds for the next Multiannual Financial Framework has been agreed by the European Parliament and the Council.

36
The preparation of delegated and implementing acts has started with priority given to legislation relevant for the programming phase and the set-up of management and control systems which need to be functional at the start of implementation.
3.2 To develop all country negotiation mandates in a harmonized way across the DG on the basis of the CSF Communication, the country profiles, input from the Thematic Task Forces and taking account of the 2012 country-specific recommendations under the European Semester.
(+-)Modified
This priority action has been modified and will be carried out in 2013, given the fact that the agreement on the Multi Annual Financial Framework and decision on legislative package were still pending. The country negotiation mandates are replaced by Commission observations on the programming documents submitted by the Member States and are expected be adopted by the Commission in the 2nd half of 2013. In addition, in 2012, DG Regional and Urban Policy together with other Commission services prepared and transmitted to all Member States the so called position papers, setting the Commission’s position on the most relevant priorities each Member State should focus on and starting the preparatory negotiations in all Member States.
3.3 To produce draft guidance documents addressed to both external and internal readers on all key issues regarding the future framework for an enhanced capacity building (performance framework, ex-ante conditionality, financial instruments, and management systems)
(+/-) partially achieved; with actions to be continued
A first set of guidance documents was produced with priority given to those related to the programming process. Preparation of guidance documents, in cooperation with DGs Employment, Inclusion and Social Affairs, Agriculture and Rural Development and Maritime Affairs and Fisheries, is continuing in 2013. Preparation of explanatory documents and information sheets in view of supporting the negotiations for the 2014-2020 programming period, have also been prepared. The preparation of internal documents will continue and be completed in 2013, subject to the progress and finalisation of the regulatory framework.
3.4 To set-up framework contracts and an AMI list containing country and sector experts who can be contracted for advice and assistance during the preparation and negotiation phases.
(+) nearly achieved
The setting up of framework contracts was started with one call for Multiple Framework Service contracts ("cascade" system) for the provision of support to Academic Editing, Training, Workshops and Seminars on Cohesion Policy 2014-2020. This was launched in September 2012, and a second call for studies will be launched before summer 2013. The list of experts (CEI-AMI list) has been set up. From this, DG Regional and Urban Policy may select one or several experts to perform specific tasks supporting the preparation of negotiations 2014-2020 as required. DG Regional and Urban Policy has signed 65 contracts in 2012.
3.5 To steer in 2012 the preparation of partnership agreements and operational programmes together with the Member States and regions so that they are submitted in 2013. Notably through the provision of policy guidance and thematic support in the form of methodological guides (e.g. smart growth, social innovation, environmental issues)
(+/-) partially achieved
Although not yet formally launched – because decision on the legislative package is still pending- the preparation of partnership agreements and operational programmes with the Member States and regions was started through the provision of guidance and thematic support on a variety of issues, such as smart growth, social innovation, environmental issues, discussions in the frame of the annual meetings and transmission of Commission position papers as regards 2014-2020 priorities in each country to all Member States by end of 2012.
3.6 To negotiate and adopt already in 2013 most of the partnership contracts and operational programmes including inter alia review of compliance with ex-ante conditionality, concentration on thematic priorities and definition of performance frameworks
(n.a.) To be reported in AAR 2013
Agreement on the Multi Annual Financial Framework and decision on legislative package still pending
3.7 To prepare the launching of innovative actions in the field of urban development (+/-) partially achieved
In 2012 the draft of delegating act has been prepared presenting various options for implementation of innovative actions. It has been presented at the Council SAWP. Further analysis of implementing modalities respecting staff constraints will continue in 2013.
3.8 To define the specifications for the e-cohesion policy project (and the successor of SFC2007) to ensure its readiness for 2014 with a clear identification of its impact on the reduction of the administrative burden
(+) Nearly achieved, although with actions being delayed
The e-Cohesion project has been endorsed by the Council and European Parliament as part of the negotiations on 2014-2020 regulations. However, the date of its implementation is still under discussion between the Council and European Parliament. Several meetings to raise awareness were held with Member States’ administrations in order to identify problems they may face during the implementation of this policy project and to help them to find solutions. These meetings have contributed to the exchange of experiences and good practices among Member States.
3.9 To implement the training programmes developed to support all DG Regional and Urban Policy staff involved in the preparation and implementation of the negotiations, in particular through the provision of thematic training linked to EU 2020 objectives for GU desks
(++) Achieved, with actions to continue
A training plan on the 2014-2020 legislative package has been established and the first training sessions to cover programming and ex-ante conditionality have been scheduled. Priority has been given to training related to the programming process. The training project called the “Negotiator's Training Initiative – Ready for 2014-2020”, which was conceived in 2011, continued jointly with DG Employment and Social Affairs and Inclusion throughout 2012.
3.10 To communicate the new framework on the ground to the potential beneficiaries and stakeholders as well as the EU citizen
(+/-) partially achieved with actions to continue
As the new legal framework was not yet adopted in 2012, the main work in this area lies still ahead in 2013. On the Inforegio website, a dedicated section on the new regulation has been created and a number of articles were also published in the Panorama magazine. In addition, the Commission proposal of the new framework was communicated and discussed with the Member States, with also the participation of the DG top and senior management. In addition, the INFORM network members are kept up-to date on the state of play of the negotiations in the Council.
Multiannual priority 4. Coordinating specific EU territorial policies 4.1 To adopt the Communication on the new strategy for the Outermost regions and to organise the second edition (++) Achieved

37
of the Forum for Outermost Europe
The Communication ‘The outermost regions of the European Union: towards a partnership for smart, sustainable and inclusive growth’61 was adopted in June 2012 setting out the basis for a renewed EU strategy in favour of the Outermost regions and explaining how the Commission intends to work in partnership with them to implement Europe 2020 strategies in their territories. In July, the 2nd Forum for Outermost Europe "Together towards Europe 2020" was organised in Brussels.
4.2 To analyse and prepare the opinion of the Commission as regards the possible decision of the Council to grant the status of outermost region to the French territory of Mayotte; to implement the related pilot project
(++) Achieved
In 2012, the Commission's opinion62 was adopted upon the request of French authorities to amend the status from Overseas Territory to Outermost Region of Mayotte with regard to the European Union and the corresponding European Council Decision of 11 July 2012. In 2012, a new preparatory action for Mayotte was also implemented.
4.3 To further coordinate the implementation of macro-regional strategies and to assess the progress of the strategy for the Danube Region
(++) Achieved, with actions to be continued
The DG has pursued the coordination of two macro-regional strategies, now in their implementation phase: the EU Strategy for the Baltic Sea Region and the EU Strategy for the Danube Region. The 1st Annual Forum of the EU Strategy for the Danube Region took place in November provided the opportunity to take stock of its developments. First implementation report on Danube strategy and Commission Report on the evaluation of the broader concept of macroregional strategies are expected in the first half of 2013.
4.4 To develop and coordinate the EC activities on Territorial cohesion and Urban matters, in particular through the (merged) Interservice Group on Territorial Cohesion and Urban Development.
(++) Achieved
A new Inter-service Group on urban development and territorial cohesion has been set up, following the merge of two previous ISGs. A new mandate will be formulated so the group may be a platform for discussing key EU programmes and initiatives which impact on urban development and/or are targeted on cities.
4.5 To open accession negotiations with Iceland and to monitor progress made by Croatia towards meeting the commitments and requirements arising from the accession negotiations
(++) Achieved
Negotiations on chapter 22 (Regional policy and co-ordination of structural instruments) were opened in December 2012 with Iceland and were already finalised with Croatia in July 2011. After accession Croatia will benefit from Cohesion Policy already in the 2007-2013 programming period. The ongoing IPA programmes will be transformed into a multi-annual ERDF/CF programmes covering the full period. IPA assistance will be incorporated into these programmes and implemented with Structural Funds rules.
In Croatia, the efforts continued to focus on the preparation of the future Management and control system, having mature and high-quality projects on the pipeline, and in strengthening the capacity of structures for the management of future ESI funds.
4.6 To coordinate, facilitate and monitor activities of the Northern Ireland Task Force (++) Achieved
The coordination and monitoring of activities of the Northern Ireland Task Force were carried out by organising two meetings.
Multiannual priority 5: To improve efficiency and quality of key internal processes 5.1 To implement an HR forward planning process, based inter alia on an inventory of existing competences, and professional development programmes
(+) Nearly achieved with actions to be continued in 2013 and following years
The DG has developed in 2012 and adopted early 2013 a HR Rolling Plan in 2012 which will be fully implemented in 2013 and following years. The inventory of existing competencies has been drawn on the basis of an internal survey on skills and competencies organised in 2012 as part of the broader change process within the DG. The HR Rolling Plan is a work in progress document which will progressively integrate new parameters: efficiency gains from the various initiatives of the Change Regio process, results of workload analyses, external staff allocations, etc. The professional development program has been created and will be implemented in 2013 and following years.
5.2 To identify new outsourcing opportunities and to launch the selection procedure as necessary (--) Not achieved, with actions to be continued in 2013 and following years
This action will be pursued in the frame of the broader Change Regio process and addressed in parallel with the reflection on shared services and strategic programming of Technical Assistance.
5.3 To move towards a specialisation of roles and to reallocate the tasks in the area of CF projects closure and drafting of legal texts and to reflect on other activities as necessary
(+) Nearly achieved, with action to be continued in 2013 and following years
In the context of the DG reorganisation, a new unit on the closure of Cohesion Fund projects (2000-06 programming period) has been created on summer 2012. Further specialisation of roles, reallocation of tasks and/or streamlining of working methods will be explored in 2013 and following years in the frame of Change Regio Process.
5.4 To streamline internal procedures and optimise IT systems both for short term adjustments (quick win) and further reengineering for the future tasks
(+-) Partially achieved, with actions to be continued
In 2012, the DG had revised and reengineered the processes for warnings interruptions and (pre-) suspensions of interim payments, leading to
61 COM(2012) 287 final 62 C(2012)3506 final

38
efficiency gain and improved monitoring and follow-up. The DG has clarified the role of the business process team (BPT) with a view to improve the description if business processes within the DG. The BPT has reviewed the interruption/suspension process and has analysed and described the first two decision all processes for 2014/20 (the adoption of the Partnership agreements and of the operational programmes) to be implemented in the IT systems SFC 2014 and WAVE. It has also identified all the other 2014/20 business processes and prepared a calendar/action plan of the detailed analysis and description phase.
5.5 To address knowledge management and sharing within DG Regional and Urban Policy (++) Fully achieved, with actions to be continued in 2013 - 2014
As part of Change Regio process, a strategy to develop knowledge management in the DG has been created. The vision, roadmap as well as the governance structure and the tools of the knowledge management were decided by senior management by end of 2012. The first two phases – prototype and production for some key area should be finished before mid-2014.
5.6 To revise the tools and procedures for the monitoring of priorities at DG level (dashboard) (++) Fully achieved
A new approach to follow up on key priorities of the Management plan has been created and a monitoring tool has been developed to support this, with two pilot exercises performed in the second half of 2012. The monitoring was further enhanced in the beginning of 2013 and enlarged to cover all operational priorities.
5.7 To increase DG Regional and Urban Policy's reactive capacity in case of crisis by setting-up ad-hoc procedures
(+) Nearly achieved
In 2012, the DG proved its responsive capacity to the crisis by using instruments such as: (i) reprogramming funds to support the most pressing needs and reinforce certain areas of interventions; (ii) establishment of joint Commission – Member States task forces to assist particularly problematic programmes (i.e. for two Italian regional programmes ‘Campania’ and ‘Sicily’); (iii) the creation of the "Competence Centre Administrative Capacity Building" was created to support DG's efforts and priority to promote administrative capacity building.

39
ANNEX 8: MEMBER STATES / DG REGIONAL AND URBAN POLICY AUDIT OPINIONS 2012

40
ANNEX 9: ERROR RATES 2012

41
ANNEX 10: ANNUAL SUMMARIES COVERING 2012
MS
Compliance with minimum requirements of
FR?
Has the template in the annex of
the guidance note been followed?
Has the MS used the suggested
declaration on the overall level of the assurance (point 2.9
in the guidance note*)?
Has the MS provided an overall
analysis covering both parts of the AS as regards structural actions for the year
in question (point 2.6.3 guidance note*)?
Action by the Commission (March
2013)
Austria Non-compliant Yes No No Returned for corrections
Bulgaria Compliant Yes Yes Yes Accepted
Belgium Compliant Yes No No Accepted with follow-up
Czech Republic
Compliant Yes No Yes Accepted with follow-up
Cyprus Compliant Yes Yes Yes Accepted
Denmark Compliant Yes Yes Yes Accepted
Estonia Compliant Yes Yes Yes Accepted
Finland Compliant Yes Yes Yes Accepted
France Compliant Yes No No Accepted with follow-up
Germany Compliant No No No Accepted with follow-up
Greece Compliant Yes No No Accepted with follow-up
Ireland Compliant Yes No No Accepted with follow-up
Italy Compliant Yes No No Accepted with follow-up
Latvia Compliant Yes No Yes Accepted
Lithuania Compliant Yes No Yes Accepted
Luxembourg Compliant Yes No No Accepted
Hungary Compliant Yes No Yes Accepted
Malta Compliant Yes Yes Yes Accepted
Netherlands Compliant Yes No Yes Accepted
Poland Compliant Yes No Yes Accepted
Portugal Compliant Yes Yes Yes Accepted
Romania Compliant Yes Yes Yes Accepted with follow-up
Slovenia Non-compliant Yes No Yes Returned for corrections
Slovakia Compliant Yes Yes Yes Accepted with follow-up
Spain Compliant Yes Yes Yes Accepted
Sweden Compliant Yes No No Accepted
United Kingdom
Compliant Yes Yes Yes Accepted with follow-up
27 25 Compliant 26 Yes 11 Yes 18 Yes 15 Accepted
* Guidance note on annual summaries in relation to Structural Funds and EFF (COCOF 07/0063/09)

42
ANNEX 11: 2011 RESERVATIONS CARRIED OVER TO AAR 2012
The list of 2007-2013 programmes still affected by AAR 2011 reservations at end of 2012 and/or beginning of 2013 are:
COUNTRY OP CCI OP abbreviated title Still outstanding end of 2012
Completely solved
beginning 2013
Carried over in AAR 2012
CZECH REP 2007CZ161PO004 Enterprise and innovation x x 2007CZ161PO008 North West x x
2007CZ161PO009 ROP Central Bohemia x x CZECH REP Total 3 0 3
ESTONIA 2007EE161PO002 Development of Living Environment x x ESTONIA Total 1 0 1
ETC 2007CB163PO004 Austria-Bavaria x x ETC Total 1 0 1
GERMANY 2007DE162PO002 Saarland x √ GERMANY Total 1 1 0
GREECE 2007GR161PO001 Competitiveness * x √ 2007GR161PO002 Digital Convergence x √ 2007GR161PO005 Environment x √ 2007GR161PO006 Attica x √ 2007GR161PO007 Western Greece, Peloponnesus, Ionian Islands x √ 2007GR161PO008 Macedonia – Thrace x √ 2007GR16UPO001 Thessaly, Continental Greece, Epirus x √ 2007GR16UPO002 Crete & Aegean Islands x √ GREECE Total 8 8 0
HUNGARY 2007HU161PO002 Environment and Energy** x √ 2007HU161PO001 Economic Development x √ 2007HU161PO003 West Pannon x √ 2007HU161PO004 South Great Plain x √ 2007HU161PO005 Central Transdanubia x √ 2007HU161PO006 North Hungary x √ 2007HU161PO007 Transport** x √ 2007HU161PO008 Social Infrastructure** x √ 2007HU161PO009 North Great Plain x √ 2007HU161PO010 Implementation x √ 2007HU161PO011 South Transdanubia x √ 2007HU162PO001 Central Hungary x √ 2007HU16UPO001 Electronic Public Administration x √ HUNGARY Total 13 13 0
ITALY 2007IT161PO001 Attrattori culturali, naturali e turismo x x 2007IT161PO008 Calabria x x 2007IT161PO011 Sicily x √ ITALY Total 3 1 2
LATVIA 2007LV161PO001 Entrepreneurship and Innovations x √ LATVIA Total 1 1 0
ROMANIA 2007RO161PO001 Regional Operational Programme x x 2007RO161PO002 Increase of Economic Competitiveness x x 2007RO161PO003 Transport x x ROMANIA Total 3 0 3
SPAIN 2007ES161PO001 Murcia x x 2007ES161PO005 Galicia x x 2007ES161PO006 Extremadura x x 2007ES161PO008 Andalucia x x 2007ES162PO002 Pais Vasco x x 2007ES162PO006 Cataluña x x 2007ES162PO009 Castilla y Leon x x 2007ES162PO010 Comunidad Valenciana x x 2007ES162PO011 Canarias x x 2007ES16UPO001 Investigacion, desarrollo e innovacion x x 2007ES16UPO002 Asistencia Técnica x x SPAIN Total 11 0 11
UK 2007UK162PO003 Northern Ireland x X 0 UK Total 1 1 0 Grand Total 46 25 21
* A new partial reservation was issued for this programme in the frame of AAR 2012. ** Full reservation was issued for these programmes based on new audit findings
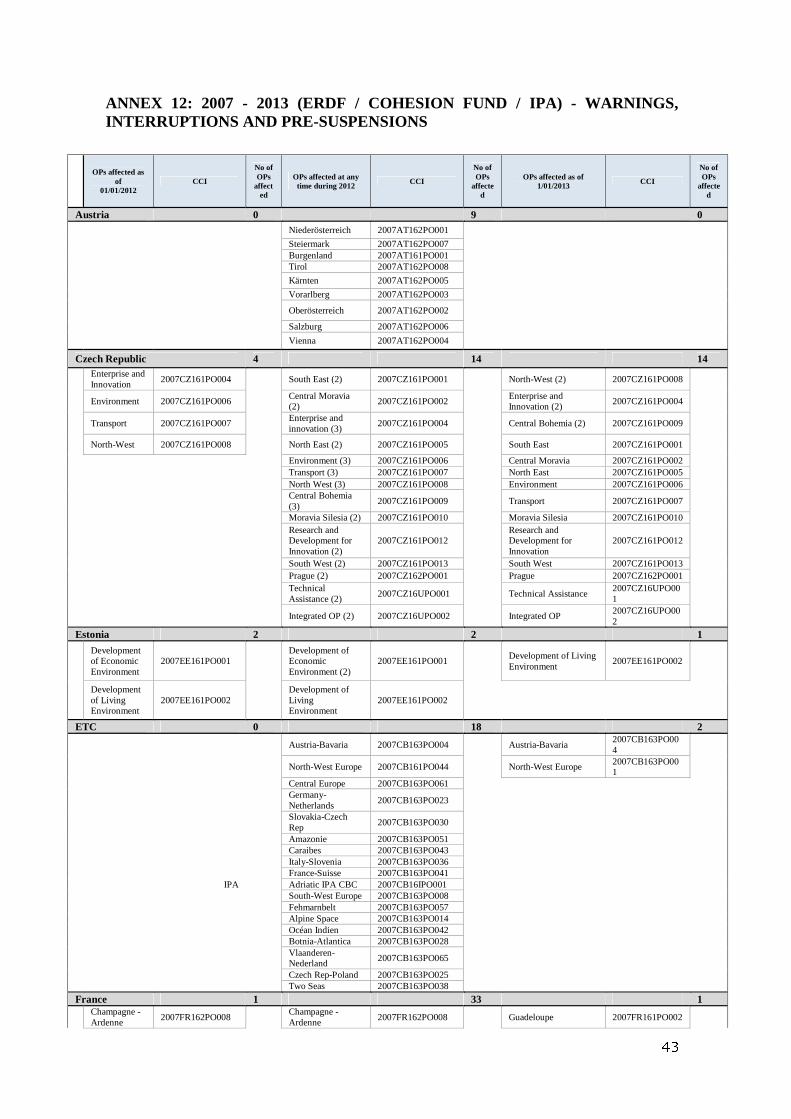
43
ANNEX 12: 2007 - 2013 (ERDF / COHESION FUND / IPA) - WARNINGS, INTERRUPTIONS AND PRE-SUSPENSIONS
OPs affected as of
01/01/2012 CCI
No of OPs
affected
OPs affected at any time during 2012 CCI
No of OPs
affected
OPs affected as of 1/01/2013 CCI
No of OPs
affected
Austria 0 9 0
Niederösterreich 2007AT162PO001
Steiermark 2007AT162PO007
Burgenland 2007AT161PO001
Tirol 2007AT162PO008
Kärnten 2007AT162PO005
Vorarlberg 2007AT162PO003
Oberösterreich 2007AT162PO002
Salzburg 2007AT162PO006
Vienna 2007AT162PO004
Czech Republic 4 14 14
Enterprise and Innovation
2007CZ161PO004
South East (2) 2007CZ161PO001
North-West (2) 2007CZ161PO008
Environment 2007CZ161PO006
Central Moravia (2)
2007CZ161PO002
Enterprise and Innovation (2)
2007CZ161PO004
Transport 2007CZ161PO007
Enterprise and innovation (3)
2007CZ161PO004
Central Bohemia (2) 2007CZ161PO009
North-West 2007CZ161PO008
North East (2) 2007CZ161PO005
South East 2007CZ161PO001
Environment (3) 2007CZ161PO006
Central Moravia 2007CZ161PO002
Transport (3) 2007CZ161PO007
North East 2007CZ161PO005
North West (3) 2007CZ161PO008
Environment 2007CZ161PO006
Central Bohemia (3)
2007CZ161PO009
Transport 2007CZ161PO007
Moravia Silesia (2) 2007CZ161PO010
Moravia Silesia 2007CZ161PO010
Research and Development for Innovation (2)
2007CZ161PO012
Research and Development for Innovation
2007CZ161PO012
South West (2) 2007CZ161PO013
South West 2007CZ161PO013
Prague (2) 2007CZ162PO001
Prague 2007CZ162PO001
Technical Assistance (2)
2007CZ16UPO001
Technical Assistance 2007CZ16UPO001
Integrated OP (2) 2007CZ16UPO002
Integrated OP
2007CZ16UPO002
Estonia 2 2 1
Development of Economic Environment
2007EE161PO001
Development of Economic Environment (2)
2007EE161PO001
Development of Living Environment
2007EE161PO002
Development of Living Environment
2007EE161PO002
Development of Living Environment
2007EE161PO002
ETC 0 18 2
Austria-Bavaria 2007CB163PO004
Austria-Bavaria
2007CB163PO004
North-West Europe 2007CB161PO044
North-West Europe
2007CB163PO001
Central Europe 2007CB163PO061
Germany-Netherlands
2007CB163PO023
Slovakia-Czech Rep
2007CB163PO030
Amazonie 2007CB163PO051
Caraibes 2007CB163PO043
Italy-Slovenia 2007CB163PO036
France-Suisse 2007CB163PO041
IPA
Adriatic IPA CBC 2007CB16IPO001
South-West Europe 2007CB163PO008
Fehmarnbelt 2007CB163PO057
Alpine Space 2007CB163PO014
Océan Indien 2007CB163PO042
Botnia-Atlantica 2007CB163PO028
Vlaanderen-Nederland
2007CB163PO065
Czech Rep-Poland 2007CB163PO025
Two Seas 2007CB163PO038
France 1 33 1
Champagne -Ardenne
2007FR162PO008
Champagne -Ardenne
2007FR162PO008
Guadeloupe 2007FR161PO002

44
Alpes multiregional 2007FR162PO023
Lorraine 2007FR162PO015
Bretagne 2007FR162PO007
Languedoc-Roussillon
2007FR162PO013
Limousin 2007FR162PO014
Picardie 2007FR162PO018
Bourgogne 2007FR162PO006
Guadeloupe 2007FR161PO002
Corsica 2007FR162PO009
Champagne-Ardenne
2007FR162PO008
Poitou-Charentes 2007FR162PO019
Aquitaine 2007FR162PO001
PACA 2007FR162PO020
Pays de la Loire 2007FR162PO016
Midi-Pyrénées 2007FR162PO021
Centre 2007FR162PO002
Massif-Central 2007FR162PO025
Auvergne 2007FR162PO004
Franche-Comté 2007FR162PO010
Europ'Act 2007FR16UPO001
Basse Normandie 2007FR162PO005
Loire 2007FR162PO024
Rhône-Alpes 2007FR162PO022
Réunion 2007FR161PO004
Martinique 2007FR161PO003
Haute-Normandie 2007FR162PO011
NPdC 2007FR162PO017
Alsace 2007FR162PO003
Ile-de-France 2007FR162PO012
Guyane 2007FR161PO001
Rhone pluriregional
2007FR162PO026
Guadeloupe 2007FR161PO002
Germany 6 9 4
Baden-Württemberg
2007DE162PO008
Baden-Württemberg
2007DE162PO008
Saarland 2007DE162PO002
Saarland 2007DE162PO002
Saarland 2007DE162PO002
Brandenburg 2007DE161PO002
Brandenburg 2007DE161PO002
Brandenburg (2) 2007DE161PO002
Thüringen 2007DE161PO001
Thüringen 2007DE161PO001
Thüringen (2) 2007DE161PO001
Niedersachsen 2007DE162PO010
Berlin 2007DE162PO004
Berlin 2007DE162PO004
Nordrhein-Westfalen
2007DE162PO007
Nordrhein-Westfalen (2)
2007DE162PO007
Bayern 2007DE162PO001
Sachsen-Anhalt 2007DE162PO001
Niedersachsen 2007DE162PO010
Greece 0 8 8
Competitiveness (2)
2007GR161PO001
Competitiveness (2) 2007GR161PO001
Digital Convergence
2007GR161PO002
Digital Convergence 2007GR161PO002
Environment 2007GR161PO005
Environment
2007GR161PO005
Attica 2007GR161PO006
Attica
2007GR161PO006
Western Greece, Peloponnesus, Ionian Islands
2007GR161PO007
Western Greece, Peloponnesus, Ionian Islands
2007GR161PO007
Macedonia – Thrace
2007GR161PO008
Macedonia – Thrace 2007GR161PO008
Thessaly, Continental Greece, Epirus
2007GR16UPO001
Thessaly, Continental Greece, Epirus
2007GR16UPO001
Crete & Aegean Islands
2007GR16UPO002
Crete & Aegean Islands 2007GR16UPO002
Hungary 1 1 1
Environment and Energy
2007HU161PO002
Environment and Energy (2)
2007HU161PO002
Environment and Energy
2007HU161PO002
Italy 4 12 3
Campania 2007IT161PO009
Campania 2007IT161PO009
Calabria 2007IT161PO008
Calabria 2007IT161PO008
Calabria 2007IT161PO008
Sicily 2007IT161PO011

45
Sardegna 2007IT162PO016
Sardegna (2) 2007IT162PO016
Attrattori culturali, naturali e turismo (Lack of Compliance Assessment)
2007IT161PO001
Attrattori culturali, naturali e turismo (Lack of Compliance Assessment)
2007IT161PO001
Attrattori culturali, naturali e turismo (Lack of Compliance Assessment)
2007IT161PO001
Sicily 2007IT161PO011
Ricerca e competitività
2007IT161PO006
Abruzzo 2007IT162PO001
Lazio 2007IT162PO004
Ambienti per l'Apprendimento/ Instruzione
2007IT161PO004
Valle d'Aosta 2007IT162PO014
Veneto 2007IT162PO015
Energie rinnovabili e risparmio energetico
2007IT161PO002
Latvia 1 2 1
Entrepreneurship and Innovations
2007LV161PO001
Entrepreneurship and Innovations (2)
2007LV161PO001
Entrepreneurship and Innovations
2007LV161PO001
Infrastructure and Services
2007LV161PO002
Lithuania 0 2 0
Promotion of Cohesion
2007LT161PO001
Economic Growth 2007LT161PO002
Netherlands 0 2 0
Zuid 2007NL162PO003
Noord 2007NL162PO001
Poland 0 3 2
Innovative Economy (2)
2007PL161PO001
Infrastructure & Environment
2007PL161PO002
Infrastructure & Environment
2007PL161PO002
Eastern Poland 2007PL161PO003
Eastern Poland 2007PL161PO003
Romania 0 4 3
Transport 2007RO161PO003
Transport
2007RO161PO003
Increase of Economic Competitiveness (2)
2007RO161PO002
Increase of Economic Competitiveness (2)
2007RO161PO002
Environment 2007RO161PO004
Regional Operational Programme (2)
2007RO161PO001
Regional Operational Programme (2)
2007RO161PO001
Slovakia 2 2 1
Environment 2007SK161PO002
Environment 2007SK161PO002
Transport 2007SK161PO004
Transport 2007SK161PO004
Transport (2) 2007SK161PO004
Slovenia 0 1 0
Regional Potentials (2)
2007SI161PO001
Spain 6 23 17
Fondo de Cohesion
2007ES161PO009
Fondo de Cohesión - FEDER (2)
2007ES161PO009
Comunidad Valenciana (4)
2007ES162PO010
Madrid 2007ES162PO004
Madrid (2) 2007ES162PO004
Región de Murcia (2) 2007ES161PO001
Comunidad Valenciana
2007ES162PO010
Comunidad Valenciana (5)
2007ES162PO010
Galicia (2) 2007ES161PO005
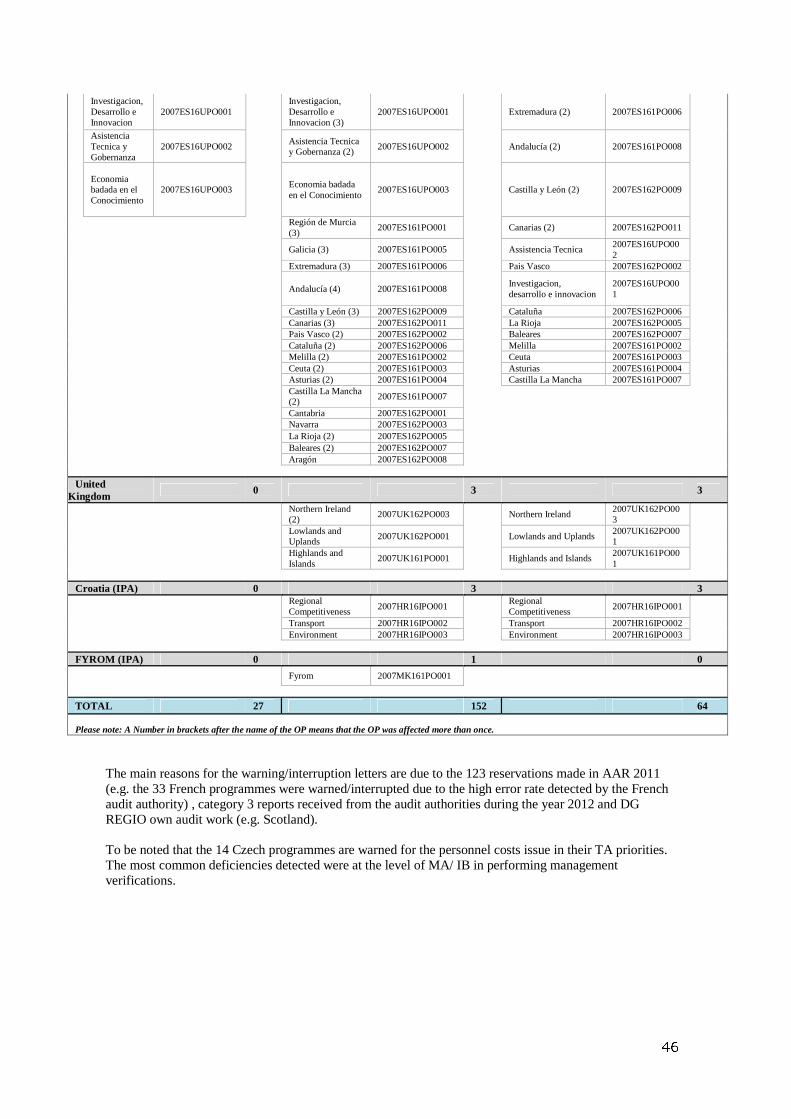
46
Investigacion, Desarrollo e Innovacion
2007ES16UPO001
Investigacion, Desarrollo e Innovacion (3)
2007ES16UPO001
Extremadura (2) 2007ES161PO006
Asistencia Tecnica y Gobernanza
2007ES16UPO002
Asistencia Tecnica y Gobernanza (2)
2007ES16UPO002
Andalucía (2) 2007ES161PO008
Economia badada en el Conocimiento
2007ES16UPO003
Economia badada en el Conocimiento
2007ES16UPO003
Castilla y León (2) 2007ES162PO009
Región de Murcia (3)
2007ES161PO001
Canarias (2) 2007ES162PO011
Galicia (3) 2007ES161PO005
Assistencia Tecnica
2007ES16UPO002
Extremadura (3) 2007ES161PO006
Pais Vasco 2007ES162PO002
Andalucía (4) 2007ES161PO008
Investigacion, desarrollo e innovacion
2007ES16UPO001
Castilla y León (3) 2007ES162PO009
Cataluña 2007ES162PO006
Canarias (3) 2007ES162PO011
La Rioja 2007ES162PO005
Pais Vasco (2) 2007ES162PO002
Baleares 2007ES162PO007
Cataluña (2) 2007ES162PO006
Melilla 2007ES161PO002
Melilla (2) 2007ES161PO002
Ceuta 2007ES161PO003
Ceuta (2) 2007ES161PO003
Asturias 2007ES161PO004
Asturias (2) 2007ES161PO004
Castilla La Mancha 2007ES161PO007
Castilla La Mancha (2)
2007ES161PO007
Cantabria 2007ES162PO001
Navarra 2007ES162PO003
La Rioja (2) 2007ES162PO005
Baleares (2) 2007ES162PO007
Aragón 2007ES162PO008
United
Kingdom 0 3 3
Northern Ireland (2)
2007UK162PO003
Northern Ireland 2007UK162PO003
Lowlands and Uplands
2007UK162PO001
Lowlands and Uplands 2007UK162PO001
Highlands and Islands
2007UK161PO001
Highlands and Islands 2007UK161PO001
Croatia (IPA) 0 3 3
Regional Competitiveness
2007HR16IPO001
Regional Competitiveness
2007HR16IPO001
Transport 2007HR16IPO002
Transport 2007HR16IPO002
Environment 2007HR16IPO003
Environment 2007HR16IPO003
FYROM (IPA) 0 1 0
Fyrom 2007MK161PO001
TOTAL 27 152 64
Please note: A Number in brackets after the name of the OP means that the OP was affected more than once.
The main reasons for the warning/interruption letters are due to the 123 reservations made in AAR 2011 (e.g. the 33 French programmes were warned/interrupted due to the high error rate detected by the French audit authority) , category 3 reports received from the audit authorities during the year 2012 and DG REGIO own audit work (e.g. Scotland). To be noted that the 14 Czech programmes are warned for the personnel costs issue in their TA priorities. The most common deficiencies detected were at the level of MA/ IB in performing management verifications.

47
ANNEX 13: INTERRUPTIONS AND SUSPENSIONS - 2012 BY MEMBER STATE
ERDF / Cohesion Fund
Number of cases Amount (EUR m)
Interruptions - closed cases during 2012
Spain 37 1,319.49
France 5 24.38 Italy 20 871.28
Latvia 5 94.33 Lithuania 4 163.73 Slovakia 2 71.03 Slovenia 1 6.35
ETC 8 52.27 Subtotal closed cases 82 2,602.87
Interruptions - open cases as at 31 December 2012
Germany 5 180.3063 Spain 7 73.81
France 1 26.79 Italy 13 571.4064
Hungary 3 54.54 Poland 5 604.65
Romania 1 41.48 UK 1 22.40
ETC 3 6.30 Subtotal open cases 39 1,581.66
Total interruptions 121 4,184.52
As of 1st January 2013, there was still approximately EUR 1.6 Billion interrupted.
63 Of which EUR 34 million are suspended 64 Of which EUR 203 million are suspended