analyst and investor briefing on the second quarter of ... · on-year in the japanese, ... (average...
TRANSCRIPT

Yamaha Corporation Analyst and Investor Briefing on
the Second Quarter of Fiscal Year Ending March 31, 2017 (FY2017.3)
November 8, 2016
2
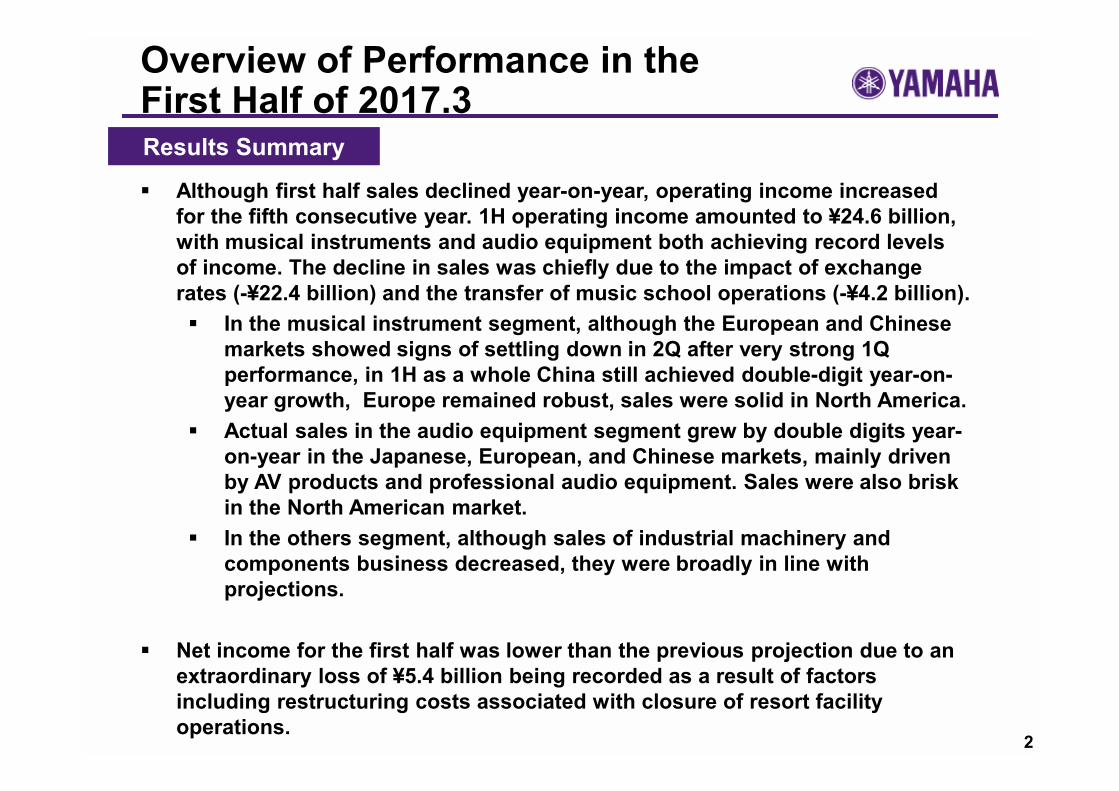
Overview of Performance in the First Half of 2017.3Results SummaryResults Summary
Although first half sales declined year-on-year, operating income increased for the fifth consecutive year. 1H operating income amounted to ¥24.6 billion, with musical instruments and audio equipment both achieving record levels of income. The decline in sales was chiefly due to the impact of exchange rates (-¥22.4 billion) and the transfer of music school operations (-¥4.2 billion).
In the musical instrument segment, although the European and Chinese markets showed signs of settling down in 2Q after very strong 1Q performance, in 1H as a whole China still achieved double-digit year-on-year growth, Europe remained robust, sales were solid in North America. Actual sales in the audio equipment segment grew by double digits year-on-year in the Japanese, European, and Chinese markets, mainly driven by AV products and professional audio equipment. Sales were also brisk in the North American market. In the others segment, although sales of industrial machinery and components business decreased, they were broadly in line with projections.
Net income for the first half was lower than the previous projection due to an extraordinary loss of ¥5.4 billion being recorded as a result of factors including restructuring costs associated with closure of resort facility operations.
3
FY2016.3 1H results
FY2017.3 1H results
Changes from same period of
the previous year
FY2017.3 1H previous projections
Changes from the previous
projection
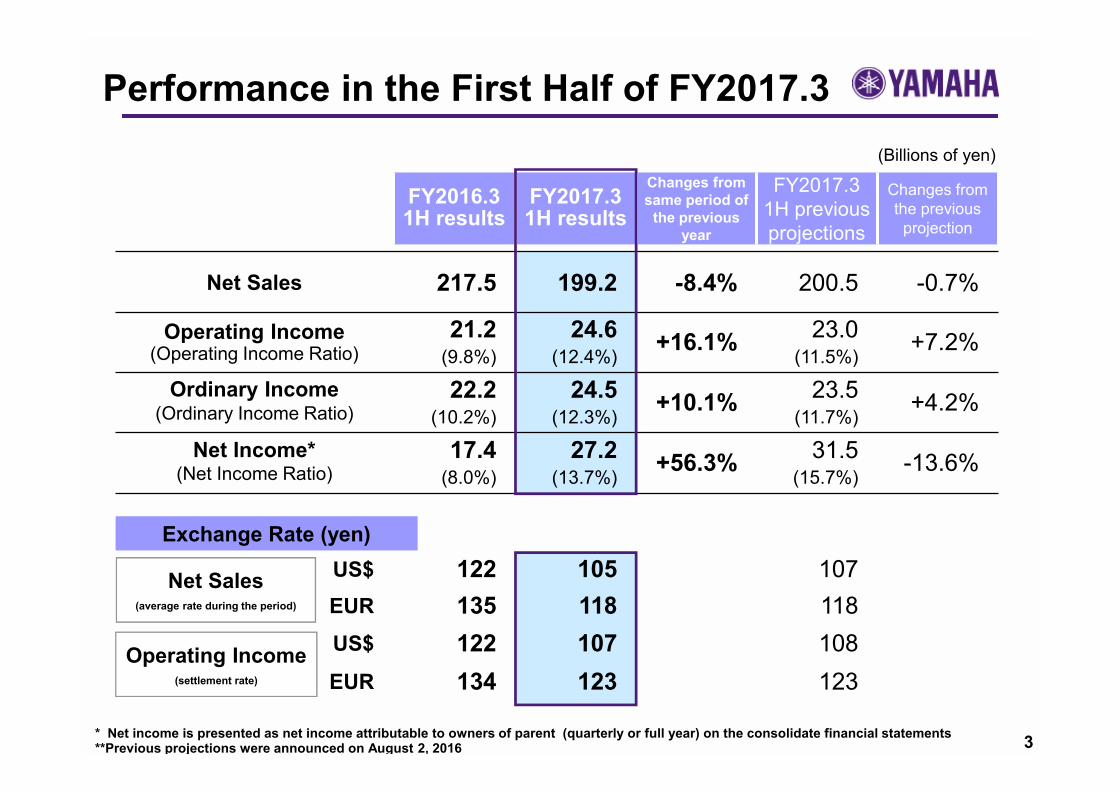
Net Sales 217.5 199.2 -8.4% 200.5 -0.7%
Operating Income(Operating Income Ratio)
21.2 (9.8%)
24.6 (12.4%)
+16.1% 23.0 (11.5%)
+7.2%
Ordinary Income(Ordinary Income Ratio)
22.2(10.2%)
24.5(12.3%)
+10.1% 23.5(11.7%)
+4.2%
Net Income*(Net Income Ratio)
17.4(8.0%)
27.2(13.7%)
+56.3% 31.5(15.7%)
-13.6%
US$ 122 105 107EUR 135 118 118US$ 122 107 108EUR 134 123 123
Performance in the First Half of FY2017.3
Exchange Rate (yen)Exchange Rate (yen)
Net Sales(average rate during the period)
Operating Income(settlement rate)
(Billions of yen)
**Previous projections were announced on August 2, 2016* Net income is presented as net income attributable to owners of parent (quarterly or full year) on the consolidate financial statements

4
142.4 128.5
55.3 53.0
19.8 17.7
200.5Year-on-year change
(-8.4%)
(-10.8%)
(-4.1%)
(-9.8%)16.8 18.8
3.5 4.8 1.0
1.0
グラフ タイトル
21.2 23.024.6
217.5 199.2
Net SalesNet Sales Operating IncomeOperating Income
Performance by Business Segment in the First Half of FY2017.3
(Billions of yen)
Impact of Exchange Rates
Year-on-Year-¥22.4 billion(musical instruments -¥15.2 billion, audio equipment -¥6.9 billion, others -¥0.3 billion)
Versus previous projections
-¥0.5 billion(musical instruments -¥0.3 billion, audio equipment -¥0.2 billion)
-¥6.3 billion(musical instruments -¥5.1 billion, audio equipment -¥1.3 billion)
+¥0.1 billion(musical instruments +¥0.1 billion, audio equipment +¥0.1 billion)
FY2016.3 1H FY2017.3 1H FY2017.3 1H(previous
projections)
■Musical Instruments
■Audio Equipment
■Others
■Musical Instruments
■Audio Equipment
■Others
FY2016.3 1H FY2017.3 1H FY2017.3 1H(previous projections)
* Previous projections were announced on August 2, 2016** FY2016.3 figures have been adjusted to reflect the segmentation change of soundproof room business
5
23.0
24.6
21.224.6
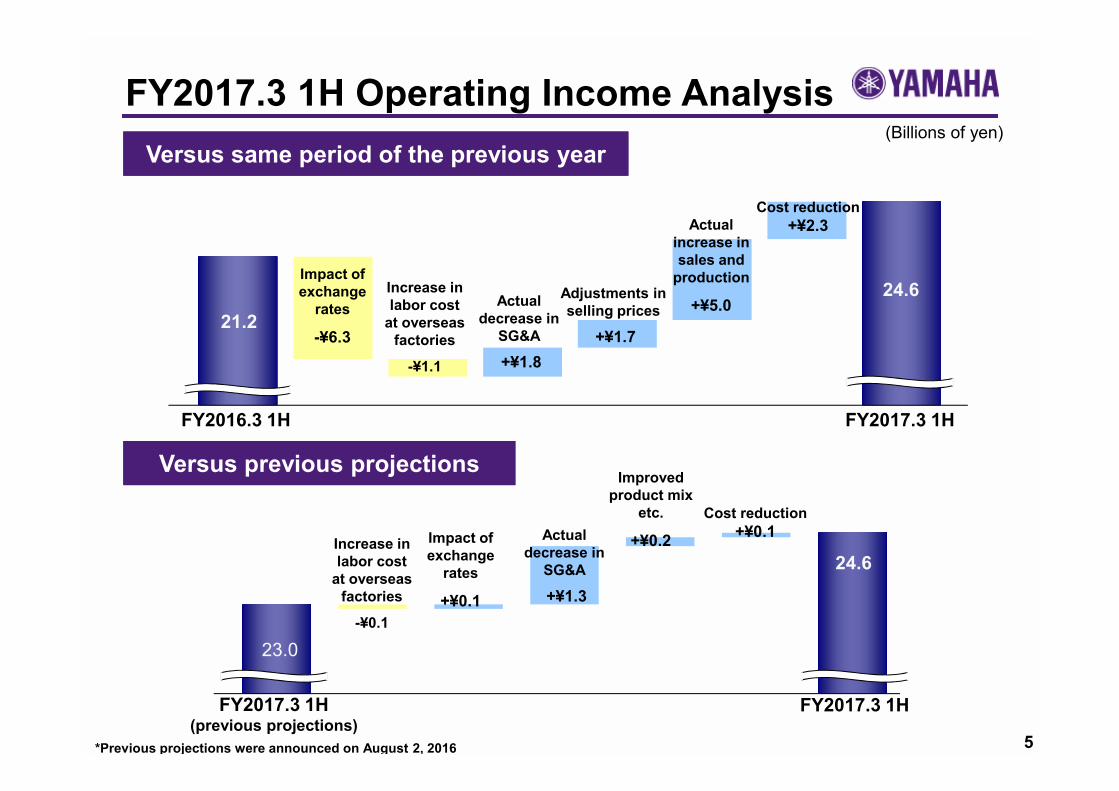
FY2017.3 1H Operating Income Analysis(Billions of yen)
Versus previous projectionsVersus previous projections
FY2016.3 1H FY2017.3 1H
FY2017.3 1H (previous projections)
FY2017.3 1H
Versus same period of the previous yearVersus same period of the previous year
*Previous projections were announced on August 2, 2016
Increase in labor cost
at overseas factories
-¥1.1
Cost reduction+¥2.3Actual
increase in sales and
production
+¥5.0
Impact of exchange
rates
-¥6.3
Adjustments in selling prices
+¥1.7
Actual decrease in
SG&A
+¥1.8
Increase in labor cost
at overseas factories
-¥0.1
Cost reduction+¥0.1
Improved product mix
etc.
+¥0.2Impact of exchange
rates
+¥0.1
Actual decrease in
SG&A
+¥1.3

110.0 102.2
32.5 26.3
16.8 18.8
6
142.4128.5
1H1H
Musical Instruments 1H
■Operating Income■Net Sales
(Billions of yen)
Music schools, etc.
Yamaha musical
instruments
1H Overview
• Sales decreased from the same period of the previous year, but income rose
• The decline in sales was mainly due to the impact of exchange rates and the transfer of music school operations
• The Chinese and European markets recorded strong sales. Although the North American market was also robust, it slowed in 2Q as sales recoiled following strong 1Q results.
• Guitars sold briskly, and sales of pianos and digital musical instruments were solid
• Operating income increased due to higher actual sales, sales price adjustments, cost reductions, and control of SG&A expenses including the decrease in amortization of goodwill
* FY2016.3 figures have been adjusted to reflect the segmentation change of soundproof room business
FY2016.3 1H FY2017.3 1H
7
23.7 22.2
24.0 23.7
7.5 7.1
グラフ タイトル
3.5 4.8
55.3 53.0
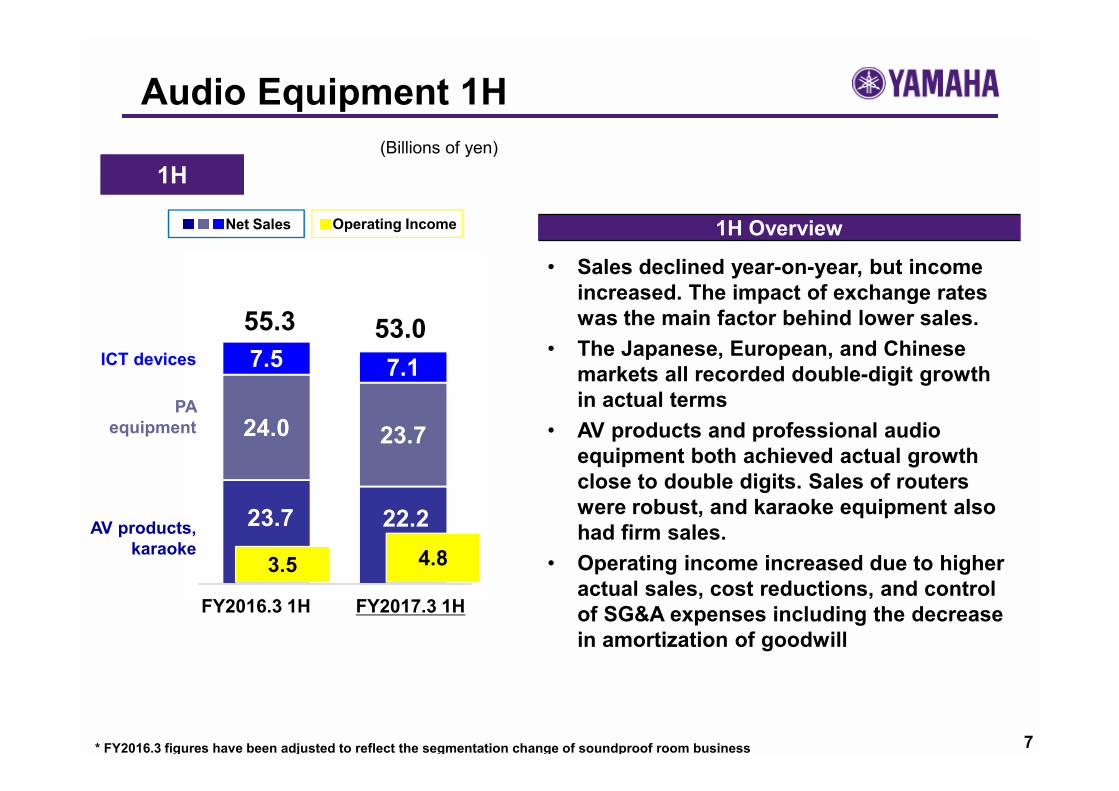
Audio Equipment 1H
ICT devices
PA equipment
AV products, karaoke
FY2016.3 1H FY2017.3 1H
■■■Net Sales
1H1H(Billions of yen)
■Operating Income 1H Overview
• Sales declined year-on-year, but income increased. The impact of exchange rates was the main factor behind lower sales.
• The Japanese, European, and Chinese markets all recorded double-digit growth in actual terms
• AV products and professional audio equipment both achieved actual growth close to double digits. Sales of routers were robust, and karaoke equipment also had firm sales.
• Operating income increased due to higher actual sales, cost reductions, and control of SG&A expenses including the decrease in amortization of goodwill
* FY2016.3 figures have been adjusted to reflect the segmentation change of soundproof room business
13.4 11.6
2.3 2.5
2.7 2.7
1.4 0.9
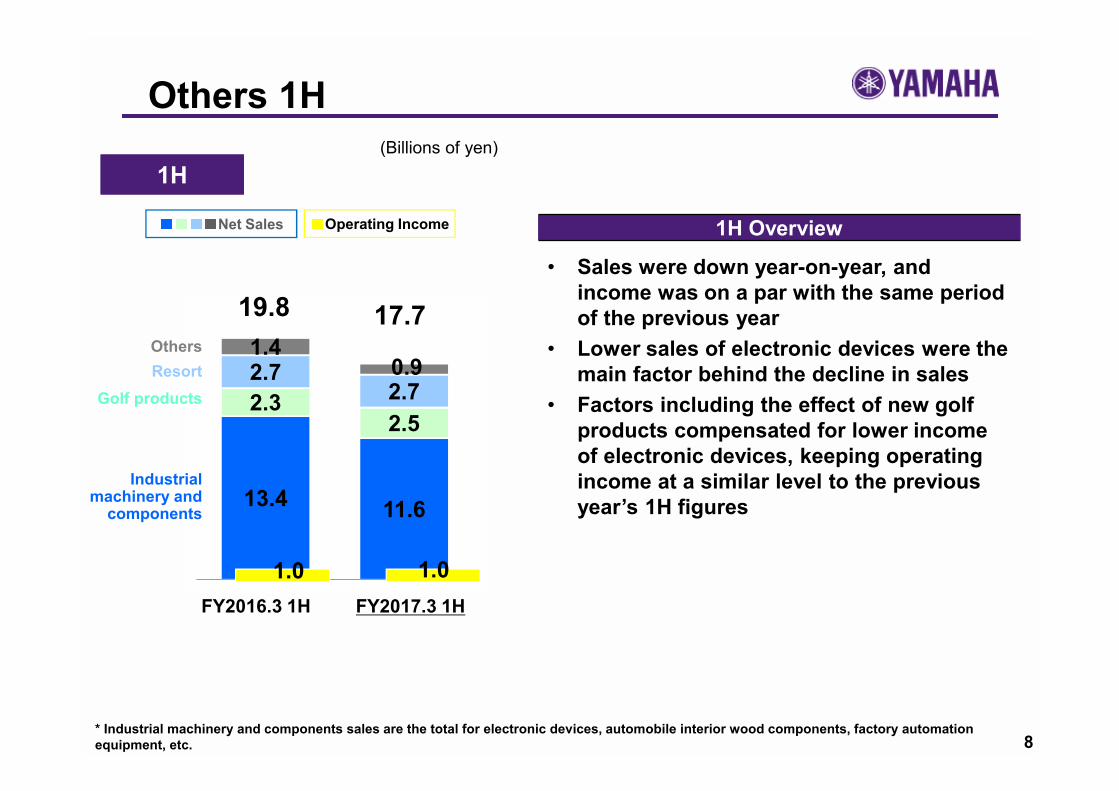
8
1.0 1.0
17.719.8
1H1H
Others 1H
■Operating Income■■■■Net Sales
OthersResort
Golf products
Industrial machinery and
components
* Industrial machinery and components sales are the total for electronic devices, automobile interior wood components, factory automation equipment, etc.
(Billions of yen)
1H Overview
• Sales were down year-on-year, and income was on a par with the same period of the previous year
• Lower sales of electronic devices were the main factor behind the decline in sales
• Factors including the effect of new golf products compensated for lower income of electronic devices, keeping operating income at a similar level to the previous year’s 1H figures
FY2016.3 1H FY2017.3 1H

Outlook for Second Half and Full Year
9
Full Year OutlookFull Year Outlook
Outlook for 2HOutlook for 2HNo major change in outlook for the musical instrument market. Compared to previous projections, audio equipment business is expected to slow in the AV product and ICT device businesses. Overall sales in the others segment are anticipated to decline, due to factors including lower sales resulting from cessation of operations at resort facilities.
The exchange rate forecast for 2H has been revised to US$1 = ¥100 and EUR1=¥110.
Although the full year sales projection has been revised downward from ¥411.0 billion to ¥402.0 billion to reflect altered exchange rate assumptions, strong 1H income has resulted in previous projections for operating income and ordinary income remaining unchanged at ¥42.0 billion.
Net income attributable to owners of the parent company has been revised downward from the previous projection of ¥45.5 billion to ¥41.0 billion due to the posting of an extraordinary loss for restructuring expenses associated with operation closure of resort facilities.
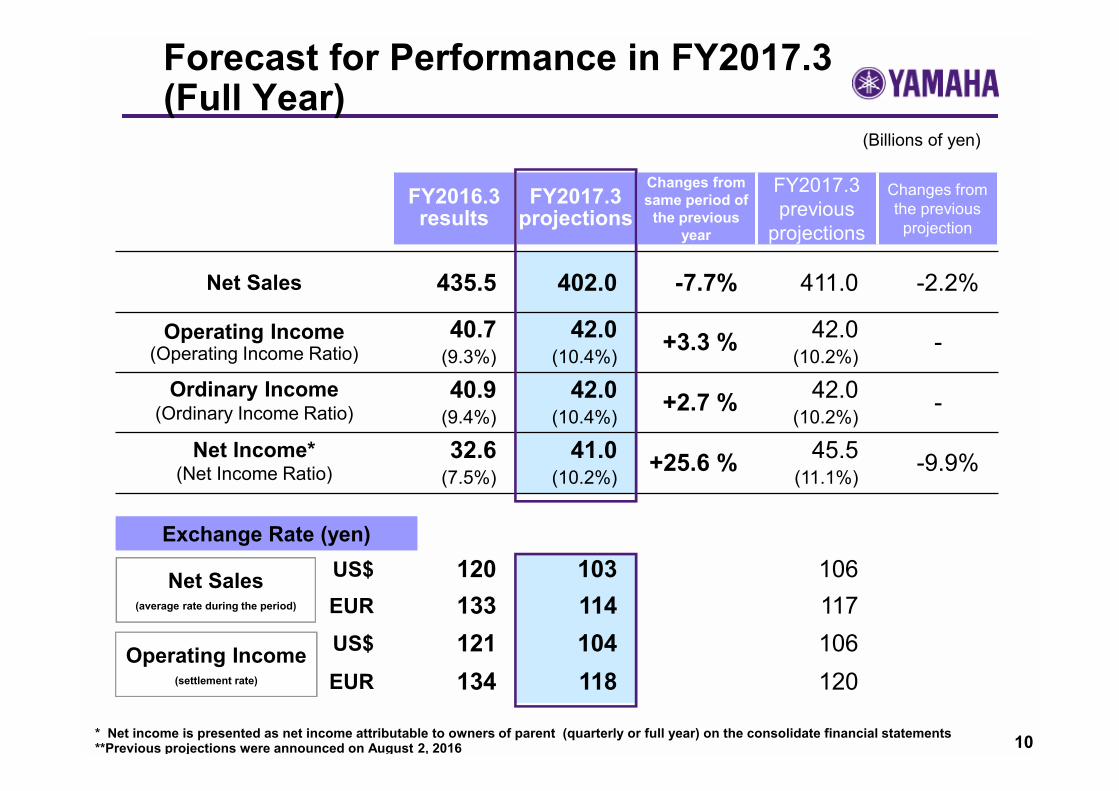
10
FY2016.3 results
FY2017.3 projections
Changes from same period of
the previous year
FY2017.3 previous
projections
Changes from the previous
projection
Net Sales 435.5 402.0 -7.7% 411.0 -2.2%
Operating Income(Operating Income Ratio)
40.7 (9.3%)
42.0 (10.4%)
+3.3 % 42.0 (10.2%)
-
Ordinary Income(Ordinary Income Ratio)
40.9(9.4%)
42.0(10.4%)
+2.7 % 42.0(10.2%)
-
Net Income*(Net Income Ratio)
32.6(7.5%)
41.0(10.2%)
+25.6 % 45.5(11.1%)
-9.9%
US$ 120 103 106EUR 133 114 117US$ 121 104 106EUR 134 118 120
Forecast for Performance in FY2017.3 (Full Year)
(Billions of yen)
**Previous projections were announced on August 2, 2016* Net income is presented as net income attributable to owners of parent (quarterly or full year) on the consolidate financial statements
Exchange Rate (yen)Exchange Rate (yen)
Net Sales(average rate during the period)
Operating Income(settlement rate)

11
277.4 254.0 258.0
120.9 113.0 116.0
37.2 35.0 37.0
グラフ タイトル
411.0Year-on-year change
(-7.7%)
(-6.0%)
(-6.5%)
(-8.4%)
Change from the previous projections
(-2.2%)
(-5.4%)
(-2.6%)
(-1.6%) 31.7 32.5 32.5
8.5 9.0 9.0 0.4 0.5 0.5
40.742.042.0
435.5 402.0
FY2017.3 Full Year Forecast for Performance by Business Segment
(Billions of yen)
Impact of Exchange Rates
Year-on-Year-¥45.6 billion(musical instruments -¥29.9 billion, audio equipment -¥14.8 billion, others -¥0.9 billion)
Versus previous projections
-¥4.6 billion(musical instruments -¥2.7 billion, audio equipment -¥1.7 billion, others -¥0.2)
-¥13.8 billion(musical instruments -¥10.5 billion, audio equipment -¥3.4 billion, others +¥0.1)
-¥1.2 billion(musical instruments -¥0.9 billion, audio equipment -¥0.3 billion)
FY2016.3 FY2017.3 FY2017.3(previous projections)
FY2016.3 FY2017.3 FY2017.3(previous
projections)
Net SalesNet Sales Operating IncomeOperating Income
■Musical Instruments
■Audio Equipment
■Others
■Musical Instruments
■Audio Equipment
■Others
* Previous projections were announced on August 2, 2016** FY2016.3 figures have been adjusted to reflect the segmentation change of soundproof room business
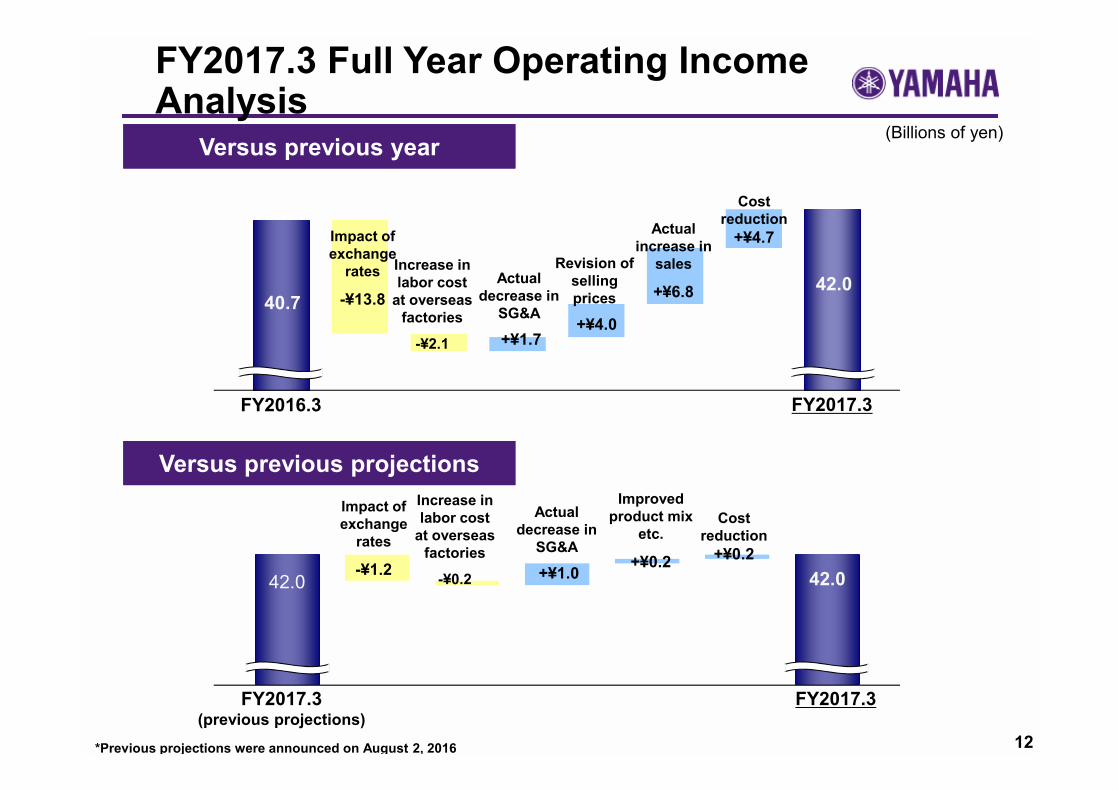
12
40.742.0
42.0 42.0
FY2017.3 Full Year Operating Income Analysis
(Billions of yen)
Versus previous projectionsVersus previous projections
Versus previous yearVersus previous year
FY2016.3 FY2017.3
FY2017.3 (previous projections)
FY2017.3
Increase in labor cost
at overseas factories
-¥2.1
Cost reduction
+¥4.7Actual increase in
sales
+¥6.8
Impact of exchange
rates
-¥13.8
Revision of selling prices
+¥4.0
Actual decrease in
SG&A
+¥1.7
Increase in labor cost
at overseas factories
-¥0.2
Cost reduction
+¥0.2
Impact of exchange
rates
-¥1.2
Actual decrease in
SG&A
+¥1.0
Improved product mix
etc.
+¥0.2
*Previous projections were announced on August 2, 2016

13
216.1 199.6 202.0
61.4 54.4 56.0
31.7 32.5 32.5
Full YearFull Year
■Operating Income■Net Sales
(Billions of yen)
FY2016.3 FY2017.3 FY2017.3 (previous
projections)
Musical Instruments Full Year Projections
Full Year Projections
• Although sales are likely to be down year-on-year and against previous projections, income is expected to be in line with previous projections
• The decline in sales is mainly due to revised exchange rate assumptions
• Strong sales are anticipated in all markets, broadly in line with previous projections
• Sales of pianos, digital pianos, and guitars are expected to be robust
• Increased actual sales, sales price adjustments, cost reductions, and control of SG&A expenses are expected to absorb the impact of exchange rates on operating income
* Previous projections were announced on August 2, 2016** FY2016.3 figures have been adjusted to reflect the segmentation change of soundproof room business
216.1 199.6 202.0
61.4 54.4 56.0
31.7 32.5 32.5
277.4 254.0 258.0Music
schools, etc.
Yamaha musical
instruments
26.9 21.713.1 12.5 10.7 11.9 8.3 8.4 11.5 10.2
19.0 18.9
15.8 13.4 13.8 11.4 11.1 9.3
12.3 10.8
20.2 20.0
14.0 12.6 16.9 15.0
8.9 7.9
13.2 12.2
21.520.8
13.511.9 9.4
8.2
6.9 6.7
10.510.1
FY2016.3 FY2017.3 FY2016.3 FY2017.3 FY2016.3 FY2017.3 FY2016.3 FY2017.3 FY2016.3 FY2017.3
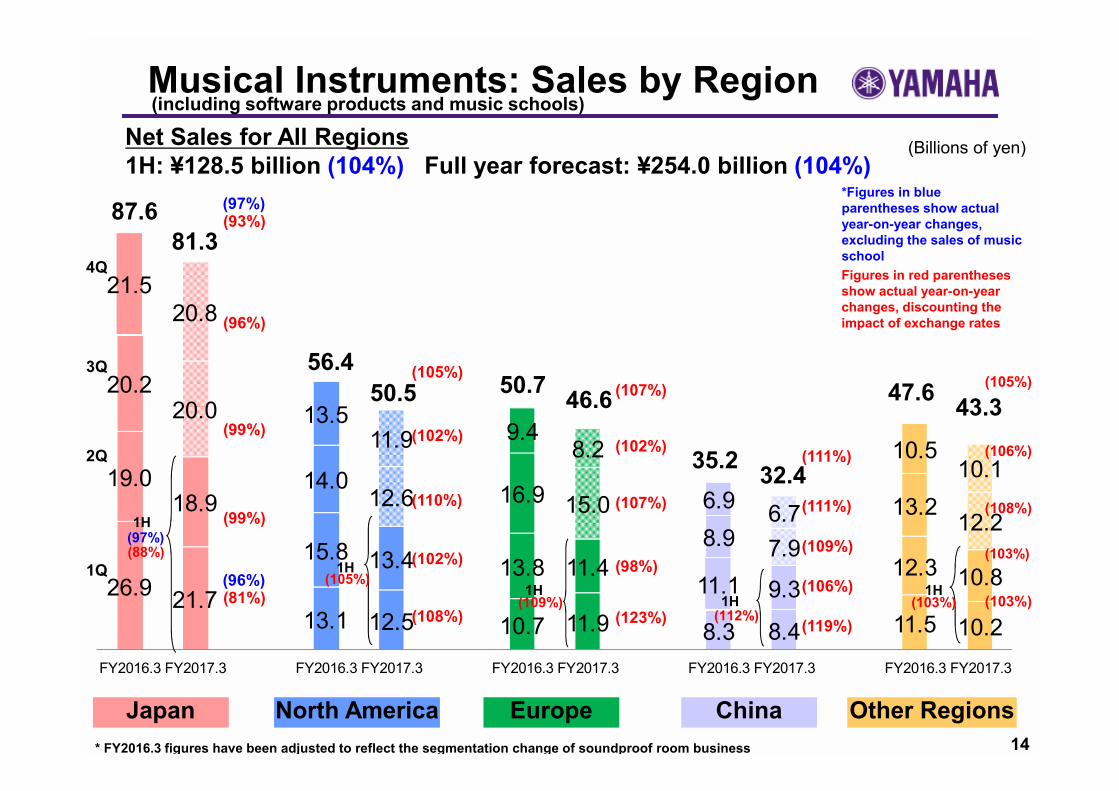
87.6
4Q
3Q
2Q
1Q
(93%)
(96%)
(99%)
(99%)
(81%)
56.4 (105%)
(102%)
(110%)
(102%)
(108%)
(107%)
(102%)
(107%)
(98%)
(123%)
(111%)
(111%)
(109%)
(106%)
(119%)
(105%)
(106%)
(108%)
(103%)
(103%)
14
50.7
35.2
47.6
(97%)
81.3
50.5 46.6
32.4
43.3
(96%)
(88%)
1H
(105%)1H
(109%)1H
(112%)1H (103%)
1H
(97%)
Japan North America Europe China Other Regions
Figures in red parentheses show actual year-on-year changes, discounting the impact of exchange rates
(Billions of yen)
Musical Instruments: Sales by Region
*Figures in blue parentheses show actual year-on-year changes, excluding the sales of music school
Net Sales for All Regions1H: ¥128.5 billion (104%) Full year forecast: ¥254.0 billion (104%)
* FY2016.3 figures have been adjusted to reflect the segmentation change of soundproof room business
(including software products and music schools)

15
53.3 48.3 50.0
52.4 50.5 51.0
15.2 14.2 15.0
8.5 9.0 9.0
120.9 113.0 116.0
Full YearFull Year
■Operating Income
(Billions of yen)
FY2016.3 FY2017.3 FY2017.3 (previous
projections)
Audio Equipment Full Year Projections
■■■Net Sales
ICT devices
PA equipment
AV products, karaoke
Full Year Projections• Although sales are likely to be down year-
on-year and against previous projections, income projections remain unchanged
• Strong sales of AV products are anticipated. In the professional audio equipment segment, actual double-digit growth is expected for routers and commercial audio equipment.
• Increased actual sales, cost reductions, sales price adjustments, and control of SG&A expenses are expected to absorb the negative impact of exchange rates on operating income
* Previous projections were announced on August 2, 2016** FY2016.3 figures have been adjusted to reflect the segmentation change of soundproof room business

4.5 6.0 6.7 6.1 6.4 6.9 2.7 2.7 4.7 3.8
6.3 6.2
8.0 7.3 7.8 6.8
2.8 2.6
5.3 4.5
6.2 6.3
9.9 8.8
10.4 9.5
3.5 2.6
6.4 5.4
9.4 9.4
6.6 5.8
6.6 6.2
2.5 2.0
4.1 4.1
FY2016.3 FY2017.3 FY2016.3 FY2017.3 FY2016.3 FY2017.3 FY2016.3 FY2017.3 FY2016.3 FY2017.3
3Q
2Q
1Q
(106%)
(100%)
(102%)
(99%)
(135%)
11.5
(107%)
(103%)
(109%)
(111%)
(106%)
(110%)
(109%)
(110%)
(104%)
(118%)
(97%)
(88%)
(84%)
(111%)
(109%)
(101%)
(110%)
(99%)
(102%)
(95%)
26.3
4Q
31.3 31.1
20.5
16
27.9 28.1 29.4
9.8
17.8
(114%) (109%)1H
(111%)1H
(110%)1H (99%)
1H1H
Japan North America Europe China Other Regions
Figures in parentheses show actual year-on-year changes, discounting the impact of exchange rates
(Billions of yen)
Audio Equipment: Sales by RegionNet Sales for All Regions1H: ¥53.0 billion (109%) Full year forecast: ¥113.0 billion (106%)
* FY2016.3 figures have been adjusted to reflect the segmentation change of soundproof room business
12.1 12.0
14.7 12.3
13.1 12.8
11.4 10.7
FY2016.3 FY2017.3
17
51.4 (107%)
(105%)
(114%)
(99%)
(112%)1Q
2Q
3Q
4Q
19.8 19.6
23.1 20.3
28.124.2
18.417.2
FY2016.3 FY2017.3
12.5 11.8
11.7 10.3
8.6 7.9
9.98.7
FY2016.3 FY20167.3
6.1 6.4
7.3 6.7
7.7 7.3
6.1 5.4
FY2016.3 FY2017.3
8.8 8.6
12.2 11.3
17.9 15.3
9.58.5
FY2016.3 FY2017.3
48.3 (105%)
(102%)
(102%)
(109%)
(110%)
42.7(102%)
(96%)
(105%)
(101%)
(103%)
(104%)
(104%)
(101%)
(103%)
(110%)
89.3
(108%)
(97%)
(112%)
(107%)
(117%) 11.5 11.8
12.6 11.8
13.3 12.6
15.0 14.3
FY2016.3 FY2017.3
27.352.4 (109%)
(104%)
(110%)
(109%)
(115%)
47.9 81.4
38.725.8
43.6
50.5
(105%)1H
(107%)1H
(109%)1H
(102%)1H
(111%)1H
(112%)1H
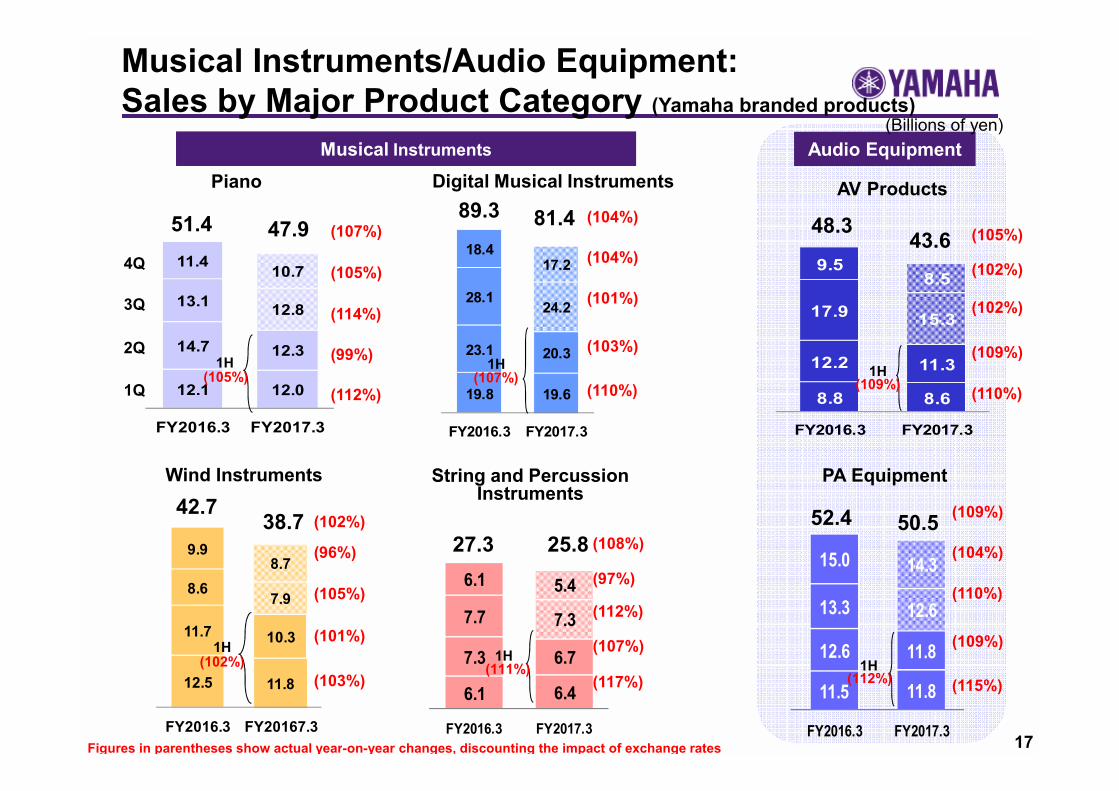
Musical Instruments/Audio Equipment: Sales by Major Product Category (Yamaha branded products)
Audio EquipmentAudio EquipmentMusical InstrumentsMusical Instruments
Figures in parentheses show actual year-on-year changes, discounting the impact of exchange rates
(Billions of yen)
AV Products
PA EquipmentWind Instruments
Digital Musical Instruments
String and Percussion Instruments
Piano
18
24.4 24.1 24.6
5.8 5.1 5.3
4.8 4.1 5.0 2.2 1.7 2.2
37.035.037.2
0.4 0.5 0.5
Full YearFull Year
■Operating Income
(Billions of yen)
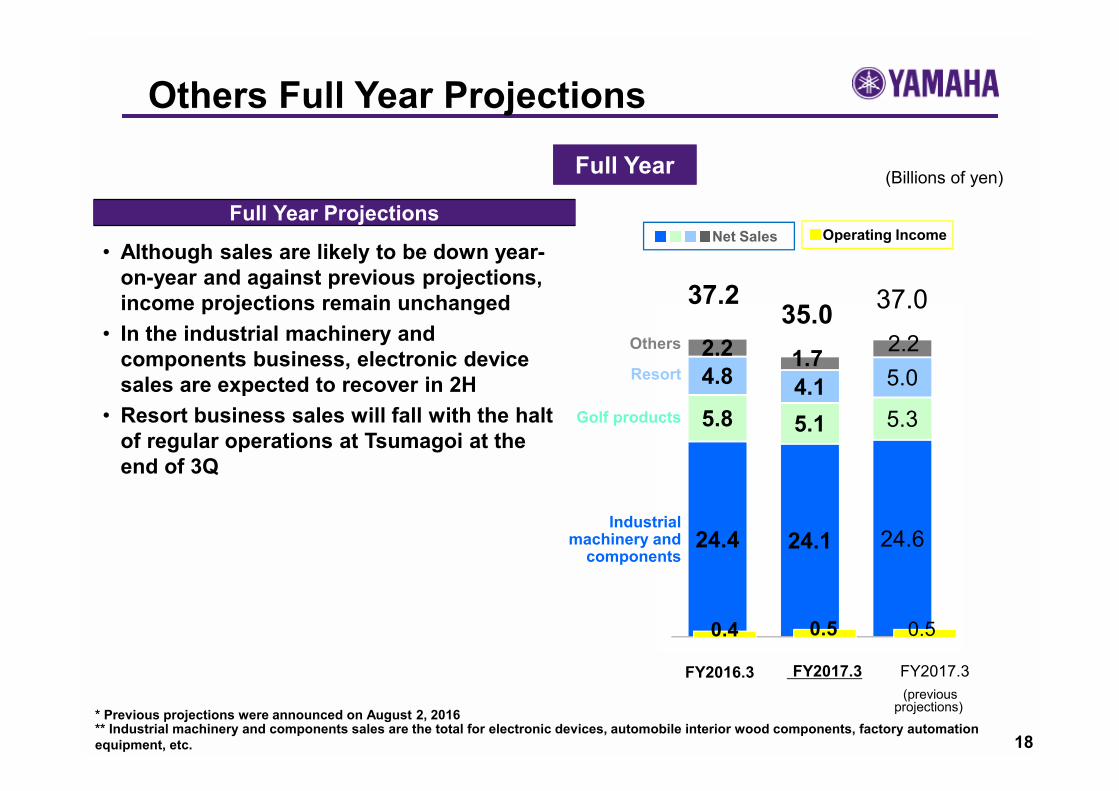
Others Full Year Projections
■■■■Net Sales
FY2016.3 FY2017.3 FY2017.3 (previous
projections)
Full Year Projections
• Although sales are likely to be down year-on-year and against previous projections, income projections remain unchanged
• In the industrial machinery and components business, electronic device sales are expected to recover in 2H
• Resort business sales will fall with the halt of regular operations at Tsumagoi at the end of 3Q
Others
Resort
Golf products
Industrial machinery and
components
** Industrial machinery and components sales are the total for electronic devices, automobile interior wood components, factory automation equipment, etc.
* Previous projections were announced on August 2, 2016
19
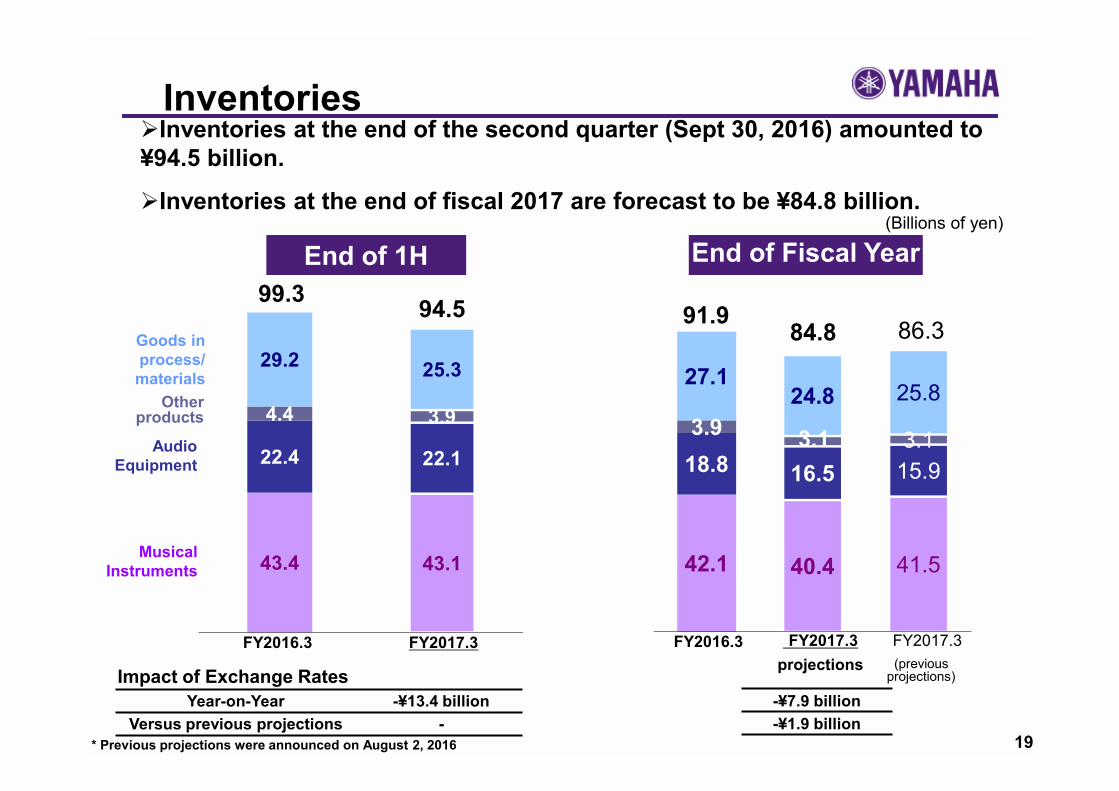
42.1 40.4 41.5
18.8 16.5 15.9
3.9 3.1 3.1
27.124.8 25.8
43.4 43.1
22.4 22.1
4.4 3.9
29.2 25.3
99.3 94.5 91.9 86.384.8
Inventories at the end of the second quarter (Sept 30, 2016) amounted to ¥94.5 billion.
Inventories at the end of fiscal 2017 are forecast to be ¥84.8 billion.(Billions of yen)
Goods in process/ materials
Audio Equipment
Musical Instruments
Other products
Inventories
End of 1HEnd of 1H End of Fiscal YearEnd of Fiscal Year
Impact of Exchange RatesYear-on-Year -¥13.4 billion
Versus previous projections --¥7.9 billion-¥1.9 billion
* Previous projections were announced on August 2, 2016
FY2016.3 FY2017.3 FY2016.3 FY2017.3 FY2017.3projections (previous
projections)
20
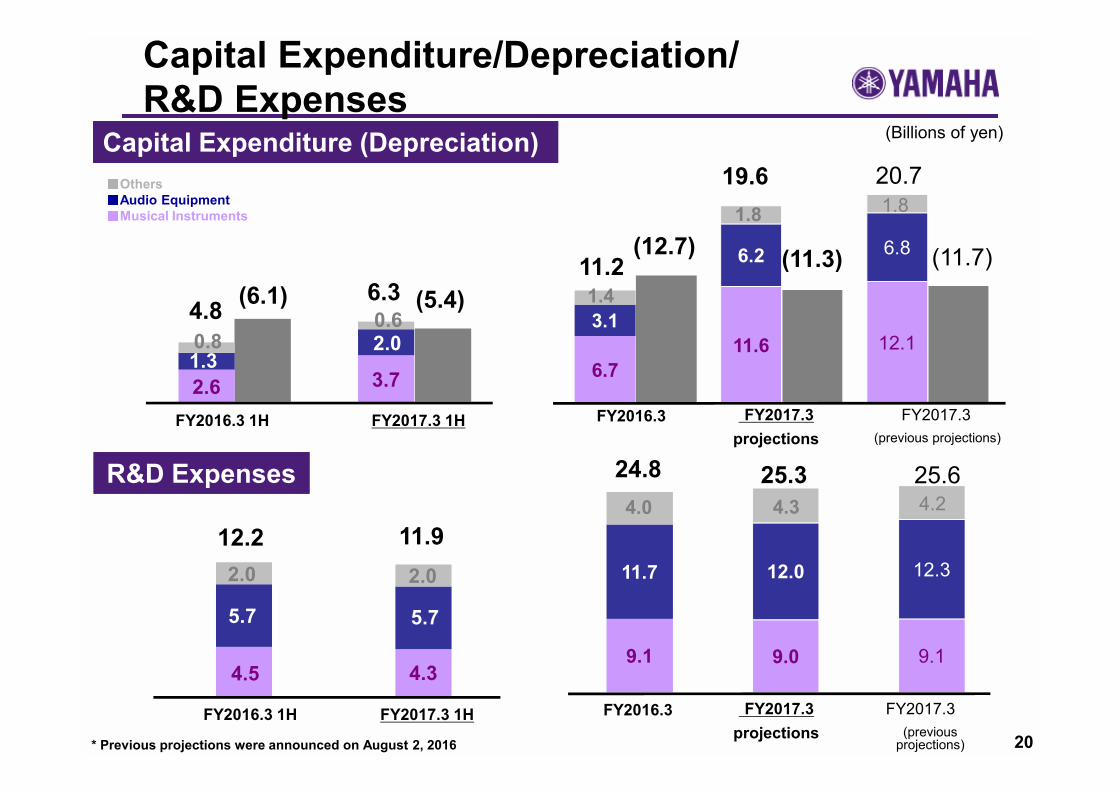
2.6 3.71.3
2.00.80.6
4.5 4.3
5.7 5.7
2.0 2.0
9.1 9.0 9.1
11.7 12.0 12.3
4.0 4.3 4.2
6.3
6.711.6 12.1
3.1
6.2 6.8
1.4
1.8 1.8
(6.1)4.8
11.2 (11.3)
20.7
(11.7)
12.2
(5.4)
24.8 25.6
11.9
19.6
(12.7)
25.3
■Others■Audio Equipment■Musical Instruments
Capital Expenditure/Depreciation/R&D Expenses
Capital Expenditure (Depreciation)Capital Expenditure (Depreciation)
R&D ExpensesR&D Expenses
(Billions of yen)
FY2016.3 1H FY2017.3 1H FY2016.3 FY2017.3 FY2017.3 projections (previous projections)
FY2016.3 1H FY2017.3 1H FY2016.3 FY2017.3 FY2017.3 projections (previous
projections)* Previous projections were announced on August 2, 2016
21
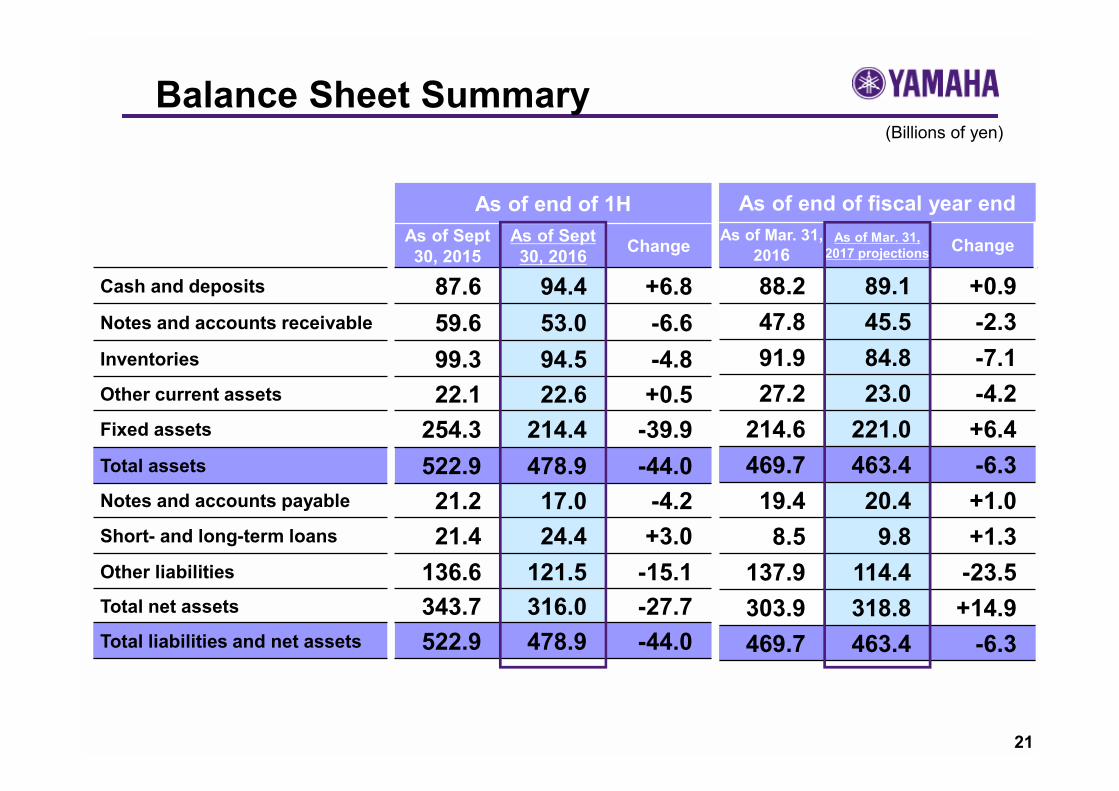
As of end of 1HAs of Sept 30, 2015
As of Sept 30, 2016 Change
Cash and deposits 87.6 94.4 +6.8Notes and accounts receivable 59.6 53.0 -6.6Inventories 99.3 94.5 -4.8Other current assets 22.1 22.6 +0.5Fixed assets 254.3 214.4 -39.9Total assets 522.9 478.9 -44.0Notes and accounts payable 21.2 17.0 -4.2Short- and long-term loans 21.4 24.4 +3.0Other liabilities 136.6 121.5 -15.1Total net assets 343.7 316.0 -27.7Total liabilities and net assets 522.9 478.9 -44.0
As of end of fiscal year endAs of Mar. 31,
2016As of Mar. 31,
2017 projections Change
88.2 89.1 +0.947.8 45.5 -2.391.9 84.8 -7.127.2 23.0 -4.2
214.6 221.0 +6.4469.7 463.4 -6.319.4 20.4 +1.08.5 9.8 +1.3
137.9 114.4 -23.5303.9 318.8 +14.9469.7 463.4 -6.3
Balance Sheet Summary(Billions of yen)

付 属 資 料Appendix

23
FY2016.3 2Q results
FY2017.3 2Q results
Changes from same period of
the previous year
FY2017.3 2Q previous projections
Changes from the previous
projection
Net Sales 111.9 100.8 -10.0% 102.1 -1.3%
Operating Income(Operating Income Ratio)
12.4 (11.1%)
12.9 (12.8%)
+3.9% 11.2 (11.0%)
+14.9%
Ordinary Income(Ordinary Income Ratio)
13.8(12.3%)
13.0(12.9%)
-5.5% 12.0(11.8%)
+8.5%
Net Income*(Net Income Ratio)
11.2(10.0%)
4.7(4.7%)
-57.6% 9.0(8.8%)
-47.5%
US$ 122 102 105EUR 136 114 115US$ 123 104 105EUR 134 121 121
Performance in the Second Quarter of FY2017.3 (Three Months)
(Billions of yen)
**Previous projections were announced on August 2, 2016* Net income is presented as net income attributable to owners of parent (quarterly or full year) on the consolidate financial statements
Exchange Rate (yen)Exchange Rate (yen)
Net Sales(average rate during the period)
Operating Income(settlement rate)
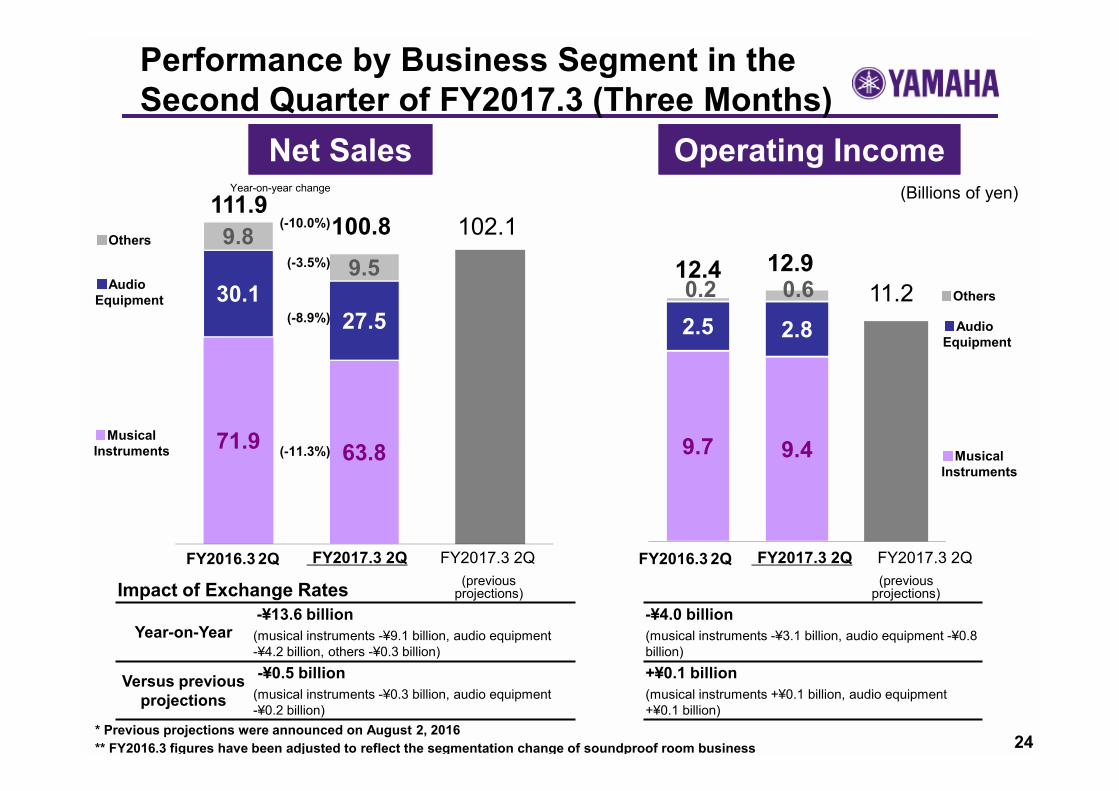
24
71.9 63.8
30.1 27.5
9.8 9.5
102.1
Year-on-year change
(-10.0%)
(-3.5%)
(-8.9%)
(-11.3%) 9.7 9.4
2.5 2.8
0.2 0.6 12.4
11.212.9
111.9100.8
Net SalesNet Sales Operating IncomeOperating Income
Performance by Business Segment in the Second Quarter of FY2017.3 (Three Months)
(Billions of yen)
Impact of Exchange Rates
Year-on-Year-¥13.6 billion(musical instruments -¥9.1 billion, audio equipment -¥4.2 billion, others -¥0.3 billion)
Versus previous projections
-¥0.5 billion(musical instruments -¥0.3 billion, audio equipment -¥0.2 billion)
-¥4.0 billion(musical instruments -¥3.1 billion, audio equipment -¥0.8 billion)
+¥0.1 billion(musical instruments +¥0.1 billion, audio equipment +¥0.1 billion)
FY2016.3 2Q FY2017.3 2Q FY2017.3 2Q(previous
projections)
■Musical Instruments
■Audio Equipment
■Others
■Musical Instruments
■Audio Equipment
■Others
FY2016.3 2Q FY2017.3 2Q FY2017.3 2Q(previous
projections)
* Previous projections were announced on August 2, 2016** FY2016.3 figures have been adjusted to reflect the segmentation change of soundproof room business

25
FY2016.3 1H FY2017.3 1H FY2017.3 1H previous projections
Net financial income 1.3 1.8 1.8Other -0.3 -2.0 -1.3
Total 1.0 -0.2 0.5
Income from (loss on) disposal of fixed assets
0.5 0.1 0.1
Others -0.2 -5.3 -0.1Total 0.3 -5.2 0
Income taxes -current 5.7 5.6 5.9Income taxes -deferred -0.7 -13.6 -14.1Net income attributable to non-controlling interests
0.1 0.1 0.2
Total 5.1 -7.9 -8.0
-Restructuring of resort business -¥4.9-Impairment loss -¥0.4
(Billions of yen)
1H Non-Operating Income/Loss & Extraordinary Income/Loss
Non-Operating Income/LossNon-Operating Income/Loss
Extraordinary Income/LossExtraordinary Income/Loss
Income Taxes and Other ExpensesIncome Taxes and Other Expenses
*Previous projections were announced on August 2, 2016** In conjunction with the recent improvement in profitability, scope of recording deferred tax assets has expanded from FY2017.3 and deferred tax assets of ¥13.6 billion were recorded in the first half.
26
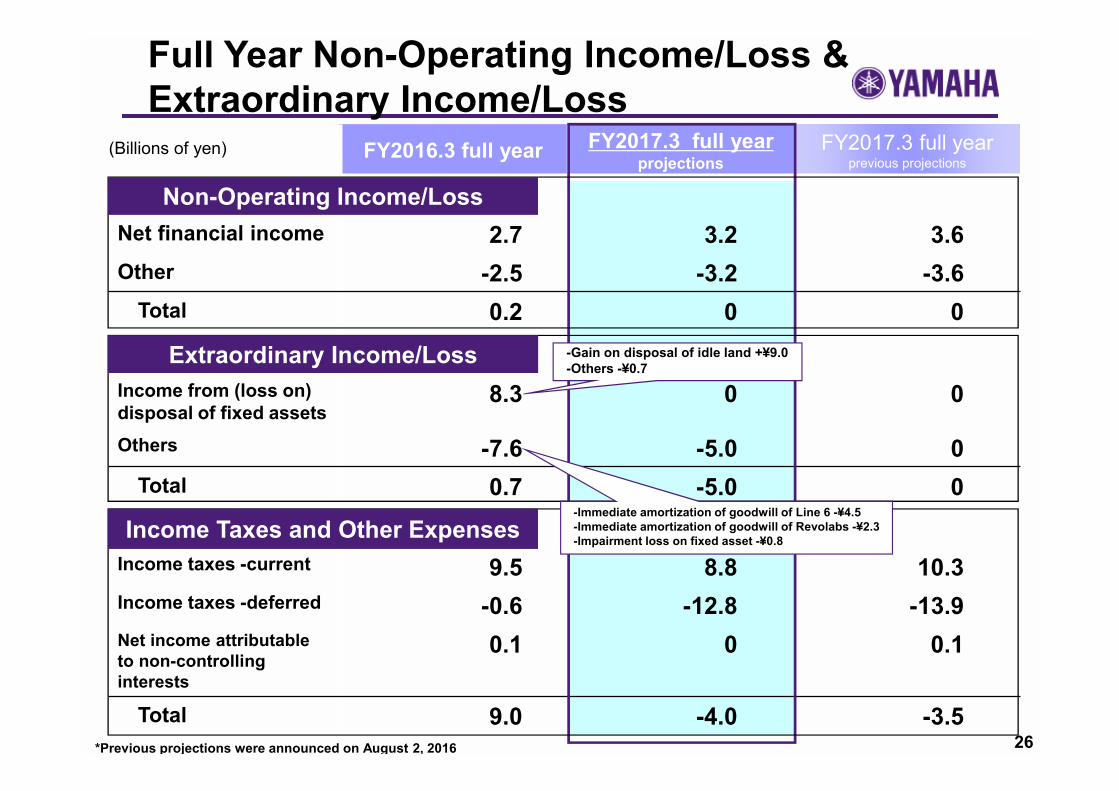
FY2016.3 full year FY2017.3 full year projections
FY2017.3 full year previous projections
Net financial income 2.7 3.2 3.6Other -2.5 -3.2 -3.6
Total 0.2 0 0
Income from (loss on) disposal of fixed assets
8.3 0 0
Others -7.6 -5.0 0Total 0.7 -5.0 0
Income taxes -current 9.5 8.8 10.3Income taxes -deferred -0.6 -12.8 -13.9Net income attributable to non-controlling interests
0.1 0 0.1
Total 9.0 -4.0 -3.5
(Billions of yen)
Full Year Non-Operating Income/Loss & Extraordinary Income/Loss
Non-Operating Income/LossNon-Operating Income/Loss
Extraordinary Income/LossExtraordinary Income/Loss
Income Taxes and Other ExpensesIncome Taxes and Other Expenses
*Previous projections were announced on August 2, 2016
-Gain on disposal of idle land +¥9.0-Others -¥0.7
-Immediate amortization of goodwill of Line 6 -¥4.5-Immediate amortization of goodwill of Revolabs -¥2.3-Impairment loss on fixed asset -¥0.8

Quarterly Sales and Income
27
105.5111.9
118.3
99.7
8.9 12.4 15.73.7
1Q 2Q 3Q 4Q
98.4 100.8109.8
93.0
11.8 12.9 13.93.5
1Q 2Q 3Q 4Q
98.4 102.1
114.0
96.5
11.8 11.2 15.04.0
1Q 2Q 3Q 4Q
Net Sales 435.5
Operating Income 40.7
Net Sales 402.0
Operating Income 42.0
Net Sales 411.0
Operating Income 42.0
(Billions of yen)
FY2016.3 FY2017.3 (previous projections)
FY2017.3 (projections)
*Previous projections were announced on August 2, 2016

28
An acoustic player piano that offers immersive new user experience andexciting new ways to listen, learn and play
Disklavier ENSPIRETM
Disklavier ENSPIRE retains its category-leading position as the only fully-integrated and most accurate high-resolution reproducing piano system available.
Wireless network connectivity and seamless compatibility with mobile devices, smartphones and computers allows intuitive access to all of the instrument’s exclusive content and unique capabilities.
YUS1ENST C3X ENPRO
(scheduled to be released in December 2016)
Key Products in FY2017.3

A guitar of built-in sounding reverb/choruswith no need for external amplification or effects
TransAcousticTM Guitar
29
The Yamaha TransAcoustic guitar recreates an experience of playing in a rich, live room without needing any external amplification or effects, just the guitar itself. An actuator installed on the inner surface of the guitar back vibrates, thereby generating authentic reverb and chorus sounds from inside the body.
LL-TA VT
An actuator installed on the inner surface of the guitar back vibrates in response to the vibrations of the strings. The vibrations of the actuator are then conveyed to the body of the guitar, and to the air in and around the guitar body, generating authentic reverb and chorus sounds from inside the body.
Key Products in FY2017.3
(scheduled to be released in November 2016)
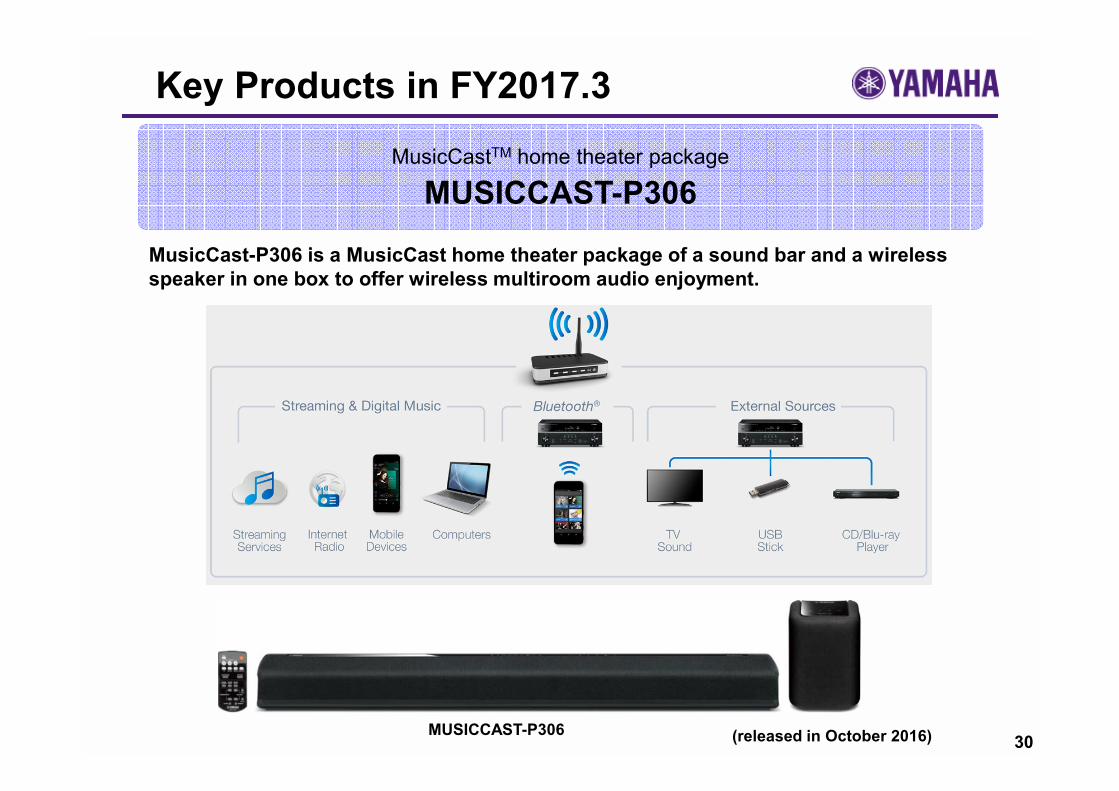
MusicCastTM home theater package
MUSICCAST-P306
30
MusicCast-P306 is a MusicCast home theater package of a sound bar and a wireless speaker in one box to offer wireless multiroom audio enjoyment.
(released in October 2016)MUSICCAST-P306
Key Products in FY2017.3
In this report, the figures forecast for the Company’s future performance have been calculated on the basis of information currently available to Yamaha and the Yamaha Group. Forecasts are, therefore, subject to risks and uncertainties.
Accordingly, actual performance may differ greatly from our predictions depending on changes in the economic conditions surrounding our business, demand trends, and the value of key currencies, such as the U.S. dollar and the euro.