analysis of protein sumoylation and its role in alzheimer
TRANSCRIPT

Analysis of protein SUMOylation and its role in
Alzheimer's disease using mouse models
Dissertation
for the award of the degree
"Doctor rerum naturalium" (Dr. rer. nat.)
of the Georg-August-Universität Göttingen
within the doctoral program Biology
of the Georg-August University School of Science (GAUSS)
submitted by
Trayana Hristova Stankova
from Harmanli, Bulgaria
Göttingen, 2016

2
Thesis Committee
Prof. Dr. Nils Brose
Department of Molecular Neurobiology, Max Planck Institute for Experimental Medicine
Dr. Judith Stegmüller
Department of Neurology, University Clinical Centre Aachen
Prof. Dr. Thomas Bayer
Division of Molecular Psychiatry, University Medical Center Göttingen
Members of the Examination Board
Reviewer: Prof. Dr. Nils Brose
Department of Molecular Neurobiology, Max Planck Institute for Experimental Medicine
Second Reviewer: Dr. Judith Stegmüller
Department of Neurology, University Clinical Centre Aachen
Further members of the Examination Board:
Prof. Dr. Thomas Bayer
Division of Molecular Psychiatry, University Medical Center Göttingen
Prof. Dr. Christian Griesinger
Department of NMR-based Structural Biology, Max Planck Institute for Biophysical
Chemistry
Prof. Dr. Dr. Hannelore Ehrenreich
Department of Clinical Neuroscience, Max Planck Institute for Experimental Medicine
Prof. Dr. Ralf Heinrich
Department of Cellular Neurobiology, Schwann-Schleiden Research Centre
Date of the oral examination: February 2nd, 2017

3
Declaration
I hereby declare that this thesis was written independently with the help of no other
sources than those cited.
Trayana Stankova

4
Table of contents
Table of contents ....................................................................................................................... 4
List of abbreviations ................................................................................................................. 7
List of figures .......................................................................................................................... 10
Abstract ................................................................................................................................... 12
1. Introduction ........................................................................................................................ 14
1.1. Ubiquitination and ubiquitin-like protein modifications ...................................................... 14
1.1.1. Ubiquitin .............................................................................................................................. 14
1.1.2. Ubiquitin-like proteins......................................................................................................... 15
1.2. SUMOylation ............................................................................................................................ 17
1.2.1. The SUMO proteins ............................................................................................................ 17
1.2.2. SUMO conjugation .............................................................................................................. 19
1.2.3. Essentiality of SUMOylation .............................................................................................. 21
1.2.4. Consequences of SUMOylation .......................................................................................... 22
1.2.5. SUMOylation and human disease pathogenesis .................................................................. 23
1.3. SUMOylation in neurons ......................................................................................................... 24
1.3.1. Subcellular localization of the SUMOylation machinery in neurons .................................. 24
1.3.2. Spatiotemporal distribution of the SUMOylation machinery in the developing mammalian
brain ............................................................................................................................................... 26
1.3.3. SUMOylation in the neuronal nucleus ................................................................................ 27
1.3.4. Extranuclear SUMOylation in neurons ............................................................................... 28
1.3.5. SUMOylation and neurodegenerative diseases ................................................................... 30
1.4. Alzheimer's disease ................................................................................................................... 32
1.4.1. Symptoms of Alzheimer's disease ....................................................................................... 32
1.4.2. Pathological changes in Alzheimer's disease ...................................................................... 33
1.4.3. Etiology of Alzheimer's disease .......................................................................................... 35
1.4.4. Pathogenic mechanisms of Alzheimer's disease .................................................................. 36
1.4.5. Mouse models of Alzheimer's disease ................................................................................. 40
1.5. SUMO in Alzheimer's disease ................................................................................................. 42
1.5.1. SUMOylation of APP .......................................................................................................... 42
1.5.2. Effect of SUMO on APP processing and Aβ levels ............................................................ 42
1.5.3. Effect of Aβ levels on SUMO ............................................................................................. 44
1.5.4. SUMO and tau ..................................................................................................................... 46
1.5.5. SUMO in Alzheimer's disease patients ............................................................................... 47
1.5.6. Other links between SUMO and Alzheimer's disease ......................................................... 48
1.6. Investigating SUMOylation ..................................................................................................... 48
1.7. Aims of the present study ........................................................................................................ 50
2. Materials and Methods ...................................................................................................... 52
2.1. Animals ...................................................................................................................................... 52
2.2. Molecular biology ..................................................................................................................... 52
2.2.1. Oligonucleotides .................................................................................................................. 52
2.2.2. Plasmids ............................................................................................................................... 54
2.2.3. Bacterial strains ................................................................................................................... 58
2.2.4. Bacterial transformation ...................................................................................................... 58
5
2.2.5. Plasmid DNA preparation ................................................................................................... 59
2.2.6. BAC DNA preparation ........................................................................................................ 60
2.2.7. DNA extraction from agarose gel ........................................................................................ 61
2.2.8. Phenol/chloroform extraction of the targeting vector .......................................................... 61
2.2.9. Recombineering ................................................................................................................... 61
2.2.10. Agarose gel electrophoresis ............................................................................................... 62
2.2.11. TOPO cloning .................................................................................................................... 62
2.2.12. Standard cloning procedures ............................................................................................. 62
2.3. Cell cultures .............................................................................................................................. 62
2.3.1. Mouse embryonic fibroblasts .............................................................................................. 62 2.3.1.1. Mouse embryonic fibroblasts culture .......................................................................................... 62 2.3.1.2. Inactivation of MEFs .................................................................................................................. 63
2.3.2. Embryonic stem cells .......................................................................................................... 63 2.3.2.1. Embryonic stem cells culture ...................................................................................................... 63 2.3.2.2. Electroporation of embryonic stem cells ..................................................................................... 64 2.3.2.3. Picking embryonic stem cell colonies ......................................................................................... 64 2.3.2.4. Freezing 96-well plates with embryonic stem cells .................................................................... 65 2.3.2.5. Isolating embryonic stem cell DNA and validation of positive embryonic stem cell clones ...... 65
2.3.3. HEK293FT cells .................................................................................................................. 66 2.3.3.1. HEK293FT cells culture ............................................................................................................. 66 2.3.3.2. HEK293FT cells transfection ...................................................................................................... 66
2.4. Generation of the Strep-Myc-SUMO3 knock-in mouse line and genotyping strategy....... 66
2.5. Biochemistry ............................................................................................................................. 68
2.5.1. Antibodies ........................................................................................................................... 68
2.5.2. Basic characterization of the Strep-Myc-SUMO3 knock-in mouse line ............................. 68
2.5.3. Quantitative Western Blots to investigate SUMO1 conjugation levels .............................. 69
2.5.4. Subcellular fractionation of brain tissue ............................................................................. 69
2.5.5. SDS-PAGE and Western blotting for testing SUMO3 tags ............................................... 70 2.5.5.1. Sample preparation ..................................................................................................................... 70 2.5.5.2. SDS-PAGE and Western blotting ............................................................................................... 70
2.6. Immunohistochemistry ............................................................................................................ 72
2.6.1. Antibodies ........................................................................................................................... 72
2.6.2. Tissue preparation ............................................................................................................... 73
2.6.3. Immunostaining ................................................................................................................... 74
2.6.4. Image acquisition................................................................................................................. 74
2.6.5. Figure preparation and image analysis ................................................................................ 74
2.7. Statistics ..................................................................................................................................... 74
3. Results ................................................................................................................................. 76
3.1. Generation and basic characterization of a Strep-Myc-SUMO3 knock-in mouse line ...... 76
3.1.1. Choosing the appropriate tag ............................................................................................... 76
3.1.2. Generation of the targeting vector ....................................................................................... 77
3.1.3. Generation of the SUMO3 knock-in mouse line ................................................................. 80
3.1.4. Basic characterization of the SUMO3 knock-in mouse line ............................................... 82
3.2. Analysis of SUMO1 conjugation profile in a mouse model of Alzheimer's disease ............ 92
3.2.1. Investigation of the localization of SUMO1 upon Alzheimer's disease pathology ............. 92
3.2.2. Investigation of SUMO1 conjugation levels upon Alzheimer’s disease pathology .......... 103
4. Discussion .......................................................................................................................... 112
4.1. Generation and basic characterization of a Strep-Myc-SUMO3 knock-in mouse line .... 112

6
4.1.1. Strep-Myc-SUMO3 mouse line as a model for identification of SUMO3 substrates ....... 112
4.1.2. Strep-Myc-SUMO3 mouse line as a model for localization of SUMO3 ........................... 113
4.2. Analysis of SUMO1 conjugation profile in a mouse model of Alzheimer's disease .......... 114
4.2.1. 5xFAD as a model to study Alzheimer's disease ............................................................... 115
4.2.2. Investigation of the localization of SUMO1 upon Alzheimer's disease pathology ........... 116
4.2.3. Investigation of SUMO1 conjugation levels upon Alzheimer's disease pathology ........... 117
4.2.4. Conclusions and outlook ................................................................................................... 120
References ............................................................................................................................. 121
Acknowledgements ............................................................................................................... 140

7
List of abbreviations
AD Alzheimer's disease
ALS amyotrophic lateral sclerosis
AMPA -amino-3-hydroxy-5-methyl-4-isoxazolepropionic acid
A. nidulans Aspergillus nidulans
ANOVA analysis of variance
APH-1 anterior pharynx-defective 1
APLP amyloid precursor-like protein
APOE apolipoprotein E
APP amyloid precursor protein
AR androgen receptor
Atg autophagy-related
ATP adenosine triphosphate
BAC bacterial artificial chromosome
BACE1 β-site APP-cleaving enzyme 1
BCA assay bicinchoninic acid assay
BMAL1 brain and muscle Arnt-like protein 1
BSA bovine serum albumin
CALHM1 calcium homeostasis modulator 1
CASK calcium/calmodulin-dependent serine protein kinase
CA Cornu ammonis
CREB cAMP response element binding protein
CtBP1 C-terminal-binding protein 1
Ctip2 chicken ovalbumin upstream promoter transcription factor-interacting protein 2
ddH2O double-distilled water
DEAE diethylaminoethyl
DeSI deSUMOylating isopeptidase
DMEM Dulbecco's modified eagle medium
DMSO dimethyl sulfoxide
DUBs deubiquitinating enzymes
DNA deoxyribonucleic acid
dNTPs deoxynucleotide triphosphates
DRP1 dynamin-related protein 1
E15 embryonic day 15
EAAT2 excitatory amino acid transporter 2
ECL enhanced chemiluminiscence
E. coli Escherichia coli
EDTA ethylendiaminetetraacetic acid
El eluate
ER endoplasmic reticulum
ES cells embryonic stem cells
FAD familial Alzheimer's disease
FAT10 human leukocyte antigen F-associated transcript 10

8
FBS fetal bovine serum
GFP green fluorescent protein
GLUT glucose transporter
HBmg cells H4 cells stably expressing human Myc-BACE1
HDAC histone deacetylase
HEK cells human embryonic kidney cells
HEPES 4-(2-hydroxyethyl)-1-piperazineethanesulfonic acid
het heterozygous
HRP horseradish peroxidase
HSV-TK herpes simplex virus thymidine kinase
Hub1 homologous to ubiquitin 1
IDE insulin-degrading enzyme
INP input
ISG15 interferon-stimulated gene 15
KI knock-in
LB Luria broth
LTD long-term depression
LTP long-term potentiation
MAP2 microtubule-associated protein 2
MCF-7 Michigan Cancer Foundation 7
MeCP2 methyl-CpG-binding protein 2
MEF2A myocyte-specific enhancer factor 2A
MEFs mouse embryonic fibroblasts
min minutes
mRNA messenger ribonucleic acid
Nedd8 neural precursor cell expressed, developmentally down-regulated 8
NEM N-ethylmaleimide
NGFR nerve growth factor receptor
NGS normal goat serum
NIID neuronal intranuclear inclusion disorder
NMDA N-methyl-D-aspartic acid
OD optical density
Pax paired box
PBS phosphate buffered saline
PBST phosphate buffered saline with Tween 20
PCNA proliferating cell nuclear antigen
PCR polymerase chain reaction
PE phosphatidylethanolamine
PEN-2 presenilin enhancer 2
Pen/Strep penicillin/streptomycin
PFA paraformaldehyde
PIAS protein inhibitor of activated STAT
PML promyelocytic leukemia
PMSF phenylmethylsulfonyl fluoride

9
PS presenilin
PTEN phosphatase and tensin homologue
RAGE receptor for advanced glycation endproducts
RanBP2 Ran-binding protein 2
RIM1 Rab3-interacting molecule 1
RING really interesting new gene
RIPA buffer Radioimmunoprecipitation assay buffer
RNF4 RING finger protein 4
RT room temperature
RT-PCR reverse transcription polymerase chain reaction
RanGAP1 Ran GTPase-activating protein 1
Rhes Ras homologue enriched in striatum
rpm revolutions per minute
SAE1 SUMO-activating enzyme 1
SAE2 SUMO-activating enzyme 2
sAPP secreted APP
SBMA spinal and bulbar muscular atrophy
SDS-PAGE sodium dodecyl sulfate polyacrylamide gel electrophoresis
sec seconds
SEM standard error of the mean
SENP sentrin-specific protease
SERCA sarco/endoplasmic reticulum Ca2+-ATPase
SIM SUMO-interacting motif
Smchd1 structural maintenance of chromosome flexible hinge domain containing 1
SOC super optimal broth with catabolite repression
SOD1 superoxide dismutase 1
SORL1 sortilin-related receptor, L (DLR class) A repeats containing
S. pombe Schizosaccharomyces pombe
STET buffer sucrose/Triton/EDTA/Tris buffer
SUMO small ubiquitin-like modifier
TBE buffer Tris/borate/EDTA buffer
TDG thymine DNA glycosylase
TE buffer Tris-EDTA buffer
TGN trans-Golgi network
TIF1 transcription intermediary factor 1
TOPORS TOP1 binding arginine/serine rich protein
tRNA transfer ribonucleic acid
UBL5 ubiquitin-like protein 5
UBQLN1 ubiquilin 1
Ufm1 ubiquitin-fold modifier 1
Ulp1 ubiquitin-like-specific protease 1
Urm1 ubiquitin-related modifier 1
WT wild type
Zbtb20 zinc finger and BTB domain containing 20

10
List of figures
Fig. 3.1. Testing of SUMO3 tags for the generation of a SUMO3 knock-in mouse model.
Fig. 3.2. Cloning strategy for the generation of the Strep-Myc SUMO3 knock-in targeting
vector.
Fig. 3.3. Generation of the Strep-Myc-SUMO3 mouse model.
Fig. 3.4. Anti-Myc affinity purification of free Strep-Myc-SUMO3 and Strep-Myc-SUMO3-
conjugated proteins from Strep-Myc-SUMO3 knock-in mice.
Fig. 3.5. Analysis of the localization of Strep-Myc-SUMO3 in brain sections from Strep-Myc-
SUMO3 knock-in mice using a mouse anti-Myc antibody from Sigma (clone 9E10).
Fig. 3.6. Analysis of the localization of Strep-Myc-SUMO3 in brain sections from Strep-Myc-
SUMO3 knock-in mice using a rabbit anti-Myc antibody from Sigma.
Fig. 3.7. Analysis of the localization of Strep-Myc-SUMO3 in brain sections from Strep-Myc-
SUMO3 knock-in mice using a rabbit anti-Myc antibody from Santa Cruz.
Fig. 3.8. Analysis of the localization of Strep-Myc-SUMO3 in brain sections from Strep-Myc-
SUMO3 knock-in mice using a mouse anti-Myc antibody from Santa Cruz (clone 9E11).
Fig. 3.9. Analysis of the localization of Strep-Myc-SUMO3 in brain sections from Strep-Myc-
SUMO3 knock-in mice using a mouse anti-Strep antibody from Iba.
Fig. 3.10. Analysis of the influence of His6-HA tagging of SUMO1 on Alzheimer’s disease
pathology in the subiculum of His6-HA-SUMO1;5xFAD mice.
Fig. 3.11. Analysis of the influence of His6-HA tagging of SUMO1 on Alzheimer’s disease
pathology in cortical layer V of His6-HA-SUMO1;5xFAD mice.
Fig. 3.12. Analysis of the localization of His6-HA-SUMO1 in the subiculum of 16-week-old
mice.
Fig. 3.13. Analysis of the localization of His6-HA-SUMO1 in the cortical layer V of 16-week-
old mice.
Fig. 3.14. Analysis of the non-nuclear anti-HA signal produced by the goat anti-HA antibody
in 24-week-old mice.
Fig. 3.15. Analysis of the non-nuclear anti-HA signal produced by a mouse anti-HA antibody
in 24-week-old mice.
Fig. 3.16. Subcellular localization of His6-HA-SUMO1 in the brain of 36-week-old mice.
Fig. 3.17. Analysis of the nuclear anti-HA signal intensity in the subiculum of 8-week-old
mice.
Fig. 3.18. Analysis of the nuclear anti-HA signal intensity in the cortical layer V of 8-week-
old mice.

11
Fig. 3.19. Analysis of the nuclear anti-HA signal intensity in the subiculum of 12-week-old
mice.
Fig. 3.20. Analysis of the nuclear anti-HA signal intensity in the cortical layer V of 12-week-
old mice.
Fig. 3.21. Analysis of the nuclear anti-HA signal intensity in the subiculum of approximately
48-week-old mice.
Fig. 3.22. Analysis of the nuclear anti-HA signal intensity in the cortical layer V of
approximately 48-week-old mice.
Fig. 3.23. Quantification of the nuclear anti-HA signal intensity in 8-, 12-, 16- and
approximately 48-week-old mice.
Fig. 3.24. Quantitative Western blot of global His6-HA-SUMO1 conjugation levels in
hippocampus and cortex.

12
Abstract
Post-translational modifications serve as a cellular mechanism for the regulation of
the activity, stability and localization of proteins. SUMOylation is a dynamic and reversible
post-translational modification, which entails the attachment of a SUMO protein to a lysine
residue of the target protein. SUMOylation is involved in the regulation of numerous cellular
processes including transcription, nucleocytoplasmic trafficking, and DNA repair. Three or
four SUMO paralogs are present in mammals – SUMO1, SUMO2, SUMO3 and SUMO4.
SUMO2 and SUMO3 exhibit extremely high sequence homology and therefore cannot be
distinguished by antibodies. Interestingly, SUMO2/3 conjugation has been shown to change
dramatically in response to aberrant cellular conditions. The identification of endogenous
SUMO substrates has long been hindered by the transient nature of SUMOylation, the lack of
reliable antibodies for affinity purification, and the modification of only a small percentage of
a given SUMO substrate at a given time.
Thus, in a first project, analogous to a His6-HA-SUMO1 knock-in mouse model
generated in our lab, we generated a Strep-Myc-SUMO3 knock-in mouse model expressing
Strep-Myc-tagged SUMO3 instead of wild type SUMO3 from the endogenous SUMO3 locus.
Importantly, a main advantage of this model is the possibility to distinguish specifically SU-
MO3 from SUMO2. Strep-Myc-SUMO3 knock-in and wild type mice brain homogenates
were used to perform anti-Myc affinity purification, which resulted in the enrichment of free
SUMO3 and SUMO3 conjugates in the eluate from the knock-in mice. Thus, we proved that
the newly generated mouse model can be used as a tool for the identification of SUMO3 sub-
strates. However, despite the utilization of several anti-Myc and one anti-Strep antibody, we
were not able to clearly localize Strep-Myc-SUMO3 in brain sections of SUMO3 knock-in
mice as the antibodies showed different staining patterns. This mouse model will be further
used to study SUMO3 conjugation profiles under physiological and non-physiological condi-
tions.
A constantly increasing number of studies have suggested a link between SUMOylation and
Alzheimer's disease. Thus, in a second project, we crossbred His6-HA-SUMO1 knock-in mice
with 5xFAD, a mouse model of Alzheimer's disease, in order to assess SUMO1 conjugation
profile in the context of Alzheimer's disease pathology. Using mice at different stages of dis-
ease progression, we intended to identify specific changes in the localization of SUMO1 and
in the global SUMO1 conjugation levels. Anti-HA immunostaining of brain sections showed
that in subiculum and cortical layer V SUMO1 exhibited nuclear presence in both His6-HA-
SUMO1 and His6-HA-SUMO1;5xFAD mice at any of the ages examined. Furthermore, two

13
different anti-HA antibodies produced two different types of non-nuclear anti-HA signal in
His6-HA-SUMO1;5xFAD mice. While one of the antibodies produced anti-HA signal localiz-
ing to amyloid plaques, the other resulted in line-shaped signals or signals with the shape of
amorphous mass, with some of the line-shaped signal surrounding amyloid plaques. Im-
portantly, both anti-HA antibodies produced similar signals in the 5xFAD non-knock-in mice
which strongly speaks against specificity of the signal. The predominantly nuclear localiza-
tion of His6-HA-SUMO1 in both 5xFAD and non-5xFAD mice was confirmed by subcellular
fractionation followed by Western blot. Regarding SUMO1 conjugation levels upon Alzhei-
mer's disease pathology, anti-HA Western blot did not reveal any significant differences be-
tween His6-HA-SUMO1 and His6-HA-SUMO1;5xFAD mice in both cortex and hippocampus
at any of the examined ages. Furthermore, a quantitative comparison of the anti-HA signal in
the neuronal nuclei of His6-HA-SUMO1 and His6-HA-SUMO1;5xFAD in both subiculum
and cortical layer V did not reveal substantial differences between the two genotypes. A mi-
nor increase of 25.8% was observed in the pyramidal neurons of cortical layer V of 8-week-
old His6-HA-SUMO1;5xFAD mice when compared to age-matched His6-HA-SUMO1 mice.
In summary, we did not discover substantial changes in SUMO1 localization and SUMO1
conjugation levels in the context of increased amyloid burden. However, we cannot conclude
that the SUMO1 profile is undisturbed upon Alzheimer's disease pathology as changes in the
SUMOylation pattern of individual proteins may not be detected by the techniques utilized in
this study. Thus, the next step will be the investigation of differentially SUMOylated sub-
strates by anti-HA affinity purification of brain homogenates from His6-HA-SUMO1, His6-
HA-SUMO1;5xFAD, 5xFAD and wild type mice followed by mass spectrometry analysis.

Introduction
14
1. Introduction
Bacterial and eukaryotic cells face constantly changing external environments and
internal conditions. In order to preserve their homeostasis, cells require mechanisms to
carefully regulate the activity, stability, function and localization of proteins. One of the
mechanisms used by cells in this context is the employment of post-translational protein
modifications (van der Veen & Ploegh, 2012; Beltrao et al., 2013). Typically, post-
translational modifications are covalent modifications of amino acid residues of proteins
(Prabakaran et al., 2012). There is an enormous variety of post-translational modifications
which contributes substantially to the large number of ways by which proteins are regulated.
While some modifications, such as phosphorylation, acetylation and methylation, include the
addition of a small moiety, others, such as ubiquitination and ubiquitin-like modifications,
entail the attachment of a whole polypeptide to the target protein (Beltrao et al., 2013). The
focus of this thesis will be SUMOylation, a key ubiquitin-like protein modification.
1.1. Ubiquitination and ubiquitin-like protein modifications
1.1.1. Ubiquitin
In 1978, a group of scientists studying in vitro proteolysis by using lysates from rabbit
reticulocytes described an ATP-dependent proteolysis process that requires a substance with
an approximate molecular weight of 9 kDa, which is unusually heat-stable and is degraded by
proteolytic enzymes (Ciechanover et al., 2012; Callis, 2014). Two years later, the same
authors reported that when the newly discovered protein is incubated with the reticulocytes
fraction retained by DEAE cellulose in the presence of ATP, it ‘enters into high molecular
weight conjugates’ (Ciechanover et al., 1980; Callis, 2014). This work brought the team the
2004 Nobel Prize in Chemistry ‘for the discovery of ubiquitin-mediated protein degradation’
(Callis, 2014).
Ubiquitin is a eukaryotic 76-amino-acid polypeptide that adopts a β-grasp fold
(Komander, 2009; Komander & Rape, 2012; Callis, 2014). Interestingly, the protein shows an
extremely high degree of conservation (Komander & Rape, 2012; Callis, 2014). Ubiquitin is
usually attached to its substrates by formation of a linkage between the C-terminal glycine
residue of ubiquitin and the ε-amino group of a lysine (Komander, 2009; Callis, 2014).
The attachment of ubiquitin requires a specific enzymatic cascade including E1
activating enzymes, E2 conjugating enzymes and E3 ligases. Special deubiquitinating
enzymes, referred as DUBs, release the ubiquitin from the substrates (Callis, 2014).

Introduction
15
Substrates can be modified by only one ubiquitin molecule (monoubiquitination) and by
multiple single ubiquitin molecules at multiple different sites (multi-monoubiquitination).
Further, ubiquitin can be conjugated to substrates in the form of polyubiquitin chains.
Depending on the residues used for the chain formation, polyubiquitin chains of types Met1,
Lys6, Lys11, Lys27, Lys29, Lys33, Lys48, Lys63 can be generated. Additionally, the so-
called ‘linear’ chains are generated by head-to-tail linkage of ubiquitin molecules through the
α-amino group of their N-terminus. Furthermore, ubiquitin can form mixed chains including
different types of ubiquitin-ubiquitin linkages and branched chains (Komander, 2009;
Komander & Rape, 2012).
While ubiquitin was first described as a protein involved in ATP-dependent
proteolysis, its involvement in a variety of non-proteolytic processes has become obvious.
The proteolytic function of ubiquitin is mostly mediated by Lys48-linked ubiquitin chains.
The proteins that need to be degraded are conjugated to Lys48 ubiquitin chains, which are
recognized by the proteasome. Interestingly, another common type of ubiquitin chain
formation - Lys63 - is not involved in proteasomal degradation but, for example, in DNA-
damage response and signalling processes. Monoubiquitination and multi-
monoubiquitination, likewise, are utilized for outcomes different from proteasomal
degradation (Komander, 2009). Thus, the complexity of the biological outcomes of
ubiquitination goes far beyond mere tagging for degradation.
1.1.2. Ubiquitin-like proteins
Ubiquitin-like proteins are eukaryotic proteins that resemble ubiquitin in sequence and
three-dimensional structure. Most of the ubiquitin-like proteins also require an enzymatic
cascade for their conjugation to proteins that is similar to the enzymatic cascade for the
conjugation of ubiquitin (van der Veen & Ploegh, 2012). Furthermore, most of them possess a
C-terminal diglycine motif which is uncovered after proteolysis of the proteins (Flotho &
Melchior, 2013).
In 1987, a 15 kDa interferon-stimulated protein was shown to share a significant
sequence similarity with ubiquitin (Haas et al., 1987). Later, this protein was shown to be
conjugated to other proteins (Loeb & Haas, 1992; Hochstrasser, 2009). This protein, called
ISG15 (interferon-stimulated gene 15), was the first discovered ubiquitin-like modifier.
ISG15 has two ubiquitin-like domains that show sequence and structural homology to
ubiquitin (Zhang & Zhang, 2011). ISG15 expression is induced by type I interferons, which
are secreted by cells infected with viruses. ISG15 is conjugated to both viral and host proteins.

Introduction
16
Interestingly, ISG15 can also be secreted from IFN-treated T cells, monocytes, B cells and
epithelial cells and might then function as a cytokine (D'Cunha et al., 1996; van der Veen &
Ploegh, 2012).
Nedd8 is one of the set of genes discovered to be downregulated in murine neural
precursor cells during brain development. In 1993, this gene was named neural precursor cell-
expressed, developmentally downregulated 8 (Kumar et al., 1993; Herrmann et al., 2007).
Nedd8 is the ubiquitin-like modifier with the highest sequence similarity to ubiquitin. Nedd8
can be conjugated to almost all members of the cullin family, which are scaffold subunits of
ubiquitin E3 ligase complexes (Herrmann et al., 2007; van der Veen & Ploegh, 2012). Many
of the cullin substrates play a role in cell cycle regulation, so that Nedd8 also has a function in
this context (van der Veen & Ploegh, 2012). Interestingly, Nedd8 conjugation to proteins can
also result in their degradation by the proteasome (Herrmann et al., 2007).
FAT10 (human leukocyte antigen F-associated transcript 10) is a ubiquitin-like protein
that contains two ubiquitin-like domains, and for this reason was first called ‘diubiquitin’
(Schmidtke et al., 2014). In mammals, FAT10 is expressed in mature dendritic cells and B
cells, while in other cell types its expression is induced by IFNγ and TNFα (van der Veen &
Ploegh, 2012). FAT10 targets conjugated substrates for degradation by the 26S proteasome
(Schmidtke et al., 2014).
Ufm1 (ubiquitin-fold modifier 1) is a ubiquitin-like protein present in almost all
eukaryotes with the exception of fungi. Even though not much is known about the biological
function of Ufm1 conjugation, one of the processes that Ufm1 is mostly related to, is the
endoplasmic reticulum stress response (Herrmann et al., 2007; Daniel & Liebau, 2014).
Furthermore, the Ufm1 cascade has been related to differentiation of erythroid progenitors
and cell cycle control (Daniel & Liebau, 2014).
Atg8 and Atg12 are ubiquitin-like proteins related to the process of macroautophagy,
which involves the sequestering of cytoplasm, macromolecules or whole organelles in the
double-membrane autophagosome, subsequent autophagosome-lysosome fusion, and the
degradation of cargo (van der Veen & Ploegh, 2012). Autophagy, in general, is a mechanism
for elimination of non-functional cellular components and recycling of cellular constituents
(Yang & Bassham, 2015). Atg8 and Atg12 are needed for the expansion and growth of the
autophagosomal membrane. Atg12 is conjugated to a lysine residue of Atg5 which interacts
with Atg16L1 and an Atg12-Atg5-Atg16L1 oligomer is formed by homo-oligomerization of
Atg16L1. On the other hand, Atg8 does not get conjugated to proteins but to the phospholipid

Introduction
17
phosphatidyletanolamine (PE), the Atg12-Atg5-Atg16L1 oligomer being involved in the
conjugation (van der Veen & Ploegh, 2012).
Yet another ubiquitin-like protein that has been known is Hub1 (homologous to
ubiquitin 1), also called beacon or UBL5 in mammals. A unique feature of Hub1 is the
presence of dityrosine instead of diglycine at its C-terminus (van der Veen & Ploegh, 2012).
In fission yeast, a role of Hub1 in pre-mRNA splicing has been described which is
independent of conjugation (Wilkinson et al., 2004; Herrmann et al., 2007).
Urm1 (ubiquitin-related modifier 1) is regarded as a link between prokaryotic sulfur
carriers and eukaryotic protein modifiers and is involved in two types of modifications (van
der Veen & Ploegh, 2012). Firstly, resembling prokaryotic sulfur carriers, Urm1 transfers
sulfur to the wobble uridine in several tRNA molecules. On the other hand, similar to protein
modifiers, it can become conjugated to proteins (Vierstra, 2012).
1.2. SUMOylation
SUMOylation is a highly dynamic and reversible post-translational modification that
involves the covalent attachment of a SUMO (small ubiquitin-like modifier) protein to a
lysine residue of the target protein.
1.2.1. The SUMO proteins
The discovery of the first SUMO gene dates back to 1995 when Meluh and Koshland
discovered it in a genetic screen for Mif2 suppressors (Meluh & Koshland, 1995). One year
later, Matunis and collaborators demonstrated that RanGAP1 can be modified by SUMO
(Matunis et al., 1996; Geiss-Friedlander & Melchior, 2007).
The SUMO proteins have an approximate size of 10 kDa and are present in all
eukaryotic organisms. While their three-dimensional structure closely resembles the one of
ubiquitin, the SUMO proteins exhibit less than 20% sequence identity with ubiquitin and their
surface-charge distribution is different from that of ubiquitin. A difference in the three-
dimensional structures of the SUMO proteins and ubiquitin is the presence of an N-terminal
unstructured domain in SUMO proteins, which is not present in ubiquitin. The formation of
SUMO chains is attributed to this domain (Geiss-Friedlander & Melchior, 2007) .
While some eukaryotes, such as Saccharomyces cerevisiae and Drosophila
melanogaster, have only one SUMO gene in their genome, in humans there are four SUMO
proteins – SUMO1, SUMO2, SUMO3 and SUMO4. SUMO1, SUMO2 and SUMO3 are
expressed ubiquitously while SUMO4 expression seems to be localized mainly to lymph

Introduction
18
nodes, kidney and spleen. The sequence identity of the human mature forms of SUMO2 and
SUMO3 is 97%. Thus, SUMO2 and SUMO3 are referred to as SUMO2/3. Conversely,
mature human SUMO2 shares only approximately 50% identity with mature human SUMO1
(Johnson, 2004; Geiss-Friedlander & Melchior, 2007; Flotho & Melchior, 2013).
One of the main differences between SUMO1 and SUMO2/3 is the ratio between the
free pool and the conjugated form. Almost all of the SUMO1 protein present in cells is
conjugated to substrates. Oppositely, there is a large pool of free unconjugated SUMO2/3
(Saitoh & Hinchey, 2000; Johnson, 2004; Hay, 2005). However, upon certain aberrant cellular
conditions, the conjugation of SUMO2/3 increases dramatically. Indeed, several studies have
demonstrated a dramatic increase of SUMO2/3 conjugates upon heat shock in cell cultures
(Saitoh & Hinchey, 2000; Golebiowski et al., 2009; Castoralova et al., 2012). Furthermore,
oxygen and glucose deprivation in dissociated primary rat cortical neurons also results in an
increase of SUMO2/3 conjugation (Geiss-Friedlander & Melchior, 2007; Guo et al., 2013;
Guo & Henley, 2014). Dramatic increase in SUMO2/3-ylation has also been shown in vivo
upon conditions such as hibernation torpor, hypothermic cardiopulmonary bypass, etc. (Lee et
al., 2007; Cimarosti et al., 2008; Yang et al., 2008a; b; Yang et al., 2009; Wang et al., 2012;
Yang et al., 2014).
Another important difference between SUMO1 and SUMO2/3 is the presence of a
consensus ψKxE sequence (Lys11) in SUMO2/3 but not in SUMO1, which is used as a
conjugation site for SUMO chain formation (Johnson, 2004). Tatham and collaborators first
demonstrated the formation of polySUMO chains by SUMO2 and SUMO3 in vitro involving
the aforementioned Lys11 residue. The study also demonstrated formation of poly-SUMO2
chains in cell culture (Tatham et al., 2001; Vertegaal, 2010; Flotho & Melchior, 2013).
However, there is evidence that the formation of SUMO chains may not only depend on the
presence of consensus SUMOylation sites. Even though Matic and collaborators implied that
conjugation of SUMO1 terminates the formation of SUMO2/3 due to the lack of a consensus
site (Matic et al., 2008), other groups demonstrated the formation of SUMO1 chains in vitro
(Pichler et al., 2002; Pedrioli et al., 2006; Yang et al., 2006). Furthermore, mass
spectrometric analyses have provided evidence in cell culture for the formation of SUMO
chains that involve several non-consensus SUMOylation sites in SUMO1, SUMO2 and
SUMO3 (Hsiao et al., 2009; Blomster et al., 2010; Matic et al., 2010; Bruderer et al., 2011;
Flotho & Melchior, 2013). The knowledge about the functional significance of SUMO chain
formation is restricted (Flotho & Melchior, 2013). Notably, one of the interesting functions of
SUMO chain formation is linked to the ubiquitin-proteasome system. The ubiquitin ligase in

Introduction
19
mammals RNF4 is a SUMO chain binder that conjugates ubiquitin to polySUMOylated
proteins and thus mediates their degradation via the proteasome (Tatham et al., 2008).
Furthermore, SUMO chains have been shown, for example, to exhibit a profound
accumulation upon heat shock (Golebiowski et al., 2009). SUMO chains have also been
implicated in mitosis and meiosis (Vertegaal, 2010).
An important point that needs to be mentioned is that the usage of the mammalian
SUMO2 and SUMO3 nomenclature has been confusing. Several groups follow the
nomenclature that was initially introduced by Saitoh and Hinchey in 2000, which defines
SUMO2 as the protein whose mature form is 92 amino acids long, while the mature form of
SUMO3 is 93 amino acids (Saitoh & Hinchey, 2000; Flotho & Melchior, 2013). However, in
the online databases, the nomenclature has been switched and this type of nomenclature is
used by other research groups. This can be misleading since not everybody is aware of these
discrepancies and publications rarely give a clear definition of the nomenclature that they use.
In this doctoral thesis, I have used the nomenclature that has been adopted by the online
databases.
The fourth SUMO paralog, SUMO4, shows high sequence similarity to SUMO2.
However, despite this high similarity, several reasons argue against an ability of SUMO4 to
be conjugated to substrates. First, the gene encoding SUMO4 lacks introns, which hints
towards SUMO4 being a pseudogene. Second, even though SUMO4 mRNA is expressed in
lymph, kidney and spleen (Bohren et al., 2004; Guo et al., 2004), information about the
presence of endogenous SUMO4 protein is lacking. Last, Owerbach and collaborators have
demonstrated that the presence of proline at a critical position in SUMO4 inhibits the
maturation needed for conjugation to substrates (Owerbach et al., 2005). However,
exogenously expressed SUMO4 can be processed to a mature form and be conjugated to
substrates upon stressful conditions (Geiss-Friedlander & Melchior, 2007; Wei et al., 2008;
Wilkinson & Henley, 2010; Flotho & Melchior, 2013).
1.2.2. SUMO conjugation
The enzymatic cascade for the conjugation of SUMO to substrates closely resembles
the ubiquitination cascade. SUMO proteins are first activated by the action of an E1 activating
enzyme. This enzyme is a heterodimer of two subunits, SUMO-activating enzyme 1 (SAE1;
also called Aos1) and SUMO-activating enzyme 2 (SAE2, also called Uba1). Initially, the
activation reaction involves the formation of a SUMO adenylate intermediate, a step that
requires ATP hydrolysis (Flotho & Melchior, 2013). Then, a thioester bond is formed

Introduction
20
between the C-terminal glycine of SUMO and the cysteine at the active site of SAE2.
Afterwards, the SUMO moiety is transferred from the active-site cysteine of the E1 enzyme to
the active-site cysteine of the E2 conjugating enzyme Ubc9 (Wilkinson & Henley, 2010).
Ubc9 plays the role of a donor of activated SUMO for the final reaction of conjugation of
SUMO to the ε-NH2 group of a lysine residue (Johnson, 2004). Notably, and in contrast to the
numerous E2 enzymes that conjugate ubiquitin to specific substrates, only one conjugating
enzyme has been found to conjugate SUMO (Komander, 2009). Besides its role as a donor of
activated SUMO, Ubc9 can also participate in the selection of substrates by directly binding
to consensus SUMOylation sites (Flotho & Melchior, 2013). The sequence of the consensus
site is ψKxD/E, where ψ is a large hydrophobic residue and x is any amino acid (Wilkinson et
al., 2010). The consensus SUMOylation sequence can be recognized if it is a part of an
extended loop or of an unstructured area (Geiss-Friedlander & Melchior, 2007). However, it
should be noted that SUMOylation can take place not only at a consensus SUMOylation site
and not all consensus sites can be SUMOylated (Wilkinson & Henley, 2010).
Even though high concentrations of Ubc9 can be sufficient for SUMO conjugation in
vitro, the process is normally assisted by the action of E3 ligases (Geiss-Friedlander &
Melchior, 2007; Flotho & Melchior, 2013). The largest group of SUMO E3 ligases described
till now possesses a characteristic SP-RING motif, which resembles the RING domain found
in many ubiquitin E3 ligases (Geiss-Friedlander & Melchior, 2007). The SP-RING ligases
bind non-covalently to Ubc9, the substrate, and SUMO (via a SIM (SUMO-interacting
motif)). Thus, these E3 ligases act as a platform that brings together SUMO-loaded Ubc9 and
the substrates and thus favours SUMO conjugation (Geiss-Friedlander & Melchior, 2007;
Wilkinson & Henley, 2010). In yeast, the SP-RING ligase family includes Siz1, Siz2, Mms21
and potentially Zip3. In humans, the members of the family are the PIAS (protein inhibitor of
activated STAT) proteins, namely PIAS1, PIAS3, PIASy, PIASxα, PIASxβ and Nse2/Mms21
(Flotho & Melchior, 2013).
A second type of SUMO E3 ligases is represented by the vertebrate-specific protein
RanBP2 (Geiss-Friedlander & Melchior, 2007). In 2012, Werner and collaborators
demonstrated that in vivo RanBP2 actually acts as an E3 ligase in a complex with Ubc9 and
SUMO1-conjugated RanGAP1 (Werner et al., 2012).
SUMO E3 ligase function has also been attributed to other proteins. One of them is
Pc2, which is a part of the multimeric polycomb repressive complex (PRC1) that facilitates
CtBP1 SUMOylation. Other proteins with E3 ligase activity are HDAC4, p14 Arf, and
TOPORS (Geiss-Friedlander & Melchior, 2007; Flotho & Melchior, 2013).

Introduction
21
The highly dynamic and reversible nature of SUMOylation is secured by the action of
SUMO proteases, which can rapidly cleave the SUMO moiety from substrates. Besides
deSUMOylation, the proteases are involved in the process of maturation of SUMO proteins.
Since all SUMO proteins are translated in the form of inactive precursors, they undergo
cleavage at their C-terminus, which exposes the diglycine motif needed for conjugation to
substrates. The first identified family of proteases is the Ulp/SENP family. The Ulp/SENP
family comprises two members in yeast, Ulp1 and Ulp2, and six in mammals, SENP1,
SENP2, SENP3, SENP5, SENP6 and SENP7. The mammalian proteins show differences with
regard to their SUMO paralog specificity, subcellular localization and preference for
performing SUMO maturation and/or deSUMOylation of substrates. Additional SUMO
proteases that were identified are DeSI-1 (deSUMOylating isopeptidase-1), DeSI-2, and
USPL1 (Wilkinson et al., 2010; Flotho & Melchior, 2013).
1.2.3. Essentiality of SUMOylation
The process of SUMOylation is essential for almost all eukaryotic organisms.
Exceptions are the fission yeast Schizosaccharomyces pombe and the fungus Aspergillus
nidulans. Even though not causing lethality, the disruption of the SUMO gene in both S.
pombe and A. nidulans results in pronounced growth defects (Tanaka et al., 1999; Wong et
al., 2008; Flotho & Melchior, 2013). Disruption of two of the eight SUMO genes in
Arabidopsis thaliana (AtSUMO1 and AtSUMO2) causes lethality (Saracco et al., 2007; Flotho
& Melchior, 2013). Disruption of Ubc9 in the chicken DT40 lymphocyte cell line, on the
other hand, causes chromosome segregation defects and eventually death by apoptosis
(Hayashi et al., 2002; Wilkinson & Henley, 2010). Finally, Ubc9-deficient mice die as
embryos (Nacerddine et al., 2005).
An interesting question that still remains to be fully answered concerns the
requirement of specific SUMO paralogs for the survival of an organism and the compensation
for the loss of one SUMO paralog by other paralogs. Alkuraya and collaborators reported the
case of a 5-year-old female with cleft lip and palate who has SUMO1 haploinsufficiency due
to an insertion in the SUMO1 gene. The authors went further and generated mice that bear a
β-galactosidase insertion in the SUMO1 gene and observed that 4 out of 46 heterozygous pups
showed cleft lip and palate. Furthermore, some pups homo- and heterozygous for the insertion
died as embryos or immediately after birth (Alkuraya et al., 2006). However, in 2008, two
studies reported the lack of lethality and any overt phenotypic changes in mice lacking
SUMO1, indicating that SUMO2/3 can compensate for lacking SUMO1 (Evdokimov et al.,

Introduction
22
2008; Zhang et al., 2008; Wilkinson & Henley, 2010). Furthermore, a recent study by Wang
and collaborators reported that while SUMO3-null mice are viable, SUMO2-null mice die as
embryos. In view of the extremely high sequence similarity between SUMO2 and SUMO3,
this finding was unexpected. However, using a quantitative RT-PCR to determine levels of
SUMO1, SUMO2 and SUMO3 in E7.5 and E8.5 embryos, the authors identified SUMO2 as
the most predominant form, being up to forty times more abundant than SUMO3 (Wang et
al., 2014).
1.2.4. Consequences of SUMOylation
SUMOylation can affect different protein characteristics, including localization,
stability, and activity. The molecular consequences of SUMOylation fall into three main
categories. First, SUMOylation can mask a binding site of a protein. For example,
SUMOylation of the ubiquitin-conjugating enzyme E2-25K blocks its interaction with the
ubiquitin E1 enzyme (Pichler et al., 2005; Geiss-Friedlander & Melchior, 2007; Wilkinson &
Henley, 2010). Second, conjugated SUMO can participate in the formation of a new
interaction surface for proteins that interact directly with SUMO or with a domain that is
created both by the substrate and conjugated SUMO. For example, transcriptional repression
by p300 is achieved by SUMO conjugation since HDAC6 is recruited by SUMO (Girdwood
et al., 2003; Geiss-Friedlander & Melchior, 2007; Wilkinson & Henley, 2010). Three,
SUMOylation can result in a change in the conformation of the substrate. Indeed,
SUMOylation of thymine DNA glycosylase (TDG) results in a conformational change in
TDG that leads to release from DNA (Geiss-Friedlander & Melchior, 2007; Wilkinson &
Henley, 2010).
The majority of SUMO substrates described till now are nuclear. Thus, SUMOylation
research has mainly focused on processes related to the nucleus, such as transcription, DNA
repair, chromatin remodelling, or formation of nuclear bodies (Flotho & Melchior, 2013). Up
to now, a large number of transcriptional activators, repressors, coactivators and corepressors
have been shown to be SUMOylated. Even though there are cases where SUMOylation leads
to transcriptional activation, SUMOylation appears to be mainly involved in transcriptional
repression (Johnson, 2004). For example, SUMOylation of the transcription factor Elk-1 is
required for its repressive activity (Yang et al., 2003). The involvement of SUMOylation in
DNA repair is exemplified by a variety of cases. One of them is the aforementioned
SUMOylation of TDG, an enzyme acting in the base excision repair pathway (Gill, 2004;
Bergink & Jentsch, 2009). Interestingly, histone proteins are also SUMO substrates (Gill,

Introduction
23
2004). SUMOylation is further involved in the regulation of a variety of processes by its
association with the formation of PML nuclear bodies (Sahin et al., 2014). Not only is
SUMOylation of PML of critical importance for the formation of nuclear bodies, but many of
the other components of PML bodies can be SUMOylated (Gill, 2004).
In spite of the enrichment of SUMO targets in the nucleus, SUMOylation is
unquestionably not restricted to this cellular compartment. A variety of SUMO modifications
have been reported for substrates residing outside of the nucleus. In 2004, Harder and
collaborators reported significant levels of SUMO1 conjugates in the mitochondrial fraction
of COS7 cells. Furthermore, they identified dynamin-related protein 1 (DRP1) as a SUMO1
substrate. DRP1 is involved in mitochondrial dynamics by mediating mitochondrial
fragmentation or fission. Upon transient transfection of SUMO1, mitochondrial fission was
found to be increased, likely, due to the fact that SUMO1 overexpression stabilizes DRP1
(Harder et al., 2004). Another example of a regulation of an extranuclear process by
SUMOylation is plasma membrane association. In 2012, Huang and collaborators revealed
that SUMOylation assists binding of PTEN (tumour suppressor phosphatase and tensin
homologue) to the plasma membrane (Huang et al., 2012; Flotho & Melchior, 2013).
Importantly, quantitative SUMOylation is attributed only to a few targets, such as
RanGAP1, while for the rest of the SUMO substrates only a small fraction of the available
protein is SUMOylated at any given time. The lack of quantitative SUMOylation complicates
the identification of SUMO targets and poses the question as to how a small amount of
modified protein can cause such a significant effect (Geiss-Friedlander & Melchior, 2007).
1.2.5. SUMOylation and human disease pathogenesis
The essential role of SUMOylation in regulating protein function decidedly determines
its crucial role in human disease pathogenesis. A variety of studies have focused on the link
between SUMOylation and tumorigenesis. For example, the levels of the E2 SUMO
conjugating enzyme Ubc9 have been shown to be increased in several human cancers, such as
lung adenocarcinoma, ovarian tumors, and melanoma-positive lymph nodes (McDoniels-
Silvers et al., 2002; Mo et al., 2005; Moschos & Mo, 2006; Moschos et al., 2007).
Furthermore, overexpression of Ubc9 in MCF-7 human breast cancer tumor cells significantly
increased their growth (Mo et al., 2005; Sarge & Park-Sarge, 2009). Increased levels of the
E3 ligase PIAS3 have also been associated with various types of human cancers such as lung,
breast, and prostate cancer (Wang & Banerjee, 2004; Sarge & Park-Sarge, 2009).
Interestingly, lower survival of patients with hepatocellular carcinoma correlates with

Introduction
24
increased levels of the SUMO E1 activating enzyme, while, on the contrary, longer
metastasis-free survival of patients with breast cancer with high Myc levels correlates with
low levels of SUMO E1 activating enzyme (Lee & Thorgeirsson, 2004; Sarge & Park-Sarge,
2009; Kessler et al., 2012; Flotho & Melchior, 2013).
A significant number of reports have also indicated a link between SUMO conjugation
and heart disease. Two missense mutations of lamin A glutamic acid 203, E203G and E203K,
have been associated with familial dilated cardiomyopathy and conduction system disease
(Fatkin et al., 1999; Jakobs et al., 2001). Interestingly, in 2008, Zhang and Sarge
demonstrated that lamin A is SUMOylated at lysine 201, which is located within the
SUMOylation consensus motif ψKxE. Thus, it turned out that the two disease-associated
mutations take place within the consensus motif and reduce SUMOylation of lamin A (Zhang
& Sarge, 2008b; Sarge & Park-Sarge, 2009). Furthermore, Kho and collaborators associated
decreased SUMO1 levels with failing human hearts, as well as with heart failure in mice.
Notably, overexpression of SUMO1 in those mice ameliorated the cardiac function. In this
report, the authors suggest that the reduction of SUMOylation of SERCA2a could contribute
to heart failure (Kho et al., 2011; Flotho & Melchior, 2013).
A very pronounced involvement of SUMOylation in the pathology of
neurodegenerative disorders has been indicated by several studies. This issue will be
discussed below.
1.3. SUMOylation in neurons
SUMOylation in neurons has received pronounced attention over the past decade. A
large number of proteins that are essential for neuronal function have been proposed as
SUMOylation substrates.
1.3.1. Subcellular localization of the SUMOylation machinery in neurons
Besides the nuclear SUMO substrates, evidence of a large variety of extranuclear
SUMO substrates in neurons has just started to emerge. The affirmation of those proteins as
SUMO targets, however, requires that an important question is answered: Where can the
SUMOylation machinery be found in neurons? Notably, addressing this question has
produced some quite controversial results, especially when the issue was investigated by
immunostaining. For example, with regard to SUMO1, most studies in non-neuronal cell
cultures show predominantly nuclear localization of endogenous and overexpressed protein.
Furthermore, several studies using anti-SUMO1 antibodies for staining rat primary neurons

Introduction
25
reported significant presence of SUMO1 labelling in axons, dendrites, and synapses besides
the predominant nuclear localization (Martin et al., 2007a; Chao et al., 2008; Konopacki et
al., 2011; Loriol et al., 2012; Girach et al., 2013; Jaafari et al., 2013; Loriol et al., 2013;
Henley et al., 2014). In contrast, in 2012, Tirard and collaborators reported the generation of a
SUMO1 knock-in mouse model expressing double affinity tagged His6-HA-SUMO1 instead
of wild type SUMO1 from the endogenous genetic locus. This proved to be an excellent
mammalian model for the identification and localization of SUMO1 substrates in vivo.
Staining primary hippocampal neuronal cultures from this model with a reliable anti-HA
antibody, Tirard and collaborators observed His6-HA-SUMO1 predominantly in the nucleus
but it did not colocalize with synaptic markers. These results were confirmed in vivo by
immunostaining of brain sections (Tirard et al., 2012). Thus, the latter finding represents a
reason to reconsider some of the previously published results obtained with the use of not
very reliable antibodies. Apart from immunostaining, the subcellular localization of SUMO1
in neurons was studied by subcellular fractionation experiments. In 2007, Martin and
collaborators presented data indicating high levels of SUMO1-conjugated proteins in the
synaptosomal and the postsynaptic density fractions of rat brains (Martin et al., 2007a). Tirard
and collaborators also used subcellular fractionation of brains from the His6-HA-SUMO1 KI
mice to study the subcellular localization of SUMO1. The experiment revealed the expected
high abundance of SUMO1-conjugated proteins in the nucleus. Furthermore, SUMO1
conjugates were found in cytosol, synaptic cytosol, and synaptic vesicle fractions, but
SUMO1 conjugates were not present in the synaptic membrane fractions (Tirard et al., 2012).
Regarding the localization of SUMO2/3, most immunostaining studies in non-
neuronal cell cultures show that endogenous SUMO2/3 reside predominantly in the nucleus.
Furthermore, overexpression of SUMO2 or SUMO3 in non-neuronal cell cultures results
mainly in nuclear signal. Again, similar to SUMO1, in rat primary neurons SUMO2/3 were
shown to be significantly present in axons, dendrites and synapses (Loriol et al., 2012; Jaafari
et al., 2013; Loriol et al., 2013; Henley et al., 2014). Notably, some in vivo studies in rats
show the presence of SUMO2/3 in the cytoplasm of different brain regions (Yang et al.,
2008a; Yang et al., 2009; Wang et al., 2012). Regarding the other components of the
SUMOylation machinery, in rat primary neurons E1 complex, Ubc9, SENPs and PIAS
proteins were also found in axons, dendrites and synapses (Martin et al., 2007a; Loriol et al.,
2012; Jaafari et al., 2013; Loriol et al., 2013; Henley et al., 2014). Furthermore, Ubc9, Aos1,
SENP1 and SENP6 were found in the synaptosomal fraction of rat brains (Feligioni et al.,
2009; Loriol et al., 2012; Henley et al., 2014). However, given the controversial results for

Introduction
26
SUMO1 and the fact that key controls were often missing in the relevant studies, further
research is required to investigate these issues.
Recent research has also addressed the link between synaptic SUMOylation and
neuronal activity. For example, Loriol and collaborators reported that upon KCl stimulation of
rat primary neurons, the immunoreactivity of SUMO1 in the pre-synapse increases while the
immunoreactivity of SUMO2/3 decreases in the postsynapse (Loriol et al., 2013; Henley et
al., 2014).
1.3.2. Spatiotemporal distribution of the SUMOylation machinery in the developing
mammalian brain
Another question that has received attention with regard to elucidating the role of
SUMOylation in neuronal function is the spatiotemporal distribution of SUMOylation during
mammalian brain development. In 2008, Watanabe and collaborators examined the levels of
Ubc9 mRNA throughout the development of the rat brain. They noted that the expression of
Ubc9 increases from E13 to E18 and after that decreases throughout development. Moreover,
the protein levels of Ubc9 were also high during the embryonic stage and then decreased.
Similarly, SUMO1 conjugates showed high levels during the embryonic stage and then
decreased. Regarding the spatial distribution of Ubc9 mRNA during development, in situ
hybridization showed that during the embryonic stage Ubc9 is present in many different brain
regions, but it is predominantly present in areas with proliferating neural stem cells. In the
adult brain, Ubc9 mRNA was mainly found in dentate granular neurons, pyramidal neurons in
the hippocampus, and in large pyramidal neurons in the cortex. Considering these results, the
authors suggested that SUMOylation participates in neuronal proliferation and differentiation
in the developing brain and in neuronal plasticity in the adult brain (Watanabe et al., 2008;
Henley et al., 2014). Additionally, another study investigated the levels of the SUMOylation
machinery throughout the development of the rat brain. Similar to the study mentioned
previously, SUMO1 conjugation levels were highest at E12 and then decreased slowly.
Interestingly, the authors also investigated SUMO2/3 conjugation levels, which peaked at E12
and at birth. Ubc9 levels were also developmentally regulated, with highest levels of Ubc9
between E15 and E18, and decreasing after birth. The study also examined the levels of
SENP1 and SENP6, which exhibited high expression early in development and decreased
after that. Finally, the levels of Aos1 were almost stable throughout development (Loriol et
al., 2012; Henley et al., 2014). The decrease of SUMO1 conjugates during mammalian
development was also demonstrated by Tirard and collaborators who compared the SUMO1

Introduction
27
conjugation levels in the brains of mice varying from postnatal day 0 to postnatal day 56
(Tirard et al., 2012). Finally, a very detailed investigation of the spatiotemporal distribution of
SUMO proteins and Ubc9 during mouse brain development was published by Hasegawa and
collaborators in 2014. Ubc9 protein levels were shown to be highest at E10.5 and at E12.5 and
decreased with development. Furthermore, total SUMO1 and SUMO2/3 conjugation levels
were once again seen to decrease with development. Regarding the localization of the SUMO
proteins, during the embryonic stage SUMO1 and SUMO2/3 immunoreactivity were localized
to the nucleoplasm of nestin-positive neural stem cells. Interestingly, while many neurons in
the adult brain had SUMO1, SUMO2/3 were mainly localized in neurogenic regions, such as
the subventricular zone and the hippocampal subgranular zone (Hasegawa et al., 2014).
1.3.3. SUMOylation in the neuronal nucleus
In agreement with the essential role of SUMOylation for regulating nuclear processes,
a number of nuclear proteins have been shown to be SUMOylation targets in neurons. Some
of them are transcription factors. The Pax family of transcription factors, for example, is
involved in cell specification in the central nervous system, starting early in development.
Several members of this family have been identified as SUMOylation substrates. Pax6, for
instance, is involved in brain and eye development (Gwizdek et al., 2013). Yan and
collaborators showed that SUMOylation facilitates the binding of Pax6 to DNA and thus
stimulates gene expression (Yan et al., 2010; Gwizdek et al., 2013; Henley et al., 2014).
Pax7, on the other hand, is a transcription factor with a role in neural crest and muscle
development (Gwizdek et al., 2013). SUMOylation of Pax7 was shown to play an essential
role in the development of the neural crest (Luan et al., 2013; Henley et al., 2014). Another
SUMOylated transcription factor, MEF2A, plays an important role in the formation of
dendritic claws, specialized structures formed by the dendrites of cerebellar granule neurons
to contact the terminals of mossy fibers to form synapses (Wilkinson et al., 2010; Henley et
al., 2014). In 2006, Shalizi and collaborators demonstrated that SUMOylation of MEF2A
represses its transcriptional activity and thus promotes dendritic claw formation. Neuronal
activation, on the other hand, promoted a molecular switch from SUMOylation to acetylation
which led to activation of MEF2A and inhibited dendritic claw formation (Shalizi et al., 2006;
Gwizdek et al., 2013). SUMOylation of two transcription factors has also been shown to be
involved in rod photoreceptor development. Nrl and Nr2e3 are transcription factors that
activate the expression of rod-specific genes while suppressing the expression of cone-
specific genes. SUMOylation of Nr2e3 was shown to be important for the repression of cone-

Introduction
28
specific genes (Onishi et al., 2009), while SUMOylation of Nrl promotes the expression of the
rod-specific genes rhodopsin and Nr2e3 (Roger et al., 2010; Gwizdek et al., 2013; Henley et
al., 2014). Other SUMOylated transcription factors that are important for the proper function
of neurons are MeCP2, the SUMOylation of which is involved in synapse development,
BMAL1, which is SUMOylated in the context of circadian rhythms (Wilkinson et al., 2010;
Henley et al., 2014).
Apart from SUMO targets, another protein related to SUMOylation is the Drosophila
SUMO protease Verloren. Verloren has been shown to function in olfactory projection
neurons target selection, i.e. in the targeting of their dendrites to antennal lobe glomeruli and
of their axons to higher brain centers (Berdnik et al., 2012; Henley et al., 2014).
1.3.4. Extranuclear SUMOylation in neurons
As mentioned above, despite the fact that the majority of SUMO substrates reside in
the nucleus, extranuclear roles of SUMOylation have received ever increasing attention. The
interest in the identification of new extranuclear substrates is, naturally, also relevant for
neurons.
An example of an extranuclear protein important for neuronal functioning and a
SUMOylation target is the mRNA-binding protein La. La supports axonal protein synthesis
by binding mRNAs and promoting their axonal trafficking (Wilkinson et al., 2010). In 2007,
van Niekerk and collaborators demonstrated La SUMOylation in cultured mouse dorsal root
ganglion neurons and isolated mouse sciatic nerve and showed that SUMOylation of La
determines its interaction with dynein, thus stimulating retrograde transport to the cell body.
In mouse dorsal root ganglion neurons, La, which cannot be SUMOylated, moves only in
anterograde direction (van Niekerk et al., 2007; Wilkinson et al., 2010).
Some proteins residing in the plasma membrane have also been shown to be substrates
of SUMO modification. One report, for example, demonstrated the SUMOylation of the
potassium leak channel K2P1, which helps the preservation of the resting membrane potential
below the threshold in excitable cells (Rajan et al., 2005). The channel mRNA is known to be
strongly expressed in heart, brain and kidney (Orias et al., 1997). The authors stated that
SUMOylation is responsible for keeping the channel in an inactive state (Rajan et al., 2005).
However, later Feliciangeli and collaborators failed to observe SUMO modification of this
channel, which left the question about the SUMOylation of K2P1 open (Feliciangeli et al.,
2007; Feliciangeli et al., 2010). Finally, in 2010 Plant and collaborators revalidated the
SUMOylation of K2P1 (Plant et al., 2010; Wilkinson et al., 2010; Henley et al., 2014).

Introduction
29
Another potassium channel which is expressed in the brain and is also considered to be
SUMOylated is the voltage-gated Kv1.5 (Benson et al., 2007; Wilkinson et al., 2010).
Furthermore, the glucose transporters GLUT1 and GLUT4 were the first membrane proteins
described as SUMOylation targets. They have been shown to be highly expressed in the brain.
Overexpression of Ubc9 resulted in a 65% decrease in the levels of GLUT1 and an eight-fold
increase in the GLUT4 levels (Giorgino et al., 2000; Martin et al., 2007b; Wilkinson et al.,
2010).
A large number of studies reported important roles of SUMOylation in synapse
formation and function by demonstrating SUMO modification of synaptic proteins. One of the
synaptic proteins that has been shown to be SUMOylated is the calcium/calmodulin-
dependent serine protein kinase (CASK). CASK is a scaffold protein that is necessary for
dendritic spine formation. Chao and collaborators demonstrated that CASK SUMOylation
reduces the interaction between CASK and protein 4.1. Furthermore, overexpression of
SUMO1-CASK led to defective synapse formation (Chao et al., 2008; Wilkinson et al.,
2010). Another proposed synaptic target of SUMOylation is the kainate receptor subunit
GluK2. Kainate receptors are glutamate-gated ion channels which are strongly represented at
synapses throughout the brain and can act both pre- and postsynaptically. In 2007, Martin and
collaborators showed in rat hippocampal neurons that SUMOylation is triggered by agonist
stimulation and that this leads to endocytosis of kainate receptors containing the GluK2
subunit (Martin et al., 2007a; Wilkinson et al., 2010; Henley et al., 2014). Another study
proposed as a synaptic SUMOylation substrate the active zone protein Rab3 interacting
molecule 1 alpha (RIM1α). SUMOylation of RIM1α was shown to be required for the Ca2+
channel clustering function of the protein (Girach et al., 2013; Henley et al., 2014).
Interestingly, in 2015 Tang and collaborators demonstrated that SUMOylation of synapsin Ia
is needed for its proper functioning. Synapsins cluster presynaptic vesicles, bind them to the
actin cytoskeleton and release the vesicles upon depolarization (Tang et al., 2015). Very
recently, one of the synaptic SNARE proteins, syntaxin1A, was identified to be SUMOylated
and this SUMOylation was shown to be activity-dependent. The authors proposed that the
SUMOylation of syntaxin1A regulates vesicle endocytosis (Craig et al., 2015).
At present, it is unclear whether the currently available data on extranuclear and
synaptic SUMOylation in neurons can be taken at face value. Essentially none of the relevant
studies involving immunostaining in cells or tissues employed truly stringent controls, such as
SUMO knock-outs, and knock-in mice expressing His6-HA-SUMO1 instead of wild-type
SUMO1 yielded no evidence for extranuclear or synaptic SUMO1 conjugation, apart from

Introduction
30
annulate lamellae. Consequently, current and quite prominently published claims regarding
extranuclear and synaptic SUMO conjugation in neurons have to be regarded with caution.
1.3.5. SUMOylation and neurodegenerative diseases
The essential role of SUMOylation in neuronal development and function explains the
increasing number of studies attempting to elucidate the link between SUMOylation and the
pathogenesis of a variety of neurological diseases. Special attention has focused on the
involvement of SUMOylation in neurodegenerative disorders. Notably, major players in the
pathogenesis of different neurodegenerative diseases, such as α-synuclein, ataxin-1,
huntingtin, SOD1, are thought to be modified by SUMOylation.
Importantly, SUMO proteins are extremely soluble, which has led to utilization of
SUMO as a tag for the expression and purification of proteins. Given the fact that the majority
of neurodegenerative diseases are characterized by decreased solubility of specific proteins
and their pathological aggregation, it has been suggested that SUMOylation can regulate
protein solubility and aggregation in neurodegeneration (Krumova & Weishaupt, 2013).
Parkinson's disease is the second most common neurodegenerative disorder,
characterized by degeneration of dopaminergic neurons in the substantia nigra in the
midbrain and the presence of neuronal inclusions called Lewy bodies, with the major
component α-synuclein. In 2006, Dorval and Fraser were the first to demonstrate the mono-
SUMOylation of α-synuclein by overexpressing α-synuclein and SUMO in HEK293 cells
(Dorval & Fraser, 2006). Later, Krumova and collaborators investigated the importance of
SUMOylation for the aggregation of α-synuclein in both, in vitro fibril formation assay and in
a cell-line based assay. It was reported that non-SUMOylated α-synuclein forms fibrils while
SUMO modification of the protein abolishes the formation of fibrils. Additionally, the cell-
based assay demonstrated that the overexpression of a SUMOylation-deficient form of α-
synuclein correlates with higher cellular toxicity when compared to the wild type form.
Finally, this study also confirmed the SUMOylation of α-synuclein in vivo utilizing a His6-
SUMO3 expressing transgenic mouse model (Krumova et al., 2011; Krumova & Weishaupt,
2013). Yet another study explored the consequences of α-synuclein SUMOylation,
demonstrating that SUMOylation enhances the release of α-synuclein via extracellular
vesicles (Kunadt et al., 2015). Furthermore, Shinbo and collaborators reported the
SUMOylation of another protein that has been implicated in the pathogenesis of Parkinson’s
disease, DJ-1. The authors demonstrated that SUMOylation is required for all activities of this
multifunctional protein (Shinbo et al., 2006).
Introduction
31
SUMOylation has also been linked to polyglutamine disorders, a group of diseases
that results from toxic expansion of trinucleotide repeats, CAG. Huntington's disease is
characterized by an extended polyglutamine repeat in the Huntingtin protein. In 2004, Steffan
and collaborators showed that SUMO can modify a pathogenic fragment of Huntingtin. The
authors reported that in cultured cells SUMOylation of this mutant fragment increases its
stability and reduces its aggregation. Furthermore, they showed that in a Drosophila
melanogaster model of Huntington's disease, animals heterozygous for a SUMO mutation
exhibit decreased degeneration when compared to animals having normal levels of SUMO
(Steffan et al., 2004; Krumova & Weishaupt, 2013). Notably, in 2008 Subramaniam and
collaborators reported that the striatal-specific protein Rhes stimulates SUMOylation of
mutant Huntingtin (Subramaniam et al., 2009).
Another polyglutamine disorder, spinocerebellar ataxia type I, is characterized by
polyglutamine expansions in ataxin-1. In 2005, Riley and collaborators demonstrated that
SUMOylation of ataxin is decreased in the polyglutamine-expanded form of the protein.
Furthermore, the authors revealed that SUMOylation depends on the ataxin-1 being able to
enter the nucleus (Riley et al., 2005; Sarge & Park-Sarge, 2009).
Yet another polyglutamine disease that has been linked to SUMOylation is spinal and
bulbar muscular atrophy (SBMA), which is caused by polyglutamine expansion of the
androgen receptor (AR). AR has been shown to be SUMOylated, the modification resulting in
repression of its transcriptional activity (Poukka et al., 2000; Nishida & Yasuda, 2002;
Wilkinson et al., 2010; Henley et al., 2014). Moreover, in a Drosophila model of SBMA, the
overexpression of a catalytically inactive form of the SUMO1 activating enzyme results in
enhanced neurodegeneration (Chan et al., 2002; Krumova & Weishaupt, 2013). Furthermore,
a recent study also revealed a link between SUMOylation and SBMA by coexpressing
SUMO3 in HELA cells expressing the polyglutamine-extended form of AR. The
coexpression of SUMO3 was found to decrease the aggregation of AR (Mukherjee et al.,
2009; Wilkinson et al., 2010).
Notably, a link between SUMOylation and amyotrophic lateral sclerosis (ALS) has
also been established. ALS is a motor neuron disease characterized by degeneration of both
upper and lower motor neurons. A substantial number of familial ALS cases are caused by
mutations in the gene for superoxide dismutase (SOD1) (Sarge & Park-Sarge, 2009).
SUMOylation of human SOD1 was demonstrated by Fei and collaborators in 2006. The
authors showed that SUMOylation of SOD1 increases protein stability and aggregation (Fei et
al., 2006). Another protein that has also been related to ALS pathogenesis is the astroglial
Introduction
32
glutamate transporter EAAT2, which generates a CTE fragment upon cleavage by caspase-3.
In a mouse model of ALS, Foran and collaborators showed that the CTE fragment is SUMO1-
modified which triggers its accumulation in the nuclei of spinal cord astrocytes (Foran et al.,
2011; Krumova & Weishaupt, 2013).
Neuronal intranuclear inclusion disorder (NIID) is a rare slowly progressing
neurodegenerative disease, characterized by the presence of neuronal intranuclear inclusions.
Interestingly, it was demonstrated that these inclusions show strong SUMO immunoreactivity
in familial, juvenile and sporadic cases of NIID (Pountney et al., 2003; McFadden et al.,
2005; Takahashi-Fujigasaki et al., 2006; Wilkinson et al., 2010).
Finally, an increasing number of studies indicate a link between SUMOylation and
Alzheimer's disease (AD) pathogenesis. This will be discussed in detail below.
1.4. Alzheimer's disease
In 1906, at the Meeting of the South-West German Psychiatrists held in Tübingen, the
Bavarian psychiatrist and neuroanatomist Alois Alzheimer described the case of a 50-year-old
woman who had been hospitalized for progressive memory disturbances, sleep problems,
paranoia, confusion and aggression. Alzheimer reported the presence of plaques,
neurofibrillary tangles and arteroscleriotic changes. This was the first description of AD
which subsequently appeared in 1910 in the third edition of Psychiatrie (Alzheimer, 1907;
Maurer et al., 1997; Hippius & Neundorfer, 2003).
AD is the most common neurodegenerative disorder and it is the leading cause for
dementia worldwide. Affecting millions of people throughout the world, AD places great
financial and emotional burden on the patients, their families and the society in general
(Huang & Mucke, 2012). AD occurrence is age-dependent, its prevalence becoming double
every 5 years after the age of 65. Thus, with the increase of life expectancy, the disorder is
expected to place an enormous challenge on healthcare systems worldwide (Minati et al.,
2009).
1.4.1. Symptoms of Alzheimer's disease
A major symptom occurring during AD is the progressive loss of memory. The slow
impairment of episodic memory (encoding and recollecting daily experiences) starts from the
preclinical phase (Dickerson & Eichenbaum, 2010). The initial manifestation of episodic
memory impairment is the deficit in verbal and nonverbal anterograde memory. In mild AD, a
progressive deficiency in semantic memory (the ability to learn and remember facts about the
Introduction
33
world) can be observed (Manns et al., 2003). Contrary to declarative memory (memory of
facts and events which can be consciously recollected) (Squire, 1992), during the course of
AD, implicit memory (knowledge which cannot be accessed consciously) is relatively spared
(Ettlinger et al., 2011). AD is also characterized by language problems, which are firstly
manifested as semantic memory deficits. However, with disease progression, the problems
become more and more serious reaching a complete inability of the affected individual to
communicate at the phase of severe AD (Minati et al., 2009). Besides deficits in memory and
language, AD patients exhibit also deterioration of executive functions, which appear early
during disease progression. These executive functions are related to the ability to mentally
manipulate information, to form concepts, to solve problems, or to cue-directed behaviour
(Weintraub et al., 2012). AD patients can also exhibit visuospatial disabilities, which are
evident as deficits in drawing, construction, or orientation (Minati et al., 2009). Furthermore,
people suffering from AD develop apraxic symptoms (inability to perform learned, skilled
movements) (Gross & Grossman, 2008), the percentage of affected patients reaching 100%
during severe AD (Minati et al., 2009). An enormous burden for the patients and their
caretakers are the behavioural abnormalities accompanying the course of AD which are
exhibited by 90% of the patients. Common behavioural symptoms are agitation, apathy, and
psychosis (Beier, 2007; Minati et al., 2009).
1.4.2. Pathological changes in Alzheimer's disease
The two major histopathological hallmarks of AD are the extracellular senile amyloid
plaques and the intracellular neurofibrillary tangles.
Amyloid plaques are mainly composed of Abeta (Aβ), a 4 kDa peptide produced by
the amyloidogenic processing of amyloid precursor protein (APP). Their diameter ranges
from 10 to 160 µm (Minati et al., 2009). Often, plaques are surrounded by abnormal neuronal
processes, which are referred to as dystrophic neurites (Dickson & Vickers, 2001).
Furthermore, amyloid plaques are often surrounded by activated microglia and reactive
astrocytes (Minati et al., 2009). Different attempts have been made to define different subsets
of amyloid plaques. Dickson and Vickers, for example, define the plaques as diffuse, dense-
core or fibrillary. Diffuse plaques do not have a specific structure ‘resembling a ball of
homogenous labelling’. Fibrillar plaques, on the other hand, have a mass of -amyloid in the
center with emerging ‘spoke-like extensions’. Finally, dense-core plaques consist of a
compact centre, which is surrounded by a sphere of -amyloid (Dickson & Vickers, 2001).
According to Braak and Braak, the amyloid deposition can be separated in three stages.

Introduction
34
During the first stage, the amyloid deposits are mainly detected in the basal frontal, temporal
and occipital lobes. The second stage is characterized by deposition of amyloid in all
isocortical association areas, with relative sparing of the hippocampus and lack of deposition
in the primary sensory, motor and visual cortices. Finally, during the third stage amyloid
deposits become manifested in those primary areas and sometimes in the molecular layer of
the cerebellum and in subcortical nuclei – thalamus, striatum, hypothalamus, subthalamic
nucleus, and red nucleus (Braak & Braak, 1991; Serrano-Pozo et al., 2011).
Neurofibrillary tangles consist mainly of hyperphosphorylated variants of the
microtubule-binding protein tau. The spreading of neurofibrillary tangles throughout the brain
in AD patients has been used by Braak and Braak as a basis to define the stages I-VI of
disease progression. During stage I, neurofibrillary tangles are present in the transentorhinal
region and the entorhinal cortex proper. Stage II involves spreading of the pathological
hallmark to the CA1 region of the hippocampus. During stage III, neurofibrillary tangles
appear in the subiculum, while stage IV is characterized with their spreading to amygdala,
thalamus and claustrum. Finally, during stages V and VI, the pathology spreads to the
neocortex. The appearance of neurofibrillary tangles in the associative areas is earlier and
more severe (stage V) than in the primary motor, sensory and visual areas (stage VI) (Braak &
Braak, 1991; Serrano-Pozo et al., 2011). Importantly, it should be noted that the appearance
of neurofibrillary tangles within the brain is more closely related to the temporal progression
of AD symptoms as compared to plaques (Minati et al., 2009).
Besides the deposition of Aβ in the brain parenchyma as amyloid plaques, the peptide
also accumulates in the walls of blood vessels, a phenomenon called congophilic angiopathy.
Aβ is mainly deposited in the cortical capillaries, small arterioles, middle-size arteries, and
leptomeningal arteries, while veins, venules and white-matter arteries are mostly spared (Perl,
2010; Serrano-Pozo et al., 2011). Even though these depositions are known to not disturb the
function of blood vessels, they could result in rupturing of the blood vessels and thus, in
hemorrhages (Perl, 2010).
Another AD-related pathological hallmark, which is almost exclusive for the
perikaryal cytoplasm of hippocampal pyramidal neurons, is granulovacuolar degeneration.
Granulovacuolar degeneration is a lesion consisting of intraneuronal accumulation of small
vacuoles, each of them containing a basophilic granule. Those granules are positive for tau,
ubiquitin, tubulin, and neurofilaments (Perl, 2010; Serrano-Pozo et al., 2011).

Introduction
35
Yet another pathological change in AD is the presence of Hirano bodies, eosinophilic
rodlike inclusions in the cytoplasm. The Hirano bodies are present in the CA1 region of the
hippocampus (Perl, 2010; Serrano-Pozo et al., 2011).
Another pathological hallmark of AD is the progressive loss of brain weight and
volume, which results from enormous neuronal and synapse loss. Some brain regions are
specifically affected by neuronal loss, such as pyramidal cells in lamina II of the entorhinal
cortex and in the CA1 hippocampal region (Huang & Mucke, 2012). Importantly, the
profound degeneration of the cholinergic neurons in the basal nucleus of Meynert and in the
medial septal nucleus results in the loss of up to 95% of the cholinergic cortical innervation
(Minati et al., 2009). Synapse loss, the other contributor to brain atrophy, has been
demonstrated by immunostaining of synaptic proteins and by electron microscopy (Serrano-
Pozo et al., 2011). It has been shown that synapse loss is more closely related to cognitive
decline in AD than neuronal loss (Serrano-Pozo et al., 2011; Huang & Mucke, 2012).
Besides morphological changes, the brains of AD patients exhibit changes in neural
network activities. One of these is represented by alterations in the default mode network,
most active when people are not thinking about anything specifically. Another alteration in
the network activities is hippocampal hyperactivation during the performance of memory
tasks (Huang & Mucke, 2012).
1.4.3. Etiology of Alzheimer's disease
The etiology of AD can be both familial and sporadic. Familial AD, which represents
5% of all AD cases, is caused by mutations in three genes, which encode amyloid precursor
protein (APP), presenilin 1 (PS1) and presenilin 2 (PS2). These mutations are inherited in an
autosomal dominant manner (Minati et al., 2009).
A number of genes have been related to the development of sporadic AD. One of these
encodes apolipoprotein E (APOE), which can exist in three alleles, APOE 2, APOE 3 and
APOE 4. AD patients show higher probability to be carriers of the APOE 4 allele. Indeed,
individuals carrying two APOE 4 alleles have an approximately 60% chance to develop AD
by the age of 85 while the chance for those carrying two APOE 3 alleles is approximately
10% (Minati et al., 2009; Huang & Mucke, 2012). Other genes which have been linked to
sporadic AD encode insulin-degrading enzyme (IDE), ubiquilin 1 (UBQLN1), sortilin-related
receptor, L (DLR class) A repeats containing (SORL1), calcium homeostasis modulator 1
(CALHM1), and several others (Minati et al., 2009).

Introduction
36
The main non-genetic risk factor that contributes to sporadic AD pathogenesis is old
age. Besides this, many other non-genetic risk factors have been suggested, such as diabetes,
obesity, smoking, low educational levels, diet, physical and mental inactivity, depression,
head injury, and homocysteinemia (Huang & Mucke, 2012; Scheltens et al., 2016).
1.4.4. Pathogenic mechanisms of Alzheimer's disease
In senile plaques, the main component, Aβ peptide, is present in the form of insoluble
amyloid fibrils, a result of the conformational conversion of Aβ from α-helix to β-sheet
structure (Serpell, 2000). Analogous to other amyloid fibrils, the Aβ fibrils have a cross-β
structure, which means that the separate β-strands are located perpendicularly to the fibrillar
axis. Importantly, the production of amyloid fibrils is the end result of a complex aggregation
cascade that includes the formation of intermediary products, including soluble oligomers and
protofibrils (Ahmed et al., 2010).
Aβ peptide is produced by the amyloidogenic pathway of processing of APP. APP is a
member of a protein family that in mammals includes APLP1 and APLP2. These proteins are
transmembrane proteins and contain large extracellular domains. Alternative splicing gives
rise to several APP isoforms, the most common of which are the 695-amino-acid isoform,
mostly expressed in the central nervous system, and the 751- and 770-amino-acid isoforms,
expressed more ubiquitously (O'Brien & Wong, 2011). Some of the proposed physiological
functions of APP include a trophic role, a role in cell adhesion, and a function as a receptor
(Thinakaran & Koo, 2008). The best-studied proteases that can cleave APP are α-secretase, β-
secretase and γ-secretase. Depending on whether α- or β-secretase perform the first cleavage
reaction, APP can be processed either by the nonamyloidogenic or by the amyloidogenic
pathway. The nonamyloidogenic pathway commences with α-secretase cleaving APP to
release the N-terminal soluble fragment sAPPα, while the 83-amino-acid C-terminal fragment
(CTF) is retained within the membrane. Subsequently, γ-secretase cleaves the membrane-
bound CTF releasing another fragment, p3. Notably, since α-secretase cleaves within the Aβ
domain, the generation of Aβ is precluded. Conversely, the amyloidogenic pathway starts
with β-secretase performing the first cleavage reaction, producing the soluble N-terminal
fragment sAPPβ and the membrane-bound 99-amino-acid C-terminal fragment. Then, γ-
secretase performs its function, generating Aβ peptides with a length of 38-43 amino acids.
Very common forms are Aβ40 and Aβ42. Aβ42 is more hydrophobic than Aβ40 and is the main
Aβ form residing in amyloid plaques (Thinakaran & Koo, 2008; O'Brien & Wong, 2011;
Cavallucci et al., 2012). α-secretase function is attributed to enzymes that belong to the

Introduction
37
ADAM family of metalloproteinases. Importantly, α-secretase performs its function at the cell
surface. On the other hand, the transmembrane aspartyl protease BACE1 (β-site APP-cleaving
enzyme 1) is the major β-secretase in neurons and is mainly localized to the late-Golgi/trans-
Golgi network (TGN) and endosomes. Finally, γ-secretase is a complex of 4 proteins –
presenilin 1 or presenilin 2, nicastrin, APH-1 and PEN-2. γ-secretase has been shown to be
present in different cellular compartments, including endoplasmic reticulum (ER), Golgi
apparatus, TGN, endosomes, and plasma membrane (Thinakaran & Koo, 2008).
Interestingly, N- or C-terminally truncated Aβ species exist. Apart from this, Aβ can be
subject to different post-translational modifications, such as oxidation, phosphorylation, nitric
oxide-caused modifications, glycosylation, pyroglutamylation, isomerization, and
racemization. Truncated and/or post-translationally modified peptides have been shown to be
modulators of disease progression. For example, treatment of mice with an inhibitor of
glutaminyl cyclase, the enzyme responsible for the formation of pyroglutamate-modified Aβ
(AβpE3-42), in AD mouse models results in reduced Aβ40 and Aβ42 levels, reduced plaque
levels, and improvement in tests for context memory and spatial learning (Schilling et al.,
2008; Kummer & Heneka, 2014).
AD is a polyproteinopathy which, in addition to the presence of amyloid plaques, is
characterized by abnormal aggregation of hyperphosphorylated tau in the form of the
aforementioned neurofibrillary tangles (Huang & Mucke, 2012). The neurofibrillary tangles
are composed of paired fibrils wound in a helix, the so called paired helical filaments (Perl,
2010). The major constituent of neurofibrillary tangles, tau, is a protein that is relatively
abundant in neurons and commonly known to promote the assembly and the maintenance of
microtubules, the assembly function being dependent on the phosphorylation status of the
protein (Lindwall & Cole, 1984; Castellani et al., 2008; Wang et al., 2013). Except for some
special cases, tau in the normal brain has two or three moles of phosphate per one mole of tau
while in the AD brain the phosphorylation of tau is approximately three-fold higher (Wang et
al., 2013). Thus, in AD, the hyperphosphorylation of tau causes the dissociation of tau from
the microtubules and its ectopic accumulation in perykaria and dendrites (Minati et al., 2009).
Since its postulation in the beginning of the 1990s up until now, the amyloid cascade
hypothesis has been the most popular hypothesis used to explain AD pathogenesis. During
these decades, while preserving its name, the hypothesis has undergone significant changes as
a result of constantly emerging data (Pimplikar, 2009). Briefly, a postulation of the hypothesis
from 2010 states that accumulation and aggregation of the Aβ peptide in the brain, resulting
from an imbalanced production and/or clearance of the peptide, triggers a pathological

Introduction
38
cascade that includes amyloid deposition, inflammation, oxidative stress, neuronal injury and
loss (Lemere & Masliah, 2010; Herrup, 2015). This hypothesis is supported by a variety of
genetic, biochemical, and neuropathological studies but is mainly supported by the fact that
all the mutations associated with familial AD result in a deviation of the processing of APP,
which leads to an increased production of Aβ or to increased Aβ42 levels relative to Aβ40
levels (Cavallucci et al., 2012; Morris et al., 2014).
A major issue in Aβ toxicity research is which form of Aβ assembly is most
pathogenic. It has been shown that while the correlation between the levels of insoluble Aβ
and cognitive impairment, neuronal and synaptic loss is poor, the levels of soluble Aβ
oligomers correlate well with the disease progression (McLean et al., 1999; Cavallucci et al.,
2012). Thus, a variety of studies have tried to elucidate the role of Aβ oligomers in
neurotoxicity. In spite of the assumption that Aβ oligomers are the main form contributing to
neurotoxicity, the neurotoxicity of amyloid plaques cannot be completely rejected. Neuritic
alterations have, indeed, been demonstrated immediately adjacent to senile plaques (Huang &
Mucke, 2012; Mucke & Selkoe, 2012).
Another major question concerning Aβ toxicity is the role of extracellular vs.
intracellular Aβ as a trigger of the pathogenic cascade. A plethora of studies on post-mortem
AD brains and transgenic mouse brain have revealed the accumulation of intraneuronal Aβ.
For example, Oddo and collaborators demonstrated that in triple transgenic mice expressing
mutant APP, PS1 and tau, the appearance of intraneuronal Aβ precedes the formation of
amyloid plaques and neurofibrillary tangles. Notably, in this mouse model, synaptic
dysfunction was documented before plaques and tangles became obvious and it was shown to
correlate with intraneuronal Aβ accumulation (Oddo et al., 2003; Cavallucci et al., 2012). The
intracellular Aβ is thought to be either produced intracellularly or to be internalized after
being secreted (Sakono & Zako, 2010). Despite many studies claiming the presence of
intraneuronal Aβ accumulation, the actual presence and importance of it has been a matter of
argument. A major reason for the debate is the cross-reactivity of Aβ antibodies with APP,
which could lead to a misinterpretation of the results (Wirths & Bayer, 2012).
Notably, due to the fact that in AD synapse loss correlates better with cognitive
decline when compared to neuron loss, many research groups have focused their attention on
the mechanisms through which Aβ contributes to synapse dysfunction rather than studying the
relation between Aβ and neuronal loss (Huang & Mucke, 2012; Mucke & Selkoe, 2012).
Different studies have shown that one of the ways by which Aβ can lead to synaptic
dysfunction is related to the connection between Aβ and ion channels (Cavallucci et al.,

Introduction
39
2012). Several studies have examined the effect of Aβ on NMDA receptors function and Ca2+
influx. Aβ has been also shown to bind the α7 nicotinic acetylcholine receptor (Wang et al.,
2000; Cavallucci et al., 2012). Interplay between AMPA receptors and Aβ has also been
shown. It has been reported that the removal of AMPA from synapses is triggered by Aβ
(D'Amelio et al., 2011; Cavallucci et al., 2012).
Mitochondrial dysfunction is a characteristic of many neurodegenerative diseases,
including AD. Interestingly, Aβ has been found to be localized within mitochondria. Since
synapses are characterized by high energy demand and constant calcium fluctuations,
mitochondria are essential for proper synaptic functioning. Accumulation of Aβ in synaptic
mitochondria has been shown by Du and collaborators in the transgenic mouse model Tg2576
expressing APP bearing the Swedish mutation (K670N, M671L). These mitochondria
exhibited decreased mitochondrial respiration, decreased activity of key respiratory enzymes,
increased oxidative stress, and defects in calcium handling. Importantly, synaptic
mitochondria showed earlier Aβ accumulation and dysfunction when compared to non-
synaptic mitochondria (Du et al., 2010; Cavallucci et al., 2012).
Besides its contribution to synaptic dysfunction, Aβ can induce cellular damage
independently of synapse damage. For example, Aβ oligomers have been shown to induce
cell death which is mediated by nerve growth factor receptor (NGFR) (Yamamoto et al.,
2007; Sakono & Zako, 2010). Moreover, it has been also shown that Aβ oligomers can trigger
destabilization of the cellular membrane by formation of pores, which leads to abnormal flow
of ions such as Ca2+ (Valincius et al., 2008; Sakono & Zako, 2010).
Over the last years, in the field of AD pathogenesis, increasing attention has been put
on spreading AD pathology through cell-to-cell spreading of Aβ and tau with toxic
conformations. The so-called seeds are thought to interact with normal peptides and induce
toxic conformations, analogous to prion disorders. The nature of those toxic conformations
has not been fully elucidated (Huang & Mucke, 2012; Scheltens et al., 2016).
One aspect of the amyloid hypothesis is that the formation of neurofibrillary tangles is
preceded by Aβ pathology initiation. Support for this assumption has come from genetic
studies demonstrating that while mutations in APP and presenilins lead to AD with amyloid
plaques and neurofibrillary tangles, mutations in tau result in neurofibrillary tangle formation
but not in senile plaques appearance (Huang & Mucke, 2012). Analogous to Aβ, soluble
hyperphosphorylated tau oligomers rather than insoluble neurofibrillary tangles have been the
most popular candidates for mediating neurotoxicity. Due to the essential function of tau in
the assembly and maintenance of microtubules, hyperphosphorylated tau compromises

Introduction
40
intracellular trafficking upon its dissociation from microtubules. Another way through which
tau has been proposed to exert its toxicity is by disrupting protein turnover pathways – the
proteasomal, the lysosomal and the autophagosomal function. Ren and collaborators found,
for example, that in HEK293 cells hyperphosphorylation of tau inhibits the proteasome (Ren
et al., 2007; Gendreau & Hall, 2013; Wang et al., 2013).
Interestingly, the amyloid cascade hypothesis is also supported by the fact that apoE
has an Aβ-dependent role in AD pathogenesis. It has been shown that human apoE induces
Aβ clearance in human APP transgenic mice and notably, apoE2 and apoE3 are able to clear
more Aβ when compared to apoE4 (Holtzman et al., 1999; Holtzman et al., 2000; Bales et al.,
2009; Huang & Mucke, 2012).
Despite the enormous evidence supporting the well-known amyloid cascade
hypothesis, in the last years some reports have provided evidence that the validity of the
hypothesis cannot be unequivocally accepted. One of the arguments against the hypothesis is
that amyloid burden can be seen in cognitively normal individuals (Morris et al., 2014;
Herrup, 2015). Another argument against the hypothesis originates from the fact that apart
from its Aβ-dependent role in AD pathogenesis, ApoE can also have an Aβ-independent role.
It has been shown that apoE4 can undergo proteolytic cleavage, which generates C-terminally
truncated neurotoxic fragments that could trigger neuronal dysfunction and
neurodegeneration. Interestingly, those fragments have been shown to increase tau
phosphorylation and the formation of neurofibrillary tangles, which could be the reason for
their neurotoxicity (Huang & Mucke, 2012).
1.4.5. Mouse models of Alzheimer's disease
Research on AD pathogenesis has involved many approaches to model the disease -
ranging from in vitro assays to the development of elaborate rodent models of AD. Transgenic
mouse models of AD, based on information about the genetics of rare inherited forms of AD,
have been particularly popular and useful for the elucidation of the mechanisms of disease
pathogenesis (Spires & Hyman, 2005). A variety of such transgenic mouse models of AD rely
on the expression of wild type APP or APP bearing familial AD (FAD) mutations. The first
convincing model based on this approach was published in 1995 by Games and collaborators,
the PDAPP transgenic mouse model, which overexpresses human APP bearing a FAD-
associated mutation (V717F) in neurons. Notably, the levels of APP in this mouse line are ten
times higher than the endogenous levels of APP. This mouse model reproduces many features
of AD pathology, such as extracellular thioflavin S-positive Aβ deposits, dystrophic neurites,

Introduction
41
gliosis, and reduced synapse density (Games et al., 1995; Spires & Hyman, 2005; Elder et al.,
2010). In 1996, Hsiao et al. described another APP transgenic mouse model, named Tg2576,
which overexpresses human APP bearing the Swedish FAD-associated mutation (K670N,
M671L) in neurons. Like the PDAPP mice, these mice also develop amyloid plaques along
with dystrophic neurites and gliosis (Hsiao et al., 1996; Spires & Hyman, 2005; Elder et al.,
2010).
Besides overexpression of wild type or mutant APP, another strategy employed in the
field is the combination of APP transgenes with PS1 or PS2 transgenes in an attempt to
enhance AD-related pathology. Indeed, in 1997, Borchelt and collaborators showed that mice
coexpressing a PS1 variant bearing an FAD-linked mutation and a chimeric mouse/human
APP bearing the Swedish mutation exhibit amyloid deposition earlier than mice expressing
mutant APP or mutant PS1 alone (Borchelt et al., 1997; Spires & Hyman, 2005).
Another model that combines the presence of APP and PS1 mutant transgenes is the
model used in this study - 5xFAD (Oakley et al., 2006). 5xFAD is a mouse model expressing
APP695 and PS1 bearing five familial AD-related mutations in total. APP bears three FAD-
associated mutations - the Swedish mutation (K670N, M671L) increases the total levels of
Aβ, while the Florida (I716V) and the London (V717I) mutations increase the levels of Aβ42.
The mutations in PS1 (M146L and L286V) also increase the levels of Aβ42. The transgenes
are expressed under the control of the Thy1 promoter, which drives expression in neurons.
The concentration of five FAD-associated mutations in the mouse model results in a highly
accelerated development of AD pathology, with an accumulation of Aβ42 starting within
neuronal somata and neurites and preceding the formation of amyloid plaques at the age of
one and a half months. Amyloid deposits, which appear at 2-month-old animals, are
accompanied by gliosis - activated astrocytes and microglia surround the plaques - and spread
from deeper cortical layers and the subiculum to later occupy large parts of the cortex,
subiculum and hippocampus. Additionally, the 5xFAD model shows decreased levels of
various synaptic markers. In comparison to other transgenic mouse models of AD, the 5xFAD
mice are one of the few models that exhibit neuronal loss. Interestingly, the 5xFAD mice
develop spatial memory deficits as measured in the Y-maze by the age of four to five months
(Oakley et al., 2006).
Notably, APP overexpressing AD model mice do not exhibit neurofibrillary tangles
although many of them show substantial tau hyperphosphorylation. In order to model the
formation of neurofibrillary tangles, tau transgenic models have been developed, which entail
the overexpression of tau alone or in combination with other transgenes. For example, in

Introduction
42
2003, Oddo and collaborators reported the generation of a triple transgenic mouse model
characterized by overexpression of APP bearing the Swedish mutation, PS1 bearing the
M146V mutation, and tau bearing the P301L mutation. Besides amyloid pathology, this
mouse model also exhibits neurofibrillary tangles (Oddo et al., 2003; Spires & Hyman, 2005;
Morrissette et al., 2009).
Despite the enormous usefulness of transgenic mouse models for the elucidation of
mechanisms of AD pathogenesis, they have received criticism due to the possibility of
overexpression artifacts. To avoid such off-target effects of overexpression, Saito and
collaborators reported knock-in mouse lines which bear the Swedish and Beyreuther/Iberian
mutations with or without the Arctic mutation in the APP gene. The mice exhibited A
pathology, neuroinflammation and memory impairment (Saito et al., 2014).
1.5. SUMO in Alzheimer's disease
Over the past few years, an increasing number of studies have proposed a link between
the post-translational modifier SUMO and AD pathology. This cannot be considered as
unexpected, taking into account the large number of neuronal proteins that were shown or
predicted to be SUMOylated (Lee et al., 2013). However, the corresponding literature is still
very sketchy and controversial.
1.5.1. SUMOylation of APP
In 2005, Gocke and collaborators described an in vitro expression cloning approach
for the identification of putative SUMO1 substrates. Among the identified putative SUMO1
substrates was APP (Gocke et al., 2005). Subsequently, conjugation of SUMO1 and SUMO2
to APP in HeLa cells was proposed, partly based on studies in which lysines 587 and 595 in
APP were mutated to arginine (K587R, K595R). The authors also claimed that endogenous
APP is SUMOylated in the mouse brain. To support their hypothesis, the authors intended to
prove the presence of Ubc9 in the ER, the compartment in which APP was thought to become
SUMOylated (Zhang & Sarge, 2008a). However, others failed to show conjugation of
SUMO2 to APP in HEK293T cells (Li et al., 2003) indicating that the SUMOylation of APP
is still an unresolved matter.
1.5.2. Effect of SUMO on APP processing and Aβ levels
With the intention of developing new therapeutic approaches to modulate Aβ levels,
several studies have explored the influence of SUMOylation on Aβ levels and APP

Introduction
43
processing. However, the results obtained in the corresponding studies are very controversial
and thus, the issue remains far from being resolved (Lee et al., 2013).
In 2003, the first report exploring this issue was published, indicating that
coexpression of SUMO2 and APP in HEK293T cells results in decreased Aβ levels as
compared to control, and favours the nonamyloidogenic processing of APP. Interestingly, the
authors claimed that poly-SUMO2 conjugation, in contrast to mono-SUMO2 or lowered
SUMO2 conjugation, reduced Aβ production. Further analyses indicated that coexpression of
both wild type and non-conjugatable SUMO2 increased the levels of APP and BACE1.
Ultimately, the authors claimed that the turnover of APP was unchanged (Li et al., 2003; Lee
et al., 2013). Unfortunately, the SUMO2 conjugates involved in the decreased Aβ levels were
not identified. In support of the study from Li et al. (2003), Zhang and Sarge (2008) showed
that increasing the SUMOylation machinery in cells causes decreased levels of Aβ aggregates
and argued that increased levels of SUMOylated APP might be involved.
However, other studies contradicted these observations (Dorval et al., 2007; Yun et
al., 2013). Although there is a certain ambiguity regarding the nomenclature of SUMO
variants used, Dorval et al. (2007) showed that coexpression of SUMO2 and APP in HEK293
cells leads to a significant increase in the Aβ40 and Aβ42 levels. In contrast to the study of Li et
al. (2003), this effect did apparently not require the covalent attachment of SUMO2 to
substrates, supporting the hypothesis that the modulation of Aβ levels by SUMO2 does not
require conjugation of SUMO2 to substrates. Notably, as in the study from Li et al. (2003),
SUMO2 overexpression also lead to increased levels of APP and BACE1, but here, the
authors claimed that the half-life of APP was altered. Thus, the results of Dorval et al. (2007)
indicate that overexpression of SUMO2 monomers, and not SUMO2 conjugation, upregulates
APP and BACE1 levels, thereby enhancing the formation of Aβ (Dorval et al., 2007; Lee et
al., 2013).
In 2013, Yun and collaborators showed that coexpression of APP with either SUMO1,
SUMO2 or SUMO3 in cells stably expressing Myc-tagged BACE1 (HBmg) resulted in
increased levels of full length APP and of Aβ. Interestingly, this effect did not require
covalent binding of SUMOs (Yun et al., 2013). In a follow-up study, the group argued that
SUMO1 regulates autophagy-dependent Aβ production (Cho et al., 2015a). Additionally, Yun
et al. (2013) showed that overexpression of all three SUMO isoforms increased the levels of
BACE1 in HBmg cells and primary cortical neurons, and that this effect is abolished when a
SIM-like motif is mutated in BACE1. While Yun et al. (2013) showed that the increased
BACE1 levels are not caused at the transcriptional level, Fang and collaborators reported that

Introduction
44
overexpression of SUMOs inhibits the BACE1 gene promoter activity (Fang et al., 2011).
Finally, in a recent study, Lee and collaborators showed in Tg2576 hippocampal slices that
increasing SUMOylation does not affect Aβ40 and Aβ42 levels while it rescues Aβ-induced
deficits in learning and memory (Lee et al., 2014).
The main problem in interpreting the studies described above is the variety of the cell
systems or AD transgenic mice used to study the link between SUMOylation and APP
processing and Aβ levels, which makes it difficult to put the entirety of these into perspective.
However, independently of whether Aβ levels are increased or decreased by SUMOylation,
the corresponding studies establish a link between protein SUMOylation and APP processing,
but the exact molecular mechanisms that cause these effects remain unidentified.
1.5.3. Effect of Aβ levels on SUMO
Besides studying the influence of protein SUMOylation on APP processing and Aβ
levels, researchers have also addressed the question as to whether Aβ levels can modulate
SUMOylation. Using predominantly transgenic mouse models of AD that overexpress APP,
several groups intended to study how increased Aβ levels might influence the levels of free
and/or conjugated SUMOs, producing again highly controversial and incomplete results.
Using a Western blot approach, McMillan and collaborators described in 9-month-old
Tg2576 mice that the total levels of SUMO1 and SUMO2/3 conjugates do not differ
significantly from control mice in cortex, hippocampus, or cerebellum, with the exception of
two high molecular weight SUMO2/3 conjugate bands in the cortex. Additionally, the levels
of Ubc9 and SENP1 proteins did not show any changes in any of the brain regions explored
(McMillan et al., 2011).
Furthermore, Nistico et al. (2014) found the levels of SUMO1 conjugates to be
increased and the SUMO2/3 conjugate levels to be unchanged in the cortex and the
hippocampus of 3-6 months old transgenic Tg2576 animals. Interestingly, the authors
observed increased SUMO1 mRNA levels in transgenic Tg2576 animals at the age of 6 moths
in both brain regions tested. At the age of 17 months, the levels of SUMO1 conjugates had
returned to basal levels, while SUMO2/3 conjugate levels were reduced in cortex and
hippocampus. Furthermore, Ubc9 and SENP1 proteins levels were increased in these brain
regions at 6 months of age (Nistico et al., 2014).
Finally, a third group studied SUMO conjugate levels in the Tg2576 model and
described minimal changes in the levels of Ubc9 and SUMO1 conjugates at 1-2-, 7-8- and 13-

Introduction
45
14- months in hippocampus, while SUMO2/3 conjugate levels were decreased in 7-8-, 13-14-
and 24-26-month-old animals in the same brain region (Lee et al., 2014).
In summary, three independent groups studied by Western blotting the levels of
SUMO conjugates, and two of them the SUMOylation enzymes in the Tg2576 model, and
reached different conclusions. A possible explanation for these discrepancies might be the use
of different antibodies, partly of poor quality/specificity, and different ways of analysing
Western blot data. Based on other mouse models of AD, several studies described increased
levels of SUMO1 or of SUMO1 conjugates at various disease stages and in various brain
regions, but here again, the corresponding data are poorly quantified (Yun et al., 2013; Zhao
et al., 2013; Cho et al., 2015a).
In light of the various AD mouse models used, the various brain regions and ages
studied, and the various tools used to detect SUMOs, it is very difficult to draw any clear
conclusions regarding the putative interplay between SUMO levels, aging, and AD.
Apart from the use of transgenic mice, the influence of increased Aβ levels on SUMO
levels has also been studied in cell culture systems. Interestingly, Yun and collaborators
described that treatment of primary cortical neurons and HBmg cells with Aβ1-40 increases the
levels of both, free and conjugated SUMO1. This effect was also observed after
overexpression of GFP-Aβ1-42 in HBmg cells (Yun et al., 2013). Interestingly, the opposite
effect was described in primary astrocyte cultures, where SUMO1 levels and levels of
SUMO1 conjugates were decreased upon Aβ treatment. Besides SUMO1 conjugates, the
levels of Ubc9 were also reduced. Furthermore, the authors showed that overexpression of
SUMO1 in astrocytes blocks the Aβ-induced reactivity of astrocytes, as indicated by
upregulated GFAP expression and hypertrophy of cell bodies and processes (Hoppe et al.,
2013). Here, the contradicting results may not only be due to the different cell systems tested
but to various ways of preparing Aβ peptide.
In acute hippocampal slices from wild type mice, Lee et al. (2014) described that
induction of LTP leads to increased levels of SUMO2/3 conjugates. Interestingly, this effect
was abolished in slices from Tg2576 mice, as well as in wild type slices treated with Aβ42
oligomers, indicating that increased Aβ levels block LTP-induced increases in SUMO2/3
conjugation levels. Incubation of Aβ-treated slices with TAT-Ubc9 restored the activity-
induced increase in SUMO2/3 conjugation. However, the SUMO2/3 conjugates involved in
this phenomenon were not identified.
Transgenic mouse models of AD have been also utilized to study alterations in SUMO
localization. SUMO1 is mainly found in cell nuclei, but several studies, using different AD

Introduction
46
mouse models (aged between 12 and 26 months) have reported a localization of SUMO1
surrounding amyloid plaques and colocalization of SUMO1 with phospho-Tau or autophagy
markers (Takahashi et al., 2008; Yun et al., 2013; Zhao et al., 2013; Cho et al., 2015a). In
addition to SUMO1 surrounding plaques, some SUMO1 labelling within plaques was
observed (Yun et al., 2013; Zhao et al., 2013). However, it should be noted that in most of the
studies mentioned above, the typical SUMO1 staining as a ring representing the nuclear
membrane was not observed, which raises doubts about the specificity of the SUMO1
detection tools used.
1.5.4. SUMO and tau
Several studies have indicated a link between SUMOs and tau, another major player in
AD pathogenesis. In 2006, Dorval and Fraser demonstrated SUMOylation of tau in HEK293
cells, with a preference for SUMO1 conjugation. In this study, lysine 340 appeared to be the
dominant acceptor lysine. Interestingly, tau SUMOylation was decreased upon proteasome
inhibition. Finally, the authors demonstrated that tau SUMOylation was increased upon
treatment with the phosphatase inhibitor okadaic acid and the microtubule depolymerizing
agent colchicine. Since tau binding to microtubules is negatively influenced by
phosphorylation, the study indicates that SUMOs preferentially conjugate to the free soluble
pool of tau, i.e. the pool that is not bound to microtubules (Dorval & Fraser, 2006).
Another recently published report extensively explored the downstream effects of tau
SUMOylation. In an overexpression approach in HEK293 cells, the authors confirmed that
tau is modified by SUMO1 at lysine 340 and that this results in increased tau phosphorylation
at various residues, indicating that SUMOylation of tau induces its hyperphosphorylation.
Strikingly, the authors also observed that tau SUMOylation is also stimulated by tau
phosphorylation, indicative of a positive regulatory loop between SUMOylation and
phosphorylation of tau. Further, the authors described that tau SUMOylation decreases its
solubility and counteracts its degradation, indicating that SUMOylation might compete with
tau ubiquitination. Finally, in an attempt to examine the upstream factors that influence tau
SUMOylation, the authors treated primary rat hippocampal cultures with Aβ40. This resulted
in an increase in tau phosphorylation and tau SUMOylation (Luo et al., 2014). These studies
describe an interesting interplay between SUMOylation, phosphorylation, and ubiquitination
of tau, and a link with its aggregation propensity.
A link between SUMO and tau in vivo has been proposed by the aforementioned
studies from Takahashi et al. (2008) and Zhao et al. (2013) which demonstrated a

Introduction
47
colocalization of SUMO1 with phospho-tau surrounding amyloid plaques in transgenic mouse
models of AD. Colocalization of SUMO1 and phospho-tau was also seen in cortex and the
hippocampal CA1 region in AD patients (Luo et al., 2014). However, these studies were done
using anti-SUMO antibodies that did not show the typical nuclear SUMO1 staining, which
raises concerns regarding the validity of the relevant studies.
1.5.5. SUMO in Alzheimer's disease patients
The use of transgenic mice, cell cultures, and in vitro systems to demonstrate a link
between AD and SUMOylation has been complemented by analyses of samples from AD
patients. Evidence that the mechanism of SUMOylation is linked to AD came from two
genetic association studies. Genome-wide association studies showed that the SNP
rs6907175, located within a gene homologous to SUMO1 activating enzyme subunit 1, and a
polymorphism in intron 7 of the SUMO conjugating enzyme Ubc9 are associated with late-
onset AD (Grupe et al., 2007; Ahn et al., 2009; Lee et al., 2013). Additionally, using
microarray and real-time RT PCR analyses of parietal lobes of late-onset AD patients, non-
AD demented patients, and non-demented controls, Weeraratna et al. (2007) reported a
downregulation of sentrin-specific protease 3 (SENP3) in AD patients. While these studies
may indicate a link between protein SUMOylation and AD, the underlying molecular
mechanisms remain unknown.
In studies on AD patients, several additional pieces of evidence were provided that
appear to link SUMOylation and AD. One study reported an increased level of SUMO1 in
blood plasma from demented patients as compared to healthy controls (Cho et al., 2015b).
Another study indicated that SUMO2/3 might localize to both, neuronal somata and nuclei,
under normal conditions, while SUMO2/3 appears to be exclusively somatic in more neurons
in AD patients (Li et al., 2003). Further, Luo et al. (2014) described that SUMO1 signals are
increased in the cortex and the hippocampal CA1 region of AD patients, and that SUMO1
appears to colocalize with phosphorylated tau. Additionally, Lee et al. (2014) described a
significant decrease in the levels of high molecular weight SUMO2/3 conjugates, but not of
SUMO1 conjugates, in brains of AD patients. Here again, it is difficult to draw definitive
conclusions from these correlative studies in human patients. There seems to be a link
between SUMOylation and AD, but the underlying molecular mechanisms are unclear, as is
the question as to whether the observed changes are causes or consequences of the
neurodegenerative process.
Introduction
48
1.5.6. Other links between SUMO and Alzheimer's disease
SUMOylation has been implicated in the regulation of a variety of processes related to
AD pathogenesis. For example, mitochondrial dysfunction is a major feature of various
neurodegenerative diseases, including AD. Two studies have shown a dysregulation of DRP1,
a GTPase required for mitochondrial fission, in brains of AD patients (Wang et al., 2009;
Manczak & Reddy, 2012). Interestingly, DRP1 was shown to be a SUMO substrate, and
SUMOylation of DRP1 influences its function during mitochondrial fragmentation (Harder et
al., 2004; Figueroa-Romero et al., 2009; Lee et al., 2013; Martins et al., 2016).
Further, a possible link between AD and kainate receptor signalling has been
proposed. Kainate receptor binding is significantly increased in the frontal cortex of AD
patients, and kainate binding sites being proportional to the plaque abundance in deep cortical
layers has been described in AD (Chalmers et al., 1990; Lee et al., 2002; Martins et al.,
2016). In this context, it has also been proposed that SUMOylation of the kainate receptor
subunit GluK2 favours its endocytosis (Martin et al., 2007a). Thus, impaired SUMOylation of
GluK2 in AD might increase its abundance at the neuronal cell surface.
Other interesting SUMO targets that could be investigated with relation to AD
pathogenesis include the transcription factor MEF2 (Shalizi et al., 2006), the RNA-binding
protein La (van Niekerk et al., 2007), the protein kinase CASK (Chao et al., 2008), the
cAMP-responsive element binding protein (CREB) (Comerford et al., 2003), and the K2P1
potassium channel (Rajan et al., 2005; Lee et al., 2013).
1.6. Investigating SUMOylation
The identification of endogenous SUMO substrates has long been hampered due to a
variety of reasons. Even though SUMOs are often conjugated to a ψKxD/E motif,
SUMOylation sites cannot be reliably predicted by bioinformatics. Furthermore,
SUMOylation is a transient modification due to isopeptidases that efficiently reverse
SUMOylation. In addition, at any given time only a small percentage of a given protein is
SUMOylated. Also, reliable antibodies for affinity purification of endogenous SUMO
substrates have long been missing. Finally, one problem that particularly concerns the study
of SUMO2 and SUMO3 conjugation stems from the close resemblance of SUMO2 and
SUMO3 so that no currently available antibody can distinguish them (Tirard et al., 2012;
Yang & Paschen, 2015).
In attempts to overcome these difficulties, researchers have employed various
approaches. One of these is the expression of tagged SUMOs in a wild type background

Introduction
49
(Tirard et al., 2012). A large number of studies reported on the expression of tagged SUMOs
in mammalian cell cultures. Especially important in the SUMOylation research are
proteomics analyses, the goal of which is the large-scale identification of candidate SUMO
substrates by affinity purification followed by mass spectrometry, and the identification of the
SUMO-targeted lysines using proteomics tools. Thus, a variety of proteomics studies were
performed based on expressing tagged SUMOs in mammalian cell cultures (Vertegaal et al.,
2004; Rosas-Acosta et al., 2005; Vertegaal et al., 2006; Blomster et al., 2009; Golebiowski et
al., 2009; Tatham et al., 2011; Tirard et al., 2012). For example, the first study that aimed to
identify SUMO2 substrates at a large-scale was published by Vertegaal et al. (2004). Due to
the already mentioned differences in the nomenclature used by some groups and by the
existing databases, here SUMO2 actually means SUMO3. The study reported the use of a
HeLa cell line stably expressing His6-SUMO3 to pull down SUMOylated proteins by Ni2+-
nitriloacetic acid-agarose beads, which were then subjected to mass spectrometry analysis
(Vertegaal et al., 2004; Yang & Paschen, 2015). Apart from cell cultures, tagged SUMOs
were also expressed in vivo. Proteomic studies with tagged SUMOs were performed, for
instance, in Trypanosoma cruzi (Bayona et al., 2011), Toxoplasma gondii (Braun et al.,
2009), Drosophila melanogaster (Nie et al., 2009; Tirard et al., 2012). Recently, a study
reported the generation of a transgenic mouse in which the expression of His-SUMO1, HA-
SUMO2 and FLAG-SUMO3 is Cre-dependent. In the same study, the authors describe the use
of the transgenic mice for the proteomic examination of changes in SUMO3 conjugation upon
ischemia (Yang et al., 2014). Thus, proteomics could not only be used under normal
physiological conditions but also to identify changes in SUMO conjugation upon different
pathological events. In spite of the usefulness of the expression of tagged SUMOs in a wild
type background, a key disadvantage of this approach are possible overexpression artifacts,
e.g. by off-target SUMOylation (Tirard et al., 2012).
Other groups have attempted to affinity purify endogenous SUMO conjugates. A
purification approach for the enrichment of endogenous polySUMOylated proteins was
published by Bruderer et al. (2011). The purification approach makes use of the four SIMs
present on a fragment of RNF4, which allow it to bind to polySUMO chains. This strategy
was employed to identify polySUMOylated proteins upon heat shock in HeLa cells (Bruderer
et al., 2011; Yang & Paschen, 2015). Yet another group also reported the purification of
endogenous SUMO substrates with the use of monoclonal antibodies for immunoprecipitation
and elution with epitope-specific peptides. The authors used this approach, combined with
mass spectrometry analysis, to compare for the first time the endogenous SUMO1 and

Introduction
50
SUMO2/3 conjugates in mammalian cells. Notably, the study also reported the enrichment of
SUMO substrates from mouse liver (Becker et al., 2013; Yang & Paschen, 2015).
Another approach that has been used in an attempt to facilitate the identification of
novel SUMO targets is the exchange of endogenous SUMOs with affinity-tagged forms. This
approach excludes the presence of overexpression artifacts as the tagged SUMOs are
expressed at levels close to the endogenous ones (Tirard et al., 2012). The use of substitution
of the endogenous SUMO with tagged SUMOs for proteomics analysis has been reported in
different organisms such as yeast (Panse et al., 2004; Denison et al., 2005; Hannich et al.,
2005), Arabidopsis thaliana (Miller et al., 2010), Candida albicans (Leach et al., 2011), and
Caenorhabditis elegans (Kaminsky et al., 2009; Tirard et al., 2012). In 2012, Tirard et al.
(2012) published the generation of the aforementioned SUMO1 knock-in mouse model,
which expresses His6-HA-SUMO1 instead of wild type SUMO1 under the control of the
endogenous promoter. Apart from the identification and validation of SUMO substrates, this
model is also extremely useful for studying the localization of free SUMO1 and SUMO1
conjugates. In comparison to previously published models, this knock-in model has several
advantages. First, as was already mentioned, expression of tagged SUMO1 instead of the wild
type protein excludes overexpression artifacts such as ‘off-target’ SUMOylation.
Additionally, very reliable anti-HA antibodies for affinity purification and immunostaining
exist. It should be also noted that wild type mice are ideal negative controls for the knock-in
mice. The authors used this mouse model to explore for the first time the SUMO1 conjugates
in the brain (Tirard et al., 2012; Yang & Paschen, 2015). They performed anti-HA affinity
purification to enrich SUMO1 conjugates from the brain, separated the eluates by SDS-PAGE
and analysed the tryptically digested gel pieces by mass spectrometry. Using this approach,
several hundreds of candidate SUMO1 substrates linked to various biological processes were
identified. The candidate list included already known SUMO1 substrates, such as RanGAP1
and RanBP2, but also some novel candidate SUMO1 substrates such as Smchd1, Zbtb20,
TIF1, and Ctip2. Some of the proteins from the candidate list were validated by Western blot
analysis (Tirard et al., 2012).
1.7. Aims of the present study
The first aim of the present study was the generation of a Strep-Myc-SUMO3 knock-
in mouse line and its basic characterization. Analogous to the His6-HA-SUMO1 knock-in
model generated previously (Tirard et al., 2012), we wanted to generate a reliable tool to
study SUMO3 conjugation profile in vivo by the generation of a SUMO3 knock-in mouse

Introduction
51
model. Our expectation is that this mouse line will be an excellent model to study SUMO3
localization and identify SUMO3 substrates. This would be extremely useful, given the high
similarity between SUMO2 and SUMO3 that confounds the distinction between the two
proteins using antibodies. Furthermore, we expect that the new mouse line will allow to
investigate SUMO3 function in the context of different physiological and pathological
conditions, which is important because it has been demonstrated that predominantly
SUMO2/3 conjugation increases dramatically upon aberrant cellular conditions.
As has been mentioned above, a large number of studies indicate a link between
SUMOylation and AD pathogenesis. Thus, the second aim of this study was to investigate
SUMO1 conjugation profile in the presence of AD pathology by making use of His6-HA-
SUMO1 knock-in mice and 5xFAD mice as a model of AD. Using crossbred His6-HA-
SUMO1;5xFAD mice at different time points of disease progression, we aimed to identify
changes in the localization of SUMO1 and in the global SUMO1 conjugation levels that
might be associated with AD pathology. Our expectation was that these experiments would
help to elucidate the molecular link between SUMO1 and AD pathogenesis.

Materials and Methods
52
2. Materials and Methods
2.1. Animals
All experiments including mice were performed in agreement with the guidelines for
the welfare of experimental animals issued by the Federal Government of Germany and the
Max Planck Society.
Table 2.1: Mouse lines used in this study
Mouse line Description Reference Provider
His6-HA-SUMO1
knock-in
SUMO1 knock-in mouse line
expressing His6-HA-tagged SUMO1
instead of wild type SUMO1 from
the endogenous locus
(Tirard et al.,
2012)
Dr. M. Tirard
5xFAD Double transgenic mice expressing
human APP and PS1 bearing five
familial AD-related mutations
(Oakley et
al., 2006)
Kindly
provided by
Prof. Dr.
Thomas Bayer
Strep-Myc-
SUMO3 knock-in
SUMO3 knock-in mouse line
expressing Strep-Myc-SUMO3
instead of wild type SUMO-3
Created as a
part of the PhD
project
2.2. Molecular biology
2.2.1. Oligonucleotides
The oligonucleotides’ Lab ID numbers and sequences are listed. Restriction sites
which were used for cloning are underlined and in bold. The primers indicated with (1-8)
were used for validation of positive ES cell clones and the ones indicated with (9-11) were
used for genotyping of the Strep-Myc-SUMO3 knock-in mouse. All these numbers are used
in Fig. 3.3.

Materials and Methods
53
Table 2.2: Primers used in this study
Primer ID Sequence Restriction site
29680 5'-CAGCGCGCTAGCCCCA -3' NheI
29681 5'-TGATCAGCCAGTCAAGAGCACAGAATG -3' BclI
29682 5'-AGCTAGCATCTCCAAAGTGC -3' NheI
29683 5'-TGATCATTTAAGGCCACCTCCGCT -3' BclI
30945 5'-CGATGTCGACTTGAGATAAGGAGTCTCCTC -3' SalI
29685 5'-GAATTCGCTAGCGCGCTGCCCGGGGCGGAGT -3' EcoRI, NheI
29686 5'-ACTAGTGTGACGCATTCGCAACCGT -3' SpeI
29687 5'-ACTAGTGTACAAGTGTGTATCCACCTG -3' SpeI
31653 5'-CATGGAATTCGCTAGCCCCACCCCCGGCT -3' EcoRI, NheI
31654 5'-CGATGAATTCGCTAGCATCTCCAAAGTGC -3' EcoRI, NheI
31738 5'-CATGGGCGCCTGACCCGCCCCGTGACGATTC -3' NarI
31739 5'-
ATGTGGTCACACCCGCAGTTTGAGAAGGAACAAAA
ACTTATTTCTGAAGAAGATCTGTCGGAAGAGAAGC
CCAAGGTAAGCCCGG -3'
31740 5'-
CAGATCTTCTTCAGAAATAAGTTTTTGTTCCTTCTC
AAACTGCGGGTGTGACCACATGGTTGCGCAGCGAC
GGCGGCGGCAAGCG -3'
31741 5'-CATGGCTAGCGCGCTGCCCGGGGCGGAGTGCA -
3'
NheI
31629 (1) 5'-GCCACCTAGTGGTTACTTTG -3'
33462 (2) 5'-GCACCCTTCCTTTCTTGACTTTCC -3'
22574 (3) 5'-CCTCTTGAAAACCACACTGCTCGACCT -3'
33455 (4) 5'-CTTCTCAAACTGCGGGTGTGACCA -3'
33456 (5) 5'-GGCTTACCTTGGGCTTCTCTTCCGA -3'
33457 (6) 5'-GGCTTGCGTACCGGGCTTACCTTG -3'
4174 (7) 5'-GGCTTGCGTACCGGGCTTACCTTG -3'
33570 (8) 5'-CTGTCAAGACAGGTACGACTAGTGGGTTC -3'
34055 (9) 5'-CGTGACTCGCCCGCTCCA -3'
34056 (10) 5'-CCGGGTTCTCGAGCCGTG -3'

Materials and Methods
54
16285 (11) 5'-TGAAAACCACACTGCTCGACC -3'
31892 5'-
CATGAAGCTTATGTCCGAGGAGAAGCCCAAGGAG -
3'
HindIII
31891 5'-
CATGAAGCTTATGTGGTCACACCCGCAGTTTGAGA
AGGAACAAAAACTTATTTCTGAAGAAGATCTGTCC
GAGGAGAAGCCCAAGGAG -3'
HindIII
30934 5'-
CATGAAGCTTATGGAACAAAAACTTATTTCTGAAG
AAGATCTGTACCCATACGATGTTCCAGATTACGCTT
CCGAGGAGAAGCCCAAGGAG -3'
HindIII
30935 5'-CAGTGGATCCCTAACCTCCCGTCTGCTGCTGG -3' BamHI
2.2.2. Plasmids
Table 2.3: Plasmids used in this study
Name Obtained from
pcDNA3 Invitrogen
pcDNA3.1 (-) Invitrogen
pBluescript II SK (-) Stratagene
pTKNeoLox Kind gift from
Prof. Dr.
Thomas Südhof
pCRII-TOPO Invitrogen
pCRII-TOPO + 5' miniarm for 5' homology arm (5' MA 5' HA pCRII-
TOPO)
this work
pCRII-TOPO + 3' miniarm for 5' homology arm (3' MA 5' HA pCRII-
TOPO)
this work
pCRII-TOPO + 5' miniarm for 3' homology arm (5' MA 3' HA pCRII-
TOPO)
this work
pCRII-TOPO + 3' miniarm for 3' homology arm (3' MA 3' HA pCRII- this work

Materials and Methods
55
TOPO)
pBluescript II SK (-) + 5' and 3' miniarms for 5' homology arm (5', 3' MA
5' HA pBluescript II SK (-))
this work
pBluescript II SK (-) + 5' and 3' miniarms for 5' homology arm – MCS
SpeI (5', 3' MA 5' HA – SpeI MCS pBluescript II SK (-))
this work
pBluescript II SK (-) + 5' homology arm (5' HA pBluescript II SK (-)) this work
pcDNA 3.1 (-) + 5' and 3' miniarms for 3' homology arm (5', 3' MA 3' HA
pcDNA 3.1 (-))
this work
pBluescript II SK (-) + 5' and 3' miniarms for 3' homology arm (5', 3' MA
3' HA pBluescript II SK (-))
this work
pBluescript II SK (-) + 3' homology arm (3' HA pBluescript II SK (-)) this work
pTKNeoLox + 3' homology arm (3' HA pTKNeoLox) this work
pCRII-TOPO + NarI-NheI segment with Strep-Myc-tagged exon1 (Strep-
Myc-exon 1 pCRII-TOPO)
this work
pBluescript II SK(-) + 5' homology arm bearing Strep-Myc tag after the
start codon of SUMO3 (Strep-Myc-exon1 in 5' HA pBluescript II SK (-))
this work
pTKNeoLox + 5' homology arm bearing Strep-Myc tag after the start
codon of SUMO3 + 3' homology arm (Strep-Myc-exon1 in 5’HA, 3’HA
pTKNeoLox)
this work
pCRUZ + HA-SUMO3 (HA-SUMO3 pCRUZ) Kind gift from
Prof. Dr. F.
Melchior
pCRUZ + His6-SUMO3 (His6-SUMO3 pCRUZ) Kind gift from
Prof. Dr. F.
Melchior
pCRII-TOPO + Myc-HA-SUMO3 (Myc-HA-SUMO3 pCRII-TOPO) this work
pcDNA3 + Myc-HA-SUMO3 (Myc-HA-SUMO3 pcDNA3) this work
pcDNA3 + SUMO3 (SUMO3 pcDNA3) this work
pcDNA3 + Strep-Myc-SUMO3 (Strep-Myc-SUMO3 pcDNA3) this work
Primers 30945 and 29687 were used to amplify the 5' miniarm for the recovery of the
5' homology arm of the Strep-Myc-SUMO3 knock-in targeting vector. As a template, BAC

Materials and Methods
56
DNA containing the SUMO3 gene was used. The PCR product was inserted into pCRII-
TOPO vector for the generation of the 5' MA 5' HA pCRII-TOPO plasmid.
Primers 29685 and 29686 were used to amplify the 3' miniarm for the recovery of the
5’ homology arm. The aforementioned BAC DNA was used as a template. The PCR product
was inserted into pCRII-TOPO for the generation of 3' MA 5' HA pCRII-TOPO.
Primers 29680 and 29681 were used to amplify the 5' miniarm for the recovery of the
3' homology arm. The aforementioned BAC DNA was used as a template. The PCR product
was inserted into pCRII-TOPO for the generation of 5’ MA 3' HA pCRII-TOPO.
Primers 29682 and 29683 were used to amplify the 3' miniarm for the recovery of the
3' homology arm. The aforementioned BAC DNA was used as a template. The PCR product
was inserted into pCRII-TOPO for the generation of 3' MA 3' HA pCRII-TOPO.
5', 3' MA 5' HA pBluescript II SK (-) was obtained by digestion of 5' MA 5' HA
pCRII-TOPO with SalI and SpeI, 3' MA 5' HA pCRII-TOPO with SpeI and EcoRI and
pBluescript II SK (-) with SalI and EcoRI and subsequent triple ligation of the two miniarms
into the pBluescript II SK (-) vector.
5', 3' MA 5' HA – SpeI MCS pBluescript II SK (-) was obtained by digestion of 5', 3'
MA 5' HA pBluescript II SK (-) with XbaI and BamHI, incubation of the cut DNA with
Klenow polymerase to create blunt ends and subsequent ligation.
5' HA pBluescript II SK (-) was generated by successful recombineering after
transformation of 5', 3' MA 5' HA – SpeI MCS pBluescript II SK (-) in SW106 cells
containing BAC DNA with the SUMO3 gene. Before the transformation of the vector, it was
linearized by SpeI and dephosphorylated.
5', 3' MA 3' HA pcDNA 3.1 (-) was obtained by digestion of 5' MA 3' HA pCRII-
TOPO and 3' MA 3' HA pCRII-TOPO with NheI and BclI and pcDNA3.1. (-) with NheI
followed by triple ligation of the miniarms into the pcDNA3.1 (-) vector. After digeston,
pcDNA3.1 (-) was dephosphorylated.
Primers 31653 and 31654 were used to amplify the joined 5' and 3' miniarms for
recovery of 3' homology arm. 5', 3' MA 3' HA pcDNA3.1 (-) was used as a template. The
PCR product was cut with EcoRI. pBluescript II SK (-) was also cut with EcoRI and
dephosphorylated. This was followed by ligation of the joined miniarms into pBluescript II
SK (-) to obtain 5', 3' MA 3' HA pBluescript II SK (-).
3' HA pBluescript II SK (-) was generated by successful recombineering after
transformation of 5', 3' MA 3' HA pBluescript II SK (-) in the aforementioned SW106 cells.
Before the transformation of the vector, it was linearized with BclI and dephosphorylated.

Materials and Methods
57
For the generation of 3' HA pTKNeoLox, 3' HA pBluescript II SK (-) was cut with
NheI, while pTKNeoLox was cut with XbaI and then dephosphorylated. This was followed by
a ligation reaction.
A segment containing the Strep-Myc tag placed after the starting codon of SUMO3
was generated by overlap PCR using the primers 31738, 31739, 31740 and 31741. 5' HA
pBluescript II SK (-) was used as a template. The PCR product was then cloned in pCRII
TOPO to obtain Strep-Myc-exon 1 pCRII-TOPO.
Strep-Myc-exon1 in 5' HA pBluescript II SK (-) was obtained by digestion of Strep-
Myc-exon 1 pCRII-TOPO and 5' HA pBluescript II SK (-) with NarI and NheI and ligation
leading to the exchange of the wild type segment with the Strep-Myc tag-containing segment
in 5' HA pBluescript II SK (-).
Strep-Myc-exon1 in 5' HA, 3' HA pTKNeoLox (the final targeting vector) was
generated by digestion of Strep-Myc-exon1 in 5' HA pBluescript II SK (-) and 3' HA
pTKNeoLox with SalI and NheI and subsequent ligation of the Strep-Myc tag-containing 5'
homology arm in pTKNeoLox.
Myc-HA-SUMO3 pCRII-TOPO was obtained by PCR amplification of Myc-HA-
SUMO3 using primers 30934 and 30935. As a template, HA-SUMO3 pCRUZ was used. This
was followed by ligation of the PCR product in pCRII-TOPO.
Myc-HA-SUMO3 pcDNA3 was generated by digestion of Myc-HA-SUMO3 pCRII-
TOPO and pcDNA3 with HindIII and BamHI followed by ligation of Myc-HA-SUMO3 in
pcDNA3.
SUMO3 pcDNA3 was generated by PCR amplification of SUMO3 with the primers
31892 and 30935 followed by digestion of the PCR fragment and pcDNA3 with BamHI and
HindIII and subsequent ligation of SUMO3 in pcDNA3. As a template, HA-SUMO3 pCRUZ
was used.
A fragment containing Strep-Myc-SUMO3 was PCR amplified by the use of the
primers 31891 and 30935. Then the PCR fragment and pcDNA3 were digested with BamHI
and HindIII, which was followed by ligation of Strep-Myc-SUMO3 in pcDNA3 to generate
Strep-Myc-SUMO3 pcDNA3. As a template, HA-SUMO3 pCRUZ was used.

Materials and Methods
58
2.2.3. Bacterial strains
Table 2.4: Bacterial strains used in this study
Bacterial strain Source
E. coli XL1-Blue Stratagene
E. coli Electro10-Blue Stratagene
E. coli SW106 Biological Resources Branch, DCTD
NCI-Frederick Cancer Research and
Development Center
E. coli XL2-Blue Stratagene
E. coli One Shot TOP10 Invitrogen
E. coli JM110 (dam-/dcm-) Stratagene
E.coli DH10B Source BioScience, UK
2.2.4. Bacterial transformation
For electroporation, up to 1 l ligation reaction or 0.5 l plasmid DNA were in most
cases added to thawed electrocompetent cells. The mixture of cells and DNA was pipetted in
a precooled cuvette. The cuvette was subjected to a 1.8 kV electrical pulse. This was followed
by resuspension of the bacteria in 1 ml LB or 200 l SOC medium and their transfer into
Eppendorf tubes or 14 ml Falcon tubes. Bacteria were then incubated for approximately 1
hour at 37°C with moderate shaking. For plating ligation reactions, bacteria were concentrated
and after that plated on LB agar plates containing the appropriate antibiotic. For plating
plasmid retransformations, bacteria were not pelleted and only a part of them was plated on
LB agar plates with the appropriate antibiotic. Plates were kept overnight at 37°C.
For electroporation of BAC DNA, two colonies from a plate containing SW106
bacteria were picked, inoculated in 5 ml LB and left shaking overnight at 32°C. After that, the
overnight cultures were diluted with a ratio 1:30 (1 ml in 29 ml LB) and were kept shaking at
32°C until the OD reached 0.6. The Erlenmeyer flasks containing the cultures were cooled on
ice for several minutes and then their content was transferred into 15 ml Falcon tubes.
Bacteria were spun down for 10 min, which was followed by removal of the supernatant and
turning the tubes upside down on a paper towel. The pellet was then resuspended in 10 ml ice-
cold ddH2O by slowly pipetting up and down. Then, cells were spun down again for 10 min,
the supernatant was removed and cells were resuspended again as before. Cells were spun

Materials and Methods
59
down once more and the pellet was resuspended in the leftover water (total volume around
100 l). 50 l of bacteria were placed in a pre-cooled Eppendorf tube and 0.5, 1, 1.5 and 2 l
of BAC minipreps with concentration 3726 and 5208 g/ml were added to the bacteria. DNA
was electroporated in the bacteria, they were resuspended in 1 ml LB and left to recover at
32°C shaking for 1 hour in 14 ml Falcon tubes. 100 l from each tube were plated on
chloramphenicol plates. The rest of the tube was spun for 10 sec, most of the supernatant was
removed and the rest was plated again on chloramphenicol plates. The chloramphenicol plates
were kept for approximately 24 hours at 32°C.
For transformation in XL2 bacteria, the procedure from the manufacturer's protocol
was followed. 14 ml round-bottom Falcon tubes were placed on ice and NZY+ medium was
placed at 42°C. Then, bacteria were thawed, transferred to the falcon tubes and 2 l -
mercaptoethanol were pipetted to each bacterial aliquot. After that, the tubes were gently
swirled and placed on ice for 10 min with gentle swirling every 2 min. To the tubes were
added 10 l DNA, they were swirled and placed on ice for 30 min. The tubes were incubated
in 42°C water bath for 30 sec and then incubated on ice for 2 min. This was followed by
addition of 0.9 ml of NZY+ medium and one hour incubation at 37°C with moderate shaking.
After spinning down and resuspension of the cells in 200 l NZY+, 150 l and 50 l bacteria
were plated. Plates were kept overnight at 37°C.
2.2.5. Plasmid DNA preparation
For purification of small amounts of DNA for sequencing, analytical restriction
digestion and PCR, PureLink Quick Plasmid Miniprep Kit from Invitrogen was utilized
according to the manufacturer's protocol. Sometimes for testing a big number of colonies
DNA was obtained by a boiling miniprep method. 1.5 ml bacterial culture was spun down.
The bacterial cells were resuspended in 250 l STET buffer and vortexed. 25 l of freshly
prepared 10 mg/ml lysozyme was pipetted into each tube and the tubes were vortexed again.
Samples were boiled for 45 sec at 100°C and centrifuged at 13000 rpm for 10 min. The cell
debris was then discarded with the use of a toothpick. 50 l 7.5 M NH4-acetate and 500 l
100 % ethanol were added to the tubes which were then vortexed again. The tubes were
centrifuged at 13000 rpm for 30 min. The supernatant was removed and 500 l 70% ethanol
were added. The samples were centrifuged at 13000 rpm for 5 min. The supernatant was
discarded again, the pellet was air-dried and then resuspended in 50 l of TE buffer. For

Materials and Methods
60
restriction digestion analysis of the obtained DNA, 5 l DNA were used for 50 l total
volume including 0.5 l of RNAse.
To obtain higher amounts of plasmid DNA, PureLink HiPure Plasmid Filter Midiprep
Kit from Invitrogen was used according to the manufacturer's protocol. In order to obtain pure
endotoxin-free plasmid DNA for electroporation in ES cells, EndoFree Plasmid Maxi Kit
from Qiagen was used according to the manufacturer's protocol.
Sometimes TempliPhi preparation of DNA was used for screening colonies. A colony
was picked and placed in 5 l TempliPhi Denature buffer and then in a copy plate containing
100 l LB. The plate with the Denature buffer was heated to 95°C for 3 min and cooled down.
5 l TempliPhi Premix were added and the samples were incubated for 18 hours at 30°C.
After that, they were heated to 65°C for 10 min and cooled down to 10°C. Before using the
reaction for restriction digestion, 20 l of water were added.
2.2.6. BAC DNA preparation
The bacteria containing BAC DNA were inoculated in 5 ml LB + chloramphenicol
and left shaking overnight at 32°C. The cultures were spun down for 15 min. After the
removal of the supernatant, bacteria were resuspended in 250 l P1 buffer (Qiagen). Cells
were then lysed by the addition of 250 l P2 buffer (Qiagen) which was followed by turning
the Eppendorf tubes upside down 5-6 times and 5 min incubation at RT. Then, 350 l P3
buffer (Qiagen) were added and the content of the tubes was carefully mixed. The tubes were
centrifuged for 4 min at 11000 rpm. The supernatant was transferred to a 2 ml Eppendorf tube
and the tube was centrifuged again for 4 min at 11000 rpm. The supernatant was again
transferred to a new tube and 750 l isopropanol were added to it. The tubes were then
incubated for 10 min at RT. DNA was pelleted by 10 min centrifugation at 13000 rpm and the
supernatant was removed. DNA was washed by addition of 1 ml 70% ethanol. This was
followed by 10 min spinning down at 13000 rpm and removal of the supernatant. The pellet
was air-dried and resuspended in 50 l 10 mM Tris.
Buffer P1 (resuspension buffer) – 50 mM TrisCl, pH 8.0; 10 mM EDTA; 100 g/ml RNAse
A
Buffer P2 (lysis buffer) – 200 mM NaOH, 1% SDS
Buffer P3 (neutralization buffer) – 3.0 M potassium acetate, pH 5.5
Materials and Methods
61
2.2.7. DNA extraction from agarose gel
For extraction of DNA fragments from agarose gel, in some cases a PureLink Quick
Gel Extraction Kit from Invitrogen was used. This was done according to the manufacturer’s
protocol. In other cases, phenol/chloroform extraction of the DNA fragments was performed.
The DNA band of interest was cut and crushed. 1 ml phenol solution was added and the tube
was vortexed for 1 min. This was followed by incubation of the tube overnight at -80°C. The
tube was then spun for 30 min at 15000 rpm. The upper phase was put in another tube, the
same volume of phenol:chloroform (1:1) was added, the tube was then vortexed for 1 min and
spun for 5 min at 15000 rpm. The upper phase was again taken and the same volume of
chloroform was added to it followed by vortexing the tube for 1 min. The tube was then spun
for 3 min at 15000 rpm. The upper phase was put again in a new Eppendorf tube. DNA was
precipitated, washed with 70% ethanol and resuspended in water.
2.2.8. Phenol/chloroform extraction of the targeting vector
The linearized Strep-Myc-SUMO3 knock-in targeting vector was purified by
phenol/chloroform extraction. An equal amount of phenol/chloroform (1:1) was added to the
digestion reaction and the tubes were shaken gently. They were centrifuged at 15000 rpm for
15 min. The upper phase was placed in a new tube. This procedure was repeated again twice.
After that, the procedure was repeated once only with chloroform. Sodium acetate was added
to a final concentration of 0.25 M and the solution was mixed. 2 volumes of 100% ethanol
were also added. The solution was mixed and was left at -20°C for at least one hour. This was
followed by centrifugation for 15 min at 15000 rpm. From this point on, the steps were
performed in the tissue culture hood. The DNA pellet was washed twice with 1 ml 70%
ethanol and let to air-dry. After that, the pellet was resuspended in 50 l sterile 0.1x TE buffer
and all the aliquots were put together.
2.2.9. Recombineering
Two colonies of SW106 bacteria containing BAC DNA with the SUMO3 gene were
inoculated in 5 ml LB with chloramphenicol and left shaking overnight at 32°C. 30-40 ml of
LB with chloramphenicol were inoculated with 1 ml of the overnight culture and left shaking
at 32°C until the OD reached 0.6. At this point, 15 ml of the culture were placed in a 100 ml
Erlenmeyer flask and incubated for 15 min at 42°C in a shaking waterbath. Another 15 ml of
the culture were incubated shaking at 32°C serving as an uninduced control. Then,
electrocompetent bacteria were prepared from the induced and uninduced cultures. Bacteria

Materials and Methods
62
were spun down for 10 min, resuspended in 1 ml ice-cold water and then the falcon was filled
up to 10 ml with ice-cold water and was inverted several times. These steps were repeated two
more times. Finally, cells were spun again, the supernatant was removed and cells were
resuspended in the remaining water. The linearized and dephosphorylated vector was
electroporated in the induced and uninduced bacterial cells. Bacteria were then resuspended in
1 ml LB and left shaking for 1 hour at 32°C. They were concentrated, plated on ampicillin
plates and left at 32°C overnight.
2.2.10. Agarose gel electrophoresis
DNA samples were loaded on agarose gels with different percentage depending on the
purpose. To run the DNA, 1x TBA buffer was used. For the visualization of the DNA in the
gel, ethidium bromide or GelRed were used.
2.2.11. TOPO cloning
TOPO cloning was performed using the TOPO TA cloning kit according to the
manufacturer's protocol. When the generated PCR product did not have 3'-A overhangs, it
was additionally incubated with RedTaq polymerase.
2.2.12. Standard cloning procedures
All other standard cloning procedures (including restriction digest, ligation,
dephosphorylation, PCRs, generation of blunt ends with Klenow polymerase) were carried out
as described previously (Sambrook & Russell, 2001) and according to manufacturer's proto-
cols.
2.3. Cell cultures
2.3.1. Mouse embryonic fibroblasts
2.3.1.1. Mouse embryonic fibroblasts culture
Mouse embryonic fibroblasts (MEFs) were grown in medium made by mixing 500 ml
KO-DMEM, 95 ml FBS, 6ml MEM non-essential amino acids, 6 ml Glutamine, 6 ml 10 mM
-mercaptoethanol, and 3 ml Pen/Strep.

Materials and Methods
63
Before use, the flasks and the dishes for growing MEFs were coated with gelatin.
0.1% gelatin was placed in the flasks and dishes and incubated for minimum one hour at room
temperature (RT). The gelatin was removed just before plating the MEFs.
For passaging MEFs, cells were washed once with PBS which was followed by addi-
tion of 0.05% Trypsin which is enough to cover the surface. Cells were incubated for 3-5 min
at 37°C until they detach. An equal volume of medium was added, cells were triturated and
then transferred to new flasks with sufficient amount of medium.
For freezing MEFs, cells were washed with PBS and 0.05% Trypsin was added. Cells
were then incubated for several min at 37°C until they detach. An equal amount of medium
was added and cells were triturated. Cells were spun for 7 min, the supernatant was discarded
and they were resuspended in MEF medium. An equal amount of 2x Freezing medium was
added dropwise. Cells were then aliquoted in cryovials and frozen overnight in a freezing box
at -80°C.
2x Freezing medium: 60% DMEM, 20% FBS, 20% DMSO
2.3.1.2. Inactivation of MEFs
For inactivation of MEFs, cells were incubated for 2.5 hours with 10 g/ml mitomycin
C at 37°C. They were then washed 3-4 times with PBS. 0.05% Trypsin was added which was
followed by incubation for several min at 37°C until cells detach. An equal amount of medi-
um was added, cells were triturated, if needed resuspended in appropriate volume of M15
medium and plated.
2.3.2. Embryonic stem cells
2.3.2.1. Embryonic stem cells culture
Embryonic stem (ES) cells were grown in M15 medium made by mixing 500 ml KO-
DMEM, 95 ml FBS, 6 ml MEM non-essential amino acids, 6 ml glutamine, 6 ml 10 mM -
mercaptoethanol, 3 ml Pen/Strep, and 65 l LIF. ES cells were plated on feeder plates (con-
taining inactivated MEFs).
The thawing of ES cells was performed by first putting the vial quickly in a 37°C wa-
ter bath. Then, cells were diluted with 12 ml M15 medium in a 15 ml Falcon tube, the first 3-4
ml of the M15 medium being added dropwise. Cells were mixed and spun for 7 min. The su-
Materials and Methods
64
pernatant was discarded, cells were resuspended in 6 ml M15 medium and then plated on
feeder plates.
Cells needed to be fed 3-4 hours before splitting. Cells were washed twice with PBS,
0.25% Trypsin was added and they were incubated at 37°C for 10-15 min until they detach.
M15 medium was added, cells were triturated and then plated.
ES cells needed to be fed 3-4 hours before freezing. Cells were washed once with
PBS, 0.25% Trypsin was added and they were incubated for 10-15 min at 37°C. An equal
amount of M15 medium was added and cells were triturated. Cells were spun for 7 min, the
supernatant was discarded and they were resuspended in M15 medium. An equal amount of
2x Freezing medium was added dropwise. After every drop, the tubes were mixed. Cells were
then placed in cryovials which were put in a freezing container and frozen overnight at -80°C.
2.3.2.2. Electroporation of embryonic stem cells
Cells were fed 3-4 hours before electroporation. One 10 cm dish was trypsinized with
0.25% Trypsin, cells were incubated at 37°C for 10-15 min, an equal amount of M15 medium
was added and trituration was performed. Then, cells were transferred into a Falcon tube,
spun for 7 min and resuspended in PBS. After that, the concentration of the cells was adjusted
to 11 million cells per ml. 0.9 ml of the cells were mixed with 25 g (25 l) vector. 0.9 ml of
the cells and DNA mixture were transferred to an electroporation cuvette and electroporation
was performed with the BioRad GenePulser set at 230 V, 500 F. The cuvette was then incu-
bated at RT for 5 min and cells were plated on 10 cm feeder plates. From the following day
on, cells were subjected to positive selection by supplementing the M15 medium with G418
with a final concentration of 180 g/ml. Between the third and the fifth days after the electro-
poration, the medium was also supplemented with ganciclovir at final concentration of 2 M.
2.3.2.3. Picking embryonic stem cell colonies
20-25 l of 0.25% Trypsin were added into the wells of 96-well round bottom plate
and the plates were kept on ice. The medium from the petri dishes containing the ES cells was
substituted with 30 ml PBS. Colonies were picked and transferred into the plates containing
Trypsin. After the completion of a plate, it was incubated for 10-15 min at 37°C. After the
incubation time was over, 35 l of M15 medium containing G418 were added per well and
cells were gently triturated. Cells were then transferred to 96-well feeder plates which con-

Materials and Methods
65
tained 100 l of M15 medium with G418. After a few days, cells were split onto two feeder
plates and two gelatinized plates.
2.3.2.4. Freezing 96-well plates with embryonic stem cells
Cells were fed 3-4 hours before freezing. Cells were washed twice with PBS, 50 l
0.25% Trypsin were added and they were incubated at 37°C for approximately 15 min. After
that, 50 l of 2x Freezing medium were pipetted in each well and cells were triturated. 100 l
of filter-sterilized light paraffin oil were placed in each well. The plates were then closed,
sealed with parafilm, placed in a polystyrene box and put in the -80°C freezer.
2.3.2.5. Isolating embryonic stem cell DNA and validation of positive embryonic stem
cell clones
Stem cell DNA was isolated from the ES cell clones grown on gelatine. ES cells were
washed twice with PBS and subjected to lysis with 50 l of lysis buffer. The 96-well plates
were then incubated overnight in a humidified chamber. On the next day, a fresh solution of
75 mM NaCl in ethanol was prepared by adding 150 l of 5 M NaCl to 10 ml of cold absolute
ethanol and mixing well. 100 l of this solution were added per well and the plates were incu-
bated at RT for approximately 15-60 min. To pour off the solution, the plates were inverted
while the DNA sticked to the plate. The plates were then washed three times with 70% etha-
nol and stored at -20°C in the last ethanol wash.
Lysis buffer: 10 mM Tris pH 7.5, 10 mM EDTA pH 8.0, 10 mM NaCl, 0.5% Sarcosyl,
1 mg/ml proteinase K which is added fresh each time
For validation of positive ES cell clones, the plate was inverted to discard the ethanol
and let to air-dry. DNA was then dissolved in 30 l of 10 mM Tris (pH 8) and was used to
perform diagnostic PCR as follows:
Diagnostic PCR of the 5' arm:
31629 (1) x 22574 (2) = 1155 bp
33662 (2) x 33455 (4) = 2923 bp
33462 (2) x 33456 (5) = 2924 bp
33462 (2) x 33457 (6) = 2991 bp

Materials and Methods
66
Diagnostic PCR of the 3' arm:
4174 (7) x 33570 (8) = 6603 bp
The primers are listed in Table 2.2. PCR was performed in duplicates. All PCR frag-
ments were confirmed by sequencing. The PCR settings were the following:
1. 98.0°C 00:02:00
2. 98.0°C 00:00:30
3. 64.0°C 00:01:00
4. 72.0°C 00:03:00
5. go to 2 34x
6. 72.0°C 00:07:00
7. 12.0°C forever
2.3.3. HEK293FT cells
2.3.3.1. HEK293FT cells culture
HEK293FT cells were grown using standard cell culture techniques. The HEK cells
medium was made by mixing 500 ml DMEM with GlutaMAX, 50 ml FBS and 5 ml
Pen/Strep.
2.3.3.2. HEK293FT cells transfection
2.5 g of each DNA construct were added to 100 l Opti-MEM. Furthermore, 5 l
Lipofectamine were added to 100 l Opti-MEM. The DNA-Opti-MEM mix was added to the
Lipofectamine-Opti-MEM mix. The mixtures were then incubated for approximately 20 min
under the hood and added dropwise to the cells.
2.4. Generation of the Strep-Myc-SUMO3 knock-in mouse line and genotyping strategy
For the generation of Strep-Myc-SUMO3 knock-in mouse line, a positive ES cell
clone was injected into C57 mice blastocysts. A PCR evaluation showed that chimeras trans-
mitting the mutation via the germ line were obtained. Mice heterozygous for the mutated
SUMO3 gene, which were offspring of the chimeric mice, were crossed with EIIa-cre mice
expressing the cre transgene in early embryonic stages, the transgene being under the control
of the adenovirus EIIa promoter (Lakso et al., 1996). PCR was used to evaluate germ line
transmission of the Cre recombined gene. Heterozygous for the mutation mice were crossbred

Materials and Methods
67
for the generation of WT and KI littermates which were further used for the generation of
separate WT and KI lines.
In order to perform genotyping, DNA was isolated from tail tips using Nextec kit. Di-
agnostic PCR was performed as follows:
34055 (9) x 34056 (10) = 339bp (SUMO3 WT)
34055 (9) x 16825 (11) = 368bp (SUMO3 KI)
34055 (9) x 34056 (10) = 463bp (SUMO3 KI with Neo cassette removed)
The primers are listed in Table 2.2. PCR reactions were set up in the following way:
MasterMix: MG143 UHF_HotStartPCR_biotool
0.8 l water
10 l 2xUniverse Buffer (CatNo. B21103, LotNo. 4209043)
4 l dNTPs (Bioline DM-515107)
0.2 l Universe High-Fidelity Hot Start DNA Polymerase (CatNo. B21103, LotNo. 4209043)
4 l 1 PrimerSet (1 pmol/l each)
1-2 l DNA
Total: 20 l
The PCR settings were the following:
1. 96.0°C 00:03:00
2. 94.0°C 00:00:30
3. 62.0°C 00:01:00
3. 72.0°C 00:01:00
4. go to 2 32x
5. 72.0°C 00:07:00
6. 12.0°C forever

Materials and Methods
68
2.5. Biochemistry
2.5.1. Antibodies
Table 2.5. Antibodies used for biochemistry in this study
Antibody Concentration Company Cat. No.
Primary antibodies
Mouse monoclonal anti-HA.11 (clone
16B12) (quantitative Western blot of
SUMO1 conjugation levels)
1:1000 Biolegend 901501
Mouse monoclonal anti-HA.11 (clone
16B12) (subcellular fractionation)
1:1000 Covance,
Biolegend
MMS-
101R-
500
Mouse monoclonal anti-GluN1 1:1000 Synaptic systems 114 011
Mouse monoclonal anti-synaptophysin 1:1000 Synaptic systems 101 011
Mouse monoclonal anti-SUMO2/3 1:1000 (testing
of tags)
1:1000 (basic
characterization)
Hybridoma Bank 8A2
Rabbit polyclonal anti-Myc 1:1000 Sigma C3956
Secondary antibodies
Goat anti-mouse IgG HRP-conjugated 1:5000 (testing
of tags)
Jackson 705-035-
003
Goat anti-mouse IgG HRP-conjugated
(H&L)
1:5000 BIO-RAD 172-
1011
Goat anti-rabbit IgG HRP-conjugated
(H&L)
1:5000 BIO-RAD 172-
1019
2.5.2. Basic characterization of the Strep-Myc-SUMO3 knock-in mouse line
8-12-week-old mice were sacrificed by cervical dislocation, their brains were taken
and flash frozen in liquid nitrogen. Brains were then reduced to powder with a porcelain mor-
tar and pestle in a liquid nitrogen bath. Cold RIPA buffer (150 mM NaCl, 1% Triton X-100,
10 mM Tris, pH 7.4) containing protease inhibitors (1 g/ml aprotinin, 0.5 g/ml leupeptine,

Materials and Methods
69
17.4 g/ml PMSF) and 20 mM NEM was used to resuspend the powder. The powder was
then sonicated and ultracentrifuged at 100000 x g for 1 hour at 4°C. The supernatant was in-
cubated then for 4 h at 4°C on a rotating wheel with 0.2 ml anti-Myc beads (Sigma or Bio-
tool). Then, the beads were subjected to pelleting and washing several times in RIPA buffer.
SDS-PAGE sample buffer was used to directly elute the bound material. Western blot analy-
sis with anti-Myc (Sigma) and anti-SUMO2/3 (Hybridoma Bank) antibodies was performed
with the input and the eluted material.
2.5.3. Quantitative Western Blots to investigate SUMO1 conjugation levels
Mice of different ages were sacrificed by cervical dislocation which was followed by
dissection of hippocampi and cortices on ice. Tissue was lysed in 150 mM NaCl, 20 mM Tris
pH 7.4 containing protease inhibitors (1 g/ml aprotinin, 0.5 g/ml leupeptine, 17.4 g/ml
PMSF) and 20 mM NEM in a small glass potter homogenizer. The protein concentrations of
the samples were assessed using the BCA assay (Pierce). The samples were separated by
SDS-PAGE with the use of commercially available 4%-12% Bis-Tris gradient gels from Invi-
trogen. This was followed by Western blot. Memcode assay (Pierce) was used to visualize the
transferred on the membrane proteins. Anti-HA antibody from Biolegend was used and for
developing, enhanced chemiluminiscence (GE Healthcare) was utilized, as the Odyssey
method could not detect the weak signal. Labeling with Memcode and anti-HA was assessed
by ImageJ. The values were divided by the Memcode value for the corresponding lane and
after that normalized to the average sample value. Loading of the samples was done in three
replicates at various positions on the gel. N=6
SDS-PAGE sample buffer: 2% SDS, 62.5 mM Tris, 10% glycerol, 1% -mercaptoethanol,
0.01% bromphenol blue, pH 6.8
2.5.4. Subcellular fractionation of brain tissue
Subcellular fractionation was performed as described previously (Jones & Matus,
1974; Tirard et al., 2012). Brains were subjected to homogenization in 10 ml 320 mM sucrose
containing 4 mM HEPES pH 7.4, 20 nM NEM, and protease inhibitors (1 g/ml aprotinin, 0.5
g/ml leupeptine and 17.4 g/ml PMSF) with a glass-Teflon homogenizer (900 rpm, 12
strokes). Homogenates (H) were spun at 1000 x g for 10 min at 4°C with an SS - 34 rotor
(Sorvall). The supernatant (S1) was separated from the pellet (P1) and spun at 12500 x g for

Materials and Methods
70
15 min at 4°C with an SS - 34 rotor. The supernatant was discarded, 9 volumes of cold water
were used to resuspend the synaptosome-enriched pellet (P2). The pellet was homogenized
using a glass-Teflon homogenizer (1500 rpm, 10 strokes) and spun for 20 min at 4°C with an
SS-34 rotor at 25000 x g. For the generation of fractions LP2 and LS2, the supernatant (LS1)
was spun at 200000 x g for 2 h at 4°C. The pellet (LP1), on the other hand, was subjected to
resuspension in 1 ml homogenization buffer and placed on top of a two-step sucrose gradient
(1.2 M and 5 ml of 0.8 M sucrose, 4 mM HEPES, protease inhibitors as stated above). The
resulting gradient was spun for 2 hours at 62000 x g at 4°C with an SW - 41Ti rotor (Beck-
man). Synaptosomes were present at the interface of 0.8 M and 1.2 M sucrose and recovered
with a Pasteur pipette. For the generation of the SPM fraction, the recovered synaptosomal
fraction was diluted 10-fold and pelleted at 37000 x g at 4°C for 20 min using SS – 34 rotor.
H, homogenate; P, nuclear pellet; S1, supernatant after P1 sedimentation; P2, crude synapto-
somal pellet; S2, supernatant after P2 sedimentation; LP1, lysed synaptosomal membranes;
LS1, supernatant after LP1 sedimentation; LP2, synaptic vesicle-enriched fraction; LS2, su-
pernatant after LP2 sedimentation; SPM, synaptic plasma membrane.
2.5.5. SDS-PAGE and Western blotting for testing SUMO3 tags
2.5.5.1. Sample preparation
On the day after the transfection, cells which were incubated at 37°C were washed
once with PBS and resuspended in 250 l Lysis buffer containing fresh 20 nM NEM and 1x
protease inhibitors. To lyse the cells, they were left on ice for 10 min and inverted regularly.
Then, samples were centrifuged at maximum speed for 15 min. Supernatant was placed in a
new Eppendorf tube. The concentration of the protein samples was determined using the BCA
assay (Pierce). Samples were diluted with Lämmli buffer containing appropriate amount of
DTT for final concentration of 100 mM and boiled for several min.
Lysis buffer (RIPA) – 150 mM NaCl, 20 mM Tris pH 7.4, 1% Triton
2.5.5.2. SDS-PAGE and Western blotting
Samples were run on a commercially available 4%-12% Bis-Tris gel and transferred to
a nitrocellulose membrane for 16 h at 45 mA. Equal loading of the samples was assessed by
Ponceau staining. The nitrocellulose membrane was blocked for 1 hour in 5% milk in PBST.
This was followed by 2-hour incubation with primary antibody (mouse monoclonal anti-

Materials and Methods
71
SUMO2/3) with a concentration 1:000 in 5% milk in PBST. The membrane was washed three
times with 5% milk in PBST and incubated for 1 hour with secondary antibody at a dilution of
1:5000 in 5% milk in PBST. The membrane was washed again three times with 5% milk in
PBST, twice with PBS and developed using the ECL kit.

Materials and Methods
72
2.6. Immunohistochemistry
2.6.1. Antibodies
Table 2.6. Antibodies used for immunohistochemistry in this study
Antibody Concentration Company Cat. No.
Primary antibodies
Mouse monoclonal anti-c-Myc
(clone 9E10)
1:500, 1:1000
(Fig. 3.5. 1:1000
heterozygous mice, 1:500
homozygous mice)
Sigma M5546
Rabbit polyclonal anti-c-Myc 1:1000, 1:500, 1:250
(Fig.3.6. 1:500 heterozygous,
1:250 homozygous)
Sigma C3956
Rabbit polyclonal anti-c-Myc
(A-14)
1:250 Santa Cruz
Biotechnology
sc-789
Mouse monoclonal anti-c-Myc 1:250 Life
Technologies
132500
Mouse monoclonal anti-c-Myc
(clone 9E11)
1:250 Santa Cruz
Biotechnology
sc-47694
Mouse monoclonal anti-Strep
(StrepMAB-Classic)
1:1000, 1:500 (Fig. 3.9.
1:500)
Iba 2-1507-
001
Goat polyclonal anti-HA 1:500 Novus
Biologicals
NB600-
362
Chicken polyclonal anti-MAP2 1:1000 Novus
Biologicals
NB300-
213
Mouse monoclonal anti--
amyloid 1-16 (clone 9E10)
1:1000 Covance SIG-
39320
Mouse monoclonal anti-HA.11
(clone 16B12)
1:1000 Covance MMS-
101R-
500
Mouse monoclonal anti-HA.11
(clone 16B12)
1:1000 BioLegend 901501

Materials and Methods
73
Rabbit polyclonal anti-A42 1:500 Synaptic
Systems
218-703
Secondary antibodies
Goat anti-mouse Alexa555 1:1000 Invitrogen A21424
Goat anti-rabbit Alexa555 1:1000 Mobitec A21429
Goat anti-chicken Alexa633 1:1000 Invitrogen A-21103
Donkey anti-goat Alexa555 1:1000 Mobitec A21432
Goat anti-rabbit Alexa488 1:1000 Invitrogen A11008
Goat anti-mouse Alexa488 1:1000 Mobitec A11029
2.6.2. Tissue preparation
Mice were anaesthetized with isofluorane and injected with avertin solution. Mice
were then transcardially perfused with 4% PFA in phosphate buffer using the following perfu-
sion protocol:
12 (speed of the pump) – 1 min
11 – 1 min
10 - 1 min
9 – 1 min
8 – 8 min
Depending on the perfusion quality, brains were postfixed at least for 1 hour in 4%
PFA. After the postfixation, brains were moved sequentially in 10%, 20% and 30% sucrose in
phosphate buffer. In order to proceed with placing the brains in a solution with higher sucrose
concentration, brains needed to sink. Brains were incubated for at least 24 hours in 30% su-
crose.
To prepare brains for cutting, they were cut in two sagittally and rolled on the surface
of dry ice wrapped in aluminum foil. Then, brains were embedded in Tissue-Tek and kept in
the Cryostat (Leica) for at least one hour. 35 m sagittal brain sections were cut and stored in
PBS with sodium azide at 4°C.
Avertin solution: 100 l stock avertin, 400 l 100% ethanol, 4.5 ml 0.9% NaCl
Materials and Methods
74
2.6.3. Immunostaining
For localizing Strep-Myc-SUMO3, sections were blocked with PBS containing 5-10%
normal goat serum (NGS) or 5% horse serum, 0.3-0.5% Triton X-100 and in some cases 1%
fish skin gelatin and 1% BSA. For labeling His6-HA-SUMO1, sections were blocked with
PBS containing 5% NGS or horse serum and 0.3% Triton X-100. The blocking step was per-
formed for 1 hour at RT. The blocking solutions were also used for diluting the primary and
secondary antibodies. Sections were incubated with the primary antibodies overnight at 4°C.
On the next day, sections were washed three times with PBS. From this point on, the incuba-
tions were done in the dark. Sections were incubated for approximately 2 hours with a sec-
ondary antibody, washed three times with PBS and mounted using Vectashield containing
DAPI. For staining His6-HA-SUMO1 with goat anti-HA antibody, sections were incubated
first with donkey anti-goat antibody for 2 hours, washed three times with PBS and then incu-
bated for another 2 hours with goat anti-mouse and goat anti-chicken antibodies.
2.6.4. Image acquisition
Confocal microscopy was performed using Leica TCS-SP5. Single-plane images were
taken with 40x oil objective. For some images, a zoom factor of 3 was used. For a given label-
ing, the gain and the offset were kept constant.
2.6.5. Figure preparation and image analysis
All the figures containing confocal images were created using Photoshop CS5.1. Re-
adjustment of the tonal range of the images was the only change to which the original data
was subjected.
For quantification of the nuclear anti-HA signal in His6-HA-SUMO1 knock-in mice,
ImageJ was utilized. Pyramidal neurons in cortical layer V were selected by location and/or
size and/or shape. For choosing the appropriate neurons in the subiculum, a line was drawn
separating the big pyramidal cells from the mostly small cells located in the deep subiculum.
These deeply located cells were excluded from the analysis. For quantification of the anti-HA
signal, a line surrounding the anti-HA labeled nuclei was drawn. This was followed by obtain-
ing information about the mean intensity of the circled area by choosing Analyze Measure.
The average intensity from all the neurons in the examined section was then found which was
followed by finding the average intensity of all the sections examined for a given mouse.
2.7. Statistics

Materials and Methods
75
For the comparison of the nuclear anti-HA signal in His6-HA-SUMO1 knock-in
5xFAD and non-5xFAD mice, GraphPad was used to perform two-tailed unpaired Student’s t-
test.
For the quantitative Western blot, a 2-way ANOVA with genotype and age as factors
was used to conduct statistical analysis for both hippocampal and cortical tissues. There was
no significant main effect of genotype or genotype x age interaction. The age factor was sig-
nificant for both hippocampus and cortex (hippocampus P=0.009, cortex P=0.01).

Results
76
3. Results
3.1. Generation and basic characterization of a Strep-Myc-SUMO3 knock-in mouse line
3.1.1. Choosing the appropriate tag
The generation of a knock-in mouse model that can be reliably used for the
localization of SUMO3 and the identification of SUMO3 substrates requires the choice of
appropriate tags. An important characteristic of an appropriate tag is that it should not affect
the function of the tagged protein. Thus, in order to facilitate the choice of the tag that should
be incorporated in the SUMO3 knock-in mouse model, we cloned constructs encoding
untagged SUMO3 or SUMO3 with Myc-HA and Strep-Myc tag. HA-SUMO2 and His6-
SUMO2 in pCRUZ were a kind gift from Prof. Dr. Frauke Melchior. We transfected the
prepared plasmids into HEK293FT cells and performed SDS-PAGE and Western blot
analysis of whole cell extracts with an anti-SUMO2/3 antibody in order to test if the tags
affect the SUMO3 conjugation pattern (Fig. 3.1.). As a control, we transfected ‘empty’
pcDNA3 to be able to draw a comparison with endogenous SUMO2/3 conjugation. Notably,
neither the overexpression of untagged SUMO3, nor the overexpression of SUMO3 with any
of the tags resulted in obvious changes of the SUMO2/3 conjugation pattern. A drawback of
this experiment was, though, that it was not possible to judge what percentage of the
overexpressed SUMO3 remains free and what percentage is conjugated to proteins.
Furthermore, as SUMO2 and SUMO3 cannot be distinguished by antibodies, in all the lanes
endogenous SUMO2 is also detected.
Additionally, we wanted the chosen tag to be suitable for affinity purification and
immunostaining and, ideally, to differ from the His6-HA tag present in the SUMO1 knock-in
mouse model. Thus, we chose the double tag Strep-Myc for the generation of the SUMO3
knock-in mouse model. A double tag allows alternative options for investigation and,
additionally, allows the performance of a two-step affinity purification protocol.

Results
77
Fig. 3.1. Testing of SUMO3 tags for the generation of a SUMO3 knock-in mouse model.
HEK293FT cells were transfected with SUMO3, HA-SUMO3, His6-SUMO3, Myc-HA-
SUMO3, Strep-Myc-SUMO3 or with 'empty' pcDNA3 as a control. Whole cell extracts were
analyzed by SDS-PAGE and Western blotting. Anti-SUMO2/3 antibody was used for probing
the extracts. Note the endogenous SUMO2/3 and the transfected SUMO3 at the bottom part of
the membranes.
3.1.2. Generation of the targeting vector
We decided to generate the SUMO3 knock-in mouse model using homologous
recombination in mouse embryonic stem (ES) cells. Thus, the targeting vector had to contain
two homology arms so that homologous recombination could take place. In addition, the 5'
homology arm, which carried the exon 1 of the SUMO3 gene, had to undergo insertion of the
Strep-Myc tag after the start codon (ATG) of the SUMO3 gene (Fig. 3.2.).
The first step in the generation of the SUMO3 knock-in targeting vector was the
retrieval of the 5' and the 3' homology arms by a chromosome engineering approach called
recombineering. This approach involves homologous recombination in E.coli, which is
mediated by lambda phage-encoded Red proteins (Liu et al., 2003). In order to retrieve the 5'
homology arm, firstly, 5' and 3' miniarms were PCR-amplified from a BAC DNA containing
the full sequence of the SUMO3 gene. The amplified miniarms were then cloned into a TOPO
vector. The 5' miniarm was excised from the TOPO vector with SalI and SpeI, while the 3'
miniarm was excised with SpeI and EcoRI. The two inserts were then ligated with a triple
ligation into pBluescript II SK (-) that had been digested with SalI and EcoRI.

Results
78
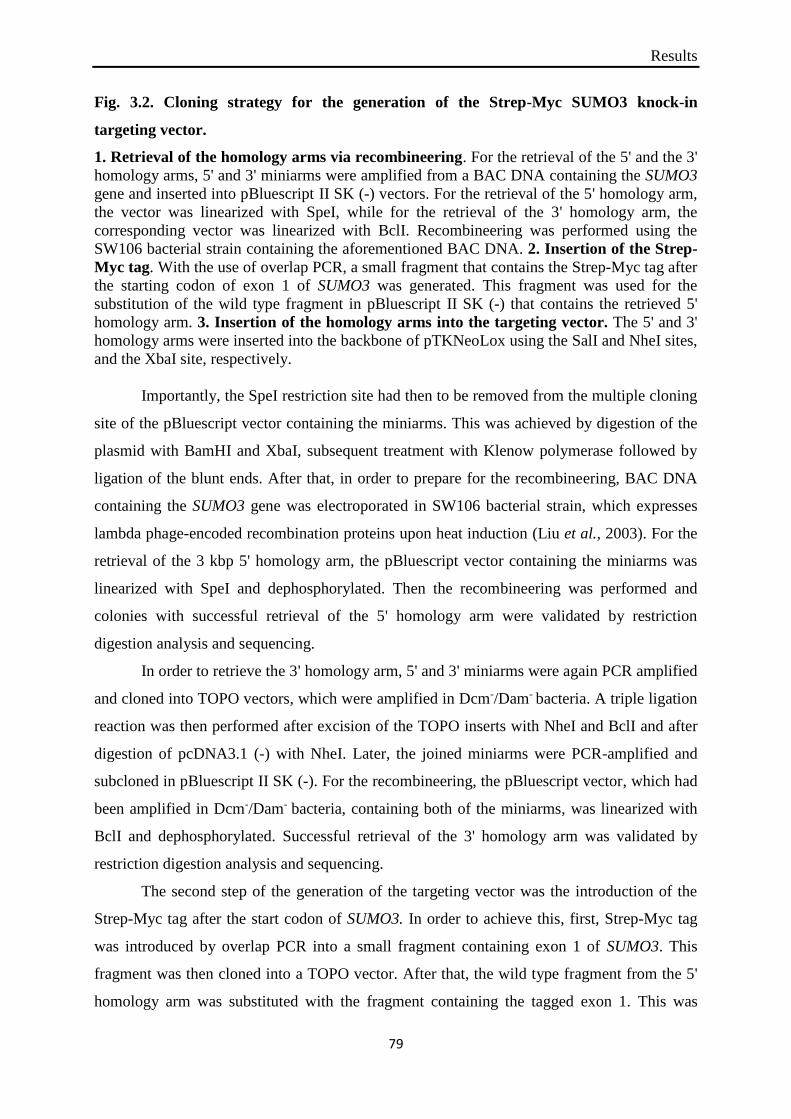
Results
79
Fig. 3.2. Cloning strategy for the generation of the Strep-Myc SUMO3 knock-in
targeting vector.
1. Retrieval of the homology arms via recombineering. For the retrieval of the 5' and the 3'
homology arms, 5' and 3' miniarms were amplified from a BAC DNA containing the SUMO3
gene and inserted into pBluescript II SK (-) vectors. For the retrieval of the 5' homology arm,
the vector was linearized with SpeI, while for the retrieval of the 3' homology arm, the
corresponding vector was linearized with BclI. Recombineering was performed using the
SW106 bacterial strain containing the aforementioned BAC DNA. 2. Insertion of the Strep-
Myc tag. With the use of overlap PCR, a small fragment that contains the Strep-Myc tag after
the starting codon of exon 1 of SUMO3 was generated. This fragment was used for the
substitution of the wild type fragment in pBluescript II SK (-) that contains the retrieved 5'
homology arm. 3. Insertion of the homology arms into the targeting vector. The 5' and 3'
homology arms were inserted into the backbone of pTKNeoLox using the SalI and NheI sites,
and the XbaI site, respectively.
Importantly, the SpeI restriction site had then to be removed from the multiple cloning
site of the pBluescript vector containing the miniarms. This was achieved by digestion of the
plasmid with BamHI and XbaI, subsequent treatment with Klenow polymerase followed by
ligation of the blunt ends. After that, in order to prepare for the recombineering, BAC DNA
containing the SUMO3 gene was electroporated in SW106 bacterial strain, which expresses
lambda phage-encoded recombination proteins upon heat induction (Liu et al., 2003). For the
retrieval of the 3 kbp 5' homology arm, the pBluescript vector containing the miniarms was
linearized with SpeI and dephosphorylated. Then the recombineering was performed and
colonies with successful retrieval of the 5' homology arm were validated by restriction
digestion analysis and sequencing.
In order to retrieve the 3' homology arm, 5' and 3' miniarms were again PCR amplified
and cloned into TOPO vectors, which were amplified in Dcm-/Dam- bacteria. A triple ligation
reaction was then performed after excision of the TOPO inserts with NheI and BclI and after
digestion of pcDNA3.1 (-) with NheI. Later, the joined miniarms were PCR-amplified and
subcloned in pBluescript II SK (-). For the recombineering, the pBluescript vector, which had
been amplified in Dcm-/Dam- bacteria, containing both of the miniarms, was linearized with
BclI and dephosphorylated. Successful retrieval of the 3' homology arm was validated by
restriction digestion analysis and sequencing.
The second step of the generation of the targeting vector was the introduction of the
Strep-Myc tag after the start codon of SUMO3. In order to achieve this, first, Strep-Myc tag
was introduced by overlap PCR into a small fragment containing exon 1 of SUMO3. This
fragment was then cloned into a TOPO vector. After that, the wild type fragment from the 5'
homology arm was substituted with the fragment containing the tagged exon 1. This was

Results
80
achieved by excising the respective insert from TOPO with NarI and NheI and cloning it into
the respective sites of the pBluescript vector lacking the wild type fragment.
The final step in the generation of the targeting vector was the subcloning of the
retrieved 5' and 3' homology arms from pBluescript II SK (-) to pTKNeoLox. Initially, the 3'
homology arm was subcloned using the XbaI cloning site. This was followed by introduction
of the tagged 5' homology arm using the SalI and the NheI cloning site. Besides with SalI and
NheI, pBluescript containing the tagged 5' homology arm was also cut with XmnI.
3.1.3. Generation of the SUMO3 knock-in mouse line
The targeting vector was purified using the EndoFree Plasmid Maxi Kit from Qiagen.
For the electroporation, the purified targeting vector was linearized with NotI and adjusted to
a concentration of 1 µg/µl. The linearized targeting vector was electroporated into SV129/Ola
ES cells. The clones were then subjected to positive and negative selection by using the
antibiotic G418 and the antiviral drug ganciclovir, respectively. Cells containing the
Neomycin cassette, which is located within the homology arms, are resistant to the antibiotic
G418. In contrast, the herpes simplex virus thymidine kinase (HSV-TK) gene is located
outside of the homology arms and its incorporation into the cells would signify a non-
homologous insertion. The HSV-TK-containing cells are sensitive to ganciclovir (Dubey,
2014). Positive clones were validated by PCR using as a template DNA isolated from ES cells
grown on gelatine. Then, injection of a positive clone into C57 mice blastocysts was
performed. The goal was the generation of chimeric mice that are able to transfer the mutation
to the next generation via the germ line. Later, mice heterozygous for the wanted mutation,
which were offspring of the chimeras, were crossbred with EIIa-cre mice, which express Cre
recombinase under the control of adenovirus EIIa promoter in early embryonic stages. PCR
was used to detect the presence of germ line transmission of the Cre recombined gene (Lakso
et al., 1996). Later, wild type and knock-in littermates were generated by crossing mutants
heterozygous for the mutation. The wild type and knock-in mice were used for the generation
of wild type and knock-in mouse lines. Tail tips were used for the preparation of DNA for
genotyping. To prepare the DNA, the Nextec genomic isolation kit was used (Fig. 3.3.).

Results
81
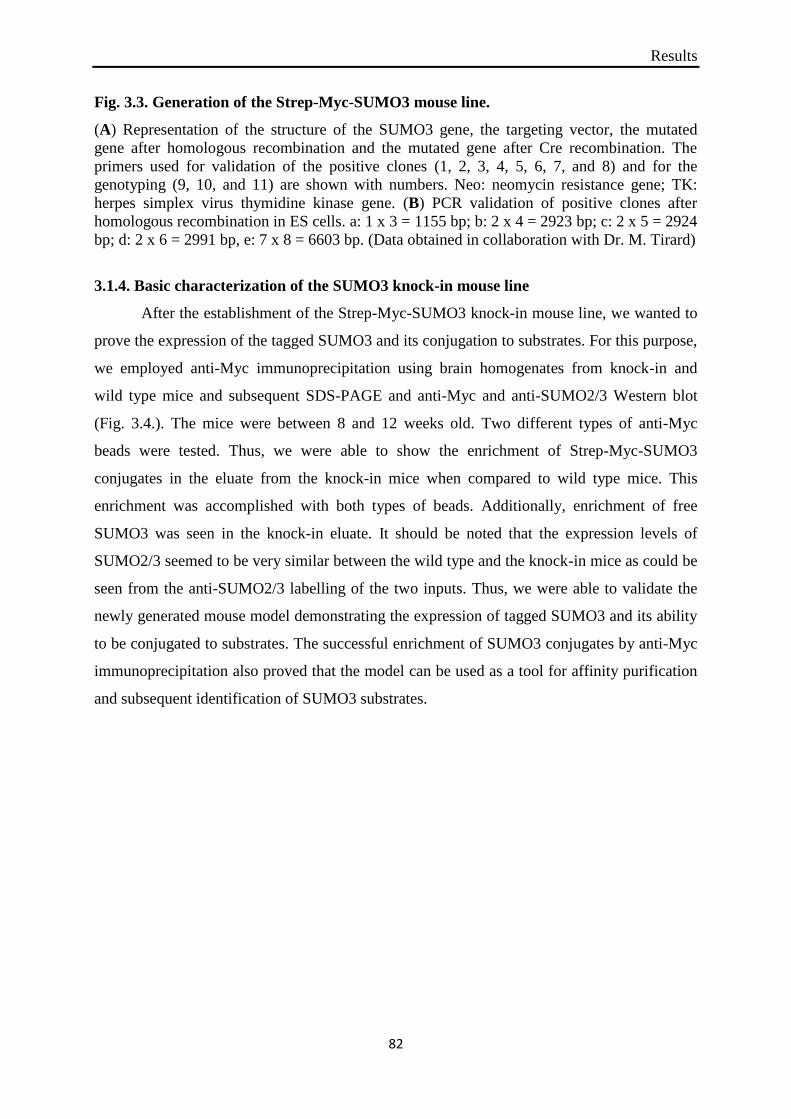
Results
82
Fig. 3.3. Generation of the Strep-Myc-SUMO3 mouse line.
(A) Representation of the structure of the SUMO3 gene, the targeting vector, the mutated
gene after homologous recombination and the mutated gene after Cre recombination. The
primers used for validation of the positive clones (1, 2, 3, 4, 5, 6, 7, and 8) and for the
genotyping (9, 10, and 11) are shown with numbers. Neo: neomycin resistance gene; TK:
herpes simplex virus thymidine kinase gene. (B) PCR validation of positive clones after
homologous recombination in ES cells. a: 1 x 3 = 1155 bp; b: 2 x 4 = 2923 bp; c: 2 x 5 = 2924
bp; d: 2 x 6 = 2991 bp, e: 7 x 8 = 6603 bp. (Data obtained in collaboration with Dr. M. Tirard)
3.1.4. Basic characterization of the SUMO3 knock-in mouse line
After the establishment of the Strep-Myc-SUMO3 knock-in mouse line, we wanted to
prove the expression of the tagged SUMO3 and its conjugation to substrates. For this purpose,
we employed anti-Myc immunoprecipitation using brain homogenates from knock-in and
wild type mice and subsequent SDS-PAGE and anti-Myc and anti-SUMO2/3 Western blot
(Fig. 3.4.). The mice were between 8 and 12 weeks old. Two different types of anti-Myc
beads were tested. Thus, we were able to show the enrichment of Strep-Myc-SUMO3
conjugates in the eluate from the knock-in mice when compared to wild type mice. This
enrichment was accomplished with both types of beads. Additionally, enrichment of free
SUMO3 was seen in the knock-in eluate. It should be noted that the expression levels of
SUMO2/3 seemed to be very similar between the wild type and the knock-in mice as could be
seen from the anti-SUMO2/3 labelling of the two inputs. Thus, we were able to validate the
newly generated mouse model demonstrating the expression of tagged SUMO3 and its ability
to be conjugated to substrates. The successful enrichment of SUMO3 conjugates by anti-Myc
immunoprecipitation also proved that the model can be used as a tool for affinity purification
and subsequent identification of SUMO3 substrates.

Results
83
Fig. 3.4. Anti-Myc affinity purification of free Strep-Myc-SUMO3 and Strep-Myc-
SUMO3-conjugated proteins from Strep-Myc-SUMO3 knock-in mice.
Brain homogenates from Strep-Myc-SUMO3 knock-in mice (KI) and wild type (WT) mice
were subjected to anti-Myc affinity purification using two types of anti-Myc beads – Sigma
and Biotool. The input (INP) and the eluate (El) were analysed by SDS-PAGE and Western
blotting. Anti-SUMO2/3 and anti-Myc antibodies were used for probing the input and the
eluate samples. Note the enrichment of Strep-Myc-SUMO3 conjugates and free Strep-Myc-
SUMO3 in the eluate samples from the knock-in mice. (Data obtained in collaboration with
Dr. M. Tirard and K. Hellmann)
In the scope of the basic characterization of the mouse line, we also wanted to explore
its use as a tool for localization of SUMO3. More specifically, we wanted to focus on
SUMO3 localization in the brain. For this purpose, we decided to employ anti-Myc and anti-
Strep labelling of brain sections from 5-week-old heterozygous and 11- or 12-week-old
homozygous SUMO3 knock-in mice using wild type mice as a negative control. All the mice
were male except one 12-week-old homozygous mouse and one 12-week-old wild type
mouse. In the following description of the used antibodies we focused on neuronal cells
unless otherwise stated. Furthermore, even though specific brain regions were mentioned, this
does not exclude the presence of labelling in other brain regions.
The use of a mouse anti-Myc antibody from Sigma (clone 9E10) resulted in
pronounced neuronal somata cytoplasmic staining in a heterozygous SUMO3 knock-in mouse
in the CA3 hippocampal region, subiculum and dentate gyrus (Fig. 3.5. A). Additionally, in
the CA3 hippocampal region, the anti-Myc antibody also labelled the apical dendrites of the
pyramidal neurons. Notably, the antibody showed weaker background cytoplasmic staining of

Results
84
neuronal somata in brain sections from a wild type mouse in the same brain regions.
Interestingly, the use of the same clone from a different company (Life Technologies) showed
similar results in the upper cortical layers of heterozygous and wild type mice. Unexpectedly,
when SUMO3 knock-in homozygous mice were used, two out of four mice exhibited
cytoplasmic anti-Myc labelling in the deep cortical layers while in the rest of the mice in
addition to weak somata cytoplasmic staining in some regions, the anti-Myc antibody labelled
some structures resembling cells in a variety of brain regions (Fig. 3.5. B). The incubation of
the wild type controls with the anti-Myc antibody resulted again in cytoplasmic staining that
was in most but not all of the cases localized to neuronal somata. It could not be concluded if
the cytoplasmic staining in the wild type mice was weaker than the one in the homozygous
Strep-Myc-SUMO3 mice.
The next antibody that was used was a rabbit anti-Myc antibody from Sigma (Fig.
3.6.). Staining of brain sections from Strep-Myc-SUMO3 heterozygous mouse with this
antibody generated both nuclear and cytoplasmic anti-Myc labelling in different brain regions
examined such as CA3 hippocampal region, subiculum and parts of the cortex. The results
were quite inconsistent. In most cases, the intensities of the cytoplasmic and the nuclear
labelling did not differ much from each other. However, in some cases the cytoplasmic
staining was clearly stronger than the nuclear. Differences in the staining pattern were seen
even between different labellings of the same region. The cytoplasmic labelling seemed to be
either restricted or not restricted to the soma. For example, in the CA3 hippocampal region,
the apical dendrite was also labelled. The wild type mouse exhibited predominantly
cytoplasmic background staining but sometimes also nuclear staining. Again, the part of the
cytoplasm labelled by this unspecific staining varied. When Strep-Myc-SUMO3 homozygous
mice were used, the observations were again inconsistent. While in the subiculum, for
example, the anti-Myc cytoplasmic staining was comparable to the nuclear staining, this was
not observed in other brain regions such as the CA3 hippocampal region where the
cytoplasmic labelling was stronger than the nuclear (Fig. 3.6. B). Further, the staining seemed
inconsistent even between the wild type controls.
The next antibody that we utilized in an attempt to study the localization of SUMO3
was a rabbit anti-Myc antibody from Santa Cruz (A-14) (Fig. 3.7.). In the CA3 hippocampal
region, the wild type mouse showed diffuse cytoplasmic background staining, while in the
heterozygote mouse a more pronounced cytoplasmic staining was detected. In both genotypes
the cytoplasmic staining seemed to be localized to the neuronal somata.

Results
85
Next, we used a mouse antibody from Santa Cruz (clone 9E11) (Fig. 3.8.). Incubation
of the brain sections from the heterozygous and the wild type mice did not result in any
differences between the two genotypes in dentate gyrus, upper cortical layers and subiculum.
Both genotypes exhibited the same general and diffuse background staining.
Finally, we engaged in staining with a mouse anti-Strep antibody (Fig. 3.9.). In both
the heterozygous and the wild type mice, the antibody mainly labelled the outline of the
neuronal nuclei in different brain regions including CA3 hippocampal region and subiculum.
Interestingly, while in the subiculum of the wild type mouse the antibody labelled only the
nuclear outline, in the heterozygous mouse some neurons also exhibited anti-Myc staining
within their nuclei.
In conclusion, despite the utilization of several different antibodies, we could not reach
a definite conclusion regarding the subcellular localization of SUMO3 or compare SUMO3
presence between different brain regions. Some of the data indicate the presence of SUMO3
in the nucleus but the inconsistency of the results does not allow us to confirm this
hypothesis.

Results
86
Fig. 3.5. Analysis of the localization of Strep-Myc-SUMO3 in brain sections from Strep-
Myc-SUMO3 knock-in mice using a mouse anti-Myc antibody from Sigma (clone 9E10).
Sagittal brain sections from PFA-perfused Strep-Myc-SUMO3 heterozygous, Strep-Myc-
SUMO3 homozygous and wild type (WT) mice were incubated with a mouse anti-Myc
antibody from Sigma (clone 9E10) (red) and an anti-MAP2 antibody (blue). The images show
CA3 hippocampal regions. (A) CA3 hippocampal regions from heterozygous Strep-Myc-

Results
87
SUMO3 knock-in and wild type mice. Note the prominent anti-Myc cytoplasmic staining in
the pyramidal neurons of the heterozygote animal and the weaker cytoplasmic staining in the
wild type animal. Scale bar – 50 m. (B) CA3 hippocampal region of homozygous Strep-
Myc-SUMO3 knock-in mice and wild type mice. The wild type mice show again cytoplasmic
staining, while half of the homozygous mice exhibit cell-like anti-Myc labelling. Scale bar –
50 m.

Results
88
Fig. 3.6. Analysis of the localization of Strep-Myc-SUMO3 in brain sections from Strep-
Myc-SUMO3 knock-in mice using a rabbit anti-Myc antibody from Sigma.
Sagittal brain sections from PFA-perfused Strep-Myc-SUMO3 heterozygous, Strep-Myc-
SUMO3 homozygous and wild type mice were stained with a rabbit anti-Myc antibody from
Sigma (red) and an anti-MAP2 antibody (blue). The images show CA3 hippocampal regions.
(A) CA3 hippocampal regions from heterozygous Strep-Myc-SUMO3 knock-in and wild type
mice. Note the lack of any visible difference between the intensities of the nuclear and the
cytoplasmic anti-Myc labelling in the heterozygous mouse. Scale bar – 50 m (B) CA3
hippocampal regions from homozygous Strep-Myc-SUMO3 knock-in and wild type mice. In
contrast to the heterozygous mouse, in the homozygous mice the cytoplasmic labelling of the
CA3 pyramidal neurons is much stronger than the nuclear staining. Scale bar – 50 m.
Fig. 3.7. Analysis of the localization of Strep-Myc-SUMO3 in brain sections from Strep-
Myc-SUMO3 knock-in mice using a rabbit anti-Myc antibody from Santa Cruz.
Sagittal brain sections from PFA-perfused Strep-Myc-SUMO3 heterozygous and wild type
mice were stained with a rabbit anti-Myc antibody from Santa Cruz (red) and an anti-MAP2
antibody (not shown). The images show CA3 hippocampal regions. Scale bar – 50 m.

Results
89
Fig. 3.8. Analysis of the localization of Strep-Myc-SUMO3 in brain sections from Strep-
Myc-SUMO3 knock-in mice using a mouse anti-Myc antibody from Santa Cruz (clone
9E11).
Sagittal brain sections from PFA-perfused Strep-Myc-SUMO3 heterozygous and wild type
mice were stained with a mouse anti-Myc antibody from Santa Cruz (clone 9E11) and an anti-
MAP2 antibody (green). The images show dentate gyri. Scale bar – 50 m.

Results
90
Fig. 3.9. Analysis of the localization of Strep-Myc-SUMO3 in brain sections from Strep-
Myc-SUMO3 knock-in mice using a mouse anti-Strep antibody from Iba.
Sagittal sections from PFA-perfused Strep-Myc-SUMO3 heterozygous and wild type mice
were stained with a mouse anti-Strep antibody from Iba (red) and an anti-MAP2 antibody (not
shown). The first two rows show CA3 hippocampal regions and the last two rows show

Results
91
subicular regions. Note the staining of the nuclear outline in the CA3 hippocampal regions of
both the heterozygous Strep-Myc-SUMO3 knock-in mouse and the wild type mouse. In the
subicular region of the wild type mouse the antibody labelled only the nuclear outlines of the
neurons, while in the same region of the heterozygous mouse besides the nuclear outlines, the
antibody also labelled the inner part of some nuclei. Scale bar – 50 m.

Results
92
3.2. Analysis of SUMO1 conjugation profile in a mouse model of Alzheimer's disease
3.2.1. Investigation of the localization of SUMO1 upon Alzheimer's disease pathology
A large number of studies have indicated an apparent link between SUMOylation and
AD. Thus, in the second part of this work, our goal was to investigate SUMO1 conjugation
profile during AD pathology by crossbreeding the His6-HA-SUMO1 knock-in mice and the
5xFAD mice - a mouse model of AD.
Before engaging in description of the results, a question that should be discussed is
whether the tagging of SUMO1 has an influence on AD pathology. We took the abundance of
amyloid plaques as a readout of AD pathology (Fig. 3.10. and Fig. 3.11.). In 24-week-old
mice, the plaque density in the subiculum and cortical layer V seemed to be comparable
between His6-HA-SUMO1;5xFAD mice and non-knock-in 5xFAD mice. In 12-week-old
mice there seemed to be more plaques in the knock-in mice when compared to non-knock-in.
16-week-old mice did not show the same tendency as the 12-week-old ones and even seemed
to show the opposite tendency in the cortical layer V. The similarity in the plaque abundance
in the 24-week-old mice together with the low number of mice available do not speak in
favour of big influence of SUMO1 tagging on AD pathology. The slight differences we
observed are likely a result of interindividual variability.

Results
93
Fig. 3.10. Analysis of the influence of His6-HA tagging of SUMO1 on Alzheimer's disease
pathology in the subiculum of His6-HA-SUMO1;5xFAD mice.
Sagittal brain sections from PFA-perfused His6-HA-SUMO1;5xFAD and 5xFAD were
stained with a goat anti-HA antibody (red), a mouse anti-A antibody (green) and an anti-
MAP2 antibody (blue). The images show subicular regions. AD pathology is represented by
intraneuronal A accumulation and extracellular amyloid plaques. Scale bar - 50 m.
Fig. 3.11. Analysis of the influence of His6-HA tagging of SUMO1 on Alzheimer’s disease
pathology in cortical layer V of His6-HA-SUMO1;5xFAD mice.
Sagittal brain sections from PFA-perfused His6-HA-SUMO1;5xFAD and 5xFAD were
stained with a goat anti-HA antibody (red), a mouse anti-A antibody (green) and an anti-
MAP2 antibody (blue). The images show cortical layer V. AD pathology is represented by
intraneuronal A accumulation and extracellular amyloid plaques. Scale bar - 50 m.
The first issue we wanted to address was whether SUMO1 undergoes changes in its
subcellular localization in the context of AD pathology. For this purpose, we compared the
subcellular localization of SUMO1 in anti-HA-labelled brain sections from His6-HA-
SUMO1;5xFAD mice and His6-HA-SUMO1 mice. As controls, 5xFAD and wild type mice
were used. In order to study differences in the SUMO1 localization at different stages of the
disease progression, we utilized mice from different ages, i.e. 8-, 12-, 16-, 24- and
approximately 48-week-old mice. We focused our investigation on two brain regions -

Results
94
subiculum and cortical layer V - since intraneuronal A is visible in these regions and
amyloid plaques first appear there. Additionally, two different anti-HA antibodies were used.
First, we will focus on the results from staining with a goat anti-HA antibody. Figure 3.12.
and Figure 3.13. show examples of anti-HA immunolabelling of brain sections from 16-week-
old His6-HA-SUMO1;5xFAD, His6-HA-SUMO1, 5xFAD and wild type mice. The AD
pathology is visible in the His6-HA-SUMO1;5xFAD mice and the 5xFAD mice as the
presence of extracellular amyloid plaques and intraneuronal accumulation of A. Analogous
to what was shown by Tirard et al. (2012), in both cortical layer V and subiculum, SUMO1
showed predominantly nuclear localization in the neurons of His6-HA-SUMO1 knock-in
mice. Interestingly, in His6-HA-SUMO1;5xFAD mice SUMO1 also showed pronounced
nuclear localization. In both genotypes, especially pronounced was the staining of the nuclear
envelope which results from the labelling of the extensively SUMOylated RanGAP1.
Importantly, the nuclear anti-HA remained present in all the examined ages. In contrast, the
non-knock-in mice did not show any anti-HA staining in the neuronal nuclei, which proves
the specificity of the signal.
Apart from nuclear localization of the anti-HA signal, the crossbred His6-HA-
SUMO1;5xFAD mice exhibited non-nuclear anti-HA signals in the subiculum which seemed
to be proportional to the abundance of amyloid plaques. We focused our analysis of this
additional signal on the subiculum due to its high concentration of plaques. We examined 24-
week-old mice since this age is characterized by a significant amount of senile plaques. This
non-nuclear signal could be line-shaped and interestingly, some of the lines surrounded
amyloid plaques (Fig. 3.14. yellow arrowheads). Additionally, some of this anti-HA signal
looked like an amorphous mass (Fig. 3.14. yellow arrow). The specificity of this signal could
be determined by examining the appropriate control – 5xFAD non-knock-in mice. Notably,
the 5xFAD mice exhibited a similar type of anti-HA staining (Fig. 3.14. white arrowheads and
arrows), which suggests that the observed non-nuclear signal is a non-specific background
signal associated with Alzheimer's disease pathology. In addition, even the mice from the
non-5xFAD genotypes sometimes showed significant background staining, probably resulting
from poor perfusion which could mean that some of the non-nuclear signal in His6-HA-
SUMO1;5xFAD is just background not even related to Alzheimer’s disease pathology.
Besides the goat anti-HA antibody, we also utilized a monoclonal mouse anti-HA
antibody (Fig. 3.15.). Analogous to the goat antibody, His6-HA-SUMO1 was observed in the
neuronal nuclei in both of the knock-in genotypes. Interestingly, the use of this antibody
resulted in a different type of non-nuclear anti-HA staining. His6-HA-SUMO1;5xFAD mice

Results
95
showed anti-HA signal localizing to the amyloid plaques (Fig. 3.15. yellow arrowheads).
Importantly, a similar signal was observed again in the 5xFAD non-knock-in mice, which
speaks against the specificity of the signal in the knock-in mice (Fig. 3.15. white arrowheads).
Studying SUMO1 localization in the context of Alzheimer’s disease pathology, several
studies have reported the presence of SUMO1 around or within amyloid plaques (Takahashi
et al., 2008; Yun et al., 2013; Zhao et al., 2013; Cho et al., 2015a). However, the similarity of
the non-nuclear anti-HA signal observed in His6-HA-SUMO1;5xFAD and 5xFAD mice did
not allow us to confirm this observation.

Results
96
Fig. 3.12. Analysis of the localization of His6-HA-SUMO1 in the subiculum of 16-week-
old mice.
Sagittal brain sections from PFA-perfused His6-HA-SUMO1, His6-HA-SUMO1;5xFAD,
5xFAD and wild type mice were stained with a goat anti-HA antibody (red), a mouse anti-A
antibody (green) and an anti-MAP2 antibody (blue). The images show subicular regions. In
(B) a higher magnification of the same regions is shown. Note the predominantly nuclear
localization of the anti-HA signal in both His6-HA-SUMO1 and His6-HA-SUMO1;5xFAD
mice. Extracellular amyloid plaques and intraneuronal accumulation of A represent the AD
pathology in His6-HA-SUMO1;5xFAD and 5xFAD mice. Scale bar - 50 m.

Results
97
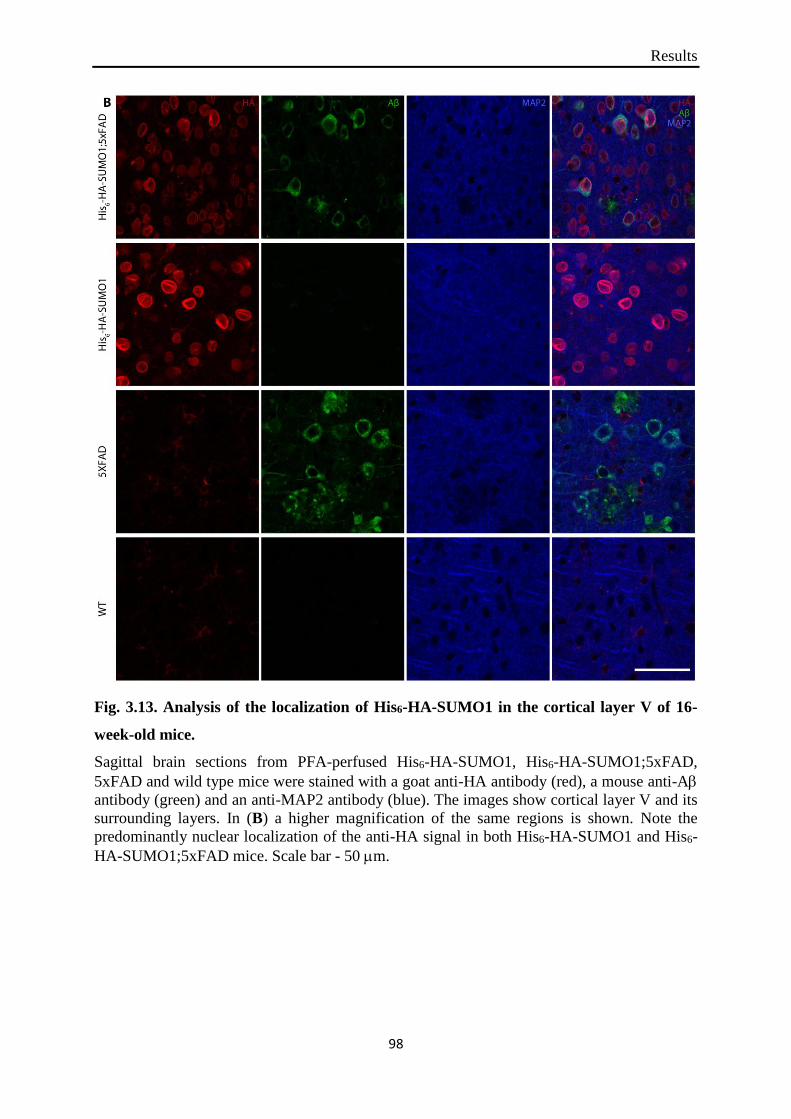
Results
98
Fig. 3.13. Analysis of the localization of His6-HA-SUMO1 in the cortical layer V of 16-
week-old mice.
Sagittal brain sections from PFA-perfused His6-HA-SUMO1, His6-HA-SUMO1;5xFAD,
5xFAD and wild type mice were stained with a goat anti-HA antibody (red), a mouse anti-A
antibody (green) and an anti-MAP2 antibody (blue). The images show cortical layer V and its
surrounding layers. In (B) a higher magnification of the same regions is shown. Note the
predominantly nuclear localization of the anti-HA signal in both His6-HA-SUMO1 and His6-
HA-SUMO1;5xFAD mice. Scale bar - 50 m.

Results
99

Results
100
Fig. 3.14. Analysis of the non-nuclear anti-HA signal produced by the goat anti-HA
antibody in 24-week-old mice.
Sagittal brain sections from PFA-perfused His6-HA-SUMO1, His6-HA-SUMO1;5xFAD,
5xFAD and wild type mice were stained with a goat anti-HA antibody (red), a mouse anti-A
antibody (green) and an anti-MAP2 antibody (blue). The images show subicular regions. Note
the presence of extranuclear line-shaped signal, some of which surrounds amyloid plaques
(arrowheads) and extranuclear amorphous masses (arrows) in both His6-HA-SUMO1;5xFAD
and 5xFAD mice. WT: wild type. Scale bar - 50 m.
In addition to immunostaining of brain sections, we decided to complement our
analysis of SUMO1 localization in the context of AD pathology by performing SDS-PAGE
and anti-HA Western blot of subcellular fractions from brains of His6-HA-SUMO1 and His6-
HA-SUMO1;5xFAD mice (Fig. 3.16.). The age of the studied mice was 36 weeks. Both
genotypes showed similar distribution of the anti-HA signal throughout the different
subcellular fractions. As expected, the nuclear fractions exhibited the most prominent signal.
Thus, the predominantly nuclear localization of His6-HA-SUMO1 was also confirmed with
this technique.

Results
101

Results
102
Fig. 3.15. Analysis of the non-nuclear anti-HA signal produced by a mouse anti-HA
antibody in 24-week-old mice.
Sagittal brain sections from PFA-perfused His6-HA-SUMO1, His6-HA-SUMO1;5xFAD,
5xFAD and wild type mice were stained with a mouse anti-HA antibody (red), a rabbit anti-
A42 antibody (green) and an anti-MAP2 antibody (blue). The images show subicular regions.
Note the presence of extranuclear anti-HA signal in the plaques in both His6-HA-
SUMO1;5xFAD (yellow arrowheads) and 5xFAD (white arrowheads) genotypes. In (B) a
higher magnification of the same regions is shown. Scale bar - 50 m.
Fig. 3.16. Subcellular localization of His6-HA-SUMO1 in the brain of 36-week-old mice.
Subcellular fractions from His6-HA-SUMO1;5xFAD (KI/AD) and His6-HA-SUMO1
(KI/WT) mouse brains were analysed by SDS-PAGE and Western blot using an anti-HA
antibody to detect SUMO1, and anti-GluN1 and anti-synaptophysin antibodies to confirm
accurate fractionation. The subcellular distribution of His6-HA-SUMO1 is similar in both
genotypes. Note that SUMO1 is most abundant in the nuclear fraction (P1). H, homogenate;
P1, nuclear pellet; S1, supernatant after P1 sedimentation; P2, crude synaptosomal pellet; S2,
supernatant after P2 sedimentation; LP1, lysed synaptosomal membrane; LS1, supernatant
after LP1 sedimentation; LP2, synaptic vesicles-enriched fraction; SPM, synaptic plasma
membrane. (Data obtained in collaboration with Dr. M. Tirard and K. Hellmann)

Results
103
3.2.2. Investigation of SUMO1 conjugation levels upon Alzheimer’s disease pathology
A significant number of studies have investigated the effect of increased amyloid
burden on the levels of free SUMO or SUMO conjugates but the results have been very
inconsistent (McMillan et al., 2011; Hoppe et al., 2013; Lee et al., 2013; Yun et al., 2013;
Nistico et al., 2014). Thus, we wanted to increase the current knowledge concerned in
particular with SUMO1 conjugation levels in the context of AD pathology. For this purpose,
we employed two approaches.
First, we engaged in quantitative comparison of the anti-HA signal intensity in the
neuronal nuclei of His6-HA-SUMO1;5xFAD and His6-HA-SUMO1 mice from different ages
- 8-, 12-, 16-, and approximately 48-week-old mice. For this purpose, for cortical layer V, we
focused predominantly on the pyramidal neurons. Regarding the subiculum, the mainly
smaller neurons residing deep in the subiculum were not included in the analysis. 8-, 12- and
16-week-old mice were female while approximately 48-week-old mice were male.
The quantification of the anti-HA signal intensity in the subiculum of 8-week-old
His6-HA-SUMO1;5xFAD and His6-HA-SUMO1 mice did not reveal any significant
difference between the two genotypes (Fig. 3.17. and Fig. 3.23. A and B). However, when we
examined the pyramidal neurons of cortical layer V, the His6-HA-SUMO1;5xFAD mice
showed a significant increase in the signal intensity which amounted to 25.8% (p=0.0205)
(Fig. 3.18. and Fig. 3.22. C and D).
The examination of 12-week-old mice revealed a slight increase in the signal in the
crossbred His6-HA-SUMO1;5xFAD mice in both subiculum and cortical layer V (Fig. 3.19.,
Fig. 3.20. and Fig. 3.23. E, F, G and H). However, as there were only two mice from the His6-
HA-SUMO1 genotype, no definite conclusion can be drawn from these data.
The quantification of the anti-HA signal in 16-week-old mice did not show any
significant differences between the two genotypes in both brain regions examined (Fig. 3.12.,
Fig. 3.13. and Fig. 3.23. I, J, K and L). However, for His6-HA-SUMO1;5xFAD mice the
results displayed an almost significant decrease in the anti-HA signal in the cortical layer V.
Finally, the approximately 48-week-old His6-HA-SUMO1;5xFAD and His6-HA-
SUMO1 did not show any significant differences in the signal intensity in both subiculum and
cortical layer V (Fig. 3.21., Fig. 3.22. and Fig. 3.23. M, N, O and P).
Importantly, the results using this technique should be carefully interpreted with
regard to SUMO1 conjugation levels since we cannot distinguish between free and conjugated
SUMO and the examined SUMO is only the one residing in the nucleus.
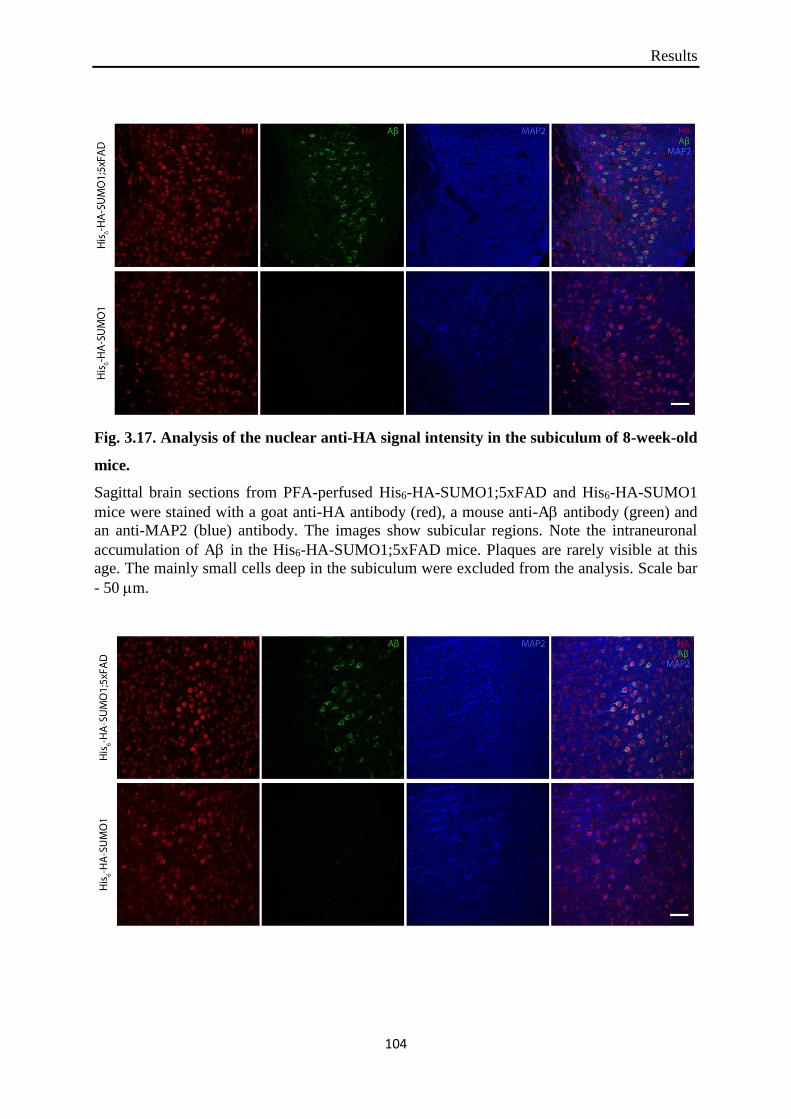
Results
104
Fig. 3.17. Analysis of the nuclear anti-HA signal intensity in the subiculum of 8-week-old
mice.
Sagittal brain sections from PFA-perfused His6-HA-SUMO1;5xFAD and His6-HA-SUMO1
mice were stained with a goat anti-HA antibody (red), a mouse anti-A antibody (green) and
an anti-MAP2 (blue) antibody. The images show subicular regions. Note the intraneuronal
accumulation of A in the His6-HA-SUMO1;5xFAD mice. Plaques are rarely visible at this
age. The mainly small cells deep in the subiculum were excluded from the analysis. Scale bar
- 50 m.

Results
105
Fig. 3.18. Analysis of the nuclear anti-HA signal intensity in the cortical layer V of 8-
week-old mice.
Sagittal brain sections from PFA-perfused His6-HA-SUMO1;5xFAD and His6-HA-SUMO1
mice were stained with a goat anti-HA antibody (red), a mouse anti-A antibody (green) and
an anti-MAP2 (blue) antibody. The images show cortical layer V and its surrounding layers.
The signal from the pyramidal neurons of layer V was used for the quantification. Scale bar –
50 m.
Fig. 3.19. Analysis of the nuclear anti-HA signal intensity in the subiculum of 12-week-
old mice.
Sagittal brain sections from PFA-perfused His6-HA-SUMO1;5xFAD and His6-HA-SUMO1
mice were stained with a goat anti-HA antibody (red), a mouse anti-A antibody (green) and
an anti-MAP2 (blue) antibody. The images show subicular regions. Scale bar – 50 m.

Results
106
Fig. 3.20. Analysis of the nuclear anti-HA signal intensity in the cortical layer V of 12-
week-old mice.
Sagittal brain sections from PFA-perfused His6-HA-SUMO1;5xFAD and His6-HA-SUMO1
mice were stained with a goat anti-HA antibody (red), a mouse anti-A antibody (green) and
an anti-MAP2 (blue) antibody. The images show cortical layer V and its surrounding layers.
Scale bar – 50 m.
Fig. 3.21. Analysis of the nuclear anti-HA signal intensity in the subiculum of
approximately 48-week-old mice.
Sagittal brain sections from PFA-perfused His6-HA-SUMO1;5xFAD and His6-HA-SUMO1
mice were stained with a goat anti-HA antibody (red), a mouse anti-A antibody (green) and
an anti-MAP2 (blue) antibody. The images show subicular regions. Scale bar – 50 m.

Results
107
Fig. 3.22. Analysis of the nuclear anti-HA signal intensity in the cortical layer V of
approximately 48-week-old mice.
Sagittal brain sections from PFA-perfused His6-HA-SUMO1;5xFAD and His6-HA-SUMO1
mice were stained with a goat anti-HA antibody (red), a mouse anti-A antibody (green) and
an anti-MAP2 (blue) antibody. The images show cortical layer V and its surrounding layers.
Scale bar – 50 m.

Results
108

Results
109
Fig. 3.23. Quantification of the nuclear anti-HA signal intensity in 8-, 12-, 16- and
approximately 48-week-old mice.
(A) and (B) Quantification of the nuclear anti-HA signal intensity in the subiculum of 8-
week-old His6-HA-SUMO1 (WT) and His6-HA-SUMO1;5xFAD (5xFAD) mice. (A) Mean
anti-HA signal intensity of His6-HA-SUMO1 (N=3) and His6-HA-SUMO1;5xFAD (N=3)
mice. No significant difference is seen between the two genotypes. p=0.1744. Data are
represented as mean SEM. (B) Scatter plot graph including the anti-HA signal intensity
values of all the examined neurons from the two genotypes - His6-HA-SUMO1 (N=727) and
His6-HA-SUMO1;5xFAD (N=789). Mean SEM is shown. (C) and (D) Quantification of
the nuclear anti-HA signal intensity in the cortical layer V of 8-week-old His6-HA-SUMO1
and His6-HA-SUMO1;5xFAD mice. (C) Mean anti-HA signal intensity of His6-HA-SUMO1
(N=3) and His6-HA-SUMO1;5xFAD (N=3) mice. His6-HA-SUMO1;5xFAD mice show a
25.8% increase in the nuclear anti-HA signal intensity when compared to His6-HA-SUMO1
mice. p=0.0205. (D) Scatter plot graph including the anti-HA signal intensity values of all the
examined neurons from the two genotypes - His6-HA-SUMO1 (N=287) and His6-HA-
SUMO1;5xFAD (N=259). (E) and (F) Quantification of the nuclear anti-HA signal intensity
in the subiculum of 12-week-old His6-HA-SUMO1 and His6-HA-SUMO1;5xFAD mice. (E)
Mean anti-HA signal intensity of His6-HA-SUMO1 (N=2) and His6-HA-SUMO1;5xFAD
(N=3) mice. (F) Scatter plot graph including the anti-HA signal intensity values of all the
examined neurons from the two genotypes - His6-HA-SUMO1 (N=460) and His6-HA-
SUMO1;5xFAD (N=480). (G) and (H) Quantification of the nuclear anti-HA signal intensity
in the cortical layer V of 12-week-old His6-HA-SUMO1 and His6-HA-SUMO1;5xFAD
mice. (G) Mean anti-HA signal intensity of His6-HA-SUMO1 (N=2) and His6-HA-
SUMO1;5xFAD (N=3) mice. (H) Scatter plot graph including the anti-HA signal intensity
values of all the examined neurons from the two genotypes - His6-HA-SUMO1 (N=220) and
His6-HA-SUMO1;5xFAD (N=242). (I) and (J) Quantification of the nuclear anti-HA signal
intensity in the subiculum of 16-week-old His6-HA-SUMO1 and His6-HA-SUMO1;5xFAD
mice. (I) Mean anti-HA signal intensity of His6-HA-SUMO1 (N=3) and His6-HA-
SUMO1;5xFAD (N=3) mice. No significant difference is seen between the two genotypes
p=0.2025. (J) Scatter plot graph including the anti-HA signal intensity values of all the
examined neurons from the two genotypes - His6-HA-SUMO1 (N=538) and His6-HA-
SUMO1;5xFAD (N=547). (K) and (L) Quantification of the nuclear anti-HA signal intensity
in the cortical layer V of 16-week-old His6-HA-SUMO1 and His6-HA-SUMO1;5xFAD
mice. (K) Mean anti-HA signal intensity of His6-HA-SUMO1 (N=3) and His6-HA-
SUMO1;5xFAD (N=3) mice. An almost significant decrease is observed in His6-HA-
SUMO1;5xFAD mice. p=0.0624. (L) Scatter plot graph including the anti-HA signal intensity
values of all the examined neurons from the two genotypes - His6-HA-SUMO1 (N=195) and
His6-HA-SUMO1;5xFAD (N=316). (M) and (N) Quantification of the nuclear anti-HA
signal intensity in the subiculum of approximately 48-week-old His6-HA-SUMO1 and His6-
HA-SUMO1;5xFAD mice. (M) Mean anti-HA signal intensity of His6-HA-SUMO1 (N=3)
and His6-HA-SUMO1;5xFAD (N=3) mice. No significant difference was observed between
the two genotypes. p=0.9452. (N) Scatter plot graph including the anti-HA signal intensity
values of all the examined neurons from the two genotypes - His6-HA-SUMO1 (N=1038) and
His6-HA-SUMO1;5xFAD (N=473). (O) and (P) Quantification of the nuclear anti-HA signal
intensity in the cortical layer V of approximately 48-week-old His6-HA-SUMO1 and His6-
HA-SUMO1;5xFAD mice. (O) Mean anti-HA signal intensity of His6-HA-SUMO1 (N=3)
and His6-HA-SUMO1;5xFAD (N=3) mice. No significant difference is observed between the
two genotypes. p=0.2089. (P) Scatter plot graph including the anti-HA signal intensity values
of all the examined neurons from the two genotypes - His6-HA-SUMO1 (N=391) and His6-
HA-SUMO1;5xFAD (N=389). App. - approximately

Results
110
The second approach employed to detect changes in the SUMO1 levels relied on SDS-
PAGE and quantitative anti-HA Western blot (Fig. 3.24.). The levels of His6-HA-SUMO1
conjugates in hippocampus and cerebral cortex were compared between His6-HA-
SUMO1;5xFAD and His6-HA-SUMO1 mice. Mice from different ages were again used – 8-,
12-, 16-, 24-, and 36-week-old mice. Analogous to most of the results from the
immunostaining experiments, there was no significant difference in the His6-HA-SUMO1
conjugation levels between the two genotypes in the hippocampus and cortex at any of the
investigated ages in both hippocampus and cortex. Only minor trends were observed. For
example, in the cortex of His6-HA-SUMO1;5xFAD 16-week-old mice there is a trend towards
an increase when compared to His6-HA-SUMO1 mice. However, overall amyloid pathology
does not influence SUMO1 conjugation. Further, a slight decrease in SUMO1 conjugation
levels was observed with increasing age, at least in hippocampus. This effect was independent
of the 5xFAD genotype, indicating a general age-dependent reduction of SUMO1
conjugation.

Results
111
Fig. 3.24. Quantitative Western blot of global His6-HA-SUMO1 conjugation levels in
hippocampus and cortex.
Hippocampal and cortical tissue extracts from His6-HA-SUMO1;5xFAD (AD, black bar) and
His6-HA-SUMO1 mice (WT, white bar) were subjected to SDS-PAGE and quantitative anti-
HA Western blot. The mice were 8 (8w), 12 (12w), 16 (16w), 24 (24w) and 36 (36w) weeks
of age. The bracket indicates the quantified SUMO1 conjugates. No significant differences in
the His6-HA-SUMO1 conjugation values were observed between the two genotypes at any of
the examined ages in both cortex and hippocampus. (Data obtained in collaboration with Dr.
M. Tirard and K. Hellmann)

Discussion
112
4. Discussion
4.1. Generation and basic characterization of a Strep-Myc-SUMO3 knock-in mouse line
Studying SUMOylation has long been hampered by a number of difficulties - the lack
of reliable antibodies, the transient nature of the post-translational modification, the fact that
only a small fraction of a certain protein is SUMOylated at a given time. In an attempt to
facilitate the study of SUMOylation, Tirard et al. (2012) generated a His6-HA-SUMO1
knock-in mouse expressing the double-tagged SUMO1 protein under the control of the
endogenous SUMO1 promoter. This proved to be a reliable model for the localization of
SUMO1 and the identification of SUMO1 substrates. Analogous to that, in the course of my
doctoral work, we generated a Strep-Myc-SUMO3 knock-in mouse line expressing Strep-
Myc-tagged SUMO3 instead of wild type SUMO3. Importantly, a successfully generated
mouse would allow to distinguish SUMO3 from SUMO2 as till now, due to their high
sequence similarity, no antibody can distinguish between them. Additionally, the choice of
tags different from His6 and HA would allow a direct comparison of the localization of
SUMO1 and SUMO3. Furthermore, besides studying SUMO3 under normal conditions, the
mouse model would make it possible to investigate SUMO3 in the context of different
pathologies since predominantly SUMO2/3 conjugation has been shown to change
dramatically in response to aberrant cellular conditions both in cell cultures (Saitoh &
Hinchey, 2000; Golebiowski et al., 2009; Castoralova et al., 2012; Cimarosti et al., 2012;
Guo et al., 2013) and in vivo (Lee et al., 2007; Cimarosti et al., 2008; Yang et al., 2008a; b;
Yang et al., 2009; Wang et al., 2012; Yang et al., 2014).
4.1.1. Strep-Myc-SUMO3 mouse line as a model for identification of SUMO3 substrates
After the generation of the Strep-Myc-SUMO3 mouse line, we wanted to test if the
line could be used as a model for the identification of SUMO3 substrates. By performing anti-
Myc affinity purification of brain homogenates from wild type and Strep-Myc-SUMO3 mice,
we were able to show the enrichment of free and conjugated Strep-Myc-SUMO3 in the eluate
from the knock-in mice (Fig. 3.4.). Thus, we proved that by performing anti-Myc affinity
purification and subsequent mass spectrometry analysis, the mouse line can be used as a
model for identifying SUMO3 substrates. Notably, the presence of a double tag after the start
codon of the SUMO3 gene presents the opportunity for a two-step affinity purification, which
would increase the stringency of the purification procedure. For this purpose, the anti-Strep

Discussion
113
affinity purification still needs to be optimized. Furthermore, Fig. 3.4. shows comparable
expression levels of SUMO2/3 in the knock-in and the wild type mice. Unfortunately, the lack
of SUMO3-specific antibody does not allow us to compare the expression of SUMO3
between knock-in and wild type mice.
4.1.2. Strep-Myc-SUMO3 mouse line as a model for localization of SUMO3
A look at the literature shows that even though some studies have focused on SUMO2
and SUMO3 localization in the brain, endogenous SUMO2 and SUMO3 have always been
studied together owing to the fact that no antibody can distinguish between them (Li et al.,
2003; Yang et al., 2008a; Yang et al., 2009; Wang et al., 2012; Hasegawa et al., 2014; Wang
et al., 2014). This makes the examination of SUMO3 localization in the brain of Strep-Myc-
SUMO3 mice very interesting.
However, in contrast to the successful affinity purification of free Strep-Myc-SUMO3
and Strep-Myc-SUMO3 conjugates, we could not achieve much in revealing the localization
of SUMO3 in the brain both on subcellular and regional level. The utilization of several
different anti-Myc and one anti-Strep antibody resulted in very different types of staining in
the knock-in mice, which was accompanied by different types of background staining in the
wild type mice. A likely reason for this failure is the methodology that was used. Indeed,
some antibodies work well for staining cell cultures but fail to give a good signal in brain
sections. Furthermore, optimization of the conditions could be required, such as changing the
fixation method. Another likely reason for the inability to localize Strep-Myc-SUMO3 is low
expression levels of SUMO3. Indeed, in 2014 Wang and collaborators provided evidence that
SUMO2 is the predominant SUMO isoform in both embryonic and adult tissues. While
SUMO3-/- mice were viable, SUMO2-/- embryos died around the age of E10.5. Using
quantitative RT-PCR, the authors showed very low expression levels of SUMO3 in contrast to
SUMO2. At embryonic day 7.5 and 8.5 SUMO3 was only 2 and 3%, respectively, from all the
SUMO isoforms while SUMO2 was 80 and 75%. Notably, in adult tissue SUMO3 expression
increased to 20% of all isoforms. Besides quantitative RT-PCR, the authors also used Western
blot to determine the relative abundance of SUMO2 and SUMO3 in both embryonic and adult
tissue. In E8.5 embryos, the levels of SUMO2/3 conjugated proteins were decreased in
SUMO2-/- mice compared to SUMO2+/- and SUMO2+/+, while there were no significant
differences in the levels of SUMO2/3 conjugated proteins between SUMO3-/-, SUMO3+/-
and SUMO3+/+. The results were similar when brains, hearts and kidneys from adult mice
were used with the difference that the levels of free SUMO2/3 were compared since in adult

Discussion
114
animals there were few SUMO2/3 conjugates (Wang et al., 2014). Finally, another, albeit
unlikely, reason for the failure to properly localize Strep-Myc-SUMO3 could be that the
protein is present in brain regions that were not examined in the present study.
In essence, some of the used antibodies indicated nuclear localization of SUMO3
while others indicated that SUMO3 resides in the cytoplasm. However, it is really difficult to
draw any conclusions since the results varied not only when different antibodies were used
but also between homozygous and heterozygous mice. A possible though unlikely explanation
for these discrepancies between homozygous and heterozygous mice could be the differences
in the mice age.
To summarize, the generation of the Strep-Myc-SUMO3 knock-in mouse model
proved to be successful in providing a tool for the enrichment and identification of SUMO3
substrates. Regarding the localization of SUMO3, given all the controversial results obtained
by now, further work is needed to draw a definite conclusion.
4.2. Analysis of SUMO1 conjugation profile in a mouse model of Alzheimer's disease
Different reports implicated SUMOylation in the pathogenesis of different
neurodegenerative diseases. For example, key players in AD pathology, APP and tau, were
suggested to be SUMO-modified (Gocke et al., 2005; Dorval & Fraser, 2006; Zhang & Sarge,
2008a; Luo et al., 2014). Furthermore, different groups reported dysregulation of SUMO
conjugation levels in mouse models of AD (Zhao et al., 2013; Lee et al., 2014; Nistico et al.,
2014). Some of the observations, however, are highly controversial requiring additional
investigations to shed light on the matter. Thus, in a second project, our goal was to examine
SUMO1 in the context of AD pathology using a mouse model of AD. This included checking
for differences in SUMO1 localization and conjugation levels between His6-HA-SUMO1
mice and crossbred His6-HA-SUMO1;5xFAD mice. Mice from different ages were used in
order to identify any changes between different stages of the disease progression.
Regarding the localization of SUMO1, the nuclear localization was evident in both
His6-HA-SUMO1 and His6-HA-SUMO1;5xFAD mice in both of the brain regions examined -
subiculum and cortical layer V - and at any of the ages examined. Furthermore, additional
anti-HA signal was observed in His6-HA-SUMO1;5xFAD, the abundance of which correlated
with the abundance of amyloid plaques. The examination of the non-nuclear signal was done
in the subiculum due to the high concentration of amyloid plaques. However, this does not
exclude the presence of this signal in other brain regions. The signal had either the shape of a
line or of an amorphous mass. Some of the line-shaped signal surrounded amyloid plaques.

Discussion
115
However, similar staining was also observed in 5xFAD non-knock-in mice which does not
speak in favour of specific anti-HA signal in His6-HA-SUMO1;5xFAD mice. A different anti-
HA antibody, raised in mouse, in addition to nuclear anti-HA signal, produced a different type
of non-nuclear staining in the subiculum of His6-HA-SUMO1;5xFAD mice. This antibody
labelled the amyloid plaques. Again, non-knock-in 5xFAD mice exhibited a similar type of
signal. Apart from immunostaining, the nuclear localization of SUMO1 was confirmed using
subcellular fractionation and subsequent SDS-PAGE and Western blot. His6-HA-SUMO1
resided predominantly in the nuclear fraction in both 5xFAD and non-5xFAD mice.
With regard to SUMO1 conjugation levels upon AD pathology, using anti-HA
Western blot, we did not observe any significant differences in the SUMO1 conjugation levels
between His6-HA-SUMO1 and His6-HA-SUMO1;5xFAD mice in both cortex and
hippocampus at any of the ages examined – 8-, 12-, 16-, 24- and 36-week-old mice. Similarly,
quantification of the anti-HA signal intensity in the nuclei of His6-HA-SUMO1 and His6-HA-
SUMO1;5xFAD mice in both cortical layer V and subiculum did not reveal any substantial
differences between the two genotypes. A significant but small increase which accounted for
25.8% was observed in the cortical layer V of 8-week-old His6-HA-SUMO1;5xFAD mice
when compared to His6-HA-SUMO1 mice. In 12-week-old mice there may be small
differences but the number of mice did not allow us to perform statistics. Opposite to 8- and
12-week-old mice, the cortical layer V of His6-HA-SUMO1;5xFAD 16-week-old mice
showed almost significant decrease in the nuclear anti-HA signal.
4.2.1. 5xFAD as a model to study Alzheimer's disease
AD research is based on an enormous amount of experimental models with transgenic
mouse models constituting a big part of them. The mouse model which was used in our study
is 5xFAD – the mice bear five familial AD-related mutations in APP and PS1 (Oakley et al.,
2006).
Supposedly the most important advantage of the 5xFAD mouse model is the fast
development of AD-like pathology, owing to the compound mutations. Indeed, while in the
very popular mouse model Tg2576 amyloid plaques do not appear before 9 months of age
(Hsiao et al., 1996; Spires & Hyman, 2005), in 5xFAD mice the amyloid plaques are visible
in 2-month-old mice (Oakley et al., 2006). Furthermore, the 5xFAD mouse model exhibits
neuronal loss – an important characteristic of AD pathology. In contrast, many of the other
transgenic mouse models of AD fail to reproduce this feature (Oakley et al., 2006).

Discussion
116
Despite the enormous usefulness of the 5xFAD mouse model, certain limitations
should also be mentioned. Some of those limitations are shared by AD transgenic mouse
models or even by all transgenic mouse models. One of the problems is the non-physiological
level of expression of the transgenes (Elder et al., 2010). Furthermore, a main issue for all AD
transgenic mouse models is the inability to reproduce all the features that characterize human
AD pathology (Elder et al., 2010). For example, 5xFAD mice do not develop neurofibrillary
tangles despite the fact that neurofibrillary tangle development is believed to be downstream
with regard to A pathology as postulated by the amyloid hypothesis (Oakley et al., 2006).
Another major problem regarding transgenic mouse models of AD is that they are based on
mutations exhibited in a very small percentage of AD patients. As Elder and collaborators
argue in their review paper about transgenic mouse models of AD from 2010, such mutations
can result in introduction of effects which are not present in sporadic AD (Elder et al., 2010).
Furthermore, most transgenic mouse models, including 5xFAD, utilize heterologous
promoters, which results in different patterns of temporal and spatial expression when
compared to human AD (Kitazawa et al., 2012). Notably, the integration of the transgene may
result in disruption of an endogenous gene (Onos et al., 2016). Finally, in their original paper
describing the generation of 5xFAD mice, Oakley and collaborators state two important
limitations of the mouse model with regard to studying AD in humans. First, AD in humans is
never caused by multiple mutations and thus, the authors speculate about occurrence of some
unpredicted changes in APP processing in the 5xFAD mouse model. Second, the A42/A40
ratio is higher than the one in humans which could lead to a higher A42 toxicity in the
5xFAD mice (Oakley et al., 2006).
4.2.2. Investigation of the localization of SUMO1 upon Alzheimer's disease pathology
Interestingly, several studies have reported the presence of SUMO1 surrounding or
within amyloid plaques using anti-SUMO1 antibodies for staining brain sections of different
AD mouse models. First, in 2008, Takahashi and collaborators reported the colocalization of
SUMO1 with phospho-Tau positive puncta around amyloid plaques in Tg2576 mice
(Takahashi et al., 2008). Later, in 2013, Zhao and collaborators using an APP/PS1 transgenic
mouse model reported the colocalization of SUMO1 with AT8 stained phospho-tau in
dystrophic neurites around amyloid plaques and furthermore, the presence of diffuse SUMO1
signal in the centre of some plaques (Zhao et al., 2013). In 2013 again, Yun et al. used
APP/PS1E9 transgenic mice to report SUMO1 surrounding and partially colocalizing with

Discussion
117
amyloid plaques. Finally, the same group using the same mouse model reported colocalization
of SUMO1 with autophagy markers surrounding amyloid plaques (Cho et al., 2015a).
In contrast to those studies, we could not find evidence of the presence of SUMO1
within or surrounding amyloid plaques and in general of a significant presence of SUMO1
outside the nucleus. The existence of similar non-nuclear signals in both knock-in 5xFAD and
non-knock-in 5xFAD speaks strongly against the specificity of the signal in knock-in 5xFAD
mice. Furthermore, the different plaque-related staining produced by the use of a different
antibody strongly supports the lack of specificity hypothesis. The labelling around or within
the plaques with the two antibodies could be a result of amyloid plaques acting as a trap for
antibodies. Of course, we cannot completely rule out that there are differences between the
non-nuclear staining in the two genotypes and thus the possibility of AD-related SUMO1
relocalization. Drawing a definite conclusion would require an even more thorough
investigation including quantitative analysis. Notably, in our hands, none of the plaque-related
signal had punctate appearance, which was, in contrast, predominantly seen in the
aforementioned studies. Several reasons could account for the discrepancies between our
results and the results obtained by the aforementioned groups. First, this could arise from
differences in the model systems that were used. The colocalization of SUMO1 with
phosphorylated tau in some of the studies could suggest distinct tau phosphorylation profiles
in the different AD transgenic mouse models. Secondly, as we focused on subiculum for our
analysis of the non-nuclear anti-HA signal, the discrepancies could be caused by differences
between the different brain regions, even though this is unlikely. Finally, taking into account
the strong background staining in non-knock-in 5xFAD mice, there is a possibility that what
has been observed by these studies is only a non-specific background staining related to AD
pathology. Amyloid plaques acting as a trap for the antibodies could account for the observed
signal surrounding and within the plaques. Indeed, the perfect control would be SUMO1
knock-out mice which were not analysed in any of the studies.
4.2.3. Investigation of SUMO1 conjugation levels upon Alzheimer's disease pathology
Apart from localizing SUMO in mouse models of AD, some authors have used them
to examine the levels of SUMO conjugates in comparison to wild type mice using Western
blot. In 2011, McMillan and collaborators were the first to explore possible changes in SUMO
conjugation using a mouse model of AD – Tg2576. With regard to SUMO1, they did not find
any significant differences in the global SUMO1 conjugation levels between 9-month-old
transgenic and wild type mice when hippocampus, cortex and cerebellum were examined

Discussion
118
(McMillan et al., 2011). Using the same mouse model, Nistico and collaborators showed an
increase in SUMO1 conjugation levels in the cortex and the hippocampus of 3- and 6-month-
old transgenic mice while 1,5- and 17-month-old mice did not exhibit significant changes in
SUMO1 conjugation in these regions (Nistico et al., 2014). Lee et al. (2014) also used the
same mouse model to show that there are no big changes in the SUMO1 conjugation levels in
the hippocampus when mice of ages 1-2-, 7-8- or 13-14 months were examined. Furthermore,
Zhao et al. (2013) observed an increase in SUMO1 conjugation in different brain regions of
12-month-old APP/PS1 transgenic mice when compared to wild type mice. Finally, a study
reported an increase in free SUMO1 levels in the cortex of 18-month-old
APPSwedish/PS1E9 transgenic mice (Yun et al., 2013). Reasons for this increase in free
SUMO1 could be increased SUMO1 deconjugation or decreased SUMO1 conjugation even
though SUMO1 exhibited boosted immunoreactivity, which could mean increased expression
levels of SUMO1. In addition to mouse models of AD, the effect of increased A levels on
SUMO1 conjugation has been studied in cell cultures. Overexpression of GFP-A1-42 resulted
in increased levels of free SUMO1 in HBmg cells, while treatment with A1-40 applied to the
same cells resulted in increased free SUMO1 and SUMO1 conjugation levels (Yun et al.,
2013).
The use of quantitative anti-HA Western blot to compare SUMO1 conjugation levels
between His6-HA-SUMO1;5xFAD and His6-HA-SUMO1 mice did not reveal any significant
differences in both hippocampus and cortex at any of the different ages examined. These
observations are in contrast to the studies that found changes in SUMO1 conjugation, namely
the study by Nistico et al. (2014) and Zhao et al. (2013). The reason for this discrepancy
could be the different properties of the examined mouse models. However, given the
discrepancy between the other studies as well, the controversies could arise from unreliable
antibodies, insufficient numbers of animals tested, or different ways of analysing Western blot
data.
Furthermore, the analysis of the nuclear anti-HA signal intensity of His6-HA-
SUMO1;5xFAD and His6-HA-SUMO1 mice revealed a significant difference only in the
cortical layer V of 8-week-old His6-HA-SUMO1;5xFAD mice. However, the observations
from the two experimental methods should be compared carefully. While the quantitative
Western blot focuses on SUMO1 conjugates, the immunostaining analysis cannot distinguish
between free and conjugated SUMO1. If free SUMO1 does not relocalize, even a substantial
decrease of SUMO1 conjugation would not be detected by analysis of the nuclear anti-HA
signal intensity. Furthermore, increases in SUMO1 conjugation accompanied by a decrease in

Discussion
119
free SUMO1 but not by an increase in SUMO1 expression would not be detected. This
possibility is unlikely due to the lack of a large amount of free SUMO1, described first in
COS-7 cells by Saitoh and Hinchey (Saitoh & Hinchey, 2000). Thus, an increase in SUMO1
conjugation would most probably require increased expression of the protein. Furthermore,
the technique focuses only on the levels of nuclear SUMO1 conjugates. Increases or decreases
in the nuclear signal may just be a result of relocalization of free and/or conjugated SUMO1.
Thus, any changes or lack of changes detected by this technique would not directly correlate
to changes or lack of changes in SUMO1 conjugation. In spite of these drawbacks, which
make studying SUMO1 conjugation levels difficult, the analysis of anti-HA signal intensity
has one big advantage – its narrow focus. Examined are the regions in which the AD
pathology appears first and therefore is the strongest there. Thus, if the small increase in
signal intensity detected in 8-week-old mice is a result of increased SUMO1 conjugation
accompanied by increased expression levels of SUMO1, the reason why this is not detected
with the Western blot analysis would be a dilution of the effect. However, the small increase
could also reflect relocalization of free and/or conjugated SUMO1 into the nucleus, which
would also explain the failure to detect this by quantitative Western blot.
In general, the fact that we observed no or only minimal differences between the His6-
HA-SUMO1;5xFAD and His6-HA-SUMO1 mice with both of the methods used, speaks
against a considerable effect of AD pathology on global SUMO1 conjugation. Besides, the
small difference that was observed needs to be confirmed by the utilization of a larger number
of animals as in most of the cases only 3 animals per genotype were used. The small number
of animals used could suggest that the small differences observed could reflect interindividual
variability. If the results from the quantification hold true after a larger number of animals is
examined, the cortical layer V fluctuations in the ratio between anti-HA signal intensity in
His6-HA-SUMO1;5xFAD and the intensity in His6-HA-SUMO1 mice could be explained in
different ways. One possibility would be that in 8-week-old His6-HA-SUMO1;5xFAD mice,
the AD pathology drives the increase of anti-HA signal intensity. The signal, however, returns
back to normal levels and maybe to even lower ones in 16-week-old mice owing to
compensatory mechanisms that have started to take place in older mice. Another possibility
would be that the initial increase could reflect a compensatory mechanism which continues
until a certain point (maybe even until 12 or more weeks of age), at which the mice could not
cope with the strengthening of the AD pathology anymore.
Discussion
120
4.2.4. Conclusions and outlook
In conclusion, we were not able to find any clear changes in SUMO1 localization and
SUMO1 global conjugation levels related to AD-like pathology. This is in contrast to several
studies that linked altered SUMO1 conjugation to AD pathology and indicates that SUMO1
conjugation is largely undisturbed in the context of AD pathology. However, since changes in
individual proteins may not be detected by examining global SUMO1 conjugation and
SUMO1 localization, additional experiments are warranted. Thus, the next step in our
investigation, which is currently in progress, includes anti-HA affinity purification of SUMO1
conjugates from brain homogenates of His6-HA-SUMO1;5xFAD, His6-HA-SUMO1, 5xFAD
and wild type mice and subsequent mass spectrometry analysis, with the aim of identifying
differentially SUMOylated substrates under the conditions of AD pathology. The
identification of altered substrates would provide many further possibilities for research. The
acceptor lysines could be identified and SUMOylation-deficient proteins could be expressed
in cell cultures to study the importance of SUMO1-ylation in the AD context.
Furthermore, the SUMO1-ylation of APP and tau has been mainly studied by
overexpression of APP or tau and SUMO1 in cell cultures (Dorval & Fraser, 2006; Zhang &
Sarge, 2008a; Luo et al., 2014). Thus, it would be interesting to examine their SUMOylation
status in the His6-HA-SUMO1 mouse model and compare with crossbred His6-HA-
SUMO1;5xFAD mice to identify eventual differences in APP and/or tau SUMO1-ylation
upon AD pathology.
Another possible future direction that could be explored involves the crossbreeding of
the newly generated Strep-Myc-SUMO3 knock-in mouse line with the mouse model of AD –
5xFAD mice in order to explore in a similar way the SUMO3 profile in conditions of AD
pathology.

121
References
Ahmed, M., Davis, J., Aucoin, D., Sato, T., Ahuja, S., Aimoto, S., Elliott, J.I., Van Nostrand, W.E. &
Smith, S.O. (2010) Structural conversion of neurotoxic amyloid-beta(1-42) oligomers to
fibrils. Nat Struct Mol Biol, 17, 561-567.
Ahn, K., Song, J.H., Kim, D.K., Park, M.H., Jo, S.A. & Koh, Y.H. (2009) Ubc9 gene polymorphisms
and late-onset Alzheimer's disease in the Korean population: a genetic association study.
Neurosci Lett, 465, 272-275.
Alkuraya, F.S., Saadi, I., Lund, J.J., Turbe-Doan, A., Morton, C.C. & Maas, R.L. (2006) SUMO1
haploinsufficiency leads to cleft lip and palate. Science, 313, 1751.
Alzheimer, A. (1907) Über eine eigenartige Erkrankung der Hirnrinde. Allgemeine Zeitschrift für
Psychiatrie, 64, 146-148.
Bales, K.R., Liu, F., Wu, S., Lin, S., Koger, D., DeLong, C., Hansen, J.C., Sullivan, P.M. & Paul,
S.M. (2009) Human APOE isoform-dependent effects on brain beta-amyloid levels in PDAPP
transgenic mice. J Neurosci, 29, 6771-6779.
Bayona, J.C., Nakayasu, E.S., Laverriere, M., Aguilar, C., Sobreira, T.J., Choi, H., Nesvizhskii, A.I.,
Almeida, I.C., Cazzulo, J.J. & Alvarez, V.E. (2011) SUMOylation pathway in Trypanosoma
cruzi: functional characterization and proteomic analysis of target proteins. Mol Cell
Proteomics, 10, M110 007369.
Becker, J., Barysch, S.V., Karaca, S., Dittner, C., Hsiao, H.H., Berriel Diaz, M., Herzig, S., Urlaub, H.
& Melchior, F. (2013) Detecting endogenous SUMO targets in mammalian cells and tissues.
Nat Struct Mol Biol, 20, 525-531.
Beier, M.T. (2007) Treatment strategies for the behavioral symptoms of Alzheimer's disease: focus on
early pharmacologic intervention. Pharmacotherapy, 27, 399-411.
Beltrao, P., Bork, P., Krogan, N.J. & van Noort, V. (2013) Evolution and functional cross-talk of
protein post-translational modifications. Mol Syst Biol, 9, 714.
Benson, M.D., Li, Q.J., Kieckhafer, K., Dudek, D., Whorton, M.R., Sunahara, R.K., Iniguez-Lluhi,
J.A. & Martens, J.R. (2007) SUMO modification regulates inactivation of the voltage-gated
potassium channel Kv1.5. Proc Natl Acad Sci U S A, 104, 1805-1810.
Berdnik, D., Favaloro, V. & Luo, L. (2012) The SUMO protease Verloren regulates dendrite and axon
targeting in olfactory projection neurons. J Neurosci, 32, 8331-8340.
Bergink, S. & Jentsch, S. (2009) Principles of ubiquitin and SUMO modifications in DNA repair.
Nature, 458, 461-467.

122
Blomster, H.A., Hietakangas, V., Wu, J., Kouvonen, P., Hautaniemi, S. & Sistonen, L. (2009) Novel
proteomics strategy brings insight into the prevalence of SUMO-2 target sites. Mol Cell
Proteomics, 8, 1382-1390.
Blomster, H.A., Imanishi, S.Y., Siimes, J., Kastu, J., Morrice, N.A., Eriksson, J.E. & Sistonen, L.
(2010) In vivo identification of sumoylation sites by a signature tag and cysteine-targeted
affinity purification. J Biol Chem, 285, 19324-19329.
Bohren, K.M., Nadkarni, V., Song, J.H., Gabbay, K.H. & Owerbach, D. (2004) A M55V
polymorphism in a novel SUMO gene (SUMO-4) differentially activates heat shock
transcription factors and is associated with susceptibility to type I diabetes mellitus. J Biol
Chem, 279, 27233-27238.
Borchelt, D.R., Ratovitski, T., van Lare, J., Lee, M.K., Gonzales, V., Jenkins, N.A., Copeland, N.G.,
Price, D.L. & Sisodia, S.S. (1997) Accelerated amyloid deposition in the brains of transgenic
mice coexpressing mutant presenilin 1 and amyloid precursor proteins. Neuron, 19, 939-945.
Braak, H. & Braak, E. (1991) Neuropathological stageing of Alzheimer-related changes. Acta
Neuropathol, 82, 239-259.
Braun, L., Cannella, D., Pinheiro, A.M., Kieffer, S., Belrhali, H., Garin, J. & Hakimi, M.A. (2009)
The small ubiquitin-like modifier (SUMO)-conjugating system of Toxoplasma gondii. Int J
Parasitol, 39, 81-90.
Bruderer, R., Tatham, M.H., Plechanovova, A., Matic, I., Garg, A.K. & Hay, R.T. (2011) Purification
and identification of endogenous polySUMO conjugates. EMBO Rep, 12, 142-148.
Callis, J. (2014) The ubiquitination machinery of the ubiquitin system. Arabidopsis Book, 12, e0174.
Castellani, R.J., Nunomura, A., Lee, H.G., Perry, G. & Smith, M.A. (2008) Phosphorylated tau: toxic,
protective, or none of the above. J Alzheimers Dis, 14, 377-383.
Castoralova, M., Brezinova, D., Sveda, M., Lipov, J., Ruml, T. & Knejzlik, Z. (2012) SUMO-2/3
conjugates accumulating under heat shock or MG132 treatment result largely from new
protein synthesis. Biochim Biophys Acta, 1823, 911-919.
Cavallucci, V., D'Amelio, M. & Cecconi, F. (2012) Abeta toxicity in Alzheimer's disease. Mol
Neurobiol, 45, 366-378.
Chalmers, D.T., Dewar, D., Graham, D.I., Brooks, D.N. & McCulloch, J. (1990) Differential
alterations of cortical glutamatergic binding sites in senile dementia of the Alzheimer type.
Proc Natl Acad Sci U S A, 87, 1352-1356.

123
Chan, H.Y., Warrick, J.M., Andriola, I., Merry, D. & Bonini, N.M. (2002) Genetic modulation of
polyglutamine toxicity by protein conjugation pathways in Drosophila. Hum Mol Genet, 11,
2895-2904.
Chao, H.W., Hong, C.J., Huang, T.N., Lin, Y.L. & Hsueh, Y.P. (2008) SUMOylation of the MAGUK
protein CASK regulates dendritic spinogenesis. J Cell Biol, 182, 141-155.
Cho, S.J., Yun, S.M., Jo, C., Lee, D.H., Choi, K.J., Song, J.C., Park, S.I., Kim, Y.J. & Koh, Y.H.
(2015a) SUMO1 promotes Abeta production via the modulation of autophagy. Autophagy, 11,
100-112.
Cho, S.J., Yun, S.M., Lee, D.H., Jo, C., Ho Park, M., Han, C. & Ho Koh, Y. (2015b) Plasma SUMO1
Protein is Elevated in Alzheimer's Disease. J Alzheimers Dis, 47, 639-643.
Ciechanover, A., Heller, H., Elias, S., Haas, A.L. & Hershko, A. (1980) ATP-dependent conjugation
of reticulocyte proteins with the polypeptide required for protein degradation. Proc Natl Acad
Sci U S A, 77, 1365-1368.
Ciechanover, A., Hod, Y. & Hershko, A. (2012) A heat-stable polypeptide component of an ATP-
dependent proteolytic system from reticulocytes. 1978. Biochem Biophys Res Commun, 425,
565-570.
Cimarosti, H., Ashikaga, E., Jaafari, N., Dearden, L., Rubin, P., Wilkinson, K.A. & Henley, J.M.
(2012) Enhanced SUMOylation and SENP-1 protein levels following oxygen and glucose
deprivation in neurones. J Cereb Blood Flow Metab, 32, 17-22.
Cimarosti, H., Lindberg, C., Bomholt, S.F., Ronn, L.C. & Henley, J.M. (2008) Increased protein
SUMOylation following focal cerebral ischemia. Neuropharmacology, 54, 280-289.
Comerford, K.M., Leonard, M.O., Karhausen, J., Carey, R., Colgan, S.P. & Taylor, C.T. (2003) Small
ubiquitin-related modifier-1 modification mediates resolution of CREB-dependent responses
to hypoxia. Proc Natl Acad Sci U S A, 100, 986-991.
Craig, T.J., Anderson, D., Evans, A.J., Girach, F. & Henley, J.M. (2015) SUMOylation of Syntaxin1A
regulates presynaptic endocytosis. Sci Rep, 5, 17669.
D'Amelio, M., Cavallucci, V., Middei, S., Marchetti, C., Pacioni, S., Ferri, A., Diamantini, A., De Zio,
D., Carrara, P., Battistini, L., Moreno, S., Bacci, A., Ammassari-Teule, M., Marie, H. &
Cecconi, F. (2011) Caspase-3 triggers early synaptic dysfunction in a mouse model of
Alzheimer's disease. Nat Neurosci, 14, 69-76.
D'Cunha, J., Ramanujam, S., Wagner, R.J., Witt, P.L., Knight, E., Jr. & Borden, E.C. (1996) In vitro
and in vivo secretion of human ISG15, an IFN-induced immunomodulatory cytokine. J
Immunol, 157, 4100-4108.
Daniel, J. & Liebau, E. (2014) The ufm1 cascade. Cells, 3, 627-638.

124
Denison, C., Rudner, A.D., Gerber, S.A., Bakalarski, C.E., Moazed, D. & Gygi, S.P. (2005) A
proteomic strategy for gaining insights into protein sumoylation in yeast. Mol Cell
Proteomics, 4, 246-254.
Dickerson, B.C. & Eichenbaum, H. (2010) The episodic memory system: neurocircuitry and disorders.
Neuropsychopharmacology, 35, 86-104.
Dickson, T.C. & Vickers, J.C. (2001) The morphological phenotype of beta-amyloid plaques and
associated neuritic changes in Alzheimer's disease. Neuroscience, 105, 99-107.
Dorval, V. & Fraser, P.E. (2006) Small ubiquitin-like modifier (SUMO) modification of natively
unfolded proteins tau and alpha-synuclein. J Biol Chem, 281, 9919-9924.
Dorval, V., Mazzella, M.J., Mathews, P.M., Hay, R.T. & Fraser, P.E. (2007) Modulation of Abeta
generation by small ubiquitin-like modifiers does not require conjugation to target proteins.
Biochem J, 404, 309-316.
Du, H., Guo, L., Yan, S., Sosunov, A.A., McKhann, G.M. & Yan, S.S. (2010) Early deficits in
synaptic mitochondria in an Alzheimer's disease mouse model. Proc Natl Acad Sci U S A, 107,
18670-18675.
Dubey, R.C. (2014) Advanced biotechnology. S. Chand & Company Pvt. Ltd., New Delhi.
Elder, G.A., Gama Sosa, M.A. & De Gasperi, R. (2010) Transgenic mouse models of Alzheimer's
disease. Mt Sinai J Med, 77, 69-81.
Ettlinger, M., Margulis, E.H. & Wong, P.C. (2011) Implicit memory in music and language. Front
Psychol, 2, 211.
Evdokimov, E., Sharma, P., Lockett, S.J., Lualdi, M. & Kuehn, M.R. (2008) Loss of SUMO1 in mice
affects RanGAP1 localization and formation of PML nuclear bodies, but is not lethal as it can
be compensated by SUMO2 or SUMO3. J Cell Sci, 121, 4106-4113.
Fang, H., Du, X., Meng, F.T. & Zhou, J.N. (2011) SUMO negatively regulates BACE expression.
Neuro Endocrinol Lett, 32, 313-316.
Fatkin, D., MacRae, C., Sasaki, T., Wolff, M.R., Porcu, M., Frenneaux, M., Atherton, J., Vidaillet,
H.J., Jr., Spudich, S., De Girolami, U., Seidman, J.G., Seidman, C., Muntoni, F., Muehle, G.,
Johnson, W. & McDonough, B. (1999) Missense mutations in the rod domain of the lamin
A/C gene as causes of dilated cardiomyopathy and conduction-system disease. N Engl J Med,
341, 1715-1724.
Fei, E., Jia, N., Yan, M., Ying, Z., Sun, Q., Wang, H., Zhang, T., Ma, X., Ding, H., Yao, X., Shi, Y. &
Wang, G. (2006) SUMO-1 modification increases human SOD1 stability and aggregation.
Biochem Biophys Res Commun, 347, 406-412.
125
Feliciangeli, S., Bendahhou, S., Sandoz, G., Gounon, P., Reichold, M., Warth, R., Lazdunski, M.,
Barhanin, J. & Lesage, F. (2007) Does sumoylation control K2P1/TWIK1 background K+
channels? Cell, 130, 563-569.
Feliciangeli, S., Tardy, M.P., Sandoz, G., Chatelain, F.C., Warth, R., Barhanin, J., Bendahhou, S. &
Lesage, F. (2010) Potassium channel silencing by constitutive endocytosis and intracellular
sequestration. J Biol Chem, 285, 4798-4805.
Feligioni, M., Nishimune, A. & Henley, J.M. (2009) Protein SUMOylation modulates calcium influx
and glutamate release from presynaptic terminals. Eur J Neurosci, 29, 1348-1356.
Figueroa-Romero, C., Iniguez-Lluhi, J.A., Stadler, J., Chang, C.R., Arnoult, D., Keller, P.J., Hong, Y.,
Blackstone, C. & Feldman, E.L. (2009) SUMOylation of the mitochondrial fission protein
Drp1 occurs at multiple nonconsensus sites within the B domain and is linked to its activity
cycle. FASEB J, 23, 3917-3927.
Flotho, A. & Melchior, F. (2013) Sumoylation: a regulatory protein modification in health and disease.
Annu Rev Biochem, 82, 357-385.
Foran, E., Bogush, A., Goffredo, M., Roncaglia, P., Gustincich, S., Pasinelli, P. & Trotti, D. (2011)
Motor neuron impairment mediated by a sumoylated fragment of the glial glutamate
transporter EAAT2. Glia, 59, 1719-1731.
Games, D., Adams, D., Alessandrini, R., Barbour, R., Berthelette, P., Blackwell, C., Carr, T.,
Clemens, J., Donaldson, T., Gillespie, F. & et al. (1995) Alzheimer-type neuropathology in
transgenic mice overexpressing V717F beta-amyloid precursor protein. Nature, 373, 523-527.
Geiss-Friedlander, R. & Melchior, F. (2007) Concepts in sumoylation: a decade on. Nat Rev Mol Cell
Biol, 8, 947-956.
Gendreau, K.L. & Hall, G.F. (2013) Tangles, Toxicity, and Tau Secretion in AD - New Approaches to
a Vexing Problem. Front Neurol, 4, 160.
Gill, G. (2004) SUMO and ubiquitin in the nucleus: different functions, similar mechanisms? Genes
Dev, 18, 2046-2059.
Giorgino, F., de Robertis, O., Laviola, L., Montrone, C., Perrini, S., McCowen, K.C. & Smith, R.J.
(2000) The sentrin-conjugating enzyme mUbc9 interacts with GLUT4 and GLUT1 glucose
transporters and regulates transporter levels in skeletal muscle cells. Proc Natl Acad Sci U S A,
97, 1125-1130.
Girach, F., Craig, T.J., Rocca, D.L. & Henley, J.M. (2013) RIM1alpha SUMOylation is required for
fast synaptic vesicle exocytosis. Cell Rep, 5, 1294-1301.

126
Girdwood, D., Bumpass, D., Vaughan, O.A., Thain, A., Anderson, L.A., Snowden, A.W., Garcia-
Wilson, E., Perkins, N.D. & Hay, R.T. (2003) P300 transcriptional repression is mediated by
SUMO modification. Mol Cell, 11, 1043-1054.
Gocke, C.B., Yu, H. & Kang, J. (2005) Systematic identification and analysis of mammalian small
ubiquitin-like modifier substrates. J Biol Chem, 280, 5004-5012.
Golebiowski, F., Matic, I., Tatham, M.H., Cole, C., Yin, Y., Nakamura, A., Cox, J., Barton, G.J.,
Mann, M. & Hay, R.T. (2009) System-wide changes to SUMO modifications in response to
heat shock. Sci Signal, 2, ra24.
Gross, R.G. & Grossman, M. (2008) Update on apraxia. Curr Neurol Neurosci Rep, 8, 490-496.
Grupe, A., Abraham, R., Li, Y., Rowland, C., Hollingworth, P., Morgan, A., Jehu, L., Segurado, R.,
Stone, D., Schadt, E., Karnoub, M., Nowotny, P., Tacey, K., Catanese, J., Sninsky, J., Brayne,
C., Rubinsztein, D., Gill, M., Lawlor, B., Lovestone, S., Holmans, P., O'Donovan, M., Morris,
J.C., Thal, L., Goate, A., Owen, M.J. & Williams, J. (2007) Evidence for novel susceptibility
genes for late-onset Alzheimer's disease from a genome-wide association study of putative
functional variants. Hum Mol Genet, 16, 865-873.
Guo, C. & Henley, J.M. (2014) Wrestling with stress: roles of protein SUMOylation and
deSUMOylation in cell stress response. IUBMB Life, 66, 71-77.
Guo, C., Hildick, K.L., Luo, J., Dearden, L., Wilkinson, K.A. & Henley, J.M. (2013) SENP3-mediated
deSUMOylation of dynamin-related protein 1 promotes cell death following ischaemia.
EMBO J, 32, 1514-1528.
Guo, D., Li, M., Zhang, Y., Yang, P., Eckenrode, S., Hopkins, D., Zheng, W., Purohit, S., Podolsky,
R.H., Muir, A., Wang, J., Dong, Z., Brusko, T., Atkinson, M., Pozzilli, P., Zeidler, A., Raffel,
L.J., Jacob, C.O., Park, Y., Serrano-Rios, M., Larrad, M.T., Zhang, Z., Garchon, H.J., Bach,
J.F., Rotter, J.I., She, J.X. & Wang, C.Y. (2004) A functional variant of SUMO4, a new I
kappa B alpha modifier, is associated with type 1 diabetes. Nat Genet, 36, 837-841.
Gwizdek, C., Casse, F. & Martin, S. (2013) Protein sumoylation in brain development, neuronal
morphology and spinogenesis. Neuromolecular Med, 15, 677-691.
Haas, A.L., Ahrens, P., Bright, P.M. & Ankel, H. (1987) Interferon induces a 15-kilodalton protein
exhibiting marked homology to ubiquitin. J Biol Chem, 262, 11315-11323.
Hannich, J.T., Lewis, A., Kroetz, M.B., Li, S.J., Heide, H., Emili, A. & Hochstrasser, M. (2005)
Defining the SUMO-modified proteome by multiple approaches in Saccharomyces cerevisiae.
J Biol Chem, 280, 4102-4110.
Harder, Z., Zunino, R. & McBride, H. (2004) Sumo1 conjugates mitochondrial substrates and
participates in mitochondrial fission. Curr Biol, 14, 340-345.

127
Hasegawa, Y., Yoshida, D., Nakamura, Y. & Sakakibara, S. (2014) Spatiotemporal distribution of
SUMOylation components during mouse brain development. J Comp Neurol, 522, 3020-3036.
Hay, R.T. (2005) SUMO: a history of modification. Mol Cell, 18, 1-12.
Hayashi, T., Seki, M., Maeda, D., Wang, W., Kawabe, Y., Seki, T., Saitoh, H., Fukagawa, T., Yagi, H.
& Enomoto, T. (2002) Ubc9 is essential for viability of higher eukaryotic cells. Exp Cell Res,
280, 212-221.
Henley, J.M., Craig, T.J. & Wilkinson, K.A. (2014) Neuronal SUMOylation: mechanisms,
physiology, and roles in neuronal dysfunction. Physiol Rev, 94, 1249-1285.
Herrmann, J., Lerman, L.O. & Lerman, A. (2007) Ubiquitin and ubiquitin-like proteins in protein
regulation. Circ Res, 100, 1276-1291.
Herrup, K. (2015) The case for rejecting the amyloid cascade hypothesis. Nat Neurosci, 18, 794-799.
Hippius, H. & Neundorfer, G. (2003) The discovery of Alzheimer's disease. Dialogues Clin Neurosci,
5, 101-108.
Hochstrasser, M. (2009) Origin and function of ubiquitin-like proteins. Nature, 458, 422-429.
Holtzman, D.M., Bales, K.R., Tenkova, T., Fagan, A.M., Parsadanian, M., Sartorius, L.J., Mackey, B.,
Olney, J., McKeel, D., Wozniak, D. & Paul, S.M. (2000) Apolipoprotein E isoform-dependent
amyloid deposition and neuritic degeneration in a mouse model of Alzheimer's disease. Proc
Natl Acad Sci U S A, 97, 2892-2897.
Holtzman, D.M., Bales, K.R., Wu, S., Bhat, P., Parsadanian, M., Fagan, A.M., Chang, L.K., Sun, Y. &
Paul, S.M. (1999) Expression of human apolipoprotein E reduces amyloid-beta deposition in a
mouse model of Alzheimer's disease. J Clin Invest, 103, R15-R21.
Hoppe, J.B., Rattray, M., Tu, H., Salbego, C.G. & Cimarosti, H. (2013) SUMO-1 conjugation blocks
beta-amyloid-induced astrocyte reactivity. Neurosci Lett, 546, 51-56.
Hsiao, H.H., Meulmeester, E., Frank, B.T., Melchior, F. & Urlaub, H. (2009) "ChopNSpice," a mass
spectrometric approach that allows identification of endogenous small ubiquitin-like modifier-
conjugated peptides. Mol Cell Proteomics, 8, 2664-2675.
Hsiao, K., Chapman, P., Nilsen, S., Eckman, C., Harigaya, Y., Younkin, S., Yang, F. & Cole, G.
(1996) Correlative memory deficits, Abeta elevation, and amyloid plaques in transgenic mice.
Science, 274, 99-102.
Huang, J., Yan, J., Zhang, J., Zhu, S., Wang, Y., Shi, T., Zhu, C., Chen, C., Liu, X., Cheng, J.,
Mustelin, T., Feng, G.S., Chen, G. & Yu, J. (2012) SUMO1 modification of PTEN regulates
tumorigenesis by controlling its association with the plasma membrane. Nat Commun, 3, 911.

128
Huang, Y. & Mucke, L. (2012) Alzheimer mechanisms and therapeutic strategies. Cell, 148, 1204-
1222.
Jaafari, N., Konopacki, F.A., Owen, T.F., Kantamneni, S., Rubin, P., Craig, T.J., Wilkinson, K.A. &
Henley, J.M. (2013) SUMOylation is required for glycine-induced increases in AMPA
receptor surface expression (ChemLTP) in hippocampal neurons. PLoS One, 8, e52345.
Jakobs, P.M., Hanson, E.L., Crispell, K.A., Toy, W., Keegan, H., Schilling, K., Icenogle, T.B., Litt,
M. & Hershberger, R.E. (2001) Novel lamin A/C mutations in two families with dilated
cardiomyopathy and conduction system disease. J Card Fail, 7, 249-256.
Johnson, E.S. (2004) Protein modification by SUMO. Annu Rev Biochem, 73, 355-382.
Jones, D.H. & Matus, A.I. (1974) Isolation of synaptic plasma membrane from brain by combined
flotation-sedimentation density gradient centrifugation. Biochim Biophys Acta, 356, 276-287.
Kaminsky, R., Denison, C., Bening-Abu-Shach, U., Chisholm, A.D., Gygi, S.P. & Broday, L. (2009)
SUMO regulates the assembly and function of a cytoplasmic intermediate filament protein in
C. elegans. Dev Cell, 17, 724-735.
Kessler, J.D., Kahle, K.T., Sun, T., Meerbrey, K.L., Schlabach, M.R., Schmitt, E.M., Skinner, S.O.,
Xu, Q., Li, M.Z., Hartman, Z.C., Rao, M., Yu, P., Dominguez-Vidana, R., Liang, A.C.,
Solimini, N.L., Bernardi, R.J., Yu, B., Hsu, T., Golding, I., Luo, J., Osborne, C.K., Creighton,
C.J., Hilsenbeck, S.G., Schiff, R., Shaw, C.A., Elledge, S.J. & Westbrook, T.F. (2012) A
SUMOylation-dependent transcriptional subprogram is required for Myc-driven
tumorigenesis. Science, 335, 348-353.
Kho, C., Lee, A., Jeong, D., Oh, J.G., Chaanine, A.H., Kizana, E., Park, W.J. & Hajjar, R.J. (2011)
SUMO1-dependent modulation of SERCA2a in heart failure. Nature, 477, 601-605.
Kitazawa, M., Medeiros, R. & Laferla, F.M. (2012) Transgenic mouse models of Alzheimer disease:
developing a better model as a tool for therapeutic interventions. Curr Pharm Des, 18, 1131-
1147.
Komander, D. (2009) The emerging complexity of protein ubiquitination. Biochem Soc Trans, 37,
937-953.
Komander, D. & Rape, M. (2012) The ubiquitin code. Annu Rev Biochem, 81, 203-229.
Konopacki, F.A., Jaafari, N., Rocca, D.L., Wilkinson, K.A., Chamberlain, S., Rubin, P., Kantamneni,
S., Mellor, J.R. & Henley, J.M. (2011) Agonist-induced PKC phosphorylation regulates
GluK2 SUMOylation and kainate receptor endocytosis. Proc Natl Acad Sci U S A, 108,
19772-19777.
129
Krumova, P., Meulmeester, E., Garrido, M., Tirard, M., Hsiao, H.H., Bossis, G., Urlaub, H.,
Zweckstetter, M., Kugler, S., Melchior, F., Bahr, M. & Weishaupt, J.H. (2011) Sumoylation
inhibits alpha-synuclein aggregation and toxicity. J Cell Biol, 194, 49-60.
Krumova, P. & Weishaupt, J.H. (2013) Sumoylation in neurodegenerative diseases. Cell Mol Life Sci,
70, 2123-2138.
Kumar, S., Yoshida, Y. & Noda, M. (1993) Cloning of a cDNA which encodes a novel ubiquitin-like
protein. Biochem Biophys Res Commun, 195, 393-399.
Kummer, M.P. & Heneka, M.T. (2014) Truncated and modified amyloid-beta species. Alzheimers Res
Ther, 6, 28.
Kunadt, M., Eckermann, K., Stuendl, A., Gong, J., Russo, B., Strauss, K., Rai, S., Kugler, S., Falomir
Lockhart, L., Schwalbe, M., Krumova, P., Oliveira, L.M., Bahr, M., Mobius, W., Levin, J.,
Giese, A., Kruse, N., Mollenhauer, B., Geiss-Friedlander, R., Ludolph, A.C., Freischmidt, A.,
Feiler, M.S., Danzer, K.M., Zweckstetter, M., Jovin, T.M., Simons, M., Weishaupt, J.H. &
Schneider, A. (2015) Extracellular vesicle sorting of alpha-Synuclein is regulated by
sumoylation. Acta Neuropathol, 129, 695-713.
Lakso, M., Pichel, J.G., Gorman, J.R., Sauer, B., Okamoto, Y., Lee, E., Alt, F.W. & Westphal, H.
(1996) Efficient in vivo manipulation of mouse genomic sequences at the zygote stage. Proc
Natl Acad Sci U S A, 93, 5860-5865.
Leach, M.D., Stead, D.A., Argo, E. & Brown, A.J. (2011) Identification of sumoylation targets,
combined with inactivation of SMT3, reveals the impact of sumoylation upon growth,
morphology, and stress resistance in the pathogen Candida albicans. Mol Biol Cell, 22, 687-
702.
Lee, H.G., Zhu, X., Ghanbari, H.A., Ogawa, O., Raina, A.K., O'Neill, M.J., Perry, G. & Smith, M.A.
(2002) Differential regulation of glutamate receptors in Alzheimer's disease. Neurosignals, 11,
282-292.
Lee, J.S. & Thorgeirsson, S.S. (2004) Genome-scale profiling of gene expression in hepatocellular
carcinoma: classification, survival prediction, and identification of therapeutic targets.
Gastroenterology, 127, S51-55.
Lee, L., Dale, E., Staniszewski, A., Zhang, H., Saeed, F., Sakurai, M., Fa, M., Orozco, I., Michelassi,
F., Akpan, N., Lehrer, H. & Arancio, O. (2014) Regulation of synaptic plasticity and cognition
by SUMO in normal physiology and Alzheimer's disease. Sci Rep, 4, 7190.
Lee, L., Sakurai, M., Matsuzaki, S., Arancio, O. & Fraser, P. (2013) SUMO and Alzheimer's disease.
Neuromolecular Med, 15, 720-736.
Lee, Y.J., Miyake, S., Wakita, H., McMullen, D.C., Azuma, Y., Auh, S. & Hallenbeck, J.M. (2007)
Protein SUMOylation is massively increased in hibernation torpor and is critical for the

130
cytoprotection provided by ischemic preconditioning and hypothermia in SHSY5Y cells. J
Cereb Blood Flow Metab, 27, 950-962.
Lemere, C.A. & Masliah, E. (2010) Can Alzheimer disease be prevented by amyloid-beta
immunotherapy? Nat Rev Neurol, 6, 108-119.
Li, Y., Wang, H., Wang, S., Quon, D., Liu, Y.W. & Cordell, B. (2003) Positive and negative
regulation of APP amyloidogenesis by sumoylation. Proc Natl Acad Sci U S A, 100, 259-264.
Lindwall, G. & Cole, R.D. (1984) Phosphorylation affects the ability of tau protein to promote
microtubule assembly. J Biol Chem, 259, 5301-5305.
Liu, P., Jenkins, N.A. & Copeland, N.G. (2003) A highly efficient recombineering-based method for
generating conditional knockout mutations. Genome Res, 13, 476-484.
Loeb, K.R. & Haas, A.L. (1992) The interferon-inducible 15-kDa ubiquitin homolog conjugates to
intracellular proteins. J Biol Chem, 267, 7806-7813.
Loriol, C., Khayachi, A., Poupon, G., Gwizdek, C. & Martin, S. (2013) Activity-dependent regulation
of the sumoylation machinery in rat hippocampal neurons. Biol Cell, 105, 30-45.
Loriol, C., Parisot, J., Poupon, G., Gwizdek, C. & Martin, S. (2012) Developmental regulation and
spatiotemporal redistribution of the sumoylation machinery in the rat central nervous system.
PLoS One, 7, e33757.
Luan, Z., Liu, Y., Stuhlmiller, T.J., Marquez, J. & Garcia-Castro, M.I. (2013) SUMOylation of Pax7 is
essential for neural crest and muscle development. Cell Mol Life Sci, 70, 1793-1806.
Luo, H.B., Xia, Y.Y., Shu, X.J., Liu, Z.C., Feng, Y., Liu, X.H., Yu, G., Yin, G., Xiong, Y.S., Zeng,
K., Jiang, J., Ye, K., Wang, X.C. & Wang, J.Z. (2014) SUMOylation at K340 inhibits tau
degradation through deregulating its phosphorylation and ubiquitination. Proc Natl Acad Sci
U S A, 111, 16586-16591.
Manczak, M. & Reddy, P.H. (2012) Abnormal interaction between the mitochondrial fission protein
Drp1 and hyperphosphorylated tau in Alzheimer's disease neurons: implications for
mitochondrial dysfunction and neuronal damage. Hum Mol Genet, 21, 2538-2547.
Manns, J.R., Hopkins, R.O. & Squire, L.R. (2003) Semantic memory and the human hippocampus.
Neuron, 38, 127-133.
Martin, S., Nishimune, A., Mellor, J.R. & Henley, J.M. (2007a) SUMOylation regulates kainate-
receptor-mediated synaptic transmission. Nature, 447, 321-325.
Martin, S., Wilkinson, K.A., Nishimune, A. & Henley, J.M. (2007b) Emerging extranuclear roles of
protein SUMOylation in neuronal function and dysfunction. Nat Rev Neurosci, 8, 948-959.

131
Martins, W.C., Tasca, C.I. & Cimarosti, H. (2016) Battling Alzheimer's Disease: Targeting
SUMOylation-Mediated Pathways. Neurochem Res, 41, 568-578.
Matic, I., Schimmel, J., Hendriks, I.A., van Santen, M.A., van de Rijke, F., van Dam, H., Gnad, F.,
Mann, M. & Vertegaal, A.C. (2010) Site-specific identification of SUMO-2 targets in cells
reveals an inverted SUMOylation motif and a hydrophobic cluster SUMOylation motif. Mol
Cell, 39, 641-652.
Matic, I., van Hagen, M., Schimmel, J., Macek, B., Ogg, S.C., Tatham, M.H., Hay, R.T., Lamond,
A.I., Mann, M. & Vertegaal, A.C. (2008) In vivo identification of human small ubiquitin-like
modifier polymerization sites by high accuracy mass spectrometry and an in vitro to in vivo
strategy. Mol Cell Proteomics, 7, 132-144.
Matunis, M.J., Coutavas, E. & Blobel, G. (1996) A novel ubiquitin-like modification modulates the
partitioning of the Ran-GTPase-activating protein RanGAP1 between the cytosol and the
nuclear pore complex. J Cell Biol, 135, 1457-1470.
Maurer, K., Volk, S. & Gerbaldo, H. (1997) Auguste D and Alzheimer's disease. Lancet, 349, 1546-
1549.
McDoniels-Silvers, A.L., Nimri, C.F., Stoner, G.D., Lubet, R.A. & You, M. (2002) Differential gene
expression in human lung adenocarcinomas and squamous cell carcinomas. Clin Cancer Res,
8, 1127-1138.
McFadden, K., Hamilton, R.L., Insalaco, S.J., Lavine, L., Al-Mateen, M., Wang, G. & Wiley, C.A.
(2005) Neuronal intranuclear inclusion disease without polyglutamine inclusions in a child. J
Neuropathol Exp Neurol, 64, 545-552.
McLean, C.A., Cherny, R.A., Fraser, F.W., Fuller, S.J., Smith, M.J., Beyreuther, K., Bush, A.I. &
Masters, C.L. (1999) Soluble pool of Abeta amyloid as a determinant of severity of
neurodegeneration in Alzheimer's disease. Ann Neurol, 46, 860-866.
McMillan, L.E., Brown, J.T., Henley, J.M. & Cimarosti, H. (2011) Profiles of SUMO and ubiquitin
conjugation in an Alzheimer's disease model. Neurosci Lett, 502, 201-208.
Meluh, P.B. & Koshland, D. (1995) Evidence that the MIF2 gene of Saccharomyces cerevisiae
encodes a centromere protein with homology to the mammalian centromere protein CENP-C.
Mol Biol Cell, 6, 793-807.
Miller, M.J., Barrett-Wilt, G.A., Hua, Z. & Vierstra, R.D. (2010) Proteomic analyses identify a diverse
array of nuclear processes affected by small ubiquitin-like modifier conjugation in
Arabidopsis. Proc Natl Acad Sci U S A, 107, 16512-16517.
Minati, L., Edginton, T., Bruzzone, M.G. & Giaccone, G. (2009) Current concepts in Alzheimer's
disease: a multidisciplinary review. Am J Alzheimers Dis Other Demen, 24, 95-121.

132
Mo, Y.Y., Yu, Y., Theodosiou, E., Ee, P.L. & Beck, W.T. (2005) A role for Ubc9 in tumorigenesis.
Oncogene, 24, 2677-2683.
Morris, G.P., Clark, I.A. & Vissel, B. (2014) Inconsistencies and controversies surrounding the
amyloid hypothesis of Alzheimer's disease. Acta Neuropathol Commun, 2, 135.
Morrissette, D.A., Parachikova, A., Green, K.N. & LaFerla, F.M. (2009) Relevance of transgenic
mouse models to human Alzheimer disease. J Biol Chem, 284, 6033-6037.
Moschos, S.J. & Mo, Y.Y. (2006) Role of SUMO/Ubc9 in DNA damage repair and tumorigenesis. J
Mol Histol, 37, 309-319.
Moschos, S.J., Smith, A.P., Mandic, M., Athanassiou, C., Watson-Hurst, K., Jukic, D.M., Edington,
H.D., Kirkwood, J.M. & Becker, D. (2007) SAGE and antibody array analysis of melanoma-
infiltrated lymph nodes: identification of Ubc9 as an important molecule in advanced-stage
melanomas. Oncogene, 26, 4216-4225.
Mucke, L. & Selkoe, D.J. (2012) Neurotoxicity of amyloid beta-protein: synaptic and network
dysfunction. Cold Spring Harb Perspect Med, 2, a006338.
Mukherjee, S., Thomas, M., Dadgar, N., Lieberman, A.P. & Iniguez-Lluhi, J.A. (2009) Small
ubiquitin-like modifier (SUMO) modification of the androgen receptor attenuates
polyglutamine-mediated aggregation. J Biol Chem, 284, 21296-21306.
Nacerddine, K., Lehembre, F., Bhaumik, M., Artus, J., Cohen-Tannoudji, M., Babinet, C., Pandolfi,
P.P. & Dejean, A. (2005) The SUMO pathway is essential for nuclear integrity and
chromosome segregation in mice. Dev Cell, 9, 769-779.
Nie, M., Xie, Y., Loo, J.A. & Courey, A.J. (2009) Genetic and proteomic evidence for roles of
Drosophila SUMO in cell cycle control, Ras signaling, and early pattern formation. PLoS One,
4, e5905.
Nishida, T. & Yasuda, H. (2002) PIAS1 and PIASxalpha function as SUMO-E3 ligases toward
androgen receptor and repress androgen receptor-dependent transcription. J Biol Chem, 277,
41311-41317.
Nistico, R., Ferraina, C., Marconi, V., Blandini, F., Negri, L., Egebjerg, J. & Feligioni, M. (2014)
Age-related changes of protein SUMOylation balance in the AbetaPP Tg2576 mouse model of
Alzheimer's disease. Front Pharmacol, 5, 63.
O'Brien, R.J. & Wong, P.C. (2011) Amyloid precursor protein processing and Alzheimer's disease.
Annu Rev Neurosci, 34, 185-204.
Oakley, H., Cole, S.L., Logan, S., Maus, E., Shao, P., Craft, J., Guillozet-Bongaarts, A., Ohno, M.,
Disterhoft, J., Van Eldik, L., Berry, R. & Vassar, R. (2006) Intraneuronal beta-amyloid

133
aggregates, neurodegeneration, and neuron loss in transgenic mice with five familial
Alzheimer's disease mutations: potential factors in amyloid plaque formation. J Neurosci, 26,
10129-10140.
Oddo, S., Caccamo, A., Shepherd, J.D., Murphy, M.P., Golde, T.E., Kayed, R., Metherate, R.,
Mattson, M.P., Akbari, Y. & LaFerla, F.M. (2003) Triple-transgenic model of Alzheimer's
disease with plaques and tangles: intracellular Abeta and synaptic dysfunction. Neuron, 39,
409-421.
Onishi, A., Peng, G.H., Hsu, C., Alexis, U., Chen, S. & Blackshaw, S. (2009) Pias3-dependent
SUMOylation directs rod photoreceptor development. Neuron, 61, 234-246.
Onos, K.D., Sukoff Rizzo, S.J., Howell, G.R. & Sasner, M. (2016) Toward more predictive genetic
mouse models of Alzheimer's disease. Brain Res Bull, 122, 1-11.
Orias, M., Velazquez, H., Tung, F., Lee, G. & Desir, G.V. (1997) Cloning and localization of a
double-pore K channel, KCNK1: exclusive expression in distal nephron segments. Am J
Physiol, 273, F663-666.
Owerbach, D., McKay, E.M., Yeh, E.T., Gabbay, K.H. & Bohren, K.M. (2005) A proline-90 residue
unique to SUMO-4 prevents maturation and sumoylation. Biochem Biophys Res Commun,
337, 517-520.
Panse, V.G., Hardeland, U., Werner, T., Kuster, B. & Hurt, E. (2004) A proteome-wide approach
identifies sumoylated substrate proteins in yeast. J Biol Chem, 279, 41346-41351.
Pedrioli, P.G., Raught, B., Zhang, X.D., Rogers, R., Aitchison, J., Matunis, M. & Aebersold, R. (2006)
Automated identification of SUMOylation sites using mass spectrometry and SUMmOn
pattern recognition software. Nat Methods, 3, 533-539.
Perl, D.P. (2010) Neuropathology of Alzheimer's disease. Mt Sinai J Med, 77, 32-42.
Pichler, A., Gast, A., Seeler, J.S., Dejean, A. & Melchior, F. (2002) The nucleoporin RanBP2 has
SUMO1 E3 ligase activity. Cell, 108, 109-120.
Pichler, A., Knipscheer, P., Oberhofer, E., van Dijk, W.J., Korner, R., Olsen, J.V., Jentsch, S.,
Melchior, F. & Sixma, T.K. (2005) SUMO modification of the ubiquitin-conjugating enzyme
E2-25K. Nat Struct Mol Biol, 12, 264-269.
Pimplikar, S.W. (2009) Reassessing the amyloid cascade hypothesis of Alzheimer's disease. Int J
Biochem Cell Biol, 41, 1261-1268.
Plant, L.D., Dementieva, I.S., Kollewe, A., Olikara, S., Marks, J.D. & Goldstein, S.A. (2010) One
SUMO is sufficient to silence the dimeric potassium channel K2P1. Proc Natl Acad Sci U S A,
107, 10743-10748.

134
Poukka, H., Karvonen, U., Janne, O.A. & Palvimo, J.J. (2000) Covalent modification of the androgen
receptor by small ubiquitin-like modifier 1 (SUMO-1). Proc Natl Acad Sci U S A, 97, 14145-
14150.
Pountney, D.L., Huang, Y., Burns, R.J., Haan, E., Thompson, P.D., Blumbergs, P.C. & Gai, W.P.
(2003) SUMO-1 marks the nuclear inclusions in familial neuronal intranuclear inclusion
disease. Exp Neurol, 184, 436-446.
Prabakaran, S., Lippens, G., Steen, H. & Gunawardena, J. (2012) Post-translational modification:
nature's escape from genetic imprisonment and the basis for dynamic information encoding.
Wiley Interdiscip Rev Syst Biol Med, 4, 565-583.
Rajan, S., Plant, L.D., Rabin, M.L., Butler, M.H. & Goldstein, S.A. (2005) Sumoylation silences the
plasma membrane leak K+ channel K2P1. Cell, 121, 37-47.
Ren, Q.G., Liao, X.M., Chen, X.Q., Liu, G.P. & Wang, J.Z. (2007) Effects of tau phosphorylation on
proteasome activity. FEBS Lett, 581, 1521-1528.
Riley, B.E., Zoghbi, H.Y. & Orr, H.T. (2005) SUMOylation of the polyglutamine repeat protein,
ataxin-1, is dependent on a functional nuclear localization signal. J Biol Chem, 280, 21942-
21948.
Roger, J.E., Nellissery, J., Kim, D.S. & Swaroop, A. (2010) Sumoylation of bZIP transcription factor
NRL modulates target gene expression during photoreceptor differentiation. J Biol Chem, 285,
25637-25644.
Rosas-Acosta, G., Russell, W.K., Deyrieux, A., Russell, D.H. & Wilson, V.G. (2005) A universal
strategy for proteomic studies of SUMO and other ubiquitin-like modifiers. Mol Cell
Proteomics, 4, 56-72.
Sahin, U., de The, H. & Lallemand-Breitenbach, V. (2014) PML nuclear bodies: assembly and
oxidative stress-sensitive sumoylation. Nucleus, 5, 499-507.
Saito, T., Matsuba, Y., Mihira, N., Takano, J., Nilsson, P., Itohara, S., Iwata, N. & Saido, T.C. (2014)
Single App knock-in mouse models of Alzheimer's disease. Nat Neurosci, 17, 661-663.
Saitoh, H. & Hinchey, J. (2000) Functional heterogeneity of small ubiquitin-related protein modifiers
SUMO-1 versus SUMO-2/3. J Biol Chem, 275, 6252-6258.
Sakono, M. & Zako, T. (2010) Amyloid oligomers: formation and toxicity of Abeta oligomers. FEBS
J, 277, 1348-1358.
Sambrook, J. & Russell, D.W. (2001) Molecular cloning: A laboratory manual. Cold Spring Harbor
Laboratory Press, Cold Spring Harbor, NY.

135
Saracco, S.A., Miller, M.J., Kurepa, J. & Vierstra, R.D. (2007) Genetic analysis of SUMOylation in
Arabidopsis: conjugation of SUMO1 and SUMO2 to nuclear proteins is essential. Plant
Physiol, 145, 119-134.
Sarge, K.D. & Park-Sarge, O.K. (2009) Sumoylation and human disease pathogenesis. Trends
Biochem Sci, 34, 200-205.
Scheltens, P., Blennow, K., Breteler, M.M., de Strooper, B., Frisoni, G.B., Salloway, S. & Van der
Flier, W.M. (2016) Alzheimer's disease. Lancet.
Schilling, S., Zeitschel, U., Hoffmann, T., Heiser, U., Francke, M., Kehlen, A., Holzer, M., Hutter-
Paier, B., Prokesch, M., Windisch, M., Jagla, W., Schlenzig, D., Lindner, C., Rudolph, T.,
Reuter, G., Cynis, H., Montag, D., Demuth, H.U. & Rossner, S. (2008) Glutaminyl cyclase
inhibition attenuates pyroglutamate Abeta and Alzheimer's disease-like pathology. Nat Med,
14, 1106-1111.
Schmidtke, G., Aichem, A. & Groettrup, M. (2014) FAT10ylation as a signal for proteasomal
degradation. Biochim Biophys Acta, 1843, 97-102.
Serpell, L.C. (2000) Alzheimer's amyloid fibrils: structure and assembly. Biochim Biophys Acta, 1502,
16-30.
Serrano-Pozo, A., Frosch, M.P., Masliah, E. & Hyman, B.T. (2011) Neuropathological alterations in
Alzheimer disease. Cold Spring Harb Perspect Med, 1, a006189.
Shalizi, A., Gaudilliere, B., Yuan, Z., Stegmuller, J., Shirogane, T., Ge, Q., Tan, Y., Schulman, B.,
Harper, J.W. & Bonni, A. (2006) A calcium-regulated MEF2 sumoylation switch controls
postsynaptic differentiation. Science, 311, 1012-1017.
Shinbo, Y., Niki, T., Taira, T., Ooe, H., Takahashi-Niki, K., Maita, C., Seino, C., Iguchi-Ariga, S.M.
& Ariga, H. (2006) Proper SUMO-1 conjugation is essential to DJ-1 to exert its full activities.
Cell Death Differ, 13, 96-108.
Spires, T.L. & Hyman, B.T. (2005) Transgenic models of Alzheimer's disease: learning from animals.
NeuroRx, 2, 423-437.
Squire, L.R. (1992) Declarative and nondeclarative memory: multiple brain systems supporting
learning and memory. J Cogn Neurosci, 4, 232-243.
Steffan, J.S., Agrawal, N., Pallos, J., Rockabrand, E., Trotman, L.C., Slepko, N., Illes, K.,
Lukacsovich, T., Zhu, Y.Z., Cattaneo, E., Pandolfi, P.P., Thompson, L.M. & Marsh, J.L.
(2004) SUMO modification of Huntingtin and Huntington's disease pathology. Science, 304,
100-104.

136
Subramaniam, S., Sixt, K.M., Barrow, R. & Snyder, S.H. (2009) Rhes, a striatal specific protein,
mediates mutant-huntingtin cytotoxicity. Science, 324, 1327-1330.
Takahashi, K., Ishida, M., Komano, H. & Takahashi, H. (2008) SUMO-1 immunoreactivity co-
localizes with phospho-Tau in APP transgenic mice but not in mutant Tau transgenic mice.
Neurosci Lett, 441, 90-93.
Takahashi-Fujigasaki, J., Arai, K., Funata, N. & Fujigasaki, H. (2006) SUMOylation substrates in
neuronal intranuclear inclusion disease. Neuropathol Appl Neurobiol, 32, 92-100.
Tanaka, K., Nishide, J., Okazaki, K., Kato, H., Niwa, O., Nakagawa, T., Matsuda, H., Kawamukai, M.
& Murakami, Y. (1999) Characterization of a fission yeast SUMO-1 homologue, pmt3p,
required for multiple nuclear events, including the control of telomere length and chromosome
segregation. Mol Cell Biol, 19, 8660-8672.
Tang, L.T., Craig, T.J. & Henley, J.M. (2015) SUMOylation of synapsin Ia maintains synaptic vesicle
availability and is reduced in an autism mutation. Nat Commun, 6, 7728.
Tatham, M.H., Geoffroy, M.C., Shen, L., Plechanovova, A., Hattersley, N., Jaffray, E.G., Palvimo, J.J.
& Hay, R.T. (2008) RNF4 is a poly-SUMO-specific E3 ubiquitin ligase required for arsenic-
induced PML degradation. Nat Cell Biol, 10, 538-546.
Tatham, M.H., Jaffray, E., Vaughan, O.A., Desterro, J.M., Botting, C.H., Naismith, J.H. & Hay, R.T.
(2001) Polymeric chains of SUMO-2 and SUMO-3 are conjugated to protein substrates by
SAE1/SAE2 and Ubc9. J Biol Chem, 276, 35368-35374.
Tatham, M.H., Matic, I., Mann, M. & Hay, R.T. (2011) Comparative proteomic analysis identifies a
role for SUMO in protein quality control. Sci Signal, 4, rs4.
Thinakaran, G. & Koo, E.H. (2008) Amyloid precursor protein trafficking, processing, and function. J
Biol Chem, 283, 29615-29619.
Tirard, M., Hsiao, H.H., Nikolov, M., Urlaub, H., Melchior, F. & Brose, N. (2012) In vivo localization
and identification of SUMOylated proteins in the brain of His6-HA-SUMO1 knock-in mice.
Proc Natl Acad Sci U S A, 109, 21122-21127.
Valincius, G., Heinrich, F., Budvytyte, R., Vanderah, D.J., McGillivray, D.J., Sokolov, Y., Hall, J.E.
& Losche, M. (2008) Soluble amyloid beta-oligomers affect dielectric membrane properties
by bilayer insertion and domain formation: implications for cell toxicity. Biophys J, 95, 4845-
4861.
van der Veen, A.G. & Ploegh, H.L. (2012) Ubiquitin-like proteins. Annu Rev Biochem, 81, 323-357.
van Niekerk, E.A., Willis, D.E., Chang, J.H., Reumann, K., Heise, T. & Twiss, J.L. (2007)
Sumoylation in axons triggers retrograde transport of the RNA-binding protein La. Proc Natl
Acad Sci U S A, 104, 12913-12918.

137
Vertegaal, A.C. (2010) SUMO chains: polymeric signals. Biochem Soc Trans, 38, 46-49.
Vertegaal, A.C., Andersen, J.S., Ogg, S.C., Hay, R.T., Mann, M. & Lamond, A.I. (2006) Distinct and
overlapping sets of SUMO-1 and SUMO-2 target proteins revealed by quantitative
proteomics. Mol Cell Proteomics, 5, 2298-2310.
Vertegaal, A.C., Ogg, S.C., Jaffray, E., Rodriguez, M.S., Hay, R.T., Andersen, J.S., Mann, M. &
Lamond, A.I. (2004) A proteomic study of SUMO-2 target proteins. J Biol Chem, 279, 33791-
33798.
Vierstra, R.D. (2012) The expanding universe of ubiquitin and ubiquitin-like modifiers. Plant Physiol,
160, 2-14.
Wang, H.Y., Lee, D.H., D'Andrea, M.R., Peterson, P.A., Shank, R.P. & Reitz, A.B. (2000) beta-
Amyloid(1-42) binds to alpha7 nicotinic acetylcholine receptor with high affinity.
Implications for Alzheimer's disease pathology. J Biol Chem, 275, 5626-5632.
Wang, J.Z., Xia, Y.Y., Grundke-Iqbal, I. & Iqbal, K. (2013) Abnormal hyperphosphorylation of tau:
sites, regulation, and molecular mechanism of neurofibrillary degeneration. J Alzheimers Dis,
33 Suppl 1, S123-139.
Wang, L. & Banerjee, S. (2004) Differential PIAS3 expression in human malignancy. Oncol Rep, 11,
1319-1324.
Wang, L., Ma, Q., Yang, W., Mackensen, G.B. & Paschen, W. (2012) Moderate hypothermia induces
marked increase in levels and nuclear accumulation of SUMO2/3-conjugated proteins in
neurons. J Neurochem, 123, 349-359.
Wang, L., Wansleeben, C., Zhao, S., Miao, P., Paschen, W. & Yang, W. (2014) SUMO2 is essential
while SUMO3 is dispensable for mouse embryonic development. EMBO Rep, 15, 878-885.
Wang, X., Su, B., Lee, H.G., Li, X., Perry, G., Smith, M.A. & Zhu, X. (2009) Impaired balance of
mitochondrial fission and fusion in Alzheimer's disease. J Neurosci, 29, 9090-9103.
Watanabe, M., Takahashi, K., Tomizawa, K., Mizusawa, H. & Takahashi, H. (2008) Developmental
regulation of Ubc9 in the rat nervous system. Acta Biochim Pol, 55, 681-686.
Weeraratna, A.T., Kalehua, A., Deleon, I., Bertak, D., Maher, G., Wade, M.S., Lustig, A., Becker,
K.G., Wood, W., 3rd, Walker, D.G., Beach, T.G. & Taub, D.D. (2007) Alterations in
immunological and neurological gene expression patterns in Alzheimer's disease tissues. Exp
Cell Res, 313, 450-461.
Wei, W., Yang, P., Pang, J., Zhang, S., Wang, Y., Wang, M.H., Dong, Z., She, J.X. & Wang, C.Y.
(2008) A stress-dependent SUMO4 sumoylation of its substrate proteins. Biochem Biophys
Res Commun, 375, 454-459.

138
Weintraub, S., Wicklund, A.H. & Salmon, D.P. (2012) The neuropsychological profile of Alzheimer
disease. Cold Spring Harb Perspect Med, 2, a006171.
Werner, A., Flotho, A. & Melchior, F. (2012) The RanBP2/RanGAP1*SUMO1/Ubc9 complex is a
multisubunit SUMO E3 ligase. Mol Cell, 46, 287-298.
Wilkinson, C.R., Dittmar, G.A., Ohi, M.D., Uetz, P., Jones, N. & Finley, D. (2004) Ubiquitin-like
protein Hub1 is required for pre-mRNA splicing and localization of an essential splicing factor
in fission yeast. Curr Biol, 14, 2283-2288.
Wilkinson, K.A. & Henley, J.M. (2010) Mechanisms, regulation and consequences of protein
SUMOylation. Biochem J, 428, 133-145.
Wilkinson, K.A., Nakamura, Y. & Henley, J.M. (2010) Targets and consequences of protein
SUMOylation in neurons. Brain Res Rev, 64, 195-212.
Wirths, O. & Bayer, T.A. (2012) Intraneuronal Abeta accumulation and neurodegeneration: lessons
from transgenic models. Life Sci, 91, 1148-1152.
Wong, K.H., Todd, R.B., Oakley, B.R., Oakley, C.E., Hynes, M.J. & Davis, M.A. (2008) Sumoylation
in Aspergillus nidulans: sumO inactivation, overexpression and live-cell imaging. Fungal
Genet Biol, 45, 728-737.
Yamamoto, N., Matsubara, E., Maeda, S., Minagawa, H., Takashima, A., Maruyama, W., Michikawa,
M. & Yanagisawa, K. (2007) A ganglioside-induced toxic soluble Abeta assembly. Its
enhanced formation from Abeta bearing the Arctic mutation. J Biol Chem, 282, 2646-2655.
Yan, Q., Gong, L., Deng, M., Zhang, L., Sun, S., Liu, J., Ma, H., Yuan, D., Chen, P.C., Hu, X., Liu, J.,
Qin, J., Xiao, L., Huang, X.Q., Zhang, J. & Li, D.W. (2010) Sumoylation activates the
transcriptional activity of Pax-6, an important transcription factor for eye and brain
development. Proc Natl Acad Sci U S A, 107, 21034-21039.
Yang, M., Hsu, C.T., Ting, C.Y., Liu, L.F. & Hwang, J. (2006) Assembly of a polymeric chain of
SUMO1 on human topoisomerase I in vitro. J Biol Chem, 281, 8264-8274.
Yang, S.H., Jaffray, E., Hay, R.T. & Sharrocks, A.D. (2003) Dynamic interplay of the SUMO and
ERK pathways in regulating Elk-1 transcriptional activity. Mol Cell, 12, 63-74.
Yang, W., Ma, Q., Mackensen, G.B. & Paschen, W. (2009) Deep hypothermia markedly activates the
small ubiquitin-like modifier conjugation pathway; implications for the fate of cells exposed
to transient deep hypothermic cardiopulmonary bypass. J Cereb Blood Flow Metab, 29, 886-
890.
Yang, W. & Paschen, W. (2015) SUMO proteomics to decipher the SUMO-modified proteome
regulated by various diseases. Proteomics, 15, 1181-1191.

139
Yang, W., Sheng, H., Thompson, J.W., Zhao, S., Wang, L., Miao, P., Liu, X., Moseley, M.A. &
Paschen, W. (2014) Small ubiquitin-like modifier 3-modified proteome regulated by brain
ischemia in novel small ubiquitin-like modifier transgenic mice: putative protective
proteins/pathways. Stroke, 45, 1115-1122.
Yang, W., Sheng, H., Warner, D.S. & Paschen, W. (2008a) Transient focal cerebral ischemia induces
a dramatic activation of small ubiquitin-like modifier conjugation. J Cereb Blood Flow Metab,
28, 892-896.
Yang, W., Sheng, H., Warner, D.S. & Paschen, W. (2008b) Transient global cerebral ischemia induces
a massive increase in protein sumoylation. J Cereb Blood Flow Metab, 28, 269-279.
Yang, X. & Bassham, D.C. (2015) New Insight into the Mechanism and Function of Autophagy in
Plant Cells. Int Rev Cell Mol Biol, 320, 1-40.
Yun, S.M., Cho, S.J., Song, J.C., Song, S.Y., Jo, S.A., Jo, C., Yoon, K., Tanzi, R.E., Choi, E.J. & Koh,
Y.H. (2013) SUMO1 modulates Abeta generation via BACE1 accumulation. Neurobiol Aging,
34, 650-662.
Zhang, D. & Zhang, D.E. (2011) Interferon-stimulated gene 15 and the protein ISGylation system. J
Interferon Cytokine Res, 31, 119-130.
Zhang, F.P., Mikkonen, L., Toppari, J., Palvimo, J.J., Thesleff, I. & Janne, O.A. (2008) Sumo-1
function is dispensable in normal mouse development. Mol Cell Biol, 28, 5381-5390.
Zhang, Y.Q. & Sarge, K.D. (2008a) Sumoylation of amyloid precursor protein negatively regulates
Abeta aggregate levels. Biochem Biophys Res Commun, 374, 673-678.
Zhang, Y.Q. & Sarge, K.D. (2008b) Sumoylation regulates lamin A function and is lost in lamin A
mutants associated with familial cardiomyopathies. J Cell Biol, 182, 35-39.
Zhao, X.Y., Wang, D.D., Shan, Y. & Zhu, C.Q. (2013) [Potential involvement of abnormal increased
SUMO-1 in modulation of the formation of Alzheimer's disease senile plaques and neuritic
dystrophy in APP/PS1 transgenic mice]. Sheng Li Xue Bao, 65, 253-262.

140
Acknowledgements
First, I would like to express my gratitude to Prof. Dr. Nils Brose for accepting me as a
member of his department and for his excellent guidance and support.
I would like to thank my supervisor Dr. Marilyn Tirard for introducing me to many
laboratory techniques and for her constant help and encouragement.
I thank the members of my thesis committee Prof. Dr. Bayer and Dr. Judith Stegmüller
for their valuable input. I am also thankful to Prof. Dr. Bayer for providing the 5xFAD mouse
model of Alzheimer’s disease. Furthermore, I am grateful to Prof. Dr. Christian Griesinger,
Prof. Dr. Ralf Heinrich and Prof. Dr. Dr. Ehrenreich for agreeing to be part of my thesis
examination board.
I would like to thank Fritz Benseler, Christiane Harenberg, Dayana Schwerdtfeger,
Yvonne Thanhäuser and Maik Schlieper from the DNA Core Facility for their valuable help.
I would like to express my sincere gratitude to Klaus Hellmann who provided crucial
data with his biochemistry skills. Furthermore, I am very grateful to Dr. Matthieu Hammer
who introduced me into confocal microscopy imaging. I am also sincerely thankful to Dr.
Cordelia Imig who helped me with recombineering. I thank Xiaomin Zhang for her enormous
help with embryonic stem cell work.
I am extremely thankful to Jennifer Day, Dr. James Daniel and Dr. Silvia Ripamonti
from the SUMO group for always being ready to help.
I am also grateful to other members in the lab who have helped me during my PhD
work – Dr. Kerstin Reim, Sally Wegner, Dr. Noa Lipstein, Dr. Mateusz Ambrozkiewicz, Dr.
Tolga Soykan, Dr. Dilja Krüger. Furthermore, I would like to thank everybody else from the
Department of Molecular Neurobiology for their support and the friendly atmosphere.
I would also like to express my gratitude to Prof. Dr. Dr. Ehrenreich for her
continuous moral support and encouragement.
I thank my friends for being there for me even when times were tough.
I would like to thank my boyfriend for his love and extreme patience. Thank you for
putting up with me all that time.
And last but not least, I would like to express my gratitude to my family for believing
in me and loving me unconditionally. Without their encouragement, I would have never made
it.