analysis of productivity based on kpi case study
TRANSCRIPT

JOURNAL OF ENGINEERING AND MANAGEMENT IN
INDUSTRIAL SYSTEM VOL. 8 NO. 1 YEAR 2020
e-ISSN 2477-6025
DOI 10.21776/ub.jemis/2020.008.01.1
Cite this Article As Paduloh et al. (2020). Analysis Of Productivity Based On Kpi Case Study Automotive
Paint Industry. Journal of Engineering and Management in Industrial System, 8(1), p1-12 Paper Accepted : 19 May 2020
Paper Published : 28 May 2020
ANALYSIS OF PRODUCTIVITY BASED ON KPI CASE STUDY
AUTOMOTIVE PAINT INDUSTRY
Paduloh Paduloh1), Humiras Hardi Purba2) Industrial Engineering, Bhayangkara Jakarta Raya University
Bekasi, Indonesia1)
Industrial Engineering, Mercubuana University
Bekasi, Indonesia2)
Abstract: The automotive paint industry is very dependent on the automotive vehicle industry, whether it is
two-wheeled or four-wheeled. Competition between the paint industry is currently getting tougher with the
growth of several new companies, for that the company needs to know the level of productivity of the company
so that the company can compete with the hope that the higher level of productivity then the company can
provide competitive prices. This study measures productivity based on company KPI using the objective matrix
method. The results of the study found that the company's productivity is quite low and continues to decline.
Production often does not reach the target, which results in many products having empty stock, not achieving
the output due to a complicated approval process, this condition affects many instabilities in other aspects such
as overtime, waste, and electricity.
Keywords: Automotive Paint, Productivity, Key Performance Indicator, Objective Matrix, Improvement.
1. Introduction
Productivity is an essential factor that must
be maintained by the company in carrying out its
production process. Productivity is a measure of
the company's assessment to improve the
company's performance [1][2]. The better the
richness that the company has, it is expected that
the company will be able to provide products at
low prices and have good quality[3]. So that the
company can compete with similar companies.
[4][5] in his study studying the company's KPI as
a basis for improving the company's productivity
performance, where each variable was compared
to determine the level of corporate performance.
The company that is the object of research
is a manufacturing company engaged in the field
of Automotive Paint. The company commits to
being a market leader and able to compete with
similar companies in Indonesia. The current
condition of the company is that the company can
become the market leader by controlling 58% of
the four-wheel vehicle paint market. But the
company was only able to control the market by
12% for two-wheeled vehicles.
* Corresponding author. Email : [email protected]
Published online at http://jemis.ub.ac.id
Copyright ©2020 JTI UB Publishing. All Rights Reserved
Based on this condition, the company must make
improvements to the performance of the
company, to increase sales to be able to seize the
two-wheeled market.
The actual condition in the company is that
from January 2015 to June 2018, the production
achievement was smaller than sales, so that the
company experienced problems in meeting
customer demand. Under these conditions, the
company must make improvements so that the
productivity of the company increases, and the
company can have sufficient product stock to
meet customer demand. The company's
productivity control activities have only
calculated the ratio of the number of employees
working 1hours compared to the output
produced, and the company has never measured
the company's overall performance [6], [7]. So
that research to analyse productivity by using the
Objective Matrix method needs to be done where
productivity will be measured by comparing six
productivity ratios, which include efficiency and
productivity of labour, machinery, and energy
use. With these measurements, it is expected that
the company will get an overview of the actual
productivity that exists in the company.
The purpose of this study is to determine
the performance value of company productivity.

JOURNAL OF ENGINEERING AND MANAGEMENT IN
INDUSTRIAL SYSTEM VOL. 8 NO. 1 YEAR 2020
e-ISSN 2477-6025
DOI 10.21776/ub.jemis/2020.008.01.1
Cite this Article As Paduloh et al. (2020). Analysis Of Productivity Based On Kpi Case Study Automotive
Paint Industry. Journal of Engineering and Management in Industrial System, 8(1), p1-12 Paper Accepted : 19 May 2020
Paper Published : 28 May 2020
So that it can be known the priorities of indicators
that need improvement and can be given
improvement proposals that can build the
company's performance to be better and
following the targets expected by the company.
2. Methodology This study describes the condition of the
company based on existing data, then evaluate the Performance Productivity activity in the company's business by using the indicators. The indicator is the amount of production, the number of sales, stock of raw materials, bad stock, electricity usage, loss production, machine breakdown, overtime hours, product stock productivity, and productivity of washing solvent usage. By using AHP, Key Performance Indicator and Objective Matrix method, it is expected that it will obtain the results of an optimal productivity performance calculation[3], [4], [8]–[11]. Descriptive analysis is used because the author explains what is contained in theory and compares it with the daily events or operations of the company[12][13]. After data collection is carried out, the data is processed so that it can be input for the company's productivity measurements using the Objective Matrix method. Data processed using existing achievement data and data collected based on company conditions. While descriptively can be explained by the phenomenon of terms of production, product stock, and sales. Analysis using a questionnaire with a variable consisting of indicators[14], [15].
3. Result
3.1. Formation of objective criteria
The overall potential Objective of the
Company's Vision and Mission is:
1. Minimize defective products due to
process failure
2. Minimizing the product returned by the
customer
3. Efficient energy use
4. Efficient use of materials
5. Minimize engine breakdown
6. Cycle time efficiency
7. Minimizing overtime
8. Reducing the delay in the production
schedule
9. minimize the use of solvent washing per
month
10. Using raw materials of 100% SOC free.
There is Company Target must be
achieved by the Department in the company [4],
[16]:
Table 1. Key Performance Indicator
No Criteria KPI
1
Sales Actual/Month
100% Production
Achievement/Month
2 Sales Actual/Month
100% Sales Forecast/Month
3 Raw Material Stock/Month
100% Minimum Stock/Month
4
Bad Stock/Month 25% (from
Past Year)
Sales Qty/Month
5
Electricity/Month 0.1%
(from Past
Years)
Actual production
Qty/Month
6
Production Yield/Month 1 % (from
Past Years) Raw Material
Consumption/Month
7 Machine Breakdown/Month
0,0 Production Time Available
8
Overtime/Month 10% (from
Past Years) Total Production
time/Month
9
Actual Stock
Available/month 100%
Standard Stock/month
10
Total Solvent wash 1% (from
Past Years) Actual Production
Qty/Month
Based on the results of the productivity
data collection, the results of productivity
achievement are obtained when compared with
the actual months 1 to 6 of the productivity
evaluation period. There are achievements for
each criterion which can be seen in the following
discussion:
Productivity Criteria 1
Criteria 1:
Production Achievement/Month
Production Target/Month (1)
Table 2. Data Ratio for Criteria 1
Years Month
Production
Achievement
(Month /Ton)
Production
Target
(Month/Ton)
Rasio
(%)
20
17
January 1,341.00 1,700.00 78.9
February 1,283.00 1,529.41 83.9
March 1,200.00 1,616.13 74.3
April 1,383.00 1,472.43 93.9
May 1,322.00 1,216.10 108.7
JOURNAL OF ENGINEERING AND MANAGEMENT IN
INDUSTRIAL SYSTEM VOL. 8 NO. 1 YEAR 2020
e-ISSN 2477-6025
DOI 10.21776/ub.jemis.2020.008.01.1
Cite this Article As Paduloh et al. (2020). Analysis Of Productivity Based On Kpi Case Study Automotive
Paint Industry. Journal of Engineering and Management in Industrial System, 8(1), p1-12 Paper Accepted : 19 May 2020
Paper Published : 28 May 2020
June 1,251.00 1,420.00 88.1
July 1,362.60 1,372.80 99.3
August 1,045.61 1,270.00 82.3
September 1,425.04 1,700.00 83.8
October 1,502.14 1,630.00 92.2
November 1,344.40 1,600.00 84.02
December 1,209.26 1,500.00 80.62
Total 15,669.04 18,026.87
Average 2018 1,305.75 1,502.24 87.50
20
18
January 1,232.29 1,430.00 86.17
February 1,359.09 1,600.00 84.94
March 1,378.27 1,600.00 86.14
April 1,367.06 1,300.00 105.16
May 1,114.60 1,250.00 89.17
June 1,333.89 1,160.00 114.99
Total 9,090.94 9,842.24
Average 2018 1,297.53 1,390.00 94.43
Based on Table 2, the basic value or initial
standard value for this criterion is the number of
ratios in 2017 that is 87.5. This value is placed on
a scale score of 3 because it is the value of the
current performance scale in the OMAX table.
The target value for this criterion is based on the
company's KPI, which is 100. The target value is
placed on a scale of 10, which is the scale of
achievement to be achieved.
The values between the base value and the
target value are calculated by interpolation by
calculating the difference between the target
value and the base value, then divided by the
interval values between them.
Target value − base value
Interval =
= 100 − 87.5
7
= 1,78%
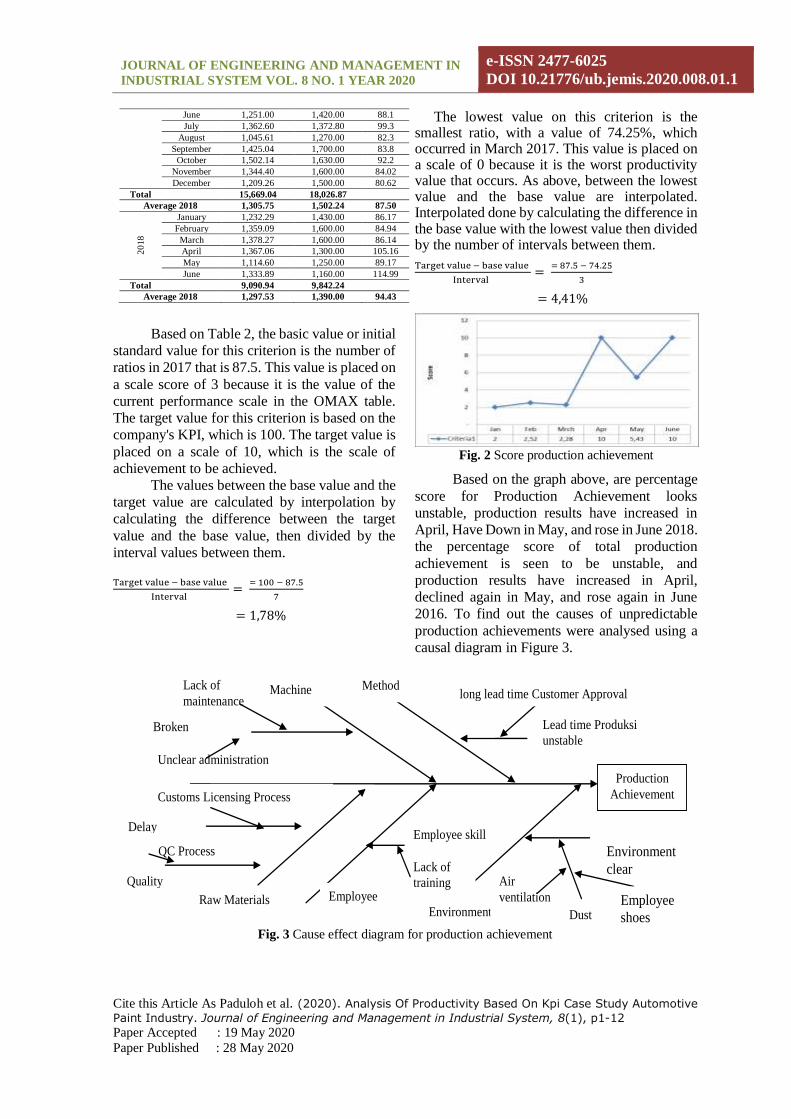
The lowest value on this criterion is the smallest ratio, with a value of 74.25%, which occurred in March 2017. This value is placed on a scale of 0 because it is the worst productivity value that occurs. As above, between the lowest value and the base value are interpolated. Interpolated done by calculating the difference in the base value with the lowest value then divided by the number of intervals between them.
Target value − base value
Interval =
= 87.5 − 74.25
3
= 4,41%
Fig. 2 Score production achievement
Based on the graph above, are percentage
score for Production Achievement looks
unstable, production results have increased in
April, Have Down in May, and rose in June 2018.
the percentage score of total production
achievement is seen to be unstable, and
production results have increased in April,
declined again in May, and rose again in June
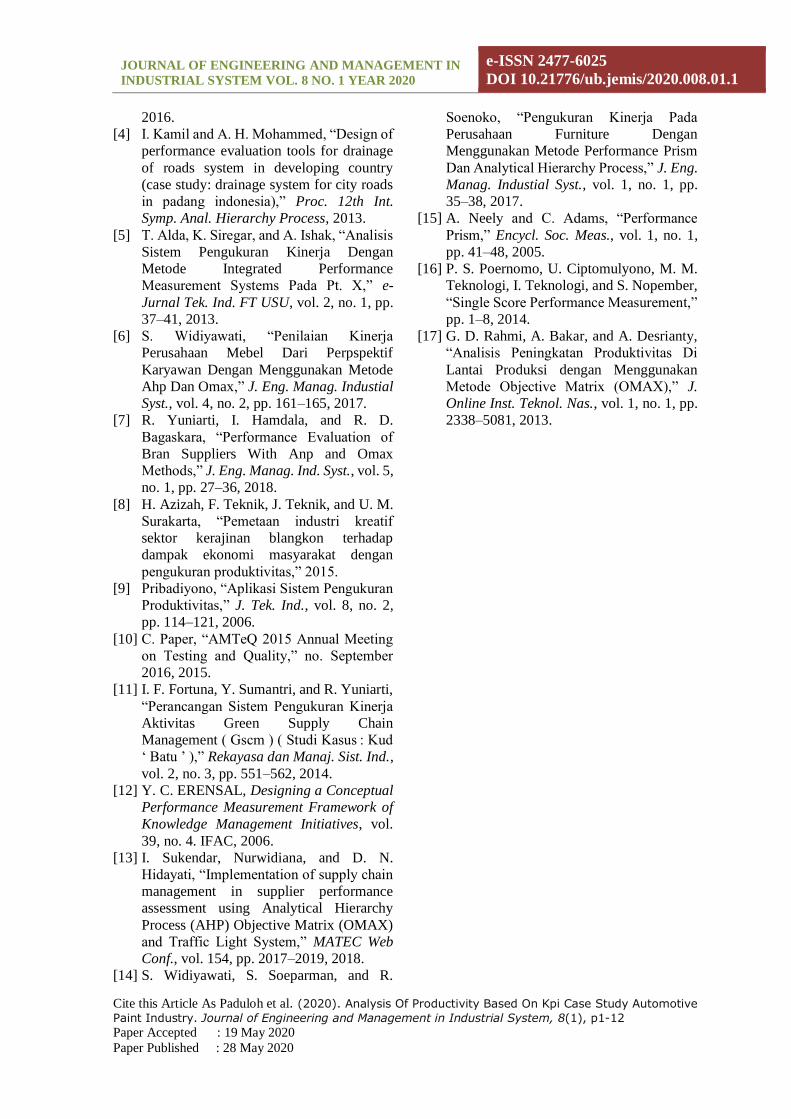
2016. To find out the causes of unpredictable
production achievements were analysed using a
causal diagram in Figure 3.
Fig. 3 Cause effect diagram for production achievement
Production
Achievement
Method Machine
Environment
Employee Raw Materials
Lead time Produksi
unstable
long lead time Customer Approval
Employee skill Delay
Environment
clear Quality
Broken
Dust Employee
shoes
Air
ventilation
Lack of
training
Lack of
maintenance
Unclear administration
Customs Licensing Process
QC Process

JOURNAL OF ENGINEERING AND MANAGEMENT IN
INDUSTRIAL SYSTEM VOL. 8 NO. 1 YEAR 2020
e-ISSN 2477-6025
DOI 10.21776/ub.jemis/2020.008.01.1
Cite this Article As Paduloh et al. (2020). Analysis Of Productivity Based On Kpi Case Study Automotive
Paint Industry. Journal of Engineering and Management in Industrial System, 8(1), p1-12 Paper Accepted : 19 May 2020
Paper Published : 28 May 2020
Based on the cause-effect diagram in
Figure 3, the production achievement is strongly
influenced by Customer Approval. Method for
the product being produced, the speed of the
Customer Approval process significantly affects
the production achievement. In other words, the
faster the approval for the proposed product, the
more production results obtained.
The condition of the machine also
dramatically influences the results of production.
The condition of the machine is not prime. Some
machines are often jammed so that they must be
repaired. Besides, the repair process requires a
long time because they have to wait for the
bidding process. The bidding process got the
approval of the directors of the costs incurred to
repair the machine. These conditions do not rule
out the possibility because the shape of the
engine is less maintenance and the age of the
machine that is relatively old.
Because paint products are susceptible to
environmental changes, contamination of dust,
silicon, and foreign matter can interfere with
product quality. The condition of the company is
quite clean at the moment. However, the
possibility of dust entering through raw
materials, production pallets, employee clothing,
and air movement is still massive, so the
company must have a huge commitment to
reduce the causes of the dirty production
environment.
For some products, the company relies
heavily on operator expertise, especially for
coloured paint products, for that training to
improve operational capability is very much
needed because of the more skilled the operator,
the faster the production lead time. The quality of
raw materials and delivery time from suppliers is
very influential in the achievement of production
targets. Supplier selection is needed to do by the
company, so in addition to considering the price
of raw materials, the company must also find the
quality of service and raw materials sent by the
supplier.
Productivity Criteria 2 Criteria 2:
Sales Actual/Month
Sales Forecast / Month (2)
Fig 4. The score of sales achievement
From the chart above, it can show that the
actual sales are below the sales forecast given,
this can show in January to April 2018 where
sales are far below the estimates provided, in
May the sales score was excellent which got a
score of 10 but returned to 2, 75 in June 2018.
The factors that influence the discrepancy
between the sales forecast and the actual are:
1. Only 10% of customers provide accurate
predictions, the rest of the forecasts given
are inappropriate. Besides, many
customers cannot provide forecasts, so the
estimated usage is based on the average
customer workload based on the average
usage of the last three months.
2. The condition of machines and working
tools in the customer is very influential in
the use of paint. If the tools and
environmental conditions are not suitable
can cause high production defects in the
customer so that this also affects the
demand for paint, this too often causes the
amount of paint usage not following the
forecast provided.
Productivity Criteria 3 Criteria 3:
Actual Stock Raw material/Month
Raw Material Stock Target/Month (3)
Fig 5. Chart of score raw material stock

JOURNAL OF ENGINEERING AND MANAGEMENT IN
INDUSTRIAL SYSTEM VOL. 8 NO. 1 YEAR 2020
e-ISSN 2477-6025
DOI 10.21776/ub.jemis.2020.008.01.1
Cite this Article As Paduloh et al. (2020). Analysis Of Productivity Based On Kpi Case Study Automotive
Paint Industry. Journal of Engineering and Management in Industrial System, 8(1), p1-12 Paper Accepted : 19 May 2020
Paper Published : 28 May 2020
Condition Stock of raw material is a
decline in January 2018. This condition is useful
to improve the raw material stock condition.
Company targets for the raw material stock as
KPI are 1-month stock. Matters affecting raw
material inventory include:
1. Forecast Sales, the lead time for ordering
raw materials, is, on average, two months,
so the purchase of raw materials is based
on the 2-month sales forecast issued by
the Dept. Sales marketing. The more
accurate the sales forecast is given, the
raw material inventory will also be more
specific.
2. Changes in Formulation, each product is
produced based on a formulation
determined by the Dept. Technical To
calculates the need for raw materials. The
calculation is based on sales forecasts and
formulations for the production of raw
materials so that any raw materials must
be provided. Changes to product
formulations will significantly affect the
supply of raw materials, so modifications
to formulations must be gradual, given the
average lead time for raw material
purchases is two months.
Productivity Criteria 4 Criteria 4:
Bad Stock/Month
Sales Qty/Month (4)
Fig 6. Score bad stock
The biggest challenge facing the company
is reducing the number of existing bad product
stocks in the company. Graph stock bad began
to increase in January 2018 with a score of 4.87
but continued to decline to reach a score of 0 in
April, May, June 2018, meaning that the target
for decreasing bad stock has never been reached
and tends to increase every month.
The biggest challenge faced by the
company is to reduce the number of B / C
products in the company. Graphic stock BC
began to increase in January 2016 with a score of
4.87, but it continued to decline until it reached a
score of 0 in April, May, June 2016 This means
that the target for the decline in B / C stock has
never been reached and tends to increase every
month. The product conditions categorized into
B / C are as follows:
1. Expired products and raw materials are
products and raw materials that have
expired so that the products and raw
materials cannot be used anymore and
cannot be sold to customers. The cause of
the product expiration is due to excess
stock caused by changes in product
formulation, excess inventory of raw
materials, inaccurate forecasts, and the
sudden cessation of product use at the
customer.
2. Abnormal Process, products produced
from the production process, but the
quality does not meet specifications. It
cannot be repaired, and abnormal
processes can be caused due to unclean
environmental factors, changes in machine
specifications, operator negligence
factors, and raw material factors that do
not match specifications.
3. Abnormal Quality is the condition of the
product whose quality does not meet
customer specifications at the time of
application in the customer's production
line. This condition can be influenced by
the customer's company environment and
machine conditions. So the product
specifications must be changed to follow
the terms in the customer's company.
Productivity Criteria 5
Criteria 5:
Electricity/Month
Actual Production Qty/Month (5)

JOURNAL OF ENGINEERING AND MANAGEMENT IN
INDUSTRIAL SYSTEM VOL. 8 NO. 1 YEAR 2020
e-ISSN 2477-6025
DOI 10.21776/ub.jemis/2020.008.01.1
Cite this Article As Paduloh et al. (2020). Analysis Of Productivity Based On Kpi Case Study Automotive
Paint Industry. Journal of Engineering and Management in Industrial System, 8(1), p1-12 Paper Accepted : 19 May 2020
Paper Published : 28 May 2020
Fig 7. The score of electricity usage per month
From the graph of energy usage above,
energy consumption can be concluded if energy
consumption is increasing from January 2016,
energy consumption is greater to stable in March
to June 2104 with an average score of 4. The
cause of the increase in energy consumption is
the use of new factories, namely plant 3. In
contrast, production targets and target sales do
not increase so that this energy consumption
increases because it is used for lighting, air
conditioners, elevators, and supporting machines
for factory operations 3.
Productivity Criteria 6 Criteria 6
Loss of Raw Material/Month
Total Raw Material Consumption/Month (6)
Fig 7. Score loss production
If seen from the graph of the score above
the efficiency of suppressing the occurrence of
raw material which is wasted increasingly
decreases, in January, February score is at
number four, while in March the score starts to
fall and in April to June 2018 falls on the most
exceptional score of 0. In terms of work
methods, the things that most influence the high
yield of production are:
a. The length of the production lead time
because products are manufactured using
volatile solvent raw materials. The longer
the production lead time, the more
evaporation occurs so that, the higher the
yield.
b. The production process must be carried
out efficiently. Raw materials must be
poured into the entire production tank, the
remaining material remaining in the drum
must also be drained so that the remaining
material in the packaging of raw materials
is getting less.
c. NG (Not Good) production process can
also contribute to production yield when
the product is reprocessed for repairs, the
amount of material lost due to packaging
changes, or waiting for the repair process
can also occur.
d. Product samples, to do a trial of paint (trial
production) required paint samples from
each lot, so the more often the prosecution
failed, the higher the yield.
Efforts to improve the discipline and skill
of operators must also continue to be carried out.
Operators must carry out the draining of raw
materials to the maximum. Besides, operator
skills also significantly affect production yields.
The higher the operator skills, the smaller the
production error, so that the production yield
will be lower.
Production yields can occur because of
weighing errors or incorrect product considering
conditions so that the contents of each can of
products are not the same. Affect return if the
product weight is much more substantial than
standard with the better condition of the
machine. The possibility of product failure is
also getting smaller, so preventive maintenance
must continue.
Productivity Criteria 7
Criteria 7
Machine Breakdown/Month
Total Raw Material Consumption/Month (7)
Fig 8. Score machine breakdown

JOURNAL OF ENGINEERING AND MANAGEMENT IN
INDUSTRIAL SYSTEM VOL. 8 NO. 1 YEAR 2020
e-ISSN 2477-6025
DOI 10.21776/ub.jemis.2020.008.01.1
Cite this Article As Paduloh et al. (2020). Analysis Of Productivity Based On Kpi Case Study Automotive
Paint Industry. Journal of Engineering and Management in Industrial System, 8(1), p1-12 Paper Accepted : 19 May 2020
Paper Published : 28 May 2020
From the above graph can be seen if the
engine breakdown has decreased, from a score of
zero in January 2018 to stable with a score of 10
from February to June 2018.
The cause of the engine breakdown that
occurs is the mechanical seal of the engine that
is leaking. The condition of the leak is caused by
a loose bolt so that when the N2 pressure is
smaller than the product, the engine will leak.
The thing to do is to check N2 regularly when it
will operate the machine.
Control and preventive maintenance on
the engine are still lacking so that the damage to
the machine cannot be known in advance. As a
result, the machine cannot be used in a few days.
Operational skills and discipline must be
improved so that the inspection of the machine
can be done periodically, not waiting for
complaints or the machine is already damaged.
Productivity Criteria 8 Criteria 8:
Total Overtime/Month
Total Production Time/Month (8)
Fig 9. Score overtime
From the graph above, it can be seen that the
percentage score for work efficiency is quite
good. It can also be seen the overtime graph
increases in February, March, and April and then
decreases again in May and June 2018, namely
the scores of 3.28 and 3.76. Overtime conditions
are usually used by companies to pursue
production targets, which are caused by not
achieving delivery targets to customers.
Overtime is also used to solve problems due to
abnormal production processes.
Productivity Criteria 9 Criteria 9:
Actual Stock Product/Month
Standard Stock Product/Month (9)
Fig 10. Score product stock condition
From the graph above, it can be seen that
the existing product stock cannot meet the
standards set by the company. In March and
April 2018, the product stock reached the lowest
level with a score of 0 and 0.09.
As for the things that affect the occurrence
of discrepancies in the product stock are:
1. The more accurate the forecast obtained,
the more precise the stock supply to meet
customer demand. It means that sales to
customers in accordance with projections
provided, no more and no less. Only 10%
of customers can accurately forecast.
2. For achieving production targets, Product
stock shortages are often caused because
production does not reach production
targets, so product stocks do not meet
standards.
Productivity Criteria 10 Criteria 10:
Washing Solvent Used/Month
Actual Total Production/Month (10)
Fig 11. Score washing solvent used
The use of washing solvents from the
graph above can be concluded to be very
unstable, using solvent washing is sometimes
very economical as in January, March, and April
but can be very wasteful as happened in June
2018. the use of the washing solvent is greatly
influenced by how difficult it is. The used

JOURNAL OF ENGINEERING AND MANAGEMENT IN
INDUSTRIAL SYSTEM VOL. 8 NO. 1 YEAR 2020
e-ISSN 2477-6025
DOI 10.21776/ub.jemis/2020.008.01.1
Cite this Article As Paduloh et al. (2020). Analysis Of Productivity Based On Kpi Case Study Automotive
Paint Industry. Journal of Engineering and Management in Industrial System, 8(1), p1-12 Paper Accepted : 19 May 2020
Paper Published : 28 May 2020
machines of the production process are washed
and cleaned. Usually, the longer the production
process, the more difficult the machine is cleaned
because dirt has dried so that the washing solvent
is used more and more. So that the more washing
solvents used, the more waste is produced.
3.2 Objective matrix data
In terms of the company's Productivity
Index in total. The results of the productivity
criteria data processing based on the analysis of
each criterion. We use ten productivity criteria
selected, which then compared the value of
performance in 2017 with conditions from
January to June 2018. then obtained indicators of
achievement of the current value, index
productivity, and productivity index changes in
the production process starting from January
2018 to June 2018 is presented in Table 5.
Table 3. Objective Matrix January 2018
Table 4. Objective Matrix February 2018
Present Value Before Value Productivity Index
370.66 0 0
No Criteria1 Criteria 2 Criteria3 Criteria4 Criteria5 Criteria6 Criteria7 Criteria8 Criteria9 Criteria10
Prod Sales Stok RM B/C Electricity Yield Breakdown OT Stock FG Waste
Target 100 100 100 0.25 0.1 1 0 10 100 1
Achv. 86.17 74 118.22 3.76 0.2503 1.1142 0.1354 98.45 94.24 0.9129
10 100 100 100 0.25 0.1 1 0 10 100 1
9 98,18 99,51
98.54 0.641 0.1403 1.0174 0.0014 24.52 100.03 1.0027
8 96,4 99,03
97.05 1.001 0.1773 1.0374 0.0029 39.06 100.055 1.005
7 94,62 98,55
95.56 1.361 0.2143 1.0574 0.0044 53.6 100.08 1.0073
6 92,84 98,07
94.07 1.721 0.251 1.0774 0.0059 68.14 100.105 1.0096
5 91,06 97,59
92.58 2.081 0.2883 1.0974 0.0074 82.68 100.13 1.0119
4 89,28 97,11
91.09 2.441 0.3253 1.117 0.0089 97.22 100.155 1.0142
3 87,5 96,63
89.6 2.801 0.3623 1.1374 0.0104 111.76 100.18 1.0165
2 83,09 91,93
83.3 2.971 0.3823 1.1864 0.0484 123.47 95.97 1.1135
1 78,68 87,23
77 3.141 0.4023 1.2354 0.0864 135.18 91.76 1.2105
0 79,3 82,52
70.61 3.304 0.4241 1.287 0.125 146.9 87.55 1.3063
Score
2.3
0
10
0
6.75
4.86
0
3.08
1.41
10
Weight 12 11.5 11.1 10.1 9.6 9.1 9.6 8.7 10.1 8.2
Value
27.6
0
111
0
64.8
44.226
0
26.796
14.241
82

JOURNAL OF ENGINEERING AND MANAGEMENT IN
INDUSTRIAL SYSTEM VOL. 8 NO. 1 YEAR 2020
e-ISSN 2477-6025
DOI 10.21776/ub.jemis.2020.008.01.1
Cite this Article As Paduloh et al. (2020). Analysis Of Productivity Based On Kpi Case Study Automotive
Paint Industry. Journal of Engineering and Management in Industrial System, 8(1), p1-12 Paper Accepted : 19 May 2020
Paper Published : 28 May 2020
The basis of the matrix is the calculation of
performance indicators (Employment
Indicators). The results of the comparison of
operations that can take place at the top of the
matrix body, then adjusted to the level of the
matrix body and then recorded in the value row
after being changed according to the existing
values. If there is a comparison between two
levels, interpolation is doing to find out the
numbers between the two values. Examples of
how to interpolate are as follows, an example
calculation in January 2016 for criterion 1:
Achievement Value: 86.17
The value is between column 2 with a value
of 82.47 and column 3 with a value of 87.5. The
interpolation calculation is as follows:
2 − 𝑋
3 − 𝑋=
87.5 − 86.17
82.47 − 86.17
2 − 𝑋
3 − 𝑋=
1.33
−3.7
X = 2.17
The number in the weight bar indicates the
degree of importance of each criterion to the
level of productivity measured. The weight is
multiplied by the top value (score) and then
recorded in the value row. The sum of these
values is a performance indicator of a certain
period. scale division consists of three levels,
namely:
1. Level 0
Is the lowest level recorded in the period,
in other words, the worst result or the
worst possible result achieved by each
criterion in that period?
3. Level 3
Are the results achieved under normal
conditions during the measurement
process?
4. Level 10
It contains realistic estimates of the best
results that may be achieved by the
company within a certain period or a
certain period. Thus level 3 is the basis for
the start of calculations in the OMAX
matrix.
The way to calculate the Productivity
Index is as follows, Example of February 2016
Productivity Index calculation:
Current Value: 426.17
Previous Value: 369.1
Productivity Index: 𝐶𝑢𝑟𝑟𝑒𝑛𝑡 𝑉𝑎𝑙𝑢𝑒−𝑃𝑟𝑒𝑣𝑖𝑜𝑢𝑠 𝑉𝑎𝑙𝑢𝑒
𝑃𝑟𝑒𝑣𝑖𝑜𝑢𝑠 𝑉𝑎𝑙𝑢𝑒 100%
426.17−369.1
369.1 100%
15.20 %
Tabel 4.28 Tabel OMAX bulan Februari 2016
No Criteria1 Criteria 2 Criteria3 Criteria4 Criteria5 Criteria6 Criteria7 Criteria8 Criteria9 Criteria10
Prod sales Stock RM B/C Electricity Yield Breakdown OT Stock FG Waste
Target 100 100 100 0.25 0.1 1 0 10 100 1
Achv. 84.9 93.5 88.9 2.4 0.3 1.1 0 137.5 102.0 1.2
10 100 100 100 0.25 0.1 1 0 10 100 1
9 98,18 99,51 98.54 0.641 0.1403 1.0174 0.0014 24.52 100.03 1.0027
8 96,4 99,03 97.05 1.001 0.1773 1.0374 0.0029 39.06 100.055 1.005
7 94,62 98,55 95.56 1.361 0.2143 1.0574 0.0044 53.6 100.08 1.0073
6 92,84 98,07 94.07 1.721 0.2513 1.0774 0.0059 68.14 100.105 1.0096
5 91,06 97,59 92.58 2.081 0.2883 1.0974 0.0074 82.68 100.13 1.0119
4 89,28 97,11 91.09 2.441 0.33 1.12 0.0089 97.22 100.155 1.0142
3 87,5 96,63 89.6 2.801 0.3623 1.1374 0.0104 111.76 100.18 1.0165
2 83,09 91,93 83.3 2.971 0.3823 1.1864 0.0484 123 95.97 1.1135
1 78,68 87,2 77 3.14 0.4023 1.2354 0.0864 135.18 91.76 1.2105
0 79,3 82,52 70.61 3.304 0.4241 1.287 0.1251 146.9 87.6 1.3063
Score
2,59
2,66 2.11 4.87 4.28 4.11 10 0.2 10 1.89
Weight 12 11,5 11.1 10.1 9.6 9.1 9.6 8.7 10.1 8.2
Value 31,08 30,59 23.421 49.187 41.088 37.401 96 1.74 101 15.498
Current Value Before Value Productivity Index
427.01 370.66 15.20%
10
0

JOURNAL OF ENGINEERING AND MANAGEMENT IN
INDUSTRIAL SYSTEM VOL. 8 NO. 1 YEAR 2020
e-ISSN 2477-6025
DOI 10.21776/ub.jemis/2020.008.01.1
Cite this Article As Paduloh et al. (2020). Analysis Of Productivity Based On Kpi Case Study Automotive
Paint Industry. Journal of Engineering and Management in Industrial System, 8(1), p1-12 Paper Accepted : 19 May 2020
Paper Published : 28 May 2020
Table 5. Productivity Index
Month Value Productivity
Index (%)
Index
Changes
(%)
January 370.66 0 0
February 427.01 15.20 15.2
March 323.18 -24.31 -39.51
April 356.9 10.43 -13.88
May 392.87 10.07 -0.36
June 377.84 -3.83 -13.9
Based on the table above, we can represent
the change in productivity as the chart below.
Fig 12. Productivity Index Chart
Productivity index chart in the Production
Department from January to June 2018. in
January 2018 the initial calculation period
changes in productivity index occur in March
2018 equal to -39.51%. with the current value of
323.18 this value has increased in April and May
2018 and declined again in June 2018 with a
productivity index - 13.9% and the present value
of 377.84 due to the human, method and
environmental factors.
3.3 Analysis Productivity
The highest productivity index occurred
in February 2018 at 15.2% and 427.01, the
current change in value. Still, the productivity
index above refers to the decline and increase,
of course, related to productivity criteria. It can
see from a pig. 12 above that the company has a
low productivity index. Based on the condition
of the company's productivity, the target of
improving the richness of the company can see
in Fig. 14, which shows the criteria for
productivity criteria every month. From the
graph, it can be seen what measures have
increased or decreased the overall productivity
index so that improvements can be made.
Fig 14. Score Total Productivity
Based on Fig. 14 all existing product
categories in the company can be seen that in
March 2018 all categories experienced a decline
in productivity, these conditions began to rise in
April 2018 except for the production
productivity index experienced a high increase
but in May 2018 when all other productivity
criteria rose again In fact, the upside
experienced by the criteria of production
productivity goes back down. And the same
thing also happened in the following month
when other criteria decreased, precisely the
production criteria again rose in June 2018.
Fig 15. Productivity Criteria Weight
Based on the calculation of the weight
derived from the questionnaire given to the
Management level. The most critical loads of
Objective matrix, in Fig.15. There are the
criteria of production achievement, monthly
sales achievement, availability of raw materials,
availability of product stock, bad stock,
breakdown of the machine, electricity usage,
Production Loss, Amount of Over Time and
Amount of Solvent Washing. Criteria for
Achievement of production is the most critical
factor that should affect other criteria. Still, from
the graph, it is found that the pattern is not
patterned following the increase in the amount
of production. When all criteria decreased,
production criteria stabilized from January to
March 2106 and experienced relatively high

JOURNAL OF ENGINEERING AND MANAGEMENT IN
INDUSTRIAL SYSTEM VOL. 8 NO. 1 YEAR 2020
e-ISSN 2477-6025
DOI 10.21776/ub.jemis.2020.008.01.1
Cite this Article As Paduloh et al. (2020). Analysis Of Productivity Based On Kpi Case Study Automotive
Paint Industry. Journal of Engineering and Management in Industrial System, 8(1), p1-12 Paper Accepted : 19 May 2020
Paper Published : 28 May 2020
growth in April 2106. Production activities were
influenced by the availability of raw materials,
which in the process caused maintenance costs,
electricity, employee overtime, waste, and costs
due to production loss. At the same time, bad
stock arises because of excess inventory of raw
materials that cause expiration, the excess of
damaged and expired finished products, and
products that fail in the production process.
Fig 16. Input-Output Model
To analyse the relationship of all
productivity criteria, the following is a
description of the relationship chart of all
productivity criteria that measured Fig. 16. In
the pattern of relations, it is illustrated that the
criteria for the amount of production affect the
rise and fall of productivity of other criteria. The
increase in production volume does not
necessarily affect the increase in the
productivity index of different criteria.
Production activities should be influenced by
the availability of raw materials, which in the
process causes maintenance costs, electricity,
over time, waste, and costs due to production
losses. Temporary bad stock (B / C Stock) arises
because of an excess inventory of raw materials,
which causes expiration, excess damaged and
expired finished products and products that fail
in the production process.
From figure 16, it can also be obtained
that bad stock can come from unused raw
materials in the end, unacceptable production
processes and final products that are damaged
due to expiration. Also, available products that
do not meet the specifications are then offered.
What if the company wants to improve
productivity? Not only at the level of the
production process such as the efficiency of
electricity costs, overtime, waste, production
losses, maintenance costs, but also the company
must overcome the emergence of bad stock
resulting from raw materials, damaged and
expired products, and opinions from customers
for various reasons.
4. Conclusion
Based on the results of the analysis of the
productivity of the company that does not
achieve the company targets, the lowest
productivity occurred in March 2018, and there
was a slight increase in April to June 2018.
Based on the weighting of the criteria, the
number of productions should affect other
productivity aspects such as sales, employee
overtime, raw materials, electricity, production
loss, which occurs within the company. Still, the
increase in production productivity does not
affect other productivity. When production
productivity rose, the productivity of other
supporters decreased. These different conditions
indicate that the productivity of the amount of
production can continue to be improved and
make more robust controls for other activities in
line with production activities.
Further research advice is to conduct
more in-depth research on factors that affect
production productivity from the amount of
production, to obtain the right correlation and
make continuous improvements to other factors.
References
[1] P. Fithri and I. Firdaus, “Analisis
Produktivitas Menggunakan Metoda
Objective Matrix (OMAX) (Studi Kasus:
PT. Moradon Berlian Sakti),” J. Optimasi
Sist. Ind., vol. 13, no. 1, pp. 548–555, 2014.
[2] D. Balkan, “Enterprise Productivity
Measurement in Services by OMAX (
Objective Matrix ) Method and An
Application with Turkish Emergency,”
Reser Conf. Product. Serv. Next Gen–
Beyond Output/Input, pp. 1–13, 2011.
[3] M. A. Pfannstiel, “Bayreuth Productivity
Analysis-a method for ascertaining and
improving the holistic service productivity
of acute care hospitals,” Int. J. Health
Plann. Manage., vol. 31, no. 1, pp. 65–86,
JOURNAL OF ENGINEERING AND MANAGEMENT IN
INDUSTRIAL SYSTEM VOL. 8 NO. 1 YEAR 2020
e-ISSN 2477-6025
DOI 10.21776/ub.jemis/2020.008.01.1
Cite this Article As Paduloh et al. (2020). Analysis Of Productivity Based On Kpi Case Study Automotive
Paint Industry. Journal of Engineering and Management in Industrial System, 8(1), p1-12 Paper Accepted : 19 May 2020
Paper Published : 28 May 2020
2016.
[4] I. Kamil and A. H. Mohammed, “Design of
performance evaluation tools for drainage
of roads system in developing country
(case study: drainage system for city roads
in padang indonesia),” Proc. 12th Int.
Symp. Anal. Hierarchy Process, 2013.
[5] T. Alda, K. Siregar, and A. Ishak, “Analisis
Sistem Pengukuran Kinerja Dengan
Metode Integrated Performance
Measurement Systems Pada Pt. X,” e-
Jurnal Tek. Ind. FT USU, vol. 2, no. 1, pp.
37–41, 2013.
[6] S. Widiyawati, “Penilaian Kinerja
Perusahaan Mebel Dari Perpspektif
Karyawan Dengan Menggunakan Metode
Ahp Dan Omax,” J. Eng. Manag. Industial
Syst., vol. 4, no. 2, pp. 161–165, 2017.
[7] R. Yuniarti, I. Hamdala, and R. D.
Bagaskara, “Performance Evaluation of
Bran Suppliers With Anp and Omax
Methods,” J. Eng. Manag. Ind. Syst., vol. 5,
no. 1, pp. 27–36, 2018.
[8] H. Azizah, F. Teknik, J. Teknik, and U. M.
Surakarta, “Pemetaan industri kreatif
sektor kerajinan blangkon terhadap
dampak ekonomi masyarakat dengan
pengukuran produktivitas,” 2015.
[9] Pribadiyono, “Aplikasi Sistem Pengukuran
Produktivitas,” J. Tek. Ind., vol. 8, no. 2,
pp. 114–121, 2006.
[10] C. Paper, “AMTeQ 2015 Annual Meeting
on Testing and Quality,” no. September
2016, 2015.
[11] I. F. Fortuna, Y. Sumantri, and R. Yuniarti,
“Perancangan Sistem Pengukuran Kinerja
Aktivitas Green Supply Chain
Management ( Gscm ) ( Studi Kasus : Kud
‘ Batu ’ ),” Rekayasa dan Manaj. Sist. Ind.,
vol. 2, no. 3, pp. 551–562, 2014.
[12] Y. C. ERENSAL, Designing a Conceptual
Performance Measurement Framework of
Knowledge Management Initiatives, vol.
39, no. 4. IFAC, 2006.
[13] I. Sukendar, Nurwidiana, and D. N.
Hidayati, “Implementation of supply chain
management in supplier performance
assessment using Analytical Hierarchy
Process (AHP) Objective Matrix (OMAX)
and Traffic Light System,” MATEC Web
Conf., vol. 154, pp. 2017–2019, 2018.
[14] S. Widiyawati, S. Soeparman, and R.
Soenoko, “Pengukuran Kinerja Pada
Perusahaan Furniture Dengan
Menggunakan Metode Performance Prism
Dan Analytical Hierarchy Process,” J. Eng.
Manag. Industial Syst., vol. 1, no. 1, pp.
35–38, 2017.
[15] A. Neely and C. Adams, “Performance
Prism,” Encycl. Soc. Meas., vol. 1, no. 1,
pp. 41–48, 2005.
[16] P. S. Poernomo, U. Ciptomulyono, M. M.
Teknologi, I. Teknologi, and S. Nopember,
“Single Score Performance Measurement,”
pp. 1–8, 2014.
[17] G. D. Rahmi, A. Bakar, and A. Desrianty,
“Analisis Peningkatan Produktivitas Di
Lantai Produksi dengan Menggunakan
Metode Objective Matrix (OMAX),” J.
Online Inst. Teknol. Nas., vol. 1, no. 1, pp.
2338–5081, 2013.