analysis of operational strategies for utilizing co2 for ...€¦ · analysis of operational...
TRANSCRIPT

PROCEEDINGS, Thirty-Eighth Workshop on Geothermal Reservoir Engineering
Stanford University, Stanford, California, February 11-13, 2013
SGP-TR-198
ANALYSIS OF OPERATIONAL STRATEGIES FOR UTILIZING CO2 FOR GEOTHERMAL
ENERGY PRODUCTION
Thomas A. Buscheck1, Mingjie Chen
1, Chuanhe Lu
1, Yunwei Sun
1, Yue Hao
1, Michael A. Celia
2,
Thomas R. Elliot2, Hyungjin Choi
3, and Jeffrey M. Bielicki
3
1Lawrence Livermore National Laboratory (LLNL)
P.O. Box 808, L-223, Livermore CA 94550, USA, e-mail: [email protected] 2Department of Civil and Environmental Engineering, Princeton University, Princeton, NJ USA
3University of Minnesota, Minneapolis, MN USA
ABSTRACT
Geothermal energy production can be limited by
insufficient working fluid and pressure depletion,
whereas geologic CO2 storage (GCS) can be limited
by overpressure, which may drive CO2 leakage and
cause induced seismicity. Integration of these
complementary systems can realize synergy,
enhancing the viability of each system. While most
research on CO2-based geothermal systems has
emphasized using CO2 as a heat-transfer working
fluid, it is possible to also use CO2 as a supplemental
pressure-support fluid to generate artesian pressures
at the CO2 and brine producers. A well pattern
consisting of a minimum of four concentric rings of
horizontal producers and injectors is proposed to
conserve pressure from the injection process,
minimize loss of CO2, control the lateral extent of
overpressure, and segregate the CO2 and brine
production zones. We present simulations of this
approach for an idealized reservoir model, consisting
of a relatively permeable sedimentary formation,
confined by two impermeable confining units.
Consideration of more realistic (heterogeneous)
geologic settings and wellbore flow effects will be
necessary to more rigorously evaluate the potential
economic advantages of this approach.
INTRODUCTION
Economic viability of geothermal energy production
requires a resource with high enough temperature,
which will yield individual well flow rates sufficient
to justify project development costs. Geothermal
energy production can be limited by insufficient
working fluid and pressure depletion. This depletion
increases the parasitic cost of powering the fluid
recirculation system, which can include the expense
of submersible pumps. Sedimentary basins are often
associated with low resource temperatures; however, such
resources have the advantages of higher permeability,
compared to typical hydrothermal systems, together with
much of that being matrix (rather than fracture)
permeability. Because of their high permeability, these
basins may be used for geologic CO2 storage (GCS).
The NATCARB Regional Carbon Sequestration
Partnership (RCSP) database (Carr et al., 2007) has
identified extensive regions suitable for GCS. A
significant subset of this area has high enough
temperature to be of economic value for CO2-based
geothermal energy production (Elliot et al., 2013).
Geothermal energy production and GCS can contribute
to lowering atmospheric CO2 emissions, necessary for
mitigating climate change (IPPC, 2005; Socolow and
Pacala, 2006). For large-scale GCS, overpressure can
limit the ability to store CO2, while geothermal energy
production can be limited by pressure depletion
(Buscheck et al., 2012a; 2012b; 2012c). It is possible to
synergistically integrate these systems, with CO2
injection providing pressure support to maintain the
productivity of geothermal brine producers, while the
net loss of brine provides pressure relief and improved
injectivity for CO2 injectors.
Enhanced geothermal energy systems (EGS), a
geothermal concept using CO2 instead of water as the
working fluid was first proposed by Brown (2000).
Pruess (2006) followed up on his idea by analyzing
reservoir behavior and found CO2 to be superior to
water in mining heat from hot fractured rock,
including reduced parasitic power consumption to
drive the fluid recirculation system. This concept has
been extended to GCS in sedimentary formations
(Randolph and Saar, 2011a; 2011b; 2011c; Saar et
al., 2010), which they call a CO2-Plume Geothermal
(CPG) system, to distinguish it from CO2-enabled
EGS in crystalline rock. Because it is targeted for
large, porous, permeable sedimentary basins, CPG can
result in more CO2 sequestration and more heat
extraction than CO2-based EGS in crystalline rock.
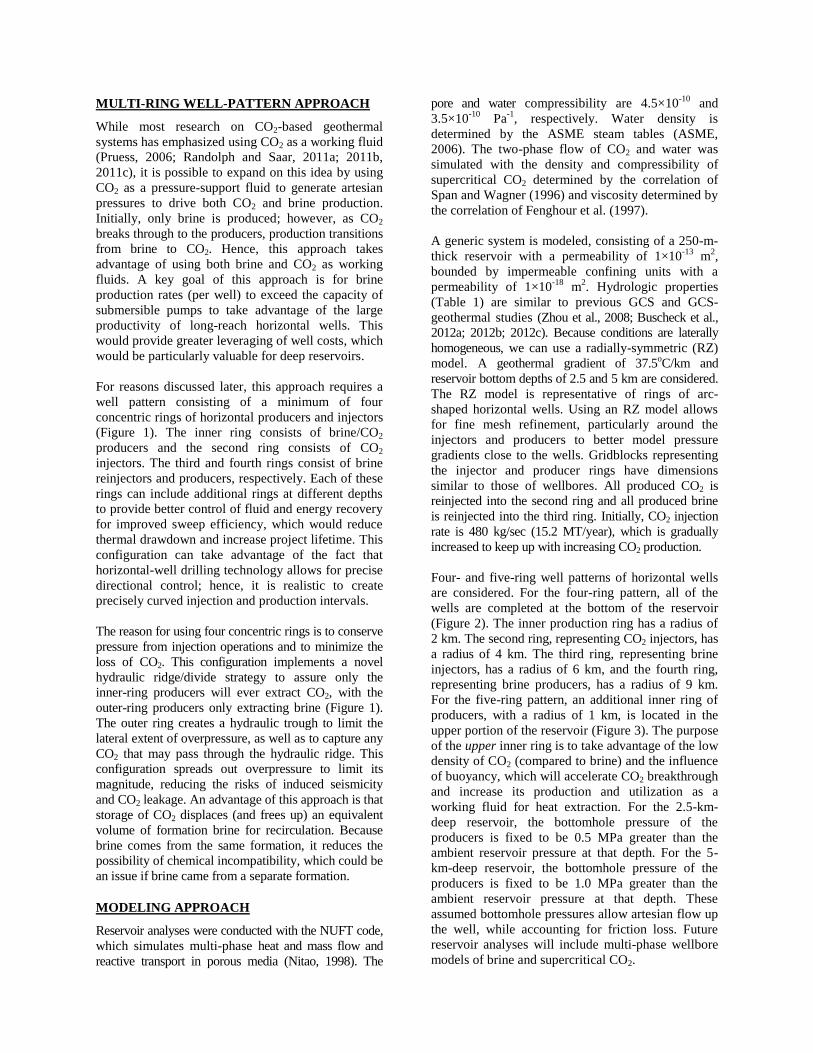
MULTI-RING WELL-PATTERN APPROACH
While most research on CO2-based geothermal
systems has emphasized using CO2 as a working fluid
(Pruess, 2006; Randolph and Saar, 2011a; 2011b,
2011c), it is possible to expand on this idea by using
CO2 as a pressure-support fluid to generate artesian
pressures to drive both CO2 and brine production.
Initially, only brine is produced; however, as CO2
breaks through to the producers, production transitions
from brine to CO2. Hence, this approach takes
advantage of using both brine and CO2 as working
fluids. A key goal of this approach is for brine
production rates (per well) to exceed the capacity of
submersible pumps to take advantage of the large
productivity of long-reach horizontal wells. This
would provide greater leveraging of well costs, which
would be particularly valuable for deep reservoirs.
For reasons discussed later, this approach requires a
well pattern consisting of a minimum of four
concentric rings of horizontal producers and injectors
(Figure 1). The inner ring consists of brine/CO2
producers and the second ring consists of CO2
injectors. The third and fourth rings consist of brine
reinjectors and producers, respectively. Each of these
rings can include additional rings at different depths
to provide better control of fluid and energy recovery
for improved sweep efficiency, which would reduce
thermal drawdown and increase project lifetime. This
configuration can take advantage of the fact that
horizontal-well drilling technology allows for precise
directional control; hence, it is realistic to create
precisely curved injection and production intervals.
The reason for using four concentric rings is to conserve
pressure from injection operations and to minimize the
loss of CO2. This configuration implements a novel
hydraulic ridge/divide strategy to assure only the
inner-ring producers will ever extract CO2, with the
outer-ring producers only extracting brine (Figure 1).
The outer ring creates a hydraulic trough to limit the
lateral extent of overpressure, as well as to capture any
CO2 that may pass through the hydraulic ridge. This
configuration spreads out overpressure to limit its
magnitude, reducing the risks of induced seismicity
and CO2 leakage. An advantage of this approach is that
storage of CO2 displaces (and frees up) an equivalent
volume of formation brine for recirculation. Because
brine comes from the same formation, it reduces the
possibility of chemical incompatibility, which could be
an issue if brine came from a separate formation.
MODELING APPROACH
Reservoir analyses were conducted with the NUFT code,
which simulates multi-phase heat and mass flow and
reactive transport in porous media (Nitao, 1998). The
pore and water compressibility are 4.5×10⁻¹⁰
and
3.5×10⁻¹⁰
Pa-1
, respectively. Water density is
determined by the ASME steam tables (ASME,
2006). The two-phase flow of CO2 and water was
simulated with the density and compressibility of
supercritical CO2 determined by the correlation of
Span and Wagner (1996) and viscosity determined by
the correlation of Fenghour et al. (1997).
A generic system is modeled, consisting of a 250-m-
thick reservoir with a permeability of 1×10-13
m2,
bounded by impermeable confining units with a
permeability of 1×10-18
m2. Hydrologic properties
(Table 1) are similar to previous GCS and GCS-
geothermal studies (Zhou et al., 2008; Buscheck et al.,
2012a; 2012b; 2012c). Because conditions are laterally
homogeneous, we can use a radially-symmetric (RZ)
model. A geothermal gradient of 37.5oC/km and
reservoir bottom depths of 2.5 and 5 km are considered.
The RZ model is representative of rings of arc-
shaped horizontal wells. Using an RZ model allows
for fine mesh refinement, particularly around the
injectors and producers to better model pressure
gradients close to the wells. Gridblocks representing
the injector and producer rings have dimensions
similar to those of wellbores. All produced CO2 is
reinjected into the second ring and all produced brine
is reinjected into the third ring. Initially, CO2 injection
rate is 480 kg/sec (15.2 MT/year), which is gradually
increased to keep up with increasing CO2 production.
Four- and five-ring well patterns of horizontal wells
are considered. For the four-ring pattern, all of the
wells are completed at the bottom of the reservoir
(Figure 2). The inner production ring has a radius of
2 km. The second ring, representing CO2 injectors, has
a radius of 4 km. The third ring, representing brine
injectors, has a radius of 6 km, and the fourth ring,
representing brine producers, has a radius of 9 km.
For the five-ring pattern, an additional inner ring of
producers, with a radius of 1 km, is located in the
upper portion of the reservoir (Figure 3). The purpose
of the upper inner ring is to take advantage of the low
density of CO2 (compared to brine) and the influence
of buoyancy, which will accelerate CO2 breakthrough
and increase its production and utilization as a
working fluid for heat extraction. For the 2.5-km-
deep reservoir, the bottomhole pressure of the
producers is fixed to be 0.5 MPa greater than the
ambient reservoir pressure at that depth. For the 5-
km-deep reservoir, the bottomhole pressure of the
producers is fixed to be 1.0 MPa greater than the
ambient reservoir pressure at that depth. These
assumed bottomhole pressures allow artesian flow up
the well, while accounting for friction loss. Future
reservoir analyses will include multi-phase wellbore
models of brine and supercritical CO2.

Figure 1: Overpressure P at 10 years, at the elevation of the injectors and lower producers, for a reservoir
bottom depth of 2.5 km for (a) four-ring horizontal-well pattern and (b) five-ring horizontal-well pattern.
Table 1: Hydrologic and thermal property values used in this study.
Property Reservoir Confining units
Permeability (m2) 1.0×10
-13 1.0×10
-18
Thermal conductivity (W/moC) 2.0 2.0
Porosity 0.12 0.12
van Genuchten (1980) m 0.46 0.46
van Genuchten (1/Pa) 5.1×10⁻⁵
5.1×10⁻⁵
Residual supercritical CO2 saturation 0.05 0.05
Residual brine saturation 0.30 0.30
RESULTS
Four-ring well pattern, reservoir depth = 2.5 km
We start with the four-ring well pattern in a reservoir
with a bottom depth of 2.5 km (Figures 1a, 2 and 4).
A zone of maximum overpressure develops between
the second ring of CO2 injectors and the third ring of
brine reinjectors (Figures 1a and 2a). This creates a
hydraulic ridge/divide that restricts lateral migration
of CO2 (Figure 2b), thereby limiting the loss of CO2,
while conserving pressure buildup from CO2
injection. The hydraulic ridge/divide segregates the
CO2- and brine-driven thermal plumes (Figure 2c and
d), causing CO2 to only be produced at the inner ring;
with the outer ring only producing brine (Figure 4a).
Initially, the inner ring only produces brine (Figure
4a), which is reinjected in the third ring. Because
brine reinjection occurs in the zone of overpressure,
driven by CO2 injection (Figures 1a and 2a), it
effectively drives flow “downhill” to the outer ring of
producers, where it causes artesian flow. All brine
produced in the outer ring is reinjected in the third
ring. Overpressure and inner-ring brine production
continue to increase for 8 years until CO2 reaches the
producers (Figure 4c). As CO2 cut increases, inner-
ring brine production decreases. Thus, there is less
brine to be reinjected in third ring, which reduces the
outer-ring brine production rate (Figure 4a). Note that
the peak in outer-ring brine production lags slightly
behind the peak for the inner producer ring.
All produced CO2 is reinjected in the second ring.
Because an important goal of this approach is to
maximize the use of CO2 as a working fluid, we
continuously increased the CO2 injection rate after
CO2 breakthrough (Figure 4a). Accordingly, the CO2
injection rate was increased from an initial rate of
0.48 T/sec to greater than 4.0 T/sec. As the region
between the first and second rings fills with CO2, flow
resistance between these rings is reduced, due to the
low viscosity of CO2, compared to brine. Thus, CO2
delivery rate, which is the difference between the
injection and production rates, declines from 15.2
MT/year to about 8 MT/year (Figure 4e). The
reduction in CO2 delivery rate decreases the rate at
which net CO2 storage accumulates, which is 373 and
1083 MT at 30 and 100 years, respectively (Figure 4e).
As CO2 cut increases, a greater fraction of produced

CO2 is recirculated CO2. At 20 years, 78 percent of
produced CO2 is recirculated, while 84, 90, and 92
percent of CO2 production is recirculated at 30, 50, and
65 years, respectively (Figure 4f).
Thermal mixing causes an immediate small decline in
extraction temperature, as cooler brine from the upper
reservoir is drawn down to the producers at the bottom
of the reservoir (Figure 4c). CO2 breakthrough causes
a small decline in extraction temperature at 8 years
for the inner ring (Figure 4c). Because of the low heat
capacity of CO2, compared to brine, thermal
drawdown is minimal until ~70 years. Because of the
greater (3-km) spacing between the third and fourth
(outer) rings, and because production rate per unit
length of producer is less for the outer ring than it is
for the inner ring, thermal drawdown is much less for
the outer-ring producers.
Figure 2: Four-ring pattern of horizontal wells, reservoir bottom depth of 2.5 km: (a) overpressure P at 10 years,
(b) brine saturation Sbrine at 30 years, and (c,d) temperature T at 30 and100 years.
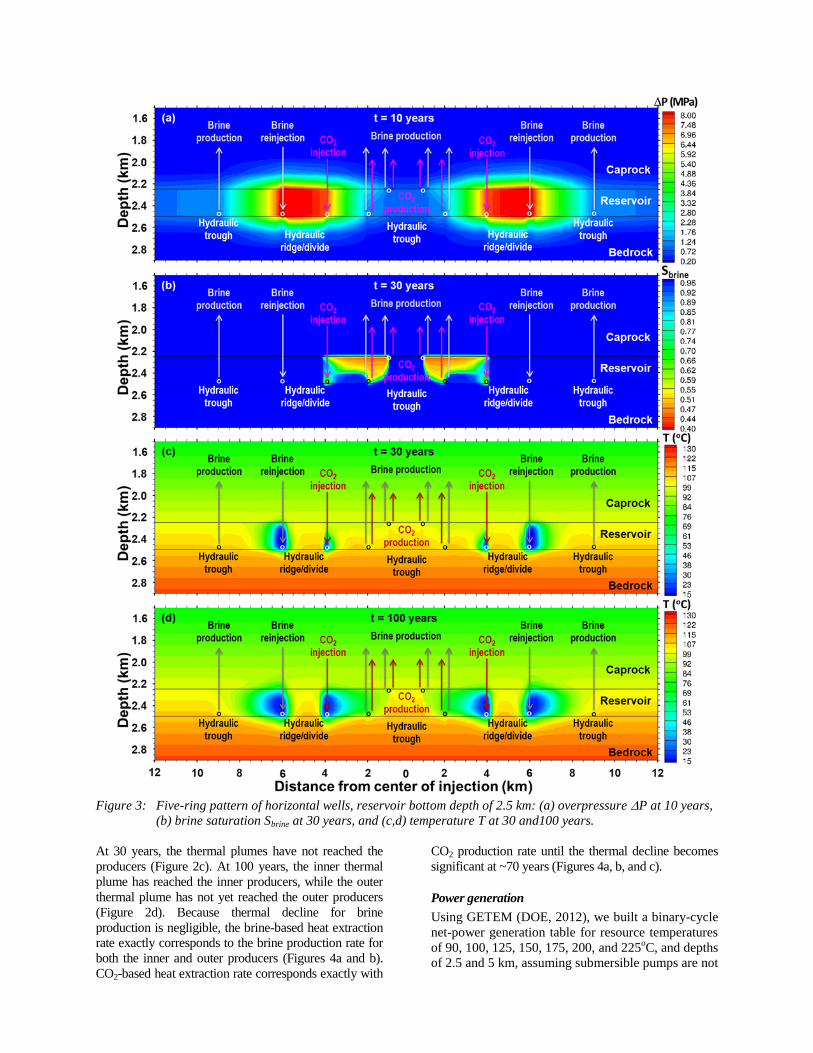
Figure 3: Five-ring pattern of horizontal wells, reservoir bottom depth of 2.5 km: (a) overpressure P at 10 years,
(b) brine saturation Sbrine at 30 years, and (c,d) temperature T at 30 and100 years.
At 30 years, the thermal plumes have not reached the
producers (Figure 2c). At 100 years, the inner thermal
plume has reached the inner producers, while the outer
thermal plume has not yet reached the outer producers
(Figure 2d). Because thermal decline for brine
production is negligible, the brine-based heat extraction
rate exactly corresponds to the brine production rate for
both the inner and outer producers (Figures 4a and b).
CO2-based heat extraction rate corresponds exactly with
CO2 production rate until the thermal decline becomes
significant at ~70 years (Figures 4a, b, and c).
Power generation
Using GETEM (DOE, 2012), we built a binary-cycle
net-power generation table for resource temperatures
of 90, 100, 125, 150, 175, 200, and 225oC, and depths
of 2.5 and 5 km, assuming submersible pumps are not

required. This table was used to create conversion
efficiencies to convert from heat extraction rate to
net-power generation, which were used to interpolate
values of conversion efficiency corresponding to the
simulated extraction temperatures. For CO2-based,
direct-turbine, power generation, we used a table of
CO2 system conversion efficiencies that include all
losses in the entire power system, including pumps
and cooling equipment (Randolph, 2013). After
applying the brine and CO2 conversion efficiencies to
the respective heat extraction rates, we determine
brine-based, CO2-based, and total net power
generation (Figure 4d). At early time, power is
entirely generated from brine production. Starting at
8 years, CO2-based power generation begins. The
contribution of CO2-based power increases with time
until it is almost equal to brine-based power. Tables 2
and 3 summarize power generation for the first 30
and 100 years, respectively, including power sales,
and power sales per MT of net CO2 storage.
Figure 4: Four-ring pattern of horizontal wells, reservoir bottom depth of 2.5 km: (a) brine and CO2 production
rate, (b) brine- and CO2-based heat extraction rate, (c) extraction temperature, (d) brine- and CO2-
based electrical power generation, (e) CO2 delivery rate and net CO2 storage, (f) instantaneous and
cumulative ratio of CO2 production to CO2 injection.
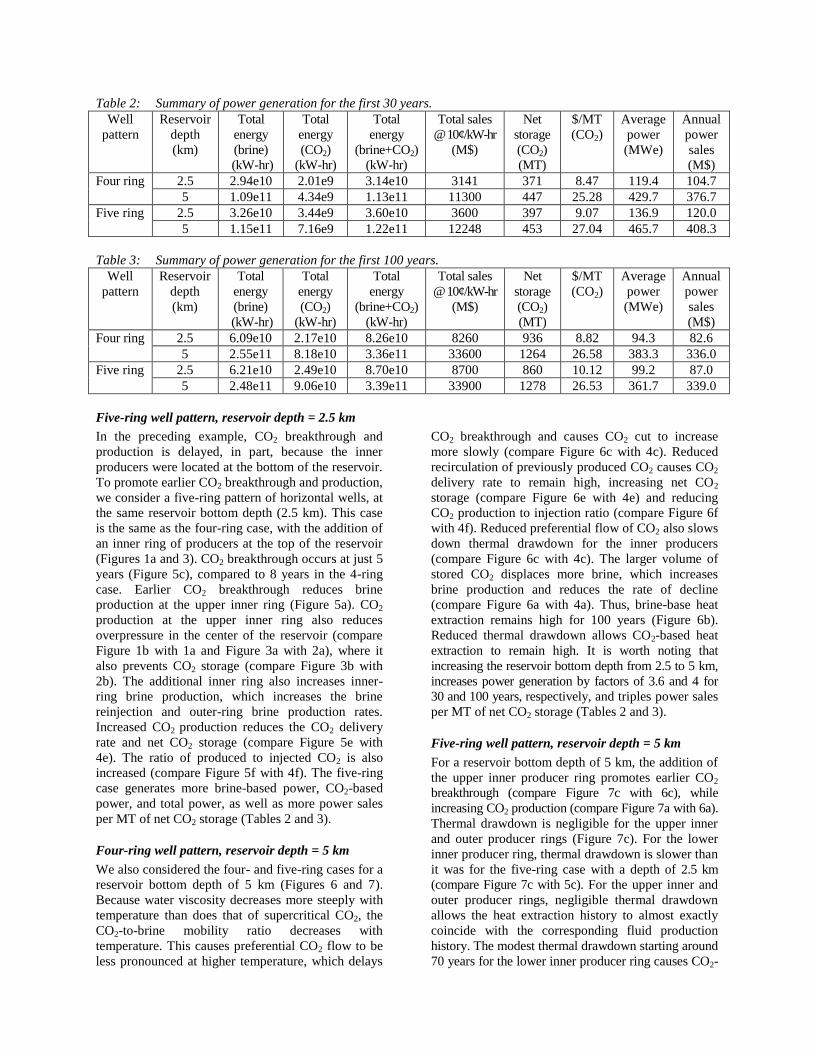
Table 2: Summary of power generation for the first 30 years.
Well
pattern
Reservoir
depth
(km)
Total
energy
(brine)
(kW-hr)
Total
energy
(CO2)
(kW-hr)
Total
energy
(brine+CO2)
(kW-hr)
Total sales
@ 10¢/kW-hr
(M$)
Net
storage
(CO2)
(MT)
$/MT
(CO2)
Average
power
(MWe)
Annual
power
sales
(M$)
Four ring 2.5 2.94e10 2.01e9 3.14e10 3141 371 8.47 119.4 104.7
5 1.09e11 4.34e9 1.13e11 11300 447 25.28 429.7 376.7
Five ring 2.5 3.26e10 3.44e9 3.60e10 3600 397 9.07 136.9 120.0
5 1.15e11 7.16e9 1.22e11 12248 453 27.04 465.7 408.3
Table 3: Summary of power generation for the first 100 years.
Well
pattern
Reservoir
depth
(km)
Total
energy
(brine)
(kW-hr)
Total
energy
(CO2)
(kW-hr)
Total
energy
(brine+CO2)
(kW-hr)
Total sales
@ 10¢/kW-hr
(M$)
Net
storage
(CO2)
(MT)
$/MT
(CO2)
Average
power
(MWe)
Annual
power
sales
(M$)
Four ring 2.5 6.09e10 2.17e10 8.26e10 8260 936 8.82 94.3 82.6
5 2.55e11 8.18e10 3.36e11 33600 1264 26.58 383.3 336.0
Five ring 2.5 6.21e10 2.49e10 8.70e10 8700 860 10.12 99.2 87.0
5 2.48e11 9.06e10 3.39e11 33900 1278 26.53 361.7 339.0
Five-ring well pattern, reservoir depth = 2.5 km
In the preceding example, CO2 breakthrough and
production is delayed, in part, because the inner
producers were located at the bottom of the reservoir.
To promote earlier CO2 breakthrough and production,
we consider a five-ring pattern of horizontal wells, at
the same reservoir bottom depth (2.5 km). This case
is the same as the four-ring case, with the addition of
an inner ring of producers at the top of the reservoir
(Figures 1a and 3). CO2 breakthrough occurs at just 5
years (Figure 5c), compared to 8 years in the 4-ring
case. Earlier CO2 breakthrough reduces brine
production at the upper inner ring (Figure 5a). CO2
production at the upper inner ring also reduces
overpressure in the center of the reservoir (compare
Figure 1b with 1a and Figure 3a with 2a), where it
also prevents CO2 storage (compare Figure 3b with
2b). The additional inner ring also increases inner-
ring brine production, which increases the brine
reinjection and outer-ring brine production rates.
Increased CO2 production reduces the CO2 delivery
rate and net CO2 storage (compare Figure 5e with
4e). The ratio of produced to injected CO2 is also
increased (compare Figure 5f with 4f). The five-ring
case generates more brine-based power, CO2-based
power, and total power, as well as more power sales
per MT of net CO2 storage (Tables 2 and 3).
Four-ring well pattern, reservoir depth = 5 km
We also considered the four- and five-ring cases for a
reservoir bottom depth of 5 km (Figures 6 and 7).
Because water viscosity decreases more steeply with
temperature than does that of supercritical CO2, the
CO2-to-brine mobility ratio decreases with
temperature. This causes preferential CO2 flow to be
less pronounced at higher temperature, which delays
CO2 breakthrough and causes CO2 cut to increase
more slowly (compare Figure 6c with 4c). Reduced
recirculation of previously produced CO2 causes CO2
delivery rate to remain high, increasing net CO2
storage (compare Figure 6e with 4e) and reducing
CO2 production to injection ratio (compare Figure 6f
with 4f). Reduced preferential flow of CO2 also slows
down thermal drawdown for the inner producers
(compare Figure 6c with 4c). The larger volume of
stored CO2 displaces more brine, which increases
brine production and reduces the rate of decline
(compare Figure 6a with 4a). Thus, brine-base heat
extraction remains high for 100 years (Figure 6b).
Reduced thermal drawdown allows CO2-based heat
extraction to remain high. It is worth noting that
increasing the reservoir bottom depth from 2.5 to 5 km,
increases power generation by factors of 3.6 and 4 for
30 and 100 years, respectively, and triples power sales
per MT of net CO2 storage (Tables 2 and 3).
Five-ring well pattern, reservoir depth = 5 km
For a reservoir bottom depth of 5 km, the addition of
the upper inner producer ring promotes earlier CO2
breakthrough (compare Figure 7c with 6c), while
increasing CO2 production (compare Figure 7a with 6a).
Thermal drawdown is negligible for the upper inner
and outer producer rings (Figure 7c). For the lower
inner producer ring, thermal drawdown is slower than
it was for the five-ring case with a depth of 2.5 km
(compare Figure 7c with 5c). For the upper inner and
outer producer rings, negligible thermal drawdown
allows the heat extraction history to almost exactly
coincide with the corresponding fluid production
history. The modest thermal drawdown starting around
70 years for the lower inner producer ring causes CO2-

based heat extraction to decline slightly. Increasing the
depth from 2.5 to 5 km, triples the power sales per MT
of stored CO2 for the five-ring cases, as it did for the
four-ring cases (Tables 2 and 3).
During the first 30 years, the addition of the upper
inner ring has a large effect, increasing brine-based
power by 11 and 6 percent for the 2.5 and 5 km
depths, respectively, while increasing CO2-based
power by a factor of 2.2 and by 65 percent (Table 2).
Over a 100-year period, adding the upper inner ring
has a smaller effect; reducing brine-based power by 3
percent, while increasing CO2-based power by 11
percent (Table 3). Over a 100-year period, CO2-based
power is 26 and 24 percent of total power for the four-
ring cases with 2.5 and 5 km depths respectively, while
it is 29 and 27 percent of total power for the five-ring
cases with 2.5 and 5 km depths, respectively (Table 3).
Figure 5: Five-ring pattern of horizontal wells, reservoir bottom depth of 2.5km: (a) brine and CO2 production
rate, (b) brine- and CO2-based heat extraction rate, (c) extraction temperature, (d) brine- and CO2-
based electrical power generation, (e) CO2 delivery rate and net CO2 storage,(f) instantaneous and
cumulative ratio of CO2 production to CO2 injection.

Figure 6: Four-ring pattern of horizontal wells, reservoir bottom depth of 5 km: (a) brine and CO2 production
rate, (b) brine- and CO2-based heat extraction rate, (c) extraction temperature, (d) brine- and CO2-
based electrical power generation, (e) CO2 delivery rate and net CO2 storage, (f) instantaneous and
cumulative ratio of CO2 production to CO2 injection.
Reservoir pressure
Maximum overpressure always occurs between the
CO2 injectors and brine reinjectors (Figures, 1, 2a,
and 3a). Overpressure continues to increase until CO2
reaches the inner producers. Because the five-ring
pattern promotes earlier CO2 breakthrough, peak
overpressure is less (Figure 1). Because CO2 and
water viscosity decrease with temperature, hydraulic
conductivity is greater for the reservoir bottom depth
of 5 km than it is for a depth of 2.5 km, resulting in
lower peak overpressure. For the cases considered in
this study, peak overpressure never exceeds 8 MPa,
which is 32 and 16 percent of hydrostatic pressure for
depths of 2.5 and 5 km, respectively; which is far
below fracture overpressure (typically approximated
as 80 percent of hydrostatic pressure).
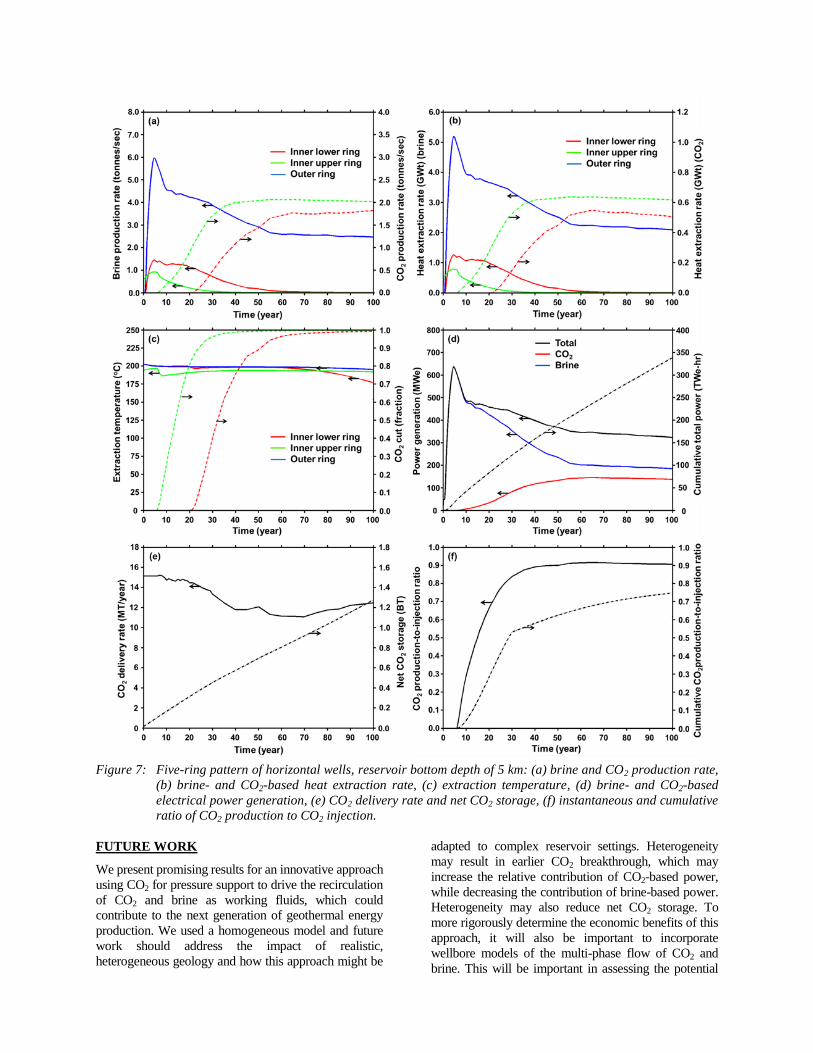
Figure 7: Five-ring pattern of horizontal wells, reservoir bottom depth of 5 km: (a) brine and CO2 production rate,
(b) brine- and CO2-based heat extraction rate, (c) extraction temperature, (d) brine- and CO2-based
electrical power generation, (e) CO2 delivery rate and net CO2 storage, (f) instantaneous and cumulative
ratio of CO2 production to CO2 injection.
FUTURE WORK
We present promising results for an innovative approach
using CO2 for pressure support to drive the recirculation
of CO2 and brine as working fluids, which could
contribute to the next generation of geothermal energy
production. We used a homogeneous model and future
work should address the impact of realistic,
heterogeneous geology and how this approach might be
adapted to complex reservoir settings. Heterogeneity
may result in earlier CO2 breakthrough, which may
increase the relative contribution of CO2-based power,
while decreasing the contribution of brine-based power.
Heterogeneity may also reduce net CO2 storage. To
more rigorously determine the economic benefits of this
approach, it will also be important to incorporate
wellbore models of the multi-phase flow of CO2 and
brine. This will be important in assessing the potential

brine-production capacity of long-reach horizontal
wells, driven by artesian pressures. The use of a
wellbore model will also allow for a more rigorous
assessment of the influence of the thermosyphon effect,
together with that of artesian pressure, on CO2-
production capacity of horizontal wells.
CONCLUSIONS
Much of the research in applying supercritical CO2 to
geothermal power systems has focused on using CO2
as a working fluid. This stems from the advantageous
thermophysical properties of CO2, which can reduce
the parasitic costs of powering fluid recirculation and
enable more direct and efficient power conversion
through a turbine. In this paper, we expand upon this
idea by demonstrating how CO2 can be also used as a
pressure-support fluid to generate artesian pressures
to drive both brine and CO2 production, thereby using
both fluids as working fluids. We develop a well-
pattern concept to address the following goals:
Conserve pressure from injection operations to
maximize the fluid-production benefit.
Minimize the loss of CO2.
Manage overpressure to reduce related risks,
such as induced seismicity and CO2 leakage.
Better control of fluid and energy recovery for
improved sweep efficiency.
Provide supplemental pressure-support and
working fluids that are chemically compatible
with the reservoir formation.
To meet these goals, we proposed and analyzed a well
pattern consisting of a minimum of four concentric rings
of horizontal producers and injectors, as follows:
1. Inner-ring brine/CO2 producers
2. CO2 injectors
3. Brine reinjectors
4. Outer-ring brine producers
For reservoir bottom depths of 2.5 and 5 km, we
considered four- and five-ring well patterns, and find:
A hydraulic ridge/divide is created that restricts
lateral migration of CO2, causing CO2 production
to only occur at the inner ring, while the outer
ring only produces brine.
Artesian pressures are created that drive large
brine production rates, which generate power
almost immediately, and provide a significant
fraction of the total power.
Because of the density difference between
supercritical CO2 and brine, the inclusion of
production (and injection) intervals at multiple
depths can enable better control of the relative
rates of CO2 and brine production, which can be a
useful tool to improve sweep efficiency.
After CO2 breakthrough, CO2-based power
increases, while brine-based power decreases.
Preferential CO2 flow decreases with depth; thus,
the fraction of produced CO2 that is recycled
decreases with depth, while net CO2 storage
increases.
Increasing the reservoir bottom depth from 2.5 to
5 km, quadruples power generation over a 100-
year period, while power sales per MT of stored
CO2 is tripled.
Net storage of CO2 frees up an equivalent volume
of make-up brine for reinjection, with the distinct
advantage of being derived from the same
formation, which reduces the possibility of
chemical incompatibility.
The results of our study indicate that the multi-ring,
horizontal-well approach, which uses CO2 as both a
pressure-support and working fluid, has the potential of
improving the economic viability of geothermal energy
production in sedimentary formations.
ACKNOWLEDGEMENT
This work was sponsored by the USDOE Geothermal
Technologies Program, managed by Joshua Mengers,
by the Carbon Mitigation Initiative at Princeton
University, and by Ormat Technologies, under the
direction of Ezra Zemach. We also acknowledge Jimmy
Randolph at the University of Minnesota for providing
the conversion efficiencies for power generated from
direct CO2 turbines. This work was performed under the
auspices of the USDOE by LLNL under contract DE-
AC52-07NA27344.
REFERENCES
ASME, 2006. ASME Steam Tables Compact Edition,
ASME, Three Park Avenue, New York, NY, USA.
Brown, D.W., 2000. A hot dry rock geothermal energy
concept using supercritical CO2 instead of water.
Proceedings of the 25th Workshop on Geothermal
Reservoir Engineering, Stanford University, 233-238.
Buscheck, T.A., Sun, Y., Chen, M., Hao, Y., Wolery,
T.J., Bourcier, W.L., Court, B., Celia, M.A.,
Friedmann, S.J., and Aines, R.D., 2012a. Active
CO2 reservoir management for carbon storage:
Analysis of operational strategies to relive pressure
buildup and improve injectivity, Internationl
Journal of Greenhouse Gas Control, 6, 230–245,
doi:10.1.1016/j.ijggc.2011.11.007.

Buscheck, T.A., Elliot, T.R., Celia, M.A., Chen, M.,
Hao, Y., Lu, C., Sun, Y., 2012b. Integrated,
geothermal-CO2 storage reservoirs: adaptable,
multi-stage, sustainable, energy-recovery strategies
that reduce carbon intensity and environmental
risk, Proceedings for the Geothermal Resources
Council 36th Annual Meeting, 30 Sept–3 Oct, 2012,
Reno, NV, USA.
Buscheck, T.A., Elliot, T.R., Celia, M.A., Chen, M.,
Sun, Y., Hao, Y., Lu, C., Wolery, T.J., and Aines,
R.D., 2012c. Integrated geothermal-CO2 reservoir
systems: Reducing carbon intensity through
sustainable energy production and secure CO2
storage, Proceedings of the International
Conference on Greenhouse Gas Technologies
(GHGT-11), Kyoto, Japan, 18–22 Nov, 2012.
Carr, T.R., Rich, P.M., and Bartley, J.D., 2007. The
NATCARB geoportal: linking distributed data from
the Carbon Sequestration Regional Partnerships.
Journal of Map and Geography Libraries: Special
Issue on Department of Energy (DOE) Geospatial
Science Innovations, 4, 131–147.
DOE, 2012. GETEM–Geothermal electricity
technology evaluation model, August 2012 Beta,
USDOE Geothermal Technologies Program.
Elliot, T.R., Buscheck, T.A., and Celia, M.A., 2013.
Active CO2 reservoir management for
sustainable geothermal energy extraction and
reduced leakage, Greenhouse Gases: Science
and Technology, 1, 1–16; DOI: 1002/ghg.
Fenghour, A., Wakeham, W.A., and Vesovic, V., 1998.
The viscosity of carbon dioxide. J. Phys. Chem.
Ref. Data, 27 (1), 31–44.
IPPC (Intergovermental Panel on Climate Change),
2005. Special report on carbon dioxide capture
and storage. Cambridge University Press,
Cambridge, UK and New York, NT, USA.
Nitao, J.J., 1998. “Reference manual for the NUFT
flow and transport code, version 3.0,” Lawrence
Livermore National Laboratory, UCRL-MA-
130651-REV-1, Livermore, CA, USA.
Pruess, K., 2006. Enhanced geothermal systems (EGS)
using CO2 as working fluid–a novel approach for
generating renewable energy with simultaneous
sequestration of carbon, Geothermics, 35, 351–367.
Randolph, J.B. and Saar, M.O., 2011a. Coupling
carbon dioxide sequestration with geothermal
energy capture in naturally permeable, porous
geologic formations: Implications for CO2
sequestration. Energy Procedia, 4, 2206–2213.
Randolph, J.B. and Saar, M.O., 2011b. Impact of
reservoir permeability on the choice of subsurface
geothermal heat exchange fluid: CO2 versus water
and native brine. Proceedings for the Geothermal
Resources Council 35th Annual Meeting: 23–26 Oct,
2011, San Diego, CA, USA.
Randolph, J.B., and Saar, M.O., 2011c. Combining
geothermal energy capture with geologic carbon
dioxide sequestration, Geophysical Research Letters,
38, L10401, doi:10.1029/2011GL047265.
Randolph, J.B., 2013. Personal communication and
spreadsheet on the thermal efficiency of a direct
CO2 turbine power system, University of
Minnesota, Minneapolis, MN, USA.
Saar, M.O., Randolph, J.B., and Kuehn, T.H., 2010.
Carbon Dioxide-based geothermal energy
generation systems and methods related thereto.
US Patent Application 20120001429.
Socolow, R.H. and Pacala, S.W., 2006. A plan to keep
carbon in check, Scientific American, 295 (3), 50–57.
Span, R. and Wagner, W., 1996. A new equation of
state for carbon dioxide covering the fluid region
from the triple-point temperature to 1100K at
pressures up to 800 MPa. Journal of Physical
and Chemical Reference Data, 25, 1509–1596.
van Genuchten, M.T., 1980. A closed form equation
for predicting the hydraulic conductivity of
unsaturated soils. Soil Science Society of
America Journal, 44, 892–898.
Zhou, Q., Birkholzer, J.T., Tsang C-F., and Rutqvist,
J. A., 2008.A method for quick assessment of
CO2 storage capacity in closed and semi-closed
saline formations. International Journal of
Greenhouse Gas Control, 2, 626–639.