strategies for decreasing test tat utilizing technology · strategies for decreasing test tat...
TRANSCRIPT
Strategies for Decreasing Test TAT Utilizing Technology
Lab InfoTech SummitMarch 6, 2007
Walter H. Henricks, M.D.Cleveland Clinic

Objectives
• List elements that comprise laboratory test turnaround time (TAT) that are potential targets for applications of information technology
• Describe selected information technologies that may have the greatest effect on reducing turnaround time
• Discuss the measurement of TAT and its role in outcomes and value assessment

Technology and TAT – Outline
Definition and measurement of TAT• Pre-analytical phase• Analytical phase• Post-analytical phase• Anatomic Pathology

Turnaround Time – Definitions
• TAT is traditionally measured as time from receipt to time of test reporting, i.e., analytical or process TAT
• Limitations:– Looks more at efficiency of process (more like QC)– Does not assess value or outcome
• TAT outlier rate is defined as the percentage of tests whose TAT exceeds a defined threshold or target– Example: 5% of stat potassium with TAT >1 hr.– Better measure of value or outcome related to
clinicians’ expectations and to outcomes of perception of lab services and patient experience
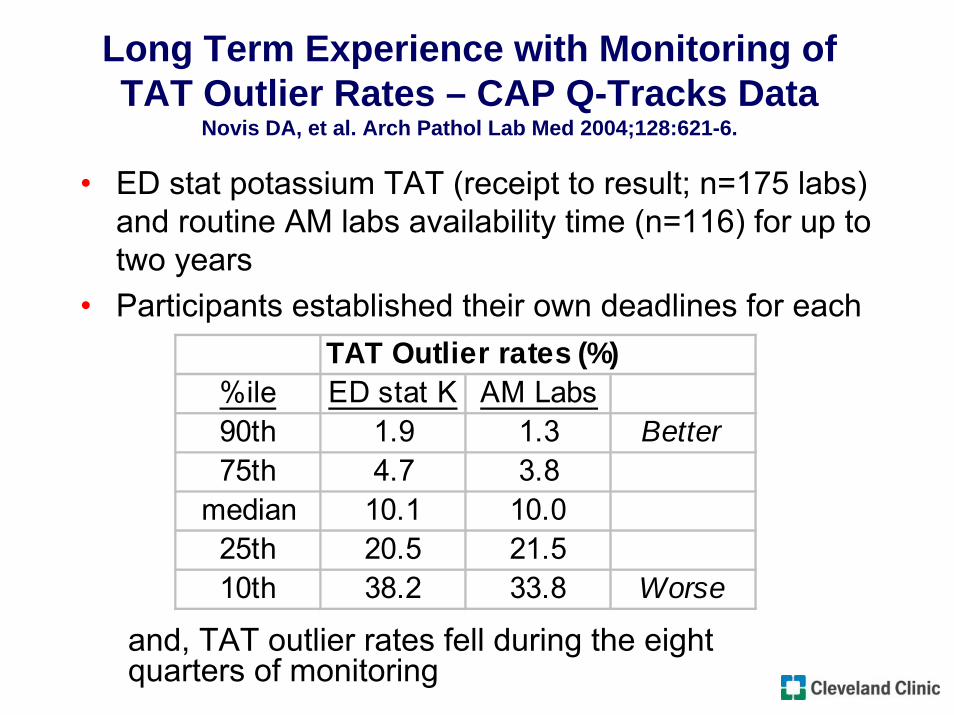
Long Term Experience with Monitoring of TAT Outlier Rates – CAP Q-Tracks Data
Novis DA, et al. Arch Pathol Lab Med 2004;128:621-6.
• ED stat potassium TAT (receipt to result; n=175 labs) and routine AM labs availability time (n=116) for up to two years
• Participants established their own deadlines for eachTAT Outlier rates (%)
%ile ED stat K AM Labs90th 1.9 1.3 Better75th 4.7 3.8
median 10.1 10.025th 20.5 21.510th 38.2 33.8 Worse
and, TAT outlier rates fell during the eight quarters of monitoring

CAP Q-Track for TAT OutliersNovis DA, et al. Arch Pathol Lab Med 2004;128:621-6.
• Top-performing labs’ opinions of practices responsible for superior TAT outlier performance that relate directly to IT:– Computerized test order entry– Automatic printing of specimen labels and
assignment of accession numbers at time of specimen collection
– Pneumatic tube transport of specimens– Regular review of pending logs to detect and to
resolve delays– Printing of results in patient care area immediately
upon their verification in lab

Reducing TAT Outliers can Reduce ED Patient Length of Stay
Holland LL et al. Am J Clin Pathol 2005;124:672-4.
• TAT and TAT outlier rates for CBC (30 min target), chemistries (40 min), troponin I (60 min), and urinalysis (30 min) at 11 community hospitals
• ED LOS correlated with TAT outlier rate and less so with mean TAT
• Improvement in TAT outlier rate over time was related to decrease in ED LOS
• TAT outlier rate did not consistently correlate with mean TAT across hospitals

Achieving Meaningfulness in TAT Measurement
• Traditional measurements of mean TAT are useful largely for assessing intra-lab processes.
• More important to clinicians is whether results are there when they expect them.
• TAT outlier rate is a better outcome measurement for lab services with respect to:– meeting clinician needs– effect on patient experience or outcome, e.g. ED LOS
• Demonstrating linkage TAT outlier performance to other outcomes (e.g. ED LOS) may be opportunity for labs to demonstrate value.
• Generating TAT outlier data may require additional data analysis tools after extraction of TAT data from LIS.

Technology and TAT – Outline
• Definition and measurement of TATPre-analytical phase
• Analytical phase• Post-analytical phase• Anatomic Pathology

Computerized Provider Order Entry (CPOE)
• CPOE was identified as a core function of the EMR (IOM, 2003).
• CPOE adoption is being driven primarily by evidence that it can reduce medication errors.
• A number of studies have reported decreased lab test TAT after CPOE implementation.

Computerized Provider Order Entry (CPOE) and Lab TAT Reduction in Hospital Setting
Westbrook JI. J Clin Pathol 2006;59:533-6.
• Mean TAT (lab receipt to report) fell significantly by 21% (73.8 to 58.3 min) in 650 bed hospital after CPOE.
• All major categories of tests were measured.• Improvement was seen for stat and non-stat tests as
well as for tests during and outside of business hours.
• “Control” ward that did not implement CPOE had no change during the same time.
• TAT reduction was attributed to elimination of manual entry of lab orders into LIS.
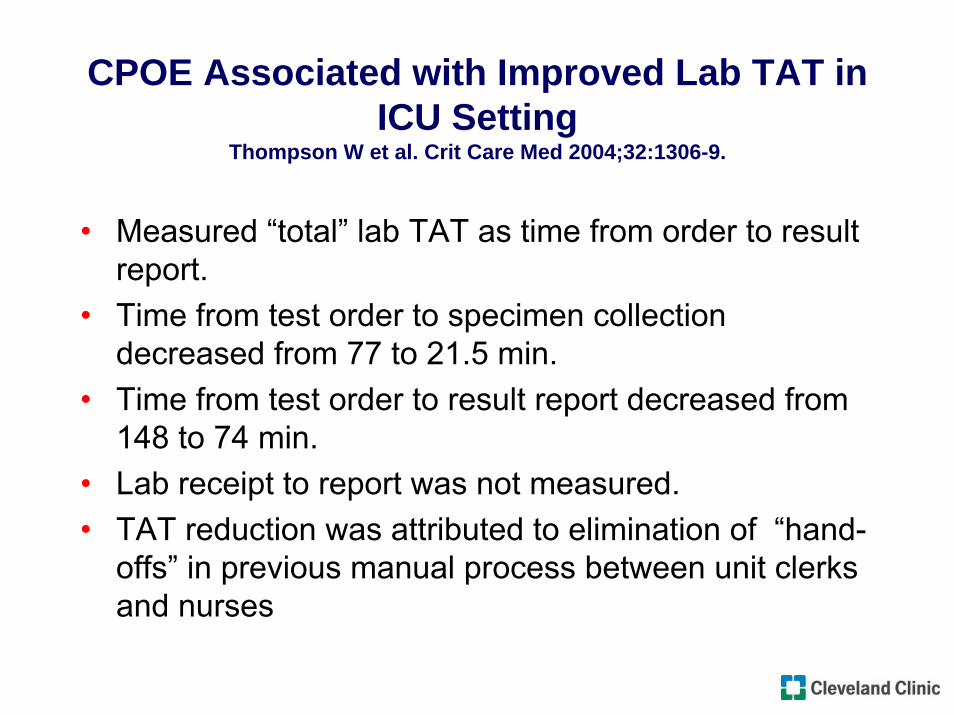
CPOE Associated with Improved Lab TAT in ICU Setting
Thompson W et al. Crit Care Med 2004;32:1306-9.
• Measured “total” lab TAT as time from order to result report.
• Time from test order to specimen collection decreased from 77 to 21.5 min.
• Time from test order to result report decreased from 148 to 74 min.
• Lab receipt to report was not measured.• TAT reduction was attributed to elimination of “hand-
offs” in previous manual process between unit clerks and nurses

CPOE Implications for Laboratory TAT
• Poorly designed process and/or suboptimal order entry screens may prolong lab TAT by creating more work for lab staff.– Incorrect orders that require follow up by lab staff– Workarounds in lab to compensate for inflexible
order entry screens– Unclear procedures for handling test order
cancellations– Limitations of add-on test order handling in CPOE
system

CPOE and “Total” Test TAT
• CPOE provides the capability to measure test TAT from time of order and gives the lab an important tool in monitoring pre-analytical processes
• Reduced TAT achieved through electronic lab orders may be offset by increased time that order entry requires of clinicians
• Future assessments of TAT will be able to look more at “total” TAT and take into account diverse upstream processes that may affect TAT greater than what happens once the specimen is received in the lab.

Patient Identification (ID) Technology to Improve Efficiency of Phlebotomy
• Patient ID systems use machine-readable methods for verifying patient identification at bedside and facilitating correct sample labeling.
• Reducing specimen identification problems improves specimen handling efficiency and thus affects TAT.
• Now largely 1-D and 2-D barcodes are ID method; radiofreqency identification (RFID) and biometric techniques are emerging.

Multiple systems that are involved in patient ID technology cannot be islands
Bridges are necessary

Wristband patient ID
Portable barcode reader and label printerSource: Pt. ID system or LIS
Wireless connectivity
John Doe
LIS Specimen ####
Specimen labelSource: Pt. ID system or LIS
Source: Registration system or EMR/HIS or third party
Phlebotomist IDSource: ID badge system
LIS
Docking station
- Test orders from LIS- Collection status back to LIS
Bedside Patient ID Technology

Barcoded Patient ID Improves Specimen Labeling and Reduces TAT
Bologna LJ et al. J Healthc Inf Manag. 2002;16(1):65-70.
• Implementation of patient ID system resulted in (60K draws; 9 months): – 48% reduction in total specimen errors– 77% reduction in critical errors– 13% reduction in specimen collection time– 55% reduction in receipt process time
• Keys to success included:– thorough pre-implementation process mapping and
time and motion studies– multidisciplinary involvement

CAP Today Systems Survey of Patient ID Technology (July 2006)
Pt. ID system Tech onlyTotal 9 72D Barcode 6 7RFID 3 4Biometrics 1 2Blood Transfusion 5 4Meds dispensing 6 5FDA approved 2 1FDA applied 2Integrated in LIS 3
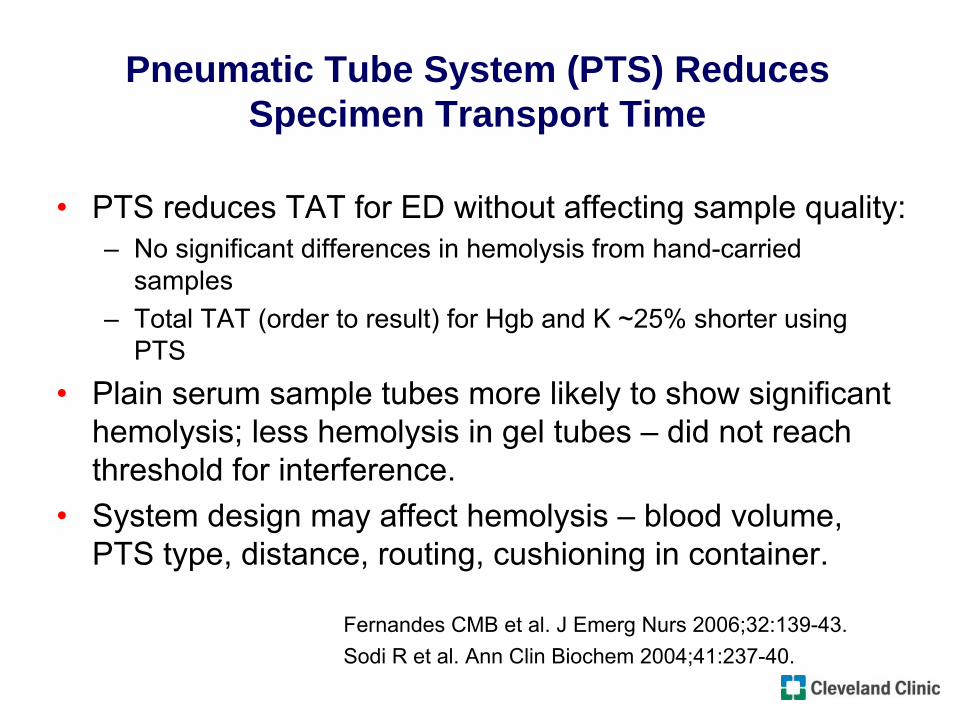
Pneumatic Tube System (PTS) Reduces Specimen Transport Time
• PTS reduces TAT for ED without affecting sample quality:– No significant differences in hemolysis from hand-carried
samples– Total TAT (order to result) for Hgb and K ~25% shorter using
PTS
• Plain serum sample tubes more likely to show significant hemolysis; less hemolysis in gel tubes – did not reach threshold for interference.
• System design may affect hemolysis – blood volume, PTS type, distance, routing, cushioning in container.
Fernandes CMB et al. J Emerg Nurs 2006;32:139-43.Sodi R et al. Ann Clin Biochem 2004;41:237-40.
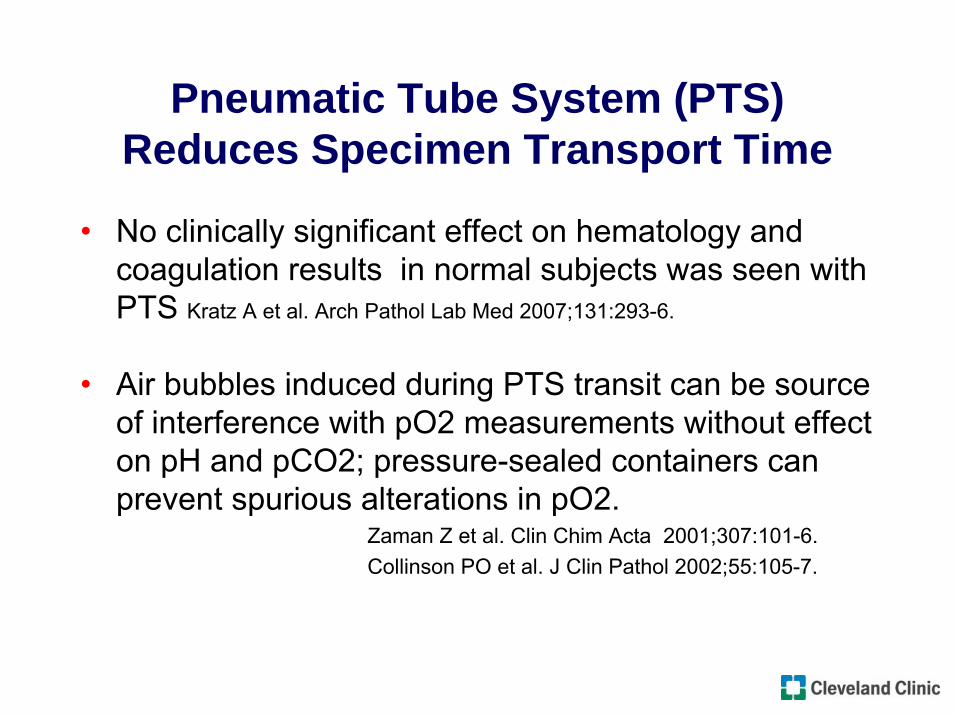
Pneumatic Tube System (PTS) Reduces Specimen Transport Time
• No clinically significant effect on hematology and coagulation results in normal subjects was seen with PTS Kratz A et al. Arch Pathol Lab Med 2007;131:293-6.
• Air bubbles induced during PTS transit can be source of interference with pO2 measurements without effect on pH and pCO2; pressure-sealed containers can prevent spurious alterations in pO2.
Zaman Z et al. Clin Chim Acta 2001;307:101-6.Collinson PO et al. J Clin Pathol 2002;55:105-7.

Technology and TAT – Outline
• Definition and measurement of TAT• Pre-analytical phase
Analytical phase• Post-analytical phase• Anatomic Pathology

Total Lab Automation Eliminates TAT Outlier Rate as Factor in ED Length of Stay
Holland LL et al. Am J Clin Pathol 2006;125:765-70.
• Stat potassium (K) was key benchmark with TAT target of 40 min.
• Mean TAT did not change with TLA (28 to 27 min).• Stat K TAT outlier rate fell from 18% to 5%.• Pre-TLA, ED LOS correlated best with stat K TAT
outlier rate.• Post-TLA, ED LOS correlated best with ED patient
volume, consistent with removing lab as rate limiter.• Success was attributed primarily to elimination of
batch processing with TLA.
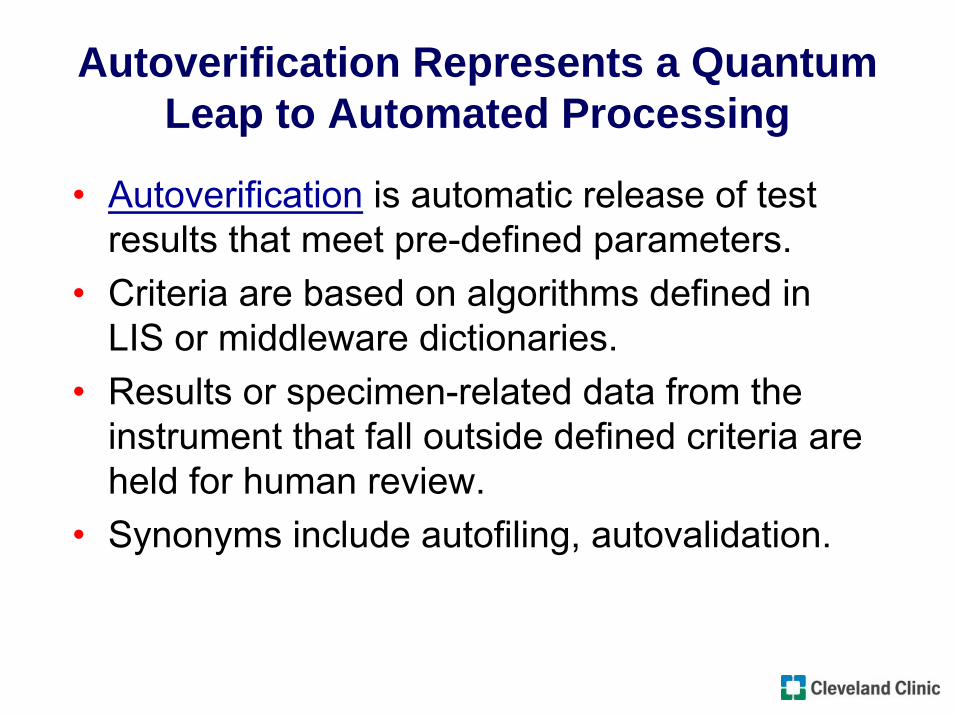
Autoverification Represents a Quantum Leap to Automated Processing
• Autoverification is automatic release of test results that meet pre-defined parameters.
• Criteria are based on algorithms defined in LIS or middleware dictionaries.
• Results or specimen-related data from the instrument that fall outside defined criteria are held for human review.
• Synonyms include autofiling, autovalidation.

Autoverification Reduces Test TAT and Results in Other Process Improvements
Torke N et al. Clin Chem 2005;51:2406-8.
• Autoverification was implemented in LIS for chemistry tests in high volume (6M/yr) lab.
• TAT (receipt to result) for stat chemistries fell from 38 to 28 min and for stat urinalysis from 47 to 39 min.
• TAT for routine labs fell from 151 to 115 min and for urinalysis from 138 to 111 min.
• Stat orders decreased 16% while total volume increased 4% - another outcome measure related to TAT.
• 62% of chemistry panels, 73% of single analyte assays, and 43% of urinalysis are now autoverified.

Autoverification at Cleveland Clinic
• Autoverification was implemented in LIS in 1995 – almost all high volume automated tests are have autoverification criteria defined.
• Of 3113 orderable tests defined in LIS, 285 are defined for autoverification.
• 45% of all results are autoverified: 21.5M of 47.7M annual.
• 60% of automated core lab results are autoverified.

Autoverification – Possible Parameters• Reference (normal) range • Technical range of the assay • Instrument-defined filing range (see below) • Critical value range, or other “verify” range
specified in dictionary • Delta checks• Acceptance criteria for inpatients vs.
outpatients• Criteria based on other results in same test
(e.g. RBC indices)• Instrument flags

Autoverification in LIS: LIS-instrument Interplay
• Autoverification is linked with the instrument as some of the rules available for autoverification may be based on instrument output.– Instrument software may define its own range for filing results.– Abnormal flags generated by cell counter may be defined as
criteria. – Instrument may pass codes that indicate instrument malfunction. – The LIS and instrument determine whether a whole “cup” should
fail if one component fails, e.g. fail entire CBC if Hgb fails.
• As a rule, criteria for release are explicitly defined (i.e., “release if X or Y”), rather than criteria for failure (i.e., “release all unless A or B”).

Autoverification Table in LIS
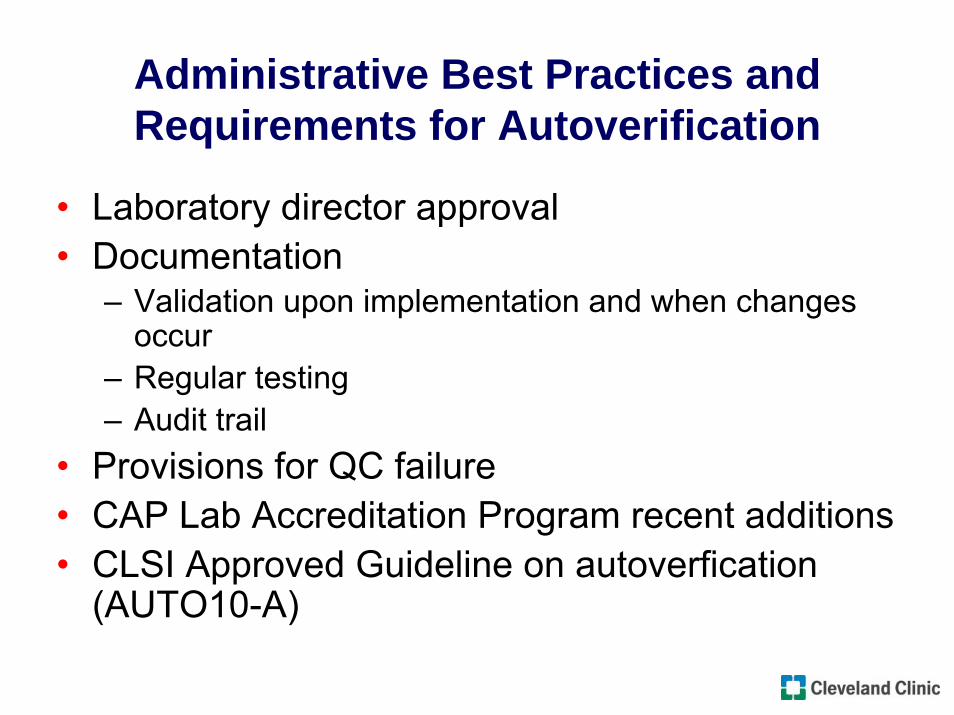
Administrative Best Practices and Requirements for Autoverification
• Laboratory director approval• Documentation
– Validation upon implementation and when changes occur
– Regular testing– Audit trail
• Provisions for QC failure• CAP Lab Accreditation Program recent additions• CLSI Approved Guideline on autoverfication
(AUTO10-A)
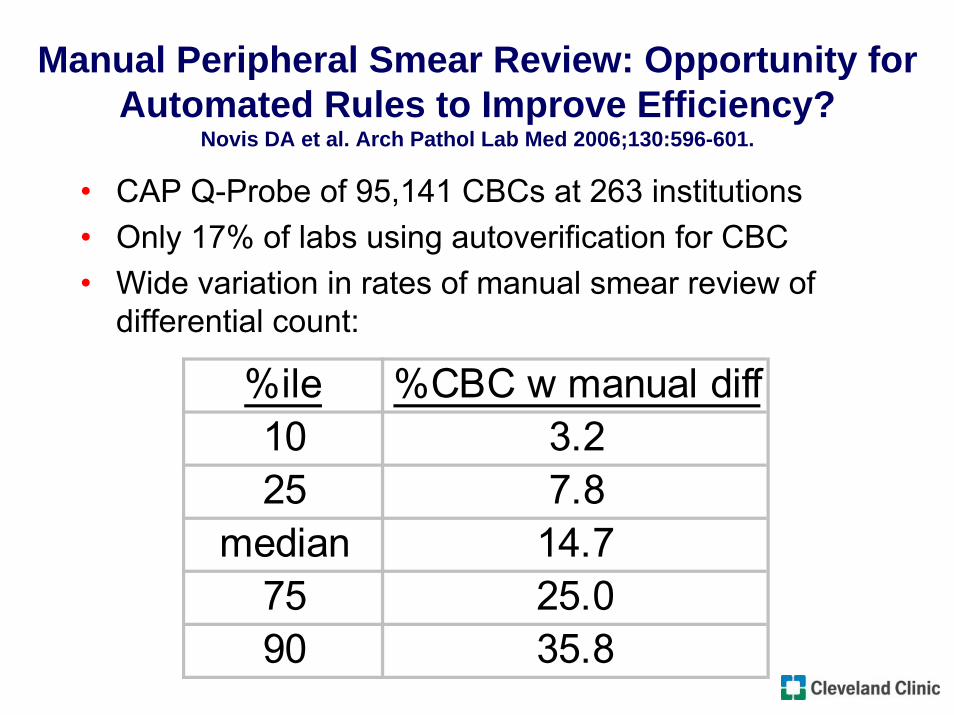
Manual Peripheral Smear Review: Opportunity for Automated Rules to Improve Efficiency?
Novis DA et al. Arch Pathol Lab Med 2006;130:596-601.
• CAP Q-Probe of 95,141 CBCs at 263 institutions• Only 17% of labs using autoverification for CBC• Wide variation in rates of manual smear review of
differential count:
%ile %CBC w manual diff10 3.225 7.8
median 14.775 25.090 35.8
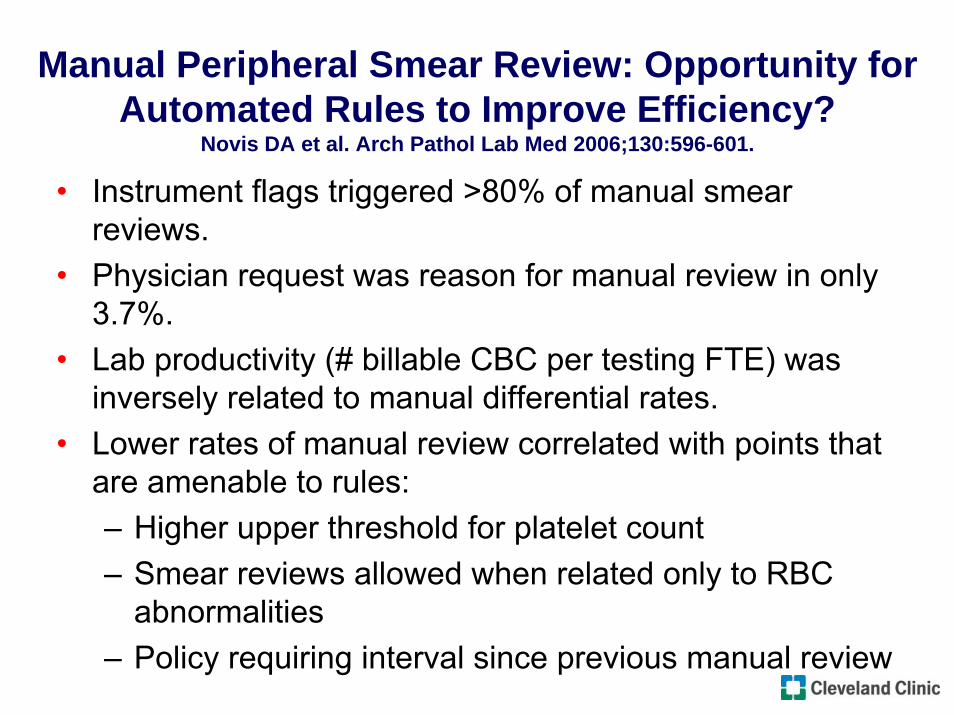
Manual Peripheral Smear Review: Opportunity for Automated Rules to Improve Efficiency?
Novis DA et al. Arch Pathol Lab Med 2006;130:596-601.
• Instrument flags triggered >80% of manual smear reviews.
• Physician request was reason for manual review in only 3.7%.
• Lab productivity (# billable CBC per testing FTE) was inversely related to manual differential rates.
• Lower rates of manual review correlated with points that are amenable to rules:– Higher upper threshold for platelet count– Smear reviews allowed when related only to RBC
abnormalities– Policy requiring interval since previous manual review

Reflex Testing Reduces Need for Manual Intervention and Increases Efficiency
• In reflex testing, a new test order is generated automatically when initial test results meet defined criteria.
• Reflex criteria may be defined in LIS and/or middleware.
• Reflex testing at Cleveland Clinic includes:– 50 tests with reflex criteria– 97K reflex orders per year– ~3 results per reflex order

Laboratory-Initiated Reflex Testing to Identify Outpatients with Autoimmune Hemolytic Anemia
Froom P et al. Am J Clin Pathol 2005;124:129-132.
• Design:– For outpatients with Hgb <10, MCV ≥80, and no
previous decreased Hgb, perform reticulocyte count– If reticulocyte count ≥2, perform DAT
• 33 patients were identified in which physicians were previously unaware of AIHA diagnosis.
• Authors concluded that reflex testing:– ensured recommended medical practices– led to more timely diagnosis and treatment– probably saved office visits

Home of the Rules: LIS or Middleware?
• LIS and middleware rules capability may overlap, while each retain some unique functions, e.g. middleware controls specific instrument functions like automatic re-check and blood film preparation
• Distribution of autoverification, reflex testing, and other rules between middleware and LIS will depend on:– relative strengths of the systems in use– expertise of lab IT staff– complexity of rules already defined in LIS– ability create rules in lab without need for vendor

Technology and TAT – Outline
• Definition and measurement of TAT• Pre-analytical phase• Analytical phase
Post-analytical phase• Anatomic Pathology

Technology and the Post-Analytical Phase of TAT
• Specimen archiving systems – incorporated into LIS or standalone – reduce TAT for add-on test requests.
• Electronic result delivery effectively eliminates much of post-analytical phase TAT component.
• Critical values notification and tracking physician review of results are emerging areas of focus and applicability of technology.

Technology and the Post-Analytical Phase of TAT
• Systems exist that enable allow automated immediate result delivery to clinicians (pager, email, phone, web) based on flexible criteria.
• Such systems may facilitate critical values notification and documentation.
• Implementation must consider:– Integration with existing systems– Definition and maintenance of rules– Variations in physician interest in receiving alerts

The Electronic Medical Record (EMR) and Lab Results Availability
• MDs require a prompt to know that new results are available; the arrival of paper is a prompt.
• Many EMR systems have “in-basket”-type function that alerts MDs to new results.
• Labs need to understand how such a function works in their institution’s EMR(s), e.g.– Is such a system in use?– Do all results qualify?– Do alerts go to all MDs on order or just one?– Do corrected reports and addenda trigger alerts?

Technology and TAT – Outline
• Definition and measurement of TAT• Pre-analytical phase• Analytical phase• Post-analytical phase
Anatomic Pathology

Technology and TAT in Anatomic Pathology – Voice Recognition Technology (VRT)
• Results with VRT in AP have been mixed.• VRT for gross descriptions can improve efficiency in
surgical pathology; extensive use of templates is key.• VRT can reduce efficiency of pathologists in report
creation compared to human transcription.• VRT is probably most effectively implemented in
situations where transcription is inadequate or unavailable.
Henricks WH et al. Mod Pathol 2002.Al-Avnati MM et al. Arch Pathol Lab Med 2003;127:721-5.

Technology and TAT in Anatomic Pathology
• Integration of document scanning into AP LIS can save pathologist time and improve departmental efficiency. Schmidt RA et al. Am J Clin Pathol 2006;126:678-83.
• Direct interface of stain orders between AP LIS and automated immunohistochemistry stainer reduces manual data re-entry delays.
• As automated methods emerge in AP labs, interfaces and integration with AP LIS may lead to improved specimen tracking and process control.
Summary
• Turnaround time outlier rate is a more effective measurement of TAT than mean TAT and can be a marker for value of lab services and related outcomes.
• Technologies are available that can address components of TAT prior to specimen receipt, and these require extra-departmental involvement by labs.
• LISs and middleware now present sophisticated rules-based capabilities that can improve TAT and efficiency.

References
• Novis DA, Walsh MK, Dale JC, Howanitz PJ. Continuous monitoring of stat and routine outlier turnaround times. Arch Pathol Lab Med 2004;128:621-6.
• Holland LL, Smith LL, Blick KB. Reducing laboratory turnaround time outliers can reduce emergency department patient length of stay. Am J Clin Pathol2005;124:672-4.
• Georgiou A, Westbrook JI. Computerised order entry systems and pathology services – a synthesis of the evidence. Clin Biochem Rev 2006;27:79-87.
• Westbrook JI, Georgiou A. Computerised pathology test order entry reduces laboratory turnaround times and influences tests ordered by hospital clinicians: a controlled before and after study. J Clin Pathol 2006;59:533-6.
• Thompson W, Dodek PM, Norena M, Dodek J. Computerized physician order entry of diagnostic tests in an intensive care unit is associated with improved timeliness of service. Crit Care Med 2004;32:1306-9.

References
• Bologna LJ J Healthc Inf Manag. 2002;16(1):65-70.• Fernandes CMB, Worster A, Eva K, Hill S, McCallum C. Pneumatic tube
delivery system for blood samples reduces turnaround times without affecting sample quality. J Emerg Nurs 2006;32:139-43.
• Kratz A, Raneem RO, Van Cott EM. Effects of a pneumatic tube system on routine and novel hematology and coagulation parameters in healthy volunteers. Arch Pathol Lab Med 2007;131:293-6.
• Sodi R, Dam SM, Stott A. Pneumatic tube system induced haemolysis: assessing sample type susceptibility to haemolysis. Ann Clin Biochem2004;41:237-40.
• Collinson PO, John CM, Gaze DC, Ferrigan LF, Cramp DG. Changes in blood gas samples produced by a pneumatic tube system. J Clin Pathol 2002;55:105-7.
• Zaman Z, Demedts M. Blood gas analysis: POCT versus central laboratory on samples sent by a pneumatic tube systems. J Clin Chim Acta 2001;307:101-6.

References
• Holland LL, Smith LL, Blick KB. Total laboratory automation can help eliminate the laboratory as a factor in emergency department length of stay. Am J ClinPathol 2006;125:765-70.
• Torke N, Boral L, Nguyen T, Perri A, Charkin A. Process improvement and operational efficiency through test result autoverification. Clin Chem2005;51:2406-8.
• Duca DJ. Autoverification in a laboratory information system. Lab Medicine 2002;33:21-5.
• Sullivan E. To the middle and beyond: exploring the expanding universe of laboratory software. Lab Medicine 2006:37:407-11.
• Froom P, Neck A, Shir M, Haavis R, Barak M. Automatic laboratory-initiated reflex testing to identify patients with autoimmune hemolytic anemia. Am J ClinPathol 2005;124:129-132.
• Novis DA, Walsh M, Wilkinson D, St. Louis M, Ben-Ezra J. Laboratory productivity and the rate of manual peripheral blood smear review. Arch PatholLab Med 2006;130:596-601.

References
• Al-Aynati MM, Chorneyko KA. Comparison of voice-automated transcription and human transcription in generating pathology reports. Arch Pathol Lab Med 2003;127:721-5.
• Schmidt RA, Simmons K, Grimm EE, Middlebrooks M, Changchien R. Integration of scanned document management with an anatomic pathology laboratory information system. Am J Clin Pathol 2006;126:678-83.
• Ellis J. A new approach to results delivery. Advance for Lab Admin January 2007.