analysis of nigerian electricity generation multi year ...the section 76 (6) of the epsra act, 2005...
TRANSCRIPT

Energy and Power Engineering, 2017, 9, 541-554 http://www.scirp.org/journal/epe
ISSN Online: 1947-3818 ISSN Print: 1949-243X
DOI: 10.4236/epe.2017.910038 Sep. 11, 2017 541 Energy and Power Engineering
Analysis of Nigerian Electricity Generation Multi Year Tariff Order Pricing Model
Nnamdi B. Anosike1*, Jude E. Dara1, Ugochukwu C. Ngwaka2, Frances O. Enemuoh3
1Mechanical Engineering Department, Nnamdi Azikiwe University, Awka, Nigeria 2Mechanical Engineering Department, Enugu State University of Science and Technology, Enugu, Nigeria 3Electrical Engineering Department, Nnamdi Azikiwe University, Awka, Nigeria
Abstract The Multi Year Tariff Order (MYTO) is the Nigerian Electricity Regulatory Commission (NERC) pricing framework for determining the Nigerian Elec-tricity Supply Industry (NESI) pricing model. One of the objectives of the NERC’s MYTO pricing model is to ensure regulated electricity end user tariff without compromising return on investment. Achieving this objective is im-perative to attract investors in the growing Nigerian electricity market. How-ever, NESI has hitherto been faced with challenges ranging from its inability to provide sufficient power to its customers to not being viable enough to provide return on capital invested. In this paper, sensitivity analysis of power plant operation and performance parameters on the cost of electricity (CoE) generation using MYTO (power generation) pricing model were evaluated. Thermodynamic modeling and simulation of an open cycle gas turbine (OCGT) was carried out to augment scarce data on power plant performance and operation in Nigeria. Sensitivity analysis was carried out using probabilis-tic method based on Monte Carlo simulation (MCS) implemented in com-mercial software (@ Risk®). The result highlighted sensitivity of the model in-put parameters to cost of electricity generation based on technical and finan-cial assumptions of MYTO model. Seven most influential parameters affecting generation cost were identified. These parameters and their correlation coeffi-cients are given as: 1) foreign exchange rate, 0.76; 2) cost of fuel, 0.51; 3) thermal efficiency, −0.23; 4) variable operation and maintenance cost, 0.22; 5) fixed operating and maintenance cost, −0.03; 6) capacity factor, −0.02; and 7) average capacity degradation, 0.01. Based on the gas turbine engine and input parameter distributions statistics for this study, the generation cost lies be-tween 9.84 to 15.45 ₦/kWh and the probabilities of CoE within these values were established.
How to cite this paper: Anosike, N.B., Dara, J.E., Ngwaka, U.C. and Enemuoh, F.O. (2017) Analysis of Nigerian Electricity Generation Multi Year Tariff Order Pricing Model. Energy and Power Engineering, 9, 541-554. https://doi.org/10.4236/epe.2017.910038 Received: July 20, 2017 Accepted: September 8, 2017 Published: September 11, 2017 Copyright © 2017 by authors and Scientific Research Publishing Inc. This work is licensed under the Creative Commons Attribution International License (CC BY 4.0). http://creativecommons.org/licenses/by/4.0/
Open Access

N. B. Anosike et al.
DOI: 10.4236/epe.2017.910038 542 Energy and Power Engineering
Keywords Nigerian electricity Market, Generation Multi Year Tariff Order (MYTO), Combustion Turbine, Electricity Price Uncertainty, Government Interventions
1. Introduction
Proper energy mix with adequate production is a target of every nation in achieving her energy demands and meeting stringent emission requirement. One of the major reasons Nigeria is less attracted to start a new business or ex-pansion of existing business is unacceptable blackouts in national grid which impact customers, particularly commercial and industrial users; almost causing them to go entirely off grid [1]. The analysis of Nigeria’s electricity supply prob-lems and prospects found that the electricity demand in Nigeria far outstrips the supply, which is epileptic in nature [2]. The erratic electricity supply hinders the country’s development, restricts socio-economic activities to basic human needs and adversely affects the quality of life [3] [4].
Nigeria with low energy generation capacity and inadequate energy genera-tion mix alike is facing multi-dimensional challenges in meeting her energy re-quirement of at least 10,000 MW. Hence, the Nigeria government in a bid to re-position the electric sector in 2005 came up with Electric Power Sector Reform Act (EPSRA, 2005) to boost energy generation and distribution capacities in the country. This leads to privatization of two segments of its electricity industry; generation and distribution sectors, anticipating that investors can take over and produce sufficient power to meet growing electricity needs of Nigerians. The transmission segment is still under monopoly (controlled by the government); while retail is coordinated within the distribution companies (Discos). Though the transmission and distribution infrastructures are insufficient to evacuate the proposed 10,000 MW and require attention. However, generation remains the most challenging presently. Transmission problems can be somewhat taken care of upon introduction and increased number of distributed or embedded power generation. The NESI is majorly characterized by centralized power plants, which feed into the national grid and the power is then apportioned to different distribution companies through the Nigerian bulk electricity trading (NBET) company. The current long distance transmission lines leads to technical losses, increased externalities and poor voltage profile which results to higher final tariff payable by the end user. Ensuring improved efficiency, access and reliability of the energy industry as well as establishing a competitive market in the country, requires investors in the core areas, especially in the generation segment of the industry. Thus, a visible and consistent polices to guarantee capital recovery, re-turns on investment for investors while maintaining affordability and quality of service to consumers must be in place [5].

N. B. Anosike et al.
DOI: 10.4236/epe.2017.910038 543 Energy and Power Engineering
The Section 76 (6) of the EPSRA Act, 2005 empowers Nigerian Electricity Regulatory Commission (NERC) to establish tariff methodologies for regulating electricity prices in Nigeria. NERC in 2008 introduced a pricing model, the so called ‘‘Multi Year Tariff Order (MYTO)’’ as the framework for determining the Nigerian Electricity Supply Industry (NESI) pricing structure. Close to a decade of the MYTO model introduction, the NESI has hitherto been faced with nu-merous challenges ranging from its inability to provide sufficient power to its customers to not being viable enough to provide return on capital invested. Ac-cording to Iwayemi, 2008 [6], NESI is probably one of the most inefficient in meeting the needs of its customers globally.
The MYTO review is a critical step towards electricity sector viability and immediate growth [7]. Fundamentally, the assumption that available electricity assets are used to their maximum capacity as embedded in MYTO [8] can be somewhat detrimental to cost of electricity (CoE) generation from operators perspective. For instance, effect of highly influential ambient temperatures on gas turbine performance is not considered; acute part-load operations due to several reasons which in most cases are beyond operators’ control were not en-visaged. These unprecedented changes in plant operations attract performance penalties to include reduction in thermal efficiency, availability and capacity factor. Such penalties directly affect most economic appraisal parameters like the net present value (NPV), internal rate of return (IRR), payback period (PBP) and so on. In most cases gas turbine units in some plants are unavoidably re-dundant because of problems beyond operators’ control. This could be a deter-rent for prospective investors and reduce the anticipated growth of the electricity industry. This could be the case until such times when NERC deem market to be matured enough to implement optimized and realistic pricing model.
Typically, techno-economic models like MYTO developed under several in-fluences ranging from lack of stability of macroeconomic assumptions; unstable marketing performance; underutilization of available power plant technology; and volatile government policies will be prone to uncertainties with issue of risk allocation. Thus, the economic and technical performance of power plant in this situation carries several uncertainties arising from number of sources Sensitivity study is important for accessing the robustness and appraisal’s conclusion [9] [10]. The probability distribution is much more realistic way of describing un-certainties in variables for risk analysis [11]. Probabilistic approach differs from the conventional deterministic approach in the sense that it accepts model input inform of distribution and with Monte Carlo simulation (MCS) produce model output as probability distribution function (PDF). In addition probability ap-proach provides useful information in doing “What if scenario” analyses. The probability distribution of the model input variables can be constructed from historic data or forecast model. Electricity forecast model is divided into two major categories: top-down and bottom-up [12]. The top-down forecast ap-proach uses huge historical data and the most forecasting methods such as re-gression, time series, fuzzy logic, neural network, and expert system belong to

N. B. Anosike et al.
DOI: 10.4236/epe.2017.910038 544 Energy and Power Engineering
top-down forecast approach [13] [14] [15]. On the other hand, the bottom-up approach involves developing engineering modules and using it to capture data at appliance level [16] [17]. The dependency of top-down forecast approach on past data means it does not detect incremental changes that may occur slowly but radical in forecasting behavioral changes.
The suboptimal performance described as nonviable enough to provide return on capital invested in Nigerian electricity generating (Gencos) sector as part of challenges facing NESI is evaluated in this paper. The sensitivity analysis of the so called “Nigerian Electricity Generation Charges Multi-Year Tariff Order” fi-nancial model is evaluated against typical natural gas fired combustion turbine (CT) or open cycle gas turbine (OCGT) performance. This was done considering the performance parameters envisaged to be affected with the operational condi-tion of the power plant experienced in Nigeria today.
2. Description of Multi-Year Tariff Order (MYTO) Methodology
There are three MYTOs; one for each of the sectors in the NESI namely: genera-tion, transmission and distribution/retail. In preparing the MYTO pricing model, NERC had proclaimed the basic targets were: fairness; lowest possible regulated end user tariff without compromising return on investment; simple, transparent and non-excessive regulatory costs. The commission used the building block approach in determining the regulated prices for transmission, distribution and retail tariff path. The building blocks approach is based on projection of perfor-mance, believed to have a combined positive attribute of rate of return regula-tion and price caps. However the methodology for generation is different and employs the long run marginal cost (LRMC) method. The three standard build-ing blocks used in the MYTO development as narrated by Ransome Owen [8] were to achieve the following: allowing return on capital-being the return neces-sary to achieve a fair rate of return on the necessary assets in the business; al-lowing return of capital-associated with recouping the capital over the useful lives of the assets (depreciation); and finally efficient operating costs and over-heads.
The MYTO model is subject to short term minor and long term major reviews. The model since its creation in 2008 (MYTO-1) had seen two major reviews in 2012 (MYTO-2) and 2015 (MYTO-2015). However, the generation tariff order did not see a major change in the MYTO 2015. The current major review for MYTO-2015 tariffs is based on a ten (10) year tariff path (2015-2024). Section 7 of the MYTO-2 mandates the commission to carry out bi-annual minor review for generation, transmission and distribution tariffs. This stated clearly the four parameters to be considered in the review as: foreign exchange rates, gas prices, rate of inflation and generation capacity. Price variation of plus or minus five percent (± 5%) in any of these parameters will lead to the model review. whilst the MYTO major reviews is said to encompass a comprehensive review and overhaul of the overall assumptions in the model. However, this paper is concerned

N. B. Anosike et al.
DOI: 10.4236/epe.2017.910038 545 Energy and Power Engineering
with the generation tariff order or generation charges multi-year tariff order. This is the regulated prices to be paid to licensed electricity generation compa-nies (Gencos) in providing electricity to distribution and retailing companies (Discos). The generation tariff order is divided into two parts; one representing the proclamation of the order and other representing the basis of the other. The detailed information of this generation tariff order is presented in NERC docu-ment NERC/GL115 [18].
Based on cheap price of natural gas in Nigeria, NERC determined that the lowest-cost for new entrant generator will be an open-cycle gas turbine (OCGT) using natural gas. Cost of electricity (CoE) from this technology according to NERC is lower than combined-cycle gas turbines (CCGT) and coal-fired genera-tion. This trend is predicted to change in near future as gas price becomes mar-ket-based; then CCGT is likely to emerge as the benchmark for a lowest-cost new entrant generator. Following the establishment of the OCGT or combustion turbine (CGT) as the new-entrant generator, benchmark for MTYO generation tariff was developed upon this technology for gas fired power plant. The initial method adopted here was to allow the NESI move to a market-based industry, where generators and electricity retailers will be free to contract with each other for supply of electricity. This employed the vesting contract envisaged to be a measure to enable transition to a competitive wholesale market. The Long Run Marginal Cost (LRMC) method which involves calculating the full life cycle cost of the lowest-efficient-cost new entrant generator was used. This was applied in two ways via: 1) benchmark costing: this creates a proxy for the market price which an effi-
cient generator is expected to operate below and 2) individual LRMC for each generator: this sets prices for each generator ac-
cording to its plant and site specific costs. The individual (site-specific) LRMC model requires each new entrant Inde-
pendent Power Producer (IPP) to apply to the NERC for approval beyond the MYTO benchmark.
The benchmark generation cost of an OCGT power plant is price required over the plant life to cover all the cost components as follows: capital cost, fuel cost, tax, transmission costs, return on capital, operating and maintenance cost both fixed and variable (with appropriate costs components escalated). These together with other factors to include capacitor factor, thermal efficiency (heat rate), plant internal energy use (auxiliary requirement) and availability form the input parameters for the LRMC financial model. The unit CoE generated is fined by calculating a price that makes the net present value of the power station equal to zero. The list of assumptions for building the LRMC financial model is de-picted in Table 1 [19]. The model capital cost is calculated as weighted average cost of capital (WACC), from Equations (1)-(3), using capital asset pricing mod-el (CAPM). This is proposed to provide a return on existing assets and appro-priate incentives for future investment.

N. B. Anosike et al.
DOI: 10.4236/epe.2017.910038 546 Energy and Power Engineering
Table 1. Assumptions for calculation of the WACC and LRMC for benchmark OCTG power plant generation tariff order [19].
Parameters
MYTO 1 MYTO 2
New Entrant
Successor Gencos
New Entrant
Successor Gencos
Installed Capacity, MW - - - -
Capacity factor, % 70 63 80 65
Marginal Loss Factor, % 8.05 8.05 8.05 8.05
Thermal efficiency, % 34 34 32 32
Auxiliary requirement, % 1 1 2 2
Construction period, years 2 2 3 3
Plant economic life, years 20 20 20 20
Capital cost, US$/kWh - - - -
Fuel cost, US$/mmBtu 1.8 1.8 1.8 1.8
Fixed O & M cost, ₦/MW/Year - - - -
Variable O & M cost, ₦/MWh - - - -
Availability, % 95 95 95 95
O & M costs escalation , % - - - -
Capital cost escalation , % - - - -
Fuel cost escalation , % - - - -
Corporate tax rate, % 32 32 32 32
Gearing ratio (debt/equity) 70:30 70:30 70:30 70:30
Risk-free rate , % 18 18 18 18
Nominal cost of debt, % 24 24 24 24
Nominal return on equity , % 29 29 29 29
Nominal before tax WACC, % 25 25 25 25
Nominal after tax WACC, % 17 17 17 17
Real pre-tax WACC, % 11 11 11 11
Real after tax WACC, % 7 7 7 7
WACC d eD ER R
D E D E= × + ×
+ + (1)
In which Re is the nominal cost of equity; D is the total market value of debt; E is the total market value of equity and Rd is the nominal cost of debt, given as:
d fR R DRP IC= + + (2)
DRP is the debt risk premium; IC is the debt issuance cost lending in Nigeria; and Rf is the risk free rate observed in the market. Equations (1) and (2) calculate weighted average cost of capital (WACC) without tax and return on equity re-spectively.
N. B. Anosike et al.
DOI: 10.4236/epe.2017.910038 547 Energy and Power Engineering
( ) e f m fR R e R Rβ= + − (3)
Re is the return on equity; eβ is the correlation between the equity risk and overall market risk; mR is the return on the market portfolio; and ( )m fR R− is the market risk premium. The nominal post tax WACC and real pre tax WACC are calculated with Equations (4) and (5) respectively.
( ) ( )Nominal post tax WACC 1e d cE Dw R R TV V
= × + × − × (4)
( ) ( )( ) ( )Real pre tax WACC RW 1 1 1 1cw T i = + − + − (5)
Here V is the total market value of the business, i.e. debt plus equity; cT is the company tax rate; and i is the inflation rate.
3. Research Methodology
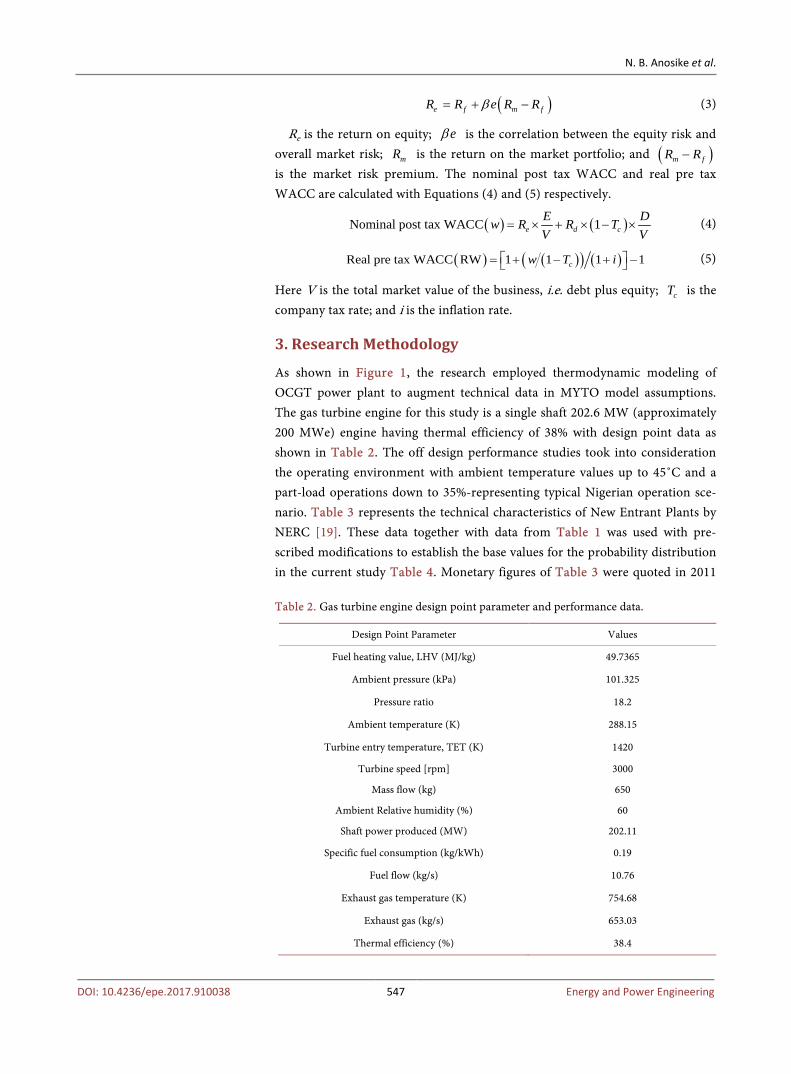
As shown in Figure 1, the research employed thermodynamic modeling of OCGT power plant to augment technical data in MYTO model assumptions. The gas turbine engine for this study is a single shaft 202.6 MW (approximately 200 MWe) engine having thermal efficiency of 38% with design point data as shown in Table 2. The off design performance studies took into consideration the operating environment with ambient temperature values up to 45˚C and a part-load operations down to 35%-representing typical Nigerian operation sce-nario. Table 3 represents the technical characteristics of New Entrant Plants by NERC [19]. These data together with data from Table 1 was used with pre-scribed modifications to establish the base values for the probability distribution in the current study Table 4. Monetary figures of Table 3 were quoted in 2011 Table 2. Gas turbine engine design point parameter and performance data.
Design Point Parameter Values
Fuel heating value, LHV (MJ/kg) 49.7365
Ambient pressure (kPa) 101.325
Pressure ratio 18.2
Ambient temperature (K) 288.15
Turbine entry temperature, TET (K) 1420
Turbine speed [rpm] 3000
Mass flow (kg) 650
Ambient Relative humidity (%) 60
Shaft power produced (MW) 202.11
Specific fuel consumption (kg/kWh) 0.19
Fuel flow (kg/s) 10.76
Exhaust gas temperature (K) 754.68
Exhaust gas (kg/s) 653.03
Thermal efficiency (%) 38.4

N. B. Anosike et al.
DOI: 10.4236/epe.2017.910038 548 Energy and Power Engineering
Table 3. Technical Characteristics of New Entrant Plants-2012 [19].
Description Units OCGT (New Entrant)
Installed capacity MW 250
Capital cost US$/kWh 1200
O & M Cost (Fixed) ₦/MW/Yr 2,496,000
O & M Cost( Variable) ₦/MWh 920
Capacity Factor % 80
Auxiliary Requirement % 2
Economic life Year 20
Construction period Year 3
Sent-out efficiency % 34
Availability % 95
Fuel costs $/mmBtu 1.8
Table 4. Baseline values and distribution types for variable input MYTO model parame-ters.
Description Units OCGT (New Entrant) Distribution Type
Capital cost US$/KWh 1033 Triangular
O & M Cost (Fixed) ₦/MW/Yr 2,496,000 Triangular
O & M Cost( Variable) ₦/MWh 920 Triangular
Capacity Factor % 80 Triangular
Sent-out efficiency % 34 Triangular
Availability % 95 Triangular
Fuel costs $/mmBtu 1.8 Triangular
Capacity degradation % 1.0 Triangular
Forex $ 168 Triangular
reference value and converted to 2016 value of money using Equation (6). Simi-larly, Equation (7) was used to convert 250 MW plant capacity cost components of Table 3 to equivalent cost components capacity (200 MWe) in this study. As shown in Equation (7), the cost, ERP of a GT unit of size S is related to cost,
ORP of the reference GT unit size oS by means of a scaling factor f taken as 0.67 [20]. In Equation 6, RP is the price at reference year, OP is the original price. The ODP performance simulations data to include plant thermal efficien-cies at varying load and ambient temperature among others were used to build the distributions for the power plant performance parameters in the MYTO model (Table 4) for MCS. Finally, the MCS of MYTO generation tariff order fi-nancial model in [21] was performed to determine the sensitivity of uncertain input parameters to OCGT power plant generation cost.

N. B. Anosike et al.
DOI: 10.4236/epe.2017.910038 549 Energy and Power Engineering
Figure 1. Layout of research approach.
price index at reference yearprice index during the original priceR OP P
= ×
(6)
( ) o
fER R oP P S S= × (7)
4. Results and Discussions
The sensitivity of input parameters (both technical and economic) to OCGT generation cost in the MYTO generation financial model is presented. Table 5 shows statistics of probabilistic input data resulting from distribution types and nominal values of parameters. The generation CoE in ₦/kWh ranges from 9.89 to 15.45. The major contributors of uncertainty is outlined and ranked Figure 2 and Figure 3 respectively. Specifically in Figure 3, the value of the input para-meters were ranked by effect on output mean of CoE (approximately ₦12.00 ₦/kWh). The most ranked input parameter is the foreign exchange rate (Forex). Quantitatively, this statistical value of Forex in MYTO has the ability of chang-ing the mean CoE at ₦12.06 ₦/kWh to a value between 10.68 and 13.27 ₦/kWh. The remaining input parameters in descending order of sensitivity are fuel cost; variable operation and maintenance (O & M) cost; plant efficiency; average plant capacity degradation; fixed operation and maintenance cost; and plant capacity factor. However, effects of other input parameters namely: capital cost, depreca-tion, pre-tax real weighted average capital cost (WACC), and corporate tax rate were trivial, (at least on the assumption limits used for their distribution con-struction).
The three input parameters (thermal efficiency, fixed O & M cost, and plant capacity factor) (Figure 3), have negative correlation coefficients. Typically, this indicates that these parameters are each inversely proportional to the CoE when other input parameters are held constant. This reveals significant information.

N. B. Anosike et al.
DOI: 10.4236/epe.2017.910038 550 Energy and Power Engineering
Table 5. Statistical data from various parameter distributions and COE distribution.
Parameter Statistics
Min. Max. Mean Mode Median Std. Dev. Skewness Kurtosis
Capital cost 173,544 300,000 224,180 198,996 220,085.79 27,305.24 0.474 2.40
O & M cost (Fixed) 72,741.5 90,015.6 78,499.5 72,741.4 77,800.96 4071.56 0.57 2.40
O & M cost( Variable) 1386.3 2386.3 1719.6 1386.3 1679.14 235.70 0.57 2.40
Sent-out efficiency 19.0% 32.0% 26.3% 28% 26.6% 2.72% -0.34 2.40
Fuel costs ($/mmBtu) 1.8 3.0 2.2 1.8 2.15 0.28 0.57 2.40
Capacity factor 35% 80.0% 65.0% 80% 66.8% 10.61% -0.57 2.40
Capacity degradation 1.0% 3.0% 1.7% 1.0% 1.6% 0.47% 0.57 2.40
Forex 161.0 420.0 300 320 304.5 53.32 -0.22 2.40
Depreciation 5.0% 8.0% 6.0% 5.0% 5.9% 0.71% 0.57 2.40
Pre-Tax Real WACC 11.0% 15.0% 12.3% 11.0% 12.2% 0.94% 0.57 2.40
Corporate tax rate 32.0% 40.0% 34.7% 32.0% 34.3% 1.89% 0.57 2.40
CoE (₦/kWh) 9.84 15.45 12.06 12.02 12.03 0.98 0.28 2.81
Figure 2. MYTO generation financial model input parameters ranked by effect on output mean of CoE, (₦/kWh). For instance, considering many factors that can affect thermal efficiency (part- load operations, high ambient temperature, component degradations), it means is quite sensitive to the overall CoE, since it will be almost impossible for it not to vary in the present power plant operations trend in Nigeria. Seemingly, power plant thermal efficient monitoring becomes essential for viable economic sus-tenance of given plant. To this end and given the present power plant operation

N. B. Anosike et al.
DOI: 10.4236/epe.2017.910038 551 Energy and Power Engineering
Figure 3. MYTO model for generation input parameter correlation coefficients. with protracted part-load, it is recommendable for gas turbines engines with flexible efficiency in part-load operations like the GE LMS 100 among others be considered.
Invariably part-load operations will have multiple effects as it will directly af-fect both efficiency and capacity factor. Impact of plant degradation is further emphasized by the average capacity degradation correlation coefficient. This highlights the important of gas turbine engine’s inlet air filtration application to limit fouling.
The probabilistic representation of CoE is useful in making decisions as it gives information on the probability of energy cost within the cost range in the probability distribution function. In Figure 4, starting with the two vertical lines corresponding to 10.5 and 13.80 ₦/kWh CoE, numerous amount of information can be revealed. Normally, moving any of the vertical lines in either direction of increasing or decreasing (right or left) CoE gives the probability at any desired value. For instance, the state of the plot presently gives the following informa-tion: 1) the probability of CoE less than 10.50 ₦/kWh is 5% and 95% above this value; 2) the probability of CoE between 10.5 and 13.80 ₦/kWh is 90%; 3) the probability of CoE below and above 13.8 ₦/kWh is 5% and 5% respectively. Figure 5 reveals that certain input parameters will only have influence on the CoE at certain values (at least above 13.27 ₦/kWh for capacity factor, fixed and variable O & M costs). Typically the highly influential parameters will have im-pact at all level of CoE.
5. Conclusion
In this study, the probabilistic approach has been applied to study and discuss the sensitivity of selected input parameters to CoE generation in the MYTO genera-tion tariff order financial model of NERC. The combined effect of protracted

N. B. Anosike et al.
DOI: 10.4236/epe.2017.910038 552 Energy and Power Engineering
Figure 4. Total generation CoE with probability in percentile.
Figure 5. Change in output 100% percentile across range of input values. part-load operation and increasing ambient temperature on the thermal effi-ciency of gas turbine engine was evaluated. The importance of gas turbine en-gines with flexible efficiency in part-load operations has been highlighted. Some selected input parameters prone to uncertainties in MYTO generation tariff or-der model were evaluated. The major input parameters with high uncertainty were revealed and their correlation coefficients determined. The probabilistic approach gives a better understanding of the CoE variations and to what extent it will go beyond a given expected value. The statistics of CoE in ₦/kWh is given as: minimum cost, 9.84; maximum cost, 15.45; mean cost, 12.06; mode, 12.02;
N. B. Anosike et al.
DOI: 10.4236/epe.2017.910038 553 Energy and Power Engineering
median, 12.03; and standard deviation, 0.98 with cost distribution skewness and kurtosis of 0.28 and 2.81 respectively. To some extent, these results hinge on the assumption of this analysis, above all on the probabilistic distribution chosen for the MYTO model input parameters considered. This study will help investors and policy makers to take into account these variables in future development of MYTO pricing model and in achieving optimized and realistic model.
References [1] Consultation Paper for the Review of the Transmission Company of Nigeria (TCN)
Tariff under the Multi-Year Tariff Order Methodology; February 2015.
[2] Oyedepo, S.O., Fagbenle, R.O., Adefila, S.S. and Adavbiele, S.A. (2014) Performance Evaluation and Economic Analysis of a Gas Turbine Power Plant in Nigeria. Energy Conversion and Management, 79, 431-440. https://doi.org/10.1016/j.enconman.2013.12.034
[3] Sule, B.F., Ajao, K.R., Ajimotokan, H.A. and Garba, M.K. (2011) Compact Fluores-cent Lamps and Electricity Consumption Trends in Residential Buildings in Ilorin, Nigeria. International Journal of Energy Sector Manage, 5, 162-168. https://doi.org/10.1108/17506221111145968
[4] Imperatives, Strategic. (2016) Report of the World Commission on Environment and Development: Our Common Future. http://www.un-documents.net/our-common-future.pdf
[5] Amadi, S. (2014) NERC’s Strategic Sectorial Prioritization Action Plan for Post Pri-vation Overall Development 2014. Nigerian Electricity Regulatory Commission. http://www.nercng.org/index.php/component/remository/NERC-Letters-Presentations-Reports-and-Papers/orderby,1/page,2/?Itemid=0
[6] Iwayemi, A. (2008) Investment in Electricity Generation and Transmission in Nige-ria: Issues and Options. International Association for Energy Economics, First Quarters, 37-42.
[7] Ekpo, E.O. (2012) MYTO 2 and Embedded Generation; GE Nigeria Power Devel-opment Summit 4/2012.
[8] Ransome, O. (2007) Nigerian Electricity Regulatory Commission’s-Notice of Pro-posed Establishment of a Methodology for a Multi-Year Tariff Order; Federal Repub-lic of Nigeria Official Gazette. The Federal Government Printer, Lagos, 18, 124-133
[9] Walter S., Danie, J.P. and Thomas, H. (1995) A Manual for the Economic Evalua-tion of Energy Efficiency and Renewable Energy Technologies (NREL) Report No. NREL/TP-462-5173.
[10] The Economic Appraisal of Investment Projects at the European Investment Bank (EIB), 2013. http://www.eib.org/attachments/thematic/economic_appraisal_of_investment_projects_en.pdf
[11] Anosike, N.B. (2013) Technoeconomic Evaluation of Flared Natural Gas Reduction and Energy Recovery Using Gas-to-Wire Scheme. Ph.D. Thesis, Cranfield Univer-sity, United Kingdom.
[12] Swan, L.G. and Ugursal, V.I. (2009) Modeling of End-Use Energy Consumption in the Residential Sector: A Review of Modeling Techniques. Renewable and Sustaina-ble Energy Reviews, 13, 1819-1835. https://doi.org/10.1016/j.rser.2008.09.033
[13] Alfares, H.K. and Nazeeruddin, M. (2002) Electric Load Forecasting: Literature Survey and Classification of Methods. International Journal of Systems Science, 33,
N. B. Anosike et al.
DOI: 10.4236/epe.2017.910038 554 Energy and Power Engineering
23-34. https://doi.org/10.1080/00207720110067421
[14] Tzafestas, S. and Tzafestas, E. (2001) Computational Intelligence Techniques for Short Term Electric Load Forecasting. Journal of Intelligent and Robotic Systems, 31, 7-68. https://doi.org/10.1023/A:1012402930055
[15] Nowicka-Zagrajek, J. and Weron, R. (2002) Modeling Electricity Loads in Califor-nia: ARMA Models with Hyperbolic Noise. Signal Processing, 82, 1903-1915. https://doi.org/10.1016/S0165-1684(02)00318-3
[16] Paatero, J.V. and Lund, P.D. (2006) A Model for Generating Household Electricity Load Profiles. International Journal of Energy Research, 30, 273-290. https://doi.org/10.1002/er.1136
[17] Larsen, B.M. and Nesbakken, R. (2004) Household Electricity End-use Consump-tion: Results from Econometric and Engineering Models. Energy Economics, 26, 179-200. https://doi.org/10.1016/j.eneco.2004.02.001
[18] NERC Multi-Year Tariff Order for the Determination of the Cost of Electricity Generation for the period 1 June 2012 to 31 may 2017. http://www.ecowrex.org/system/files/documents/2012_multiyear-tariff-order-generation_nerc.pdf
[19] Amadi, S. and Andzenge, S. (2012) Multi-Year Tariff Order for the Determining of the Cost of Electricity Generation for the Period 1 June 2012 to 31 May 2017; Nige-rian Electricity Regulatory Commission. http://www.nercng.org
[20] Browne, T. (2007) Engineering Economics and Economic Design for Process Engi-neers. CRC Press, Bosca Raton.
[21] MYTO-New-Entant-IPP.xlsm Model. http://www.nerc.ng
Submit or recommend next manuscript to SCIRP and we will provide best service for you:
Accepting pre-submission inquiries through Email, Facebook, LinkedIn, Twitter, etc. A wide selection of journals (inclusive of 9 subjects, more than 200 journals) Providing 24-hour high-quality service User-friendly online submission system Fair and swift peer-review system Efficient typesetting and proofreading procedure Display of the result of downloads and visits, as well as the number of cited articles Maximum dissemination of your research work
Submit your manuscript at: http://papersubmission.scirp.org/ Or contact [email protected]