an-najah national university. faculty of engineering … · electric power systems lab 63527...
TRANSCRIPT

An-Najah National University.
Faculty of Engineering
Electrical Engineering Department
Electric Power Systems Lab
63527
Student manual
Prepared by:
Dr. Maher Jalal Khammash
Eng. Saeed Bahjat Dwaikat
First edition
Nablus
2013

Groups and experiments distribution during the first or the second semester
Group 4Group 3Group 2Group 1
groups
weeks
Exp. 1Exp. 1Exp. 1Exp. 1Week 1
Exp. 3Exp. 3Exp 2Exp .2Week 2
Exp. 2Exp. 2Exp. 3Exp. 3Week 3
Exp. 5Exp. 5Exp. 4Exp. 4Week 4
Exp. 4Exp. 4Exp .5Exp. 5Week 5
Exp. 7Exp.7Exp. 6Exp. 6Week 6
Exp. 6Exp. 6Exp. 7Exp. 7Week 7
Exp. 9Exp. 9Exp. 8Exp. 8Week 8
Exp. 8Exp. 8Exp. 9Exp. 9Week 9
Exp. 11Exp. 11Exp. 10Exp. 10Week 10
Exp. 10Exp. 10Exp. 11Exp. 11Week 11
Exp. 13Exp. 13Exp. 12Exp. 12Week 12
Exp. 12Exp. 12Exp. 13Exp. 13Week 13
Review and discussion Week 14
Practical and theoretical exams Week 15

An najah National University Faculty of Engineering / Electrical Engineering Department
Power Systems Lab (63527) Dr. Maher Khammash & Eng. Saeed Dwaikat
:List of Lab experiments
1. Experiment #1: Introduction to power systems lab ……....… page 12. Experiment #2: Motor – generator unit …………………....… page 23. Experiment #3: Transmission line at no load ……………..…..page 94. Experiment #4: Protection relays ………………………..….....page 185. Experiment #5: T.L performance under different load ……...page 26
c conditions 6. Experiment #6: Parallel operation of two generator……….....page 367. Experiment #7: Series and parallel operations of power…….. page 48
t transmission lines under load8. Experiment #8: Parallel connection of a three-phase ………..page 62
c Synchronous Generator with the public c mains
9. Experiment #9: Studying the operation of a power…………..page 71 c transmission line in condition of c ground fault
10. Experiment #10: Power factor correction by using…………… page 80 c synchronous compensator
11. Experiment #11: Power factor correction by using…………… page 88 c C – PF/EV panel
12. Experiment #12 : Study the operation of protection …………..page 97 c relays including distance protection c relays on a power system
13. Experiment #13 : The operation of an over all power system….age 107

An najah National University Faculty of Engineering / Electrical Engineering Department
Power Systems Lab (63527) Dr. Maher Khammash & Eng. Saeed Dwaikat
1
Experiment #1
Introduction to power systems lab
Objectives
1. To discuss the instructions of public safety rules and to show the importance of these rules in the electric power systems lab.
2. To clarify the information and practical experience gained by the students through this lab and its importance in life.
3. Distribution of students into working groups to stimulate teamwork4. To discuss the course outline and to identify the laboratory
experiments.5. To describe all of the power systems equipment and devices and how
to use and deal with these apparatus safely.6. To guide the students how to prepare the experiments before doing
them in the lab and how to write the report of the experiments.

Faculty of Engineering
Power Systems Lab (63527) Dr. Maher Khammash & Eng. Saeed Dwaikat
Motor
Objectives:
1. To be familiarized with the procedures required to start and stop syn. Generators.
2. To understand the voltage characteristic of the Syn. Generator loaded with various resistive, capacitive and
3. To understand the regulation characteristic required to compensate the voltage of the Syn. Generator loaded with various resistive, capacitive and inductive loads.
Introduction
What is The Generator?
In electricity generation, an electric mechanical energy to electrical energy. A generator forces electric charge (usually carried by electrons) to flow through an external electrical circuit. The source of mechanical energy may be a reciprocating or turbine water falling through a turbine or waterwheel, an internal combustion engine, a wind turbine, a hand crank, compressed air, or any other source of mechanical energy.
The reverse conversion of electrical energy into mechanical energy is by an electric motor, and motors and generators have many similarities. Many motors can be mechanically driven to generate electricity, and frequently make acceptable generators.
Equivalent circuit.
The following circuit diagrams illustrate the pround rotor synchronous machine in the generator mode.
VVff:: Is the field voltage of the exciter. EEff:: Is the Generator internal voltage.VVtt:: Is the Generator Terminal voltage.XXss:: Is the Generator Reactance.RRff:: Is the field resistor. IIff:: Is the field current. IIaa:: is the output current.
An najah National UniversityFaculty of Engineering / Electrical Engineering Department
Power Systems Lab (63527) Dr. Maher Khammash & Eng. Saeed Dwaikat
2
Experiment #2
Motor-Generator Unit
To be familiarized with the procedures required to start and stop syn.
To understand the voltage characteristic of the Syn. Generator loaded with various resistive, capacitive and inductive loads.To understand the regulation characteristic required to compensate the voltage of the Syn. Generator loaded with various resistive, capacitive and
In electricity generation, an electric generator is a device that converts mechanical energy to electrical energy. A generator forces electric charge (usually carried by electrons) to flow through an external electrical circuit. The source of mechanical energy may be a reciprocating or turbine steam engine, water falling through a turbine or waterwheel, an internal combustion engine, a wind turbine, a hand crank, compressed air, or any other source of mechanical
The reverse conversion of electrical energy into mechanical energy is by an electric motor, and motors and generators have many similarities. Many motors can be mechanically driven to generate electricity, and frequently make
The following circuit diagrams illustrate the per phase equivalent circuits of a round rotor synchronous machine in the generator mode.
Is the field voltage of the exciter. Is the Generator internal voltage.Is the Generator Terminal voltage.Is the Generator Reactance.Is the field resistor. Figure.1: E.Circuit.
Power Systems Lab (63527) Dr. Maher Khammash & Eng. Saeed Dwaikat
To be familiarized with the procedures required to start and stop syn.
To understand the voltage characteristic of the Syn. Generator loaded with
To understand the regulation characteristic required to compensate the voltage of the Syn. Generator loaded with various resistive, capacitive and
generator is a device that converts mechanical energy to electrical energy. A generator forces electric charge (usually carried by electrons) to flow through an external electrical circuit. The
steam engine, water falling through a turbine or waterwheel, an internal combustion engine, a wind turbine, a hand crank, compressed air, or any other source of mechanical
The reverse conversion of electrical energy into mechanical energy is done by an electric motor, and motors and generators have many similarities. Many motors can be mechanically driven to generate electricity, and frequently make
er phase equivalent circuits of a
Figure.1: E.Circuit.

Faculty of Engineering
Power Systems Lab (63527) Dr. Maher Khammash & Eng. Saeed Dwaikat
Phasor Diagram of standalone synchronous generator An understanding of how load changes effectcan be obtained by considering the simplified phasor diagram.
EE:: Is the Generator internal voltage.VV:: Is the Generator Terminal voltage.XXss:: Is the Generator Reactance.IIAA:: is the output current.θθ:: is the Power factor angle.δδ:: is the torque angle.
Equipments required (Apparatuses)
1. Control board for the generating set mod.GCB2. Synchronous generator3. Variable resistive load mod.RL4. Variable inductive load mod.IL5. Variable capacitive load mod.CL
Experimental procedure:
1. Make sure that the generating to complete wiring the controare not connected.
2. Connect a parallel combination of resistive, inductive and capacitive 3. Make sure that the digital power analyzer is well 4. Connect a digital ammeter to
Generator, so you end up with the conne
An najah National UniversityFaculty of Engineering / Electrical Engineering Department
Power Systems Lab (63527) Dr. Maher Khammash & Eng. Saeed Dwaikat
3
Phasor Diagram of standalone synchronous generatorAn understanding of how load changes effect the operation of the generator
can be obtained by considering the simplified phasor diagram.
Is the Generator internal voltage.Is the Generator Terminal voltage.Is the Generator Reactance.
Figure.2: Phasor diagram
(Apparatuses):
Control board for the generating set mod.GCB-2/EV.Synchronous generator-motor unit mod.MSG-1/EV.Variable resistive load mod.RL-2/EV.Variable inductive load mod.IL-2/EV.Variable capacitive load mod.CL-2/EV.
Experimental procedure:
Make sure that the generating unit set is well connected, and thento complete wiring the control board and make sure that protection relays
combination of resistive, inductive and capacitive Make sure that the digital power analyzer is well connected.
ammeter to the excitation circuit of the synso you end up with the connections shown in figure#1
Power Systems Lab (63527) Dr. Maher Khammash & Eng. Saeed Dwaikat
the operation of the generator
Figure.2: Phasor diagram
and then continue l board and make sure that protection relays
combination of resistive, inductive and capacitive loads.
the excitation circuit of the synchronousure#1

An najah National University Faculty of Engineering / Electrical Engineering Department
Power Systems Lab (63527) Dr. Maher Khammash & Eng. Saeed Dwaikat
4
Figure#1
Part I: Load characteristic at constant excitation
1. Make sure that all loads are switched off .2. Activate the prime mover and adjust the frequency to 50Hz with help of
the power analyzer.3. Adjust the excitation current of the syn. generator to obtain 400V .4. Set the syn. generator under load by inserting the first step of the resistive
load (RL=720Ω) and write down the load current (ILoad), terminal voltage(VT) and the power consumed by the load then calculate thevoltage regulation (VR ).
5. Repeat the previous step but with different values of the resistive load and fill table(1).
6.

An najah National University Faculty of Engineering / Electrical Engineering Department
Power Systems Lab (63527) Dr. Maher Khammash & Eng. Saeed Dwaikat
5
RLoad(Ω) ILoad (A) VT (V) P (W) V.R(%)
Open circuit 0 400 0A 720B 360
A//B 240C 180
A//C 144B//C 120
A//B//C 103
Table(1)7. Switch off all loads and make sure that the no-load voltage is 400V.8. Use a fixed 720Ω resistance in parallel with first step of the inductive load
and write down the load current (ILoad), terminal voltage(VT) and the power consumed by the load then calculate the voltage regulation (VR ).
9. Repeat the previous step but with different values of the inductive load and fill table(2).
LOADILoad (A) VT (V) P (W) V.R(%)
R(Ω) L(mH)
Open circuit 0 400 0720Ω A720Ω B720Ω A//B720Ω C720Ω A//C720Ω B//C720Ω A//B//C
Table(2)
10.Switch off all loads and set the no-load voltage at 300V.(why?)11.Use a fixed 720Ω resistance in parallel with the first step of the capacitive
load and write down the load current(ILoad),terminal voltage(VT) and the power ,then calculate the voltage regulation (VR ).
12.Repeat the previous step but with different values of capacitive load and fill table(3).

An najah National University Faculty of Engineering / Electrical Engineering Department
Power Systems Lab (63527) Dr. Maher Khammash & Eng. Saeed Dwaikat
6
( CAUTION: DO NOT allow the terminal voltage to cross 450V )
LOADILoad (A) VT (V) P (W) V.R(%)
R(Ω) C (µF)
Open circuit 0 300 0720Ω A720Ω B720Ω AB
Table(3)
Sketch the terminal characteristic of this generator for different type of loads (R, RL & RC ) . VT = f(IL)
Part II: Regulation characteristic at constant terminal voltage
1. Make sure that all loads are switched off.2. Set the terminal no-load voltage to 400V by varying the excitation current.3. Set the syn. generator under load by inserting the first step of the resistive
load (RL=720Ω) .4. Increase the excitation current to obtain 400V line to line voltage the on
generator terminals and write down the values of load current, excitation current and the power.
5. Repeat the previous step but with different values of resistive loads and fill table(4). For each steps of varying load you must return the value of terminal voltage to 400 V
( CAUTION: DO NOT allow excitation current to cross over 0.43A )
RLoad(Ω) ILoad (A) Iexitation (A) P (W)
Open circuit 0 0A 720B 360
A//B 240C 180
Table(4)

An najah National University Faculty of Engineering / Electrical Engineering Department
Power Systems Lab (63527) Dr. Maher Khammash & Eng. Saeed Dwaikat
7
6. Decrease the excitation current, switch all loads off then set the no-load voltage to 400V.
7. Set the syn. generator under load using a fixed 720Ω resistance in parallel with first step of the inductive load .
8. Increase the excitation current to obtain 400V and write down the values of the load current, excitation current and power.
9. Repeat the previous step but with different values of inductive load and fill table(5).
( CAUTION: DO NOT allow excitation current to cross over 0.43A )
loadILoad (A) Iexitation (A) P (W)
RLoad(Ω) L(mH)
Open circuit 0 0720 A720 B 720 A//B720 C
Table(5)
10.Decrease the excitation current, switch off all loads then set the terminal no-load voltage to 300V.
11.Set the syn. generator under load using a fixed 720Ω resistance in parallel with first step of the capacitive load .
12.Decrease the excitation current to obtain 300V and write down the values of the load current, excitation current and power. (Be Quick)
13.Repeat the previous step but with different values of capacitive load and fill table(6).
( CAUTION: DO NOT allow excitation current to cross over 0.43A )
loadILoad (A) Iexitation (A) P (W)
RLoad(Ω) C (µF)
Open circuit 0 0720 A720 B 720 A//B
Table(6)
Sketch the regulation characteristic of this generator for different type of loads (R, RL & RC ) . If = f(IL)

An najah National University Faculty of Engineering / Electrical Engineering Department
Power Systems Lab (63527) Dr. Maher Khammash & Eng. Saeed Dwaikat
8
Question1
What are the effects of increasing loads on the terminal voltage in each case ?
Question2
How can we reduce those effects ?
Question3
How can we protect the consumers from those effects ?
Question4
Draw a phasor diagram to explain the effect of resistive load upon the terminal voltage of the synchronous generator
Question5
Draw a phasor diagram to explain the effect of resistive inductive load upon the terminal voltage of the synchronous generator
Question6
Draw a phasor diagram to explain the effect of resistive capacitive load upon the terminal voltage of the synchronous generator
Write down your conclusions:

An najah National University Faculty of Engineering / Electrical Engineering Department
Power Systems Lab (63527) Dr. Maher Khammash & Eng. Saeed Dwaikat
9
Experiment # 3
Transmission Line at NO Load
Objectives
To operate single and dual transmission lines at no load while changing the connection of transmission line equivalent capacitance and notice the changes on the receiving voltage, charging current, active power, reactive power and power factor.
:Introduction
In this experiment we will study the operation of power system transmission line in no load condition, and study the effect of this case at different value like, sending end voltage receiving end voltage, power factor, and the amount of reactive and active power at the sending end of the transmission line.
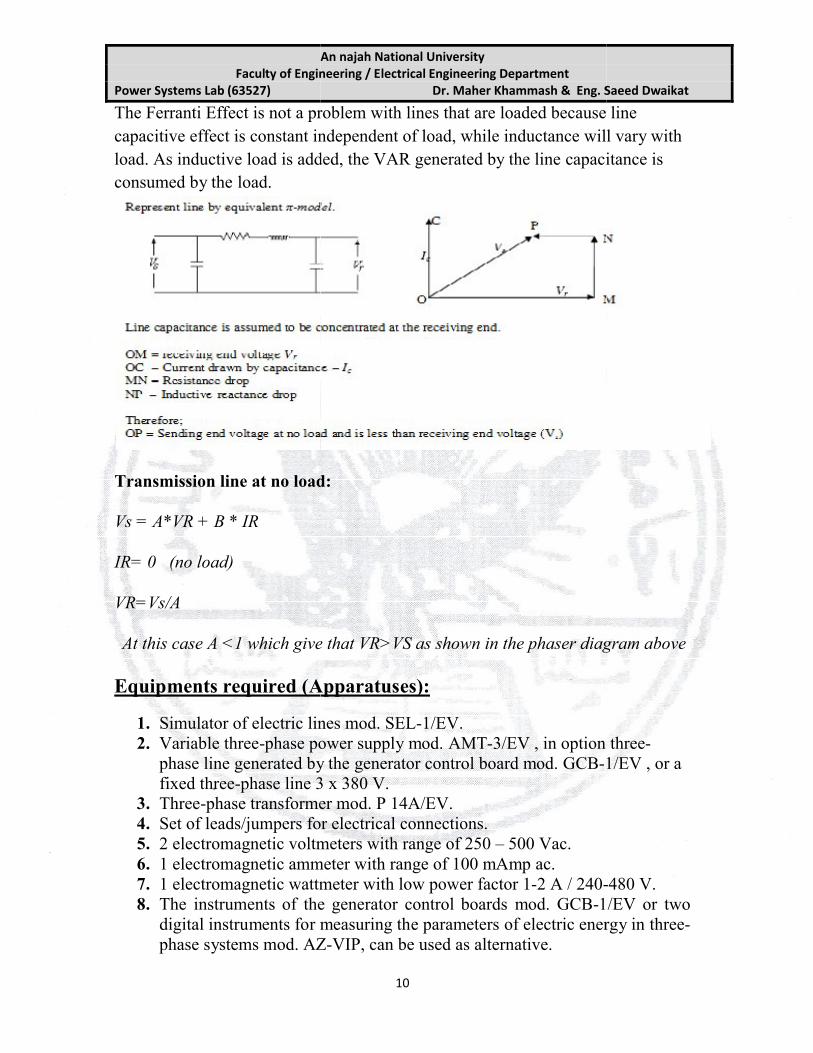
A long transmission line draws a substantial quantity of charging current. If such a line is open circuited or very lightly loaded at the receiving end, the voltage at receiving end may become greater than voltage at sending end. This is known as Ferranti Effect and is due to the voltage drop across the line inductance (due to charging current) being in phase with the sending end voltages. Therefore both capacitance and inductance is responsible to produce this phenomenon.
The capacitance (and charging current) is negligible in short line but significant in medium line and appreciable in long line. Therefore this phenomenon occurs in medium and long lines. .
The Ferranti Effect occurs when current drawn by the distributed capacitance of the transmission line itself is greater than the current associated with the load at the receiving end of the line. Therefore, the Ferranti effect tends to be a bigger problem on lightly loaded lines, and especially on underground cable circuits where the shunt capacitance is greater than with a corresponding overhead line. This effect is due to the voltage drop across the line inductance (due to charging current) being in phase with the sending end voltages. As this voltage drop affects the sending end voltage, the receiving end voltage becomes greater. The Ferranti Effect will be more pronounced the longer the line and the higher the voltage applied.
Faculty of Engineering
Power Systems Lab (63527) Dr. Maher Khammash & Eng. Saeed Dwaikat
The Ferranti Effect is not a problem with lines that are loaded because line capacitive effect is constant independent of load, while inductance will vary with load. As inductive load is added, the VAR generated by the line consumed by the load.
Transmission line at no load:
Vs = A*VR + B * IR
IR= 0 (no load)
VR=Vs/A
At this case A <1 which give that VR>VS
Equipments required (Apparatuses):
1. Simulator of electric lines mod. SEL2. Variable three-phase power supply mod. AMT
phase line generated by the generator control board mod. GCBfixed three-phase line 3 x 380 V.
3. Three-phase transformer mod. P 14A/EV.4. Set of leads/jumpers for electrical connections.5. 2 electromagnetic voltmeters with range of 250 6. 1 electromagnetic ammeter with range of 100 mA7. 1 electromagnetic wattmeter with low power factor 18. The instruments of the generator control boards mod. GCB
digital instruments for measuring the parameters of electric energy in threephase systems mod. AZ
An najah National UniversityFaculty of Engineering / Electrical Engineering Department
Power Systems Lab (63527) Dr. Maher Khammash & Eng. Saeed Dwaikat
10
The Ferranti Effect is not a problem with lines that are loaded because line capacitive effect is constant independent of load, while inductance will vary with
load is added, the VAR generated by the line capacitance is
Transmission line at no load:
At this case A <1 which give that VR>VS as shown in the phaser diagram above
required (Apparatuses):
Simulator of electric lines mod. SEL-1/EV.phase power supply mod. AMT-3/EV , in option three
phase line generated by the generator control board mod. GCB-1/EV , or a phase line 3 x 380 V.
transformer mod. P 14A/EV.Set of leads/jumpers for electrical connections.2 electromagnetic voltmeters with range of 250 – 500 Vac.1 electromagnetic ammeter with range of 100 mAmp ac.1 electromagnetic wattmeter with low power factor 1-2 A / 240-The instruments of the generator control boards mod. GCB-1/EV or two digital instruments for measuring the parameters of electric energy in threephase systems mod. AZ-VIP, can be used as alternative.
Power Systems Lab (63527) Dr. Maher Khammash & Eng. Saeed Dwaikat
The Ferranti Effect is not a problem with lines that are loaded because line capacitive effect is constant independent of load, while inductance will vary with
apacitance is
phaser diagram above
3/EV , in option three-1/EV , or a
-480 V.1/EV or two
digital instruments for measuring the parameters of electric energy in three-

An najah National University Faculty of Engineering / Electrical Engineering Department
Power Systems Lab (63527) Dr. Maher Khammash & Eng. Saeed Dwaikat
11
Preparing the exercise1. Start this exercise considering the transmission LINE 1 with the following
constants: Resistance = 25 Ω; Capacitance = 0.2 µF; Inductance = 0.072 H; Length = 50 km; Section = 35 mm² - conductor of copper. As regards other parameters, refer to the table 2.1.
2. If necessary, remove all the jumpers of the LINE 2 not considered.3. Turn the breakers at the origin and at the end of the LINE 1, to OFF.4. Connect the measuring instruments between the left busway and the
terminals at the beginning of the LINE 1 and the right busway.5. Connect the jumpers with the set of left capacitors, only in the LINE 1, to
reproduce the capacitance between active conductors (called CL). These capacitors can be connected either in star or delta configuration. The delta connection will ensure stronger capacitive currents.
6. Adjust the position of the selector Resistance LINE 1 at the value of 25 Ω.7. Connect with the variable three-phase power supply by inserting the three-
phase insulation transformer.8. The transformer is used to insulate the line from the user mains to avoid
that, when connected, the current unbalances of the capacitance CE (capacitance to the ground) can provoke the untimely intervention of the differential protections of high sensitiveness. If the power supply is insulated from the mains, that is it is not grounded, this three-phase transformer can be omitted.
Single Transmission Line
Connect the circuit as shown in figure #1

An najah National University Faculty of Engineering / Electrical Engineering Department
Power Systems Lab (63527) Dr. Maher Khammash & Eng. Saeed Dwaikat
12
Figure #1
Connection #1
1. Connect the capacitors at the sending end of the transmission line on ∆ connection
2. Connect the capacitors at the receiving end of the transmission line on Ү connection
3. Keep the voltage Vs=380 v4. Read the electric quantities on the measuring instruments and write them
down in the following table (table #1).
(V) (A) (W) (Var) (V)
Table #1
Calculate the reactive power generated by the capacitors in this part and compare it with the measured value on the line

An najah National University Faculty of Engineering / Electrical Engineering Department
Power Systems Lab (63527) Dr. Maher Khammash & Eng. Saeed Dwaikat
13
Connection #2
1. Connect the capacitors at the sending end of the transmission line on ∆ connection
2. Disconnect the capacitors at the receiving end of the transmission line3. Keep the voltage Vs=380 v . 4. Read the electric quantities on the measuring instruments and write them
down in the following table (table #2).
(V) (A) (W) (Var) (V)
Table #2
Calculate the reactive power generated by the capacitors in this part and compare it with the measured value on the line
Connection #3
Connect the capacitors at the sending end of the transmission line on ∆ connection
Connect the capacitors at the receiving end of the transmission line on ∆ connection
Keep the voltage Vs=380 v . Read the electric quantities on the measuring instruments and write them
down in the following table (table #3).
(V) (A) (W) (Var) (V)
Table #3
Calculate the reactive power generated by the capacitors in this part and compare it with the measured value on the line

An najah National University Faculty of Engineering / Electrical Engineering Department
Power Systems Lab (63527) Dr. Maher Khammash & Eng. Saeed Dwaikat
14
Series Connection of Two Transmission Line at No load
Connect the circuit as shown in figure#2
Figure#2
Connection #1
1. Connect the capacitor at the sending end of the first transmission line to ∆ connection
2. Connect the capacitor at the receiving end the first transmission line to Ү connection
3. Connect the capacitor at the sending end of the second transmission line to∆ connection
4. Connect the capacitor at the receiving end the second transmission line to ∆ connection
5. Keep the voltage Vs=380 v .6. Read the electric quantities on the measuring instruments and write them
down in the following table (table #4).
(V) (A) (W) (Var) (V)
Table #4

An najah National University Faculty of Engineering / Electrical Engineering Department
Power Systems Lab (63527) Dr. Maher Khammash & Eng. Saeed Dwaikat
15
Calculate the reactive power generated by the capacitors in this part and compare it with the measured value on the line
Connection #2
1. Connect the capacitor at the sending end of the first transmission line to ∆ connection
2. Connect the capacitor at the receiving end the first transmission line to ∆connection
3. Connect the capacitor at the sending end of the second transmission line to∆ connection
4. Connect the capacitor at the receiving end the second transmission line to ∆ connection
5. Keep the voltage Vs=380 v .6. Read the electric quantities on the measuring instruments and write them
down in the following table (table #5). .
(V) (A) (W) (Var) (V)
Table #5Calculate the reactive power generated by the capacitors in this part and compare it with the measured value on the line

An najah National University Faculty of Engineering / Electrical Engineering Department
Power Systems Lab (63527) Dr. Maher Khammash & Eng. Saeed Dwaikat
16
Parallel Connection of Two Transmission Line at No load
Connect the circuit as shown in figure#3
Figure#3
Connection #1
7. Connect the capacitor at the sending end of the first transmission line to ∆ connection
8. Connect the capacitor at the receiving end the first transmission line to Ү connection
9. Connect the capacitor at the sending end of the second transmission line to∆ connection
10.Connect the capacitor at the receiving end the second transmission line to ∆ connection
11.Keep the voltage Vs=380 v .12.Read the electric quantities on the measuring instruments and write them
down in the following table. (Table #6).
(V) (A) (W) (Var) (V)
Table #6

An najah National University Faculty of Engineering / Electrical Engineering Department
Power Systems Lab (63527) Dr. Maher Khammash & Eng. Saeed Dwaikat
17
Calculate the reactive power generated by the capacitors in this part and compare it with the measured value on the line
Connection #2
13.Connect the capacitor at the sending end of the first transmission line to∆ connection
14.Connect the capacitor at the receiving end the first transmission line to∆ connection
15.Connect the capacitor at the sending end of the second transmission line to∆ connection
16.Connect the capacitor at the receiving end the second transmission line to∆ connection
17.Keep the voltage Vs=380 v .18.Read the electric quantities on the measuring instruments and write them
down in the following table (table #7).
(V) (A) (W) (Var) (V)
Table #7
Calculate the reactive power generated by the capacitors in this part and compare it with the measured value on the line
Question #1Draw the phasor diagram for medium length transmission line operating at no loadQuestion #2Stat e why the reactive power displayed in these experiments has negative singe?Question #3What are the problems you noticed when operating a medium or long transmission line at no loadQuestion #4What action you can do to reduce the receiving end voltage at no load
Write down your conclusions

An najah National University Faculty of Engineering / Electrical Engineering Department
Power Systems Lab (63527) Dr. Maher Khammash & Eng. Saeed Dwaikat
18
Experiment #4
Protection Relays
Objectives
Studying and applying a relay for:
1. Phase sequence, phase lacking and voltage asymmetry to a three phase circuit.
2. Max/Min three phase voltage.3. Max/Min frequency of power production plant.4. Overload in three phase line.
Introduction
A lot of problems can occur in any part of power system from generation until distribution like losing a phase, overload, over or under voltages than required, improper frequency and others.
In order to minimize the potential of such problems we protect the power system by protection relays, fuses and circuit breakers.
In this experiment we will study and handle different relays in matter of protection.
Very Important Note for each part of the exp.
You must be attention to the value of line voltage on the generator
terminals to be constant to 400V because when the load is disconnected, Sure that this voltage will increase so you must quickly decrease the excitation voltage of the generator to obtain
terminal voltage 400 V constant.

An najah National University Faculty of Engineering / Electrical Engineering Department
Power Systems Lab (63527) Dr. Maher Khammash & Eng. Saeed Dwaikat
19
Experiment procedures
symmetry relayPart one:
1. First of all remove all the jumpers enabling the protection relays. 2. Insert three jumpers into the terminals set to power the relay for phase
sequence, phase lacking and voltage asymmetry as shown in figure #13. Connect an ohm meter to the enable contact of that relay as shown
4. Disconnect one of the three phases, checking continuity in the multimeter and counting delay time and notice when the relay interrupt the circuit continuity after some delay, which recorded in the following table (table#1)
Phase values of voltages Time delay
(Sec.)
Measured time
(Sec.)V1
(volt)
V1
(volt)
V3
(volt)
(Table#1)
An najah National University Faculty of Engineering / Electrical Engineering Department
Power Systems Lab (63527) Dr. Maher Khammash & Eng. Saeed Dwaikat
20
5. Another exercise is the asymmetry of the phases. put unbalanced load and recorded line currents and delay time as following table (table#2).
Percent of asymmetry
Line current (Amp) Time delay(Sec.)
Measured time (Sec.)
IA IB IC
5% 5 sec
7.5% 5 sec
10% 5 sec
(Table#2)
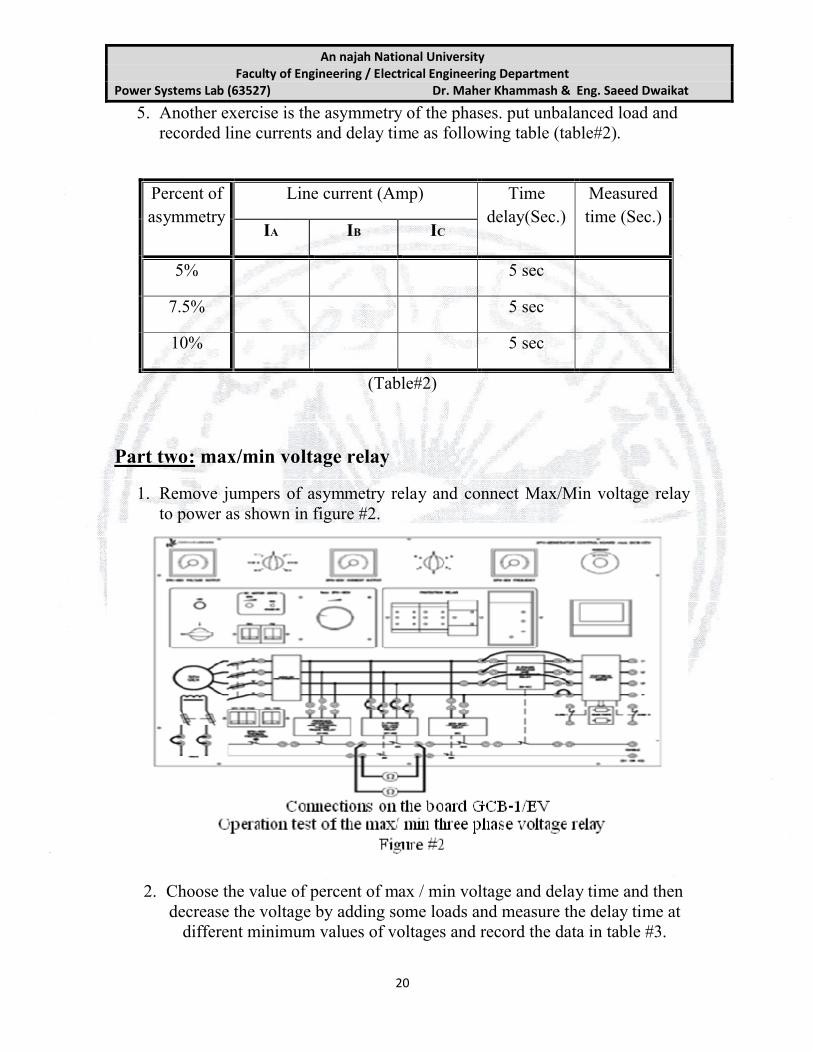
max/min voltage relayPart two:
1. Remove jumpers of asymmetry relay and connect Max/Min voltage relay to power as shown in figure #2.
2. Choose the value of percent of max / min voltage and delay time and then decrease the voltage by adding some loads and measure the delay time at
different minimum values of voltages and record the data in table #3.

An najah National University Faculty of Engineering / Electrical Engineering Department
Power Systems Lab (63527) Dr. Maher Khammash & Eng. Saeed Dwaikat
21
3. Choose the value of percent of max / min voltage and delay time and then increase the voltage by increasing the excitation voltage and measure the delay time at different maximum values of voltages and record the data in table #3:
Percent of Max/min voltage
Measured voltage (V)
Time delay
(sec.)
Measured time
(sec.)
Max of 106% 5 sec
Max of 110% 5 sec
Min of 94% 5 sec
Min of 86% 5 sec
(Table #3)
max/min frequency relayPart three:
1. As in the previous part removed jumpers of max/min voltage relay and connect Max/Min frequency relay to power as shown in figure# 3

An najah National University Faculty of Engineering / Electrical Engineering Department
Power Systems Lab (63527) Dr. Maher Khammash & Eng. Saeed Dwaikat
22
2. fixed the delay time on 3 sec and varied the frequency using RPM potentiometer once for maximum frequency and another for min frequency as shown in table #4
Percent of adjustment f
Frequency
(Hz)
Delay time
(sec.)
Measured time
(sec.)
+10% 3
+20% 3
+30% 3
-10% 3
-20% 3
-30% 3
(Table #4)
and short circuit relaycurrentoverPart three: 1. As in the previous part remove jumpers of Max/Min frequency relay and
connect over current and short circuit relay to power as shown in figure# 4
2. Chose and adjust this relay with the following project data: Overload threshold = 1 Amp and intervention delay = 5 s;

An najah National University Faculty of Engineering / Electrical Engineering Department
Power Systems Lab (63527) Dr. Maher Khammash & Eng. Saeed Dwaikat
23
3. Increase the value of the load by adding some resistors and obtain the value of the load current and the delay time when the intervention occurs that is when the ohmmeter shows disconnection of the relays enable contactTry to do that for some different adjustment current and time of intervention and tabulate your results in table #5
Adjusting current
(Amp)
Adjusting time
(sec)
Measuring current
(Amp)
Measuring time
(sec.)
Table#5
Part five: overall protection relay
1. In order to activate the over all protection relays you should make the connection of the generator control board as shown in the following circuit (figure#5).

An najah National University Faculty of Engineering / Electrical Engineering Department
Power Systems Lab (63527) Dr. Maher Khammash & Eng. Saeed Dwaikat
24
Figure#5
2. Also you must test each one of these protection relays alone when you
operate the generator and load it with a certain load. To do this successfullymake the time delay of the relay you want to test it smaller than the time delay of the other protection relay and notice how that relay will cut off the power comes from the generator to the load.
3. Repeat step 2 to test each one of protection relays alone
:Important NoteRemember This
You must be attention to the value of line voltage on the generator
terminals to be constant to 400V because when the load is disconnected, this voltage will increased so you must quickly decrease the excitation voltage of the generator to obtain terminal
voltage 400 V constant.

An najah National University Faculty of Engineering / Electrical Engineering Department
Power Systems Lab (63527) Dr. Maher Khammash & Eng. Saeed Dwaikat
25
In this part connect all of the protection relays and get three points of power without losing continuity of any one of the relays. These three points are recorded in table #6:
Load
RL (Ω)
Voltage
(V)
Current
(A)
Power
(W)
A 720 400
B 360 400
AB 240 400
(Table #6)
Write down your conclusions:

An najah National University Faculty of Engineering / Electrical Engineering Department
Power Systems Lab (63527) Dr. Maher Khammash & Eng. Saeed Dwaikat
26
Experiment #5
T.L performance under different load conditions
Objectives :
1. To study the behavior of T.L under different load conditions (voltage drop , currents and efficiency of T.L ) .
2. To notice the flow of real and reactive power under different types of loads at T.L.
THEORY:The power losses and voltage drops of a transmission line are defined under load when the root-mean-square values of the electric quantities are measured at both the starting and destination stations. The simulator will refer to lines with symmetrical conductors and balanced load. This statement enables to imagine the electric diagram shown in the fig. 1.
Fig.1 - Equivalent diagram of a three-phase line with symmetrical conductors and balanced load
The diagram of the fig. 1 also includes a fictitious neutral conductor, equidistant from the three active conductors: this gives the possibility of leading the study of the operating characteristics of the three-phase line to a mere single-phase circuit consisting of only one of the three line wires and of an ideal return wire without resistance nor inductance. All that is due to the fact that the neutral wire of a three-phase line with balanced load would not be crossed by any current and consequently it could not provoke any ohmic nor inductive voltage drop.
The line defined s indicated above would show:1. the total power Ps=3xVsxIs.Cosθ at the origin of the line.2. the total power PR=3xVRxIR.Cosθ at the end of the line.3. the total loss P= Ps- PR

Faculty of Engineering
Power Systems Lab (63527) Dr. Maher Khammash & Eng. Saeed Dwaikat
4. the performance in load condition 5. the percent loss 6. the percent voltage drop 7. the percent current variation
Equipments required (Apparatuses)
1. Simulator for electric lines mod. SEL.1/EV.2. Variable 3-phase power supply mod. AMT3. Three phase transformer mod. P 14A/EV4. Set of jumpers for electrical connection.5. 2 digital instruments for measurements6. Variable resistive load mod.RL7. Variable inductive load mod.IL8. Variable capacitive load mod.CL
Experimental procedure:
Make the connections of the transmission line circuit as shown in tfollowing figures (Figure #1
Figure #1 (The line diagram connection
An najah National UniversityFaculty of Engineering / Electrical Engineering Department
Power Systems Lab (63527) Dr. Maher Khammash & Eng. Saeed Dwaikat
27
the performance in load condition η = PR / Ps = 1-P/ Psthe percent loss P% = 100 x P/ Psthe percent voltage drop ∆V = 100 x (Vs-VR)/ Vsthe percent current variation ∆I = 100 x (Is-IR)/Is
(Apparatuses):
Simulator for electric lines mod. SEL.1/EV.phase power supply mod. AMT-3/EV.
Three phase transformer mod. P 14A/EVSet of jumpers for electrical connection.2 digital instruments for measurements mod. AZ – VIP.Variable resistive load mod.RL-2/EV.Variable inductive load mod.IL-2/EV.Variable capacitive load mod.CL-2/EV.
Experimental procedure:
Make the connections of the transmission line circuit as shown in tFigure #1& Figure #2).
Figure #1 (The line diagram connection)
Power Systems Lab (63527) Dr. Maher Khammash & Eng. Saeed Dwaikat
VR)/ Vs
Make the connections of the transmission line circuit as shown in the

Faculty of Engineering
Power Systems Lab (63527) Dr. Maher Khammash & Eng. Saeed Dwaikat
Figure #2 (The circuit connection)
Part I : Performance of T.L under resistive load heavy loads).
1. Turn on (T.L-2) alone with R=remove jumpers from (T.L
2. Notice that (Y) connection of capacitors refer to [capacitance with ground] and(∆) connection refer to capacitance between lines
3. Connect the 2 electronic meters at the sendi4. Connect the variable 3-
adjust it to keep the voltage 380 v at the sending end of the T.L5. Connect the receiving end with a resistive load.6. Adjust the power supply at 7. Enable (T.L-2) 8. Take the readings at the sending and receiving ends at different load steps
as in the table #1:
An najah National UniversityFaculty of Engineering / Electrical Engineering Department
Power Systems Lab (63527) Dr. Maher Khammash & Eng. Saeed Dwaikat
28
Figure #2 (The circuit connection)
Performance of T.L under resistive load (light, natural and
alone with R=35 Ω , L=0.072 H , C=0.1 µF , you may (T.L-1) to ensure it is disconnected
Notice that (Y) connection of capacitors refer to [capacitance with ground] ∆) connection refer to capacitance between lines
Connect the 2 electronic meters at the sending and receiving ends-phase power supply through (Y-Y) transformer and
adjust it to keep the voltage 380 v at the sending end of the T.LConnect the receiving end with a resistive load.
Adjust the power supply at 350 v
Take the readings at the sending and receiving ends at different load steps
Power Systems Lab (63527) Dr. Maher Khammash & Eng. Saeed Dwaikat
(light, natural and
H , C=0.1 µF , you may
Notice that (Y) connection of capacitors refer to [capacitance with ground]
ng and receiving endsY) transformer and
Take the readings at the sending and receiving ends at different load steps

An najah National University Faculty of Engineering / Electrical Engineering Department
Power Systems Lab (63527) Dr. Maher Khammash & Eng. Saeed Dwaikat
29
RL
(Ω)
Vs
(V)
Is
(Amp)
Ps
(W)
Qs
(VAR)PFs VR (V)
IR
(Amp)
PR
(W)
QR
(VAR)PFR
No load
O.C 350
A 720 350
B 360 350
A//B 240 350
C 180 350
A//C 144 350
Table#1
9- Notice that the (-) sign of Q means that the reactive power is generated by the line
Part II : Performance of T.L under inductive load .
1. Adjust the sending end voltage to 380 v2. Set the line parameters to: R=8.9 Ω , C=0.1 µF , L=0.035H ,
Length=25km3. Connect the inductive load to receiving end of T.L and vary it in steps and take your results as in the table #2 :
L
(mH)
Vs
(V)
Is
(Amp)
Ps
(W)
Qs
(VAR)PFs
VR
(V)
IR
(Amp)
PR
(W)
QR
(VAR)PFR
No load O.C 380
A 230 380
B 115 380
A//B 77 380
Table#2
An najah National University Faculty of Engineering / Electrical Engineering Department
Power Systems Lab (63527) Dr. Maher Khammash & Eng. Saeed Dwaikat
30
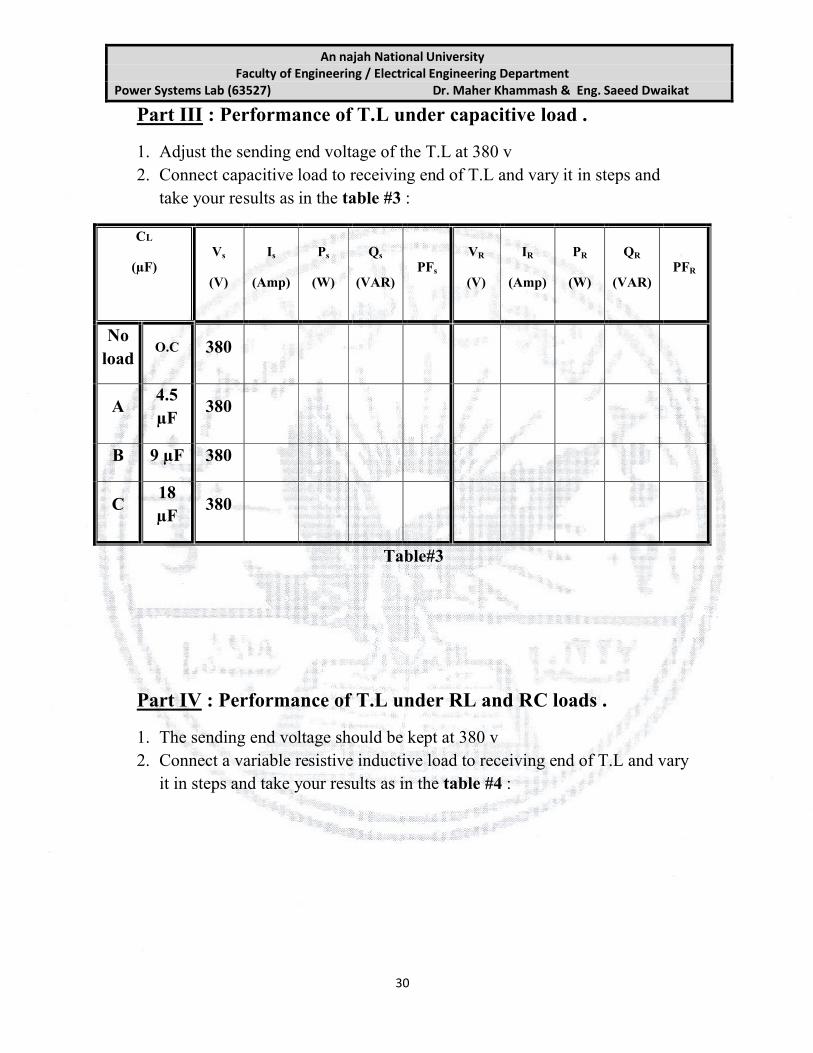
Part III : Performance of T.L under capacitive load .
1. Adjust the sending end voltage of the T.L at 380 v2. Connect capacitive load to receiving end of T.L and vary it in steps and
take your results as in the table #3 :
CL
(µF)Vs
(V)
Is
(Amp)
Ps
(W)
Qs
(VAR)PFs
VR
(V)
IR
(Amp)
PR
(W)
QR
(VAR)PFR
No load
O.C 380
A4.5µF
380
B 9 µF 380
C18 µF
380
Table#3
Part IV : Performance of T.L under RL and RC loads .
1. The sending end voltage should be kept at 380 v2. Connect a variable resistive inductive load to receiving end of T.L and vary
it in steps and take your results as in the table #4 :

An najah National University Faculty of Engineering / Electrical Engineering Department
Power Systems Lab (63527) Dr. Maher Khammash & Eng. Saeed Dwaikat
31
RL(Ω) //L(mH)Vs
(V)
Is
(Amp)
Ps
(W)
Qs
(VAR)PFs
VR
(V)
IR
(Amp)
PR
(W)
QR
(VAR)PFR
No load 380
A // A
720 Ω //230 mH380
A // B
720 Ω //115 mH380
A // (A//B)
720 Ω //77 mH380
Table #4
3. The sending end voltage should be kept at 380 v4. Connect a variable resistive capacitive load to receiving end of T.L and
vary it in steps and take your results as in the table #5 :
RL(Ω) //C(µF)Vs
(V)
Is
(Amp)
Ps
(W)
Qs
(VAR)PFs
VR
(V)
IR
(Amp)
PR
(W)
QR
(VAR)PFR
No load 380
A // A
720 Ω//4.5 µF 380
A // B
720 Ω//9 µF380
A // C
720 Ω//18 µF380
Table #5
An najah National University Faculty of Engineering / Electrical Engineering Department
Power Systems Lab (63527) Dr. Maher Khammash & Eng. Saeed Dwaikat
32
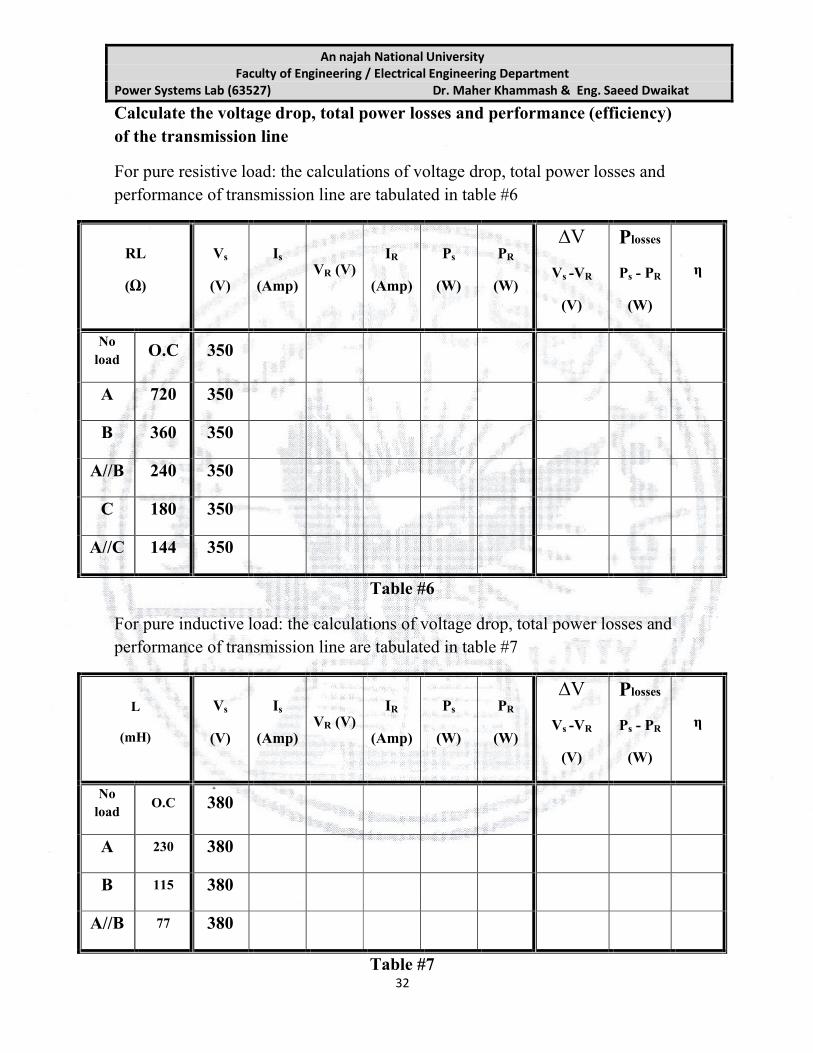
Calculate the voltage drop, total power losses and performance (efficiency)of the transmission line
For pure resistive load: the calculations of voltage drop, total power losses and performance of transmission line are tabulated in table #6
RL
(Ω)
Vs
(V)
Is
(Amp)VR (V)
IR
(Amp)
Ps
(W)
PR
(W)
∆V
Vs -VR
(V)
Plosses
Ps - PR
(W)
η
No load
O.C 350
A 720 350
B 360 350
A//B 240 350
C 180 350
A//C 144 350
Table #6
For pure inductive load: the calculations of voltage drop, total power losses and performance of transmission line are tabulated in table #7
L
(mH)
Vs
(V)
Is
(Amp)VR (V)
IR
(Amp)
Ps
(W)
PR
(W)
∆V
Vs -VR
(V)
Plosses
Ps - PR
(W)
η
No load
O.C 380
A 230 380
B 115 380
A//B 77 380
Table #7
An najah National University Faculty of Engineering / Electrical Engineering Department
Power Systems Lab (63527) Dr. Maher Khammash & Eng. Saeed Dwaikat
33
For pure capacitive load: the calculations of voltage drop, total power losses and performance of transmission line are tabulated in table #8
CL
(µF)Vs
(V)
Is
(Amp)VR (V)
IR
(Amp)
Ps
(W)
PR
(W)
∆V
Vs -VR
(V)
Plosses
Ps - PR
(W)
η
No load
O.C 380
A4.5µF
380
B 9 µF 380
C 18 µF 380
Table #8
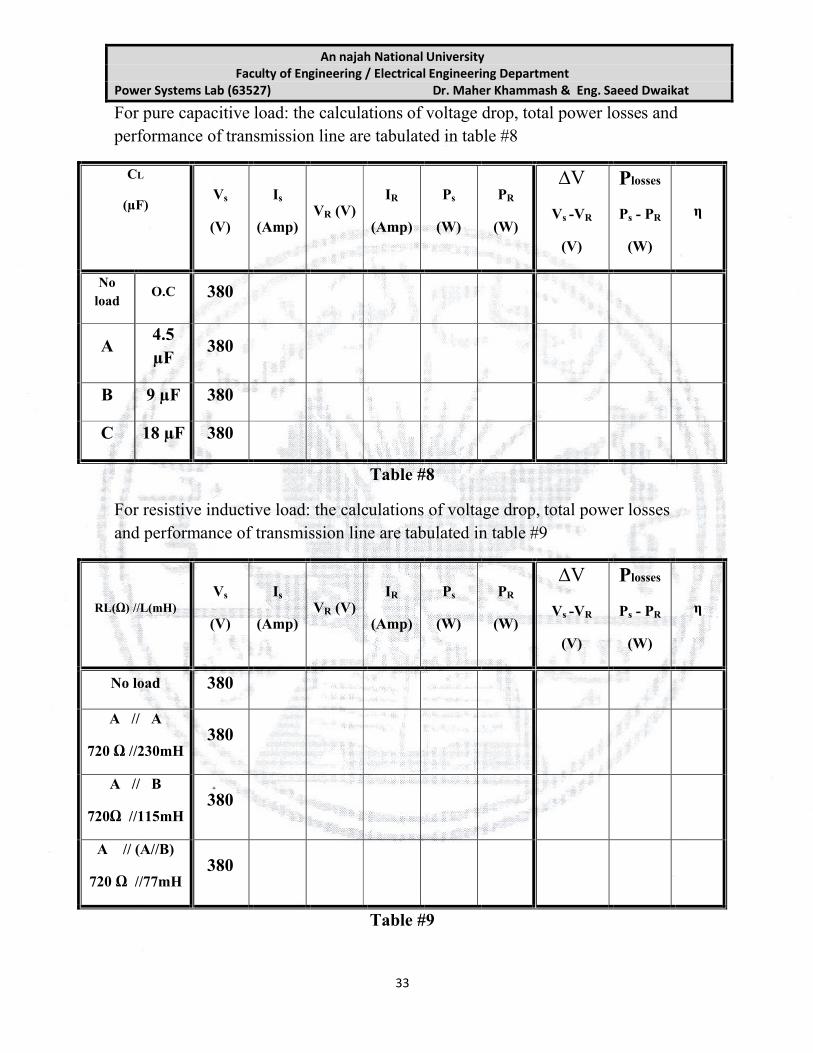
For resistive inductive load: the calculations of voltage drop, total power losses and performance of transmission line are tabulated in table #9
RL(Ω) //L(mH)Vs
(V)
Is
(Amp)VR (V)
IR
(Amp)
Ps
(W)
PR
(W)
∆V
Vs -VR
(V)
Plosses
Ps - PR
(W)
η
No load 380
A // A
720 Ω //230mH380
A // B
720Ω //115mH380
A // (A//B)
720 Ω //77mH380
Table #9

An najah National University Faculty of Engineering / Electrical Engineering Department
Power Systems Lab (63527) Dr. Maher Khammash & Eng. Saeed Dwaikat
34
For resistive capacitive load: the calculations of voltage drop, total power losses and performance of transmission line are tabulated in table #10
RL(Ω) //C(µF)Vs
(V)
Is
(Amp)VR (V)
IR
(Amp)
Ps
(W)
PR
(W)
∆V
Vs -VR
(V)
Plosses
Ps - PR
(W)
η
No load 380
A // A
720 Ω//4.5 µF 380
A // B
720 Ω//9 µF380
A // C
720 Ω//18 µF380
Table #10
At the same graph sketch the following relationships for all load conditions
1. Vs as function of Is for different load conditions.
2. VR as function of IR for different load conditions.
3. ∆V as function of IR for different load conditions.
4. η as function of IR for different load conditions.

An najah National University Faculty of Engineering / Electrical Engineering Department
Power Systems Lab (63527) Dr. Maher Khammash & Eng. Saeed Dwaikat
35
Question #1
Explain the variation of reactive power from negative sign to positive sign at the sending end as the load current increases for resistive load condition
Question #2
For, the resistive load condition, can you observe the light, natural and heavy loadconditions?
Question #3
What is the effect of increasing the load current on the receiving end voltage for different load conditions?
Question #4
What is the affect of increasing the load current on the efficiency of the TL for different load conditions?
Question #5
Can you module the medium TL?
Question #6
Draw the phasor diagrams for medium length transmission lines operating at different load conditions
Question #7
What is the characteristic impedance of the line used in part I|?
Question #8
What is the ratio of the current under natural load to the rated current of the line which is equal to 1 Amp?
Write down your conclusions

An najah National University Faculty of Engineering / Electrical Engineering Department
Power Systems Lab (63527) Dr. Maher Khammash & Eng. Saeed Dwaikat
36
Experiment #6
Parallel operation of two AC generators
Objectives:
1. To curry out the connections and the sequence of operations for the parallel connection between synchronous generators.
2. To demonstrate the effects of the oscillation in the parallel connection of two generators.
3. To include the protection relays in the power generating systems.4. To detect the system data with the digital power analyzer.5. To adjust the system frequency and the real power sharing.6. To adjust the system terminal voltage and the reactive power sharing.
Abstract:
In the system of a generator connected in parallel with another one of the same size, the basic constraint is that the sum of the real and reactive powers supplied by the two generators must be equal the P and Q demanded by the load. The system frequency is not constrained to be constant, and neither is the power of a given generator constrained to be constant.
The total power Ptot ( which is equal to Pload ) is given by
Ptot= Pload = PG1+PG2
And the total reactive power is given by
Qtot= Qload = QG1+QG2
In this report we will study the influence of the governor set points on both frequency and power flow, and the influence of the field current on both terminal voltage and reactive power flow.
Also we will explore the requirements for paralleling AC generators.
Throughout this report, concepts will be illustrated with simplified house diagrams.

An najah National University Faculty of Engineering / Electrical Engineering Department
Power Systems Lab (63527) Dr. Maher Khammash & Eng. Saeed Dwaikat
37
Equipments required (Apparatuses):
1. Generator parallel board mod. PCB-2/EV.2. 2 Control boards for the generating set mod. GCB-2/EV.3. 2 Synchronous generator-motor units mod. MSG-1/EV.4. Variable resistive load mod. RL-2/EV or RL-2A/EV.5. Variable inductive load mod. IL-2/EV .6. Set of cables-jumpers for electrical connections.
Introduction:
Figure 1 shows a synchronous generator G1 supplying power to a load, with another generator G2 about to be paralleled with G1 by closing the switch S1.
If the switch is closed arbitrarily at some moment, the generators are liable to be severely damaged, and the load may lose power. If the voltages are not exactly the same in each conductor being tied together, there will be a very large current flow when the switch is closed. To avoid this problem, each of the three phases must have exactly the same voltage magnitude and phase angle as the conductor to which it is connected. In other words, the voltage in phase a must be exactly the same as the voltage in phase a', and so forth for phases b-b' and c-c'. To achieve this match, the following paralleling conditions must be met:
1- The rms line voltage of the two generators must be equal.2- The two generators must have the same phase sequence.3- The phase angles of the two ' a ' phases must be equal.4- The frequency of the new generator, called the oncoming generator,
must be slightly higher than the frequency of the running system.
Figure# 1
(A generator being paralleled with another generator).

An najah National University Faculty of Engineering / Electrical Engineering Department
Power Systems Lab (63527) Dr. Maher Khammash & Eng. Saeed Dwaikat
38
In real systems containing generators of approximately equal size, the governor set points affect both frequency and power flow, and the field current affects both terminal voltage and reactive lower flow, this experiment will illustrate that.
Experiment Procedure:
The Conditions Required for Paralleling
1. Connect the circuit shown in the figure#2 & figure#3.
Figure#2: Electrical reference diagram for the parallel connection of two synchronous generators.

An najah National University Faculty of Engineering / Electrical Engineering Department
Power Systems Lab (63527) Dr. Maher Khammash & Eng. Saeed Dwaikat
39
Figure#3: Electrical Configuration for the parallel connection of two synchronous generators.

An najah National University Faculty of Engineering / Electrical Engineering Department
Power Systems Lab (63527) Dr. Maher Khammash & Eng. Saeed Dwaikat
40
2. Activate the prime mover of the synchronous generator#1 and adjust the speed to obtain the rated frequency (f1 =50Hz) and increase the field voltage to obtain nominal terminal line to line voltage (VT1 =400 volt).Then press the START button of the first contactor K1 to connect the triad of voltages output by the generator1, with the main bars.
3. Activate the prime mover of the synchronous generator#2 and adjust the speed to obtain the rated frequency (f2 =50Hz) and increase the field voltage to obtain nominal terminal line to line voltage (VT2 =400 volt).
Very important note:
You must make sure that the second contactor K2 remains open until reaching the stage of synchronization.
Ideal moment for carrying out the parallel connection under no load condition.
1- Adjust the field current of the generator#2 until its terminal voltage is equal to the line voltage of the generator#1 ( the running system ).
2- Check the phase sequence by using the three-light-lam method. If all three lams get bright and dark together. Then the systems have the same phase sequence.
3- Adjust the frequency of the generator#2 to be approximately equal to the frequency of the generator#1.
4- Now notice the three lamps and the synchroscope lights
Figure # 4
(The three-light-lamps method for checking phase sequence).

An najah National University Faculty of Engineering / Electrical Engineering Department
Power Systems Lab (63527) Dr. Maher Khammash & Eng. Saeed Dwaikat
41
In the exact moment when the 3 lamps are actually off and the LED synchroscope is lighting in the green zone, at this moment START the button of contactor K2 to lead the generators to be connected in parallel with the first generator (generator #1).
Part1:The effect of changing the prim mover speed and excitation current of one generator at no load.
1 . After making the parallel operation of the two generators correctly and at no load conditions take the values of frequencies, real powers of generator #1, generator #2 and the system tabulate your data in table # 1
2 . Increase the frequency for generator#2 and fill table#1with three different values of frequency.
f1(Hz)
f2(Hz)
fsys)
(Hz)P1
(watt)P2
(watt)
Psys
(watt)
Table#1
3. Decrease the frequency of generator #2 to be the same with the first value of operation and then adjust the excitation current of generator#2 to change the voltage, take the values of terminal voltages, reactive powers of generator #1, generator #2 and the system tabulate your data in table # 2
V1(v)
V2(v)
V (sys)
(v)Q1
(VAR)Q2
(VAR)
Qsys
(VAR)
Table#2

An najah National University Faculty of Engineering / Electrical Engineering Department
Power Systems Lab (63527) Dr. Maher Khammash & Eng. Saeed Dwaikat
42
4 . Decrease the excitation current of generator#2 to return back to normal operation values.
Part2 (A):The effect of changing the prime mover speed of one generator upon the system frequency and the real power sharing between the two generators.
1. Follow the parallel operation steps as mentioned before and, take care to do that correctly. Try to let the system do that automatically by setting the switch existing over the synchroscop to the automatic mode after making the all the necessary adjustments of both generators to be synchronized.
2. Add a three phase resistive inductive load to the system terminals and take the required measurements in table#3
3. Gradually, increase the frequency for generator#2 and fill the table#3.
R=360Ω (switch B) & L=1.15 H(switch B)
IL
(Amp)
I2
(Amp)
I1
(Amp)
Pload
(watt)
P2
(watt)
P1
(watt)
fsys
(Hz)
f2
(Hz)
f1
(Hz)
Table#3
Question#1:
Explain graphically by drawing house diagrams of power – frequency characteristic the effect of adjusting the frequency of generator#2?

An najah National University Faculty of Engineering / Electrical Engineering Department
Power Systems Lab (63527) Dr. Maher Khammash & Eng. Saeed Dwaikat
43
Part2 (B):The effect of increasing the prime mover speed of generator#2 while decreasing it on generator#1 on thesystem frequency and the real power sharing between the two generators
4. Return back to the normal operation values and keep the two generators to be synchronized with each other.
5. Increase the frequency of generator #2 and decrease the frequency of generator #1in a small amount with the same value of resistive inductive load an tabulate your results in table #4
R=360Ω (switch B) & L=1.15 H(switch B)
IL
(Amp)
I2
(Amp)
I1
(Amp)
Pload
(watt)
P2
(watt)
P1
(watt)
fsys
(Hz)
f2
(Hz)
f1
(Hz)
Table#4
:2Question#
How can the power sharing of the power system can be adjusted independently of the system frequency?
:3Question#
Explain graphically the effect of adjusting the frequency of both generators? (Increasing the frequency of generator#2 and decreasing the frequency of generator#1)

An najah National University Faculty of Engineering / Electrical Engineering Department
Power Systems Lab (63527) Dr. Maher Khammash & Eng. Saeed Dwaikat
44
Part2 (C):The effect of changing the prime mover speed of both generators on the system frequency and the real power sharing between the two generators
6. Return back the normal operation values and keep the two generators to be synchronized with each other.
7. Increase or decrease the frequency of both generator in a small amount with the same value of resistive inductive load and tabulate your results in table #5
R=360Ω (switch B) & L=1.15 H(switch B)
IL
(Amp)
I2
(Amp)
I1
(Amp)
Pload
(watt)
P2
(watt)
P1
(watt)
fsys
(Hz)
f2
(Hz)
f1
(Hz)
Table#5
Question#4:
Explain graphically the effect of increasing or decreasing the frequency of both generators at the same time? What do you notice about that?
Part3(A) The effect of adjusting the excitation current of one generator on the reactive power sharing and the terminal voltage
1. Return back to the normal operation values and keep the two generators to be synchronized with each other.
2. Add a three phase resistive - inductive load at the system terminals and take the required measurements in table#6
3. Gradually, increase the excitation voltage of generator#2 and fill the table#6.

An najah National University Faculty of Engineering / Electrical Engineering Department
Power Systems Lab (63527) Dr. Maher Khammash & Eng. Saeed Dwaikat
45
R=360Ω (switch B) & L=1.15 H(switch B)
Qload
(VAR)
QG2
(VAR)
QG1
(VAR)
Vsys
(v)
VG2
(V)
VG1
(v)
Table#6
Question#5:
What happens if the field current of generator#2 is increased? Explain that graphically by drawing the house diagrams of voltage- reactive power characteristic?
Part3(B) The effect of increasing or decreasing the excitation current on both generators on the reactive power sharing and the terminal voltage.
4. Return back to the normal operation values and keep the two generators to be synchronized with each other.
5. With the same resistive inductive load adjust the excitation current of both generators ( increase or decreasing the excitation voltage of both generators) in a small amount and tabulate your results in table #7

An najah National University Faculty of Engineering / Electrical Engineering Department
Power Systems Lab (63527) Dr. Maher Khammash & Eng. Saeed Dwaikat
46
R=360Ω (switch B) & L=1.15 H(switch B)
Qload
(VAR)
QG2
(VAR)
QG1
(VAR)
Vsys
(v)
VG2
(V)
VG1
(v)
Table#7
Question#6:
How can the terminal voltage of the power system can be adjusted independently of the reactive power sharing? Explain that graphically by drawing the house diagrams of voltage- reactive power characteristic?
Part3(B) The effect of increasing the excitation current on generator#2 while decreasing it on generato#1 on the reactive power sharing and the terminal voltage.
6. Return back to the normal operation values and keep the two generators to be synchronized with each other.
7. With the same resistive - inductive load increase the excitation voltage of generator #2 and decrease the excitation voltage of generator #1in a small amount keep the terminal voltage constant and tabulate your results in table #8

An najah National University Faculty of Engineering / Electrical Engineering Department
Power Systems Lab (63527) Dr. Maher Khammash & Eng. Saeed Dwaikat
47
R=360Ω (switch B) & L=1.15 H(switch B)
Qload
(VAR)
QG2
(VAR)
QG1
(VAR)
Vsys
(v)
VG2
(V)
VG1
(v)
Table#8
Question#7:
How can the reactive power sharing of two generators be adjusted independently of the terminal voltage? Explain that graphically by drawing the house diagrams of voltage- reactive power characteristic??
Write down your conclusions.

An najah National University Faculty of Engineering / Electrical Engineering Department
Power Systems Lab (63527) Dr. Maher Khammash & Eng. Saeed Dwaikat
48
Experiment#7
Series and parallel operations of power transmission lines under load
Objectives:
1. Study the series and parallel operation of transmission lines.2. Understanding the effects of transmission line capacitance.3. To understand the effects of T.L length on the voltage drop and reactive
power.4. To understand the effects and results if one line has been lost in parallel
operation.
Equipments required:
1. Simulator of electric lines mod. SEL-1/EV.2. Variable three-phase power supply mod. AMT-3/EV.3. Three-phase transformer mod. P 14A/EV.4. Set of leads/jumpers for electrical connections. 5. 2 digital instruments for measuring the parameters of electric energy in
three-phase systems mod.6. Variable resistive load mod. RL-2/EV.7. Variable inductive load mod. IL-2/EV.8. Variable capacitive load mod. CL-2/EV.
Part I: Series operation of transmission line under load
The power losses and voltage drops of a transmission line are defined under load when the root- mean-square values of the electric quantities are measured at both the starting and destination stations. Those lines have symmetrical conductors and balanced load. This statement enables to imagine the electric diagram shown in the following figure (figure#1).
(Figure#1)

An najah National University Faculty of Engineering / Electrical Engineering Department
Power Systems Lab (63527) Dr. Maher Khammash & Eng. Saeed Dwaikat
49
Preparing the experiment :
1. Consider two lines with equal current-carrying capacity, but different length.
2. For this exercise, LINE 1 is with the constants:Resistance = 18 Ω; Inductance = 0.072 H; Length = 50 km; Section = 50 mm2 – conductor of copper; And LINE 2 with the constants: Resistance = 8.9 Ω; Inductance = 0.036 H; Length = 25 km; Section = 50 mm2 – conductor of copper;
3. Connect only the jumpers at the origin of LINE 1 and those of the end of LINE 2.
4. Connect the end terminals of LINE 1 (terminals immediately at the right of the breaker) with the starting terminals of the LINE 2 (terminals at the left of the breaker), via some leads, to carry out the series connection of the two lines.
5. Make sure that the origin and end breakers of both the lines are OFF.6. Do not connect the jumpers with the capacitors supposing that the
parameter of capacitance is negligible.7. Connect the variable three phase power supply mod. AMT-3/EV to the
primary of the transformer. 8. Connect the left sending end bus with the secondary of the three-phase
transformer so that the ratio is 1:1, and the load with the right receiving end bus of LINE2.
9. By the end of this process you will obtain the electric diagram shown in the figure# 2 shown.

An najah National University Faculty of Engineering / Electrical Engineering Department
Power Systems Lab (63527) Dr. Maher Khammash & Eng. Saeed Dwaikat
50
Figure#2
An najah National University Faculty of Engineering / Electrical Engineering Department
Power Systems Lab (63527) Dr. Maher Khammash & Eng. Saeed Dwaikat
51
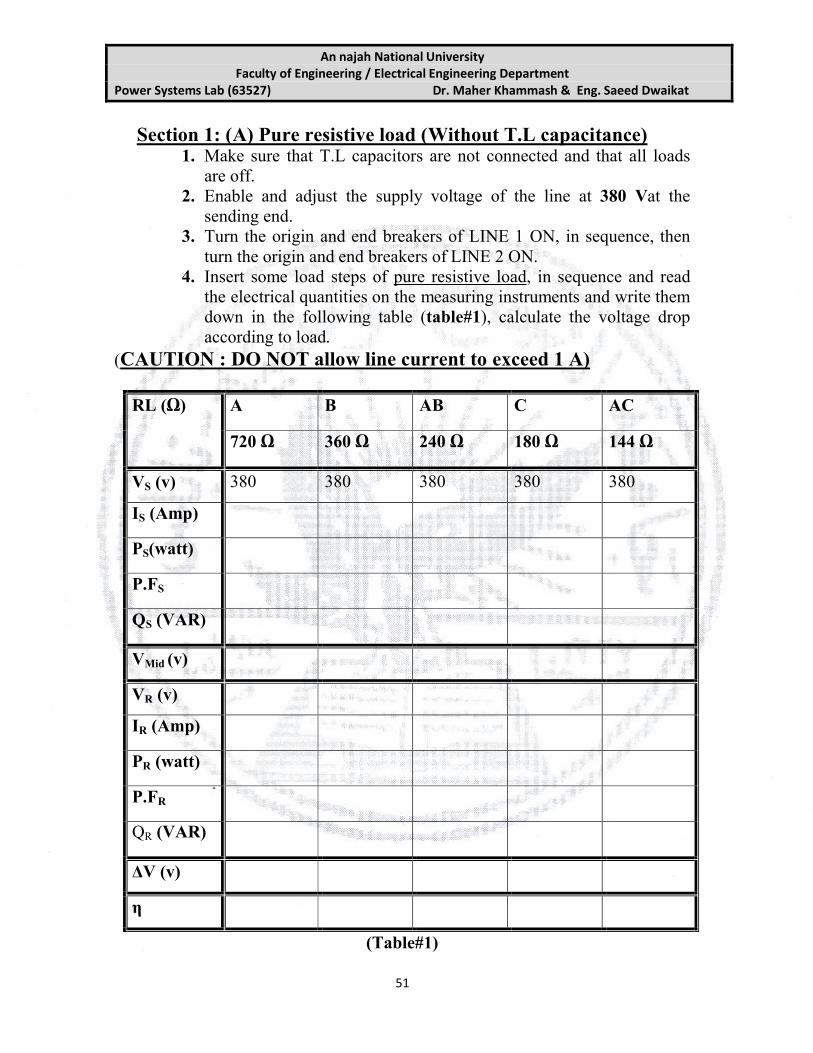
Section 1: (A) Pure resistive load (Without T.L capacitance)1. Make sure that T.L capacitors are not connected and that all loads
are off.2. Enable and adjust the supply voltage of the line at 380 Vat the
sending end.3. Turn the origin and end breakers of LINE 1 ON, in sequence, then
turn the origin and end breakers of LINE 2 ON.4. Insert some load steps of pure resistive load, in sequence and read
the electrical quantities on the measuring instruments and write them down in the following table (table#1), calculate the voltage drop according to load.
(CAUTION : DO NOT allow line current to exceed 1 A)
RL (Ω) A B AB C AC
720 Ω 360 Ω 240 Ω 180 Ω 144 Ω
VS (v) 380 380 380 380 380
IS (Amp)
PS(watt)
P.FS
QS (VAR)
VMid (v)
VR (v)
IR (Amp)
PR (watt)
P.FR
QR (VAR)
ΔV (v)
η
(Table#1)

An najah National University Faculty of Engineering / Electrical Engineering Department
Power Systems Lab (63527) Dr. Maher Khammash & Eng. Saeed Dwaikat
52
Question #1:
Draw and explain the following characteristics:
VR versus. IR
QS versus IR
ΔV versus IR
η versus IR
Question #2:
How can the drop voltage across the line be reduced ?
Section 1:(B) Resistive-inductive load (Without T.L capacitance)
1. Make sure that T.L capacitors are not connected and all loads are off.2. Enable and adjust the supply voltage of the line at 380 V.3. Turn the origin and end breakers of LINE 1 ON, in sequence, then
turn the origin and end breakers of LINE 2 ON.4. Use one fixed resistive load step in parallel with some load steps of
inductive load, in sequence and read the electrical quantities on the measuring instruments and write them down in table#2, calculate the voltage drop according to load.

An najah National University Faculty of Engineering / Electrical Engineering Department
Power Systems Lab (63527) Dr. Maher Khammash & Eng. Saeed Dwaikat
53
(CAUTION : DO NOT allow line current to exceed 1 A)RL (Ω) A A A A A
720 Ω 720 Ω 720 Ω 720 Ω 720 Ω
LL (mH) A B AB C AC
2.3mH 1.15mH 0.76mH 0.57mH 0.46mH
VS (v) 380 380 380 380 380
IS (Amp)
PS(watt)
P.FS
QS (VAR)
VMid (v)
VR (v)
IR (Amp)
PR (watt)
P.FR
QR (VAR)
ΔV (v)
η
(Table#2)
Question #3:
Draw and explain the following characteristics:
VR versus. IR
QS versus IR
ΔV versus IR
η versus IR

An najah National University Faculty of Engineering / Electrical Engineering Department
Power Systems Lab (63527) Dr. Maher Khammash & Eng. Saeed Dwaikat
54
Section 2: (A) Pure resistive load (With T.L capacitance)1. Connect the left jumpers to represent the capacitance between the active
conductors (Delta) (capacitors at the sending end delta connection), then connect the jumpers with the right capacitors to represent the capacitance between active conductors and the ground (Star) (capacitors at the receiving end star connection).
2. Make sure all loads are switched off.3. Enable and adjust the supply voltage of the line at 380 V.4. Turn the origin and end breakers of LINE 1 ON in sequence, then turn the
origin and end breakers of LINE 2 ON.5. Insert some load steps of pure resistive load, in sequence and read the
electrical quantities on the measuring instruments and write them down in table# 3, calculate the voltage drop according to load.(CAUTION : DO NOT allow line current to exceed 1 A)
RL (Ω) A B AB C AC
720 Ω 360 Ω 240 Ω 180 Ω 144 Ω
VS (v) 380 380 380 380 380
IS (Amp)
PS(watt)
P.FS
QS (VAR)
VMid (v)
VR (v)
IR (Amp)
PR (watt)
P.FR
QR (VAR)
ΔV (v)
η
(Table#3)

An najah National University Faculty of Engineering / Electrical Engineering Department
Power Systems Lab (63527) Dr. Maher Khammash & Eng. Saeed Dwaikat
55
Question #4:
Draw and explain the following characteristics:
VR versus. IR
QS versus IR
ΔV versus IR
η versus IR
Question #5:
According to your results, what are the results of light load operation? Suggest solutions.
Section 2:(B) Resistive-inductive load (With T.L capacitance) Connect the left jumpers to represent the capacitance between the
active conductors (Delta) (capacitors at the sending end delta connection), then connect the jumpers with the right capacitors to represent the capacitance between active conductors and the ground (Star) (capacitors at the receiving end star connection).
Make sure all loads are switched off. Enable and adjust the supply voltage of the line at 380 V. Turn the origin and end breakers of LINE 1 ON in sequence, then
turn the origin and end breakers of LINE 2 ON. Use one fixed resistive load step in parallel with some load steps of
inductive load, in sequence and read the electrical quantities on the measuring instruments and write them down in the table# 4, calculate the voltage drop according to load.

An najah National University Faculty of Engineering / Electrical Engineering Department
Power Systems Lab (63527) Dr. Maher Khammash & Eng. Saeed Dwaikat
56
(CAUTION : DO NOT allow line current to exceed 1 A)RL (Ω) A A A A A
720 Ω 720 Ω 720 Ω 720 Ω 720 Ω
LL (mH) A B AB C AC
2.3mH 1.15mH 0.76mH 0.57mH 0.46mH
VS (v) 380 380 380 380 380
IS (Amp)
PS(watt)
P.FS
QS (VAR)
VMid (v)
VR (v)
IR (Amp)
PR (watt)
P.FR
QR (VAR)
ΔV (v)
η
(Table#4)
Question #6:
Draw and explain the following characteristics:
VR versus. IR
QS versus IR
ΔV versus IR
η versus IR

An najah National University Faculty of Engineering / Electrical Engineering Department
Power Systems Lab (63527) Dr. Maher Khammash & Eng. Saeed Dwaikat
57
Question #7:
From section I and section II what effects of including T.L capacitance did you notice?
Part II: Parallel operation of transmission line
The continuity of the service of distribution of electric energy is very often ensured by “systems” also including spare components that can be enabled, when necessary. This is the reason why, besides the generators and the step-up/step-down transformers, also the main long-distance power lines have a “spare” line, that is a line in parallel that can be used to meet a demand of energy increase, but this type of is also very often used as substitute of the normal line to enable maintenance operations of the power line. Maintenance is generally scheduled and carried out in certain periods when the demand for power is lower. But this spare line can be enabled not only for routine maintenance, but also for faults in the main line. Under this hypothesis, a long-distance power line can always be considered as a single line, apart from the few instants when the lines are in parallel to avoid the interruption of power. This exercise will examine the normal operation of two lines in parallel with each other.
Preparing the experiment:Consider two equal lines, with the following constants:
Resistance = 18 Ω; Inductance =0.072 H; Capacitance = 0.2μF; Length = 50 km; Section = 50 mm2 – conductor of copper.
1. Connect all the jumpers at the origin and at the end of the lines, enable both sets of capacitors (those of left hand between phases, and those of right end to ground).
2. Turn the origin and end breakers of both the lines to OFF.3. Connect the variable three phase power supply mod. AMT-3/EV to the
primary side of the three phase transformer. 4. Connect the left sending end bus with the secondary side of the transformer
so that the ratio is 1:1, and the load with the right receiving end bus.5. By the end of this process you will obtain same electrical diagram shown
figure #3.

An najah National University Faculty of Engineering / Electrical Engineering Department
Power Systems Lab (63527) Dr. Maher Khammash & Eng. Saeed Dwaikat
58
Figure#3
An najah National University Faculty of Engineering / Electrical Engineering Department
Power Systems Lab (63527) Dr. Maher Khammash & Eng. Saeed Dwaikat
59
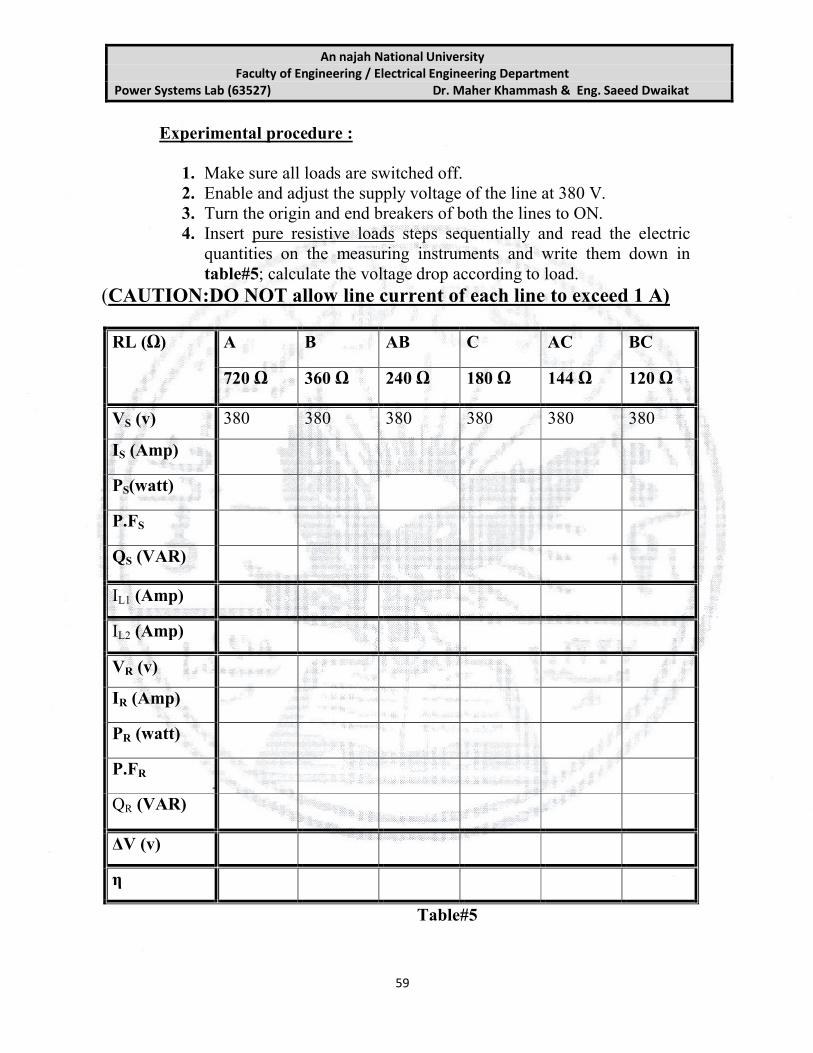
Experimental procedure :
1. Make sure all loads are switched off.2. Enable and adjust the supply voltage of the line at 380 V.3. Turn the origin and end breakers of both the lines to ON.4. Insert pure resistive loads steps sequentially and read the electric
quantities on the measuring instruments and write them down in table#5; calculate the voltage drop according to load.
(CAUTION:DO NOT allow line current of each line to exceed 1 A)
RL (Ω) A B AB C AC BC
720 Ω 360 Ω 240 Ω 180 Ω 144 Ω 120 Ω
VS (v) 380 380 380 380 380 380
IS (Amp)
PS(watt)
P.FS
QS (VAR)
IL1 (Amp)
IL2 (Amp)
VR (v)
IR (Amp)
PR (watt)
P.FR
QR (VAR)
ΔV (v)
η
Table#5

An najah National University Faculty of Engineering / Electrical Engineering Department
Power Systems Lab (63527) Dr. Maher Khammash & Eng. Saeed Dwaikat
60
5. Now disconnect one of the two parallel lines and repeat the measurements and tabulate your result in table #6.
(CAUTION : DO NOT allow line current to exceed 1 A)RL (Ω) A B AB C
720 Ω 360 Ω 240 Ω 180 Ω
VS (v) 380 380 380 380
IS (Amp)
PS(watt)
P.FS
QS (VAR)
VR (v)
IR (Amp)
PR (watt)
P.FR
QR (VAR)
ΔV (v)
η
Table #6Question #8:
Draw and each of the following characteristics for both cases (single line and double line):
VR versus. IR
QS versus IR
ΔV versus IR
η versus IR

An najah National University Faculty of Engineering / Electrical Engineering Department
Power Systems Lab (63527) Dr. Maher Khammash & Eng. Saeed Dwaikat
61
Question #9:
From your observations try to identify the advantages and disadvantages of parallel operation.
Question #10:
Compare between PART I (series) and PART II (parallel). What difference does the length of T.L have?
Write down your conclusions

An najah National University Faculty of Engineering / Electrical Engineering Department
Power Systems Lab (63527) Dr. Maher Khammash & Eng. Saeed Dwaikat
62
Experiment #8
Parallel connection of a three-phase synchronous generator with the public mains
Objectives:
1. To curry out the connections and the sequence of operations for the parallel connection between generator and the mains.2. To include the protection relays in the power generating systems.3. To detect the system data with the digital power analyzer.
Abstract:
In the system of a parallel connection of a three-phase synchronous generator with the public mains, the terminal voltage and frequency are constant regardless of the real or reactive power drown from or supply to the infinite bus. The basic constraint in this system is that the sum of the real and reactive powers supplied by the generator and the infinite bus must be equal the P and Q demanded by the load.
The total power Ptot ( which is equal to Pload ) is given by
Ptot= Pload = PG+PI.B
And the total reactive power is given by
Qtot= Qload = QG+QI.B
In this report we will study the influence of the governor set points on the no load frequency of the synchronous generator and therefore on the power sharing, and the influence of the field current on reactive power sharing between the generator and the infinite bus in order to keep both Pload and Qload constant.
Also we will explore the conditions of parallel connection of a generator with the mains.
Throughout this experiment concepts should be illustrated with simplified house diagrams.
An najah National University Faculty of Engineering / Electrical Engineering Department
Power Systems Lab (63527) Dr. Maher Khammash & Eng. Saeed Dwaikat
63
Equipments required (Apparatuses):
7. Generator parallel board mod. PCB-2/EV.8. Control boards for the generating set mod. GCB-2/EV.9. Synchronous generator-motor units mod. MSG-1/EV.10.Variable power supply mod.AMT-3/EV11.Variable resistive load mod. RL-2/EV or RL-2A/EV.12.Variable inductive load mod. IL-2/EV .13.Set of cables-jumpers for electrical connections.
Introduction:
Some conditions are necessary to be maintained to connect the alternators in parallel. As an example, let s take the case of an alternator with infinite bus, one of which is already connected to the bars. The alternator is to be connected to support the total load, by dividing the active and the reactive load between them.
1- Equal sequence of phases: if the line voltages of the synchronous generator G make ABC turn, the three of infinite bus must also make ABC turn. The rotation direction can be checked with different instruments: the first one is an instrument including a three-phase induction motor that must turn in the same direction powered by the bars and by infinite bus. Another method is with 3 lamp, as the one mounted in the system. If the 2 triads do not turn in the same direction, the 3 lamps never light on or off simultaneously. To make the triad turn to the other direction, just change the connection of any two phases of infinite bus.
2- Equal frequency: This can be seen in the frequency meters of synchronous generator G and infinite bus that must indicate the same value. Actually, G is set at a little higher speed than infinite bus (this because when “taking load”, the prime mover will naturally drop the rpm).To change the rpm act on the control device (accelerator) of the prime mover of G.
3- Equal effective voltages: this occurs with the voltmeters installed on synchronous generator G and infinite bus. To change the voltage of G, you must act on the excitation of G.
4- Equal phases: it means that both triads, synchronous generator G and infinite bus, must coincide to close INT2. This occurs with the synchronoscope, or when the 3 lamps switch off simultaneously. To change the phase of G, you must act on the speed of the prime mover of G. lightly accelerating it

An najah National University Faculty of Engineering / Electrical Engineering Department
Power Systems Lab (63527) Dr. Maher Khammash & Eng. Saeed Dwaikat
64
When you check all the previous conditions for parallel operation and confirm it's all true then you can close the switch S1 as in figure #1
Figure# 1: A generator being paralleled with another generator.
Experiment Procedure :
1. Connect the circuit shown in the figure#2.

An najah National University Faculty of Engineering / Electrical Engineering Department
Power Systems Lab (63527) Dr. Maher Khammash & Eng. Saeed Dwaikat
65
Figure #2

An najah National University Faculty of Engineering / Electrical Engineering Department
Power Systems Lab (63527) Dr. Maher Khammash & Eng. Saeed Dwaikat
66
2. Switch on the main supply and raise the voltage to obtain a terminal line to line voltage =400volt , with constant frequency=50Hz
3. Activate the prime mover of the synchronous generator and adjust its speed to obtain the output frequency ( f=50 ) and increase the excitation current to get nominal line to line voltage ( V=400 volt ). Note: don't enable the contactor K2 for any reason, in this phase.At no load condition notice the synchronization devices (synchroscope and the three lamps) the ideal moment for carrying out the parallel connection of the synchronous generator G with the main supply Is the moment where the three lamps off and the Light of the synchroscope in the Green Zone. AT that moment press the green button of contactor K2 to lead the generator to be connected in parallel with the main supply as shown in figure #3
Figure #3: The three-light-bulb method for checking phase sequence.
Part I: (A) The effect of changing frequency of the generator under load on real power sharing without inserting protection relays
1. After making the synchronization of generator to be connected in parallelwith the main supply successfully, add resistive inductive load and take the readings of the values in table #1
An najah National University Faculty of Engineering / Electrical Engineering Department
Power Systems Lab (63527) Dr. Maher Khammash & Eng. Saeed Dwaikat
67
2. Vary the frequency of the synchronous generator G(increase or decrease)and fill the table
Select resistive load switch A inductive load switch A
fG
(Hz)
fsys
(Hz)
PG
(Watt)
Pmain.supply
(Watt)
Pload
(Watt)
No changes
Increasing fG
Decreasing fG
Table #1
Question#1:
What happens if the governor set point of the S.G is increased or decreased? Draw the house diagrams to explain the effect of changing the generator speed on the power sharing?
Part I: (B) The effect of changing excitation current of the generator under load on reactive power sharing without inserting protection relays:
1. Return back to the first values of frequency and terminal voltage at no load .2. After making the synchronization of generator to be connected in parallel with
the main supply successfully, add resistive inductive load and take the readings of the values in table #2
3. Vary the excitation current of the synchronous generator G(increase or decrease) and fill the table

An najah National University Faculty of Engineering / Electrical Engineering Department
Power Systems Lab (63527) Dr. Maher Khammash & Eng. Saeed Dwaikat
68
Select resistive load switch A inductive load switch A
If generator
(Amp)
Vsys
(Volt)
QG
(VAR)
Qmain supply
(VAR)
Qload
(VAR)
Increasing
If
decreasing
If
Table #2
Question#2:
What happens if excitation current of the synchronous generator G is increased or decreased? Draw the house diagram to explain the effect of changing theexcitation current of the synchronous generator reactive power sharing?
Part II: (A) The effect of changing frequency of the generator under load on real power sharing with inserting protection relays
1. Include all the protection relays and switch to automatic mode to get synchronization automatically when conditions are met for a synchronous generator parallel operation with the mains

An najah National University Faculty of Engineering / Electrical Engineering Department
Power Systems Lab (63527) Dr. Maher Khammash & Eng. Saeed Dwaikat
69
2. Set the protection relays on the following settings: Sequence relay for phase lack and three-phase voltage asymmetry:
SYMMETRY = 10%; Asymmetry intervention delay (DELAY) = 5 s.
Max/min three-phase voltage relay: Rated line voltage Ue = 400 V; maximum voltage threshold (MAX VOLTAGE) = 105 %; maximum voltage intervention delay (DELAY MAX) = 5 s; minimum voltage threshold (MIN VOLTAGE) = 90 %; minimum voltage intervention delay (DELAY MIN) = 5 s.
MAX/min frequency relay: rated mains frequency (FREQ.) = 50 Hz; maximum frequency threshold (MAX) = 2 Hz; maximum frequency intervention delay (DELAY MAX) = 5 s; minimum frequency threshold (MIN) = 2 Hz; minimum frequency intervention delay (DELAY MIN) = 5 s.
Fixed-time three-phase ammetric relay for overload and short-circuit: overload threshold = 1 A; operation delay = 5 s; short-circuit threshold = 5 A.
3. Repeat step 2 in part I (A) and tabulate your results in table #3
Table #3
Select resistive load switch A inductive load switch A
fG
(Hz)
fsys
(Hz)
PG
(Watt)
Pmain.supply
(Watt)
Pload
(Watt)
No changes
Increasing fG
Decreasing fG

An najah National University Faculty of Engineering / Electrical Engineering Department
Power Systems Lab (63527) Dr. Maher Khammash & Eng. Saeed Dwaikat
70
Question#3:
What happens if the governor set point of the S.G is increased or decreased? Draw the house diagrams to explain the effect of changing the generator speed on the power sharing?
4. Repeat the steps 1,2 and 3 in part I (B) and tabulate your results in table #4
Select resistive load switch A inductive load switch A
If generator
(Amp)
Vsys
(Volt)
QG
(VAR)
Qmain.supply
(VAR)
Qload
(VAR)
Increasing
If
decreasing
If
Table #4
Question#4:
What happens if excitation current of the synchronous generator G is increased or decreased? Draw the house diagram to explain the effect of changing theexcitation current of the synchronous generator reactive power sharing?
Write down your Conclusions

An najah National University Faculty of Engineering / Electrical Engineering Department
Power Systems Lab (63527) Dr. Maher Khammash & Eng. Saeed Dwaikat
71
Experiment#9
Studying the operation of a power transmission line in condition of ground fault
Objectives:
1. Studying the operation of power transmission line with neutral cable insulated in condition of ground fault.
2. Studying the operation of power transmission line with compensated neutral conductor (Peterson coil) in condition of ground fault.
Equipments required (Apparatuses):
1. Similar of electric lines mod. SEL-1/EV.2. Variable three phase power supply mod. AMT-3/EV, in option 3-phase line
generated by the generator control board mod. GCB-1/EV, or a fixed 3-phase line 3X380v.
3. Three-phase transformer mod. P14A/EV.4. Set of loads/jumpers for electrical connection.5. 2 digital instruments for measuring the parameters of electric energy in 3-
phase system mod. AZ-VIP (the instruments of the generator control board mod. GCB-1/EV can be used in option).
6. Variable resistive load mod. RL-2/EV or mod. RL-1/EV.7. Variable inductive load mod. IL-2/EV.
Theory:
The single line ground fault current of an electric system insulated from ground, closes through the ground capacitance of the phases (it is defined CE ), and consequently its value is not very high.The ground fault current of the system with insulated neutral conductor (figure#1) will rise as the ground capacitance (CE) increases, that is as main is extended.An alternative to the insulated neutral cable is represented by the grounding of this same cable through a coil (Peterson coil, or arc-suppression coil) as shown in (figure#2). The single phase ground fault current IF will result from the sum of the currents IL crossing the coil, and IC closing through the capacitance of the phases not suffering ground fault.

Faculty of Engineering
Power Systems Lab (63527) Dr. Maher Khammash & Eng. Saeed Dwaikat
Figure# 1 Power transmission line with neutral cable insulated in condition of ground fault.
Figure#2 power transmission line with compensated neutral conductorin condition of ground fault.
An najah National UniversityFaculty of Engineering / Electrical Engineering Department
Power Systems Lab (63527) Dr. Maher Khammash & Eng. Saeed Dwaikat
72
Power transmission line with neutral cable insulated in condition of ground fault.
power transmission line with compensated neutral conductorcondition of ground fault.
Power Systems Lab (63527) Dr. Maher Khammash & Eng. Saeed Dwaikat
power transmission line with compensated neutral conductor

Faculty of Engineering
Power Systems Lab (63527) Dr. Maher Khammash & Eng. Saeed Dwaikat
Experimental procedure:
Part 1: Power transmission line with neutral cable insulated in condition of ground fault.
1. Connect the circuit as shown on the figconnection on the neutral line on
Figure#3 Power transmission line with neutral cable insulated in condition of ground fault.
2. Start this exercise considering the transmission LINE 2 with the following constants: Resistance = 18 Length = 50 km; Section=50 mm2
3. Turn the breakers at the origin and at the end of the LINE 2, to OFF. 4. Connect the measuring instruments between the left busway and the
terminals at the starting of the LINE 2, and between the end termithe LINE 2 and the right busway.
5. Connect the jumpers of the both set of capacitors, in the LINE 2, to reproduce the capacitance between active conductors and ground equal 0.1uF (called CE).
An najah National UniversityFaculty of Engineering / Electrical Engineering Department
Power Systems Lab (63527) Dr. Maher Khammash & Eng. Saeed Dwaikat
73
Experimental procedure:
Part 1: Power transmission line with neutral cable insulated in condition of ground fault.
Connect the circuit as shown on the figure#3 which shows that there are no connection on the neutral line on this test
Power transmission line with neutral cable insulated in condition of ground fault.
Start this exercise considering the transmission LINE 2 with the following constants: Resistance = 18 Ω; Capacitance = 0.1µF; Inductance = 0.072 H;
ngth = 50 km; Section=50 mm2 - conductor of copper.Turn the breakers at the origin and at the end of the LINE 2, to OFF. Connect the measuring instruments between the left busway and the terminals at the starting of the LINE 2, and between the end termithe LINE 2 and the right busway.Connect the jumpers of the both set of capacitors, in the LINE 2, to reproduce the capacitance between active conductors and ground equal
Power Systems Lab (63527) Dr. Maher Khammash & Eng. Saeed Dwaikat
Part 1: Power transmission line with neutral cable insulated in
ure#3 which shows that there are no
Start this exercise considering the transmission LINE 2 with the following Ω; Capacitance = 0.1µF; Inductance = 0.072 H;
Turn the breakers at the origin and at the end of the LINE 2, to OFF. Connect the measuring instruments between the left busway and the terminals at the starting of the LINE 2, and between the end terminals of
Connect the jumpers of the both set of capacitors, in the LINE 2, to reproduce the capacitance between active conductors and ground equal
An najah National University Faculty of Engineering / Electrical Engineering Department
Power Systems Lab (63527) Dr. Maher Khammash & Eng. Saeed Dwaikat
74
6. Connect the left busway with the variable three-phase power supply. This exercise does not require any load in the right busway but here make a short circuit on the right busway between line1 and ground as shown in figure#3
7. Switch on the three – phase power supply and adjust the sending end voltage of the transmission line to 380volt and keep it constant throughout the test.
8. Turn the breaker at the origin and at the end of the Line 2 to ON9. For instance, modify the set of capacitors CE (via the proper selectors) and
check the trend of ground fault current at sending end and reciving end and tabulate you results in table #1.
Vs
(V)
CEs, CEr
(µF)
C tot
(µF)
Ifs
(A)
Ifr
(A)
380 0.1, 0.1 0.2
380 0.1, 0.2 0.3
380 0.2, 0.2 0.4
380 0.1, 0.4 0.5
380 0.2, 0.4 0.6
380 0.4, 0.4 0.8
Table #1
Question#1:
Explain is the effect of increasing the values of CEs &CEr on the fault current?
Question#2:
Plot the curve of Ctot versus Ifr and explain the effect of adding certain value of
resistance in series with the faulted line?

Faculty of Engineering
Power Systems Lab (63527) Dr. Maher Khammash & Eng. Saeed Dwaikat
Part 2: (A) Power transmission line with compensated neutral conductor in condition of Single phase to ground fault
1. Connect the circuit as shown in figure # 4is connected to the ground through variable
Figure # 4 power transmission line with compensated neutral conductorin condition of ground fault.
2. Start this exercise considering the transmission LINE 2 with the following constants: Resistance = 18 Length = 50 km; Section=50 mm2
3. Turn the breakers at the origin and at the end of the LINE 2, to OFF. 4. Connect the measuring instruments between the left busway and the
terminals at the starting of the LINE 2, and between the end terminalthe LINE 2 and the right busway.
5. Connect the jumpers of both set of capacitors, in the LINE 2, to reproduce the capacitance between active conductors
An najah National UniversityFaculty of Engineering / Electrical Engineering Department
Power Systems Lab (63527) Dr. Maher Khammash & Eng. Saeed Dwaikat
75
Part 2: (A) Power transmission line with compensated neutral conductor in condition of Single phase to ground fault
Connect the circuit as shown in figure # 4 which shows that the neutral line is connected to the ground through variable inductor
power transmission line with compensated neutral conductorin condition of ground fault.
Start this exercise considering the transmission LINE 2 with the following constants: Resistance = 18 Ω; Capacitance = 0.1µF; Inductance = 0.072 H;
h = 50 km; Section=50 mm2 - conductor of copper.Turn the breakers at the origin and at the end of the LINE 2, to OFF. Connect the measuring instruments between the left busway and the terminals at the starting of the LINE 2, and between the end terminalthe LINE 2 and the right busway.Connect the jumpers of both set of capacitors, in the LINE 2, to reproduce the capacitance between active conductors and ground (called CE).
Power Systems Lab (63527) Dr. Maher Khammash & Eng. Saeed Dwaikat
Part 2: (A) Power transmission line with compensated neutral conductor in condition of Single phase to ground fault
which shows that the neutral line
power transmission line with compensated neutral conductor
Start this exercise considering the transmission LINE 2 with the following Ω; Capacitance = 0.1µF; Inductance = 0.072 H;
Turn the breakers at the origin and at the end of the LINE 2, to OFF. Connect the measuring instruments between the left busway and the terminals at the starting of the LINE 2, and between the end terminals of
Connect the jumpers of both set of capacitors, in the LINE 2, to reproduce (called CE).

An najah National University Faculty of Engineering / Electrical Engineering Department
Power Systems Lab (63527) Dr. Maher Khammash & Eng. Saeed Dwaikat
76
6. Connect the left busway with the variable three-phase power supply. This exercise does not require any load in the right busway but here make a short circuit on the right busway between a phase of the line and ground as shown in figure#3 without any resistor connected in series with this fault line.
7. Switch ion the three – phase power supply and adjust the sending end voltage of the transmission line to 380volt and keep it constant throughout the test.
8. Turn the breaker at the origin and at the end of the Line 2 to ON9. Select the values of CEs = 0.2µF & CEr =0.2µF and then vary the values
of the inductor connected in series with the neutral line and measure the values of fault current at sending end and receiving end and tabulate your results in table #2.
Vs
(V)
Inductance of
compensation coil (L)
(mH)
CEs, CEr
(µF)
C tot
(µF)
Ifs
(A)
Ifr
(A)
380 (C,C,C) 1.74 0.2, 0.2 0.4
380 (B,C,C) 2.3 0.2, 0.2 0.4
380 (A,C,C) 3.46 0.2, 0.2 0.4
380 (A,B,C) 4.03 0.2, 0.2 0.4
380 (A,A,C) 5.18 0.2, 0.2 0.4
380 (A,A,B) 5.75 0.2, 0.2 0.4
380 (A,A,A) 6.9 0.2, 0.2 0.4
Table #2
10. Repeat the previous test in this part of experiment with a new values of CEs & CEr (select CEs = 0.4µF & CEr =0.4µF) and tabulate your results in table #3

An najah National University Faculty of Engineering / Electrical Engineering Department
Power Systems Lab (63527) Dr. Maher Khammash & Eng. Saeed Dwaikat
77
Table #3
Part 2: (B) Power transmission line with compensated neutral conductor in condition of Single phase to ground fault through 540 Ω resistor.
11. Connect a resistor =540Ω in series with the line to ground fault as shown in figure #5 and repeat all steps in part 2 (A) and tabulate your results in table #4 and table #5
Vs
(V)
Inductance of
compensation coil (L)
(mH)
CEs, CEr
(µF)
C tot
(µF)
Ifs
(A)
Ifr
(A)
380 (C,C,C) 1.74 0.4, 0.4 0.8
380 (B,C,C) 2.3 0.4, 0.4 0.8
380 (A,C,C) 3.46 0.4, 0.4 0.8
380 (A,B,C) 4.03 0.4, 0.4 0.8
380 (A,A,C) 5.18 0.4, 0.4 0.8
380 (A,A,B) 5.75 0.4, 0.4 0.8
380 (A,A,A) 6.9 0.4, 0.4 0.8

An najah National University Faculty of Engineering / Electrical Engineering Department
Power Systems Lab (63527) Dr. Maher Khammash & Eng. Saeed Dwaikat
78
Figure #5 power transmission lines with compensated neutral conductorin condition of ground fault with 540Ω resistor.
Vs
(V)
Inductance of
compensation coil (L)
(mH)
CEs, CEr
(µF)
C tot
(µF)
Ifs
(A)
Ifr
(A)
380 (C,C,C) 1.74 0.2, 0.2 0.4
380 (B,C,C) 2.3 0.2, 0.2 0.4
380 (A,C,C) 3.46 0.2, 0.2 0.4
380 (A,B,C) 4.03 0.2, 0.2 0.4
380 (A,A,C) 5.18 0.2, 0.2 0.4
380 (A,A,B) 5.75 0.2, 0.2 0.4
380 (A,A,A) 6.9 0.2, 0.2 0.4
Table #4

An najah National University Faculty of Engineering / Electrical Engineering Department
Power Systems Lab (63527) Dr. Maher Khammash & Eng. Saeed Dwaikat
79
Table #5
Question#3:
Explain is the effect of increasing the values of the compensating inductor on the fault current?
Question#4:
Plot the curves of the receiving end fault current versus the inductance compensating inductor with deferent values of capacitors ?
Question#5:
Explain the effect of adding certain value of resistance in series with the fault line?
Write down your conclusions
Vs
(V)
Inductance of
compensation coil (L)
(mH)
CEs, CEr
(µF)
C tot
(µF)
Ifs
(A)
Ifr
(A)
380 (C,C,C) 1.74 0.4, 0.4 0.8
380 (B,C,C) 2.3 0.4, 0.4 0.8
380 (A,C,C) 3.46 0.4, 0.4 0.8
380 (A,B,C) 4.03 0.4, 0.4 0.8
380 (A,A,C) 5.18 0.4, 0.4 0.8
380 (A,A,B) 5.75 0.4, 0.4 0.8
380 (A,A,A) 6.9 0.4, 0.4 0.8

An najah National University Faculty of Engineering / Electrical Engineering Department
Power Systems Lab (63527) Dr. Maher Khammash & Eng. Saeed Dwaikat
80
EExxppeerriimmeenntt ##1100PPoowweerr ffaaccttoorr ccoorrrreeccttiioonn bbyy uussiinngg ssyynncchhrroonnoouuss ccoommppeennssaattoorr
OObbjjeeccttiivveess::
1. Carry out the connections and the sequence of operations to enable the synchronous compensator.
2. Detect the data of the system with a digital power analyzer
TThheeoorreettiiccaall nnoottiioonnss..
Being in load or no-load condition, an under excited synchronous motor shows an Inductive load to the mains. On the contrary, when overexcited, it is equivalent to a capacitive load (function of synchronous compensator).
What is Synchronous Condenser?
In electrical engineering, a synchronous condenser (sometimes synchronous capacitor or synchronous compensator) is a device identical to a synchronous motor, whose shaft is not connected to anything but spins freely.
Its purpose is not to convert electric power to mechanical power or vice versa, but to adjust conditions on the electric power transmission grid. Its field is controlled by a voltage regulator to either generate or absorb reactive power as needed to adjust the grid's voltage, or to improve power factor. The condenser’s installation and operation are identical to large electric motors.
How does it work ?
The following V curves figure# 1 for a synchronous machine, shows a synchronous condenser operates at nearly zero real power. As the machine passes from under excited to overexcited, its stator current passes through a minimum.
For the same output load, the armature current varies over a wide range and so causes the power factor also to vary accordingly. When over-excited, the motor runs with leading power factor and with lagging power factor when

An najah National University Faculty of Engineering / Electrical Engineering Department
Power Systems Lab (63527) Dr. Maher Khammash & Eng. Saeed Dwaikat
81
under-excited. In between, the power factor is unity. The minimum armature current corresponds to unity power factor.
Figure# 1
What are the major benefits of synchronous Condensers?
1. Generating and compensating of reactive power.2. Improving System’s power factor.3. Improves power line voltage regulation. 4. Reduce power losses in transmission lines. 5. Prevent extra fees on bills. 6. Provide exact control for variable reactive power compensation.7. Costly effective than capacitor for large amount of MVA.
Equipments required (Apparatuses):
1. Generator parallel board mod. PCB-2/EV.2. Control board for generating set mod. GCB-2/EV.3. Synchronous generator-motor unit mod. MSG-l/EV.4. Fixed three-phase power supply mod. UAT/EV, or variable power5. Three- phase power supply mod. AMT-3/EV.6. Digital power analyzer mod. AZ-VIP/EV.7. Variable resistive load mod. RL-2/EV or RL-2AJEV.8. Variable inductive load mod. IL-2/EV.9. Set of cables-jumpers for electrical connections.

An najah National University Faculty of Engineering / Electrical Engineering Department
Power Systems Lab (63527) Dr. Maher Khammash & Eng. Saeed Dwaikat
82
EExxppeerriimmeenntt pprroocceedduurree::
11.. CCoonnnneecctt tthhee cciirrccuuiitt aass sshhoowwnn iinn ffiigguurree ##11-- AA aanndd ffiigguurree ##11-- BB
FFiigguurree ##11-- AA (electrical circuit connection)

An najah National University Faculty of Engineering / Electrical Engineering Department
Power Systems Lab (63527) Dr. Maher Khammash & Eng. Saeed Dwaikat
83
cal diagram for using the synchronous machine as synchronous compensator.
FFiigguurree ##11-- BB (practical circuit connection)

An najah National University Faculty of Engineering / Electrical Engineering Department
Power Systems Lab (63527) Dr. Maher Khammash & Eng. Saeed Dwaikat
84
2. At no load start the prime mover of the control board for generating unit (GCB-2/EV). And increase the speed and the excitation current to obtain the rated values of the synchronous generator (the frequency =50Hz and terminal voltage = 400 volt) like in the case of a parallel connection of a generator with the main supply.
3. Switch on the main supply and adjust its terminal voltage to 400 volt.
4. Carry out the proper adjustments to find the best “condition for the parallel connection” and carry it out. At this moment you have a three –phase generator connected in parallel with the main supply
5. Still at no load and without changing the excitation parameters of the synchronous compensator turn the switch RUN/STAND-BY to STAND-BY. Now this process transforms synchronous generator to become synchronous motor because the DC motor doesn't drive the synchronous generator any more.
6. Still at no load and try to adjust the excitation current of thesynchronous motor to get a power factor = 1 for that motor and the main supply and measure the values of real power line current and reactive power of the main supply and the synchronous motor. ( PFsys =PFmotor = 1 and Qsys = Qmotor = 0)
7. Now add a resistive - inductive load (resistive load with switch B and inductive load with switch B ) ,increase the value of field current of the synchronous motor in steps to get the power factor of the system= 0.94 lagging and record the following measurements and the measurement in table # 1

An najah National University Faculty of Engineering / Electrical Engineering Department
Power Systems Lab (63527) Dr. Maher Khammash & Eng. Saeed Dwaikat
85
Pload= Qload= Iload = PFload=
resistive switch AB and inductive switch AB
IF
(Amp)
System measurements Motor measurements
P(Watt) Q(VAR) P.F I(Amp) P(Watt) Q(VAR) P.F I(Amp)
Table # 1
8. Return back to the first readings at no load by adjusting the field current that is PFsys=PFmotor= 1 and Qsys=Qmotor= 0.
9. Now add a resistive - inductive load (resistive load with switch B and inductive load with switch B ) ,decrease the value of field current of the synchronous motor in steps to and record the following measurements in table # 2
Pload= Qload= Iload = PFload=
resistive load with switch B and inductive load with switch B
IF
(Amp)
System measurements Motor measurements
P(Watt) Q(VAR) P.F I(Amp) P(Watt) Q(VAR) P.F I(Amp)
Table # 2

An najah National University Faculty of Engineering / Electrical Engineering Department
Power Systems Lab (63527) Dr. Maher Khammash & Eng. Saeed Dwaikat
86
10. Repeat steps 6 ,7,8 & 6 for another resistive – inductive load (resistive load with switch AB and inductive load with switch AB)
Increasing IF
Pload= Qload= Iload = PFload=
resistive switch AB and inductive switch AB
IF
(Amp)
System measurements Motor measurements
P(Watt) Q(VAR) P.F I(Amp) P(Watt) Q(VAR) P.F I(Amp)
Table # 3
Decreasing IF
Pload= Qload= Iload = PFload=
resistive switch AB and inductive switch AB
IF
(Amp)
System measurements Motor measurements
P(Watt) Q(VAR) P.F I(Amp) P(Watt) Q(VAR) P.F I(Amp)
Table # 4

An najah National University Faculty of Engineering / Electrical Engineering Department
Power Systems Lab (63527) Dr. Maher Khammash & Eng. Saeed Dwaikat
87
Question #1
What happen to the system power factor and the synchronous compensator when the field current is increased? Why?
Question #2
What happen to the system power factor and the synchronous compensator when the field current is decreased? Why?
Write down your conclusions

An najah National University Faculty of Engineering / Electrical Engineering Department
Power Systems Lab (63527) Dr. Maher Khammash & Eng. Saeed Dwaikat
88
Experiment # 11
Power factor correction by using C- PF/EV panel
Objective:
1. To be familiar with power factor correction units using capacitor banks.
2. To use these capacitor banks to improve the power factor manually and automatically and compare between the two cases.
Introduction:
In this experiment we will use Capacitor Banks to improve the all over the system power factor and have desire power factor . and this will be done by using automatic power factor correction system(C- PF/EV) manually and Automaticallyby use Microcontroller which will describe later.
What’s the Power Factor (P.F)?
The power factor of an AC electrical power system is defined as the ratio of the real power flowing to the load to the apparent power in the circuit, and is a dimensionless number between 0 and 1. However, the average power in an AC circuit expressed in terms of the rms voltage and current is
where is the phase angle between the voltage and current. The additional term is called the power factor
From the phaser diagram for AC impedance, it can be seen that the power factor is R/Z.
Why do we need Power Factor Improvement.
Power factors below 1.0 require a utility to generate more than the minimum volt-amperes necessary to supply the real power (watts). This increases generation and transmission costs. For example, if the load power factor were as low as 0.7, the apparent power would be 1.4 times the real power used by the load. Line current in the circuit would also be 1.4 times the current required at 1.0 power factor, so

An najah National University Faculty of Engineering / Electrical Engineering Department
Power Systems Lab (63527) Dr. Maher Khammash & Eng. Saeed Dwaikat
89
the losses in the circuit would be doubled (since they are proportional to the square of the current). Alternatively all components of the system such as generators, conductors, transformers, and switchgear would be increased in size (and cost) to carry the extra current.
Utilities typically charge additional costs to customers who have a power factor below some limit, which is typically 0.9 to 0.95. Engineers are often interested in the power factor of a load as one of the factors that affect the efficiency of power transmission.
And low P.F implies:
1) Low P.F large KVA Rating Equivalent circuit for Device large and price will increase too.
2) Low P.F High Currents ( currents is α . ) High conductor size.
= √ × = √ ×and after improvement Q =Ql –Qc
= √ × = ( )√ × I will decrease.
3) Low P.FHigh currentsHigh Losses Low efficiency reduce Receiving end voltage.
4) Reduce handing capacity of system
Power Factor correction methods.
1) By using Capacitors Banks2) By using Synchronous Condensers3) By using Phase advancers
Equipments required (Apparatuses):
1. Variable 3-phase power supply mod. AMT-3/EV or constant three phase power supply UAT /EV.
2. Automatic Power Factor Correction System using capacitor Banks C –PF/EV
3. Variable resistive inductive load mod.RL-2k/EV.4. Variable inductive load mod.IL-2/EV.5. Set of jumpers and cables for electrical connection.

An najah National University Faculty of Engineering / Electrical Engineering Department
Power Systems Lab (63527) Dr. Maher Khammash & Eng. Saeed Dwaikat
90
Experiment Procedure:
1. Connect the circuit as shown in figure #1A or figure #1 B2. If you use the variable power supply switch it on and adjust the terminal
voltage to be =400 volt
Figure #1A electric circuit for power factor correction test
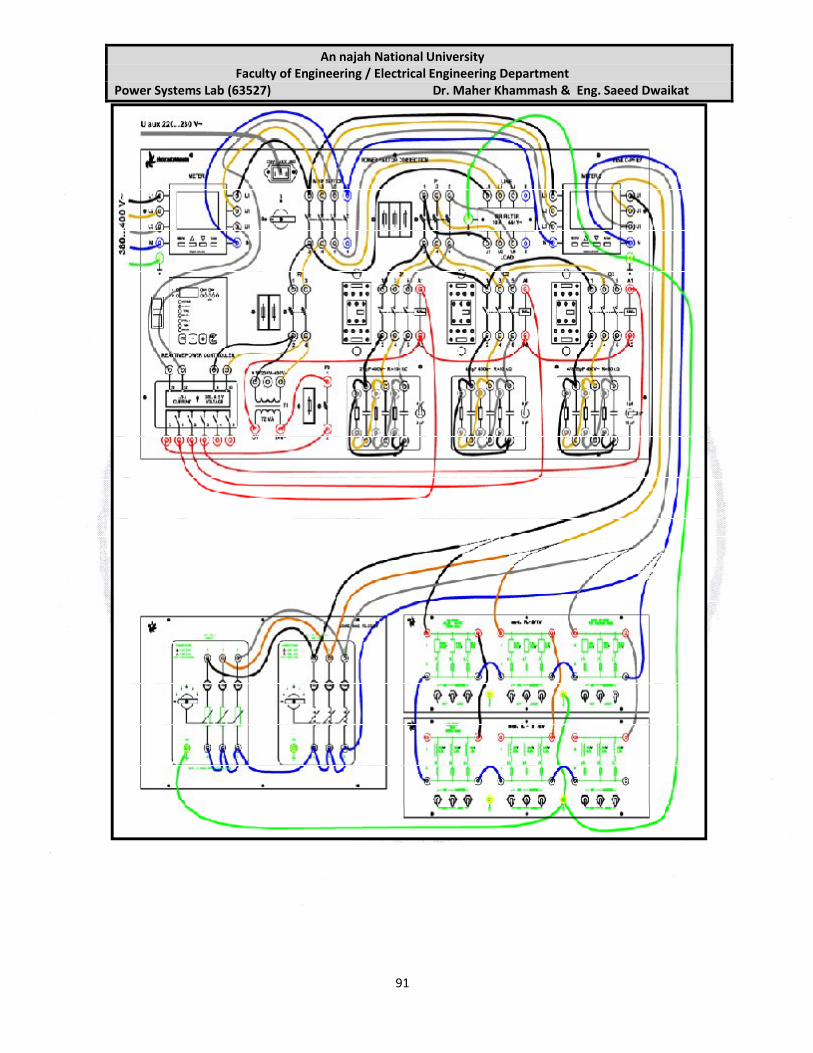
An najah National University Faculty of Engineering / Electrical Engineering Department
Power Systems Lab (63527) Dr. Maher Khammash & Eng. Saeed Dwaikat
91
Figure #1B practical electric circuit for power factor correction test

An najah National University Faculty of Engineering / Electrical Engineering Department
Power Systems Lab (63527) Dr. Maher Khammash & Eng. Saeed Dwaikat
92
Part I A: manual mode of power factor correction with three deferent values of capacitors (C1=4µF, C2=8µF, C3=16µF )
3. Set the controller of the unit C – PF/EV on the manual mod by long press on the auto /Manu push Button.
4. Set the basic settings of this controller P6 step 1=1, P6step 2=2, P6step 3=4 by pressing a long press on the mode push Button and use the auto /Manu push Button to reach to the function P6.
5. Set the advanced settings of this controller P16 to the standard mod. bypressing a long press on the mode push Button and then long press on the + & - together to inter to the advance settings and use the auto /Manupush Button to reach to the function P16.
6. Set the desired power factor on the controller =0.94 lagging.7. Now start your test by adding various steps of resistive inductive loads and
make the correction of the power factor using the manual mode by inserting the capacitors you need in parallel to the load and check the suitable value of these capacitors that mach the power factor of the system equal or near to the desired power factor and tabulate your results in table #1
R is set to step 1 L1 is set to step 5 L2 set to steps A B CL3 set to step A B C
R is set to step 2L1 is set to step 5L2 set to steps A B CL3 set to step B
R is set to step 2L1 is set to step 5L2 set to steps A B
R-L load
C1=4µFC2=8µF
C3=16µF
PFold
PFnew
Pin total (watt)
Q2=Qold = (Qload) (VAR)
Q1=Qnew (VAR)
I1 (Amp)
I2 = ILoad (Amp)
Table #1

An najah National University Faculty of Engineering / Electrical Engineering Department
Power Systems Lab (63527) Dr. Maher Khammash & Eng. Saeed Dwaikat
93
Question#1
Calculate the required values of capacitance for each load by using Qold and Qnew and compare it to the values selected by the device.
Part I B: Automatic mode of power factor correction with three deferent values of capacitors (C1=4µF, C2=8µF, C3=16µF )
1. Switch off the power supply and C – PF/EV unit and return back to the no load case with the same connection.
2. Restart the system again and turn the mode to the automatic mode by pressing a long press on the auto /Manu push Button and start to vary the resistive inductive load in steps and let the controller of the system correct the power factor automatically and tabulate your results in table #2
R is set to step 1 L1 is set to step 5 L2 set to steps A B CL3 set to step A B C
R is set to step 2L1 is set to step 5L2 set to steps A B CL3 set to step B
R is set to step 2L1 is set to step 5L2 set to steps A B
R-L load
C1=4µFC2=8µF
C3=16µF
PFold
PFnew
Pin total (watt)
Q2=Qold =(Qload) (VAR) Q1=Qnew (VAR)
I1 (Amp)
I2 = ILoad (Amp)
Table #2

An najah National University Faculty of Engineering / Electrical Engineering Department
Power Systems Lab (63527) Dr. Maher Khammash & Eng. Saeed Dwaikat
94
Question#2
Calculate the required values of capacitance for each load by using Qold and Qnew and compare it to the values selected by the device ?
3Question#
Make a comparison between your results in of manual mode with the results of the automatic mode. What do you notice about that?
tion with threepower factor correce ofanual modM:I AIPart (C1=4µF, C2=4µF, C3=4µF ) capacitorsequal
1. Switch off the power supply and C – PF/EV unit and return back to the no load case with the same connection.
2. Restart the system again and turn the mod. to the manual mode. by pressing long press on the auto /Manu push Button .
3. Set the basic settings of this controller P6 step 1=1, P6step 2=1, P6step 3=1 by pressing a long press on the mode push Button and use the auto /Manu push Button to reach to the function P6.
4. Set the advanced settings of this controller P16 to the linear mod. by pressing a long press on the mode push Button and then long press on the + & - together to inter to the advance settings and use the auto /Manupush Button to reach to the function P16.
5. Set the desired power factor on the controller =0.94 lagging.6. Now start your test by adding various steps of resistive inductive loads and
make the correction of the power factor using the manual mod by inserting the capacitor you need parallel to the load and check the suitable value of these capacitors that mach the power factor of the system equal or near to the desired power factor and tabulate your results in table #3.

An najah National University Faculty of Engineering / Electrical Engineering Department
Power Systems Lab (63527) Dr. Maher Khammash & Eng. Saeed Dwaikat
95
R is set to step 2
L1 is set to step 5
L2 set to steps A C
R is set to step 2
L1 is set to step 5
L2 set to steps B
R is set to step 2
L1 is set to step 3R-L load
C1=4µFC2=4µF
C3=4µF
PFold
PFnew
Pin total (watt)
Q2=Qold= (Qload) (VAR)
Q1=Qnew (VAR)
I1 (Amp)
I2=ILoad (Amp)
Table #3
Question#4
Calculate the required values of capacitance for each load by using Qold and Qnew and compare it to the values selected by the device ?
Part II B: Automatic mode of power factor correction with three equal capacitors (C1=4µF, C2=4µF, C3=4µF )
1. Switch off the power supply and C – PF/EV unit and return back to the no load case with the same connection.
2. Restart the system again and turn the mod. to the automatic mod. by pressing long press on the auto /Manu push Button and start to vary the resistive inductive load in steps and let the controller of the system correct the power factor automatically and tabulate your results in table #4

An najah National University Faculty of Engineering / Electrical Engineering Department
Power Systems Lab (63527) Dr. Maher Khammash & Eng. Saeed Dwaikat
96
R is set to step 2
L1 is set to step 5
L2 set to steps A C
R is set to step 2
L1 is set to step 5
L2 set to steps B
R is set to step 2
L1 is set to step 3R-L load
C1=4µFC2=4µF
C3=4µF
PFold
PFnew
Pin total (watt)
Q2=Qold =(Qload) (VAR)
Q1=Qnew (VAR)
I1 (Amp)
I2 = ILoad (Amp)
Table #4
Question#5
Calculate the required values of capacitance for each load by using Qold and Qnew and compare it to the values selected by the device ?
Question#6
Make a comparison between your results in of manual mode with the results of the automatic mode. What do you notice about that?
Write down your conclusions.

An najah National University Faculty of Engineering / Electrical Engineering Department
Power Systems Lab (63527) Dr. Maher Khammash & Eng. Saeed Dwaikat
97
Experiment # 12
Study the operation of protection relays including distance protection relays on a power system
sObjective
The present exercise is dedicated to:
1. Connect the distance relay SR-16 with all its accessories (SR20 + SR21).2. To test the relay action with a phase-to-ground failure in an HV line.3. To test the relay action with a phase-to-failure in an HV line.4. Study the operation of protection relays with a system consisting of a
power supply, a transmission line and load.
Equipments required (Apparatuses):
1. Variable Power Supply AMT-3/EV.
2. Isolated Transformer P-14/EV.3. Transmission Line Simulator SEL-1/EV.4. Digital Power Analyzer AZ-VIP5. Module SR16/EV Distance Protection Relay Panel. The Panel should be
connected to a PC via the RS232 cable.6. Module SR20/EV HV Line Simulator.7. Module SR21/EV Isolation transformer.8. Protection Relay (over current relay) SR1/EV.9. Protection Relay (max/ min voltage relay) SR3/EV.10.Protection Relay (max/ min frequency relay) SR5/EV.11.Power Supply UAT/EV.12.Resistive Load RL-2/EV.13.Inductive Load IL-2/EV.
Experiment Procedure:
4. Connect the circuit shown in the figure#1- A , figure#1- B and figure#1- C .
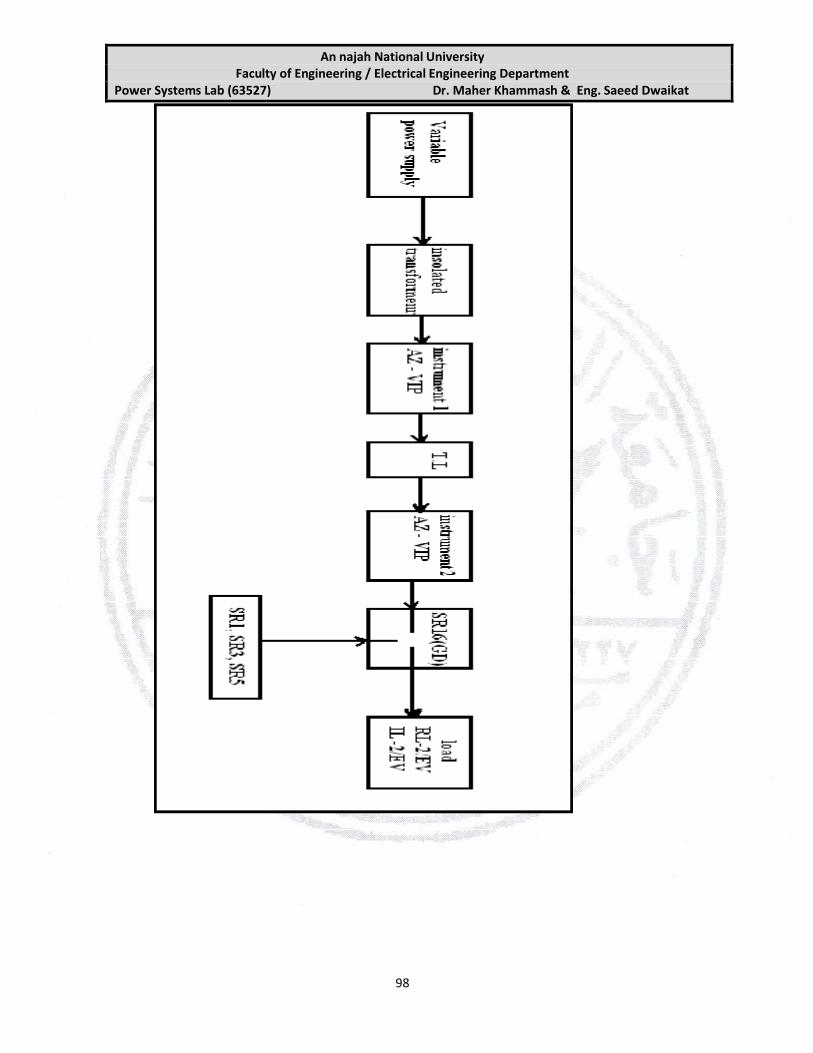
An najah National University Faculty of Engineering / Electrical Engineering Department
Power Systems Lab (63527) Dr. Maher Khammash & Eng. Saeed Dwaikat
98
Figure #1 -A

An najah National University Faculty of Engineering / Electrical Engineering Department
Power Systems Lab (63527) Dr. Maher Khammash & Eng. Saeed Dwaikat
99
Figure#1- B

An najah National University Faculty of Engineering / Electrical Engineering Department
Power Systems Lab (63527) Dr. Maher Khammash & Eng. Saeed Dwaikat
100
Figure#1- C (control circuit connection of protection relays)

An najah National University Faculty of Engineering / Electrical Engineering Department
Power Systems Lab (63527) Dr. Maher Khammash & Eng. Saeed Dwaikat
101
5. At no load Switch on the power supply and start the control circuit of the protection relays SR1 (over current relay) , SR3 (max/ min voltage relay) and SR5 (max/ min frequency relay) then adjust the protection relays to certain different tripping values of current, voltage, frequency and time .
6. The relay you want to test must has smaller values of tripping time than the others
7. Now start to add different values of resistive - inductive load in steps and check the tripping of the over current relays by regulating the terminal voltage to 400 volt in each step and tabulate your results in table #1
Over current relay settings SR1(Over load current=1 Amp & time delay =5 sec)
Terminal Voltage(V)
Load Current (Amp)
Time of tripping(sec)
Table #1
8. Return back to the no load case and terminal voltage = 400 volt and readjust the protection relays (increase the time of tripping of over current relay and decrease it for SR3 (over / under voltage relay) to check the over / under voltage relay and then start to vary the resistive - inductive load in steps and check the tripping of the over / under voltage relay without regulating the terminal voltage and tabulate your results in table #2
Over/ under voltage relay settings (under voltage = -10% & time delay =5 sec)
Terminal Voltage(V)
Load Current (Amp)
Time of tripping (sec)
Table #2

An najah National University Faculty of Engineering / Electrical Engineering Department
Power Systems Lab (63527) Dr. Maher Khammash & Eng. Saeed Dwaikat
102
9. With a certain resistive inductive load and at 400 volt terminal voltage try to increase the terminal voltage in steps and notice the value at which the overvoltage relay trip and tabulate your results in table #3
Over/ under voltage relay settings (over voltage =+6% & time delay =5 sec)
Terminal Voltage(V)
Load Current (Amp)
Time of tripping (sec)
Table #3
Distances relay protection:
line to ground faultPart I :
1. Connect the circuit as shown in figure#2

An najah National University Faculty of Engineering / Electrical Engineering Department
Power Systems Lab (63527) Dr. Maher Khammash & Eng. Saeed Dwaikat
103
Figure#2
2. HV line with a phase – to – ground fault .At no load switch on the power supply and the distance relay board and then try to make a short circuit between any one of the three lines with the ground as in figure #3and tabulate your results in table #4

An najah National University Faculty of Engineering / Electrical Engineering Department
Power Systems Lab (63527) Dr. Maher Khammash & Eng. Saeed Dwaikat
104
Figure#3
Test.1: Phase to Ground Fault at No Load
Test Distance (km)
Measured Distance
(km)
Distance Error (%)
PU Time (ms)
I Fault (A)
1 100
2 75
3 50
4 25
Table #4
3. Add all switches of resistive load and then repeat the line to ground fault and tabulate your results in table #5

An najah National University Faculty of Engineering / Electrical Engineering Department
Power Systems Lab (63527) Dr. Maher Khammash & Eng. Saeed Dwaikat
105
Test.2: Phase to Ground Fault at Full Resistive Load (switches A B C)
Test Distance (km)
Measured Distance
(km)
Distance Error (%)
PU Time (ms)
I Fault (A)
1 100
2 75
3 50
4 25
Table #5
faultlineI : line to IPart
4. With the same connection as in figure #2 and at no load switch on the power supply and the distance relay board then try to make a short circuit between any two lines as in figure#4 and tabulate your results in table #6
Figure#4

An najah National University Faculty of Engineering / Electrical Engineering Department
Power Systems Lab (63527) Dr. Maher Khammash & Eng. Saeed Dwaikat
106
Test.1: Phase to Phase Fault at No Load
Test Distance (km)
Measured Distance
(km)
Distance Error (%)
PU Time (ms)
I Fault (A)
1 100
2 75
3 50
4 25
Table #6
5. Add all switches of resistive load and then repeat the line to line fault and tabulate your results in table #7
Test.2: Phase to Phase Fault at Full Resistive Load
Test Distance (km)
Measured Distance
(km)
Distance Error (%)
PU Time (ms)
I Fault (A)
1 100
2 75
3 50
4 25
Table #7
Write down your conclusions

An najah National University Faculty of Engineering / Electrical Engineering Department
Power Systems Lab (63527) Dr. Maher Khammash & Eng. Saeed Dwaikat
107
Experiment #13
The operation of an over all power system
Objectives :
1. Study the full operation of integrated power system starting from the generating units till the loads.
2. Study the different load conditions of the system.3. Study the effects of capacitor installation on the voltages, reactive power
and P.F.
Equipments :
1. Two motor-generator units mod.MSG-2/EV.2. Two control panels for the M-G units ,mod. GCB-2/EV.3. Parallel panel, mod. PCB-2/EV.4. Three phase transformer, mod. P-14A/EV.5. HV simulator mod.SEL-1/EV.6. Multifunction instruments mod.AZ-VIP/EV.7. Resistive load mod.RL-2A/EV.8. Inductive load mod. IL-2/EV.9. Capacitive load mod.CL-2/EV.
Preparing the experiment :
This experiment requires an integration between many stages as explained:
Stage I: The two motor-generator units must be synchronized and paralleled inthe same procedure as did in previous experiments under suitable conditions.
Stage II : The output of the paralleled panel is connected to the primary of an insolated transformer (Star connection) , and the secondary of this transformer is connected star connection as well, make sure the ratio is 1 to 1 so that the transformer is used as an isolator.
Stage III: The secondary of the isolating transformer is connected to the HV simulator through multifunction instruments.

An najah National University Faculty of Engineering / Electrical Engineering Department
Power Systems Lab (63527) Dr. Maher Khammash & Eng. Saeed Dwaikat
108
Stage IV: The output of the HV simulator is connected to (Star connected) R-L load through multifunction instruments and capacitive load can be added in parallel later on to achieve power factor correction.
The following block diagram (figure# 1) gives a brief indication of panels sequence. And the connection diagram figure #2, shows the exact connections required.
Figure# 1

Faculty of Engineering
Power Systems Lab (63527) Dr. Maher Khammash & Eng. Saeed Dwaikat
procedure :Experimental
connect the circuit ac shown in
An najah National UniversityFaculty of Engineering / Electrical Engineering Department
Power Systems Lab (63527) Dr. Maher Khammash & Eng. Saeed Dwaikat
109
procedure :
connect the circuit ac shown in figure #2-A and figure #2-B
Figure #2-A
Power Systems Lab (63527) Dr. Maher Khammash & Eng. Saeed Dwaikat

Faculty of Engineering
Power Systems Lab (63527) Dr. Maher Khammash & Eng. Saeed Dwaikat
1. Figure #2- B shows that you must connect the two transmission line in parallel to be able to increase the value of the load current more than 1.5
An najah National UniversityFaculty of Engineering / Electrical Engineering Department
Power Systems Lab (63527) Dr. Maher Khammash & Eng. Saeed Dwaikat
110
Figure #2-B
B shows that you must connect the two transmission line in parallel to be able to increase the value of the load current more than 1.5
Power Systems Lab (63527) Dr. Maher Khammash & Eng. Saeed Dwaikat
B shows that you must connect the two transmission line in parallel to be able to increase the value of the load current more than 1.5

An najah National University Faculty of Engineering / Electrical Engineering Department
Power Systems Lab (63527) Dr. Maher Khammash & Eng. Saeed Dwaikat
111
amp. Set the parameters of both transmission lines as follow :R= 18 Ohm , L = 72mH and C1 = C2 = 0.2 µF.
2. Make the synchronization procedure of the two generators correctly after checking the synchronization condition as in previous experiments. That is the line to line voltage of each of them is =380volt and the frequency is = 50 Hz
3. Switch on the switches at the sending ends and receiving ends of the two transmission lines and vary the excitation current of the two generators to get the line to line voltage at the sending ends of the two transmission line = 380volt
Part I : No load test
1. Make sure that all loads are disconnected.2. Adjust both generating units so that the terminal voltage of the power
system remains unchanged (380 volts).3. Cancel the capacitance effects from both lines by removing the jumpers
totally.4. Record your measurements for the values VS ,VR ,IS ,P.FS and QS in table #
15. Repeat the same steps but connecting C1 & C2 for each T.L as: I) ΔY,
II)ΔΔ
C1connection
C2
connection
VS
(V)
VR
(V)
IS
(Amp)P.FS
QS
(VAR)
OFF OFF 380
Δ Y 380
Δ Δ 380
Table # 1
Question #1
Explain your results for each case?

An najah National University Faculty of Engineering / Electrical Engineering Department
Power Systems Lab (63527) Dr. Maher Khammash & Eng. Saeed Dwaikat
112
Part II : Load test ( pure resistive load)
Very important note:
When adding any loads the terminal line to line voltage is varying in accordance to the load value so its vey important to keep it= 380 volt constant at the sending ends of the transmission lines by changing the excitation current of both generators .
1. Before connecting any load, make sure the terminal voltage is 380.2. Connect the capacitors of both transmission lines Δ connection at the
sending ends and Y connection at the receiving ends.3. Insert various steps of the pure resistive load.4. Users will have to maintain 380 volts at sending end of the transmission
lines simulator by changing the excitation current of the two generators at the same time.
5. Record measurements and fill in the following table (table# 2).
Rload
(Ω)
VS
(V)
VR
(V)
IS
(Amp)
IR
(Amp)P.FS P.FR
QS
(VAR)
OFF 380A 380
B 380
AB 380
C 380
AC 380
BC 380
ABC 380
(Table# 2)
Question#2
Draw and explain the following relationships:
1. QS versus IR
2. VR versus IR

An najah National University Faculty of Engineering / Electrical Engineering Department
Power Systems Lab (63527) Dr. Maher Khammash & Eng. Saeed Dwaikat
113
Part III : Load test and power factor correction (resistive –inductive load)
1. Before connecting any load, make sure that the terminal voltage at the sending ends of the transmission lines is 380 volt.
2. Connect the capacitors of both transmission lines Δ connection at the sending ends and Y connection at the receiving ends.
3. Insert the first step of the pure resistive load (switch A) in parallel with an inductive load (switches AB).
4. Readjust the terminal voltage of the system to 380 volts by adjusting the excitation current of both generators.
5. Insert various steps of the pure capacitive load as a compensator to improve the P.F.
6. At each step you must maintain the terminal voltage at the sending ends of the transmission lines simulator constant 380 volts by changing the excitation current of the two generators at the same time.
7. Record measurements and fill in the following table (table#3).
resistive load (switch A) & inductive load (switches AB)
CLoad
(µF)
VS
(V)
VR
(V)
IS
(Amp)
IR
(Amp)P.FS P.FR
QS
(VAR)
Off 380
A 380
B 380
AB 380
C 380
(Table#3)
Question#3
Draw and explain the following relationships:
1. QS versus C.2. VR versus C.3. P.FR versus C.

An najah National University Faculty of Engineering / Electrical Engineering Department
Power Systems Lab (63527) Dr. Maher Khammash & Eng. Saeed Dwaikat
114
8. Repeat all steps of part III by adding a new resistive - inductive load resistive load (switch A) in parallel with an inductive load (switches AC). Record your measurements and fill in the table (table#4).
resistive load (switch A) & inductive load (switches AC)
CLoad
(µF)
VS
(V)
VR
(V)
IS
(Amp)
IR
(Amp)P.FS P.FR
QS
(VAR)
Off 380A 380
B 380
AB 380
C 380
(Table#4).
Question#4
Draw and explain the following relationships::
1. QS versus C.2. VR versus C.3. P.FR versus C.
Question#5
Compare the results you have in table #3 with the results you have in table #4? What do you notice about that?
System Stop
1. Student 3 gradually unloads the system, while student 1 and 2 should be ready to modify accordingly the 2 M- GS parameters.
2. Disconnect first one of the M-G from the parallel. Be ready to modify accordingly the 2 M-GS parameters.
3. Disconnect the second M-G from the parallel 4. Perform the M-G stop procedure for both machines
Writ e down your conclusions