an introduction to points international pts:tsx ptsef:otcbb renn capital may 2009
TRANSCRIPT
An Introduction to Points International
PTS:TSX PTSEF:OTCBB
Renn CapitalMay 2009
Apr 19, 2023Page: 2
Safe Harbor
This presentation contains or incorporates forward-looking statements within the meaning of United States securities legislation and forward-looking information within the meaning of Canadian securities legislation (collectively referred to as “forward-looking statements"). These forward-looking statements include statements relating to our guidance for 2009 with respect to revenue and EBITDA, our planned investment in the business for 2009, the future direction of the Points.com portal and our 2009 business outlook. Forward-looking statements are not guarantees of future performance, conduct or events. Forward-looking statements are predictive in nature, and are based on current expectations, estimates, forecasts and assumptions and involve risks and uncertainties that could cause actual outcomes and results to differ materially from the forward-looking statements themselves. Points' claims the protection of the safe harbor for forward-looking statements contained in the U.S. Private Securities Litigation Reform Act of 1995, and in applicable Canadian securities legislation.
The revenue and EBITDA guidance, and planned investment in the business for 2009, assume that Points’ in-market products and services will continue to perform along historical growth curves and will be responsive to optimization, and that newly launched products and services will grow and perform in a manner consistent with the Points' experience with its existing in-market products.
Important risks and uncertainties that could cause actual results to differ materially from Points' forward-looking statements include the risks and uncertainties set forth under "Risks and Uncertainties" in Management's Discussion and Analysis and the risks and uncertainties detailed in Points' Annual Information Form, annual and interim financial statements and the notes thereto. These documents are filed with U.S. and Canadian securities regulators and are available at www.sedar.com and www.sec.gov.
The forward-looking statements contained in this presentation are made as at the date of this presentation and, accordingly, are subject to change after such date. Except as required by law, Points does not undertake any obligation to update or revise any forward-looking statements made or incorporated in this presentation, whether as a result of new information, future events or otherwise.
Apr 19, 2023Page: 3
Our Business
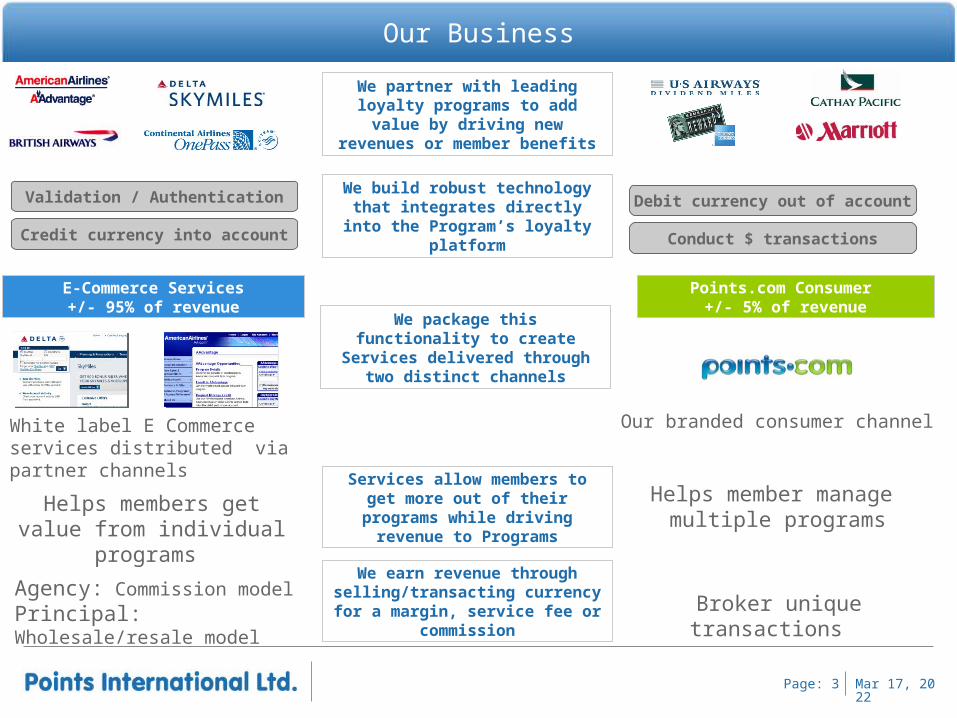
We partner with leading loyalty programs to add value by driving new revenues or member benefits
We build robust technology that integrates directly into the Program’s loyalty platformCredit currency into account
Debit currency out of accountValidation / Authentication
Conduct $ transactions
We package this functionality to create Services delivered through
two distinct channels
E-Commerce Services+/- 95% of revenue
White label E Commerce services distributed via partner channels
Points.com Consumer +/- 5% of revenue
Our branded consumer channel
Broker unique transactions
Helps member manage multiple programs
We earn revenue through selling/transacting currency for a
margin, service fee or commission
Agency: Commission modelPrincipal: Wholesale/resale model
Services allow members to get more out of their programs while
driving revenue to ProgramsHelps members get value from individual programs
Apr 19, 2023Page: 4
Financial Highlights
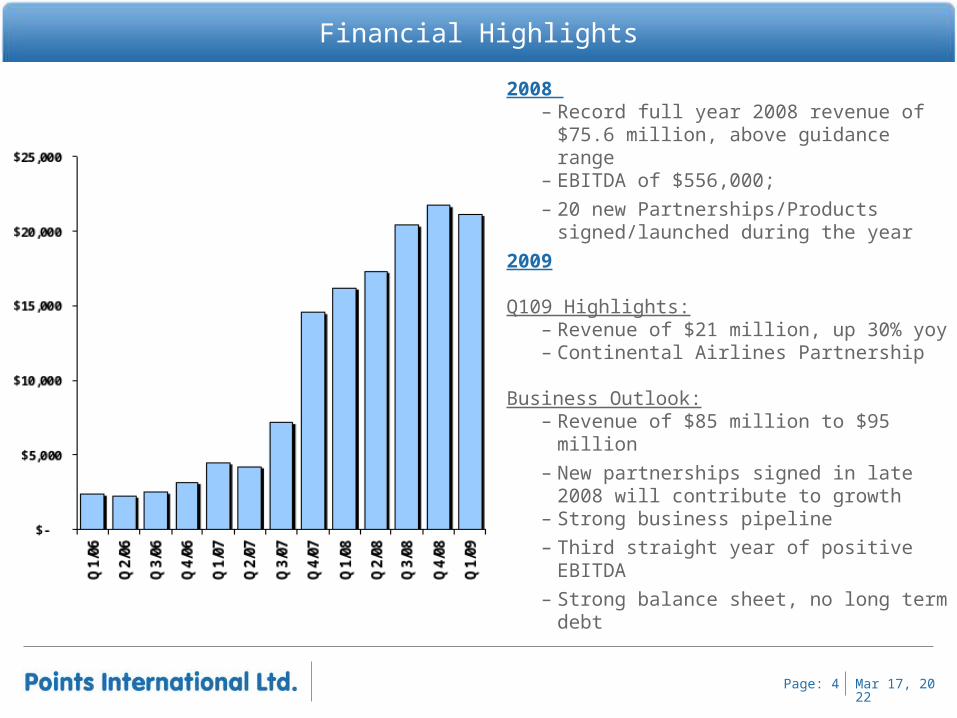
2008 – Record full year 2008 revenue of $75.6
million, above guidance range– EBITDA of $556,000;
– 20 new Partnerships/Products signed/launched during the year
2009
Q109 Highlights:– Revenue of $21 million, up 30% yoy– Continental Airlines Partnership
Business Outlook:– Revenue of $85 million to $95 million
– New partnerships signed in late 2008 will contribute to growth
– Strong business pipeline
– Third straight year of positive EBITDA
– Strong balance sheet, no long term debt
Apr 19, 2023Page: 5
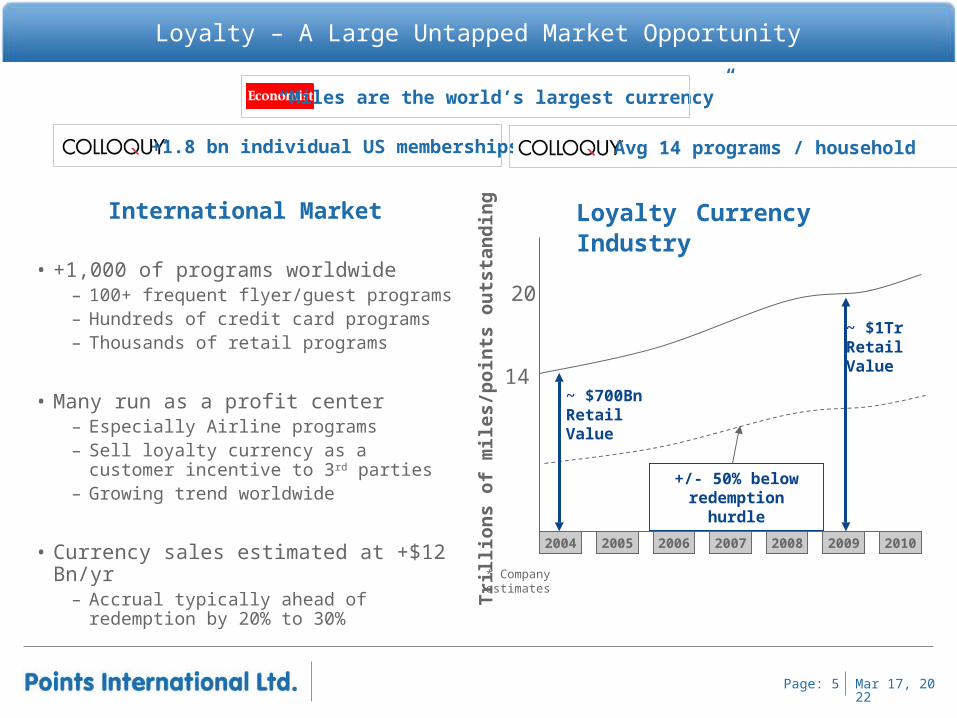
International Market
• +1,000 of programs worldwide– 100+ frequent flyer/guest programs– Hundreds of credit card programs– Thousands of retail programs
• Many run as a profit center– Especially Airline programs– Sell loyalty currency as a customer
incentive to 3rd parties– Growing trend worldwide
• Currency sales estimated at +$12 Bn/yr – Accrual typically ahead of redemption by
20% to 30%
Loyalty – A Large Untapped Market Opportunity
“Miles are the world’s largest currency”
+1.8 bn individual US memberships Avg 14 programs / household
Tri
llio
ns
of
mil
es/p
oin
ts o
uts
tan
din
g
2004 20062005 2007 20092008 2010
14
20
* Company estimates
~ $700BnRetail Value
~ $1TrRetail Value
+/- 50% below redemption hurdle
Loyalty Currency Industry
Apr 19, 2023Page: 6
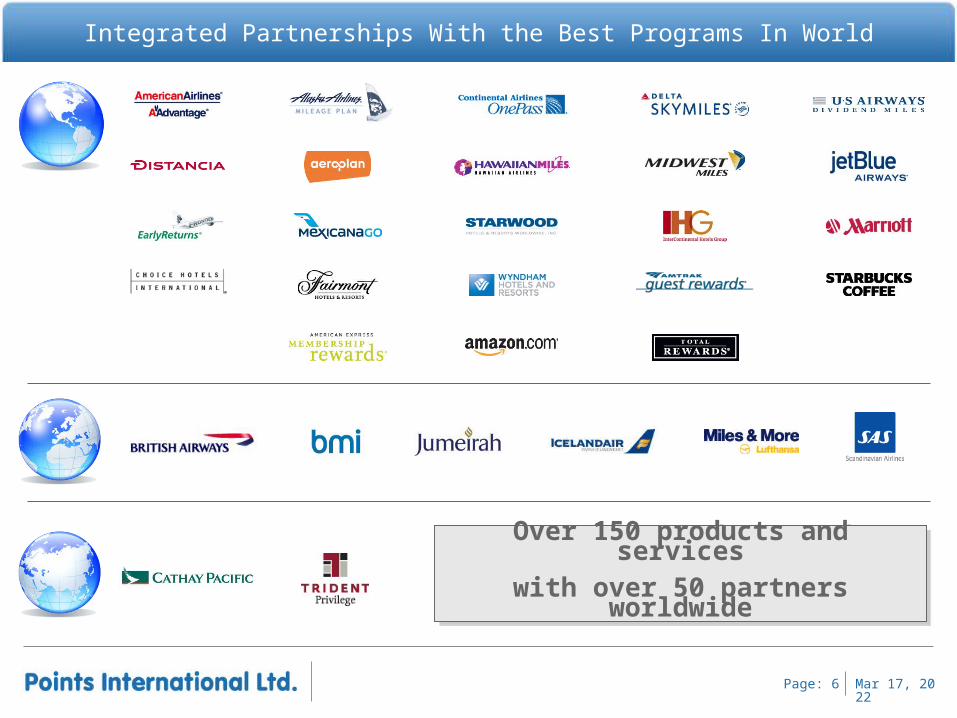
Integrated Partnerships With the Best Programs In World
Over 150 products and serviceswith over 50 partners worldwide
Over 150 products and serviceswith over 50 partners worldwide
E-Commerce Services
Core Business Driver
Global Footprint
Agency or Principal Models
Profitable Today
Apr 19, 2023Page: 8
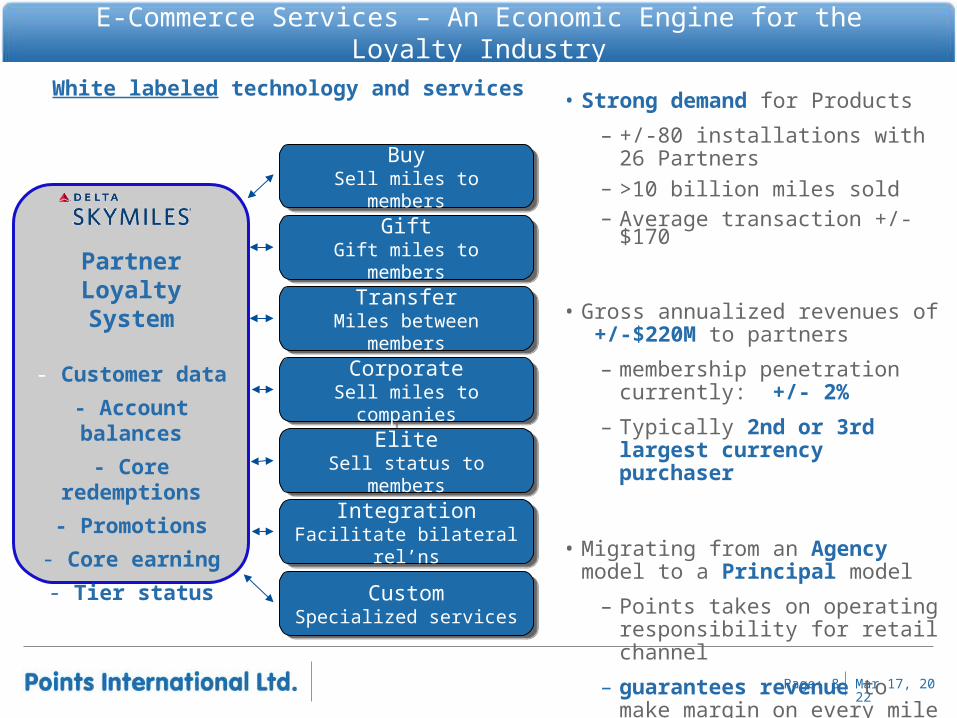
E-Commerce Services – An Economic Engine for the Loyalty Industry
White labeled technology and services • Strong demand for Products
– +/-80 installations with 26 Partners – >10 billion miles sold– Average transaction +/- $170
• Gross annualized revenues of +/-$220M to partners
– membership penetration currently: +/- 2%
– Typically 2nd or 3rd largest currency purchaser
• Migrating from an Agency model to a Principal model
– Points takes on operating responsibility for retail channel
– guarantees revenue to make margin on every mile sold
BuySell miles to
members
BuySell miles to
members
GiftGift miles to
members
GiftGift miles to
members
TransferMiles between
members
TransferMiles between
members
CorporateSell miles to companies
CorporateSell miles to companies
IntegrationFacilitate bilateral
rel’ns
IntegrationFacilitate bilateral
rel’ns
EliteSell status to
members
EliteSell status to
members
CustomSpecialized services
CustomSpecialized services
Partner Loyalty System
- Customer data
- Account balances
- Core redemptions
- Promotions
- Core earning
- Tier status
Apr 19, 2023Page: 9
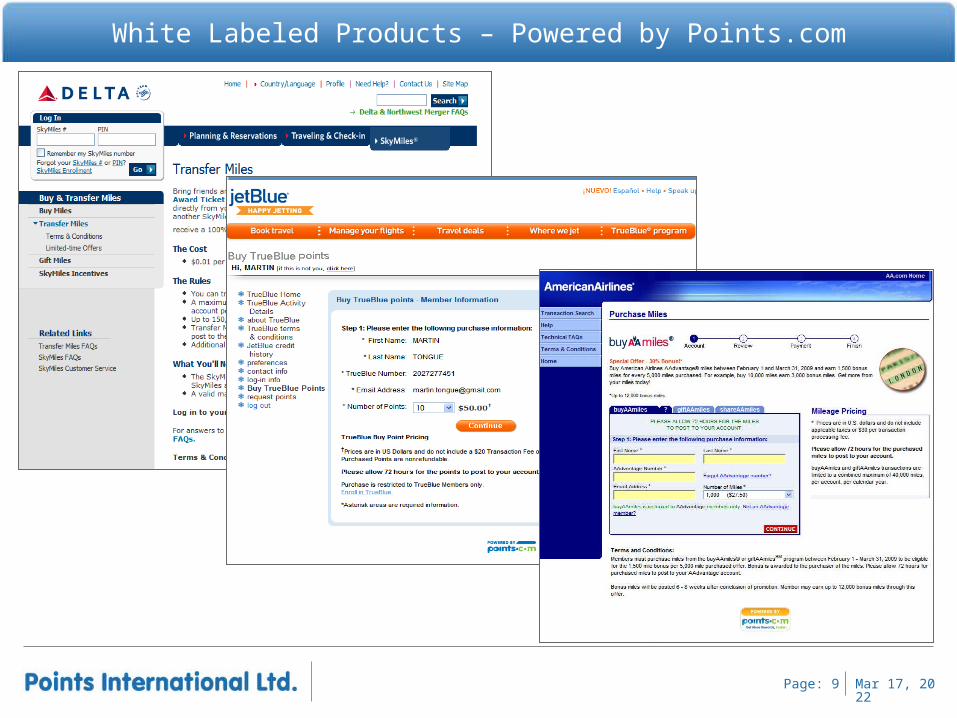
White Labeled Products – Powered by Points.com
Apr 19, 2023Page: 10
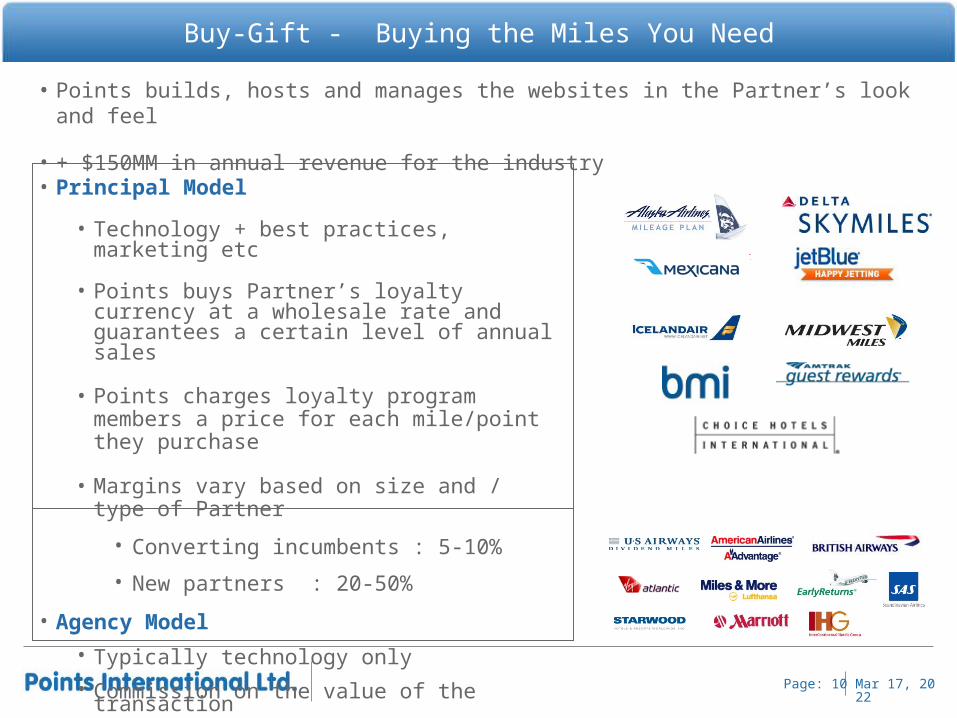
Buy-Gift - Buying the Miles You Need
•
• Principal Model
• Technology + best practices, marketing etc
• Points buys Partner’s loyalty currency at a wholesale rate and guarantees a certain level of annual sales
• Points charges loyalty program members a price for each mile/point they purchase
• Margins vary based on size and / type of Partner
• Converting incumbents : 5-10%
• New partners : 20-50%
• Agency Model
• Typically technology only
• Commission on the value of the transaction
• Margin typically in the 5-15% range
• Points builds, hosts and manages the websites in the Partner’s look and feel
• + $150MM in annual revenue for the industry
Apr 19, 2023Page: 11
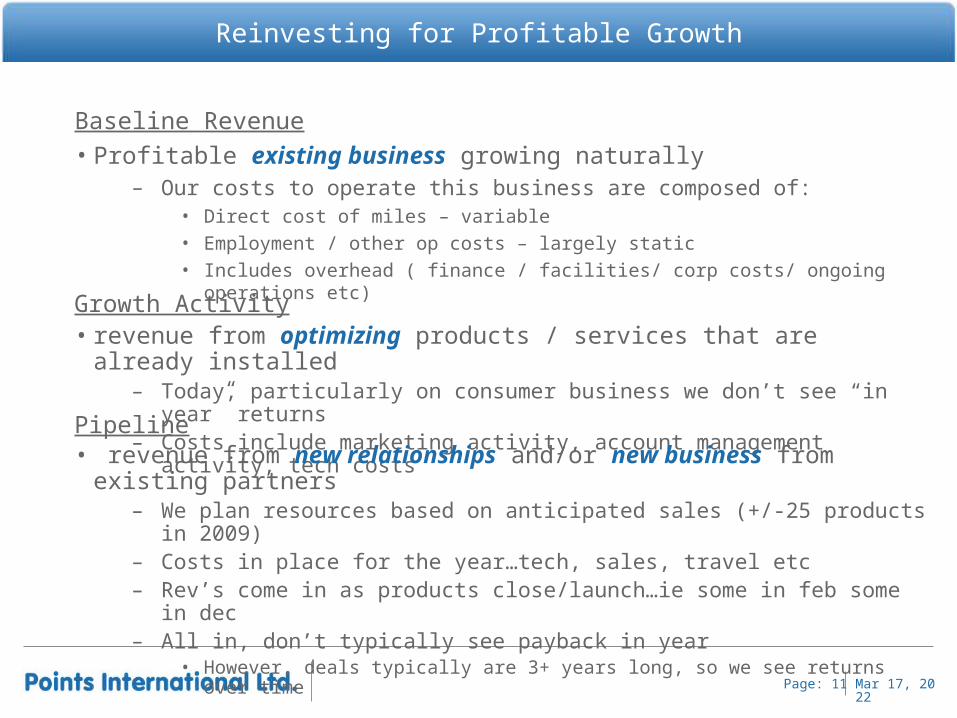
Reinvesting for Profitable Growth
Baseline Revenue
• Profitable existing business growing naturally– Our costs to operate this business are composed of:
• Direct cost of miles – variable
• Employment / other op costs – largely static
• Includes overhead ( finance / facilities/ corp costs/ ongoing operations etc)
Growth Activity • revenue from optimizing products / services that are already installed
– Today, particularly on consumer business we don’t see “in year” returns – Costs include marketing activity, account management activity, tech costs
Pipeline• revenue from new relationships and/or new business from existing partners
– We plan resources based on anticipated sales (+/-25 products in 2009)– Costs in place for the year…tech, sales, travel etc– Rev’s come in as products close/launch…ie some in feb some in dec– All in, don’t typically see payback in year
• However, deals typically are 3+ years long, so we see returns over time
Apr 19, 2023Page: 12
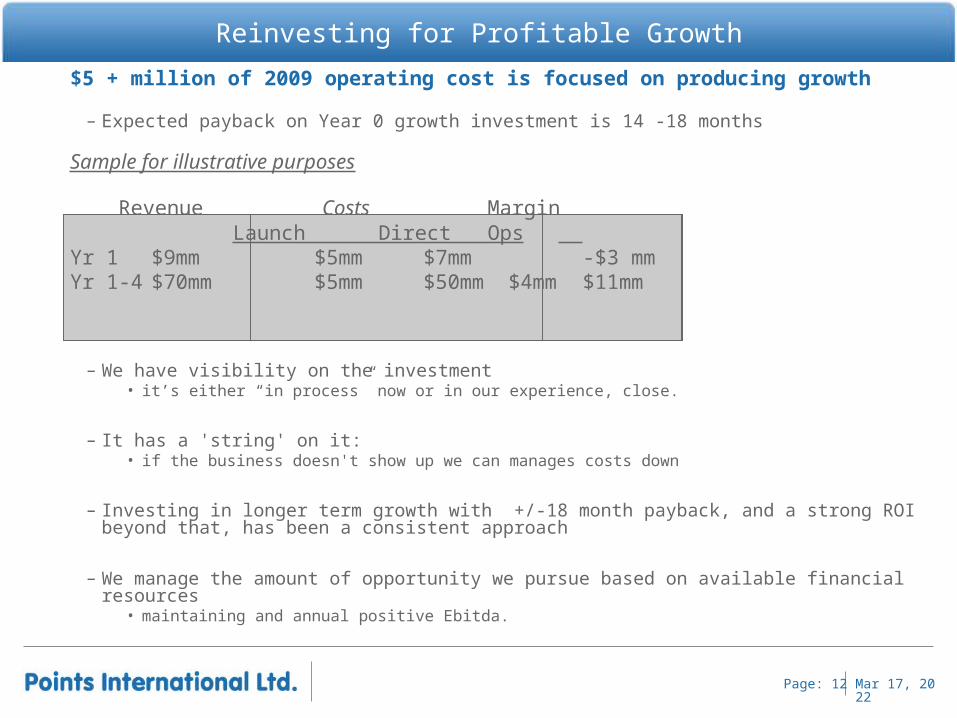
$5 + million of 2009 operating cost is focused on producing growth
– Expected payback on Year 0 growth investment is 14 -18 months
Sample for illustrative purposes
Revenue Costs MarginLaunch Direct Ops
Yr 1 $9mm $5mm $7mm -$3 mmYr 1-4 $70mm $5mm $50mm $4mm $11mm
– We have visibility on the investment • it’s either “in process” now or in our experience, close.
– It has a 'string' on it:• if the business doesn't show up we can manages costs down
– Investing in longer term growth with +/-18 month payback, and a strong ROI beyond that, has been a consistent approach
– We manage the amount of opportunity we pursue based on available financial resources• maintaining and annual positive Ebitda.
Reinvesting for Profitable Growth
Apr 19, 2023Page: 13
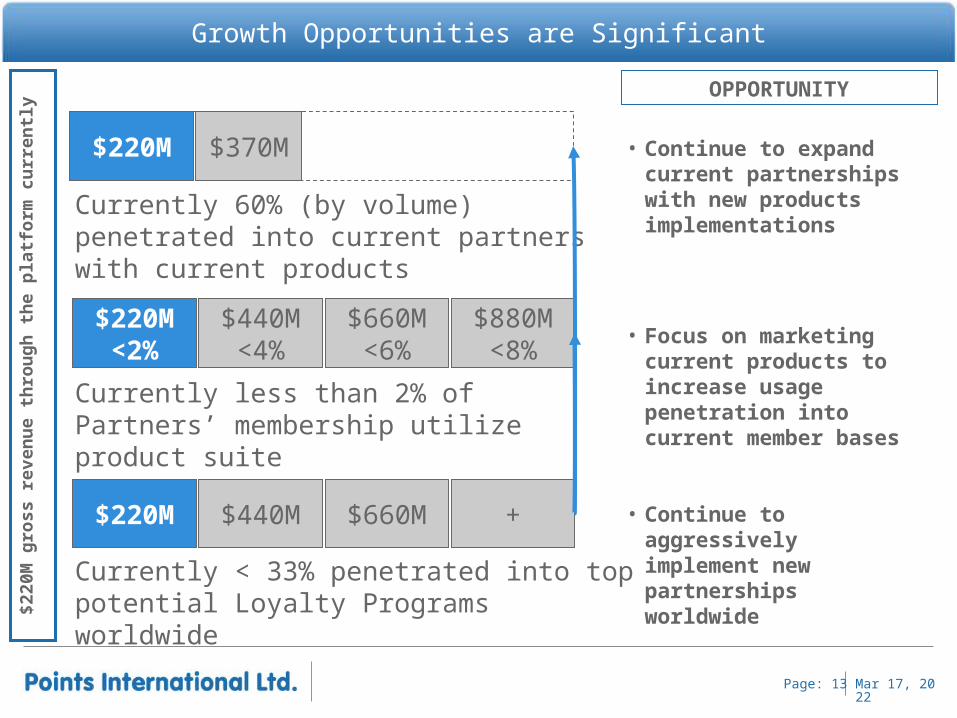
Growth Opportunities are Significant$2
20M
gro
ss r
even
ue
thro
ug
h t
he
pla
tfo
rm c
urr
entl
y
$370M$220M
Currently 60% (by volume) penetrated into current partners with current products
OPPORTUNITY
• Continue to expand current partnerships with new products implementations
$220M<2%
$440M<4%
$660M<6%
$880M<8%
Currently less than 2% of Partners’ membership utilize product suite
• Focus on marketing current products to increase usage penetration into current member bases
$220M $440M $660M +
Currently < 33% penetrated into top potential Loyalty Programs worldwide
• Continue to aggressively implement new partnerships worldwide
Points.com Consumer Services
Core Strategic Driver
Unique Transactions
High Value User Base
Apr 19, 2023Page: 15
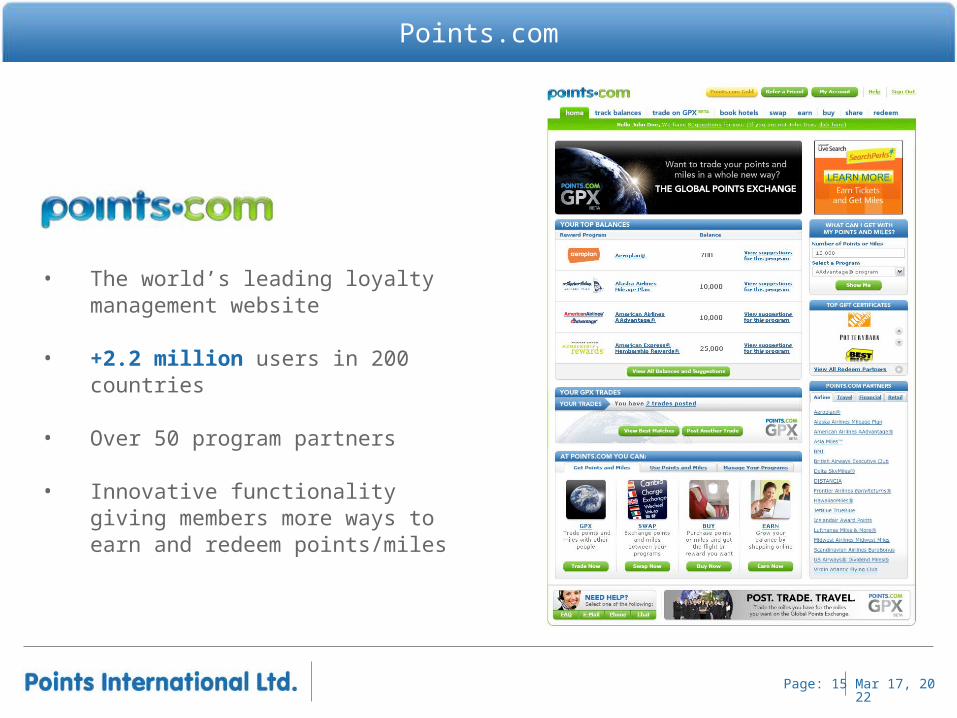
Points.com
• The world’s leading loyalty management website
• +2.2 million users in 200 countries
• Over 50 program partners
• Innovative functionality giving members more ways to earn and redeem points/miles
Apr 19, 2023Page: 16
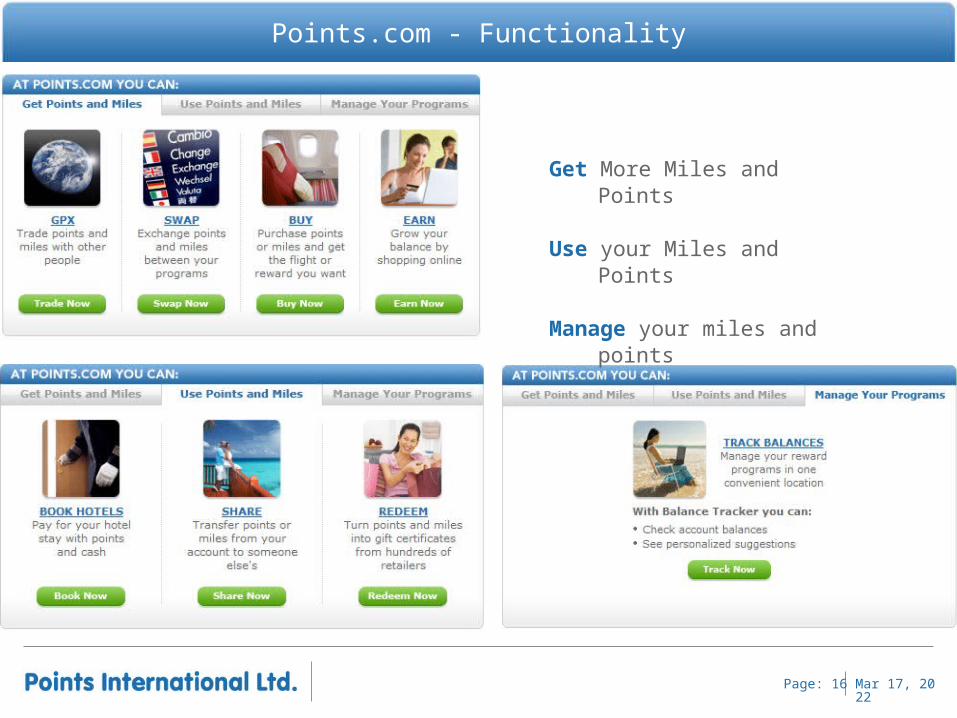
Points.com - Functionality
Get More Miles and Points
Use your Miles and Points
Manage your miles and points
Apr 19, 2023Page: 17
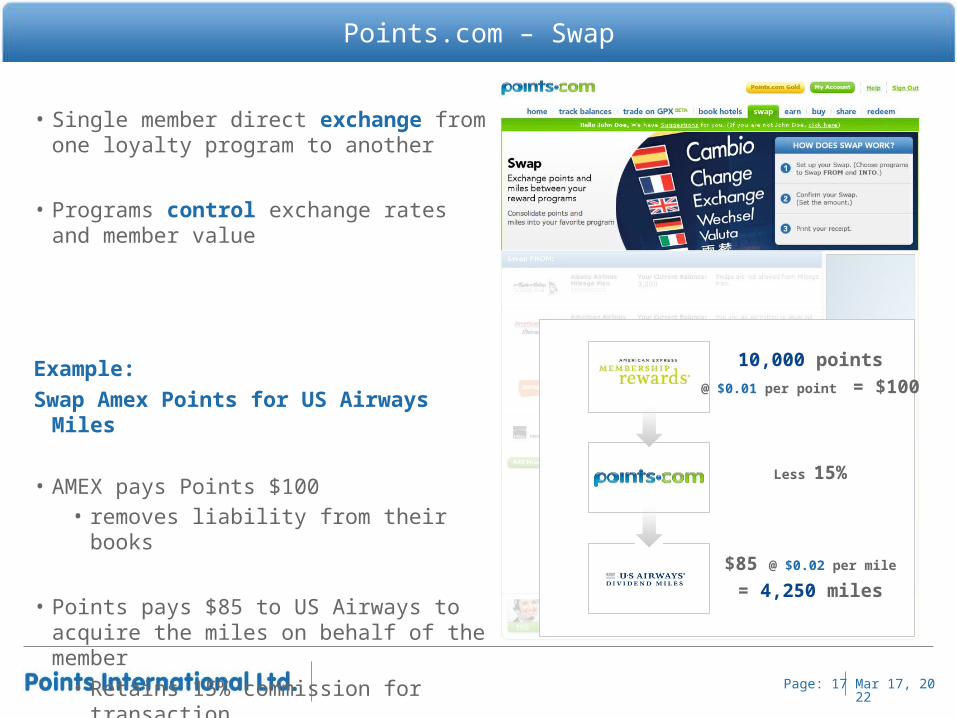
Points.com – Swap
• Single member direct exchange from one loyalty program to another
• Programs control exchange rates and member value
Example:
Swap Amex Points for US Airways Miles
• AMEX pays Points $100 • removes liability from their books
• Points pays $85 to US Airways to acquire the miles on behalf of the member• Retains 15% commission for transaction
10,000 points
@ $0.01 per point = $100
Less 15%
$85 @ $0.02 per mile
= 4,250 miles
Apr 19, 2023Page: 18
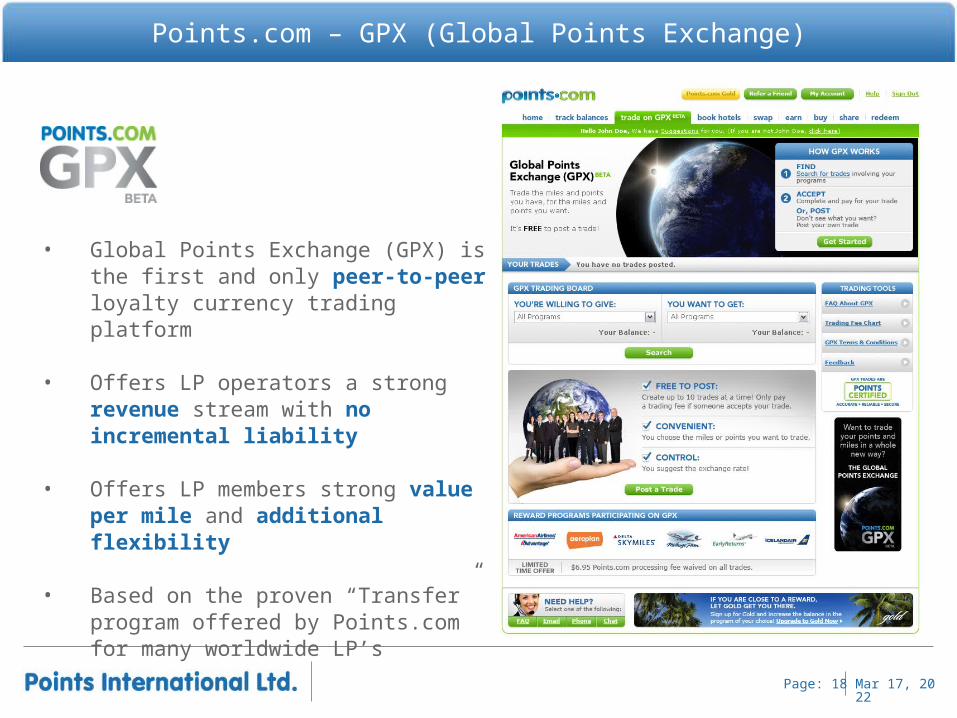
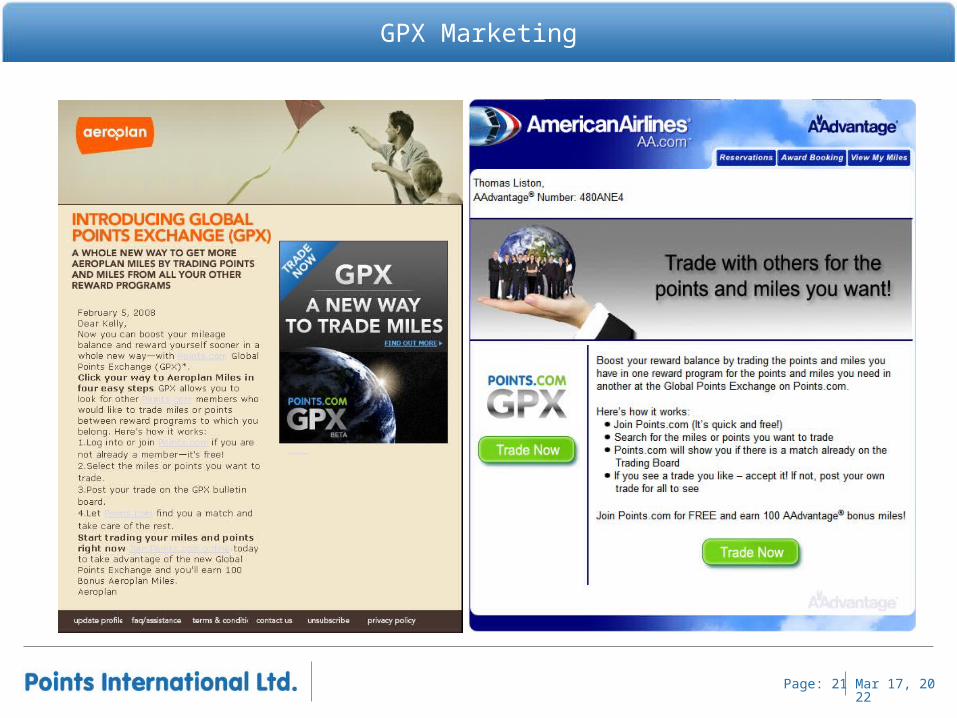
Points.com – GPX (Global Points Exchange)
• Global Points Exchange (GPX) is the first and only peer-to-peer loyalty currency trading platform
• Offers LP operators a strong revenue stream with no incremental liability
• Offers LP members strong value per mile and additional flexibility
• Based on the proven “Transfer” program offered by Points.com for many worldwide LP’s
Apr 19, 2023Page: 19
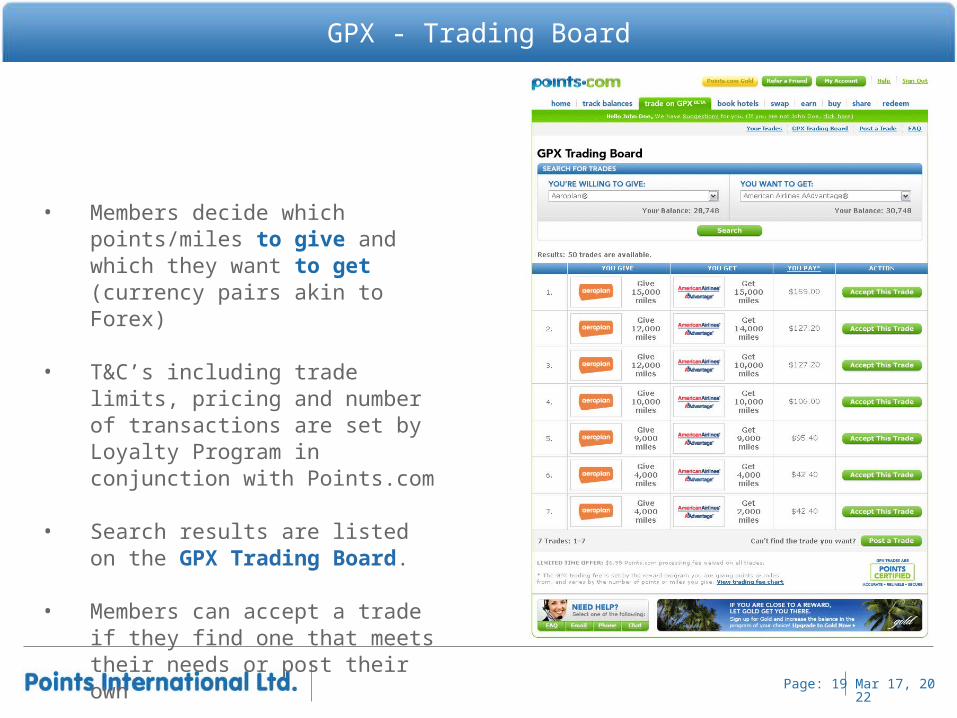
GPX - Trading Board
• Members decide which points/miles to give and which they want to get (currency pairs akin to Forex)
• T&C’s including trade limits, pricing and number of transactions are set by Loyalty Program in conjunction with Points.com
• Search results are listed on the GPX Trading Board.
• Members can accept a trade if they find one that meets their needs or post their own
Apr 19, 2023Page: 20
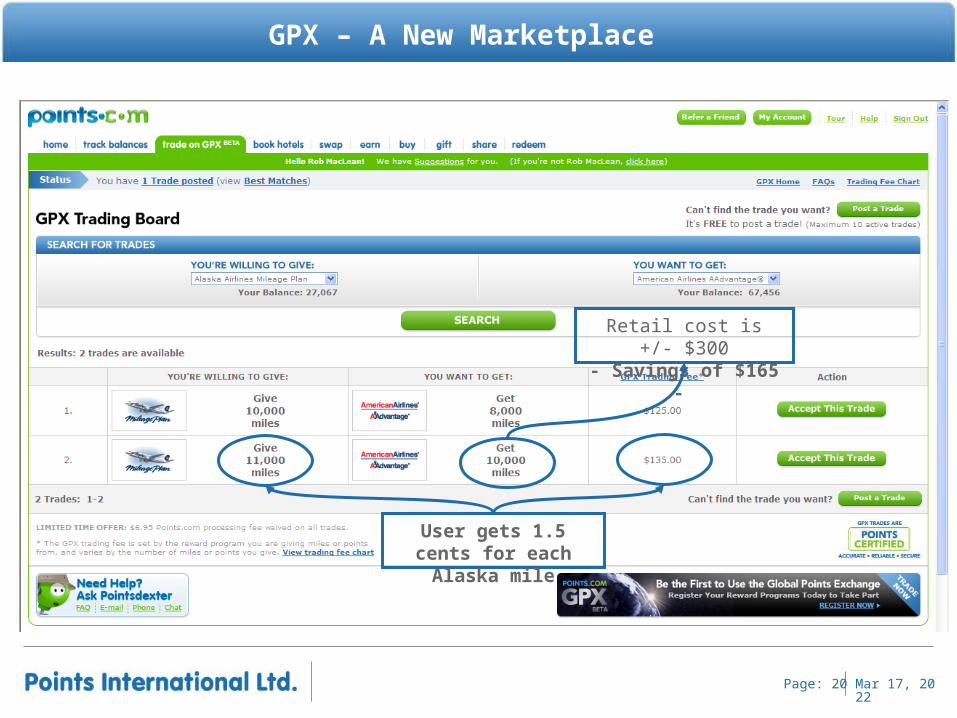
GPX – A New Marketplace
Retail cost is +/- $300- Savings of $165 -
User gets 1.5 cents for each Alaska mile
Apr 19, 2023Page: 21
GPX Marketing
Apr 19, 2023Page: 22
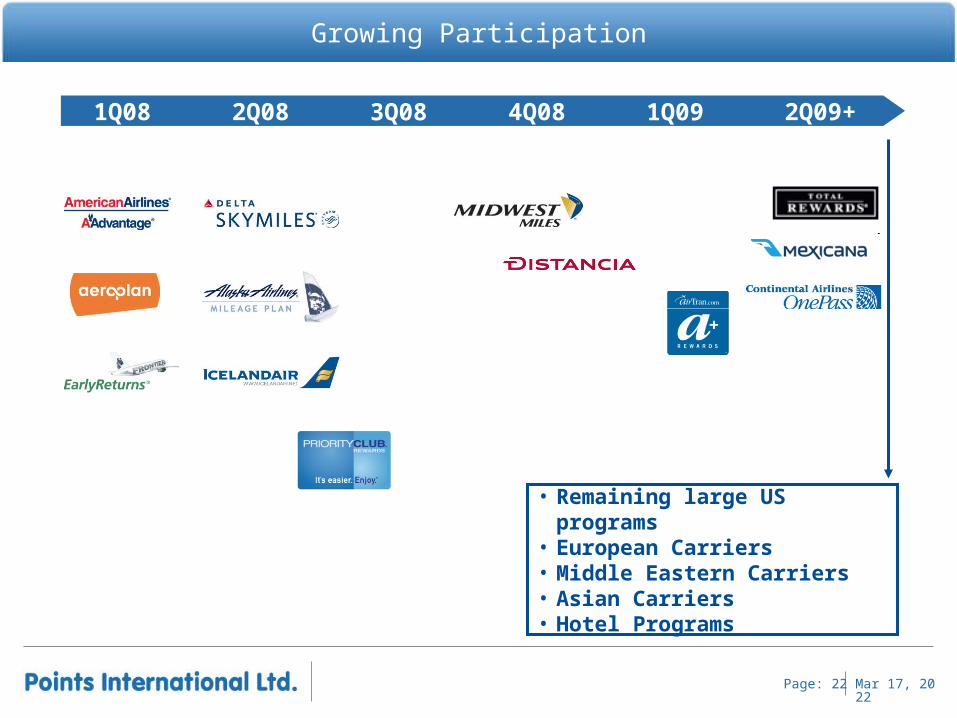
Growing Participation
1Q08 4Q08 1Q092Q08 3Q08 2Q09+
• Remaining large US programs• European Carriers• Middle Eastern Carriers• Asian Carriers• Hotel Programs
Apr 19, 2023Page: 23
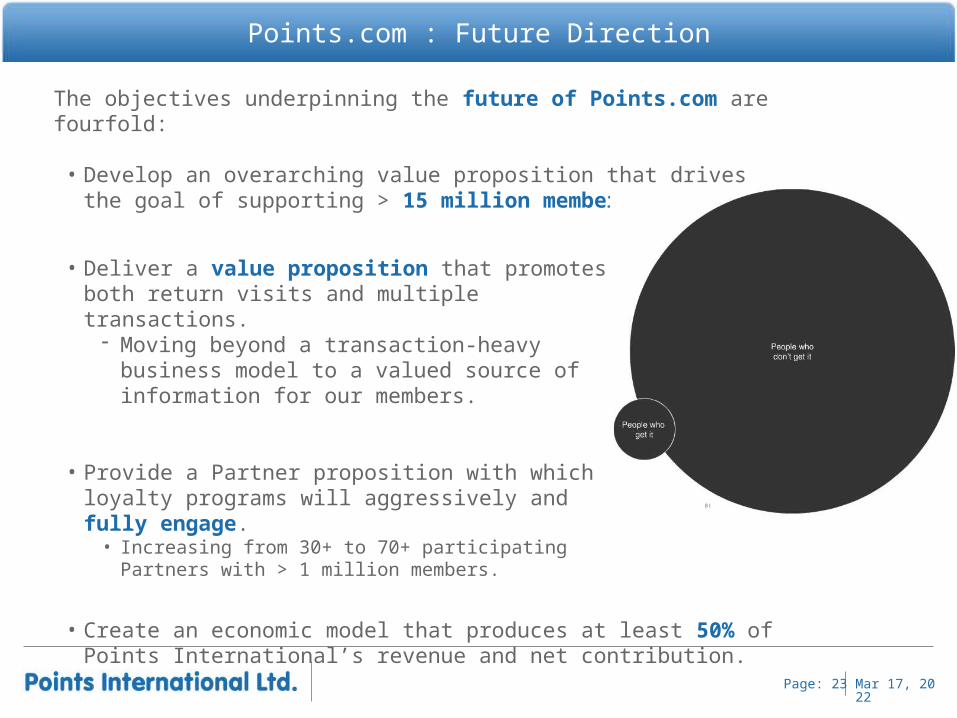
Points.com : Future Direction
The objectives underpinning the future of Points.com are fourfold:
• Develop an overarching value proposition that drives the goal of supporting > 15 million members
• Create an economic model that produces at least 50% of Points International’s revenue and net contribution.
• Deliver a value proposition that promotes both return visits and multiple transactions.
Moving beyond a transaction-heavy business model to a valued source of information for our members.
• Provide a Partner proposition with which loyalty programs will aggressively and fully engage.
• Increasing from 30+ to 70+ participating Partners with > 1 million members.
Apr 19, 2023Page: 24
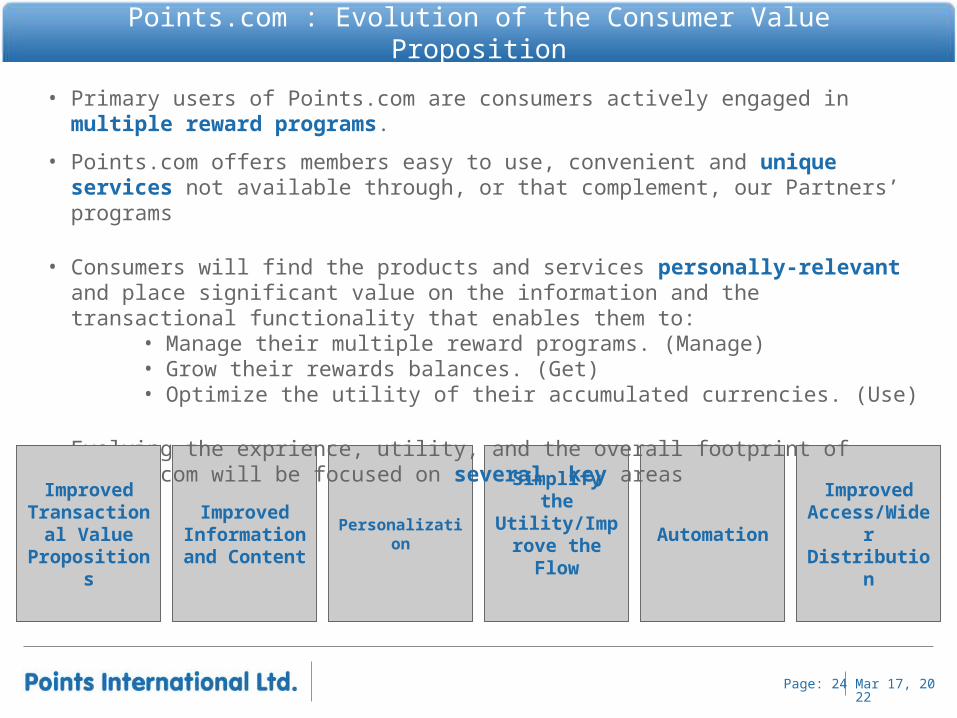
Improved Information and Content
Personalization
Simplify the Utility/Improv
e the FlowAutomation
Improved Access/Wider Distribution
Points.com : Evolution of the Consumer Value Proposition
• Primary users of Points.com are consumers actively engaged in multiple reward programs.
• Points.com offers members easy to use, convenient and unique services not available through, or that complement, our Partners’ programs
• Consumers will find the products and services personally-relevant and place significant value on the information and the transactional functionality that enables them to:
• Manage their multiple reward programs. (Manage)• Grow their rewards balances. (Get)• Optimize the utility of their accumulated currencies. (Use)
• Evolving the exprience, utility, and the overall footprint of points.com will be focused on several key areas
Improved Transactional
Value Propositions
Apr 19, 2023Page: 25
2009 Business Outlook: Growing Against the Current
2009 revenue expected to grow to range of $85 million to $95 million
Third straight year of positive EBITDA
– Aggressive growth focused investment strategy continuing • strong business pipeline will continue track record of new business success
• 2008 Successes are contributing to growth in 2009
– Successful expansion of our Principal model showing strength in a dismal economy
• Metrics improving through rest of the year
– Aggressive Consumer development underway • Driving to goal of +15 million users
• Product Development is a priority