an exploration of destination brand love among theme-park
TRANSCRIPT
An Exploration of Destination Brand Love among Theme-Park Based Tourists and
Excursionists
by Kai Jiang
A thesis exhibition
presented to the University of Waterloo
in fulfilment of the
thesis requirement for the degree of
Doctor of Philosophy
in
Recreation and Leisure Studies
Waterloo, Ontario, Canada, 2019
© Kai Jiang 2019

ii
Examining Committee Membership
The following served on the Examining Committee for this thesis. The decision of the
Examining Committee is by majority vote.
External Examiner James Petrick
Professor
Department of Recreation, Park and Tourism
Sciences
Texas A&M University
Supervisors Mark Havitz
Professor
Department of Recreation & Leisure Studies
University of Waterloo
Luke R. Potwarka Associate Professor
Department of Recreation & Leisure Studies
University of Waterloo
Internal Member Ron McCarville
Professor
Department of Recreation & Leisure Studies
University of Waterloo
Maria Banyai Professor
School of Hospitality & Tourism Management
George Brown College
Internal-external Member Harvir Bansal
Associate Professor
Conrad School of Entrepreneurship and
Business
University of Waterloo

iii
Author’s Declaration
I hereby declare that I am the sole author of this thesis. This is a true copy of the thesis, including
any required final revisions, as accepted by my examiners.
I understand that my thesis may be made electronically available to the public.

iv
Abstract
“Love” towards a brand functions as one critical component of customer brand
relationships (CBRs) (Fetscherin & Heinrich, 2015; Fournier, 1998). Brand love is an under-
researched but increasingly important marketing construct that includes both cognitive and
emotional dimensions (Albert & Merunka, 2013; Albert, Merunka, & Valette-Florence, 2008a;
Albert, Merunka, & Valette-Florence, 2008b; Fournier, 1998). Destination brand love is a type of
emotional place attachment that has not received enough scholarly attention (Aro, Suomi, &
Saraniemi, 2018). The very few qualitative and exploratory studies on destination brand love call
for quantitate investigations to establish its measurement items, reliability, and validity. Aro et
al. (2018, p. 80), for instance, emphasized that “once destination brand love has been sufficiently
explored qualitatively, further studies could develop quantitative measures.” The current study
built on the academic literature on brand love and established the multi-dimensional and multi-
indicator destination brand love construct. I defined destination brand love as the degree of
intense affection a tourist holds for a branded destination. In this study, destination brand love
features a six-dimensional structure comprising self-brand integration, passion-driven
behaviours, positive emotional connection, long-term relationship, attitude strength, and attitude
valence (Batra, Ahuvia, & Bagozzi, 2012). Destination brand love stands out as a highly
inclusive marketing construct because of its more abundant variety of sub-dimensions,
antecedents, and outcomes.
Consumers begin to interact with brands in their pre-patronage stage. In the case of
theme-park based tourism, visitors’ pre-existing awareness, trust, and beliefs of a branded
destination impact their overall emotional responses towards the destination. During travel
experiences, evaluation of experiential attributes, such as shopping, activities and events,

v
accessibility, attractions, environment, and dining, serves as a key catalyst to spark destination
brand love. As a type of desirable CBR, brand loyalty requires close emotional bonds between
consumers and brands and therefore is a potential outcome of destination brand love. Visitors’
actual on-site experiences at branded destinations may enhance their loyalty towards
destinations. So far, few attempts have addressed the significance of destination brand love in
constituting cognitive, attitudinal, and conative loyalty.
Previous research on the outcomes of brand love have focused heavily on the “brand love
leads to loyalty” paradigm, while neglecting brand love’s non-business consequences. Part of the
reason may be that earlier brand love studies are mostly from a business management
perspective. Indeed, it is highly probable that tourists and excursionists experience “non-
business” outcomes of destination brand love, such as enhanced individual well-being, improved
quality of life, and more intimate family relationships. As mentioned by McCabe and Johnson
(2013), the association between tourism experiences, individual happiness, and family cohesion
represents a relatively new line of research in the tourism discipline. However, there has been a
dearth of exploration on destination brand love’s influences on individual happiness and family
relationships.
Very few systematic theoretical frameworks of destination brand love have been
published to explain destination brand love’s brand-related and experience-related antecedents
and outcomes at the individual (happiness-related), familial (family-cohesion-related), and
business (loyalty-related) levels. To address this void, the researcher developed the multi-
dimensional and multi-indicator conceptual framework of antecedents and consequences of
destination brand love in a theme-park tourism context. Three key factors precede destination
brand love include brand awareness, brand trust, and evaluation of experiential attributes.

vi
Destination brand loyalty (including cognitive, attitudinal, and conative), individual perceived
happiness, and family togetherness are endogenous constructs. The overall purpose of this
dissertation is to explore brand awareness, brand trust, and evaluation of experiential attributes as
three antecedents of destination brand love, as well as the role of destination brand love in
predicting consumer responses to theme park-based visitation experiences (i.e., individual
perceived happiness, family togetherness) and business-related outcomes (i.e., cognitive,
attitudinal, and conative brand loyalty).
The researcher collected survey data from Shanghai Disneytown through on-site
convenience sampling in January 2017. A total of 427 respondents visited Shanghai Disneyland
with their families. The researcher used their responses in the Partial Least Square Structural
Equation Modelling (PLS-SEM) analysis in SmartPLS M 3.0. A set of destination brand love
scales were finally established through multiple methods, that is, Cronbach’s alpha reliability
coefficients, factor loading, exploratory factor analysis, and confirmatory factor analysis. PLS-
SEM results supported 15 out of 20 hypotheses put forward. Brand awareness did not exert any
meaningful and significant influence on destination brand love (β=-0.076, p>.05, t=1.872;
S.E=0.041). The direct effect of brand trust on destination brand love was statistically significant
at 99.9% confidence interval level (β= 0.229, p<.001, t=5.233; S.E=0.044). Evaluation of
experiential attributes generated a positive effect on destination brand love (β=0.710, p<.001,
t=18.225; S.E=0.039). More importantly, destination brand love exerted positive effects on
perceptions of family togetherness (β=0.613, p<0.001, t=17.756, S.E=0.035), perceived
happiness of visitors (β=0.566, p<0.001, t=11.192, S.E=0.051), and all four sequential stages of
destination brand loyalty, namely: cognitive brand loyalty (β=0.622, p<0.001, t=11.800,
S.E=0.053), attitudinal brand loyalty (β=0.791, p<0.001, t=16.913, S.E=0.047), and conative

vii
brand loyalty (β=0.782, p<0.001, t=16.225, S.E=0.048). The more visitors perceive destination
brand love, the more individual happiness, family cohesion, and brand loyalty they express.
Furthermore, the development of destination brand loyalty followed sequential stages. As
predicted, cognitive loyalty affected attitudinal loyalty in a positive and significant way
(β=0.434, p<0.001, t= 8.058, S.E= 0.054). Furthermore, attitudinal loyalty impacted conative
loyalty significantly (β=0.569, p<0.001, t= 10.249, S.E= 0.056).
The researcher also carried out a series of mediating and moderation tests using the
bootstrapping procedure and the moderation analysis techniques in SmartPLS M 3.0.
Bootstrapping outputs indicated that destination brand love functioned as a statistically
significant mediating construct in the conceptual framework. The mediation effect of destination
brand love in the evaluation of experiential attributes → attitudinal loyalty relationship turned
out to be positive and statistically significant (β =0.562, p< 0.001, CI=0.562-0.559). Similarly,
the mediation effect of destination brand love in the evaluation of experiential attributes →
conative loyalty relationship was also positive and statistically significant (β=0.555, p< 0.001,
CI=0.555-0.557). Regarding moderation effects, the researcher examined “income” and “first-
timers versus repeat visitors” as two categorical moderators. Bootstrapping results demonstrated
that the influence of evaluation of experiential attributes on conative loyalty was stronger among
repeat visitors compared with first-timers. The boosting effect of destination brand love on
family togetherness was greater for low-income visitors than for their high-income counterparts.
In other words, higher income levels entail a weaker relationship between visitors’ destination
brand love and family togetherness, while lower levels of income lead to a stronger relationship
between visitors’ destination brand love and family togetherness.

viii
This research addresses a significant gap in the literature by validating the construct of
destination brand love and establishing the multi-dimensional and multi-indicator conceptual
framework. It initiated destination brand love research in the seldom-studied non-Western
branded destination context. The establishment of the conceptual framework of antecedents and
consequences of destination brand love demonstrates the importance of understanding 1) brand-
related, experience-related precursors related to destination brand love; 2) cognitive, attitudinal
(including emotional), and conative consequences of destination brand love; and 3) well-being
related and family-related outcomes of destination brand love. The findings have implications for
academics, destination management organizations, and other destination stakeholders who wish
to improve their understanding of the influences of destination brand love in theme-park based
tourism.

ix
Acknowledgments
Embarking on a Ph.D. is akin to exploring on an endless sea that no one has been to. The
explorer pushes the limits of the known world, aiming at establishing new knowledge domains.
Sometimes the explorer is amazed by the astonishing view at sea, the stunning sunset, the
beautiful clouds, the rainstorm, and lightning. There are also times when he or she is puzzled,
feeling alone and helpless. However, it is through hard times, endless trying and deep thinking
that the explorer grows and matures. Gradually, the Ph.D. process allows the explorer to get
more self-awareness and self-understanding. Sitting alone in the favourite corner of an office
thinking about a cutting-edge research question strengthens the thinking capacity while giving
him or her more self-confidence and endurance. The Ph.D. experience itself is a great gift.
I am like the explorer. The four years is full of challenges, hard-working, and
enhancements. When I look back, I am very thankful for this valuable experience, and I have too
many people to thank. Special thanks go to my co-supervisors Dr. Mark Havitz and Dr. Luke
Potwarka. They both are great researchers that are highly respected in the scholarly world. Mark
is always warm, open-minded, kind, and conscientious about research and work. Luke is such as
multi-task taker. He is easygoing and passionate about research. I hope I could have more
opportunities in the future to cooperate with both of them. I passed the comprehensive exam in
January 2016, defended my Ph.D. dissertation proposal six months later in July 2016, and
cleared research ethics in November 2016. Mark and Luke helped me reach each milestone on
time.
Sincere thanks go to all my Ph.D. dissertation committee members: Dr. Mark Havitz, Dr.
Luke Potwarka, Dr. James Petrick, Dr. Ron McCarville, and Dr. Maria Banyai. I want to thank
x
the time and effort that you have put in reading and evaluating my dissertation. I appreciate all of
you for recognizing my efforts and raising very constructive comments and suggestions!
I want to express heartfelt thanks to my families. They all have been supporting me,
giving me warmth, sunshine, and love that nothing else can compare. They always have
confidence in me, encouraging me to live the life that I want and believing that I can realize my
dreams. My daughter is my sunshine. She has brought so many happy moments to me.
I also want to extend my thanks to my long-time friends and my co-authors in the
Department of Recreation and Leisure Studies (RLS) and other universities, institutions, and
companies around the world. A warm thank you also goes to the Ontario Trillium Scholarship.

xi
Dedication
This dissertation is dedicated to my parents, my husband, and my daughter, who support
me unconditionally anytime, anywhere.
xii
Table of Contents
Examining Committee Membership ............................................................................................... ii
Author’s Declaration ...................................................................................................................... iii
Abstract .......................................................................................................................................... iv
Acknowledgments.......................................................................................................................... ix
Dedication ...................................................................................................................................... xi
Table of Contents .......................................................................................................................... xii
List of Tables ............................................................................................................................. xviii
List of Figures .............................................................................................................................. xix
Chapter One: Introduction .............................................................................................................. 1
1.1 Theoretical Perspective: The Customer-Based Brand Equity Model ................................... 6
1.2 Research Objectives .............................................................................................................. 8
1.3 Conceptual Framework ......................................................................................................... 9
1.4 Theoretical and Practical Contributions .............................................................................. 13
Chapter Two: Literature Review .................................................................................................. 15
2.1 Brand Love’s Social Psychological Foundations ................................................................ 15
2.1.1 Sternberg’s (1986) triangular theory of love and its applications. ............................... 15
2.1.2 Self-inclusion theory and brand love. ........................................................................... 17
2.2 Similarities and Differences between Destination Brand Love and Related Marketing
Constructs .................................................................................................................................. 19
2.3 The Six Sub-dimensions of Destination Brand Love .......................................................... 22
2.3.1 Self-brand integration. .................................................................................................. 23
2.3.2 Passion-driven behaviours. ........................................................................................... 24

xiii
2.3.3 Positive emotional connection. ..................................................................................... 24
2.3.4 Long-term relationship. ................................................................................................ 24
2.3.5 Attitude strength. .......................................................................................................... 25
2.3.6 Attitude valence. ........................................................................................................... 25
2.4 Model Development: The Destination Brand Love Framework ......................................... 26
2.4.1 Antecedents of destination brand love. ......................................................................... 27
2.4.1.1 Brand awareness. ................................................................................................... 27
2.4.1.2 Brand trust. ............................................................................................................. 29
2.4.1.3 Evaluation of experiential attributes. ..................................................................... 30
2.4.2 Outcomes of destination brand love. ............................................................................ 31
2.4.2.1 Brand loyalty. ......................................................................................................... 31
2.4.2.1.1 Brand loyalty’s position in the brand experience. ........................................... 31
2.4.2.1.2 Conceptualizations and sequential stages of brand loyalty. ............................ 33
2.4.2.1.3 Loyalty stage one: cognitive loyalty ............................................................... 37
2.4.2.1.4 Loyalty stage two: attitudinal loyalty .............................................................. 38
2.4.2.1.5 Loyalty stage three: conative loyalty .............................................................. 39
2.4.2.2 Perceived happiness. .............................................................................................. 41
2.4.2.3 Family togetherness. .............................................................................................. 44
2.4.3 The mediating effects of destination brand love. .......................................................... 46
2.4.4 Moderating effects of selected demographic and trip characteristics. .......................... 49
2.4.4.1 Income. ............................................................................................................... 50
2.4.4.2 First-timers versus repeat visitors ...................................................................... 51
2.5 Tourism Destinations .......................................................................................................... 54
2.6 International Theme Parks as Destination Brands .............................................................. 56
2.6.1 A brief history of theme park development. ................................................................. 56
xiv
2.6.2 Conceptualizations and characteristics of theme parks. ............................................... 58
2.6.3 Disneyland: A strong theme park brand ....................................................................... 59
Chapter Three: Methodology ........................................................................................................ 61
3.1 Study Context: Shanghai Disney Resort. ............................................................................ 61
3.2 Data Collection Procedures ................................................................................................. 62
3.2.1 Sampling plan. .............................................................................................................. 62
3.2.2 Questionnaire structure. ................................................................................................ 65
3.3 Measures.............................................................................................................................. 66
3.4 Pilot Test ............................................................................................................................. 72
3.5 Back-translation .................................................................................................................. 74
3.6 Data Analysis Method ......................................................................................................... 75
3.6.1 PLS-SEM and Reflective Measurement Model ........................................................... 75
3.6.2 Mediation ...................................................................................................................... 81
3.7 Common Method Variance ................................................................................................. 84
Chapter Four: Results ................................................................................................................... 86
4.1 Demographic Information ................................................................................................... 86
4.2 Data Check, Missing Data Treatment, and Common Method Variance Reduction ........... 89
4.2.1. Missing data treatment................................................................................................. 89
4.2.2 Common method variance check ................................................................................. 90
4.3 Normality Test..................................................................................................................... 91
4.4 The Measurement Model .................................................................................................... 94
4.4.1 Indicator reliability. ...................................................................................................... 95
4.4.2 Internal consistency reliability...................................................................................... 98
4.4.3 Convergent validity. ..................................................................................................... 98
4.4.4 Discriminant validity. ................................................................................................... 99

xv
4.4.5 Content validity. ......................................................................................................... 107
4.4.6. Model fit indices ........................................................................................................ 107
4.5 The Structural Model ........................................................................................................ 109
4.5.1 Collinearity assessment. ............................................................................................. 110
4.5.2 Significance of path coefficients. ............................................................................... 110
4.5.2.1 The influence of brand awareness on destination brand love (H1). .................... 114
4.5.2.2 The influence of brand trust on destination brand love (H2). .............................. 114
4.5.2.3 The influence of the evaluation of experiential attributes on destination brand love
(H3a). 114
4.5.2.4 The influence of the evaluation of experiential attributes on cognitive loyalty
(H3b). 115
4.5.2.5 The influence of the evaluation of experiential attributes on attitudinal loyalty
(H3c). 116
4.5.2.6 The influence of the evaluation of experiential attributes on conative loyalty
(H3d). 116
4.5.2.8 The influence of destination brand love on cognitive loyalty (H4a). .................. 117
4.5.2.9 The influence of destination brand love on attitudinal loyalty (H4b). ................. 117
4.5.2.10 The influence of destination brand love on conative loyalty (H4c)................... 117
4.5.2.12 The influence of destination brand love on perceived happiness (H5a). ........... 118
4.5.2.13 The influence of destination brand love on family togetherness (H5b). ............ 118
4.5.2.14 The influence of cognitive loyalty on attitudinal loyalty (Hloy1). .................... 119
4.5.2.15 The influence of attitudinal loyalty on conative loyalty (Hloy2). ..................... 119
4.5.3 Coefficient of determination (R2). .............................................................................. 120
4.5.4 Effect size (f2). ............................................................................................................ 121
4.5.5 Blindfolding and predictive relevance (Q2) ................................................................ 122
4.6 A Competing Model .......................................................................................................... 123

xvi
4.7 Mediation Analysis (H6a, H6b, and H6c) ........................................................................ 132
4.8 Moderating Analysis (H7a, H7b_1, H7b_2, and H7b_3) ................................................. 135
4.8.1 The moderating effect of income. ............................................................................... 135
4.8.2 The moderating effect of first-timers versus repeat visitors. ...................................... 137
Chapter Five: Discussion and Conclusion .................................................................................. 143
5.1 Measurement items of Destination Brand Love ................................................................ 145
5.2 Drivers of Destination Brand Love ................................................................................... 145
5.2.1 Brand awareness. ........................................................................................................ 146
5.2.2. Brand trust. ................................................................................................................ 148
5.2.3. The evaluation of experiential attributes and destination brand love. ....................... 149
5.3 The Evaluation of Experiential Attributes and Destination Brand Loyalty ...................... 150
5.4 Business and Familial Outcomes of Destination Brand Love .......................................... 152
5.4.1. Destination brand love’s relative impacts on loyalty. ............................................... 152
5.4.2 Linkages between destination brand love and family togetherness. .......................... 153
5.5 Destination Brand Love as a Mediator .............................................................................. 153
5.6 Summary of the Competing Model ................................................................................... 154
5.7 Implications ....................................................................................................................... 155
5.7.1 Theoretical contributions. ........................................................................................... 155
5.7.1.1 The destination brand love framework and destination brand love scales. ......... 156
5.7.1.2 Quantitative and confirmatory destination brand love research. ......................... 156
5.7.1.3 Keller’s CBBE model in tourism research........................................................... 158
5.7.1.4 Chinese family visitors in destination branding research. ................................... 158
5.7.2 Practical implications. ................................................................................................ 159
5.7.2.1 A driver of revenue and visitor loyalty. ............................................................... 159
5.7.2.2 Visitor psychological well-being and happiness.................................................. 159

xvii
5.7.2.3 Low-income families. .......................................................................................... 160
5.7.2.4 Brand awareness’s lack of sufficiency. ................................................................ 161
5.8 Limitations ........................................................................................................................ 162
5.8.1 Partial disclosure......................................................................................................... 162
5.8.2 Feedback effects. ........................................................................................................ 162
5.8.3 Inclusive family types. ................................................................................................ 163
5.8.4 Non-response bias....................................................................................................... 164
5.8.5 Behavioural loyalty..................................................................................................... 164
5.8.5 Commitment. .............................................................................................................. 166
5.8.6 Experiential attributes ................................................................................................. 169
5.9 Future Research ................................................................................................................. 169
5.9.1 More assessment of brand awareness ......................................................................... 169
5.9.2 Other tourism or leisure contexts................................................................................ 170
5.9.3 Additional antecedents and outcomes of destining brand love. ................................. 170
5.9.4 Human-interaction-related measures. ......................................................................... 171
5.10 Conclusion ....................................................................................................................... 171
References ................................................................................................................................... 174
Appendix ..................................................................................................................................... 204
xviii
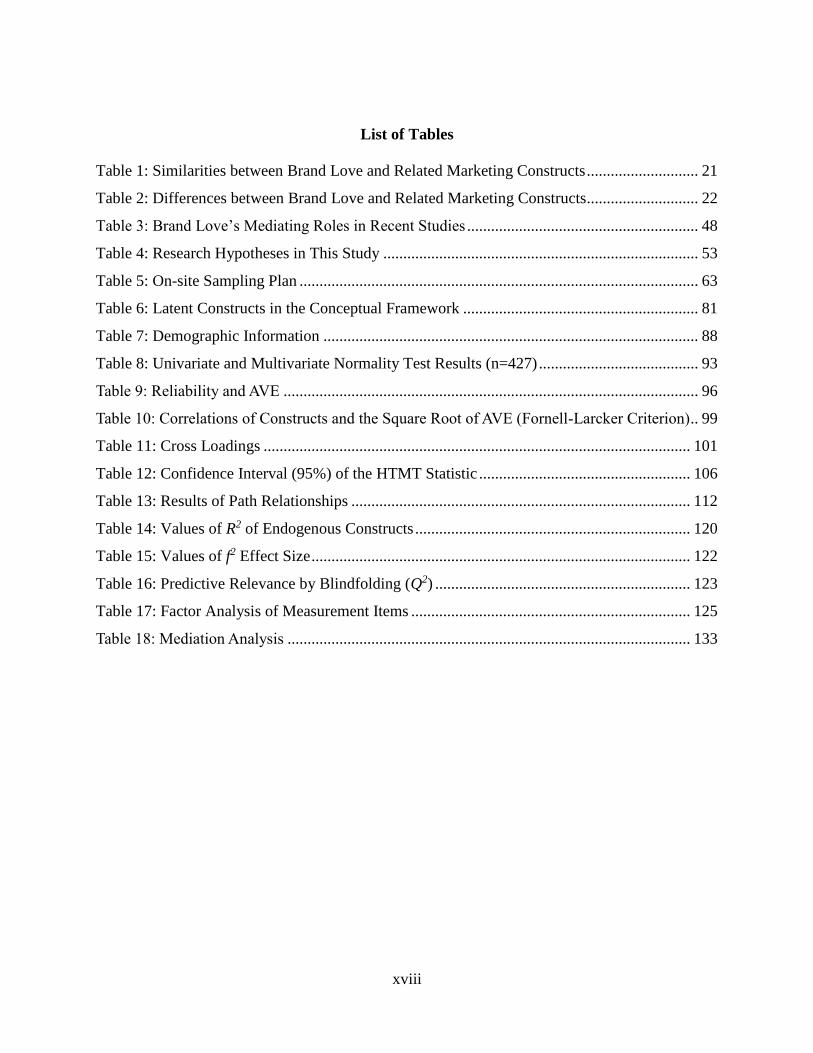
List of Tables
Table 1: Similarities between Brand Love and Related Marketing Constructs ............................ 21
Table 2: Differences between Brand Love and Related Marketing Constructs ............................ 22
Table 3: Brand Love’s Mediating Roles in Recent Studies .......................................................... 48
Table 4: Research Hypotheses in This Study ............................................................................... 53
Table 5: On-site Sampling Plan .................................................................................................... 63
Table 6: Latent Constructs in the Conceptual Framework ........................................................... 81
Table 7: Demographic Information .............................................................................................. 88
Table 8: Univariate and Multivariate Normality Test Results (n=427) ........................................ 93
Table 9: Reliability and AVE ........................................................................................................ 96
Table 10: Correlations of Constructs and the Square Root of AVE (Fornell-Larcker Criterion) .. 99
Table 11: Cross Loadings ........................................................................................................... 101
Table 12: Confidence Interval (95%) of the HTMT Statistic ..................................................... 106
Table 13: Results of Path Relationships ..................................................................................... 112
Table 14: Values of R2 of Endogenous Constructs ..................................................................... 120
Table 15: Values of f2 Effect Size ............................................................................................... 122
Table 16: Predictive Relevance by Blindfolding (Q2) ................................................................ 123
Table 17: Factor Analysis of Measurement Items ...................................................................... 125
Table 18: Mediation Analysis ..................................................................................................... 133
xix
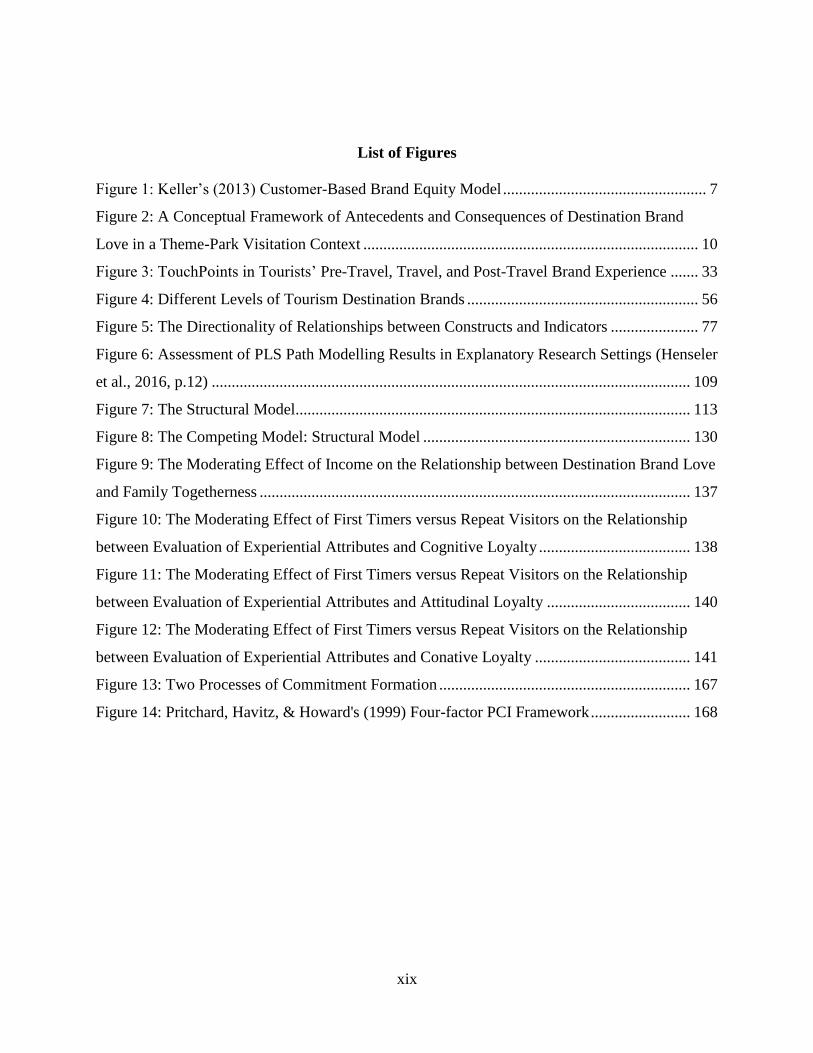
List of Figures
Figure 1: Keller’s (2013) Customer-Based Brand Equity Model ................................................... 7
Figure 2: A Conceptual Framework of Antecedents and Consequences of Destination Brand
Love in a Theme-Park Visitation Context .................................................................................... 10
Figure 3: TouchPoints in Tourists’ Pre-Travel, Travel, and Post-Travel Brand Experience ....... 33
Figure 4: Different Levels of Tourism Destination Brands .......................................................... 56
Figure 5: The Directionality of Relationships between Constructs and Indicators ...................... 77
Figure 6: Assessment of PLS Path Modelling Results in Explanatory Research Settings (Henseler
et al., 2016, p.12) ........................................................................................................................ 109
Figure 7: The Structural Model................................................................................................... 113
Figure 8: The Competing Model: Structural Model ................................................................... 130
Figure 9: The Moderating Effect of Income on the Relationship between Destination Brand Love
and Family Togetherness ............................................................................................................ 137
Figure 10: The Moderating Effect of First Timers versus Repeat Visitors on the Relationship
between Evaluation of Experiential Attributes and Cognitive Loyalty ...................................... 138
Figure 11: The Moderating Effect of First Timers versus Repeat Visitors on the Relationship
between Evaluation of Experiential Attributes and Attitudinal Loyalty .................................... 140
Figure 12: The Moderating Effect of First Timers versus Repeat Visitors on the Relationship
between Evaluation of Experiential Attributes and Conative Loyalty ....................................... 141
Figure 13: Two Processes of Commitment Formation ............................................................... 167
Figure 14: Pritchard, Havitz, & Howard's (1999) Four-factor PCI Framework ......................... 168
1
Chapter One: Introduction
Imagine that an adult tourist is planning to visit the Shanghai Disney Resort. Before his trip,
the extensive media coverage of the Disney cartoon characters and Disneyland in Tokyo, Paris,
California, Hong Kong, and Orlando, may have already established his awareness of the Disney
brand. His previous experience seeing Disney movies (e.g., Finding Dory, Cinderella), purchasing
tie-in retail products, and travelling on Disney cruises may form his initial trust of Disneyland.
During his on-site visiting experiences, he might like or dislike it and establish a certain degree of
emotional bond with Disneyland. In the post-visit stage, if the overall experience is satisfying, he
may become loyal to Disneyland and recommend friends and relatives to visit. From the perspective
of individual well-being, he may get an enhanced level of perceived happiness after visiting. If he
visited with family members, they might also feel closer to each other; therefore, their family
togetherness could be strengthened. He might also be unhappy and feel more frustrated with his
family members.
This story delineates the pre-visit, visit, and post-visit brand experience from knowing a
destination brand to experiencing it, evaluating it, and ultimately (for some) becoming loyal to it.
Some interesting questions in this scenario include: does this visitor experience a feeling of love
towards branded destinations? How strong is it? What can lead to this strong affection and what can
be influenced by it?
Every step in this brand experience continuum is related to consumer-brand relationships
(CBRs), which have three categories: emotional connections, functional connections, and a mix of
both (Fetscherin & Heilmann, 2015). Consumer affection for a brand plays a significant role in
sustaining long-term consumer-brand relationships (CBRs) (Albert & Merunka, 2013; Albert et al.,
2008a; Batra et al., 2012; Fournier, 1998). Healthy and enduring CBRs are fundamentally necessary
2
for sustaining brand loyalty (Albert & Merunka, 2013) and finally business success (Fetscherin &
Heilmann, 2015).
Researchers have long suggested that attitudes alone are insufficient predictors of brand
loyalty (Patwardhan & Balasubramanian, 2011), and real loyalty requires close emotional bond
between consumers and brands (Oliver, 1999). Given the difficulty in measuring complicated
consumer-brand emotional connections, some marketing constructs have been proposed and
validated to facilitate an understanding of these emotional connections. These constructs include
brand love (Albert & Merunka, 2013; Albert et al., 2008a; Batra et al., 2012; Carroll & Ahuvia
2006), emotional attachment, brand romance (Patwardhan & Balasubramanian, 2011), brand passion
(Bauer, Heinrich, & Martin, 2007), brand trust (Ball, Simões Coelho, & Machás, 2004; Javed, Roy,
& Mansoor, 2015), and others. Brand love, emotional attachment, brand romance, and brand passion
share several similarities. Firstly, all stress the word “attachment” (Batra et al., 2012; Bauer et al.,
2007; Carroll & Ahuvia, 2006; Park, MacInnis, Priester, Eisingerich, & Iacobucci, 2010; Patwardhan
& Balasubramanian, 2011). Secondly, all are well-established constructs that have strong reliability
and validity and lead to desirable consumer behaviours, for example, attitudinal brand loyalty, price
premium, resistance to negative comments, and positive word of mouth (WoM) (e.g., Bauer et al.,
2007; Patwardhan & Balasubramanian, 2011). Thirdly, they overlap in measurement scales. Brand
love stands out among these constructs because it has a more abundant variety of antecedents and
consequences and is more inclusive than brand passion and emotional attachment (Aro et al., 2018;
Batra et al., 2012). Brand love’s multi-dimensionality captures not only positive emotional
connection, affection, pleasure, and passion, as emotional attachment and brand passions do
(Patwardhan & Balasubramanian, 2011; Thomson, MacInnis, & Park, 2005), but also addresses
long-term relationship and attitude strength (Batra et al., 2012), the two dimensions of which have

3
not been captured in emotional attachment and brand passion. Brand love features its richness,
inclusiveness, and reliable power to predict loyalty.
Brand love is an under-researched but increasingly important marketing construct (Albert &
Merunka, 2013; Albert et al., 2008a; Fournier, 1998) that includes both cognitive and emotional
dimensions (Albert et al., 2008b). Carroll and Ahuvia (2006) appeared to have been the first to
assess brand love. They defined it as “the degree of passionate emotional attachment a satisfied
consumer has for a particular trade name” (Carroll & Ahuvia, 2006, p. 81). According to them,
brand love includes passion, attachment, positive evaluations and reactions, and declarations of love
(Carroll & Ahuvia, 2006). Carroll and Ahuvia (2006) also noted that brand love is conceptually
distinct from brand loyalty because measures of brand love and brand loyalty loaded on entirely
different factors. Batra et al. (2012) and Bergkvist and Bech-Larsen (2010) suggested that brand love
should include the following sub-dimensions: self-brand integration, passion-driven behaviours,
long-term relationship, positive emotional connection, attitude valence, attitude strength, and
anticipated separation distress.
Although previous marketing researchers have validated brand love’s reliability, validity, and
ability to predict emotional responses to product brands (e.g., Albert & Merunka, 2013; Batra et al.,
2012), to date, this construct has only found limited use in destination research. Swanson, Medway,
and Warnaby’s (2015a) exploration of brand love’s methodological and technological approaches in
tourism contexts marked an original application of this construct in tourism studies. The very few
qualitative and exploratory studies on destination brand love call for quantitate investigations to
identify its measures, reliability, and validity. Aro et al. (2018, p. 80), for instance, emphasized that
“once destination brand love has been sufficiently explored qualitatively, further studies could
develop quantitative measures.”
4
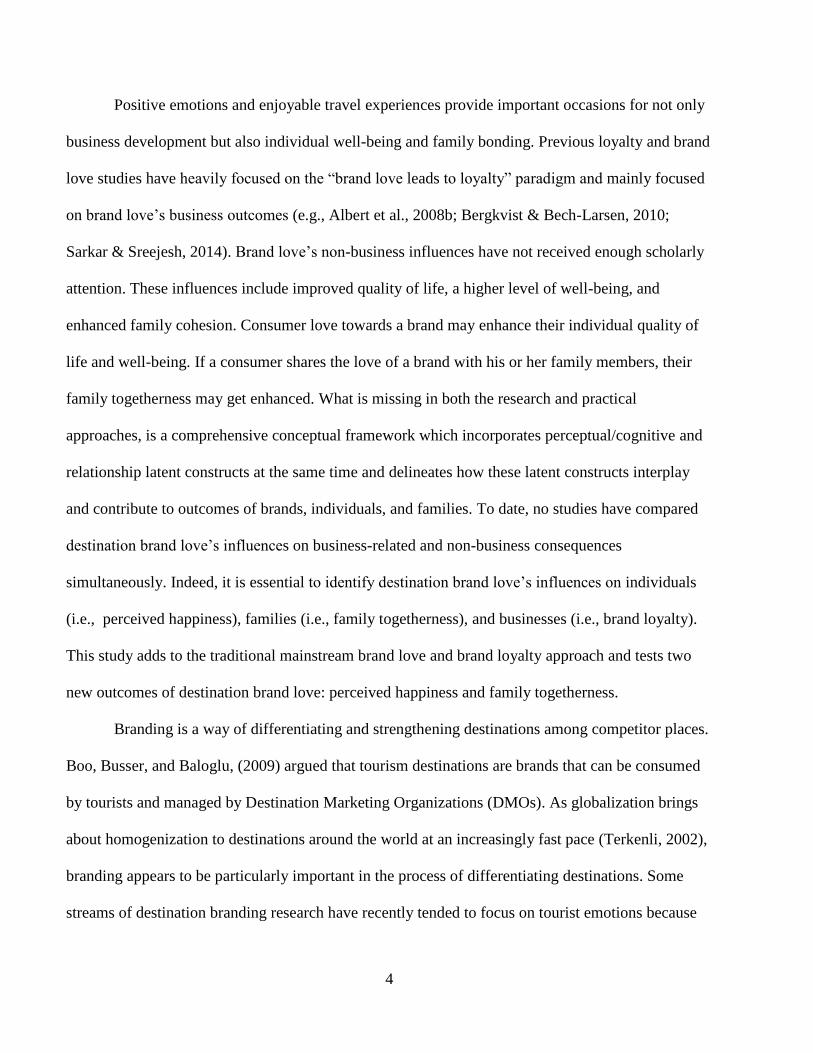
Positive emotions and enjoyable travel experiences provide important occasions for not only
business development but also individual well-being and family bonding. Previous loyalty and brand
love studies have heavily focused on the “brand love leads to loyalty” paradigm and mainly focused
on brand love’s business outcomes (e.g., Albert et al., 2008b; Bergkvist & Bech-Larsen, 2010;
Sarkar & Sreejesh, 2014). Brand love’s non-business influences have not received enough scholarly
attention. These influences include improved quality of life, a higher level of well-being, and
enhanced family cohesion. Consumer love towards a brand may enhance their individual quality of
life and well-being. If a consumer shares the love of a brand with his or her family members, their
family togetherness may get enhanced. What is missing in both the research and practical
approaches, is a comprehensive conceptual framework which incorporates perceptual/cognitive and
relationship latent constructs at the same time and delineates how these latent constructs interplay
and contribute to outcomes of brands, individuals, and families. To date, no studies have compared
destination brand love’s influences on business-related and non-business consequences
simultaneously. Indeed, it is essential to identify destination brand love’s influences on individuals
(i.e., perceived happiness), families (i.e., family togetherness), and businesses (i.e., brand loyalty).
This study adds to the traditional mainstream brand love and brand loyalty approach and tests two
new outcomes of destination brand love: perceived happiness and family togetherness.
Branding is a way of differentiating and strengthening destinations among competitor places.
Boo, Busser, and Baloglu, (2009) argued that tourism destinations are brands that can be consumed
by tourists and managed by Destination Marketing Organizations (DMOs). As globalization brings
about homogenization to destinations around the world at an increasingly fast pace (Terkenli, 2002),
branding appears to be particularly important in the process of differentiating destinations. Some
streams of destination branding research have recently tended to focus on tourist emotions because

5
positive tourist emotions elicit memorable travel experiences, predict visitor loyalty and differentiate
destinations (Ma, Scott, & Ding, 2013). In Hosany and Gilbert’s (2010, p. 513) three-dimension
destination emotion scales, “love,” “joy,” and “positive surprises” are the three primary tourist
emotional responses towards hedonic destinations1. The three types of affect contributed to 21%,
24%, and 15% of the variances of emotional responses respectively (Hosany & Gilbert, 2010).
Based on these previous studies, the feeling of love a tourist holds for a branded vacation site is
undoubtedly an essential aspect of tourist emotions and tourist-destination relationships.
Like product brands or service brands, well-branded destinations drive tourists to establish
commitment, emotional connections, and loyalty. Although visitors can set emotional attachment
with and loyalty to destination brands at different geographical levels (e.g., country, province/state,
city, destination), the researcher mainly focused on branded destinations, employing the Shanghai
Disney Resort as a context. The Walt Disney Company’s business spans various fields such as mass
media, entertainment (e.g., movies, cartoons), retail, theme parks, and cruises. Visitors must have
known this theme park brand before visiting, therefore being able to identify this brand.
Furthermore, they might have already established certain levels of trust towards Disney resort
through their pre-visiting brand experiences. Indeed, brand awareness and brand trust are two critical
antecedents of brand love (Albert & Merunka, 2013; Fetscherin & Heinrich, 2015). However, there
has been no published research on the relationships between brand trust, brand awareness, evaluation
of experiential attributes, and brand love. No study on destination brand love’ antecedents has been
carried out in the context of branded destinations.
Apart from pre-existing brand beliefs of the overall Disney brand that can influence tourist
perceptions of Disneyland, visitor evaluation of experiential attributes may significantly impact
1 Hedonic destinations are places that create broad hedonic normative meanings such as delight, fun, thrill, playfulness,
enjoyment, cheer, and amuse (Hosany & Gilbert, 2010).

6
destination brand love (Batra et al., 2012). Destination brand love may then affect perceived
happiness (Batra et al., 2012; Seligman, 2011), family togetherness (Chandralal & Valenzuela, 2013;
Shaw et al., 2008), and tourist destination brand loyalty (Lee, Graefe, & Burns, 2007) in sequential
stages (i.e., cognitive, attitudinal, and conative loyalty). This study explored and justified these
relationships further in a later section of the introduction.
While the term brand love appears to be rather emotional for academic research, it is in fact
widely used in contemporary scholarly work, such as Albert and Merunka (2013), Albert et al.
(2008a), Albert et al. (2008b), Aro et al. (2018), Batra et al. (2012), Bergkvist and Bech-Larsen
(2010), Carroll and Ahuvia (2006), Sarkar and Sreejesh (2014). It also accurately reflects the word
choice of many loyal customers. It has the benefit of being a short catch-all term with which to
replace the wordier but less inclusive “emotional attachment,” “brand romance,” or “brand passion.”
The current research uses the term brand love throughout.
1.1 Theoretical Perspective: The Customer-Based Brand Equity Model
Researchers have established various conceptualizations of how brands influence consumer
perceptions and behaviours. Two widely cited examples are Aaker’s (1991) brand equity model and
Keller’s (2013) Customer-Based Brand Equity (CBBE) model (Figure 1). Aaker (1991) recognized
five building blocks of brand equity: brand loyalty, brand awareness, perceived quality, brand
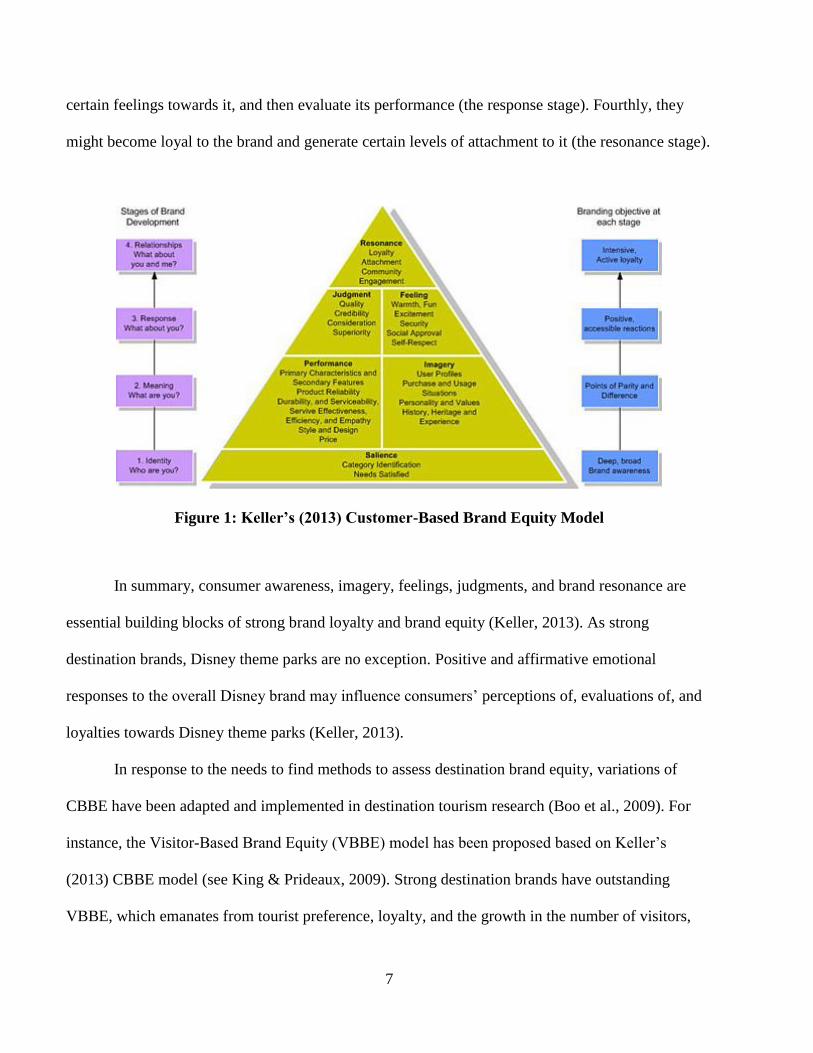
associations, and other proprietary assets. Keller’s (2013) CBBE model suggests that brand
development involves four primary stages. Firstly, consumers should be aware of the trademark and
be able to identify it (the salience stage). Secondly, after getting some level of awareness, they
experience the brand through a series of brand touch points, such as products, services, pricing, and
ambiance (the performance and imagery stages). Thirdly, they may respond to the brand, develop
7
certain feelings towards it, and then evaluate its performance (the response stage). Fourthly, they
might become loyal to the brand and generate certain levels of attachment to it (the resonance stage).
Figure 1: Keller’s (2013) Customer-Based Brand Equity Model
In summary, consumer awareness, imagery, feelings, judgments, and brand resonance are
essential building blocks of strong brand loyalty and brand equity (Keller, 2013). As strong
destination brands, Disney theme parks are no exception. Positive and affirmative emotional
responses to the overall Disney brand may influence consumers’ perceptions of, evaluations of, and
loyalties towards Disney theme parks (Keller, 2013).
In response to the needs to find methods to assess destination brand equity, variations of
CBBE have been adapted and implemented in destination tourism research (Boo et al., 2009). For
instance, the Visitor-Based Brand Equity (VBBE) model has been proposed based on Keller’s
(2013) CBBE model (see King & Prideaux, 2009). Strong destination brands have outstanding
VBBE, which emanates from tourist preference, loyalty, and the growth in the number of visitors,

8
their spending, and duration of stay (Keller, 2013). So far, insufficient tourism research has adopted
Keller’s (2013) brand-experience perspective to delineate tourists’ brand experiences from brand
awareness, imagery, perceptions, evaluations, to feelings and loyalty. Destination brand love falls
into the category of “feeling” in Keller’s (2013) CBBE model. Few studies have examined it through
the lenses of CBBE or VBBE. Moreover, existing tourist loyalty models have seldom incorporated
destination brand love as a critical type of emotional bonds between tourists and branded
destinations.
1.2 Research Objectives
So far, CBR research in theme-park based tourism is also relatively lacking. Very few
published studies have explored destination brand love in the context of theme park visitation. This
study aims to test and establish a conceptual framework of antecedents and consequences of
destination brand love in a theme-park visitation context and to delineate how these latent constructs
interplay and contribute to optimal outcomes of brands, individuals, and families. The researcher
refers to theme parks visitors as tourists and excursionists. According to World Tourism
Organization (WTO), a tourist (or an overnight visitor) means a visitor whose trip includes an
overnight stay at a destination, while an excursionist (or a same-day visitor) is a domestic, inbound,
or outbound visitor whose trip does not include an overnight stay. Specifically, this dissertation aims
to address the following four research objectives:
1) The first research objective is to validate and establish the marketing construct of
destination brand love.
9
2) Secondly, this dissertation seeks to propose, test, and establish a conceptual
framework of antecedents and consequences of destination brand love in a theme-
park tourism context (Figure 2).
3) Thirdly, this dissertation aims to test destination brand love’s mediating role in the
relationship between the evaluation of experiential attributes and sequential stages of
destination brand loyalty (cognitive, attitudinal, and conative loyalty).
4) The fourth research objective is to examine the moderating role of income in the link
between destination brand love and family togetherness and the moderating role of
first-time versus repeat visitors in the link between the evaluation of experiential
attributes and four sequential stages of destination brand loyalty (cognitive,
attitudinal, and conative loyalty).
1.3 Conceptual Framework
The current study defines destination brand love as the degree of intense affection a tourist
holds for a branded destination (Carroll & Ahuvia, 2006). Figure 2 displays the conceptual
framework of this study. The researcher developed this framework after a review of extensive
branding and tourism marketing literature.

10
Figure 2: A Conceptual Framework of Antecedents and Consequences of Destination Brand
Love in a Theme-Park Visitation Context

11
To capture the richness of the fabric from which destination brand loyalty, perceived
happiness, and family togetherness arises, the researcher designed all the latent constructs in the
conceptual framework multi-dimensional and multi-indicator. Specifically, brand awareness refers to
the extent to which a brand name can be recognized based on perceptual occurrence/frequency,
irrespective of product class (Hellofs & Jacobson, 1999; Oh, 2000). Brand trust means the extent to
which a brand is “altruistic, reliable, honest, and competent” (Bearden & Netemeyer, 1999, p. 234),
and it covers credibility, integrity, and goodwill (Hess, 1995). Brand love’s sub-dimensions include
self-brand integration, passion-driven behaviours, positive emotional connection, long-term
relationship, attitude strength, and attitude valence (Batra et al., 2012; 2014). Family togetherness
refers to a sense of emotional closeness and bonding within families (Williams & Anthony, 2015).
Perceived happiness indicates an overall assessment of the quality of life of a person (Shin &
Johnson, 1978).
Destination brand loyalty has been recognized to indicate “a deeply held commitment to
rebuy or re-patronize a preferred brand” (Oliver, 1999, p.34). Traditional ways of conceptualizing
loyalty as univariate/one-dimensional (see Carroll & Ahuvia, 2006; Delgado-Ballester et al., 2003)
or bi-dimensional (e.g., Day, 1976; Day, 1969; Jacoby, 1969, 1970, 1971) tend to be less inclusive.
This dissertation adopts a more recent and holistic view that loyalty development involves four
sequential stages (Harris & Goode, 2004; Oliver, 1999; Oliver, 1997). I tested sequential stages of
loyalty, that is, cognitive, affective, and conative loyalty (Back, 2005; Back & Parks, 2003; Choo et
al., 2011; Netemeyer, Krishnan, Pullig, Wang, Yagcid, Deane, Ricksf, & Wirth, 2004; Oliver, 1999;
Oliver, 1997). Cognitive loyalty refers to “the existence of beliefs that (typically) a brand is
preferable to others” (Harris & Goode, 2004, p. 141). Attitudinal loyalty reflects consumers’
favourable attitude or liking by satisfied usage (Harris & Goode, 2004). Conative loyalty is used to

12
represent the development of behavioural intentions and characterizes a more profound commitment
(Harris & Goode, 2004).
Notably, the constructs of brand awareness, family togetherness, and perceived happiness are
multi-indicator but single-dimensional (Williams & Anthony, 2015; Lyubomirsky & Lepper, 1999;
Oh, 2000); the other constructs in the conceptual framework are all multi-indicator and multi-
dimensional. In this conceptual framework (Figure 2), destination brand love functions as the critical
mediating construct between its antecedents and outcomes. Three factors precede destination brand
love are brand awareness, brand trust, and evaluation of experiential attributes. Outcome constructs
include destination brand loyalty (in sequential stages: cognitive, attitudinal, and conative),
perceived individual happiness, and family togetherness. Previous product marketing studies suggest
that brand trust and brand awareness significantly influence brand love, which in turn leads to brand
loyalty (e.g., Albert & Merunka, 2013). This study extended these marketing studies into destination
contexts and explored destination brand love’s familial (family togetherness) and individual
(perceived happiness) outcomes.
So far, no systematic theoretical framework of destination brand love has been published to
explain the relationships among such CBR constructs as brand loyalty and brand trust. To address
this void, the researcher proposed the scaled-down conceptual framework (Figure 2). In this
framework, the researcher excluded construct sub-dimensions that are entirely product-based and not
directly related to destination contexts. Specifically, one sub-dimension of brand love, anticipated
separation distress (Batra et al., 2012), was proposed and verified in product contexts. It appears to
be inapplicable in destination studies because tourists bear the motivation to seek novelty and variety
(see McAlister’s Theory of Variety-seeking, 1982). As a result, the researcher deleted anticipated
separation distress from the destination brand love construct in this study.

13
Destination brand love plays key mediating roles in a series of brand-related relationships
(e.g., Albert & Merunka, 2013; Bergkvist & Bech-Larsen, 2010; Carroll & Ahuvia, 2006; Roy,
Eshghi, & Sarkar, 2013), such as the relationship between satisfaction and loyalty (Roy et al., 2013)
and that between brand image and WoM (Ismail & Spinelli, 2012). Based on these previous studies,
this dissertation tested a series of research hypotheses concerning the mediating role of destination
brand love. Additionally, the researcher also examined “income” and “first-time versus repeat
visitors” as two categorical moderators. Existing studies showed that a satisfied level of income
reduces psychological distress (Thoits & Hannan, 1979), which in turn influences family
togetherness (Rivera, Guarnaccia, Mulvaney-Day, Lin, Torres, & Alegria, 2008). First-time and
repeat visitors also show distinct destination loyalty (e.g., Caber, 2015). With all the mediation and
moderation effects, this study tested a total of 20 research hypotheses, including general hypotheses,
mediation hypotheses, and moderation hypotheses.
1.4 Theoretical and Practical Contributions
Theoretically, this dissertation addressed a significant gap in the literature by validating the
construct of destination brand love and proposing the multi-dimensional and multi-indicator
conceptual framework. Much existing loyalty research has neglected the cognitive, attitudinal, and
conative constituents of loyalty. This study narrowed this gap by clarifying destination brand love’s
impacts on all four loyalty components. Moreover, the relationship between tourism, individual
happiness, and family togetherness represents a relatively new line of research in tourism studies
(e.g., McCabe & Johnson, 2013). This study contributed to travel research by delineating destination
brand love’s contribution to non-business outcomes, namely, perceived happiness and family
togetherness.

14
Practically, this study demonstrated two important antecedents of destination brand love,
which are brand trust and evaluation of experiential attributes. Understanding these antecedents will
help DMOs clarify the sources of visitors’ emotional connection with destinations. Moreover, it
compared the relative importance of brand awareness, brand trust, and the evaluation of experiential
attributes as three antecedents of destination brand love. The results can help DMO optimize the
allocation of marketing resources when advertising their branded destinations. Study results may
also help respondents better understand the role of family leisure in their lives and, consequently,
make choices that are best for their circumstances.
15
Chapter Two: Literature Review
The literature review starts with a review of existing literature about love in psychology and
brand love in branding, consumer behaviour, retail, psychology, and tourism, with a particular focus
on seminal journal articles published in the past 30 years. Section 2.1 revolves around two
perspectives: love as a social psychological phenomenon and as a consumer behaviour construct.
Section 2.2 then discusses brand love’s situation in CBR Literature. Section 2.3 delineates the six
sub-dimensions of brand love. After that, Section 2.4, the most relevant section in the Literature
Review, explains every latent construct in the conceptual framework, as well as the moderators and
mediators explored in this dissertation. Research hypotheses follow each sub-section. Section 2.5
discusses definitions and different levels of tourism destinations. To provide a more detailed
background of theme parks as branded destinations, section 2.6 briefly introduces the history of
theme park development, the conceptualizations and characteristics of theme parks, and Disneyland
as the specific context for this study.
2.1 Brand Love’s Social Psychological Foundations
2.1.1 Sternberg’s (1986) triangular theory of love and its applications.
Although the construct of brand love is relatively new, it has deep roots in consumer
psychology, especially consumer-emotion research (e.g., Fournier, 1998). Shimp and Madden (1988)
introduced the concept of brand love drawing on Sternberg’s (1986) triangular theory of love. After
that, individual research has been conducted to explore consumer enthusiasm/passion for products
(e.g., Bauer et al., 2007; Whang, Allen, Sahoury, & Zhang, 2004), relationships with brands (Batra
et al., 2012), and love for a place in the tourism context (Swanson et al., 2015a).

16
The focus of marketing has shifted from transactions to relationships, and therefore from
products to brands (Javed et al., 2015). Because of these changes, researchers have employed
interpersonal relationship theories to understand consumers’ feelings, for example, affections for
branded destinations (e.g., Hosany & Gilbert, 2010). However, it is necessary to distinguish brand
love from interpersonal love. Social psychologists define love as “the constellation of behaviours,
cognitions, and emotions associated with the desire to enter or maintain a close relationship with a
specific other person” (Aron, Aron, Tudor, & Nelson, 1991, p. 26). From the interpersonal
relationship perspective, love can be manifested through objective measures, such as sexuality and
fertility rates (Albert et al., 2008a), and demonstration of affection. The triangular theory of love by
Sternberg (1986; 1997) deconstructed love into three dimensions: intimacy, passion, and
decision/commitment.
These three dimensions interact with each other to influence the overall feeling of love.
Intimacy incorporates the feelings of “closeness, connectedness, and bondedness” that people
experience in relationships (Stenberg, 1986, p. 119). The passion constituent encompasses
“motivational and other sources of arousal that leads to the experience of passion” (Sternberg, 1986,
p. 122). Decision/commitment means both short-term (decisions to love) and long-term commitment
(endeavours to maintain the love). Sarkar (2011) noted that what differs brand love from
interpersonal love is that fact that the former is unidirectional (only from people to brands), while the
latter is bidirectional (people can give love to each other).
Existing consumer research into customers’ love of products or services brands is, to a large
extent, based on social psychology research on interpersonal love. Some of the first endeavours to
understand consumer consumptions applied Sternberg’s (1986) triangular theory of love (Albert &
Merunka, 2013) and the Self-inclusion Theory (Aron & Aron, 1986). Although early contributions

17
of consumer love research set the stage for contemporary research in brand love, they appear to be
vulnerable to criticism. For example, Shimp & Madden (1988) proposed eight categories of
consumer-object relations based on Sternberg’s (1986; 1997) triangular theory of love: non-liking,
liking, infatuation, functionalism, inhibited desire, utilitarianism, succumbed desire, and loyalty.
This eight-stage model has several omissions and is not robust. First, the most notable weakness is
that between disliking and liking, there should be a continuum or some zones of interplay such as
neutral silence. Second, utilitarianism and functionalism have areas of overlap that should be
differentiated. Keller’s (2013) customer-based brand equity (CBBE) model (Figure 1) corroborated
the robustness of and applied the “loyalty” and “liking” components to, Shimp and Madden’s (1988)
categorization.
It is also worth noting that Sternberg’s (1986) triangular theory has been tested and supported
by subsequent branding researchers. For instance, through factor analysis, Aron and Westbay (1996)
confirmed Sternberg’s (1986) eight-category love configuration. Fournier (1998) suggested that
passion and love are two of the six types of CBRs. Research on brand love also demonstrated
Sternberg’s (1986) three dimensions of love. Specifically, Carroll and Ahuvia’s (2006) definition of
brand love also mentioned the essential roles of passion.
2.1.2 Self-inclusion theory and brand love.
Increasingly more researchers study brand love without drawing upon theories of
interpersonal love (e.g., Albert et al., 2008a; Carroll & Ahuvia, 2006). They argued that brand love
stem from an established customer-brand connection: a person-entity relationship, rather than the
interpersonal relationship (e.g., Carroll & Ahuvia, 2006). It also has the function of strengthening
CBRs (e.g., Albert & Merunka, 2013; Batra et al., 2012). In social psychology, Aron and Aron’s

18
(1986) Self-inclusion Theory holds that “people need to become part of another to feel loved”
(Albert & Merunka, 2013, p. 259). Researchers such as Ahuvia (1993) extended this theory to
marketing studies. Based on this theory, the conditions for consumers to feel love for a brand include
many aspects. These elements include certain degrees of interaction between customers’ sense of
self and brand attributes (Ahuvia, 1993; see Albert & Merunka, 2013) and congruency between
consumers’ personality or value propositions with brand attributes (Batra et al., 2012).
Researchers have long recognized that certain relationships exist between people and their
belongings (e.g., Blackston, 1992); these relationships reflect owners’ sense of self and can also
influence their identity and social relationships (Belk, 1988). Likewise, the products and services
people choose may mirror their attributes and preferences. Consumers must feel “psychological
proximity to developing an affective proximity with the brand” (Albert & Merunka, 2013, p. 263).
This proximity could partially explain why relationship research extends into the CBR area.
Consumers’ favourite brands can be irreplaceable, the same as valuable personal possessions (Kretz,
2015).
Although brand love is a relatively under-researched construct in marketing, some
endeavours have been made to clarify what brand love is from the CBR perspective. For example,
from the providers’ perspective, Fuchs, Schreier, and van Osselaer (2015, p. 100) defined love as
“the producer’s warm-hearted passion for a product or its production process that, as a result, can be
perceived as symbolically embedded in the product.” According to Fuchs et al. (2015), this
conceptualization of love reflects two facets of love: the love that producers imbue to products in the
handicraft production, and the metaphorical sense of love that the human-made products carry.
Albert et al. (2008a) did not mention that they adopted the self-inclusion theory in developing the 11
dimensions of consumers’ love towards a brand. However, “self-congruity (congruity between self-
19
image and product image)” and “dreams (the brand favours consumer goals)” both reflect the
essential meaning of the self-inclusion Theory (Albert et al., 2008a, p. 1071).
Love towards a tourism destination arises from a complex constellation of discreet
experiences concerning various tourist-destination touch points in the pre-travel, travel, and post-
travel stages. No single interpersonal relationship theory or consumer behaviour theory could claim
to be able to explain tourist love towards destination brands sufficiently. Related CBR and branding
literature should be reviewed to facilitate the understanding of brand love.
2.2 Similarities and Differences between Destination Brand Love and Related Marketing
Constructs
In the CBR literature, love towards a brand functions as one critical component of CBRs
(Fetscherin & Heinrich, 2014; Fournier, 1998). In Fournier’s (1998) six-faceted brand relationship
quality (BRQ) framework, brand love and brand passion are at the center of all strong brand
relationships. Their six CBR constructs are 1) love and passion, which is at the core of all strong
brand relationships; 2) self-connection, which means the extent to which “the brand delivers on
essential identity concerns, tasks, or themes, thereby expressing a significant aspect of self”
(Fournier, 1998, p. 364); 3) interdependence, which involved frequent brand interactions, increased
scope and diversity of brand-related activities, and heightened intensity of individual communication
events; 4) commitment, including Investment-related and emotional commitment; 5) intimacy; and
6) brand partner quality, which reflects consumers’ evaluation of the brand’s performance in its
partnership role. Fournier’s (1998) BRQ framework corroborated love’s cornerstone characters but
neglects an essential facet: trust (Delgado-Ballester, Munuera-Aleman, & Yague-Guillen, 2003),
which appears to be the most critical attribute any brand can possess.

20
From a matrix perspective, Fetscherin and Heinrich (2014) classified CBRs into four
categories based on the extent to which a particular brand can fulfill consumers’ emotional
(affective) and functional (cognitive) needs. The four categories comprise 1) functional invested
brands, 2) emotionally invested brands, 3) fully invested brand connections, and 4) un-invested
brands. Fetscherin and Heinrich (2014) positioned brand love in the quadrant where consumers
showcase both strong positive feelings of and a close relationship with a particular brand. Therefore,
brand love is an essential CBR construct, leading to brand commitment and loyalty.
Brand love intimately connects with other related CBR constructs such as emotional
attachment (e.g., Thomson et al., 2005), brand passion (Bauer et al., 2007; Patwardhan &
Balasubramanian, 2011), brand romance (Patwardhan & Balasubramanian, 2011), brand trust (Ball,
Simões Coelho, & Machás, 2004; Javed, Roy, & Mansoor, 2015), place attachment (Hidalgo &
Hernandez, 2001) and brand personality (Aaker, 1997; Geuens, Weijters, & De Wulf, 2009). These
three constructs have some degrees of similarities regarding definition, multi-dimensionality, focus,
predictive power, marketing outcomes, and measurement scales. Table 1 shows the similarities
between brand love and related marketing constructs. Brand love, emotional attachment, brand
passion, and place attachment all stress attachment (Batra et al., 2012; Park et al., 2010; Thomson et
al., 2005).

21
Table 1: Similarities between Brand Love and Related Marketing Constructs
Similarities Brand Love Emotional
Attachment
Brand Passion Place Attachment Brand Personality
Definition “the degree of
passionate emotional
attachment a satisfied
consumer has for a
particular trade
name” (Carroll &
Ahuvia, 2006, p. 81).
“the strength of the
bond connecting
the brand with the
self” (Park et al.,
2010, p. 2) (also
called brand
attachment)
“a state of emotional
attachment (evoked
in response to the
brand as a stimulus)
that is characterized
by strong positive
affect toward the
brand, high arousal
caused by the brand,
and a tendency of the
brand to dominate the
consumer’s
cognition”
(Patwardhan &
Balasubramanian,
2011, p. 299)
“ a positive
affective bond
between an
individual and a
specific place, the
main characteristic
of which is the
tendency of the
individual to
maintain closeness
to such a place.”
(Hidalgo &
Hernandez, 2001,
p. 274)
“the set of human
characteristics
associated with a
brand” (Aaker,
1997, p. 347)
Focus All five constructs stress attachment or association.
Predictive
Power and
Outcomes
1) All are well-established multi-dimensional constructs that have established reliability and validity.
2) All lead to desirable consumer behaviours, e, g., consumer emotions, brand preference, trust, satisfaction,
brand loyalty/ repurchasing behaviour, positive WoM, patronage intention.
Measurement Overlapped in measurement scales
Brand love also differs significantly from its related CBR constructs. Researchers have
empirically investigated these distinctions. For example, Albert and Merunka (2013) found that
brand love differs from three essential CBR constructs: brand awareness, brand commitment, and
brand trust. Thomson et al. (2005) conducted a series of studies and identified the three sub-
dimensions of emotional attachment: affection, passion, and connection. In their EFA results, “love”
emerged as one of the four items loading on the factor “affection”; the other three items loading on
“affection” were affectionate, friendly, and peaceful (Thomson et al., 2005, p. 80). The stronger a
consumer’s emotional attachment, the stronger feelings of affection, passion, connection, and love
he will experience (Fehr & Russell, 1991; Sternberg, 1987; Thomson et al., 2005). One of brand
love’s uniqueness and advantage, however, is that it also addresses attitude strength, which has been
22
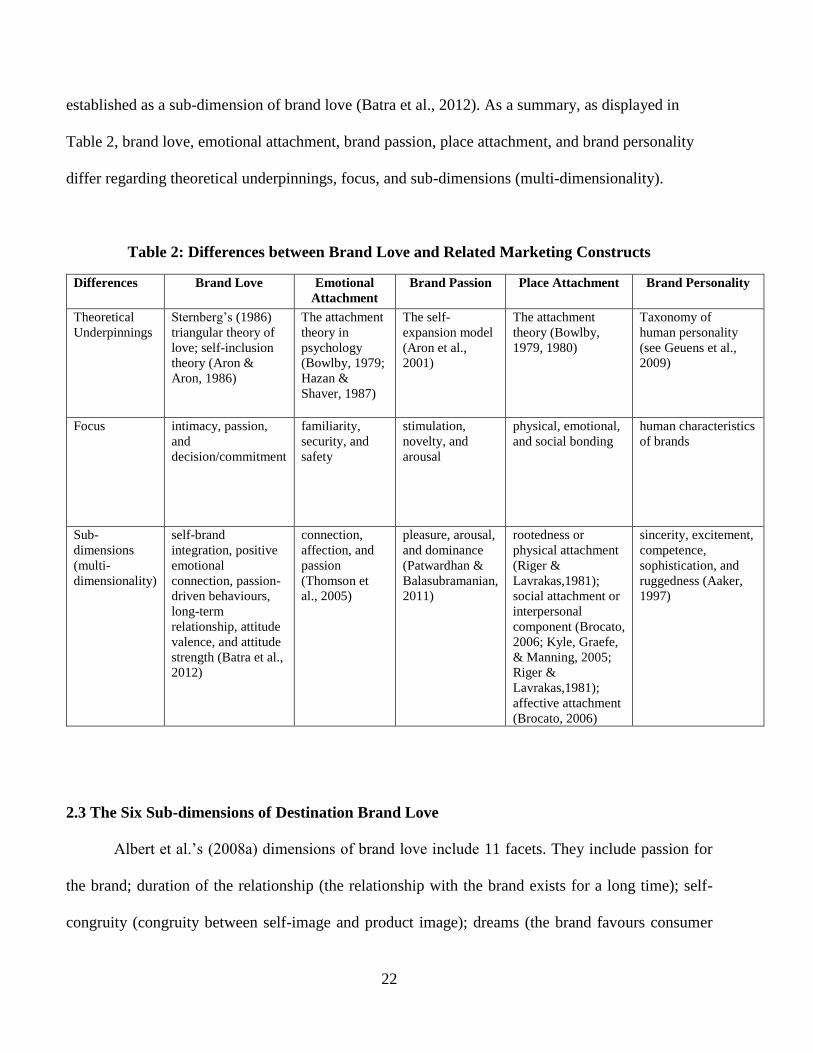
established as a sub-dimension of brand love (Batra et al., 2012). As a summary, as displayed in
Table 2, brand love, emotional attachment, brand passion, place attachment, and brand personality
differ regarding theoretical underpinnings, focus, and sub-dimensions (multi-dimensionality).
Table 2: Differences between Brand Love and Related Marketing Constructs
Differences Brand Love Emotional
Attachment
Brand Passion Place Attachment Brand Personality
Theoretical
Underpinnings
Sternberg’s (1986)
triangular theory of
love; self-inclusion
theory (Aron &
Aron, 1986)
The attachment
theory in
psychology
(Bowlby, 1979;
Hazan &
Shaver, 1987)
The self-
expansion model
(Aron et al.,
2001)
The attachment
theory (Bowlby,
1979, 1980)
Taxonomy of
human personality
(see Geuens et al.,
2009)
Focus intimacy, passion,
and
decision/commitment
familiarity,
security, and
safety
stimulation,
novelty, and
arousal
physical, emotional,
and social bonding
human characteristics
of brands
Sub-
dimensions
(multi-
dimensionality)
self-brand
integration, positive
emotional
connection, passion-
driven behaviours,
long-term
relationship, attitude
valence, and attitude
strength (Batra et al.,
2012)
connection,
affection, and
passion
(Thomson et
al., 2005)
pleasure, arousal,
and dominance
(Patwardhan &
Balasubramanian,
2011)
rootedness or
physical attachment
(Riger &
Lavrakas,1981);
social attachment or
interpersonal
component (Brocato,
2006; Kyle, Graefe,
& Manning, 2005;
Riger &
Lavrakas,1981);
affective attachment
(Brocato, 2006)
sincerity, excitement,
competence,
sophistication, and
ruggedness (Aaker,
1997)
2.3 The Six Sub-dimensions of Destination Brand Love
Albert et al.’s (2008a) dimensions of brand love include 11 facets. They include passion for
the brand; duration of the relationship (the relationship with the brand exists for a long time); self-
congruity (congruity between self-image and product image); dreams (the brand favours consumer

23
ideas); memories (evoked by the brand); pleasure (that the brand provides to the customer); attraction
(feel toward the brand); uniqueness (of the brand and/or of the relationship); beauty (of the brand);
trust (the brand has never disappointed); and declaration of affect (feel toward the brand). Similarly,
the later product-based brand love research by Batra et al. (2012) and Bergkvist & Bech-Larsen (2010)
suggested that brand love should include seven sub-dimensions: self-brand integration, passion-driven
behaviours, long-term relationship, positive emotional connection, attitude valence, attitude strength,
and anticipated separation distress.
2.3.1 Self-brand integration.
Brands are regarded to be related to human characteristics (e.g., Aaker, 1997), for example,
personality traits. Therefore, brands represent desired self-qualities. Exposure to brands can shape
decision-making. As a consumer’s exposure to a brand increases, the likelihood of this consumer
choosing this brand also rises.
Consumers choose brands for both the utilitarian and symbolic benefits. For this reason,
favourite brands should be able to reflect consumers’ current and desired self-identity and life
meanings (Batra et al., 2012). In other words, successful brands should relate to their consumers
through self-connection (Fournier, 1998, p. 364) or self-identification. Known as a kind of “brand
identification” (Bergkvist & Bech-Larsen, 2010), self-brand integration means “the extent to which
the consumer sees his or her self-image as overlapping the brand’s image” (Bagozzi & Dholakia,
2006, p. 49). It is also regarded by Fournier (1998, p. 364) as a type of “self-connection,” which
refers to “the degree to which the brand delivers on important identity concerns, tasks, or themes,
thereby expressing a significant aspect of self.” The three sub-constructs of self-brand integration are
life-meaning, desired self-identity, and current self-identity (Batra et al., 2012).

24
Self-brand integration predicts brand love (e.g., Albert & Merunka, 2013; Bergkvist & Bech-
Larsen, 2010; Batra et al., 2012). In the case of visitation at Disneyland, tourists may fit in very
naturally to Disneyland’s brand values, services, and staged authentic environment. This lack of
inhibition allows them to enjoy themselves, wholly immersed in the simulated “authenticity.”
2.3.2 Passion-driven behaviours.
Passion-driven behaviours are another sub-dimension of brand love (Batra et al., 2012). From
Batra et al.’s (2012) product-brand perspective, passion-driven behaviours include willingness to
invest time, money, energy, and other resources, passionate desire to use the brand, and things done
in the past (involvement), for example, previous interactions with the brand or the company that
makes the brand (Batra et al., 2012). In the context of Shanghai Disneyland, passion-driven
behaviours mean visitors’ willingness to spend money and time visiting it, passion for purchasing
brand-related products, and previous interactions with the Disney.
2.3.3 Positive emotional connection.
Positive emotional connection, as another sub-dimension of brand love, is also multi-faceted.
It not only captures the emotional attachment piece of the visitor-destination relationships, but also
covers multiples positive affect, such as content, relaxation, fun, excitement, calm, and pleasure (Batra
et al., 2012). It also informs the Intuitive fit between customers and brands (Batra et al., 2012).
2.3.4 Long-term relationship.
Long-term relationship means customers’ sense of commitment towards a brand over extended
periods (Batra et al., 2012). In product-choosing contexts, it can mean the willingness to use a product
25
for a long time. In this study, the long-term relationship between visitors and Shanghai Disney Resort
means that the resort may be in their memory for a long time and they feel a sense of commitment to
it.
2.3.5 Attitude strength.
Brand attitude strength and brand attachment are two distinct brand equity drivers (Park et al.,
2010). Attitude strength refers to “positivity or negativity of an attitude
weighted by the confidence or certainty with which it is held” (Park et al., 2010, p. 1). Attitudes
strength means frequent thoughts of a brand and the certainty and confidence of feelings towards the
brand (Batra et al., 2012). Theme park visitors’ attitude strength conceptually means the frequency
they think of a theme park and their certainty and confidence in their feelings towards this theme park
brand.
2.3.6 Attitude valence.
“Brands cannot be loved without also being liked and evaluated highly” (Batra et al., 2012, p.
6). Attitude valence has been reported as a significant predictor of brand love (Batra et al., 2012).
Attitude valence can be tested using several indicators such as satisfaction, feelings of like/dislike,
positive/negative evaluations, or met or unmet expectations (Batra et al., 2012). In this study, attitude
valence will be assessed under the construct evaluation of experiential attributes, leaving the final sub-
dimensions of destination brand love being self-brand integration, passion-driven behaviours, positive
emotional connection, long-term relationship, and attitude strength.
The last sub-dimension of brand love, anticipated separation distress (Batra et al., 2012),
appear to be inapplicable in the context of tourists visiting Shanghai Disney Resort because visitors

26
usually seek novelty/variety in travel experiences and may not feel distressed when they separate from
a destination. Different from consumer-product ties, separation stress does not necessarily exist in
tourist-destination relationships. McAlister’s (1982) Theory of Variety-seeking, usually applied in
tourism studies by the term novelty-seeking, explains why tourists switch from their loved brands to
other choices. Variety- or novelty- seeking are important tourist motives (e.g., Assaker, Vinzi, &
O’Connor, 2011; Feng & Jang, 2007). Exemplifications of tourists’ novelty-seeking motivations
include their pursuit of innovative physical places (McIntosh, Goeldner, & Ritchie, 1995); different
cultures; local crafts and cuisine; new friends; ethnic settings; and prestige in their travel experiences
(Assaker et al., 2011). Thus, in this study, anticipated separation distress is excluded from the sub-
dimensions of destination brand love.
2.4 Model Development: The Destination Brand Love Framework
The conceptual framework explains destination brand love through both pre-existing brand
beliefs (i.e., brand awareness and brand trust) and on-site perception and experiences (i.e., evaluation
of experiential attributes). The outcomes of destination brand love include four-faceted brand loyalty
(Albert & Merunka, 2013; Batra et al., 2012; Carroll & Ahuvia, 2006), perceived happiness, and
family togetherness. The conceptual framework encompasses seven primary hypotheses. The
propositions about brand loyalty contain four sub-hypotheses.
It may be incorrect to view the relations among these latent constructs in a unidirectional
manner. It is highly likely that the outcomes in the conceptual framework (Figure 2) will strengthen
brand awareness and brand trust, thereby creating an active cycle mechanism. The following
sections discuss each latent construct one by one.

27
2.4.1 Antecedents of destination brand love.
The antecedents of brand love are the pre-existing beliefs of the destination brand, i.e., brand
awareness and brand trust (Albert & Merunka, 2013; Fetscherin & Heinrich, 2015), and evaluation
of experiential attributes. In the case of the Shanghai Disney Resort, tourists’ pre-existing awareness
of Disney’s mass media, entertainment, retail, theme parks, and cruises can impact their overall
brand love towards Shanghai Disney Resort. Section 2.3.1.1 discusses the three antecedents of
destination brand love: brand awareness, brand trust, and evaluation of experiential attributes.
2.4.1.1 Brand awareness.
Consumers can be aware of a brand from various perspectives (e.g., identify with a firm or its
product) (Kuenzel & Halliday, 2008). In a framework clarifying consumer identification of
companies, Bhattacharya and Sen (2003, p. 77) conceptualized consumers’ identification with a
company as “an active, selective, and volitional act motivated by the satisfaction of one or more self-
definitional (i.e., “Who am I?”) needs.” Hughes and Ahearne (2010, p. 84) defined brand
identification as “the degree to which a person defines him- or herself by the same attributes that he
or she believes define a brand.” Pritchard, Havitz, and Howard (1999), in their exploration of airline
and hotel customers’ commitment, established a three-dimensional conceptualization of
commitment: informational, identification, and volitional. Consistent with Crosby and Taylor’s
(1983) arguments, Pritchard et al. (1999) contended that the consumer identification process is the
second active precursor of commitment.
Similar to identification, brand awareness functions as a decision heuristic (Hoyer & Brown,
1990; Huang & Sarigöllü, 2012) and a significant driver of customer behaviors (Kuenzel & Halliday,
2008), for example, customer choice (Hoyer & Brown, 1990), customer perception and attitude
28
(Aaker, 1996), customer value process (Oh, 2000), and customer loyalty (Aaker, 1996). Brand
awareness is one of the five components of Aaker’s (1991) brand equity model. Aaker (1991)
defined brand awareness as the degree to which the public knows a brand. Aaker (1991) also
suggested measuring brand awareness using brand associations, familiarity and liking, commitment
to a brand, and brand preference during purchase processes. Previous marketing research has
verified brand identification or awareness as an antecedent of commitment (Pritchard et al., 1999),
brand love (Albert & Merunka, 2013; Bergkvist & Bech-Larsen, 2010), and brand loyalty (Bergkvist
& Bech-Larsen, 2010; Jacoby & Kyner, 1973). However, although establishing brand salient or
brand awareness lies at the first and most fundamental level of the brand resonance pyramid (Keller,
2013), brand awareness related research is still scarce (Huang & Sarigöllü, 2012).
Consumers may be able to be aware of many brands but only express strong affections for
and positive evaluations of particular ones. Unless users know about a brand (pure awareness), it is
almost impossible that they will have a strong love for it. This process is also applicable to the case
of visitation at Shanghai Disney Resort. So far, tourist awareness of theme park brands and its
influences are still under-researched, especially in the Chinese theme park market. Few studies have
examined the impacts of destination brand awareness on the emotional bond between tourists and
branded destinations.
Brand awareness is of fundamental importance in building ideal tourist-destination
relationships (Choo et al., 2011) because strong CBRs often arise from consumers’ awareness with
those brands (Bhattacharya & Sen, 2003). Strong CBRs may further result in customer commitment
and loyalty (Keller, 2013). Based on the related literature, this study hypothesizes that:
H1: Destination brand awareness will have a positive effect on destination brand love.

29
2.4.1.2 Brand trust.
Trust comes before identified relationships (Keh & Xie, 2009). Consumer trust plays critical
roles in maintaining and enhancing CBRs; it is also the cornerstone and one of the ideal qualities of
CBRs (Delgado-Ballester et al., 2003). To understand CBRs requires analyses of consumer trust in
the brand (Delgado-Ballester et al., 2003). “The ultimate goal of marketing is to generate an intense
bond between the consumer and the brand, and the main ingredient of this bond is trust” (Hiscock,
2001, p. 1). Hess (1995) conceptualized brand trust on the basis that its consumers trust a brand to
the extent that this brand is “altruistic, reliable, honest, and competent,” and that users know what to
expect from the brand (Bearden & Netemeyer, 1999, p. 234). Hess’s (1995) brand trust scales
consist of 11 reliable and valid measurement items organized into three dimensions: brand honesty,
brand altruism, and brand reliability. Ha and Perks (2005) found three antecedents of brand trust:
consumer brand experiences and their searching for information, secondly, a high degree of
consumer brand familiarity, and consumer satisfaction.
Brand trust deals with the probabilities of satisfying occurrences and consumers’ confidence
and expectations; it expresses a brand’s reliability, honesty, altruism, and safety from the perspective
of consumers (Chaudhuri & Holbrook, 2001; Hess, 1995). Chaudhuri and Holbrook (2001, p. 82)
described brand trust as “the willingness of the average consumer to rely on the ability of the brand
to perform its stated function.” Delgado-Ballester et al. (2003) suggested another definition which
emphasizes reliability and low risk; they referred to brand trust as “the confident expectations of the
brand’s reliability and intentions in situations entailing risk to the consumer.” From these definitions;
brand trust bears both cognitive and affective components (Albert et al., 2008b).
Brand trust is an antecedent of brand love (Albert & Merunka, 2013; Fetscherin & Heinrich,
2015) and brand loyalty. It also has positive impacts on loyalty (Albert & Merunka, 2013; Chaudhuri

30
& Holbrook, 2001; Delgado-Ballester et al., 2003; Morgan & Hunt, 1994). Based on these
arguments, the researcher posits:
H2: Destination brand trust will have a positive effect on destination brand love.
2.4.1.3 Evaluation of experiential attributes.
Positive consumer evaluation of experience is one of the traditional ultimate business goals
for many destinations (e.g., Chi & Qu, 2008). Consumer satisfaction is both cognitive and emotional
(del Bosque & San Martín, 2008). In general marketing settings, a positive evaluation is an
antecedent of loyalty (Chen, 2012; Deng, Lu, Wei, & Zhang, 2010; Flint, Blocker, & Boutin, 2011;
Liu, Guo, & Lee, 2011; Nam et al., 2011). In travel circumstances, positive evaluation of
experiential attributes enhances tourist loyalty towards destinations (e.g., Alexandris, Kouthouris, &
Meligdis, 2006).
Existing research on travel satisfaction has adopted both the overall satisfaction approach
(e.g., Oliver, 1980) and the attribute satisfaction approach (e.g., Chi & Qu, 2008; Oliver, 1993).
These two types of satisfaction are distinct but also related (Oliver, 1993). The traditional single-
facet overall satisfaction approach (Oliver, 1980) merely investigates “overall satisfaction” and
appear to be partial and less informative. A multi-attribute perspective treats satisfaction as a
function of multiple attribute-level evaluations (Oliver, 1993). This attribute-level approach regards
the evaluation as arising from a complex constellation of discreet experiences concerning various
tourist-destination touch points in the pre-travel, travel, and post-travel stages.
Multiple domains significantly influence the evaluation of experiential attributes. These
domains include but are not limited to: culture; dining; shopping; attractions; activities and events;
environment; accessibility and transportation; safety; service quality (Chi & Qu, 2008; Kozak &

31
Rimmington, 2000; Rittichainuwat, Qu, & Mongknonvanit, 2002). Considering that a wide range of
destination components altogether lead to tourist evaluation of on-site experiences (Kozak &
Rimmington, 2000), this research adopts Oliver’s (1993) attribute-level conceptualization of
satisfaction and uses multiple measures to test visitors’ evaluation of experiential attributes.
Consumers will not love a brand unless they evaluate it highly (Batra et al., 2012; Roy et al.,
2013). In this sense, the evaluation of experiential attributes serves as a critical catalyst to spark
brand love during travel experiences. Because evaluation of experiences has been reported as a
significant predictor of brand love (Batra et al., 2012) and brand loyalty (Carroll & Ahuvia, 2008;
Chen, 2012; Liu et al., 2011), this research posits that:
H3a: Evaluation of experiential attributes will have a positive effect on destination brand
love.
2.4.2 Outcomes of destination brand love.
2.4.2.1 Brand loyalty.
2.4.2.1.1 Brand loyalty’s position in the brand experience.
Brand loyalty lies in the late stages of brand experience; early stages include but are not
limited to brand recognition, customer feelings, and brand evaluations (Keller, 2013). It is essential
to recognize the role brand loyalty plays in consumers’ whole brand experience. Consumers begin to
interact with brands in their pre-patronage stage, such as when they search for brand information
either online or in physical settings or when they see advertisements and hear other consumers’
opinions (Brakus, Schmitt, & Zarantonello, 2009; Hoch, 2002). When they actually buy physical
products or service, functional factors like the assortment and display of products, service staff and
their service quality, and hedonic factors like ambience and specific feelings can both influence

32
consumers’ brand experience (e.g., Brakus et al., 2009; Lloyd, Yip, & Luk, 2011). Notably,
consumers’ brand experience does not end in the consumption stage. Their evaluations, feelings,
feedback, and loyalty in the post-purchase or post-consumption stage also contribute to their brand
experience critically, making the whole experience more complete. Customers’ feelings in brand
experience tend to be specific, rather than overall liking or hating (Brakus et al., 2009).
If we take the Disney brand as an example, before coming to Disney resorts, tourists may
have already formed a certain level of emotional attachment towards Disney. The media coverage of
Tokyo, Paris, Califonia, Hong Kong, and Orlando Disneyland, as well as the long-term familiarity
with the brand from seeing Disney movies (Lion King, for example), plays, and tie-in products make
tourists familiar with the Disney brand. In their visiting, playing, and purchasing experience at
Disneyland, their on-site brand experience is formed and then further enriched; they may also
express a certain level of brand love and brand loyalty. After visiting Disneyland, they will evaluate
their visiting experience and may recommend that their friends and relatives go to Disneyland, or
otherwise, spread positive or negative WoM.
Obtaining brand experience, therefore, is a continuous process during which consumers
receive brand information, products, service, visual and audio stimuli, and other brand-related
attributes, digest and evaluate them in their ways, and then change or maintain their patronage or
recommendation behaviour according to their experience. It is apparent that subjectivity and self-
perception are unneglectable in the formation of customers’ perception of brand experience. As
Brakus et al. (2009, p. 53) defined, brand experience means the “subjective, internal consumer
responses (sensations, feelings, and cognition) and behavioural responses evoked by brand-related
stimuli that are part of a brand's design and identity, packaging, communications, and
environments.” Some brand experience is temporary and short-lived; others are long-lasting. In the

33
latter case, consumers can quickly collect a brand from their memory. Therefore their behavioural
responses tend to be more brand related (Brakus et al., 2009). Figure 3 uses customer journal
mapping to delineate some key customer touch points that usually occurs in three stages of tourist
experience: pre-travel, travel, and post-travel.
Figure 3: TouchPoints in Tourists’ Pre-Travel, Travel, and Post-Travel Brand Experience
2.4.2.1.2 Conceptualizations and sequential stages of brand loyalty.
Brand loyalty, a stream of relationship marketing research, has received extensive attention
for decades. Social psychologists, business researchers, and tourism and leisure scholars have all
tried to address what loyalty is and what its precursors are (e.g., Pritchard, Howard, & Havitz, 1992).
Crosby and Taylor’s (1983) theory of psychological commitment serves as one of the building
blocks of many subsequent explorations of loyalty conceptualization. According to this theory,
psychological commitment indicates the inclination to resist change responding to inconsistent or
incompatible experience or information (Crosby & Taylor, 1983). Two conditions can maximize
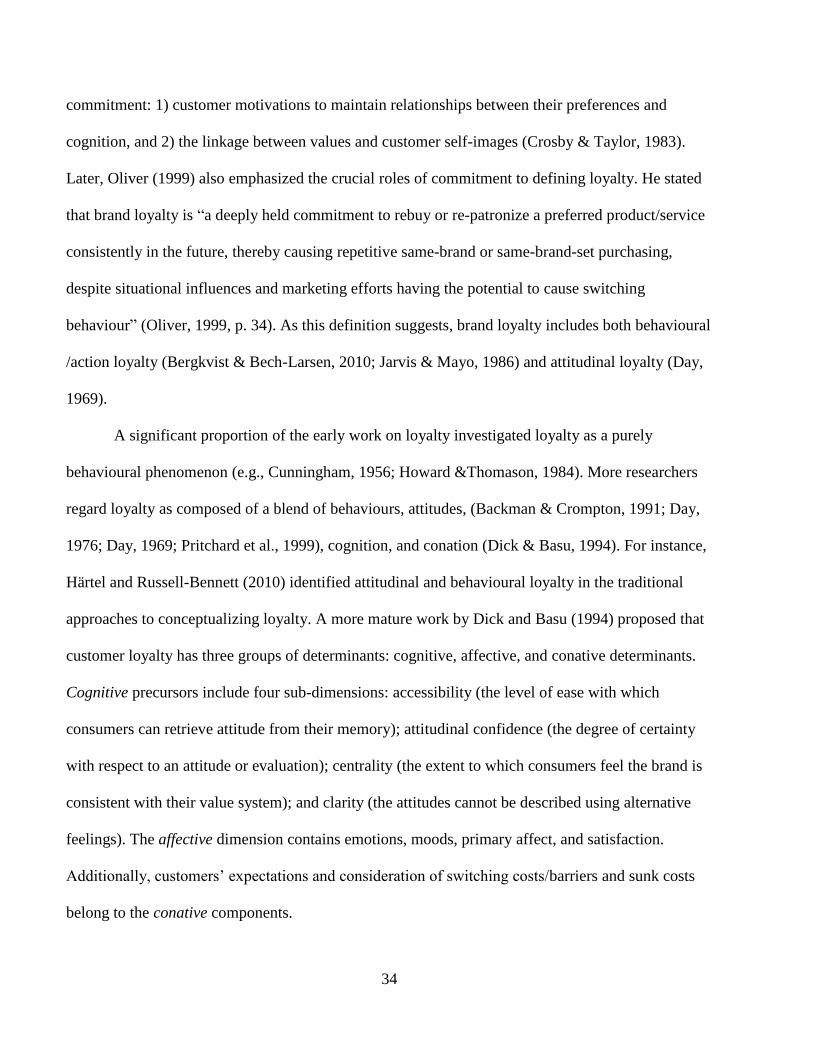
34
commitment: 1) customer motivations to maintain relationships between their preferences and
cognition, and 2) the linkage between values and customer self-images (Crosby & Taylor, 1983).
Later, Oliver (1999) also emphasized the crucial roles of commitment to defining loyalty. He stated
that brand loyalty is “a deeply held commitment to rebuy or re-patronize a preferred product/service
consistently in the future, thereby causing repetitive same-brand or same-brand-set purchasing,
despite situational influences and marketing efforts having the potential to cause switching
behaviour” (Oliver, 1999, p. 34). As this definition suggests, brand loyalty includes both behavioural
/action loyalty (Bergkvist & Bech-Larsen, 2010; Jarvis & Mayo, 1986) and attitudinal loyalty (Day,
1969).
A significant proportion of the early work on loyalty investigated loyalty as a purely
behavioural phenomenon (e.g., Cunningham, 1956; Howard &Thomason, 1984). More researchers
regard loyalty as composed of a blend of behaviours, attitudes, (Backman & Crompton, 1991; Day,
1976; Day, 1969; Pritchard et al., 1999), cognition, and conation (Dick & Basu, 1994). For instance,
Härtel and Russell-Bennett (2010) identified attitudinal and behavioural loyalty in the traditional
approaches to conceptualizing loyalty. A more mature work by Dick and Basu (1994) proposed that
customer loyalty has three groups of determinants: cognitive, affective, and conative determinants.
Cognitive precursors include four sub-dimensions: accessibility (the level of ease with which
consumers can retrieve attitude from their memory); attitudinal confidence (the degree of certainty
with respect to an attitude or evaluation); centrality (the extent to which consumers feel the brand is
consistent with their value system); and clarity (the attitudes cannot be described using alternative
feelings). The affective dimension contains emotions, moods, primary affect, and satisfaction.
Additionally, customers’ expectations and consideration of switching costs/barriers and sunk costs
belong to the conative components.

35
Oliver (1997; 1999) regarded loyalty as a procedural formation following the stages of
“cognition-affect-conation” (Oliver, 1999, p. 35). In other words, loyalty should be conceived as a
causal chain or sequential development starting with cognitions and affections and ending with
conations and behaviours (Oliver, 1997). Consumers can become loyal at each of the three stages,
albeit the mechanisms of the three loyalty phases differ. Oliver (1997; 1999) argued that consumers
“become loyal in a cognitive sense first, then later in an affective sense, still later in a conative
manner, and finally in a behavioural manner” (Oliver, 1999, p. 35). Customer satisfaction is an
antecedent of overall customer loyalty or different loyalty dimensions. For example, Back and Parks
(2003), in their studies of hotel customers in North Carolina, reported that customer satisfaction
positively influenced cognitive brand loyalty in a significant manner.
Even though brand loyalty is a multi-stage construct that entails multivariate measurements,
theories of brand loyalty differ in many perspectives. One critical perspective is by differentiating
the number of stages of brand loyalty. Sheth and Park (1974) hypothesized a vector of seven
different types of brand loyalty based upon the combinations of different types of loyalty:
1) Behavioural brand loyalty (one-dimensional), which only bears the behavioural
dimension;
2) Behavioural-evaluative brand loyalty (two-dimensional);
3) Behavioural-emotive brand loyalty (two-dimensional);
4) Behavioural-evaluative-emotive brand loyalty (three-dimensional);
5) Evaluative brand loyalty (one-dimensional);
6) Evaluative-emotive brand loyalty (two-dimensional); and
7) Emotive brand loyalty (one-dimensional)
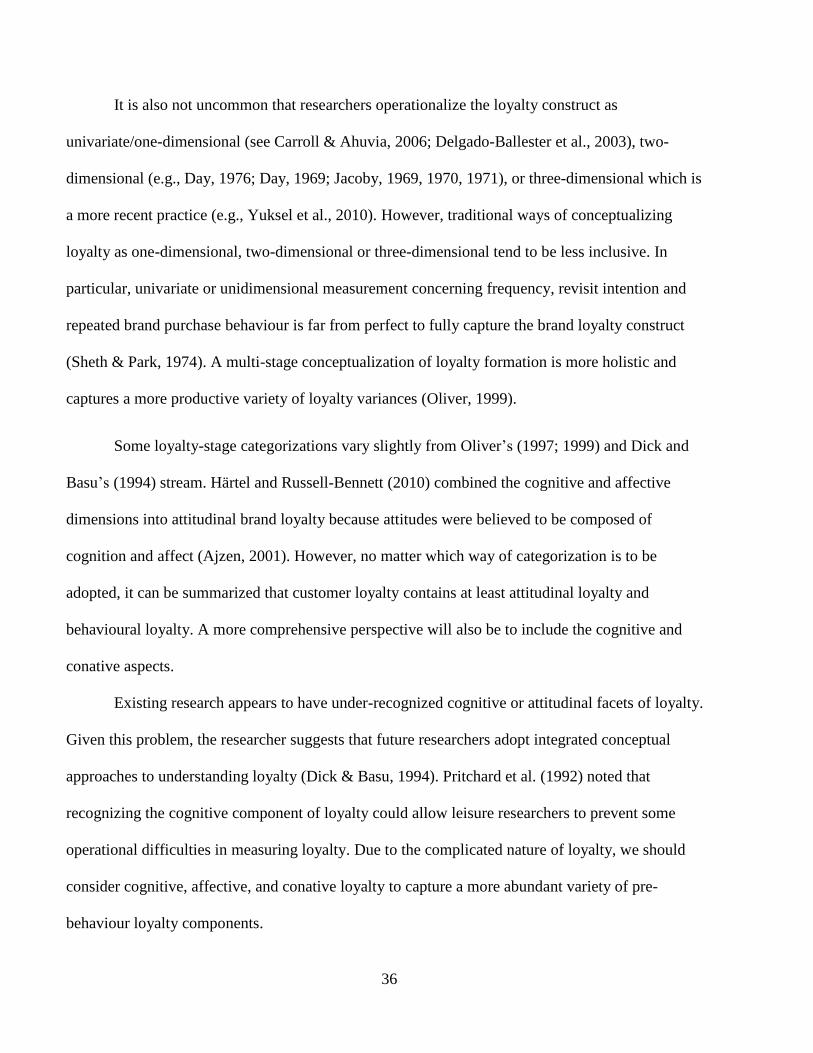
36
It is also not uncommon that researchers operationalize the loyalty construct as
univariate/one-dimensional (see Carroll & Ahuvia, 2006; Delgado-Ballester et al., 2003), two-
dimensional (e.g., Day, 1976; Day, 1969; Jacoby, 1969, 1970, 1971), or three-dimensional which is
a more recent practice (e.g., Yuksel et al., 2010). However, traditional ways of conceptualizing
loyalty as one-dimensional, two-dimensional or three-dimensional tend to be less inclusive. In
particular, univariate or unidimensional measurement concerning frequency, revisit intention and
repeated brand purchase behaviour is far from perfect to fully capture the brand loyalty construct
(Sheth & Park, 1974). A multi-stage conceptualization of loyalty formation is more holistic and
captures a more productive variety of loyalty variances (Oliver, 1999).
Some loyalty-stage categorizations vary slightly from Oliver’s (1997; 1999) and Dick and
Basu’s (1994) stream. Härtel and Russell-Bennett (2010) combined the cognitive and affective
dimensions into attitudinal brand loyalty because attitudes were believed to be composed of
cognition and affect (Ajzen, 2001). However, no matter which way of categorization is to be
adopted, it can be summarized that customer loyalty contains at least attitudinal loyalty and
behavioural loyalty. A more comprehensive perspective will also be to include the cognitive and
conative aspects.
Existing research appears to have under-recognized cognitive or attitudinal facets of loyalty.
Given this problem, the researcher suggests that future researchers adopt integrated conceptual
approaches to understanding loyalty (Dick & Basu, 1994). Pritchard et al. (1992) noted that
recognizing the cognitive component of loyalty could allow leisure researchers to prevent some
operational difficulties in measuring loyalty. Due to the complicated nature of loyalty, we should
consider cognitive, affective, and conative loyalty to capture a more abundant variety of pre-
behaviour loyalty components.

37
In the contexts of tourism destinations, Konecnik and Gartner (2007, p. 403) identified three
significant constituents of tourism destination’s brand image as cognitive, affective, and conative,
which further lead to destination brand equity. These three constituents of destination image are, in
no small extent, consistent with cognitive loyalty, attitudinal loyalty, and conative loyalty:
“The cognitive component constitutes awareness: what someone knows or
thinks they know about a destination. The affective component is based on
how one feels about this knowledge. The conative component is the action
step: how one acts on the information and how they feel about it (a
destination)” (Konecnik & Gartner, 2007, p. 403).
The next section discusses sequential stages of loyalty. The synthesis of literature on four
sequential stages provides the necessary basis for understanding loyalty’s procedural formation. The
psychological mechanisms of loyalty formation, such as volitional choices (or freedom to choose,
autonomy) (Kiesler, 1971), brand identification (Albert & Merunka, 2013; Pritchard et al., 1999),
and self-brand congruency (Batra et al., 2012) lie at the very core of consumer commitment (Kiesler,
1971; Pritchard et al., 1999), and they signify a necessary condition for attitudes to develop
(Pritchard et al., 1999; Shamir, 1988).
2.4.2.1.3 Loyalty stage one: cognitive loyalty
As the earliest phase of loyalty development, cognitive loyalty rests on shallow and vicarious
brand knowledge or recently acquired experience-based information (Oliver, 1999). Briefly
speaking, it rests on the information offered to consumers, for example, price, and the ratio of the
price paid and the benefit received (Evanschitzky & Wunderlich, 2006). It refers to “the existence of
beliefs that (typically) a brand is preferable to others” (Harris & Goode, 2004, p. 141). This
preliminary stage of loyalty is weak and non-stable; its depth is relatively shallow (Oliver, 1999).
Therefore, customers who are only cognitively loyal are easy to switch to other brands
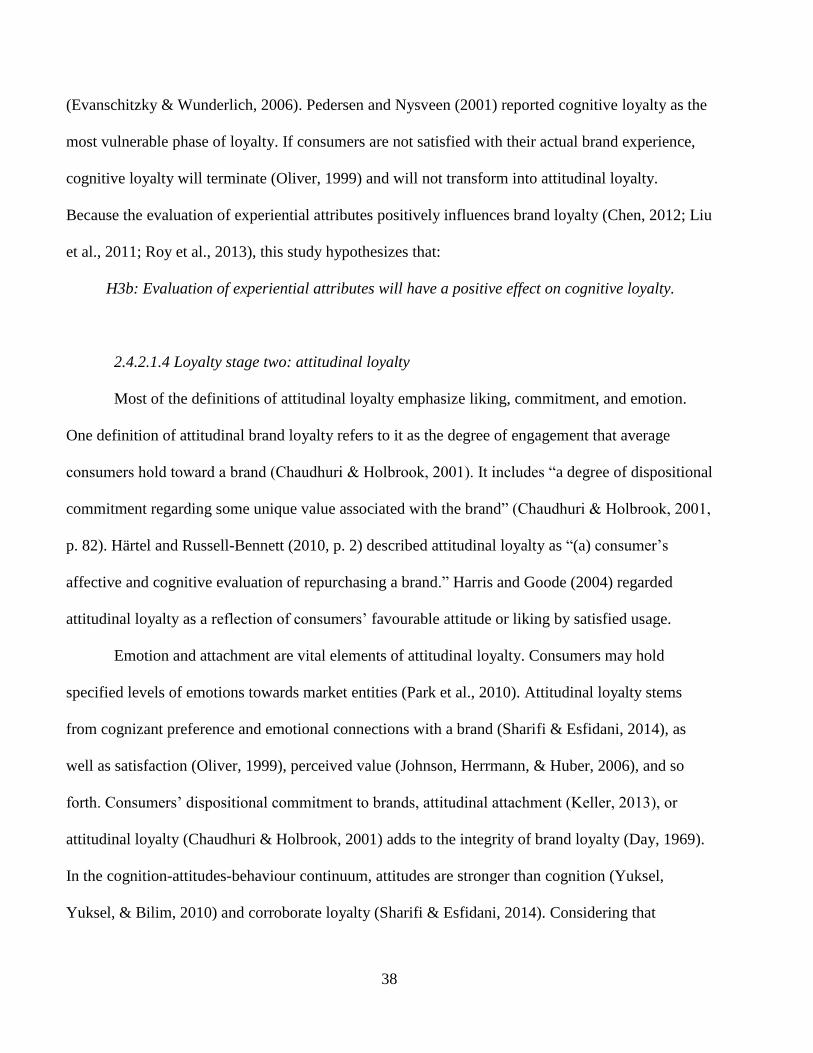
38
(Evanschitzky & Wunderlich, 2006). Pedersen and Nysveen (2001) reported cognitive loyalty as the
most vulnerable phase of loyalty. If consumers are not satisfied with their actual brand experience,
cognitive loyalty will terminate (Oliver, 1999) and will not transform into attitudinal loyalty.
Because the evaluation of experiential attributes positively influences brand loyalty (Chen, 2012; Liu
et al., 2011; Roy et al., 2013), this study hypothesizes that:
H3b: Evaluation of experiential attributes will have a positive effect on cognitive loyalty.
2.4.2.1.4 Loyalty stage two: attitudinal loyalty
Most of the definitions of attitudinal loyalty emphasize liking, commitment, and emotion.
One definition of attitudinal brand loyalty refers to it as the degree of engagement that average
consumers hold toward a brand (Chaudhuri & Holbrook, 2001). It includes “a degree of dispositional
commitment regarding some unique value associated with the brand” (Chaudhuri & Holbrook, 2001,
p. 82). Härtel and Russell-Bennett (2010, p. 2) described attitudinal loyalty as “(a) consumer’s
affective and cognitive evaluation of repurchasing a brand.” Harris and Goode (2004) regarded
attitudinal loyalty as a reflection of consumers’ favourable attitude or liking by satisfied usage.
Emotion and attachment are vital elements of attitudinal loyalty. Consumers may hold
specified levels of emotions towards market entities (Park et al., 2010). Attitudinal loyalty stems
from cognizant preference and emotional connections with a brand (Sharifi & Esfidani, 2014), as
well as satisfaction (Oliver, 1999), perceived value (Johnson, Herrmann, & Huber, 2006), and so
forth. Consumers’ dispositional commitment to brands, attitudinal attachment (Keller, 2013), or
attitudinal loyalty (Chaudhuri & Holbrook, 2001) adds to the integrity of brand loyalty (Day, 1969).
In the cognition-attitudes-behaviour continuum, attitudes are stronger than cognition (Yuksel,
Yuksel, & Bilim, 2010) and corroborate loyalty (Sharifi & Esfidani, 2014). Considering that

39
attitudinal loyalty is based on satisfaction and perceptions (Johnson et al., 2006; Roy et al., 2013),
this study posits that:
H3c: Evaluation of experiential attributes will have a positive effect on attitudinal loyalty.
2.4.2.1.5 Loyalty stage three: conative loyalty
Despite its importance, conative loyalty has not drawn much attention in tourism research. It
means the development of intentions and characterizes more profound commitment (Harris &
Goode, 2004). Conative loyalty happens after attitudinal loyalty. By becoming conatively and
behaviourally loyal, a customer can finally become truly loyal (Oliver, 1997). Customers’
expectations and consideration of switching costs/barriers and sunk costs constitute conative loyalty
(Dick & Basu, 1994).
Switching costs arise from changing from one brand to another (Bowen & Shoemaker, 1998)
and can mean both monetary (e.g., loss of mileage points) and non-monetary costs (e.g., frustration
from terminating membership and the cognitive costs to get used to another brand) (Dick & Basu,
1994). To save on costs, customers tend to maintain relatively certain relationships with some brands
(Heide & Weiss, 1995). Those who perceive high switching costs would prefer to remain loyalty
despite being dissatisfied (Gruen & Ferguson, 1994). A few studies suggested a moderating role of
switching cost in the relationships between perceived quality, satisfaction, and loyalty (e.g., Heide &
Weiss, 1995). However, Back and Lee (2009) explored switching costs’ moderating effects in the
country club members’ satisfaction–loyalty relationship but concluded that switching cost’s
moderating effect was insignificant.
Another reason leading to conative loyalty is the consideration of sunk costs. Sunk costs, also
called stranded costs, refer to “costs that have been incurred and cannot be recovered” (Park & Jang,

40
2014, p. 426). They can mean money, effort, or time Arkes and Blumer (1985). According to (Arkes
& Blumer, 1985), the sunk cost effects indicate that customers tend to maintain an existing
endeavour once they make an initial investment of money, effort or time. Park and Jang (2014)
extended the concept of sunk cost to tourist travel cancellation research. They found that temporal
sunk costs might transfer into monetary sunk costs.
Moreover, the higher the temporal and monetary sunk costs are, the less likely that tourists
will cancel a travel product. This study treats conative loyalty as a key sub-dimension of destination
brand loyalty. It assumes that the evaluation of experiential attributes will affect conative loyalty:
H3d: Evaluation of experiential attributes will have a positive effect on conative loyalty.
Considering that the development of brand loyalty features sequential stages, this dissertation
hypothesizes that:
Hloy1: Cognitive loyalty will have a positive effect on attitudinal loyalty.
Hloy2: Attitudinal loyalty will have a positive effect on conative loyalty.
Brand love is one of the CBR constructs that precedes brand loyalty (e.g., Albert & Merunka,
2013; Batra et al., 2012; Lee & Hyun, 2016), WoM (Batra et al., 2012; Carroll & Ahuvia, 2006), and
customer resistance (Batra et al., 2012). It should be noted that cognitive, attitudinal, and conative
loyalty should all be incorporated in loyalty measurement (Baldinger & Rubinson, 1996). Keller
(2013) and Roy et al. (2013) indicated that awareness and customer feelings (for instance,
satisfaction) both lead to customer loyalty. Lee et al. (2007) and Yuksel et al. (2010) further reported
that high tourist satisfaction and positive emotional and cognitive bonds with a particular destination
lead to actual repeat visits to this place. Based on the above literature, this research hypothesizes that
destination brand love would positively influence different stages of loyalty.

41
H4a: Destination brand love will have a positive effect on cognitive loyalty.
H4b: Destination brand love will have a positive effect on attitudinal loyalty.
H4c: Destination brand love will have a positive effect on conative loyalty.
2.4.2.2 Perceived happiness.
As “a global assessment of a person’s quality of life” (Shin & Johnson, 1978, p. 478),
happiness relates to frequent positive affect, infrequent negative affect, and high life satisfaction
(Lyubomirsky, Sheldon, & Schkade, 2015). Happiness is a central criterion of positive life
(Lyubomirsky et al., 2005) and it ties closely into subjective well-being (SWB) and quality of life
(QoL). Although the conceptualization and empirical studies on happiness rest mainly in positive
phycology, scholars from a wide range of other disciplines, for instance, economics, marketing, and
leisure and tourism, have paid extensive to the research on perceived happiness (e.g., Desmeules,
2002; Filep & Deery, 2010; Lyubomirsky et al., 2005).
Previous economists tended to measure happiness using economic growth, personal welfare,
and “revealed preferences,” such as actual choices and decisions (Kahneman & Krueger, 2006, p. 3).
A traditional economic measure of happiness considers GDP per capita, income level, or social
status (e.g., Fuchs, 1983). Nevertheless, this method failed to explain the fundamental connections
between income increase and happiness; therefore, it appears to be incomplete or inappropriate. For
example, according to Easterlin’s (1974) documentation, although people in the United States
enjoyed significant income growth, their perceived happiness did not increase. Therefore, economy
or income levels do not necessarily increase synchronously with happiness (Binswanger, 2006;
Blanchflower & Oswald, 2000; Easterlin, 2005), partly because people may suffer from more time
pressure when the economy grows.
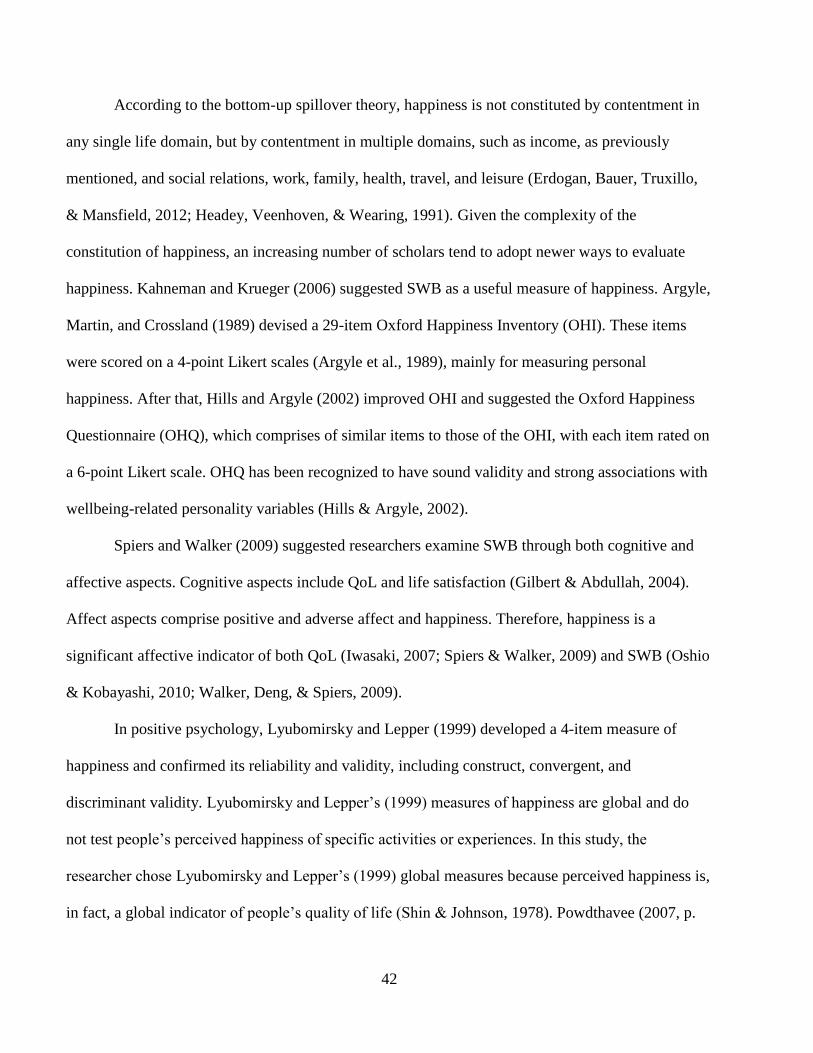
42
According to the bottom-up spillover theory, happiness is not constituted by contentment in
any single life domain, but by contentment in multiple domains, such as income, as previously
mentioned, and social relations, work, family, health, travel, and leisure (Erdogan, Bauer, Truxillo,
& Mansfield, 2012; Headey, Veenhoven, & Wearing, 1991). Given the complexity of the
constitution of happiness, an increasing number of scholars tend to adopt newer ways to evaluate
happiness. Kahneman and Krueger (2006) suggested SWB as a useful measure of happiness. Argyle,
Martin, and Crossland (1989) devised a 29-item Oxford Happiness Inventory (OHI). These items
were scored on a 4-point Likert scales (Argyle et al., 1989), mainly for measuring personal
happiness. After that, Hills and Argyle (2002) improved OHI and suggested the Oxford Happiness
Questionnaire (OHQ), which comprises of similar items to those of the OHI, with each item rated on
a 6-point Likert scale. OHQ has been recognized to have sound validity and strong associations with
wellbeing-related personality variables (Hills & Argyle, 2002).
Spiers and Walker (2009) suggested researchers examine SWB through both cognitive and
affective aspects. Cognitive aspects include QoL and life satisfaction (Gilbert & Abdullah, 2004).
Affect aspects comprise positive and adverse affect and happiness. Therefore, happiness is a
significant affective indicator of both QoL (Iwasaki, 2007; Spiers & Walker, 2009) and SWB (Oshio
& Kobayashi, 2010; Walker, Deng, & Spiers, 2009).
In positive psychology, Lyubomirsky and Lepper (1999) developed a 4-item measure of
happiness and confirmed its reliability and validity, including construct, convergent, and
discriminant validity. Lyubomirsky and Lepper’s (1999) measures of happiness are global and do
not test people’s perceived happiness of specific activities or experiences. In this study, the
researcher chose Lyubomirsky and Lepper’s (1999) global measures because perceived happiness is,
in fact, a global indicator of people’s quality of life (Shin & Johnson, 1978). Powdthavee (2007, p.

43
55) defined happiness as “the degree of how one views one’s life as a whole, or some particular
domain of one’s life, as favourable.” Many existing surveys of happiness use global measures as
well. For example, according to Powdthavee (2007), the World Values Survey adopts the following
single-item question to ask about people’s perceived happiness: ‘Taken all together, how happy
would you say you are: very happy, quite happy, not very happy, not at all happy?” Lyubomirsky
and Lepper’s (1999) measures of happiness add to the abundance of happiness research and have
been widely cited and adopted by subsequent researchers (Furnham & Cheng, 2000). Indeed, from a
practical standpoint, measures of global happiness might be important to Disney marketers who may
strive to live up to claims of being the “happiest place on earth.”
Recently, tourist happiness has been a topic of increasing relevance to tourism studies,
practice, and promotions. Considering that tourists and the general population differ in many aspects,
a clear-cut definition of tourist happiness is required. Filep (2014) argued that any conceptualization
of tourist happiness should encompass evaluations of pre-travel, travel, and post-travel experiences.
He adopted a full journey tourist-experience perspective and defined tourist happiness as “a
psychological state of fulfillment and well-being that is experienced in anticipatory, on-site, and
reflective travel phases” (Filep, 2014, p. 266). “Tourists’ happiness is a state in which the tourist
experiences positive emotions (joy, interest, contentment, and love), is engaged in and derives
meaning from holiday activities.” (Filep & Deery, 2010, p. 399). Because travel enhances well-being
(McCabe & Johnson, 2013), tourism researchers have used the SWB theory to conceptualize and
measure tourist happiness.
Existing literature suggests some links between brand love and happiness. Positive
psychologist Seligman (2011) proposed the PERMA model to explain what we need to do to be
happy. This model maintains that five essential elements—positive emotions, engagement, positive

44
relationships, meaning, and accomplishment/achievement—should be in a position to create lasting
happiness (Seligman, 2011). Positive emotion denotes the crucial first element, and it includes love,
pleasure, relaxation, excitement, and curiosity (Filep & Deery, 2010; Seligman, 2011). Filep and
Deery (2010, p. 407) further noted that tourist happiness is about having “positive emotions,
engagement, and meaning,” and a tourist may be happy if he or she experiences the three qualities.
Because positive emotion is a fundamental element of the brand love prototype (Batra et al., 2012),
this study hypothesizes that destination brand love positively impacts tourist happiness.
H5a: Destination brand love will have a positive effect on the perceived happiness of
visitors.
2.4.2.3 Family togetherness.
The word family originates from the Latin word “familia” which denotes household. How to
define the concept of family is of great significance because it influences not only socio-cultural
values but also social policy-making and legislation of a country. Historically, traditional (same-sex)
spousal and biological relations play essential roles in the legal definition of family (Bala &
Bromwich, 2002). “The rigid familial ideal was permanent, monogamous, married, nuclear,
heterosexual and Christian, and had clearly defined gender roles” (Bala & Bromwich, 2002, p. 148).
Patterson (1996) maintained that family comprises firstly, parents and siblings in one’s family of
origin, and secondly, spouse and children.
The concept of family has evolved dramatically from merely meaning heterosexual marriage,
biological parent-child relationships, and relatives to recognizing other significant “close personal
adult relationships” (Bala & Bromwich, 2002, p. 145). Recent views of what constitutes a family
expand considerably to become more inclusive, recognizing various dynamic representations of

45
family. The Law Commission of Canada, for example, accepts more inclusive formats of family,
such as phycological, same-sex and non-marital co-habitant family. According to Bala and
Bromwich (2002), in Canada, unmarried cohabitants and homosexual spouses in continuing
relationships have also obtained rights and obligations of being families. For the purpose of this
dissertation, the researcher regards family as either a nuclear family, which means a unit where two
individuals live alone by themselves or with their dependent daughters or sons in the same
household, or a traditional extended family where another adult lives with the married couple
(Senturk, Abas, Berksun, & Stewart, 2011).
No matter its type, family’s core meaning remains unchanged over the years: family denotes
a unit, something beyond a group of individuals or a collection of relationships, and an individual
can belong to it (McCarthy, 2012). In other words, family represents togetherness, belonging,
closeness, shared memories, care and support, emotions and ideas, and so on (Gillies, Ribbens,
McCarthy, & Holland, 2001; Jallinoja, 2008; McCarthy, 2012; Richards, 1990). Gillies et al. (2001)
reported that youngsters aged between 16 and 18 and their parents repeatedly mentioned the words
togetherness and closeness throughout their discussions on families. Phrases used frequently include
“living together,” “doing things together,” “going out together,” “sticking together,” and “pulling
together” (Gillies et al., 2001, p. 26). Williams and Anthony (2015) used the term family
togetherness to assess the sense of emotional closeness and bonding within families. More
importantly, family togetherness has been found to contribute to positive family relationships which
eventually lead to enhanced well-being (Williams & Anthony, 2015).
The human desire for togetherness and belonging is a part of natural needs (Ryan & Deci,
2000). Family togetherness is also a vital tourist motivation that ties to fundamental needs. Yoon and
Uysal’s (2005) exploratory factor analysis (EFA) suggested that family togetherness is a push travel

46
motivation that significantly impacts travel satisfaction and destination loyalty. A wide range of
travel experiences can fulfill the need for family cohesion (Crompton, 1979; Kim & Eves, 2012;
Yoon & Uysal, 2005). These experiences include, for instance, attending festivals and events
(Formica & Uysal, 1998; Lee et al., 2004; Uysal, Gahan, & Martin, 1993) and taking family
vacations (Shaw, Havitz, & Delemere, 2008). Family vacations play unneglectable roles in the social
construction of families (Shaw et al., 2008).
Travel provides chances for families to escape from their mundane and stressful daily lives
and engages in authentic activities jointly (Shaw et al., 2008). Therefore, travel or visiting
experiences function as valuable opportunities to foster family closeness and communication, mainly
through memories created during family vacation experiences (Shaw et al., 2008). Notably, in travel
settings, different demographic groups view the importance of family togetherness distinctively. Lee
et al. (2004), in their study of Expo attendees, concluded that the motivation of family togetherness
was stronger among married people than singles.
From a positive psychological perspective, positive emotion is one of the antecedents of
memorable tourism experiences that will strengthen family togetherness (Chandralal & Valenzuela,
2013; Shaw et al., 2008). Because destination brand love represents such positive affect as
excitement, relaxation, pleasure, and deep liking (Batra et al., 2012), this research posits that
destination brand love positively influences family togetherness.
H5b: Destination brand love will have a positive effect on family togetherness.
2.4.3 The mediating effects of destination brand love.
Existing literature has suggested the mediating role of the construct destination brand love in a
series of relationships (Table 3). Based upon related literature on satisfaction’s influences on

47
destination brand love and the latter’s impacts on cognitive, attitudinal, and conative loyalty, this
study also hypothesizes that destination brand love mediates the relationships between the evaluation
of experiential attributes and the four stages of loyalty. The researcher put forward the following
hypotheses:
H6a: Destination brand love mediates the direct relationship between the evaluation of
experiential attributes and cognitive loyalty.
H6b: Destination brand love mediates the direct relationship between the evaluation of
experiential attributes and attitudinal loyalty.
H6c: Destination brand love mediates the direct relationship between the evaluation of
experiential attributes and conative loyalty.

48
Table 3: Brand Love’s Mediating Roles in Recent Studies
Year Author(s) Brand love mediates the
relationship between:
Research Context/Sample
2013 Albert & Merunka brand global identification and
willingness to pay a price
premium
Two survey-based studies
with undergraduate
students at an Australian
University
2013 Albert & Merunka brand global identification and
WoM
Two survey-based studies
with undergraduate
2013 Albert & Merunka brand global identification and
brand commitment
students at an Australian
University
2013 Albert & Merunka brand trust and willingness to
pay a price premium
Two survey-based studies
with undergraduate
2013 Albert & Merunka brand trust and brand
commitment
students at an Australian
University
2010 Bergkvist & Bech-
Larsen
brand identification and brand
loyalty
Two survey-based studies
with undergraduate
2010 Bergkvist & Bech-
Larsen
brand identification and active
engagement
students at an Australian
University
2012 Ismail & Spinelli brand image and WoM fashion brands among
young consumers
2006 Carroll & Ahuvia Hedonic product and WoM
2006 Carroll & Ahuvia Hedonic product and brand
loyalty
white-non-Hispanic adult
consumers
2006 Carroll & Ahuvia Self-expressive brand and
WoM
white-non-Hispanic adult
consumers
2006 Carroll & Ahuvia Self-expressive brand and
brand loyalty
white-non-Hispanic adult
consumers
2013 Roy et al. Satisfaction and loyalty Research propositions based
on a literature review
2013 Roy et al. Romanticism and loyalty Research propositions based
on a literature review
2013 Roy et al. Brand experience and loyalty Research propositions based
on a literature review
2013 Roy et al. Consumer delight and loyalty Research propositions based
on a literature review
2013 Roy et al. Materialism and loyalty Research propositions based
on a literature review
2013 Roy et al. Satisfaction and WoM Research propositions based
on a literature review
2013 Roy et al. Romanticism and WoM Research propositions based
on a literature review
2013 Roy et al. Brand experience and WoM Research propositions based
on a literature review

49
2013 Roy et al. Consumer delight and WoM Research propositions based
on a literature review
2013 Roy et al. Materialism and WoM Research propositions based
on a literature review
2013 Roy et al. Self-congruity and loyalty Research propositions based
on a literature review
2013 Roy et al. Self-congruity and WoM Research propositions based
on a literature review
2.4.4 Moderating effects of selected demographic and trip characteristics.
Demographic and socio-cultural characteristics are essential criteria for market segmentation.
Accurate identification and explanation of the influences of demographic and trip-specific
characteristics on visitor perceptions and behaviours can produce valuable insights into travel market
segmentation. Therefore, to help DMOs understand different market segmentation of visitors at
Shanghai Disneyland and develop related product and service strategies, it is necessary to examine
the influence of sample’s demographic and trip information on visitor perceptions and behaviours.
Demographic and trip-specific characteristics may all moderate relationships between visitor
perceptions and visitor behaviours (e.g., Sung, Morrison, Hong, & O’Leary, 2001). Although
empirical studies have examined Oliver’s (1997) four-stage loyalty conceptualization, the issue of
moderator variables in the relationships between the evaluation of experiential attributes and four
sequential stages of loyalty has been largely under-investigated. The present study aims to analyze
the moderating effects of demographic and trip-related characteristics, including expenditures at the
resort, on selected visitor perceptions and behaviours.
50
2.4.4.1 Income.
Income is an important determinant of household and recreation expenditures (Dardis, Derrick,
Lehfeld, & Wolfe, 1981; Fish & Waggle, 1996). In the travel context, income also forecasts travel-
related family decision makings (Fish & Waggle, 1996). Previous studies have found that current
income impacts a series of family travel and vacation behaviors, such as tourism participation (Boo,
1990), the type of vacation trips chosen (Sung et al., 2001), the number of vacation trips a family
would take (Fish & Waggle, 1996), and the amount of money a family would spend per trip (Fish &
Waggle, 1996).
Income also has unneglectable effects on personal psychological state and family togetherness.
Albrecht, Bahr, and Goodman (1983) indicated that low-income is one of the critical stressors of
married life. A family’s financial ability is a prominent factor to maintain family resilience, which
means “the successful coping of family members under adversity that enables them to flourish with
warmth, support, and cohesion” (Black & Lobo, 2008, p. 33). Thoits and Hannan (1979), in their
study of US families, found that an increase in or stabilization of income could enhance individuals’
ability to manage life crises and therefore decrease psychological distress. Psychological distress, in
turn, also associates significantly with family togetherness (Rivera, Guarnaccia, Mulvaney-Day, Lin,
Torres, & Alegria, 2008). This study expects that a relatively low income could trigger
psychological distress to visitors, thereby creating potential family conflicts or incoherency. On the
contrary, a relatively high income could function as a buffer against visitors’ life stress, eventually
enhancing family togetherness. Considering that destination brand love represents a positive state of
mind which is opposite to psychological distress, this study hypothesizes that:

51
H7a: Income moderates the link between destination brand love and family togetherness
significantly; specifically, the relationship between destination brand love and family togetherness is
weaker for high-income visitors and stronger for low-income visitors.
2.4.4.2 First-timers versus repeat visitors
The extent to which destination brand love influences loyalty may vary between first-timers
and repeat visitors. First-time visitors behave differently from repeat visitors in many aspects. First-
timers and repeat visitors tend to visit different attractions, hold different emotional connections with
destinations and show distinct destination loyalty (e.g., Caber, 2015). First-timers are likely to visit
more attractions, seek excitement, variety, and alternative destinations, spend more on lodging, and
be more active.
On the contrary, repeat visitors tend to visit fewer attractions, seek familiarity and relaxation,
spend more on entertainment and recreation, be more passive, and show stronger intention to
recommend and re-purchase (Caber, 2015; Shani, Reichel, & Croes, 2012; Fallon & Schofield, 2003;
Oppermann, 1997). Repeat visitors represent a highly attractive market segment that is cost-effective
and tends to require less destination knowledge and behave more favourably for destinations. Based
on these findings and the theoretical reasoning outlined above, the researcher assumed that:
H7b_1: First-timers versus repeat visitors moderates the link between visitors’ evaluation of
experiential attributes and cognitive loyalty; specifically, the relationship between visitors’
evaluation of experiential attributes and cognitive loyalty is weaker for first-timers and stronger for
repeat visitors.
52
H7b_2: First-timers versus repeat visitors moderates the link between visitors’ evaluation of
experiential attributes and attitudinal loyalty; specifically, the relationship between visitors’
evaluation of experiential attributes and attitudinal loyalty is weaker for first-timers and stronger for
repeat visitors.
H7b_3: First-timers versus repeat visitors moderates the link between visitors’ evaluation of
experiential attributes and conative loyalty; specifically, the relationship between visitors’
evaluation of experiential attributes and conative loyalty is weaker for first-timers and stronger for
repeat visitors.
As a summary, this dissertation proposed a total of 20 hypotheses (Table 4). The researcher
tested each hypothesis using survey data from visitors who visited the Shanghai Disney Resort, a
newly opened theme park in the municipality of Shanghai, China.

53
Table 4: Research Hypotheses in This Study
General Hypotheses
H1 Destination brand awareness will have a positive effect on destination brand love.
H2 Destination brand trust will have a positive effect on destination brand love.
H3a Evaluation of experiential attributes will have a positive effect on destination brand love.
H3b Evaluation of experiential attributes will have a positive effect on cognitive loyalty.
H3c Evaluation of experiential attributes will have a positive effect on attitudinal loyalty.
H3d Evaluation of experiential attributes will have a positive effect on conative loyalty.
H4a Destination brand love will have a positive effect on cognitive loyalty.
H4b Destination brand love will have a positive effect on attitudinal loyalty.
H4c Destination brand love will have a positive effect on conative loyalty.
H5a Destination brand love will have a positive effect on the perceived happiness of visitors.
H5b Destination brand love will have a positive effect on family togetherness
Hloy1: Cognitive loyalty will have a positive effect on attitudinal loyalty.
Hloy2: Attitudinal loyalty will have a positive effect on conative loyalty.
Mediation Hypotheses
H6a Destination brand love mediates the direct relationship between the evaluation of
experiential attributes and cognitive loyalty.
H6b Destination brand love mediates the direct relationship between the evaluation of
experiential attributes and attitudinal loyalty.
H6c Destination brand love mediates the direct relationship between the evaluation of
experiential attributes and conative loyalty.
Moderation Hypotheses
H7a Income moderates the link between destination brand love and family togetherness
significantly; specifically, the relationship between destination brand love and family
togetherness is weaker for high-income visitors and stronger for low-income visitors.
H7b_1 First-timers versus repeat visitors moderates the link between visitors’ evaluation of
experiential attributes and cognitive loyalty; specifically, the relationship between
visitors’ evaluation of experiential attributes and cognitive loyalty is weaker for first-
timers and stronger for repeat visitors.
H7b_2 First-timers versus repeat visitors moderates the link between visitors’ evaluation of
experiential attributes and attitudinal loyalty; specifically, the relationship between
visitors’ evaluation of experiential attributes and attitudinal loyalty is weaker for first-
timers and stronger for repeat visitors.
H7b_3 First-timers versus repeat visitors moderates the link between visitors’ evaluation of
experiential attributes and conative loyalty; specifically, the relationship between visitors’
evaluation of experiential attributes and conative loyalty is weaker for first-timers and
stronger for repeat visitors.

54
2.5 Tourism Destinations
Notwithstanding much academic efforts devoted to destination research, to date, no
consensus on a widely applicable definition of “tourism destination” has been reached. Rather,
various ways of defining tourism destinations exist. Tourism destination has been conceptualized as
an amalgam of interconnecting supply companies/institutions and various tangible products and
intangible services provided in a geographic location to which tourists are willing to travel to
(Framke, 2002; Murphy, Pritchard, & Smith, 2000, based on Pearce, 1989; Snepenger, Snepenger,
Dalbey, & Wessol, 2007). For instance, Bornhorst, Ritchie, and Sheehan (2010, p. 572), in their
exploration of the constitution of tourism success, viewed destination as “a geographical region
which contains a sufficiently critical mass or cluster of attractions so as to be capable of providing
tourists with visitation experiences that attract them to the destination for tourism purposes”.
Tourists overcome spatial limitations, distance, and transportation in the pursuit of travel. The
products and services offered at destinations represent a broad range of contact and interaction points
in the tourism industry chain that contributes to overall visitation experiences. Providing tourism
experiences is one significant role of tourism (Bornhorst et al., 2010).
Usually regarded as outcomes of tourist experiences, tourist emotions occur during or after
discreet episodes at diversified tourist-destination contact points. These emotions stem from a
complicated set of relationships between stakeholders at both ends of the demand (e.g., tourists) and
supply (e.g., airlines, hotels) chain. Brand love is one of the emotional outcomes generated by
travelling experiences at branded destinations.
Bornhorst et al.’s (2010) definition of tourism destination alluded to the multi-level
characteristics of destinations confined by factors such as geographic boundaries and juristic entities
(e.g., country, state/province, municipality). Tourist destinations are brands themselves (Boo et al.,

55
2009). Destination brands can refer to brands at a broad range of geographical levels: country,
province/state, region, city, tourist attraction, and even specific sites, for instance, temples, civic
buildings, memorials, and dark tourism’s disaster sites (see Figure 4). In recent years, “branding a
destination” has grown into a big research stream among tourism scholars. For countries as brands,
Shimp, Samiee, and Madden (1993) adopted the concept “country equity” to explain the emotional
values that consumers associate with country brands. For cities as brands, consumers may attach
romance or luxury to fashion brands made in France, good quality or reliability to cars made in
Germany, and poor quality or lack of durability to souvenirs or small items made in Myanmar
(Kotler & Gertner, 2002). A prime example of provinces/states as brands is that, in 2008, the tourism
bureau of the Shandong province in eastern China established a provincial tourism brand—
“Friendly Shandong” to denote the Confucian idiom “It is always a great pleasure
to greet friends from afar!” A full series of brand logos, symbols, catchphrases, and slogans
expressing “friendliness” were designed for both national and international tourism marketing
promotion activities. At the city/region level, Gartner, Tasci, and So (2007) studied strategies of
branding Macao as a tourist destination. The Hong Kong Tourist Board positioned Hong Kong’s
destination brand as “Asia’s World City” and promised travellers that “every moment is a different
world’ here.” In similar ways, the town of Alta in Norway is themed as “the City of Northern
Lights,” where tourists can “hunt” the Northern Lights and enjoy a full range of hotel and souvenir
store services (Viken & Granås, 2014).

56
Figure 4: Different Levels of Tourism Destination Brands
No matter which level a destination brand belongs to, it is always necessary to design, build,
and manage it using appropriate branding strategies. However, not every branding theory/concept is
entirely applicable to destination situations.
2.6 International Theme Parks as Destination Brands
2.6.1 A brief history of theme park development.
Different from pure leisure and recreation that requires hardly any monetary spending, theme
parks are manifestations of consumerist leisure and cultural creation (Clavé, 2007). Theme parks

57
were first introduced in the 1950s and quickly become icons of the newest form of recreation space
use (Clavé, 2007). The predecessors of contemporary theme parks are believed to be traditional
amusement parks and European pleasure gardens (Clavé, 2007). Amusement parks have been
recognized to indicate “solidly part[s] of the national experience as a pleasure of the multitudes, and
has been many things to many people — escape, fantasy, otherworldliness, illusion, drama, total
theater, spectacle; a safety zone of enjoyment, absurdity and release from the habits, norms and rules
of everyday life”.
The origins of American amusement parks can be traced back to the sixteenth century in
Europe, first in France where people build public sports facilities and recreation gardens for
entertainment, and then in Great Britain following the industrial revolution in the 18th century
(Samuelson & Yegoiants, 2001). However, although American theme parks’ roots may be in the
European recreation gardens, they are different from European gardens (Samuelson & Yegoiants,
2001). Nowadays, the US theme park industry has reached maturity (Wong & Cheung, 1999).
Disneyland has been in successful operation for 50 years since 1955, and Six Flags has also grown
into the world’s largest amusement park.
At the other side of the world, almost 20 years ago, Wong and Cheung (1999) were
optimistic about the Asian theme park market and predicted that Asia would be the next leading
theme park market following the US and Europe. Nowadays, Singapore’s Universal Studios, South
Korea’s Samsung Everland, Hong Kong’s Disneyland and Ocean Park, and Tokyo’s Disneyland
have all experienced rapid growth. Contemporary theme parks seek to facilitate visitor experiences
in almost every step of park operation (Milman, 2010) from greeting customers, costumed
performances, to staged shows and services. Theme parks represent not only tourist attractions but
58
also reflect certain geographical and socio-cultural spatial entities that construct society (Clavé,
2007).
2.6.2 Conceptualizations and characteristics of theme parks.
Academia has historically avoided defining theme parks (Clavé, 2007), possibly due to the
significant similarity of theme parks with many other similar park formats (e.g., recreational parks
and amusement parks). Thach and Axinn (1994) noted that people in 1990s tend to associate theme
parks with “permanence, gardened park-like settings, and single price admission” (p. 51) and regard
Disney World, Six Flags, and Great America as amusement parks.
Finding a universal definition that applies to all kinds of theme parks also appears to be
impractical. Existing definitions of theme parks tend to be incomplete or even inaccurate (Clavé,
2007), even though much academic endeavour has been made to clarify parks’ theming and
visitation motivations (e.g., Wong & Cheung, 1999). Coltier (1985, p. 24) referred to a theme park
as “a closed universe whose purpose is to succeed in the encounter between the dreamy atmosphere
it creates and the visitors’ desire for dépaysement” (a French word meaning a change of
scenery/view). This very generic definition touched on the key elements of atmosphere and escapism
from normal life later noted by (Clavé, 2007), but failed to capture any particular characteristics of
theme parks. Meanwhile, this definition did not take into consideration the diverse types of theme
parks. From the practitioners’ perspective, the International Association of Amusement Parks and
Attractions (IAAPA) described theme parks as “an amusement park that has themed attractions, be it
food, costumes, entertainment, retail stores, and rides.” Nevertheless, this technical definition
neglected the atmospheric and experiential sphere of theme parks, which are in fact at the center of
visitor experiences. This definition indicates that theme parks are also amusement parks, while the

59
essential difference lies in that the former has got themed areas and attractions which the latter may
not have.
Instead of working towards the terminological standardization of theme parks, Mills (1990)
attributed such distinguishing features as technological wonders and magnificent buildings to theme
parks. Referring to Mills (1990) and various definitions, Clavé (2007) listed 12 essential
characteristics that differentiate theme parks from similar park formats:
1) A thematic identity;
2) One or more themed areas;
3) Organized as closed areas and with controlled access;
4) Capacity to attract families;
5) Enough rides, movement, and activities to occupy visitors for an average of 5 to 7 hours;
6) Atmospheric quality used to enhance entertainment value;
7) Commercial stores, food, beverage;
8) High investment;
9) High service quality, product quality, and cleanliness-maintenance levels;
10) Centrally-managed productive and consumer processes;
11) Technology incorporated as much as possible;
12) Single admission system, although exceptions do exist
2.6.3 Disneyland: A strong theme park brand
Customers influence the future trajectory of the theme park industry (Milman, 2001).
Customers’ awareness, imagery, feelings, judgments, and brand resonance are important building

60
blocks of strong brand equity (Keller, 2013). Disneyland is no exception. Disneyland cares about
customers’ feelings and has also conducted customer feelings studies to investigate how customers
feel about and evaluate the brand (Keller, 2013). Keller (2013), in his branding textbook, chose
Disneyland as an illustration of successful brands.
Disney’s Brand Mantra is “fun family entertainment,” with fun as the emotional modifier to
emphasize the emotional value of the brand, family as the descriptive value to indicate who the
brand is most fundamentally for, and entertainment as the brand function. This brand mantra aims to
inform Disney’s customers, employees, and external marketing cooperators what the Disney brand
is, therefore helping them make decisions accordingly. Disney’s customer-oriented brand strategies
also indicate that establishing strong CBRs are critical towards building strong brand equity.
61
Chapter Three: Methodology
The methodology is the rationale for the methods chosen and design of research, serving as a
connecting link between theory (macro theories) and methods. Philosophical paradigms and
theoretical perspectives inform and legitimate methodology and methods whereby research topics
can be studied (Crotty, 1998; 2003). This study adopts a post-positivist perspective and involves
both exploratory and confirmatory aspects. Six sections constitute the methodology chapter: Study
Context (3.1); Data Collection Procedures (3.2); Measures (3.3); Pilot Test (3.4); Back translation
(3.5); Data Analysis (3.6); and Common Method Variance (3.7).
Regarding research ethics, the researcher did not ask participants to discuss any sensitive
matter, such as financial constraints or traumatic experiences, therefore minimizing the emotional
risk to participants. There were also no physiological and psychological risks involved. There were
no physical injuries. Besides, the participants did not pay any participation fee, so there was no
economic risk as well.
3.1 Study Context: Shanghai Disney Resort.
Shanghai Disney Resort was opened to the public on June 16, 2016. According to the
information released by the Shanghai Disney Resort official website
(https://www.shanghaidisneyresort.com/en/destinations/theme-park/), the resort includes Shanghai
Disneyland, a Disney town, a large retail, dining, and entertainment venue, the Wishing Star Park,
two themed Disney hotels (the Shanghai Disneyland Hotel, a luxurious and high-end hotel, and the
Toy Story hotel, a family-oriented and budget hotel), and other themed recreation facilities. The
whole site covers approximately 390 hectares (963 acres) in Pudong new district, Shanghai. The size
is almost three times that of Hong Kong Disneyland. Shanghai Disneyland consists of six lands:

62
Mickey Avenue, Gardens of Imagination, Fantasyland, Adventure Isle, Treasure Cove, and
Tomorrowland. It has the world’s largest Disney castle—Enchanted Storybook Castle. The whole
resort aims to provide both individual and family visitors recreational experiences full of fun,
fantasy, and innovation. As the newest Disney resort around the world, the third Disneyland in Asia,
and the first one in mainland China, Shanghai Disney Resort serves as an ideal context for studying
tourists’ destination brand love, brand loyalty, and their perceived happiness and family togetherness
that could be enhanced by visiting experiences. Considering the uniqueness of the Shanghai Disney
Resort, this study chose the Shanghai Disney Resort as the study context.
There are multiple transportation means by which visitors can get to the resort. Shanghai
Metro Line 11 is a line that connects the two main airports and two main railway stations. Its
terminal station is the Disney Resort station. This line provides convenient and fast access to Disney
Resort by running a train every a few minutes. Moreover, Disney Resort shuttles offer free ways of
transportation to get hotel guests to park areas. Public buses (Pudong Bus Line 50/51/52), taxis, and
car parking space are also available.
3.2 Data Collection Procedures
3.2.1 Sampling plan.
The data collection method was on-site surveys using convenience sampling. The process of
recruiting on-site investigators involved selecting five undergraduate students as student helpers.
They all majored in Social Science at the Fudan University, which is a high-ranking comprehensive
university in mainland China. The researcher followed the following investigator-selecting criteria:
1) the student helper should be in good standing in their areas of studies and extracurricular
activities; 2) the student helper must have conducted on-site social science research before; 3) the

63
student helper is expected to be diligent and responsible. It is preferable that they could have a one-
page recommendation letter from one of their course instructors or professors. After selecting the
five student helpers, the researcher invited them to a two-hour orientation meeting in Shanghai, in
which the researcher introduced the study, finalized daily survey target and logistics schedules, and
guided them through a role play exercise. The researcher also explained specific issues to be paid
attention to during the actual survey to be happening, e.g., techniques to avoid uncompleted answers.
Table 5 displays the specific on-site sampling plan. The researcher chose three locations for
conducting the survey. The first location, Starbucks in Shanghai Disneytown, has huge customer
flow and therefore is an excellent place to approach visitors. The second location, the Food Republic
in Shanghai Disneytown, is a casual dining food hall with many small restaurants. It is an ideal place
to collect the data because of the diverse demographic characteristics of the visitors there. The
researcher approached respondents when they were taking a break or waiting for their food. The
third location, BreadTalk, is a western style bakery brand with in-store tables and seats for customers
use. Many visitors stop by there to buy breakfast, light lunch or dinner meal, making it an ideal
location to conduct the survey.
Table 5: On-site Sampling Plan
Locations Sampling Method
Starbucks in Shanghai Disneytown convenience sampling
Food Republic in Shanghai Disneytown convenience sampling
BreadTalk in Shanghai Disneytown convenience sampling
To fulfill the aims of this research, the investigators engaged a recruitment process and began
with a series of screening questions. Specifically, after getting the consent of potential respondents to
participate in the survey, the investigators started with a series of screening questions. The

64
investigators asked if the participant: is 18 years or older (only those who are 18 years or older may
proceed with the study); has not completed this study previously (only those who indicate no may
proceed with the study), and has not been told anything about this study from another person. Only
those who indicate “No” proceeded. The investigators thanked those who did not fulfill any of the
screening criteria for their time and attention.
After obtaining the oral consent of potential respondents, the investigators delivered self-
administered paperback questionnaires to those who did fulfill all the selection criteria. The
investigators also explained the purpose and aims of the study, informed participants that
participation is entirely voluntary, and all data will remain confidential and anonymous. Respondents
may choose to stop participating in the survey at any point. In the case of multiple family members
visiting together, the investigators only invited the person with the closest birthday to the survey date
to fill out the questionnaire. At the end of the study, the researchers thanked respondents for their
participation and gave them each a thank-you gift valued at RMB 5.00.
In January 2017, the researcher distributed 550 questionnaires at three locations in Shanghai
Disneytown using convenience sampling. The three locations are Starbucks, Food Republic, and
BreadTalk in Shanghai Disneytown. None of these locations required admission tickets.
Approximately 20 respondents refused to participate in this survey for reasons of inconvenient
timing, for example, in a rush to re-enter the park area after a quick lunch or having a young kid to
look after. A total of 24 questionnaires were either uncompleted or blank, creating a response rate of
95.63%. Finally, the researcher collected 526 complete and valid questionnaires, among which 427
respondents (81.2%) visited with family members to Shanghai Disney resort at the time of the
survey. There were 99 respondents (18.8%) who did not visit with family members. This dissertation
only used the 427 sample who visited with their families.

65
Krejcie and Morgan’s (1970) sample-size table provides useful guidelines for determining a
sample size from a given population. This chart applies to any defined population (Krejcie &
Morgan, 1970) and previous researchers have extensively used it (e.g., Zarandian, Shalbafian, Ryan,
& Bidokhti, 2016). According to this method, a sample size of 384 is required to represent a
population of 1,000,000 or more. Stevens (1996) further suggested that a sample of at least 400 is
necessary to avoid misspecification errors. Therefore, the sample size 427 is ideal for the study
purpose.
3.2.2 Questionnaire structure.
The questionnaire (Appendix II) in this study contains both open-ended questions and close-
ended questions, and covers the following sections:
1) Experience with the destination. Open-ended questions will get the data on the number of
times the respondents have been to Shanghai and whether they have visited the Shanghai
Disney Resort, with the latter issue being a screening question;
2) Previous exposure to the global Disney brand as a whole, including whether they have
watched Disney movies, purchased retail merchandise, visited other Disneyland or
resorts, and travelled on Disney cruises;
3) Experiences with the Shanghai Disney Resort. The researcher will test visitor experiences
by asking when they first heard of Shanghai Disney Resort, their familiarity with it, their
overall feelings of it, and all the questions about the latent variables in the theoretical
framework
4) Respondent information, which includes demographic data and the rough amount of
money spent during their entire trip and in the park area.
66
3.3 Measures
The researcher adapted measures of each latent construct in the conceptual model based on
well-established items from existing tourism, marketing, and psychology literature. Particular
attention was paid to ensure that the measures reflect the case of Shanghai Disney Resort, as it is the
study context chosen for this research.
Brand awareness. The researcher revised the five 7-point click-button brand awareness
scales developed by Oh (2000). Oh (2010) verified the brand awareness items in the context of
upscale (well-known brands, e.g., Marriott and Motel 6) and budget-economy (relatively unknown,
e.g., Central Park Hotel and Roadside Motel) lodging markets. Oh (2000) worded his five questions
as the brand name XYZ is……“Very unfamiliar” to “Very familiar”, “Not known at all” to “Very
well known”, “Not visible at all” to “Very visible”, “Never heard of” to “Heard of a lot”, and “Not
famous at all” to “Very famous”. To make all items consistent in the way that 1 stands for “Strongly
Disagree” and 7 stands for “Strongly Agree”, the researcher revised all of the five items into 7-point
Likert scales where 1 means “Strongly Disagree” and 7 means “Strongly Agree” to measure the
brand awareness of the global Disney brand. Sample items include “I am very familiar with the
Disney brand” and “this brand is well known.”
Brand Trust. This study adapted Hess’s (1995) brand trust scales to make them reflect the
theme park visitation context. Regardless of the variety of consumer brand trust scales available
(e.g., Chaudhuri & Holbrook 2001), no consensus exists on the measurement items for brand trust
(Brudvig, 2015). Hess’s (1995) original brand trust scales are 5-point Likert scales where 1=totally
disagree, and 5=totally agree. His scales are amongst the most widely adopted, and many researchers
have verified these scales’ reliability and validity (e.g., Delgado-Ballester, 2004). Hess’s (1999)
Cronbach’s alpha testing results showed the satisfying internal consistency reliability of these scales.

67
Hess (1999) also conducted CFA, and the results supported the overall validity of the measurement
model consisting of these scales.
There has been a large body of research on how rating scale format may or may not affect
scale validity and reliability (Dawes, 2008). Five- or seven-point formats are the most common in
marketing and tourism research (Dawes, 2008; Naresh & Mark, 2006). There exist many merits
using 7-point scales over with 5-point Likert scales. Firstly, from the perspective of researchers, 7-
point Likert scales can help researchers capture a more abundant variety of information on a
particular research topic. 7-point Likert scales provide more accurate measures of participants’ true
evaluations (Finstad, 2010). The more variability that Likert scales entail, the more heterogeneous
respondent answers will be. Secondly, from the perspective of respondents, 7-point Likert scales
make it possible for respondents to choose more variations (i.e., 2, 3, 5, 6) around extreme points
(i.e., 1, 7) and the midpoint (i.e., 4). Therefore, respondents have more options to choose in order to
express their true thoughts. The midpoint is crucial because it lies at “the heart of the relationship
between awareness, effort and validity in Likert response” (Johns, 2005, p. 240). Researchers should
make Likert scales midpoints available for survey respondents when the survey is on obscure topics,
where many respondents will have no basis for choice (Johns, 2005). Thirdly, from the perspective
of the immediate memory ability of human minds, Miller (1956) suggested seven categories in
Likert scales are the best for people to memorize. Miller (1956, p. 91) argued that “there is a finite
span of immediate memory and that for a lot of different kinds of test materials this span is about
seven items in length.” Fourthly, a review of the literature indicates that 7-point Likert scales
generate optimized validity and reliability (Preston & Colman, 2000; Symonds, 1924). Validity
increases with growing numbers of scale points or response categories (e.g., Chang, 1994; Hancock
& Klockars, 1991). The use of seven categories can maximize the reliability of scores (e.g., Finn,

68
1972; Miller, 1956; Nunnally, 1967; Ramsay, 1973; Symonds, 1924). Also, internal consistency is
the highest for rating scales with seven or more points (Preston & Colman, 2000). Considering these
advantages that 7-point scales hold over 5-point ones, the researcher chose to adopt 7-point scales
for this dissertation.
Furthermore, even though it is not rare that a single tourism study adopts both 5-point and 7-
point Likert scales (e.g., Baloglu & Mangaloglu, 2001), the inconsistency of response categories
may cause respondent confusion (Principles of Questionnaire Construction, 1998). To avoid
ambiguity and to make items all consistent in the way that 1=1 = strongly disagree and 7 = strongly
agree, the researcher modified Hess’s (1995) scales from 5-point to 7-point Likert scale items (1 =
strongly disagree; 7 = strongly agree). Sample items of brand trust include “Most of what Disney
says about it is true” and “When I see a Disney advertisement, I believe that the information in it is
accurate.” All the brand trust scales showed satisfying reliability and validity, as shown in Chapter
Three.
Evaluation of experiential attributes. The researcher adapted items under the construct
evaluation of experiential attributes from Chi and Qu’s (2008) destination attribute satisfaction
scales. Chi and Qu (2008) established a set of 33 7-point (1 =very dissatisfied; 7 = very satisfied)
scales to evaluate tourist satisfaction with specific attributes. In an EFA analysis in which they
confirmed the reliability and validity of these scales, they found that all items fell under seven
factors: shopping, activities and events, lodging, accessibility, attractions, environment, and dining.
According to Chi and Qu (2008), the Cronbach’s alphas of these 33 items were robust, ranging from
0.85 to 0.91, indicating high internal consistency among the manifest indicators under each
dimension.
69
In this dissertation, the researcher selected a total of 12 representative scales from each of the
seven factors (shopping, activities and events, lodging, accessibility, attractions, environment, and
dining) to measure visitor evaluation of experiential attributes. These 12 scales are the most
representative of and most relevant to the context of the Shanghai Disney Resort. To make these 12
items consistent with other items, the researcher revised the 7-point into 1= strongly disagree, and 7=
strongly agree. Sample items include “please indicate the extent to which you agree with the
following statement: the price for activities and events is reasonable” and “please indicate the extent
to which you agree with the following statement: the service is friendly.”
There are a few reasons why the researcher selected 12 scales from Chi and Qu’s (2008) 33
scales. Firstly, the researcher aimed to strike to balance between lowering respondent fatigue and
collecting accurate and sufficient information. Many questions in a particular questionnaire will
create respondent fatigue and thus will deteriorate the quality of the data and the reliability and
validity of the results. Respondent fatigue happens when survey participants become tired of the
survey questions and survey task; as a result, their attention and motivation decreases towards later
sections of a questionnaire (Ben-Nun, 2008). The best way to avoid or reduce respondent fatigue is
to avoid using too-long questionnaires (Ben-Nun, 2008). Secondly, these 12 scales reflect visitor
experiences in the research context (Shanghai Disney Resort) very well. Those unselected scales
appear less related to the research context. For example, one of Chi and Qu’s (2008) scale is “variety
of spa/massage/healing options.” This scale is unrelated to visitor experiences in the research context
of this study because visitors go to Shanghai Disney not for spa or wellness treatments.
Destination brand love. The brand-love scales developed by Batra et al. (2012) encompass
56 items. Bagozzi, Batra, and Ahuvia (2014) developed three sets of scaled-down measures based on
Batra et al. (2012): the multi-factor scales (26 items); the single-factor scales (13 items); and the
70
short scales (6 items) (see Appendix I: Brand Love Scales). This study adapted Bagozzi et al.’s
(2014) and Batra et al.’s (2012) brand love scales. Batra et al. (2012) conducted EFA and SEM and
finally established a first-order structural model of the brand love prototype, which generated
sufficient composite construct reliability (>0.7), discriminant validity, and nomological validity. All
items are 7-point Likert scales (1 = strongly disagree; 7 = strongly agree). Representative statements
include “Shanghai Disney Resort makes me relaxed” and “My overall feelings/evaluations towards
Shanghai Disney Resort are positive.”
Family togetherness. For this dissertation, the researcher regards family as either a nuclear
family, which means a unit where two individuals live alone by themselves or with their dependent
children in the same household, or a traditional extended family where another adult lives with the
married couple (Senturk et al., 2011). Family togetherness was measured using 7-point Likert scale
items (1 = strongly disagree; 7 = strongly agree) adapted from Lee et al. (2004) and Williams and
Anthony (2015). Lee et al.’s (2004) structural equation modelling (SEM) analysis of Expo attendees’
motivations established four items to measure family togetherness, such as “to increase blood
kinship” and “to spend time with my family together.” Williams and Anthony’s (2015) testing of a
cross-sectional model of positive family and peer relationships validated their items. Yoon and Uysal
(2005) also used CFA in LISREL to confirm the reliability and validity of their items. For example,
the factor loadings of the three family togetherness items ranged from 0.48 to 0.74. In this study,
some sample statements of family togetherness include responses to “I thought the entire family
enjoyed the visiting experience at Shanghai Disney Resort” and “our family kinship was increased.”
Perceived happiness. Perceived happiness was measured using 7-point Likert scale items
from Lyubomirsky and Lepper (1999), who developed four 7-point Likert scale measures of global
subjective happiness and validated them in 14 studies (including longitudinal studies) with a total of
71
2,732 participants. In these 14 studies, the internal consistency among the four items ranged from
0.79 to 0.94 (M = 0.86) and test-retest reliability ranged from 0.55 to 0.90 (M= 0.72) (Lyubomirsky
& Lepper, 1999). Their finalized Subjective Happiness Scale (SHS) measures people’ sense of
global happiness by taking the mean of four items rated on 7-point Likert scales; it has been tested
and shown test-retest reliability of 0.72 and internal consistency of 0.86 (Lyubomirsky & Lepper,
1999). The correlations between these four items were between 0.52 and 0.72, showing a sound level
of convergent validity.
To test tourist perceived happiness, the researcher adopted Lyubomirsky and Lepper’s (1999)
four 7-point subjective happiness scales (1 means less happy, 7 means happier) and kept them as
measured by 7 points. The researcher revised these items’ response format slightly, making one
stand for strongly disagree, and seven for strongly agree to make them consistent with items under
other constructs. Sample measures include “Compared to most of my peers, I am a happy person”
and “in general, I consider myself a very happy person.”
Destination brand loyalty. Destination brand loyalty in this dissertation is composed of
cognitive, attitudinal, and conative loyalty. The 7-point Likert scale items (1 = strongly disagree; 7 =
strongly agree) measuring destination brand loyalty were revised from Yuksel et al. (2010), which
rested upon Back (2005) and Back and Parks (2003). The Cronbach’s alpha values of Yuksel et al.’s
(2010) items ranged from 0.78 to 0.88, surpassing the threshold of 0.7 (Hair et al., 1995). Therefore
all the items are satisfactorily reliable. Additionally, Yuksel et al. (2010) also conducted CFA and
provided evidence supporting item convergent validity and discriminant validity. In this study, three
items will be used to test each sub-dimension of destination brand loyalty. Sample items include “It
provided me with more good experiences than other places” and “I felt better when I stayed here.”

72
In summary, all constructs in this dissertation were measured using 7-point Likert scales
where one means “Strongly Disagree,” four means “Neither Disagree or Agree,” and seven means
“Strongly Agree.” Appendix IV (Original and Modified Measures) provides explicit details
regarding how various individual measurement items were modified and which items were dropped
and why.
3.4 Pilot Test
The pilot test aims to verify the reliability and validity of the selected measurement items in
the contexts of Disney parks. Three graduate students and two professors in recreation and leisure
studies evaluated the face validity of all adapted items. The researcher incorporated their opinions on
measure revisions, adding, and dropping. The researcher paid special attention when adapting brand
love items in the tourism context. After that, the researcher surveyed a total of 61 Chinese visitors
who had been to Shanghai Disneyland in December 2016 using convenience sampling and snowball
sampling. Considering that in December 2016 the Shanghai Disneyland was only in business for no
more than five months, snowball sampling is an appropriate method to use acquaintances to find the
right sample source. The researcher firstly asked people in her social networks whether they have
been to Shanghai Disneyland. People who have been to were invited to fill out a paperback pilot
study questionnaire. The researcher informed respondents the survey purposes and procedure and
emphasized that participation is out of free will. All the data was kept confidential and anonymous.
Those who completed the survey received a 5-RMB supermarket coupon as a thank-you gift. After
that, the researcher invited these respondents to provide a list of contact of their acquaintances who
also had already visited Shanghai Disneyland. The next step involved contacting the people on this
list, informing them of the study purposes, and inviting them to participate in either a paper survey

73
or an electronic survey out of free will. Consequently, the researcher obtained a total of 61 valid
responses through the paper and electronic questionnaires for the analysis in the pilot study.
The researcher tested the reliability and validity of the pilot data using 1) Cronbach’s α of all
measurement items and all latent constructs (Nunnally, 1978); and 2) composite reliability (pc) for
each construct (Fornell & Larcker, 1981). The overall Cronbach’s α of all the measurement items
turned to be 0.964. The composite reliability (pc) of brand awareness, brand trust, evaluation of
experiential attributes, and destination brand love were 0.813, 0.926, 0.810, and 0.957 respectively.
The composite reliability (pc) of perceived happiness, family togetherness, cognitive loyalty,
attitudinal loyalty, and conative loyalty turned out to be 0.820, 0.857, 0.918, 0.882, and 0.907
respectively. Hair et al. (2014) recommended the cut-off point of 0.708 for composite reliability (pc).
Therefore, all latent constructs generated satisfactory composite reliability (pc).
One indicator under the construct of perceived happiness (11_4: I am generally not very
happy. Although I am not depressed, I seldom seem as happy as I might be) was initially reversely
coded with one standing for Strongly Disagree and seven standing for Strongly Agree. After
reversely coding this indicator to make it consistent with other indicators in this study, the researcher
found that this indicator’s factor loading with its corresponding construct was 0.392, below the
acceptable range of 0.400 to 0.700 (Hair et al., 2014). Hair et al. (2014, p. 103) suggested that
“indicators with very low outer loading (below 0.4) should, however, always be eliminated from the
scale (Hair, Ringle, & Sarstedt, 2011).” Accordingly, the researcher removed indicator 11_4 (I am
generally not very happy. Although I am not depressed, I seldom seem as happy as I might be) from
the main survey questionnaire. After that, all indicators met the recommending criterion of 0.70
regarding factor loading (Nunnally, 1978; Bagozzi, 1980).
74
3.5 Back-translation
Because all measures adopted in this study were initially in English, back-translating the
measures into Chinese is necessary. Most of the visitors at Shanghai Disney Resort speak and read
Chinese, but a small percentage of visitors are foreigners living or working in Shanghai. Therefore,
the researcher printed 30 copies of English questionnaires in case some foreign visitors are also
willing to participate in this survey.
The researcher adopted Brislin’s (1970) back-translation approach to ensure the language
equivalence. The process involved recruiting a translation panel of two bilingual (English and
Simplified Chinese) researchers: the author herself and one of her Ph.D. classmates who had not
seen the original indicators and the questionnaire. The author herself translated the questionnaire
from English to Chinese, and her classmate translated the questionnaire back from Chinese to
English. Then the author read the two versions of English questionnaires for comparison. After
several rounds of comparisons and minor revisions, the two English questionnaires turned out to be
virtually identical. Consequently, the back-translated Chinese questionnaire and the English
questionnaire were ready to be used in the following research stages.
Furthermore, the researcher also translated all the documents in the research ethics
application package from English to Chinese. These materials include 1) the information letter and
consent form; 2) the recruitment letter; 3) the online and on-site verbal scripts, and 4) the feedback
and appreciation letter. Another Ph.D. student from the same department as the researcher helped
check the language consistency and the correctness of the translation.

75
3.6 Data Analysis Method
3.6.1 PLS-SEM and Reflective Measurement Model
In the primary survey data analysis step, the researcher employed SPSS 22.0 and SmartPLS
3.0 for descriptive statistics analysis (e.g., frequencies, cross-tabulations) and exploratory analysis
(e.g., EFA). To test the measurement model, all the hypotheses, and the structural relationships
between the latent constructs, the researcher conducted a Partial Least Square Structural Equation
Modelling (PLS-SEM) in SmartPLS 3.0.
Two types of models have been distinguished in research using SEM: covariance-based SEM
(CB-SEM), also called common factor SEM, and variance-based structural equation modelling (VB-
SEM), also known as PLS-SEM. Historically, CB-SEM is an earlier form of SEM, and it was until
1980 that Word (1980) created PLS as a not-interchangeable bur rather complementary approach to
CB-SEM. Researchers should choose the type of SEM depending on a series of factors, such as:
1) whether the research model comprises common elements or composites (Henseler,
Hubona, & Ray, 2016);
2) the estimation objective (Hair, Hult, Ringle, Sarstedt, & Thiele, 2017) (predictive vs.
explanatory);
3) model complexity (small to moderate complexity vs. all kinds of model complexity)
(Hair et al., 2017);
4) measurement model specification (the model contains only reflective constructs vs.
the model contains both reflective and composite constructs) (Hair et al., 2017);
5) data distributional assumptions (normal distribution required vs. no normal
distribution assumption made) (Hair et al., 2017);
76
6) the relationships among the observed indicators (Baumann, Elliott, & Hamin, 2011, p.
252);
7) the direction of causality between the construct and indicators (Baumann et al., 2011,
p. 252); and
8) a theoretical judgment (Baumann et al., 2011, p. 252)
However, determining whether a construct is formative or reflective it is not always easy and
straightforward. For example, academia has seen emerging and complex debate on whether brand
loyalty is a formative or reflective construct (e.g., Baumann, et al., 2011). The nature of a conceptual
model, either formative or reflective, could be rooted in many theoretical and empirical aspects
(Coltman, Devinney, Midgley, & Venaik, 2008). Baumann et al. (2011, p. 252) summarized
previous work (e.g., Coltman et al., 2008; Jarvis, MacKenzie, & Podsakoff, 2003; Wilcox, Howell,
& Breivik, 2008) and noted that to determine whether a model is formative or reflective, researchers
should consider the following four aspects: the nature of the construct, relationships between
indicators, direction of causality, and theoretical judgment.
In PLS-SEM, measurement models mean outer models (Hair et al., 2014). Inner models
display path relationships while outer models depict relationships between latent constructs and their
corresponding manifest indicators. The traditional approach to SEM tends to be reflective modelling
(Baumann et al., 2011), nevertheless, increasingly more scholars have noted that this reflective
approach is not always suitable for all model types (e.g., Petter, Straub, & Rai, 2007) and it is
necessary for researchers to differentiate between reflective and formative models and adopt
respective model analytical programs and tools.

77
There exist two types of measurement models in PLS-SEM: reflective and formative
measurement models. A construct’s nature of being formative or reflective determines the analytical
program to choose, the analytical steps, and the reliability and validity indices to report (e.g., Hair et
al., 2014). Testing the validity of a formative construct differs from that of a reflective construct.
What to report for measurement model analysis is also different. Therefore, it is imperative to make
it clear the formative or reflective nature of both constructs and the theoretical framework of a study
in the early research design stage.
Hair et al. (2014, p. 92) differentiated formative models from reflective ones by stating that
“a reflective measurement model has relationships from the latent variable to its indicators……and
formative measurement models have relationships from the indicators to the latent variable.” Figure
5 presents the directionality of relationships between constructs and indicators for these two types of
models.
Source: http://www.rasch.org/rmt/rmt221d.htm
Figure 5: The Directionality of Relationships between Constructs and Indicators

78
Jarvis, MacKenzie, and Podsakoff (2003) explained the distinctions between reflective and
composite models in a detailed manner. The principle factor model has been the more commonly
used type so far, but composite-based SEM models have gained momentum to the equal number or
even outnumber principle factor models since 1990s (Hair et al., 2017). In principle factor models,
the directionality of causal action moves from the latent constructs (also called latent variables or
factors, see Wong, 2013) to the manifest indicators (also called measurement items or measures).
That said, latent constructs impact manifest indicators and the co-variation among them (Jarvis et al.,
2003). Manipulation of the latent constructs produces alterations in manifest indicators. Therefore,
Fornell and Bookstein (1982) referred to these manifest indicators as reflective and called these
models reflective (indicator) models. All manifest indicators under a particular latent construct are
hypothesized to indicate the latent construct equally (Jarvis et al., 2003); however, this is not always
the case in empirical studies. Contrariwise, in composite (latent variable) models, the causal action
flows from manifest indicators to latent constructs (Jarvis et al., 2003). Changes in manifest
indicators lead to changes in latent constructs. Thus, these manifest indicators are formative (Fornell
& Bookstein, 1982) in nature. All manifest indicators under a latent construct jointly affect the
symbolic meanings of the latent construct.
Both reflective and composite models contain error terms. The former model’s error terms
happen at the level of manifest indicators while the latter’s error terms show at the level of latent
constructs. This difference explains why researchers put an error term for each manifest indicator
when drawing principle factor models but for composite latent variable models. For composite
latent variable models, no error term for individual indicators is needed (Jarvis et al., 2003).
SmartPLS generates outputs for both reflective and formative models. According to Hair et
al. (2014), in reflective measurement models, item loadings are called “outer loadings” (p. 87),

79
which mean “the results of single regressions of each indicator variable on their corresponding
construct” (p. 92). In measurement models that are formative, item loadings are called “outer
weights” (p. 87), which refer to “the results of multiple regression of a construct on its set of
indicators” (p. 92). If the measurement model in question is reflective, researchers should interpret
outer loadings; in contrast, if the measurement model in question is formative, researchers are
suggested to explain outer weights.
At the same time, research objectives determine the nature of being formative or reflective.
As Baumann et al. (2011, p.251) recommended, “if the focus of the model is in empirically verifying
an a priori theoretical variable or model, then a reflective model or variable is appropriate.”
Conversely, if the research objective is to identify a theoretical model or variable which best fits the
empirical data or observations, then a formative approach is warranted.” Whether a latent construct
is formative or reflective is also a matter of conceptualization, and statistical considerations play are
role later on. Following Baumann et al.’s. (2011) guidelines on determining the nature of a construct,
the researcher concluded that all the latent constructs in the theoretical framework of this dissertation
are reflective.
From these differences, it is apparent that the conceptual framework of this dissertation, the
DBLF, is composed of reflective constructs. The constructs of destination brand love, evaluation of
experiential attributes, destination brand loyalty, brand awareness, brand trust, family togetherness,
and perceived happiness are all reflective. The authors who proposed the original brand love scales,
Batra et al. (2012), identified that brand love scales are interrelated, also statistically supported by
large covariances. Batra et al. (2012, p. 9) stated that “following emerging interpretations of
formative versus reflective measurement and recent recommendations in consumer research and
psychology (Bagozzi, 2011), we represent the brand love prototype using reflective indicators of

80
hierarchically organized factors. The three second-order factors and four first-order factors all loaded
on a single third-order factor, which we labelled ‘brand love’” (Batra et al., 2012). All sub-
dimensions of destination brand love— self-brand integration, passion-driven behaviours, long-term
relationship, positive emotional connection, attitude valence, and attitude strength— are reflective
(Batra et al., 2012). Each sub-dimension contains its manifest indicators. For instance, frequent
thoughts of the brand are a manifest indicator of the sub-dimensions of attitude strength (Batra et al.,
2012). A high likelihood of frequent thoughts could impact attitude strength but may not necessarily
influence other sub-dimensions and the overall destination brand love construct. Manifest indicators
under the destination brand love latent construct do not jointly shape the conceptual and empirical
meanings of it. Moreover, the causal action flows from constructs to manifest indicators, confirming
that this construct is reflective.
Evaluation of experiential attributes captures visitors’ evaluation of various brand
touchpoints at destinations, such as shopping, activities and events, lodging, accessibility,
attractions, environment, and dining. This construct is also reflective. The researcher adapted Chi
and Qu’s (2008) attribute-level satisfaction items that cover: shopping, activities and events, lodging,
accessibility, attractions, environment, and dining. Disneyland controls the atmosphere of the
destination. All the shopping, activities, product, security, transportation, and accessibility pieces
influence and depend on each other to form the overall tourist experiences at a Disneyland. All these
attributes may co-vary. Therefore, in this dissertation, the construct “evaluation of experiential
attributes” is also reflective. In the same vein, cognitive loyalty, attitudinal loyalty, and conative
loyalty are also reflective. The other constructs, brand awareness, brand trust, perceived happiness,
and family togetherness are all reflective (Table 6).

81
Table 6: Latent Constructs in the Conceptual Framework
Latent Construct Reflective or
Formative
Sub-dimensions or Attributes
(if any)
Brand Awareness Reflective NA
Brand Trust Reflective NA
Destination Brand Love Reflective self-brand integration;
passion-driven behaviors;
long-term relationship;
positive emotional connection;
attitude valence;
attitude strength
Evaluation of Experiential
Attributes
Reflective shopping, activities and events,
lodging, accessibility,
attractions, environment, and
dining
Perceived Happiness Reflective NA
Family Togetherness Reflective NA
Cognitive Loyalty Reflective NA
Attitudinal Loyalty Reflective NA
Conative Loyalty Reflective NA Note: NA means not applicable
Therefore, the researcher chose PLS-SEM as the data analysis approach as carried out in
software programs such as PLS-Graph, SmartPLS, XLSTAT, and ADANCO (Hair et al., 2017). The
researcher chose SmartPLS 3.0 as the program to conduct the model analysis. SmartPLS 3.0 is one
of the popular software of Partial Least Square (PLS) path modelling. Since its inception in 2005, it
has gained growing usage business and information systems research as a useful SEM tool to
address both formative and reflective path models.
3.6.2 Mediation
Previous studies have suggested the mediating role of brand love in various contexts (Albert &
Merunka, 2013; Bergkvist & Bech-Larsen, 2010; Carroll & Ahuvia, 2006; Roy et al., 2013). This
study extended the mediating role of brand love into destination contexts and tested whether and the

82
extent to which the construct destination brand love is a critical mediating construct in the
relationships between the evaluation of experiential attributes and destination brand loyalty. Notably,
the structural model of this study includes only one mediating construct: destination brand love.
Mediation analysis facilitates substantiating the underlying mechanisms that exist in seemingly
simple cause-effect relationships (Hair et al., 2017). In mediation testing, the researcher interpreted
the direct, indirect, and total effects from SmartPLS bootstrapping outputs. Direct effects refer to
relationships between two constructs which are linked by a single-headed arrow (Hair et al., 2017).
Indirect effects are known to reflect relationships between two constructs which are intervened by a
third construct (Hair et al., 2017). Total effects are the sum of the two. Hair et al. (2017, p. 197)
emphasized the importance of total effects by stating that “the interpretation of total effects is
particularly useful in studies aimed at exploring the differential impact of several driver constructs
on a criterion construct via one or more mediating variables.”
Bootstrapping as a nonparametric resampling procedure is a more advanced method for
mediation testing. Preacher and Hayes (2008, p. 880) explained that bootstrapping as “an additional
method advocated for testing mediation that does not impose the assumption of normality of the
sampling distribution.” It is “a computationally intensive method that involves repeatedly sampling
from the data set and estimating the indirect effect in each resampled data set. By repeating this
process thousands of times, an empirical approximation of the sampling distribution of ab is built
and used to construct confidence intervals for the indirect effect” (Preacher & Hayes, 2008, p. 880).
Hair et al. (2014), in their textbook on SmartPLS, commented that bootstrapping is a suited for PLS-
SEM especially considering that both bootstrapping and PLS-SEM do not assume large sample size
and normal distribution of sample data. They recommended researchers to follow Preacher and
Hayes’s (2004, 2008) bootstrapping procedure and interpret the indirect effects in SmartPLS.

83
Baron and Kenny’s (1986) method for testing mediation is a “citation classic” for mediation
research. They suggested the following four criteria to demonstrate the existence of mediating
effects:
1) The independent variable must account significantly for the dependent variable (the direct
effect);
2) The independent variable must significantly associate with the mediator;
3) The mediator must account significantly for the dependent variable; and
4) After the researcher adds the mediator, the original effect of the independent variable on the
dependent variable must be reduced partially (partial mediation) or fully (to nonsignificance,
i.e., full mediation).
Although Baron and Kenny’s (1986) mediation testing approach appeared to be a widely
accepted and cited classic, recently, researchers have challenged Baron and Kenny (1986) and
developed more systematic and holistic approaches to differentiate various types of mediation. Zhao,
Lynch, and Chen (2010, p. 200), for instance, criticized Baron and Kenny (1986) by stating that
there need not be a significant effect of the independent variable on the dependent variable for a
mediation effect to occur. They contributed by conducting a synthesis of previous research on
mediation and proposing the “typology of mediations and non-mediations.” They identified two
types of non-mediation and three categories of mediation. On the one hand, the two patterns of non-
mediation include (Zhao et al., 2010, p. 232):
1) Direct-only non-mediation: Direct effect exists, but no indirect effect; and
2) No-effect non-mediation: Neither direct effect nor indirect effect exists.

84
On the other hand, the three types of mediation are (Zhao et al., 2010, p. 232):
1) Complementary mediation: Mediated effect and direct effect both exist and point in the
same direction.
2) Competitive mediation: Mediated effect and direct effect both exist and point in opposite
directions.
3) Indirect-only mediation: Mediated effect exists, but no direct effect.
In this dissertation, the researcher referred to Zhao, Lynch, and Chen’s (2010) criteria as
fundamental conditions for the existence of mediation. Then, the researcher conducted mediation
tests based on the approach recommended by Preacher and Hayes (2008), with 95% bias-corrected
bootstrap confidence intervals (Preacher et al., 2007)) based on 1,000 bootstrap samples (Rogers et
al., 2017) in the software of SmartPLS M3.0. Indirect effects rest upon 10,000 bootstrapping sample
draws.
3.7 Common Method Variance
Common method variance (CMV) refers to “variance that is attributable to the measurement
method rather than to the constructs the measures represent” (Podsakoff, MacKenzie, Lee, &
Podsakoff, 2003, p. 879). It has gained strong consideration in business research (e.g., consumer
research) but has only drawn little attention from scholars in tourism and leisure studies. The reason
why we should deal with potential CMV biases seriously and explicitly is that, in same-respondent
research drawing upon self-report questionnaires, CMV could generate spurious internal consistency
(Chang, Van Witteloostuijn, & Eden, 2010). This kind of false consistency could stem from the
research design stage: if exogenous and endogenous variables of a study come from the same source,
these variables are likely to correlate with each other (Chang et al., 2010). Respondents’ propensity

85
to offer consistent answers to questions not related to exogenous or endogenous variables could also
lead to CMV (Chang et al., 2010). Perceptual questionnaire data provided by single respondents
could have CMV biases (Chang et al., 2010).
The ways the researcher adopted to reduce the likelihood of CMV will be discussed in detail
in Section 4.2.2 in Chapter Four.

86
Chapter Four: Results
This chapter reports the complete procedure of data check, data treatment, descriptive
characteristics of the data, and model analysis results. Section 4.1 presents the demographic
information of 427 survey participants. Section 4.2 describes the techniques to treat invalid
questionnaires, missing data, and common method variance (CMV). Section 4.3 presents
characteristics of the normal distribution of the data, using Skewness and Kurtosis as two main
criteria.
The rest of this chapter is structured around the four research objectives of this dissertation.
Section 4.4 and 4.5 describe the results of the measurement model. Section 4.4 discusses the results
of the exploratory factor analysis of all the measurement items. This section validates the destination
brand love construct, therefore addressing the first research objective. Through the establishment of
the conceptual framework of antecedents and consequences of destination brand love, the second
research objective is met in Section 4.5. Section 4.6 explains a competing model. After that, section
4.7 fulfills the third research objective, which is to test destination brand love’s mediating role in the
relationship between the evaluation of experiential attributes and four sequential stages of
destination brand loyalty. Section 4.8 assesses the moderating roles of income and visitors’ status of
being first-time versus repeat visitors, thereby meeting the fourth research objective.
4.1 Demographic Information
The researcher collected 526 complete and valid questionnaires, among which 427 (81.2%)
respondents visited with family members to Shanghai Disney resort at the time of the survey, and 99
(18.8%) did not visit with family members. Considering that family togetherness is an essential
latent construct in the conceptual model of this dissertation and one research question is to identify
87
destination brand love’s influence on family togetherness, the subsequent analyses only used the 427
sample who visited with their families.
The sample of 427 respondents was highly representative of married, employed, middle-
aged, well-educated, and first-time visitors. Female respondents (52.7%) outnumbered their male
counterparts (47.1%). The overwhelming majority of them were married (66.7%) and employed
(85.7%). Over 70% (72.2%) of the respondents aged between 29 and 48. The majority of the
respondents were well educated; specifically, more than 70% (72.8%) of the survey participants
reported having a Bachelor’s degree or above. The sample of 427 respondents comprised of 324
(75.9%) first-time visitors and 103 (24.1%) repeat visitors. Nearly all of them (n=415) were from
mainland China (97.2%), with the remaining 12 participants reporting Japan as their home country.
Considering that the Shanghai Disney Resort was opened to the public on June 16, 2016, it is no
surprise that over 70% of the visitors were first-timers.
Moreover, among the 427 respondents, 263 of them (61.6%) reported their identity as
tourists, 82 (19.2%) reported as non-Shanghai residents who work, study, or live in Shanghai, and an
equal number of 82 respondents (19.2%) were Shanghai residents. Approximately 25% (23.8%) of
the respondents had an after-tax personal monthly income of 3,001-6,000 RMB, followed by 6,001-
9,000 RMB (17.9%), 9,001-12,000 RMB (17%), <3000 RMB (11.8), and > 27,001 RMB (8.1%).
In terms of previous interactions of the overall Disney brand, 343 respondents (81.7%) had
ever watched Disney movies; 321 of them (76.1%) had ever purchased Disney retailer products such
as books, toys, coffee mugs; 127 of them (30.1%) had ever visited Hong Kong Disneyland; only 35
(8.3%) respondents had travelled on a Disney cruise over their lifetime (Table 7). Some
demographic questions contained a choice of “prefer not to say” to allow respondents to protect their
privacy so that missing data exists in questions concerning sex, income, and age group.

88
Table 7: Demographic Information
Demographics n % Demographics n %
Previous Visiting Experience
at Shanghai Disney Income continued
First-timers 324 75.9 > 27,001 RMB 33 8.1
Repeat visitors 103 24.1 Country/region
Gender Mainland China 415 97.2
Female 225 52.7 Other countries or regions 12 2.8
Male 201 47.1 Marital Status
Prefer not to say 1 0.2 Single, never married 129 31.4
Age Married 274 66.7
18–28 20 4.7 Widowed 3 .7
29–38 145 34.0 Divorced or separated 5 1.2
39–48 163 38.2 Employment status
49–58 57 13.3 Employed 366 85.7
59–68 18 4.2 Unemployed 2 .5
69 or above 21 4.9 Retired 9 2.1
Prefer not to say 3 0.7 Student 32 7.5
Highest Level of Education Housewife 5 1.2
Junior high School or below 24 5.8 Other 13 3.0
Senior high school 55 13.3 Had watched Disney movies
before visiting
College 33 8.0 Yes 343 81.7
University (Bachelor) 236 57.3 No 77 18.3
Postgraduate or higher 64 15.5 Had purchased Disney products
before visiting
Income Yes 321 76.1
<3000RMB 48 11.8 No 101 23.9
3,001-6,000 RMB 97 23.8 Had visited Hong Kong
Disneyland before visiting
6,001- 9,000 RMB 73 17.9 Yes 127 30.1
9,001-12,000 RMB 69 17.0 No 295 69.9
12,001-15,000 RMB 31 7.6 Had travelled on Disney cruises
before visiting
15,001-18,000 RMB 23 5.7 Yes 35 8.3
18,001-21,000 RMB 16 3.9 No 383 90.5
21,001-24,000 RMB 14 3.4
24,001-27,000 RMB 3 .7
Note: The income here means after-tax personal monthly income.

89
4.2 Data Check, Missing Data Treatment, and Common Method Variance Reduction
4.2.1. Missing data treatment
Whether intentionally or unintentionally, missing data occurs when respondents fail to
provide an answer to survey questions. It is important to spot and treat missing data before
conducting any statistical analysis. Before the primary data analysis, the researcher firstly searched
for missing data of the 427 sample. Several categorical demographic variables contained a choice
“prefer not to say” (e.g., Q17: Sex) and this decision was considered a valid category because it
indicated respondents’ actual willingness not to answer private or sensitive questions. The researcher
checked missing data points of all variables in the questionnaire following Ali and Cobanoglu’s
(2017) criteria below:
1) For each questionnaire, if the percentage of missing data points exceeded 25%, throw
out this poll;
2) For each indicator/question, if the proportion of missing data points was less than 5%,
use this indicator/question;
3) If a respondent did not answer any question related to a construct, throw out this
questionnaire;
4) If any suspicious data pattern appears, for example, all answers are the same in one
questionnaire, throw out this questionnaire
The researcher adopted the mean replacement method to deal with missing values of
indicators in the theoretical framework. For example, when the researcher spot a missing value of
the indicator “I am very familiar with the Disney brand” (this indicator is under the construct brand
awareness), she first checked to see whether the proportion of missing points was higher than 5%. If

90
no, she continued to use the mean value of the overall brand awareness construct to replace the
missing value of this indicator.
Three accommodation-related indicators under the construct “evaluation of experiential
attributes” showed missing values of over 5%. These three indicators are 10_10: The lodging is
unique; 10_11: The lodging facilities are of good quality; and 10_12: The lodging facilities are
clean. Over half of the respondents skipped these three questions because they did not stay at either
of the two official Disneyland hotels due to relatively high daily rates and lack of availability. The
researcher removed these three indicators from the dataset for further analysis. These respondents
who skipped the three questions stayed at hotels, Airbnb, or other places near the Shanghai Disney
Resort. The most common distance from their accommodation places to Shanghai Disney Resort is
two to five subway stations. Other indicators did not contain any missing data of more than 5%.
4.2.2 Common method variance check
As mentioned in Section 3.7 in Chapter Three, researchers should check CMV before
conducting PLS-SEM analysis. The researcher followed Chang et al.’s (2010) strategies to reduce
the likelihood of CMV biases. Firstly, in the research design stage, the researcher adopted multi-
source measures, especially for endogenous latent constructs. The researcher mix-ordered questions
and applied different scales to questions. Secondly, survey respondents are “unlikely to be guided by
a cognitive map that includes difficult-to-visualize interaction and non-linear effects” (Chang et al.,
2010, p. 179). The researcher designed regression models that are not seemingly linear to
respondents. Thirdly, the researcher employed post-hoc Harman one-factor analysis to determine
whether a single underlying factor accounts for the variance in the data. The results showed the
single factor only accounted for an explained variance of less than 20%. There was neither a

91
dominant factor that emerged from the EFA analysis nor any general factor that could be attributable
to the majority of variance among variables.
Another approach to testing CMV is the marker variable approach (Lindell & Whitney,
2001). This method tests CMV specifically by using a theoretically irrelevant construct in the
analysis. In the questionnaire, the researcher incorporated two measures, namely “number of nights
that a respondent stayed in the destination city Shanghai” and “identity in Shanghai” to construct
two marker factors to detect the likelihood of CMV. Theoretically, these two measures were not
related to any of the latent constructs in the conceptual model. Correlation results showed that these
two marker variables did not correlate significantly with any of the latent constructs.
Additionally, the inclusion of the marker factor “number of nights that a respondent stayed in
the destination city Shanghai” caused a minor decrease in the value of the fit statistics, including TLI
(- 0.015) and RMSEA (- 0.001). The inclusion of the marker factor “identity in Shanghai” also
minimally reduced the value of TLI (- 0.014) and RMSEA (- 0.001). In summary, all these results
supported that CMV was not a severe threat to the analysis in this dissertation.
4.3 Normality Test
Although normal distribution is not a pre-requisite for statistical analysis in PLS-SEM (Ali &
Cobanoglu, 2017), the researcher still examined data normality using SmartPLS 3.0 data view to get
a basic understanding of the data distribution characteristics of the sample data. Skewness and
Kurtosis are the two primary criteria to evaluate data distribution. Skewness assesses “the extent to
which a variable’s distribution is symmetrical. If the distribution of responses for a variable stretches
toward the right or left tail of the distribution, then the distribution is referred to as skewed” (Hair et
al., 2014, p. 54). Skewness suggests whether and to what extent the data in question is left-tailed or

92
right-tailed. Kurtosis represents “a measure of whether the distribution is too peaked (a very narrow
distribution with most of the responses in the center) (Hair et al., 2014, p. 54). In short, Kurtosis
informs how flat the data tails are compared to a normal distribution. A statistical normal distribution
has a Skewness or Kurtosis value of 0 (Hair et al., 2014). In most social science empirical studies,
this “0” situation is almost unachievable. It is more common to encounter non-zero Skewness or
Kurtosis values. A Skewness value of greater than +1 or lower than –1 indicates substantially non-
normal distribution; similarly, a Kurtosis value of bigger than +1 or less than –1 means peaked or
flat distribution respectively. Therefore, if the values of both Skewness and Kurtosis fall into the
range of +1 to –1, it could be considered that the tested data achieve normal distribution (Hair et al.,
2014). The data view in SmartPLS 3.0 provides values of Skewness and Kurtosis of all variables.
Some of the indicators Kurtosis and Skewness did not fall into the range of -1 to +1 (see those
italicized numbers in Table 1), especially those indicators under the construct of brand awareness.
The univariate distribution of all indicators were deemed acceptable since the mean kurtosis and
mean skewness were inferior to 1 (Mhthen & Kaplan, 1985).
The researcher then performed descriptive statistics such as mean, median, minimum, and
maximum analyses to assess the sample deviation patterns concerning multivariate normality. The
distribution of standardized deviations (SD) displayed no obvious cues of non-normality. Table 8
shows that the indicators are within two standard deviations around their respective means.

93
Table 8: Univariate and Multivariate Normality Test Results (n=427)
Construct and Items Mean Standard
Deviation
Excess
Kurtosis
Skewness
Brand Awareness
I am very familiar with the Disney brand. 5.178 1.641 -0.345 -0.622
This brand is well known. 6.012 1.418 1.805 -1.543
I have heard of Disney before. 6.347 1.208 4.761 -2.204
Disney is very famous. 6.319 1.172 4.928 -2.163
Disney is visible. 5.382 1.57 -0.214 -0.724
Brand Trust
Disney is genuinely committed to my satisfaction. 5.248 1.487 0.142 -0.689
When I see a Disney advertisement, I believe that the
information in it is accurate.
5.155 1.458 0.08 -0.607
Most of what Disney says about it is true. 5.342 1.401 0.24 -0.722
I trust the Disney brand whenever I visit its site. 5.290 1.479 -0.184 -0.609
Brand Love: Self-brand integration (SBI)
It makes my life more meaningful. 5.489 1.329 0.171 -0.709
Brand Love: Passion-driven behaviours (PDB)
I felt myself desiring to go to Shanghai Disney Resort. 5.564 1.433 0.708 -0.963
I have the feeling of desire toward visiting it. 5.641 1.325 0.071 -0.783
I am willing to spend time visiting it. 5.662 1.368 0.653 -0.947
Brand Love: Positive emotional connection (PEC)
Shanghai Disney Resort meets my visiting expectations. 5.241 1.534 0.163 -0.786
I’m emotionally connected to it. 4.859 1.611 -0.262 -0.453
Shanghai Disney Resort makes me relaxed. 5.333 1.554 0.741 -1.026
It is fun. 5.561 1.352 0.992 -1.007
It is exciting. 5.450 1.422 0.689 -0.939
It is pleasurable. 5.499 1.428 0.8 -1.039
Brand Love: Long-term relationship (LR)
I feel a sense of long-time commitment to it. 4.644 1.755 -0.56 -0.378
It will be part of my life. 5.429 1.522 0.309 -0.9
Brand Love: Attitude valence (AV)
I like Shanghai Disney Resort. 5.540 1.417 0.906 -1.017
My overall feelings/evaluations towards Shanghai Disney
Resort are positive.
5.617 1.355 1.273 -1.104
I am satisfied with it. 5.562 1.407 1.036 -1.069
Brand Love: Attitude strength (AS)
I am certain of my evaluations of it. 5.766 1.275 1.083 -1.07
I frequently find myself thinking about it. 5.272 1.560 0.169 -0.8
It pops into my mind. 5.096 1.657 -0.116 -0.701
Perceived Happiness
In general, I consider myself a very happy person. 5.541 1.379 1.023 -1.035
Compared to most of my peers, I am a happy person. 5.611 1.348 1.052 -1.053
I am generally happy. I enjoy life regardless of what is
going on, getting the most out of everything.
5.747 1.312 1.012 -1.037
I am generally not very happy. Although I am not
depressed, I seldom seem as happy as I might be.
Family Togetherness
My family gets along well with each other. 6.101 1.281 4.672 -2.041
I thought the entire family enjoyed the visiting experience
at Shanghai Disney Resort.
5.759 1.348 0.969 -1.114
Our family kinship was increased. 5.724 1.354 0.664 -0.993
We enjoyed the time spent with my family together.
6.166 1.096 2.285 -1.479

94
Evaluation of Experiential Attributes
The quality of merchandise is good. 5.267 1.374 -0.066 -0.5
The service is friendly. 3.623 1.568 -0.288 0.157
There is a variety of special events/festivals. 5.604 1.331 0.954 -0.976
The price for activities and events is reasonable. 5.384 1.356 0.257 -0.63
The local transportation is convenient. 5.361 1.391 0.217 -0.7
To access the resort is easy. 4.185 1.746 -0.753 -0.113
There is a variety of culture options. 5.335 1.552 0.793 -1.067
The price for sightseeing is reasonable. 5.101 1.581 0.066 -0.743
The atmosphere is restful. 5.363 1.376 0.367 -0.732
Safety and security are good. 5.267 1.374 -0.066 -0.5
The food quality is good. 3.623 1.568 -0.288 0.157
There is a variety of cuisine. 5.604 1.331 0.954 -0.976
Cognitive Loyalty
It provided me superior service quality as compared to
other places I have been to.
5.26 1.462 -0.009 -0.634
No other destination performed better than it. 5.300 1.425 -0.022 -0.638
The overall quality of Shanghai Disney Resort is the best
as a tourism destination.
5.546 1.318 0.872 -0.9
It provided me with more good experiences than other
places.
5.403 1.413 0.447 -0.823
Attitudinal Loyalty
I loved visiting here. 5.387 1.413 0.635 -0.868
I like Shanghai Disney Resort more than other
destinations.
4.899 1.611 -0.378 -0.442
I felt better when I stayed here. 5.314 1.449 0.033 -0.689
Conative Loyalty
If I am given a chance, I intend to continue making my
holiday at Shanghai Disney Resort.
5.009 1.683 -0.431 -0.591
I consider it to be my first holiday choice. 5.019 1.634 -0.224 -0.628
Note: The author used 7-point Likert Scales for all items. For all items listed out above, the min values are 1, and the
max values are 7.
4.4 The Measurement Model
Formative and reflective constructs require different approaches in reporting measurement
model results. The constructs in this dissertation’s theoretical framework are all reflective.
Therefore, the researcher tested relationships between manifest indicators (the measurement model)
and those between latent constructs (the structural model) following the guidelines of reflective
construct models. The researcher took Hair et al.’s (2014) suggestion and reported criteria such as
outer loadings, composite reliability, Cronbach’s alpha (α), average variance extracted (AVE), cross-
loadings, and Rho_A for reflective constructs in this study. Rules of thumb for evaluating reflective
measurement models includes both reliability and validity testing. The establishment of reliability
95
testing requires adequate indicator reliability and internal consistency reliability. Acceptable validity
means convergent, discriminant and content validity are meeting their specific threshold (Hair et al.,
2014). The measurement model testing validated a total of 18 destination brand love scales.
4.4.1 Indicator reliability.
The researcher checked outer loadings to examine indicator reliability (Hair et al., 2014).
Indicator reliability is the squared value of an indicator’s outer loading. For example, if an
indicator’s outer loading is 0.90; its indicator reliability is 0.81 (0.902). Statistically, if an indicator’s
outer loading is weak and below 0.40, it should be removed (Hair et al., 2014; Hair, Black, Babin, &
Anderson, 2010). Table 9 shows that outer loadings of all indicators except three are well above the
cut-off point of 0.708 (Hair et al., 2014). The two indicators that had an outer loading of lower than
0.70 are: 1) Disney is visible, and the price for activities and events is reasonable. Notably, their
outer loadings are all above 0.55, higher than the minimum acceptable level of 0.40 (Hair et al.,
2014; Hair et al., 2010). All manifest indicators were statistically significant at the 0.001 confidence
interval level. Therefore, all indicators in this study showed satisfying factor loadings.
The researcher calculated indicator reliability based on outer loadings. Overall, indicator
reliability ranged from 0.603 to 0.965. The indicator “the price for activities and events is
reasonable” under the construct of Brand Awareness, generated the lowest indicator reliability of
0.603. The indicator “If I am given a chance, I intend to continue making my holiday at Shanghai
Disney Resort” generated the highest indicator reliability of 0.925. The second column in Table 9
presents indicator reliability values.

96
Table 9: Reliability and AVE
Constructs and Manifest Indicators
Factor
loading
Indicator
reliability
Composite
reliability
(pc)
Cronbach’s
α AVE Rho_A
Brand Awareness (BA) 0.867 0.817 0.523 0.837
I am very familiar with the Disney
brand.
0.738*** 0.545
This brand is well known. 0.806*** 0.650
I have heard of Disney before. 0.756*** 0.572
Disney is very famous. 0.802*** 0.643
Disney is visible. 0.652*** 0.425
Brand Trust (BT) 0.939 0.913 0.793 0.915
Disney is genuinely committed to
my satisfaction.
0.842*** 0.709
When I see a Disney
advertisement, I believe that the
information in it is accurate.
0.918*** 0.843
Most of what Disney says about it
is true.
0.893*** 0.797
Evaluation of Experiential
Attributes (Eval)
0.936 0.925 0.549 0.928
The quality of merchandise is
good.
0.719*** 0.517
The service is friendly. 0.771*** 0.594
There is a variety of special
events/festivals.
0.767*** 0.588
The price for activities and events
is reasonable.
0.603*** 0.364
The local transportation is
convenient.
0.722*** 0.521
To access the resort is easy. 0.773*** 0.598
There is a variety of culture
options.
0.755*** 0.570
The price for sightseeing is
reasonable.
0.653*** 0.426
The atmosphere is restful. 0.756*** 0.572
Safety and security are good. 0.787*** 0.619
The food quality is good. 0.798*** 0.637
There is a variety of cuisine. 0.763*** 0.582
Destination Brand Love (DBLove) 0.972 0.969 0.658 0.971
Self-brand integration (SBI): It
makes my life more meaningful. 0.819***
0.671
Passion-driven behaviours (PDB):
I felt myself desiring visiting it.
0.740*** 0.548
PDB: I have the feeling of desire
toward visiting it.
0.716*** 0.513
PDB: I am willing to spend time
visiting it.
0.709*** 0.503
Positive emotional connection
(PEC): Shanghai Disney Resort
meets my visiting expectations.
0.831*** 0.691
PEC: I’m emotionally connected to 0.783*** 0.613

97
it.
PEC: Shanghai Disney Resort
makes me relaxed.
0.802*** 0.643
PEC: It is fun. 0.849*** 0.721
PEC: It is exciting. 0.861*** 0.741
PEC: It is pleasurable. 0.842*** 0.709
Long-term relationship (LR): I feel
a sense of long-time commitment
to it.
0.747*** 0.558
LR: It will be part of my life. 0.829*** 0.687
Attitude valence (AV): I like
Shanghai Disney Resort.
0.884*** 0.781
AV: My overall
feelings/evaluations towards
Shanghai Disney Resort are
positive.
0.841*** 0.707
AV: I am satisfied with it. 0.886*** 0.785
Attitude strength (AS): I am
certain of my evaluations of it.
0.739*** 0.546
AS: I frequently find myself
thinking about it. 0.853*** 0.728
AS: It pops into my mind. 0.837*** 0.701
Cognitive Loyalty 0.955 0.937 0.842 0.939
Cognitive Loyalty: It provided me
superior service quality as
compared to other places I have
been to.
0.911*** 0.830
No other destination performed
better than it.
0.928*** 0.861
The overall quality of Shanghai
Disney Resort is the best as a
tourism destination.
0.912*** 0.832
It provided me with more good
experiences than other places.
0.918*** 0.843
Attitudinal Loyalty 0.929 0.886 0.814 0.889
I loved visiting here. 0.914*** 0.835
I like Shanghai Disney Resort
more than other destinations.
0.878*** 0.771
I felt better when I stayed here. 0.914*** 0.835
Conative Loyalty 0.961 0.919 0.925 0.919
If I am given a chance, I intend to
continue making my holiday at
Shanghai Disney Resort.
0.962*** 0.925
I consider it to be my first holiday
choice.
0.961*** 0.924
Perceived Happiness (PH) 0.908 0.849 0.768 0.874
In general, I consider myself a very
happy person.
0.917*** 0.841
Compared to most of my peers, I
am a happy person.
0.902*** 0.814
I am generally happy. I enjoy life
regardless of what is going on,
getting the most out of everything.
0.805*** 0.648
Family Togetherness (FT) 0.904 0.860 0.702 0.893
My family gets along well with
each other.
0.730*** 0.533
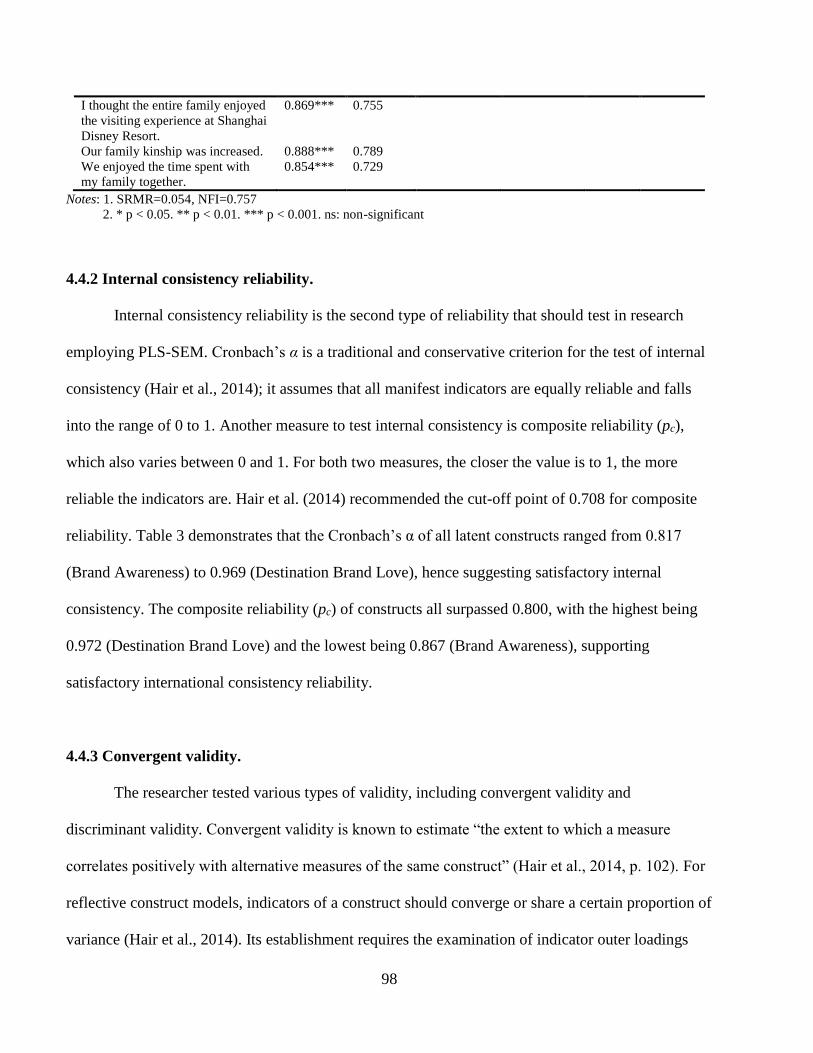
98
I thought the entire family enjoyed
the visiting experience at Shanghai
Disney Resort.
0.869*** 0.755
Our family kinship was increased. 0.888*** 0.789
We enjoyed the time spent with
my family together.
0.854*** 0.729
Notes: 1. SRMR=0.054, NFI=0.757
2. * p < 0.05. ** p < 0.01. *** p < 0.001. ns: non-significant
4.4.2 Internal consistency reliability.
Internal consistency reliability is the second type of reliability that should test in research
employing PLS-SEM. Cronbach’s α is a traditional and conservative criterion for the test of internal
consistency (Hair et al., 2014); it assumes that all manifest indicators are equally reliable and falls
into the range of 0 to 1. Another measure to test internal consistency is composite reliability (pc),
which also varies between 0 and 1. For both two measures, the closer the value is to 1, the more
reliable the indicators are. Hair et al. (2014) recommended the cut-off point of 0.708 for composite
reliability. Table 3 demonstrates that the Cronbach’s α of all latent constructs ranged from 0.817
(Brand Awareness) to 0.969 (Destination Brand Love), hence suggesting satisfactory internal
consistency. The composite reliability (pc) of constructs all surpassed 0.800, with the highest being
0.972 (Destination Brand Love) and the lowest being 0.867 (Brand Awareness), supporting
satisfactory international consistency reliability.
4.4.3 Convergent validity.
The researcher tested various types of validity, including convergent validity and
discriminant validity. Convergent validity is known to estimate “the extent to which a measure
correlates positively with alternative measures of the same construct” (Hair et al., 2014, p. 102). For
reflective construct models, indicators of a construct should converge or share a certain proportion of
variance (Hair et al., 2014). Its establishment requires the examination of indicator outer loadings

99
and AVE. An AVE of 0.50 or higher suggests acceptable AVE and indicates that a construct
explains over 50% of the variance of its manifest indicators (Fornell, 1992; Fornell & Larcker, 1981;
Hair et al., 2014; Hair et al., 2010). The construct of brand awareness generated the lowest square
root of AVE (its AVE is 0.523), while conative loyalty had the highest square root of AVE (its AVE
is 0.925). All square root of AVEs supposed the rule of thumb of 0.50 (Table 10), confirming the
convergent validity of all constructs in this study (Fornell & Larcker, 1981).
Table 10: Correlations of Constructs and the Square Root of AVE (Fornell-Larcker Criterion)
Constructs AL BA BT CogL ConL DBLove FT PH Eval
AL (0.902)
BA 0.351 (0.723)
BT 0.542 0.619 (0.891)
CogL 0.830 0.341 0.550 (0.917)
ConL 0.856 0.353 0.548 0.767 (0.962)
DBLove 0.846 0.399 0.617 0.800 0.820 (0.811)
FT 0.540 0.334 0.416 0.484 0.497 0.613 (0.838)
PH 0.512 0.350 0.423 0.484 0.489 0.566 0.618 (0.876)
Eval 0.712 0.470 0.613 0.725 0.684 0.815 0.532 0.540 (0.741)
Notes: 1. The square root of AVE values is shown in parenthesis and in bold.
2. AL=Attitudinal Loyalty; BA=Brand Awareness; BT=Brand Trust; CogL=Cognitive Loyalty; ConL=Conative
Loyalty; DBLove=Destination Brand Love; FT=Family Togetherness; PH=Perceived Happiness; Eval=Evaluation of
Experiential Attributes
4.4.4 Discriminant validity.
The next step in validity testing was the assessment of discriminant validity, a measure
indicating the degree to which a construct is empirically different from other constructs (Hair et al.,
2014). Three criteria were adopted: the Fornell-Larcker (1981) criterion, cross-loadings, and the
Heterotrait-Monotrait Ratio (HTMT). The first criterion, the Fornell-Larcker (1981) method, asserts
that constructs are discriminant if the square root of the AVE of each reflective construct surpasses

100
the correlations with all the other reflective constructs in a model. As shown in Table 8, all the
square roots of AVEs (the bold numbers in parenthesis) far exceeded correlations, suggesting
adequate discriminant validity. Another criterion for assessing discriminant validity, cross-loadings,
is typically the first approach to examine discriminant validity (Hair et al., 2017). Specifically, a
manifest indicator’s outer loading on the construct it belongs to should exceed its outer loadings on
other constructs (Hair et al., 2017; Hair et al., 2014).
Table 11 illustrates the loadings and cross-loadings for every indicator. Every indicator
expressed the highest value with its corresponding construct, and all cross-loadings were
considerably lower. For example, indicators 10_6, 10_7, 10_8 all the way to 10_20 are the indicators
for the construct “evaluation of experiential attributes.” All indicators under this construct showed
the highest value for the loading with “evaluation of experiential attributes,” while all cross-loadings
with other constructs were far lower. For instance, the factor loading of indicator 10_6 (The quality
of merchandise is good) with “evaluation of experiential attributes” was 0.719, which exceeded its
cross-loadings with other constructs. The same finding was found for other indicators measuring the
other constructs in the theoretical framework. Collectively, the Fornell-Larcker (1981) criterion and
cross-loadings provided enough evidence for the discriminant validity of constructs.

101
Table 11: Cross Loadings
Indicator/Construct
Name
AL BA BT CogL ConL DBLove FT PH Eval
10_6: The quality of
merchandise is good
0.541 0.436 0.553 0.565 0.547 0.609 0.438 0.394 0.719
10_7: The service is
friendly
0.513 0.360 0.493 0.557 0.511 0.610 0.402 0.364 0.771
10_8: There is a
variety of special
events/festivals
0.533 0.371 0.439 0.536 0.487 0.611 0.400 0.375 0.767
10_9: The price for
activities and events
is reasonable
0.394 0.273 0.324 0.385 0.396 0.460 0.239 0.292 0.603
10_13: The local
transportation is
convenient
0.472 0.277 0.380 0.485 0.465 0.550 0.335 0.383 0.722
10_14: To access the
resort is easy
0.553 0.355 0.450 0.547 0.524 0.603 0.422 0.413 0.773
10_15: There is a
variety of culture
options
0.523 0.356 0.433 0.518 0.488 0.583 0.360 0.397 0.755
10_16: The price for
sightseeing is
reasonable
0.438 0.307 0.383 0.428 0.433 0.524 0.293 0.334 0.653
10_17: The
atmosphere is restful
0.593 0.367 0.481 0.605 0.532 0.663 0.435 0.417 0.756
10_18: Safety and
security are good
0.592 0.375 0.493 0.626 0.528 0.654 0.457 0.445 0.787
10_19: The food
quality is good
0.577 0.343 0.505 0.583 0.577 0.690 0.439 0.463 0.798
10_20: There is a
variety of cuisine
0.554 0.337 0.474 0.554 0.556 0.644 0.449 0.486 0.763
11_1: In general, I
consider myself a
very happy person
0.507 0.337 0.421 0.487 0.488 0.562 0.570 0.917 0.533
11_2: Compared to
most of my peers, I
am a happy person
0.466 0.303 0.350 0.438 0.452 0.505 0.512 0.903 0.489
11_3: I am generally
happy. I enjoy life
regardless of what is
going on, getting the
most out of
everything
0.355 0.275 0.335 0.329 0.325 0.404 0.550 0.805 0.380
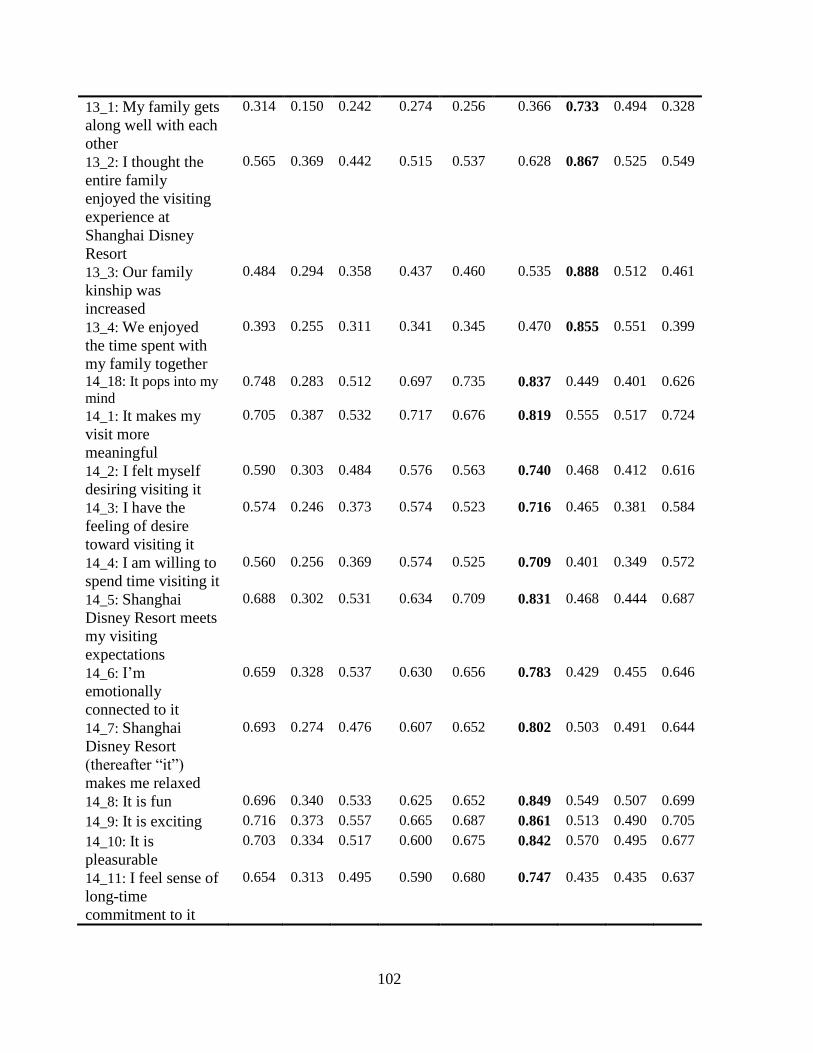
102
13_1: My family gets
along well with each
other
0.314 0.150 0.242 0.274 0.256 0.366 0.733 0.494 0.328
13_2: I thought the
entire family
enjoyed the visiting
experience at
Shanghai Disney
Resort
0.565 0.369 0.442 0.515 0.537 0.628 0.867 0.525 0.549
13_3: Our family
kinship was
increased
0.484 0.294 0.358 0.437 0.460 0.535 0.888 0.512 0.461
13_4: We enjoyed
the time spent with
my family together
0.393 0.255 0.311 0.341 0.345 0.470 0.855 0.551 0.399
14_18: It pops into my
mind
0.748 0.283 0.512 0.697 0.735 0.837 0.449 0.401 0.626
14_1: It makes my
visit more
meaningful
0.705 0.387 0.532 0.717 0.676 0.819 0.555 0.517 0.724
14_2: I felt myself
desiring visiting it
0.590 0.303 0.484 0.576 0.563 0.740 0.468 0.412 0.616
14_3: I have the
feeling of desire
toward visiting it
0.574 0.246 0.373 0.574 0.523 0.716 0.465 0.381 0.584
14_4: I am willing to
spend time visiting it
0.560 0.256 0.369 0.574 0.525 0.709 0.401 0.349 0.572
14_5: Shanghai
Disney Resort meets
my visiting
expectations
0.688 0.302 0.531 0.634 0.709 0.831 0.468 0.444 0.687
14_6: I’m
emotionally
connected to it
0.659 0.328 0.537 0.630 0.656 0.783 0.429 0.455 0.646
14_7: Shanghai
Disney Resort
(thereafter “it”)
makes me relaxed
0.693 0.274 0.476 0.607 0.652 0.802 0.503 0.491 0.644
14_8: It is fun 0.696 0.340 0.533 0.625 0.652 0.849 0.549 0.507 0.699
14_9: It is exciting 0.716 0.373 0.557 0.665 0.687 0.861 0.513 0.490 0.705
14_10: It is
pleasurable
0.703 0.334 0.517 0.600 0.675 0.842 0.570 0.495 0.677
14_11: I feel sense of
long-time
commitment to it
0.654 0.313 0.495 0.590 0.680 0.747 0.435 0.435 0.637

103
14_12: It will be part
of my life
0.693 0.321 0.474 0.672 0.694 0.829 0.468 0.450 0.674
14_13: I like
Shanghai Disney
Resort
0.774 0.325 0.538 0.718 0.730 0.884 0.552 0.499 0.713
14_14: My overall
feelings/evaluations
towards Shanghai
Disney Resort are
positive
0.708 0.355 0.503 0.703 0.675 0.841 0.569 0.511 0.705
14_15: I am satisfied
with it
0.778 0.351 0.551 0.751 0.740 0.886 0.546 0.495 0.721
14_16: I am certain
of my evaluations of
it
0.618 0.387 0.457 0.621 0.595 0.739 0.508 0.446 0.616
14_17: I frequently
find myself thinking
about it
0.740 0.335 0.535 0.687 0.750 0.853 0.474 0.455 0.629
15_1: It provided me
superior service
quality as compared
to other places I
have been to
0.744 0.288 0.513 0.911 0.705 0.719 0.464 0.455 0.653
15_2: No other
destination
performed better
than it
0.754 0.306 0.489 0.928 0.715 0.719 0.428 0.463 0.640
15_3: The overall
quality of Shanghai
Disney Resort is the
best as a tourism
destination
0.708 0.309 0.484 0.912 0.649 0.710 0.428 0.389 0.659
15_4: It provided me
with more good
experiences than
other places
0.834 0.345 0.531 0.918 0.743 0.782 0.454 0.468 0.704
15_5: I loved visiting
here
0.914 0.305 0.480 0.802 0.733 0.755 0.515 0.456 0.633
15_6: I like Shanghai
Disney Resort more
than other
destinations
0.878 0.336 0.495 0.678 0.765 0.720 0.442 0.449 0.612
15_7: I felt good
when I stayed here
0.914 0.311 0.494 0.764 0.816 0.810 0.502 0.480 0.678
15_8: If I am given a
chance, I intend to
0.823 0.342 0.541 0.736 0.962 0.795 0.492 0.479 0.644
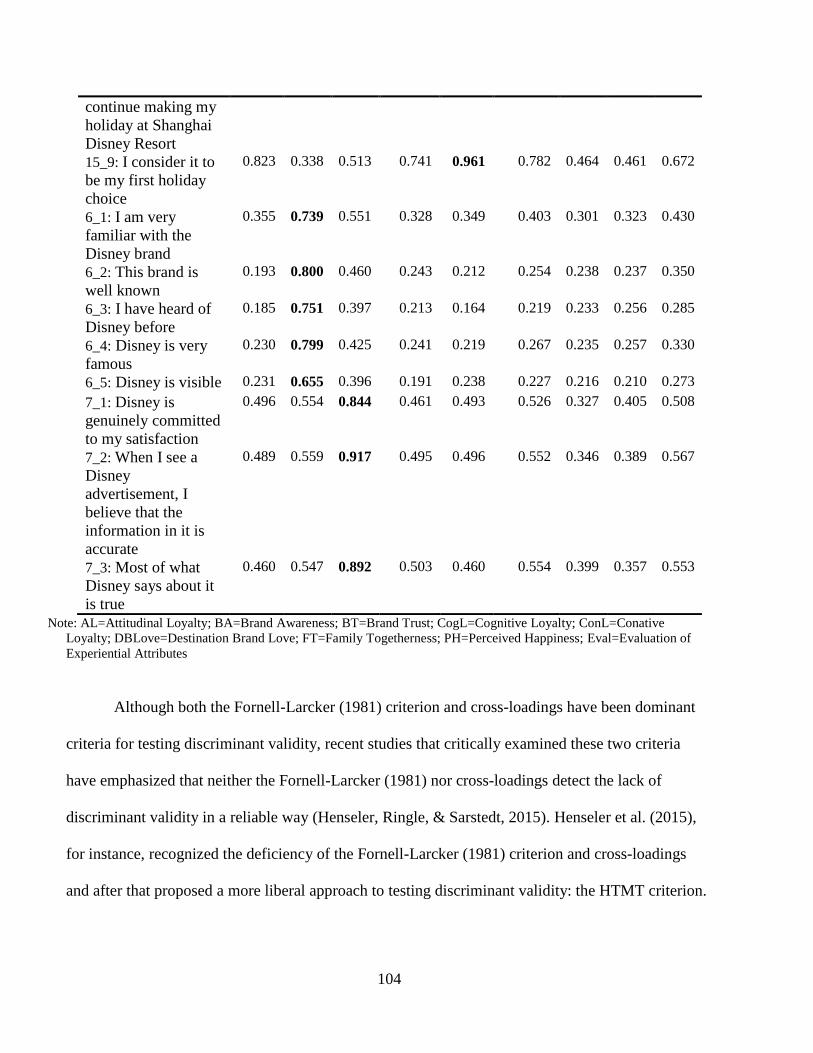
104
continue making my
holiday at Shanghai
Disney Resort
15_9: I consider it to
be my first holiday
choice
0.823 0.338 0.513 0.741 0.961 0.782 0.464 0.461 0.672
6_1: I am very
familiar with the
Disney brand
0.355 0.739 0.551 0.328 0.349 0.403 0.301 0.323 0.430
6_2: This brand is
well known
0.193 0.800 0.460 0.243 0.212 0.254 0.238 0.237 0.350
6_3: I have heard of
Disney before
0.185 0.751 0.397 0.213 0.164 0.219 0.233 0.256 0.285
6_4: Disney is very
famous
0.230 0.799 0.425 0.241 0.219 0.267 0.235 0.257 0.330
6_5: Disney is visible 0.231 0.655 0.396 0.191 0.238 0.227 0.216 0.210 0.273
7_1: Disney is
genuinely committed
to my satisfaction
0.496 0.554 0.844 0.461 0.493 0.526 0.327 0.405 0.508
7_2: When I see a
Disney
advertisement, I
believe that the
information in it is
accurate
0.489 0.559 0.917 0.495 0.496 0.552 0.346 0.389 0.567
7_3: Most of what
Disney says about it
is true
0.460 0.547 0.892 0.503 0.460 0.554 0.399 0.357 0.553
Note: AL=Attitudinal Loyalty; BA=Brand Awareness; BT=Brand Trust; CogL=Cognitive Loyalty; ConL=Conative
Loyalty; DBLove=Destination Brand Love; FT=Family Togetherness; PH=Perceived Happiness; Eval=Evaluation of
Experiential Attributes
Although both the Fornell-Larcker (1981) criterion and cross-loadings have been dominant
criteria for testing discriminant validity, recent studies that critically examined these two criteria
have emphasized that neither the Fornell-Larcker (1981) nor cross-loadings detect the lack of
discriminant validity in a reliable way (Henseler, Ringle, & Sarstedt, 2015). Henseler et al. (2015),
for instance, recognized the deficiency of the Fornell-Larcker (1981) criterion and cross-loadings
and after that proposed a more liberal approach to testing discriminant validity: the HTMT criterion.

105
The HTMT was proposed especially for VB-SEM, such as PLS-SEM. The researcher tested HTMT
values of latent constructs as the second approach to evaluate discriminant validity.
The researcher considered HTMT as an essential and reliable criterion to supplement the
Fornell-Larcker (1981) and cross-loadings. HTMT refers to “the average of the heterotrait-
heteromethod correlations (i.e., the correlations of indicators across constructs measuring different
phenomena), relative to the average of the monotrait-heteromethod correlations (i.e., the correlations
of indicators within the same construct)” (Henseler et al., 2015, p. 121). The complete bootstrapping
function in SmartPLS generated the HTMTinference which is another important criterion for judging
discriminant validity. To establish a satisfactory discriminant validity, the confidence interval of the
HTMT statistic should not surpass 1 for all combinations of constructs (Hair et al., 2017). Table 12
illustrates that the upper levels of the confidence interval limits were all below 1. Thereby the data
indicated that all HTMTinference values were significantly different from 1. Therefore, discriminant
validity between latent constructs was established.
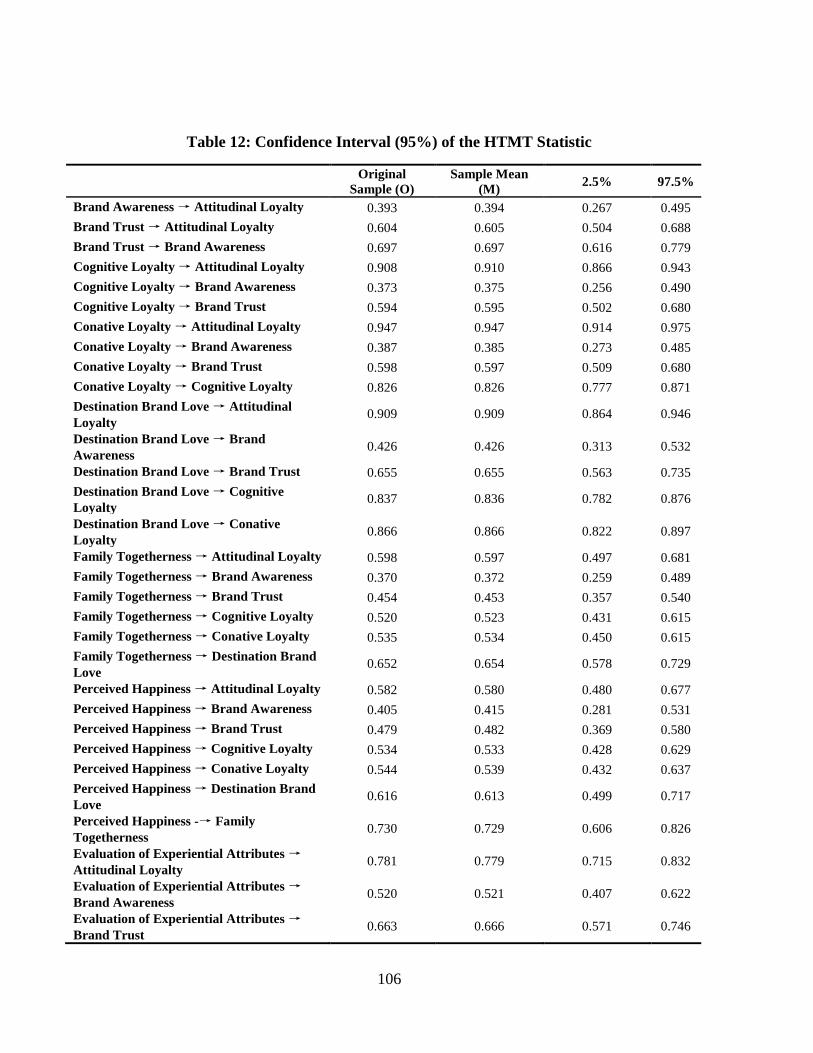
106
Table 12: Confidence Interval (95%) of the HTMT Statistic
Original
Sample (O)
Sample Mean
(M) 2.5% 97.5%
Brand Awareness → Attitudinal Loyalty 0.393 0.394 0.267 0.495
Brand Trust → Attitudinal Loyalty 0.604 0.605 0.504 0.688
Brand Trust → Brand Awareness 0.697 0.697 0.616 0.779
Cognitive Loyalty → Attitudinal Loyalty 0.908 0.910 0.866 0.943
Cognitive Loyalty → Brand Awareness 0.373 0.375 0.256 0.490
Cognitive Loyalty → Brand Trust 0.594 0.595 0.502 0.680
Conative Loyalty → Attitudinal Loyalty 0.947 0.947 0.914 0.975
Conative Loyalty → Brand Awareness 0.387 0.385 0.273 0.485
Conative Loyalty → Brand Trust 0.598 0.597 0.509 0.680
Conative Loyalty → Cognitive Loyalty 0.826 0.826 0.777 0.871
Destination Brand Love → Attitudinal
Loyalty 0.909 0.909 0.864 0.946
Destination Brand Love → Brand
Awareness 0.426 0.426 0.313 0.532
Destination Brand Love → Brand Trust 0.655 0.655 0.563 0.735
Destination Brand Love → Cognitive
Loyalty 0.837 0.836 0.782 0.876
Destination Brand Love → Conative
Loyalty 0.866 0.866 0.822 0.897
Family Togetherness → Attitudinal Loyalty 0.598 0.597 0.497 0.681
Family Togetherness → Brand Awareness 0.370 0.372 0.259 0.489
Family Togetherness → Brand Trust 0.454 0.453 0.357 0.540
Family Togetherness → Cognitive Loyalty 0.520 0.523 0.431 0.615
Family Togetherness → Conative Loyalty 0.535 0.534 0.450 0.615
Family Togetherness → Destination Brand
Love 0.652 0.654 0.578 0.729
Perceived Happiness → Attitudinal Loyalty 0.582 0.580 0.480 0.677
Perceived Happiness → Brand Awareness 0.405 0.415 0.281 0.531
Perceived Happiness → Brand Trust 0.479 0.482 0.369 0.580
Perceived Happiness → Cognitive Loyalty 0.534 0.533 0.428 0.629
Perceived Happiness → Conative Loyalty 0.544 0.539 0.432 0.637
Perceived Happiness → Destination Brand
Love 0.616 0.613 0.499 0.717
Perceived Happiness -→ Family
Togetherness 0.730 0.729 0.606 0.826
Evaluation of Experiential Attributes →
Attitudinal Loyalty 0.781 0.779 0.715 0.832
Evaluation of Experiential Attributes →
Brand Awareness 0.520 0.521 0.407 0.622
Evaluation of Experiential Attributes →
Brand Trust 0.663 0.666 0.571 0.746
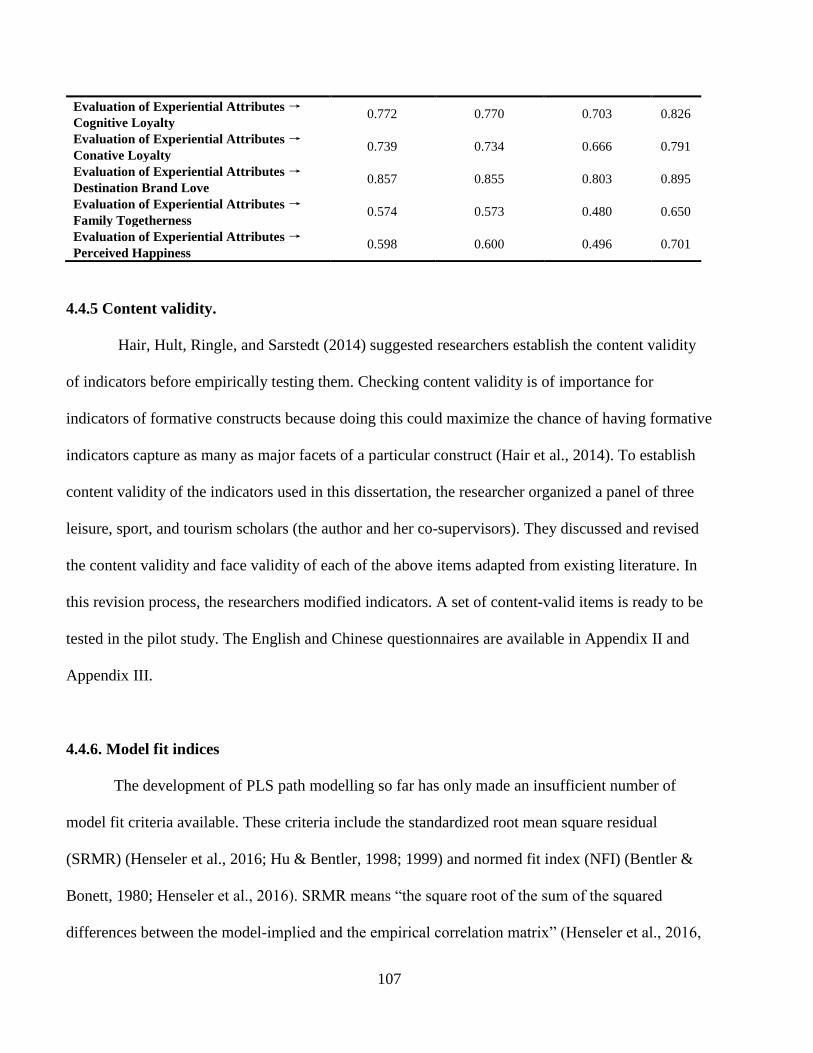
107
Evaluation of Experiential Attributes →
Cognitive Loyalty 0.772 0.770 0.703 0.826
Evaluation of Experiential Attributes →
Conative Loyalty 0.739 0.734 0.666 0.791
Evaluation of Experiential Attributes →
Destination Brand Love 0.857 0.855 0.803 0.895
Evaluation of Experiential Attributes →
Family Togetherness 0.574 0.573 0.480 0.650
Evaluation of Experiential Attributes →
Perceived Happiness 0.598 0.600 0.496 0.701
4.4.5 Content validity.
Hair, Hult, Ringle, and Sarstedt (2014) suggested researchers establish the content validity
of indicators before empirically testing them. Checking content validity is of importance for
indicators of formative constructs because doing this could maximize the chance of having formative
indicators capture as many as major facets of a particular construct (Hair et al., 2014). To establish
content validity of the indicators used in this dissertation, the researcher organized a panel of three
leisure, sport, and tourism scholars (the author and her co-supervisors). They discussed and revised
the content validity and face validity of each of the above items adapted from existing literature. In
this revision process, the researchers modified indicators. A set of content-valid items is ready to be
tested in the pilot study. The English and Chinese questionnaires are available in Appendix II and
Appendix III.
4.4.6. Model fit indices
The development of PLS path modelling so far has only made an insufficient number of
model fit criteria available. These criteria include the standardized root mean square residual
(SRMR) (Henseler et al., 2016; Hu & Bentler, 1998; 1999) and normed fit index (NFI) (Bentler &
Bonett, 1980; Henseler et al., 2016). SRMR means “the square root of the sum of the squared
differences between the model-implied and the empirical correlation matrix” (Henseler et al., 2016,

108
p. 9). It is a byproduct of the PLS algorithm (Hair et al., 2017). The smaller the value of SRMR, the
better the model fit will be. Specifically, an SRMR value of infinite approaching 0 indicates perfect
model fit. A widely adopted rule of thumb of determining a model fit using SRMR is an SRMR
value less than 0.08 (Hu & Bentler, 1999), although Byrne (2008) suggested a more rigorous
acceptable cut-off value of 0.05. Compared with SRMR, NFI has been relatively rarely used
(Henseler et al., 2016). An NFI value bigger than 0.90 has been considered acceptable (Byrne, 2008)
for factor models, but for composite models, the threshold for the NFI remains undetermined
(Henseler et al., 2016).
SmartPLS, as a partial least squares structural equation modelling (PLS-SEM) program, is
still developing its model fit indices, not as the covariance-based SEM (CB-SEM) software which
has a set of sophisticated model fit indices available and widely adopted. Although there have been
some indices created to evaluate model fit in PLS-SEM, Hair et al. (2017, p. 5) noted that “literature
casts doubt on whether measured fit—as understood in a factor-based SEM context—is a relevant
concept for PLS.”
As suggested by Henseler et al. (2016, p.12) (Figure 6), in this dissertation, the researcher
reports SRMR, NFI, d_ULS, and d_G as PLS fit indices for the measurement model. The SRMR
value was 0.062 for the estimated model, indicating a satisfactory model fit (Hu & Bentler, 1999).
The NFI value was 0.742 for the estimated model, not meeting Byrne’s (2008) cut-off point of 0.90
or higher. The Chi-Square value was 6,998.103. However, the legitimacy of these indices are still to
some extent questionable and awaits further academic validation; this study reports SRMR and NFI
only as reference fit indices.

109
Figure 6: Assessment of PLS Path Modelling Results in Explanatory Research Settings
(Henseler et al., 2016, p.12)
4.5 The Structural Model
The researcher analyzed the structural model in SmartPLS 3.0 with a full information
maximum likelihood (FIML) estimator to determine whether the survey data support the
hypothesized relationships (Rogers, Courneya, Anton, Hopkins-Price, Verhulst, Robbs, Vicari, &
McAuley, 2017). There was no missing data at this stage, thereby justifying the use of FIML
estimation (Rogers et al., 2017). This sector examines relationships among latent constructs and the

110
predictive capabilities of each exogenous constructs following Hair, Hult, Ringle, and Sarstedt’s
(2017) structural model evaluation guidelines. According to Hair et al. (2017, p. 191), specific steps
involves:
1) Assess the structural model for collinearity issues;
2) Assess the significance and relevance of the structural model relationships
3) Assess the level of R2;
4) Assess the f2 effect size;
5) Assess the predictive relevance of Q2;
6) Assess the q2 effect size
4.5.1 Collinearity assessment.
Collinearity is not neglectable because path coefficients could be biased if high levels of
collinearity exist in regression estimations (Hair, Hult, Ringle, & Sarstedt, 2017). The variance
inflation factors (VIF) among the latent constructs ranged from 1.000 to 2.978, far below the
threshold of 5, suggesting that collinearity should not be a concern in this study (Hair et al., 2011).
4.5.2 Significance of path coefficients.
Path coefficients fall into the range of -1 to +1, with 0 or close to 0 meaning profoundly weak
and usually statistically insignificant impact (Hair et al., 2017). Similarly, a path coefficient close to
+1 indicates a strong and positive impact which is also usually statistically significant, and vice versa
for coefficients close to -1 (Hair et al., 2017). To interpret the results of the structural model, the
researcher used t values and p values to gauge whether a path coefficient is significant or not at
either the .05, .01 or .001 confidence interval levels.

111
Table 13 shows that most hypothesis testing results were statistically significant. Thus, the
data supported most of the proposed hypotheses. However, there are three exceptions. The construct
brand awareness did not exert any meaningful and significant influence on the construct destination
brand love. Therefore, the data rejected H1.
Similarly, the evaluation of experiential attributes as a construct did not show any significant
influence on attitudinal loyalty. The results also rejected H3c. The data did not reveal any significant
impact of the evaluation of experiential attributes on conative loyalty. Thus, the data rejected H3d.
The data supported all the other hypotheses, either at the 0.001 or the 0.05 confidence interval level.
Figure 7 displays the structural model results. The next few sections explain each hypothesis testing
result one by one.

112
Table 13: Results of Path Relationships
Relationship directionality Standardized
Regression
Weights (Β)
Standard
Deviation
(S.D.)
t Statistics p-values Accept/
Reject
H1 Brand Awareness→ Destination Brand
Love
-0.076 ns 0.041 1.872 0.062 Reject
H2 Brand Trust→ Destination Brand Love 0.229*** 0.044 5.233 <0.001 Accept
H3a Evaluation of Experiential Attributes
→ Destination Brand Love
0.710*** 0.039 18.225 <0.001 Accept
H3b Evaluation of Experiential Attributes
→ Cognitive Loyalty
0.218*** 0.055 3.979 <0.001 Accept
H3c Evaluation of Experiential Attributes→
Attitudinal Loyalty
0.067 ns 0.050 1.355 0.176 Reject
H3d Evaluation of Experiential Attributes→
Conative Loyalty
0.047 ns 0.055 0.853 0.394 Reject
H4a Destination brand love→ Cognitive
Loyalty
0.622*** 0.053 11.800 <0.001 Accept
H4b Destination brand love→ Attitudinal
Loyalty
0.791*** 0.047 16.913 <0.001 Accept
H4c Destination brand love→ Conative
Loyalty
0.782*** 0.048 16.225 <0.001 Accept
H5a Destination brand love→ Perceived
Happiness
0.566*** 0.051 11.192 <0.001 Accept
H5b Destination brand love→ Family
Togetherness
0.613*** 0.035 17.756 <0.001 Accept
Hloy1 Cognitive loyalty→ Attitudinal loyalty 0.434*** 0.054 8.058 <0.001 Accept
Hloy2 Attitudinal loyalty→ Conative loyalty 0.569*** 0.056 10.249 <0.001 Accept
Note: * p < 0.05. ** p < 0.01. *** p < 0.001. ns: non-significant

113
Note: * p < 0.05. ** p < 0.01. *** p < 0.001. ns: non-significant
Figure 7: The Structural Model
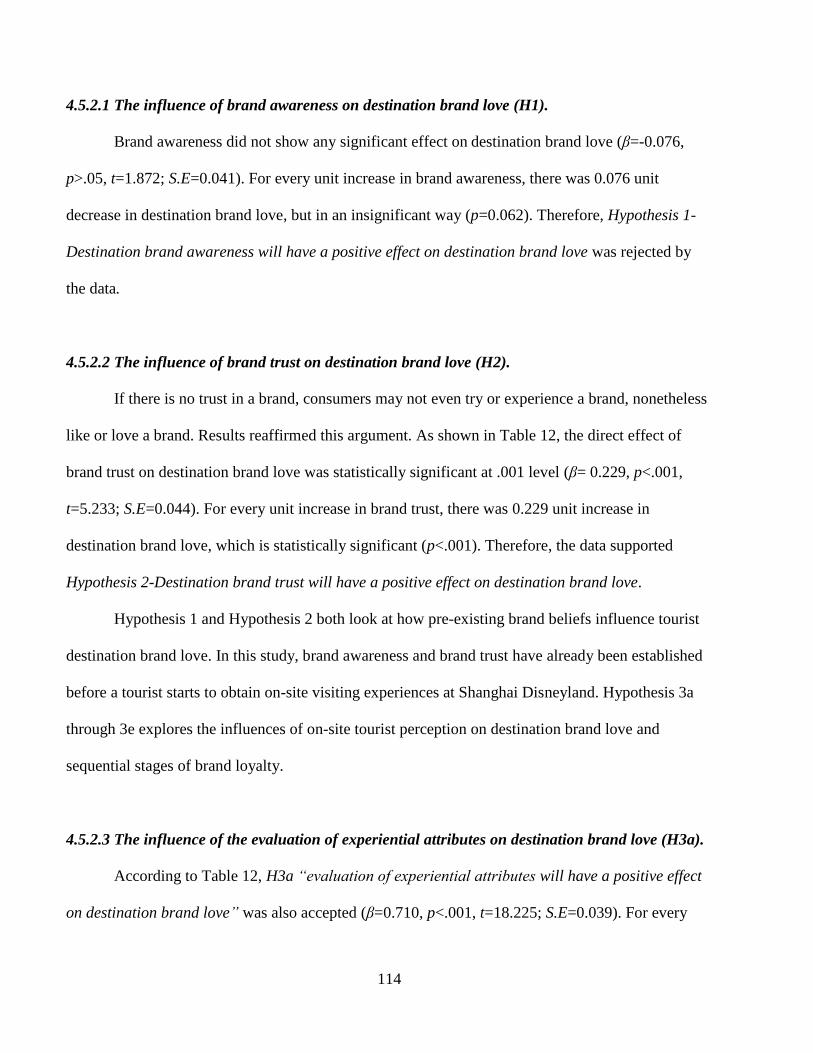
114
4.5.2.1 The influence of brand awareness on destination brand love (H1).
Brand awareness did not show any significant effect on destination brand love (β=-0.076,
p>.05, t=1.872; S.E=0.041). For every unit increase in brand awareness, there was 0.076 unit
decrease in destination brand love, but in an insignificant way (p=0.062). Therefore, Hypothesis 1-
Destination brand awareness will have a positive effect on destination brand love was rejected by
the data.
4.5.2.2 The influence of brand trust on destination brand love (H2).
If there is no trust in a brand, consumers may not even try or experience a brand, nonetheless
like or love a brand. Results reaffirmed this argument. As shown in Table 12, the direct effect of
brand trust on destination brand love was statistically significant at .001 level (β= 0.229, p<.001,
t=5.233; S.E=0.044). For every unit increase in brand trust, there was 0.229 unit increase in
destination brand love, which is statistically significant (p<.001). Therefore, the data supported
Hypothesis 2-Destination brand trust will have a positive effect on destination brand love.
Hypothesis 1 and Hypothesis 2 both look at how pre-existing brand beliefs influence tourist
destination brand love. In this study, brand awareness and brand trust have already been established
before a tourist starts to obtain on-site visiting experiences at Shanghai Disneyland. Hypothesis 3a
through 3e explores the influences of on-site tourist perception on destination brand love and
sequential stages of brand loyalty.
4.5.2.3 The influence of the evaluation of experiential attributes on destination brand love (H3a).
According to Table 12, H3a “evaluation of experiential attributes will have a positive effect
on destination brand love” was also accepted (β=0.710, p<.001, t=18.225; S.E=0.039). For every

115
unit increase in the evaluation of experiential attributes, destination brand love increases by 0.710 of
a unit. The path coefficient β is highly robust, indicating an impact that is not only statistically
significant but also strong. Tourists who reported a higher level of evaluation of experiential
attributes had stronger brand love towards the Shanghai Disney Resort. Besides, all items under the
construct of evaluation of experiential attributes were statistically significant at .001 level. Thus the
following 12 items all play significant roles in enhancing destination brand love:
1) Quality of merchandise;
2) Service;
3) Special events/festivals;
4) Price for activities and events;
5) Local transportation;
6) Access to the resort;
7) Cultural elements;
8) Admission ticket price;
9) Atmosphere;
10) Safety and security;
11) Food quality; and
12) Cuisine choices
4.5.2.4 The influence of the evaluation of experiential attributes on cognitive loyalty (H3b).
Hypothesis 3b proposed that the evaluation of experiential attributes will have a positive
effect on cognitive loyalty. The structural model results provided sufficient evidence to support this
hypothesis (β=0.218, p<.001, t=3.979; S.E=0.055). For every unit increase in the evaluation of

116
experiential attributes, there was 0.218 of a unit statistically significant increase in cognitive loyalty.
The path coefficient β (β=0.218) is significant at .001 level, indicating that the evaluation of
experiential attributes does play a meaningful role in the first phase of loyalty formation.
4.5.2.5 The influence of the evaluation of experiential attributes on attitudinal loyalty (H3c).
After cognitive loyalty, the next phase of loyalty formation is the establishment of attitudinal
loyalty (Oliver, 1999). Hypothesis 3c hypothesizes that the evaluation of experiential attributes will
have a positive effect on attitudinal loyalty. The data in the current study, however, rejected
Hypothesis 3c (β=0.067, p=0.176, t=1.355, S.E=0.050). For every unit increase in the evaluation of
experiential attributes, there was 0.067 unit increase in attitudinal loyalty, a statistically insignificant
result though. Therefore, the evaluation of experiential attributes had no significant or meaningful
effects on attitudinal loyalty.
4.5.2.6 The influence of the evaluation of experiential attributes on conative loyalty (H3d).
Hypothesis H3d posits that evaluation of experiential attributes will have a positive effect on
conative loyalty. The data rejected this hypothesis (β=0.047, p=0.394, t=0.853, S.E=0.055), which
means that the parameter estimate of the path was statistically insignificant (p>0.05) at the 0.05
confidence interval level. For every unit increase in the evaluation of experiential attributes, there
was no significant increase in conative loyalty. In other words, the evaluation of experiential
attributes did not exert any significant influences on conative loyalty.

117
4.5.2.8 The influence of destination brand love on cognitive loyalty (H4a).
Hypothesis 4a posits that Destination Brand Love will have a positive effect on Cognitive
Loyalty. As predicted, the data supported this hypothesis. Destination Brand Love exerted a positive
and highly significant impact on Cognitive Loyalty (β=0.622, p<0.001, t=11.800, S.E=0.053). The β
coefficient was also strong. The result implies that as Destination Brand Love increases by 1-unit,
cognitive dissonance decreases by 0.964 unit. Thus, the more visitors develop a strong sense of love
towards a destination, the more cognitively loyal they become.
4.5.2.9 The influence of destination brand love on attitudinal loyalty (H4b).
The testing result of Hypothesis 4b (Destination brand love will have a positive effect on
attitudinal loyalty) showed that Destination Brand Love has a meaningful and positive influence on
Attitudinal Loyalty (β=0.791, p<0.001, t=16.913, S.E=0.047). Notably, the β coefficient for the
regression path in H4b is the greatest among the results in the present study. As Destination Brand
Love goes up by 1, Attitudinal Loyalty goes down by 0.791, a positive and significant result. The
result implied that the more visitors experience a feeling of love towards branded destinations, the
more attitudinally loyal they will be.
4.5.2.10 The influence of destination brand love on conative loyalty (H4c).
H4c Destination brand love will have a positive effect on conative loyalty was also supported
by the data (β=0.782, p<0.001, t=16.225, S.E=0.048). The β coefficient for the regression path in
H4c is the second highest among all path results, indicating that Destination Brand Love also exerted
a strong influence on the third stage of brand loyalty: conative loyalty. For every unit increase in
Destination Brand Love, there was 0.782 unit increase in Conative Loyalty, a statistically significant

118
finding. The result shows that Destination Brand Love has a meaningful and positive effect on
conative loyalty.
4.5.2.12 The influence of destination brand love on perceived happiness (H5a).
The next set of hypotheses concerns with direct effects of destination brand love on a
personal construct: perceived happiness. H5a predicts that destination brand love will have a positive
effect on the perceived happiness of visitors. Path estimates supported this hypothesis (β=0.566,
p<0.001, t=11.192, S.E=0.051). Thus, there was sufficient evidence of the statistically significant
and positive influence of destination brand love on the perceived happiness of visitors. According to
the results, destination brand love holds an important role in enhancing visitors’ level of perceived
happiness.
4.5.2.13 The influence of destination brand love on family togetherness (H5b).
The last path in the proposed model, H5b, postulates that destination brand love will have a
positive effect on family togetherness. The results accepted this hypothesis as well at the 0.001
confidence interval level (β=0.613, p<0.001, t=17.756, S.E=0.035). Note that this path is also
positive in direction, as hypothesized. For every unit increase in Destination Brand Love, there was
0.613 unit increase in Family Togetherness, a statistically significant result.
In general, most hypotheses in this dissertation were corroborated by empirical results (Table
12), in which very different outcome was evidenced for brand awareness. Although theoretically,
establishing brand awareness is a fundamental step towards developing visitors’ destination brand
love, a high level of brand awareness does not necessarily bring about a high level of destination
brand love. In other words, brand awareness by itself is insufficient to ensure brand love among

119
visitors at a particular destination. Some other factors contribute significantly to enhancing
destination brand love. As evidenced in this dissertation, brand trust and evaluation of experiential
attributes are two significant factors. They both significantly contributed to destination brand love,
which in turn, contributed significantly to ideal business performance (i.e., brand loyalty), individual
(perceived happiness), and family level (family togetherness) outcomes. Destination brand love
functions as a link in the chain of effects associating brand trust with the business performance
aspects of destination brand equity.
In summary, brand trust and evaluation of experiential attributes drive destination brand love
to a great extent. It promotes not only ideal business outcomes, i.e., four sequential stages of
destination brand loyalty, but also individual- and family-based benefits through an enhanced level
of perceived happiness and family togetherness.
4.5.2.14 The influence of cognitive loyalty on attitudinal loyalty (Hloy1).
To unveil whether the development of destination brand loyalty follows four sequential
stages, the researcher tested Hloy1 “cognitive loyalty will have a positive effect on attitudinal
loyalty.” The path results suggested that cognitive loyalty generated positive and significant
influences on attitudinal loyalty (β=0.434, p<0.001, t= 8.058, S.E= 0.054). For every unit increase in
cognitive loyalty, there was 0.434 unit increase in attitudinal loyalty. Therefore, the first stage of
loyalty development was confirmed.
4.5.2.15 The influence of attitudinal loyalty on conative loyalty (Hloy2).
Attitudinal and conative loyalty represent the second and third stages of loyalty development.
Hloy2 posits that attitudinal loyalty will have a positive effect on conative loyalty. The model testing

120
results accepted this hypothesis (β=0.569, p<0.001, t= 10.249, S.E= 0.056). The higher attitudinal
loyalty is, the higher conative loyalty will be. The path coefficient β is highly robust at the 99.9%
confidence interval level, indicating a strong influence of attitudinal loyalty on conative loyalty.
4.5.3 Coefficient of determination (R2).
The coefficient R2 is a communally used measure to evaluate structural models in PLS-SEM
(Hair et al., 2017; Sarstedt, Ringle, Henseler, & Hair, 2014). It stands for exogenous latent variables’
joint influences on endogenous latent variables. Specifically, it represents “the amount of variance in
the endogenous constructs explained by all of the exogenous constructs linked to it” (Hair et al.,
2017, p. 198). Like path loadings, R2 also ranges from 0 to 1. Chin (1998, p. 323) suggested three
cut-off points to determine the R2 (degree of variance): 0.19 (weak), 0.33 (moderate), and 0.67
(substantial). Tourism researchers have widely used Chin’s (1998) cut-off points (e.g., Ayeh, Au,
Law, 2013).
As shown in Table 14, the model in this study could explain 71.5% of the variance in
attitudinal loyalty, 65.4% of the variance in cognitive loyalty, and 67.1% of the variance in conative
loyalty. According to Chin (1998), the results indicate that exogenous latent constructs in the
conceptual model explained four sequential stages of brand loyalty substantially.
Table 14: Values of R2 of Endogenous Constructs
Explained
variance (R2)
S.E. p-values Confidence
Interval 95%
Attitudinal Loyalty 0.715 0.034 <.001 [0.643, 0.777]
Cognitive Loyalty 0.654 0.037 <.001 [0.575, 0.715]
Conative Loyalty 0.671 0.031 <.001 [0.601, 0.723]
Destination Brand Love 0.688 0.037 <.001 [0.601, 0.752 ]
Family Togetherness 0.374 0.042 <.001 [0.290, 0.455]
Perceived Happiness 0.319 0.057 <.001 [0.207, 0.420]
Note: R2 is only applicable to endogenous constructs in the conceptual model.
121
Furthermore, the model explained 68.8% of the variance in the endogenous latent construct
destination brand love, a substantial predictive power (Chin, 1998). The percentages of R2 values in
family togetherness and perceived happiness were 37.4% and 31.9% respectively. Therefore, the
proposed model moderately reflects the influences of visitors’ destination brand love on their
happiness and family cohesion (Chin, 1998).
4.5.4 Effect size (f2).
Following Hair et al.’s (2017) structural model testing steps, the researcher evaluated f2 effect
size, which measures the degree to which exogenous latent constructs contribute to endogenous
constructs’R2 values. Values of f2 are calculated based on R2 values. When an exogenous latent
construct was deleted from a structural model, the R2 values of endogenous latent constructs could
change. Thus, researchers need to determine whether the omitted exogenous latent construct could
have a significant impact on endogenous variables. Researchers should examine f2 effect size to
determine the significance of this influence.
In this dissertation, Hair et al.’s. (2017, p. 201) formula to calculate f2 was adopted. Cohen
(1988) and Henseler, Ringle, and Sinkovics (2009) suggested that f2 effect size values of 0.02, 0.15,
and 0.35 indicate small, medium, and large effects. As displayed in Table 15, the omission of the
construct destination brand love could influence the R2 values of the four sequential stages of brand
loyalty significantly. Excluding destination brand love from the path model could cause substantial
changes in the R2 values of attitudinal loyalty (f2=0.742), and conative loyalty (f2=0.627) (Cohen,
1988; Henseler et al. 2009). However, this exclusion will only yield medium changes in the R2 value
of cognitive loyalty (f2=0.377) (Cohen, 1988; Henseler et al. 2009).

122
Table 15: Values of f2 Effect Size
Construct DBLove CogL AL ConL PH FT
BA→ 0.011
BT→ 0.082
Eval→ 0.994 0.046 0.005 0.002
DBLove→ 0.377 0.742 0.627 0.471 0.601
Note: AL=Attitudinal Loyalty; BA=Brand Awareness; BT=Brand Trust; CogL=Cognitive Loyalty;
ConL=Conative Loyalty; DBLove=Destination Brand Love; FT=Family Togetherness; PH=Perceived
Happiness; Eval= Evaluation of Experiential Attributes
Similarly, excluding the exogenous latent construct evaluation of experiential attributes will
bring about fundamental changes in the R2 values of destination brand love (f2=0.994), but only small
changes in those of cognitive loyalty (f2=0.046), attitudinal loyalty (f2=0.005), and conative loyalty
(f2=0.002). Besides, the omission of the construct brand awareness will produce only small changes
in the R2 value of destination brand love (f2=0.011). The exclusion of the construct brand trust will
also create small changes in the R2 value of destination brand love (f2=0.082).
4.5.5 Blindfolding and predictive relevance (Q2)
Blindfolding is usually applied to reflective versus formative model specification as well as
to single-item construct model specification (Hair et al., 2017). Latent constructs in this study are all
reflective, thereby further validating the use of the blindfolding procedure as a supplement for
predictive power testing. The researcher conducted the blindfolding procedure in SmartPLS M 3.0 to
examine cross-validated redundancy. As shown in Table 16, all the Q2 values of endogenous latent
constructs significantly surpassed zero, evident of the model’s predictive relevance (Hair et al.,
2017).

123
Table 16: Predictive Relevance by Blindfolding (Q2)
SSO SSE Q2
(=1-SSE/SSO)
Attitudinal Loyalty 1,281.000 565.265 0.559
Brand Awareness 2,562.000 2,562.000
Brand Trust 1,708.000 1,708.000
Cognitive Loyalty 1,708.000 812.262 0.524
Conative Loyalty 854.000 342.362 0.599
Destination Brand Love 7,686.000 4,393.468 0.428
Family Togetherness 1,708.000 1,292.818 0.243
Perceived Happiness 1,281.000 981.916 0.233
Evaluation of Experiential
Attributes
5,124.000 5,124.000
4.6 A Competing Model
As mentioned earlier in Chapter One, the researcher proposed a total of ten latent constructs
in the conceptual framework of antecedents and consequences of destination brand love in a theme-
park visitation context (Figure 2). Considering that, in the present study, measurement items were
revised to reflect the theme park visitation context, it is helpful to conduct an exploratory factor
analysis (EFA) of all items in the measurement model. The purpose of conducting an EFA was two-
fold. Firstly, it aimed to verify pre-specified dimensions and to identify underlying factors and
possible competing model(s). Secondly, the researcher intended to get a better understanding of
other potential path relationships between latent constructs studied.
The researcher selected Principal Axis Factoring as the extraction method and Oblimin with
Kaiser Normalization as the rotation method. As Field (2013) noted, Principal Axis Factoring and
Oblimin with Kaiser Normalization are preferred methods for EFA and are also the most commonly
used (Field, 2013; Sarstedt & Mooi, 2014). The result of Bartlett’s test of sphericity was significant
(χ2 (1770) = 21192.24, p<.001). The Kaiser-Meyer-Olkin (KMO) measure of sampling adequacy far

124
surpassed Field’s (2013) threshold of 0.5. To examine factor loadings, the researcher adopted
Tabachnick and Fidell’s (2013) rule of thumb that factor loadings should be above 0.32 in order to
be retained. All items generated factor loadings larger than 0.32. Therefore, the researcher retained
all items for subsequent analyses.
As Table 17 displays, the factor-analytic solution yielded six factors with eigenvalues greater
than 1.0. These six factors were labelled destination brand loyalty, brand awareness, perceived
happiness and family togetherness, evaluation of experiential attributes, brand trust, and destination
brand love. The first factor, destination brand loyalty, explained a particularly large share of the
variances (46.87%). The second to the sixth factor, brand awareness, explained smaller shares of
variances (5.06%). In total, the six factors accounted for 62.18% of the variances in endogenous
latent constructs.

125
Table 17: Factor Analysis of Measurement Items
Factors 1 2 3 4 5 6 Commu-
nalities
Destination brand loyalty
15_1: It provided me superior
service quality as compared to
other places I have been to
.848 .826
15_2: No other destination
performed better than it
.873 .842
15_3: The overall quality of
Shanghai Disney Resort is the
best as a tourism destination
.812 .842
15_4: It provided me with more
good experiences than other
places
.887 .887
15_5: I loved visiting here .828 .804
15_6: I like Shanghai Disney
Resort more than other
destinations
.729 .732
15_7: I felt good when I stayed
here
.363 .193
15_8: If I am given a chance, I
intend to continue making my
holiday at Shanghai Disney
Resort
.826 .836
15_9: I consider it to be my first
holiday choice
.819 .834
15_10: I will say positive things
about it to other people
.854 .880
15_11: I will encourage my
friends and relatives to visit it
.855 .897
15_12: I will recommend it to
my friends
.847 .906
15_13: I intend to visit it again .370 .177
15_14: If I hear something bad
about Shanghai Disney Resort, I
will question it in own mind
first
.711 .632
Brand awareness

126
6_1: I am very familiar with the
Disney brand
.447 .528
6_2: This brand is well known .714 .648
6_3: I have heard of Disney
before
.833 .678
6_4: Disney is very famous .895 .724
6_5: Disney is visible. .538 .457
Perceived happiness and
family togetherness
11_1: In general, I consider
myself a very happy person
.699 .745
11_2: Compared to most of my
peers, I am a happy person
.645 .707
11_3: I am generally happy. I
enjoy life regardless of what is
going on, getting the most out
of everything.
.702 .590
13_1: My family gets along
well with each other
.700 .570
13_2: I thought the entire family
enjoyed the visiting experience
at Shanghai Disney Resort
.741 .756
13_3: Our family kinship was
increased
.743 .688
13_4: We enjoyed the time
spent with my family together
.806 .714
Evaluation of Experiential
Attributes
10_6: The quality of
merchandise is good
.597 .666
10_7: The service is friendly .637 .692
10_8: There is a variety of
special events/festivals
.629 .627
10_9: The price for activities
and events is reasonable
.718 .585
10_13: The local transportation
is convenient
.618 .621
10_14: To access the resort is
easy
.706 .656
10_15: There is a variety of .701 .653

127
culture options
10_16: The price for sightseeing
is reasonable
.730 .590
10_17: The atmosphere is
restful
.591 .695
10_18: Safety and security are
good
.595 .701
10_19: The food quality is good .696 .778
10_20: There is a variety of
cuisine
.690 .752
Brand trust
7_1: Disney is genuinely
committed to my satisfaction
.824 .730
7_2: When I see a Disney
advertisement, I believe that the
information in it is accurate
.907 .807
7_3: Most of what Disney says
about it is true
.805 .772
Brand trust
Destination brand love
14_1: It makes my visit more
meaningful
.647 .785
14_2: I felt myself desiring
visiting it
.503 .802
14_3: I have the feeling of
desire toward visiting it
.433 .831
14_4: I am willing to spend
time visiting it
.449 .845
14_5: Shanghai Disney Resort
meets my visiting expectations
.704 .791
14_6: I’m emotionally
connected to it
.648 .731
14_7: Shanghai Disney Resort
(thereafter “it”) makes me
relaxed
.787 .756
14_8: It is fun .832 .835
14_9: It is exciting .819 .838
14_10: It is pleasurable .818 .800
14_11: I feel sense of long-time
commitment to it
.628 .660

128
14_12: It will be part of my life .711 .760
14_13: I like Shanghai Disney
Resort
.773 .838
14_14: My overall
feelings/evaluations towards
Shanghai Disney Resort are
positive
.675 .793
14_15: I am satisfied with it .775 .863
14_16: I am certain of my
evaluations of it
.596 .685
14_17: I frequently find myself
thinking about it
14_18: It pops into my mind
.744
.752
.833
.832
Eigenvalues 28.435 3.375 2.556 1.84 1.567 1.535
Variance explained (%) 46.871 5.061 3.626 2.46 2.104 2.056
Cumulative variance
explained (%)
46.871 51.932 55.558 58.017 60.122 62.178
Cronbach’s α .817 .913 .883 .925 .969 .916
Average of factor scores 5.961 5.249 5.824 4.191 5.421 5.294
The factor loadings of measurement items ranged between 0.363 and 0.895, meeting the
threshold suggested by Hair, Anderson, Tatham, and Black (1998). The Cronbach’s alphas for the
six factors were robust, ranging from 0.817 to 0.969. They all surpassed the generally adopted
threshold of 0.60 (Nunnally & Bernstein, 1994), indicating high internal consistency among the
variables within each factor. Two items under the construct evaluation of experiential attributes (the
atmosphere is restful; safety and security are good) cross-loaded. One item (“I felt good when I
stayed here”) under the attitudinal loyalty construct cross-loaded. The other measurement items
under brand awareness, evaluation of experiential attributes brand trust, and destination brand love
all loaded significantly on factors as the researcher conceptualized. Generally speaking, factor
loadings of the 59 items presented a clean and highly interpretable solution of the six-factor
competing model which comprises of destination brand love, destination brand loyalty, brand

129
awareness, perceived happiness and family togetherness, evaluation of experiential attributes, and
brand trust.
It was no surprise that measurement items of family togetherness and perceived happiness
loaded on one factor. The literature (e.g., Shaw et al., 2008) suggested that the meaning of family
vacations and family excursions is that families get chances to get together to enjoy some quality
time together, to create happy family memories, and to get rid of mundane daily life and working
schedule. Disney’s mantra is children and parents going together for a family vacation and family
togetherness. Measurement items of family togetherness and perceived happiness differed regarding
magnitude though. A closer look at the factor loadings revealed that the factor loadings of family
togetherness were all above 0.70, and those of perceived happiness were 0.70 or below.
As a final approach to model assessment, comparing the proposed conceptual framework (Figure 2)
with a competing model allows alternative explanations to the proposed model. All measurement
items from the original proposed model were retained for use in the competing model to maintain the
integrity of the original measurement items and to ensure that the competing model is exactly based
on the variables identified in EFA. The differences between the competing model and the proposed
model are that all four sequential stages of brand loyalty merged into one construct named
“destination brand loyalty” and family togetherness and perceived happiness merged into one
construct named “individual happiness and family togetherness.” In the subsequent competing model
path analysis, “destination brand loyalty” and “individual happiness and family togetherness” were
used as latent constructs.
Figure 8 displays the results of the structural model testing of the competing model. Similar
to the original structural model, brand awareness did not generate any significant influences on
destination brand love (β=-0.076, p>.05, t=1.906; S.E=0.040). This result informs that the competing

130
model based on EFA results still suggested that knowing the Disney brand does not necessarily bring
about destination brand love, partly because the Disney brand is too pervasive. Merely knowing
Shanghai Disney Resort does not mean visitors have an intense emotional bond with it.
Figure 8: The Competing Model: Structural Model
Five of the six paths in the competing model were significant and indicated positive
relationships between constructs. The most robust path existed in the link between destination brand

131
love and destination brand loyalty (β=0.773, p<.001, t=19.886; S.E=0.039). The impact of evaluation
of experiential attributes on destination brand love was the second strongest (β=0.718, p<.001,
t=18.914; S.E=0.038). Destination brand love influenced individual happiness and family
togetherness in a positive and highly significant (β=0.658, p<.001, t=20.417; S.E=0.032). In a similar
vein, brand trust impacted destination brand love in a significant way (β=0.218, p<.001, t=5.001;
S.E=0.044). Evaluation of experiential attributes also exerted significant influences on destination
brand loyalty (β=0.140, p<.001, t=3.188; S.E=0.044). From the perspective of path coefficients, the
competing model generated path results that were highly similar to those in the original structural
model generally, therefore suggesting that the original model is highly informative and competent.
The researcher then compared R2 values in the original model with those in the competing
model. The original model explained 68.8% (substantial), 37.4% (moderate) and 31.9% (moderate)
of the variance in destination brand love, family togetherness, and perceived happiness respectively
(Chin, 1998). It explained 65.4% (substantial), 71.5% (substantial), 67.1% (substantial), and 71.6%
(substantial) of the variances in cognitive loyalty, attitudinal loyalty, and conative loyalty.
The competing model is more data-driven and less theory-driven. It, according to Chin
(1998), explained 68.9% of the variances in destination brand love, showing a substantial predictive
power. The percentages of R2 values in the combined construct “individual happiness and family
togetherness” was 43.3%, suggesting a moderate predictive power (Chin, 1998). Moreover, it
explained 79.4% of the variances in the combined construct “destination brand loyalty,” also
indicating a substantial predictive power (Chin, 1998). The competing model’s power to predict the
combined construct loyalty construct appeared to be stronger than that in the original model.
Moreover, the competing model explained more variance in predicting the combined “individual
happiness and family togetherness” construct.

132
4.7 Mediation Analysis (H6a, H6b, and H6c)
This study examined not only direct effects between exogenous and endogenous variables but
also evaluates indirect effects of evaluation of experiential attributes on sequential stages of
destination brand loyalty (cognitive, attitudinal, and conative) via the mediating construct destination
brand love. The researcher adopted the bootstrapping procedure in SmartPLS M 3.0 to test the
mediating effects of the destination brand love construct. In Chapter Two, the researcher put forward
four mediation hypotheses (H6a, H6b, H6c, and H6d). H6a postulates that “destination brand love
mediates the direct relationship between the evaluation of experiential attributes and cognitive
loyalty.” H6b posits that “destination brand love mediates the direct relationship between the
evaluation of experiential attributes and attitudinal loyalty.” H6c hypothesizes that “destination
brand love mediates the direct relationship between the evaluation of experiential attributes and
conative loyalty.”
Path analysis determined destination brand love’s mediation effects. According to Table 18, this
study proposed four paths regarding the mediation effects of destination brand love in the evaluation
of experiential attributes → loyalty relationships. There are direct paths (evaluation of experiential
attributes → cognitive loyalty; evaluation of experiential attributes → attitudinal loyalty; evaluation
of experiential attributes → conative loyalty) and indirect paths (evaluation of experiential attributes
→ destination brand love → cognitive loyalty; evaluation of experiential attributes → destination
brand love → attitudinal loyalty; evaluation of experiential attributes → destination brand love →
conative loyalty).

133
Table 18: Mediation Analysis
Paths Direct effect Indirect effect Mediation
95% CI 95% CI
Confidence
Interval 95%
Confidence
Interval 95%
H6a: Eval → Cognitive Loyalty
LoLoyalty
0.218*** [0.113, 0.328] 0.442
*** [0.442, 0.439] Partial
mediation H6b: Eval → Attitudinal Loyalty 0.067 ns [-0.052, 0.153] 0.562
*** [0.562, 0.559] Full mediation
H6c: Eval → Conative Loyalty 0.047 ns [-0.051, 0.165] 0.555
***
[0.555, 0.557] Full mediation
Notes: 1. Eval= Evaluation of experiential attributes
2. * p < 0.05. ** p < 0.01. *** p < 0.001. ns: non-significant
The first step in interpreting mediation results is to explain direct effects and total effects (Hair
et al., 2017). Evaluation of experiential attributes has a significant and positive total effect on
cognitive loyalty (β =0.218; p< 0.001, CI=0.113-0.328). Therefore, the data supported H6a. In
contrast, no significant or effects were observed in the H6b evaluation of experiential attributes →
attitudinal loyalty (β =0.067, p>0.05, CI=-0.052-0.153) and H6c evaluation of experiential attributes
→ conative loyalty (β =0.047, p>0.05, CI=-0.051-0.165) relationships. Hence the data rejected H6c
and H6c.
According to Zhao et al. (2010), in the evaluation of experiential attributes → cognitive loyalty
(H6a) relationship, there might be complementary or competitive mediation happening. However,
for the paths evaluation of experiential attributes → attitudinal loyalty (H6b) and evaluation of
experiential attributes → conative loyalty (H6c), there might be no indirect only mediation
happening or no mediation at all (Zhao et al., 2010). To determine whether mediation effects do
exist requires a second step to test indirect effects.
The second step was to interpret indirect effects after adding the mediator destination brand love
(Hair et al., 2017). As shown in the right half of Table 16, destination brand love either fully or
134
partially mediated the relationships between the evaluation of experiential attributes and sequential
stages of destination brand loyalty (cognitive, attitudinal, and conative) positively. Even though the
path testing results demonstrated that evaluation of experiential attributes did not express statistically
significant effects on attitudinal loyalty and conative loyalty (H3c and H3d) at the .05 level, the
influences of evaluation of experiential attributes on these two sequential stages of loyalty turned out
to be highly significant after taking into account the indirect effect through destination brand love.
Specifically, the mediation effect of destination brand love in the evaluation of experiential attributes
→ attitudinal loyalty relationship (H6b) was positive and statistically significant (β =0.562, p<
0.001, CI=0.562-0.559). Similarly, the mediation effect of destination brand love in the evaluation of
experiential attributes → conative loyalty relationship (H6c) was also positive and statistically
significant (β =0.555, p< 0.001, CI=0.555-0.557).
As for the relationship between the evaluation of experiential attributes and cognitive loyalty
(H6c), it remains statistically significant after considering indirect effects of destination brand love
(β =0.442, p< 0.001, CI=0.442-0.439). Both the direct and indirect effects of evaluation of
experiential attributes on cognitive loyalty (H6c) were statistically significant at the .001 level. The
addition of the indirect effect of destination brand love increased the path coefficient from 0.218 (p <
0.001) to 0.442 (p < 0.001), a remarkable over 0.2 jump. As suggested by Zhao et al. (2010), this
type of mediation effect is complementary mediation, which refers to the situation where both
indirect and direct effects are significant and point in the same direction. This result echoed previous
findings that evaluation of experiential attributes is an important trigger of visitors’ cognitive loyalty,
and its triggering effect can be further strengthened when visitors develop a strong feeling of love
towards branded destinations.

135
4.8 Moderating Analysis (H7a, H7b_1, H7b_2, and H7b_3)
In structural equation models, moderators could be either observable traits such as
demographic information (e.g., age group, income) or unobservable or latent traits such as attitudes
and perceptions (Hair et al., 2017). Moderators can also be categorical (e.g., gender) or continuous
(e.g., income). To examine moderating effects in the conceptual model, the researcher conducted a
series of moderating analyses in SmartPLS M 3.0 using the bootstrapping procedure.
In SmartPLS, there are three moderation approaches available: the indicator approach, the
orthogonalizing approach, and the two-stage approach (Hair et al., 2017). The indicator approach is
not generally recommended for use in SmartPLS because it unavoidably causes collinearity in the
path model (Hair et al., 2017). The orthogonalizing approach is only suitable when the exogenous
construct/variable and the moderator construct/variable are both reflective, instead of formative
(Hair et al., 2017). If either the exogenous construct/variable or the moderator construct/variable is
formative, researchers should adopt the two-stage approach (Hair et al., 2017). However, if both the
exogenous construct/variable and the moderator construct/variable are reflective, and the goal of the
moderation analysis is to reveal the significance of the moderating effect, researchers should also
follow the two-stage approach (Hair et al., 2017). Considering that this study’s theoretical
framework is entirely reflective and the purpose of conducting moderation analyses is to test the
significance of the moderating effect, this study implements the two-stage approach, as suggested by
Hair et al. (2017).
4.8.1 The moderating effect of income.
The income variable in this study, question 19, is a categorical variable, with 1 representing a
personal after-tax monthly income of lower than 3,000 Chinese Yuan and 10 representing a personal

136
after-tax monthly income of more than 27,001 Chinese Yuan. The mean of this variable is 4.00, and
its standard deviation is 2.53.
H7a hypothesized that “income moderates the link between destination brand love and family
togetherness significantly; specifically, the relationship between destination brand love and family
togetherness is weaker for high-income visitors and stronger for low-income visitors.” The
moderation results generated by bootstrapping indicated that income exerted a negative effect on the
relationship between destination brand love and family togetherness (β= -0.116; p <0.05; t= 2.902;
S.E= 0.040), whereas the simple effect of destination brand love and family togetherness is 0.613
(p<0.05). Jointly, these results suggested that the relationship between destination brand love and
family togetherness is 0.613 for an average level of income. For higher levels of income, this
relationship decreases by the size of the interaction term. (i.e., 0.613-0.116=0.497).
In contrast, for lower levels of income, this relationship increases by the size of 0.729, which
is equal to 0.613+0.116. The analysis yielded a p-value of 0.004 for the path linking the interaction
term income and the endogenous construct destination brand love. Similarly, the 95% confidence
interval of the interaction term’s effect is [-0.193, -0.045], which does not include 0. Hence, we can
conclude that the moderation effect is statistically significant at the 95% confidence interval level. In
other words, the data supported Hypothesis 7b.
The moderation results showed that higher income levels entail a weaker relationship
between visitors’ Destination Brand Love and Family Togetherness, while lower levels of income
lead to a stronger relationship between visitors’ destination brand love and family togetherness. The
boosting effect of destination brand love on family togetherness is higher for low-income visitors
than for their high-income counterparts (Figure 9).

137
Figure 9: The Moderating Effect of Income on the Relationship between Destination Brand
Love and Family Togetherness
4.8.2 The moderating effect of first-timers versus repeat visitors.
Question No.2 in the questionnaire asked respondents “is this your first time visiting
Shanghai Disney Resort?” with one being “Yes” and two being “No.” This is also a categorical
variable. The researcher dummy coded this variable to make one stand for “Yes” and 0 stands for
“No.” The bootstrapping procedure in SmartPLS yielded the testing results of the moderating effect
of this variable. Chapter Two proposes four hypotheses (H7c_1, H7c_2, H7c_3, and H7c_4) using
this variable as a moderator; however, the data only supported one hypothesis (H7c_3).
H7b_1 postulates that “first-timers versus repeat visitors moderates the links between
visitors’ evaluation of experiential attributes and cognitive loyalty; specifically, the relationship
between visitors’ evaluation of experiential attributes and cognitive loyalty is weaker for first-timers

138
and stronger for repeat visitors.” The moderation results in the bootstrapping outputs revealed that
the interaction term did not exert any significant effect of the relationship between evaluation of
experiential attributes and cognitive loyalty (β= 0.033; p >0.05; t=0.852; S.E=0.039) (Figure 10).
The analysis yielded a p-value of 0.394 for the path linking the interaction term and the endogenous
construct Cognitive Loyalty. Furthermore, the 95% confidence interval of the interaction term’s
effect is [-0.041, 0.113], which includes 0. Thus, we can conclude that the moderation effect was
statistically insignificant at the 95% confidence interval level. The data rejected Hypothesis 7c_1.
Figure 10: The Moderating Effect of First Timers versus Repeat Visitors on the Relationship
between Evaluation of Experiential Attributes and Cognitive Loyalty
H7b_2 assumes that “first-timers versus repeat visitors moderates the links between visitors’
evaluation of experiential attributes and attitudinal loyalty; specifically, the relationship between
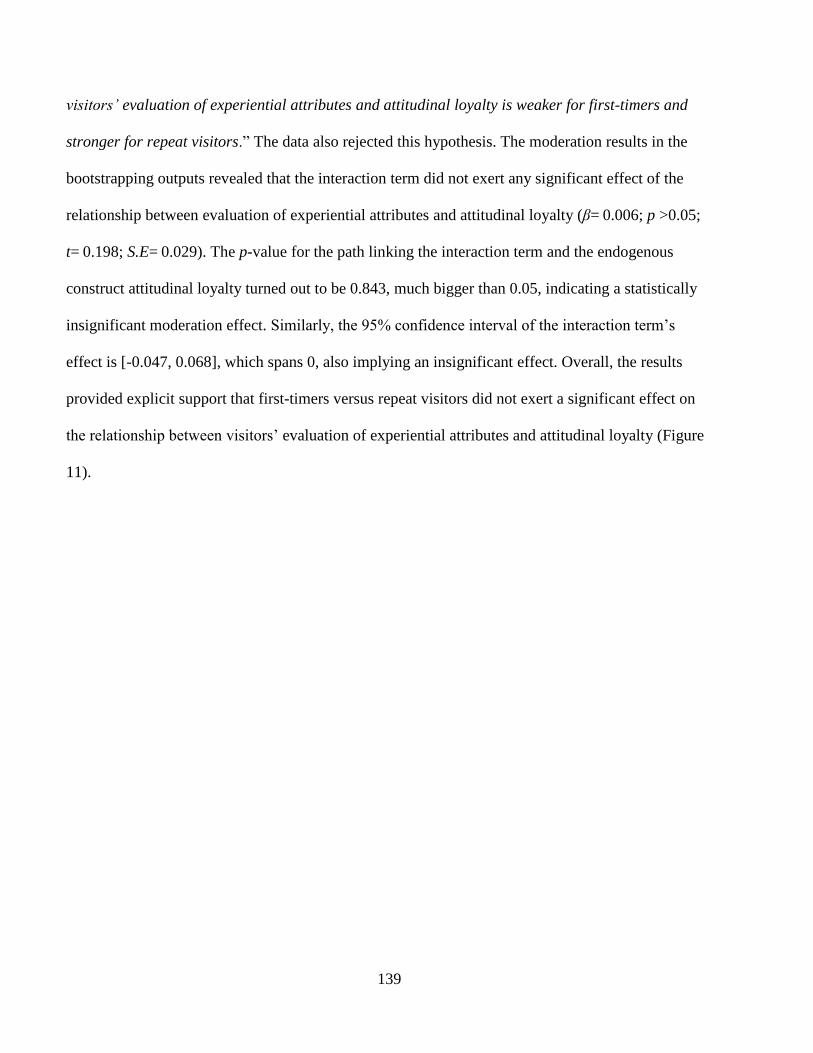
139
visitors’ evaluation of experiential attributes and attitudinal loyalty is weaker for first-timers and
stronger for repeat visitors.” The data also rejected this hypothesis. The moderation results in the
bootstrapping outputs revealed that the interaction term did not exert any significant effect of the
relationship between evaluation of experiential attributes and attitudinal loyalty (β= 0.006; p >0.05;
t= 0.198; S.E= 0.029). The p-value for the path linking the interaction term and the endogenous
construct attitudinal loyalty turned out to be 0.843, much bigger than 0.05, indicating a statistically
insignificant moderation effect. Similarly, the 95% confidence interval of the interaction term’s
effect is [-0.047, 0.068], which spans 0, also implying an insignificant effect. Overall, the results
provided explicit support that first-timers versus repeat visitors did not exert a significant effect on
the relationship between visitors’ evaluation of experiential attributes and attitudinal loyalty (Figure
11).

140
Figure 11: The Moderating Effect of First Timers versus Repeat Visitors on the Relationship
between Evaluation of Experiential Attributes and Attitudinal Loyalty
H7b_3 conjectures that “first-timers versus repeat visitors moderates the links between
visitors’ evaluation of experiential attributes and conative loyalty; specifically, the relationship
between visitors’ evaluation of experiential attributes and conative loyalty is weaker for first-timers
and stronger for repeat visitors.” The interaction term exerted a positive and significant effect on the
endogenous construct conative loyalty (β= 0.060; p <0.05; t= 2.154; S.E= 0.028). The analysis
yielded a significant p-value, 0.032, for the path linking the interaction term and the endogenous
construct conative loyalty. The 95% confidence interval of the interaction term’s effect is [0.004,
0.115], including 0. Overall, these results fully supported this hypothesis by providing evidence that
first-timers versus repeat visitors had a significant and positive impact on the relationship between
the evaluation of experiential attributes and conative loyalty (Figure 12). In other words, the

141
influence of evaluation of experiential attributes on conative loyalty is stronger among repeat
visitors.
Figure 12: The Moderating Effect of First Timers versus Repeat Visitors on the Relationship
between Evaluation of Experiential Attributes and Conative Loyalty
The simple effect of evaluation of experiential attributes on conative loyalty is 0.047
(p>0.05). For repeat visitors, the relationship between the evaluation of experiential attributes and
conative loyalty increases by the size of the interaction term (i.e., 0.047+0.060=0.107). On the
contrary, for first-time visitors, this relationship becomes -0.013 (0.047-0.060). Therefore, the status
of being a repeat visitor entail a stronger relationship between the evaluation of experiential

142
attributes and conative loyalty, while the status of being a first-time visitor lead to a weaker
relationship.

143
Chapter Five: Discussion and Conclusion
As mentioned in the Introduction chapter, the first research objective was to validate and
establish the marketing construct of destination brand love. Measurement items of each of sub-
dimension showed satisfying reliability and validity and are ready to be adopted by future
destination branding research. These items capture the following dimensions: self-brand integration
(SBI), passion-driven behaviours (PDB), positive emotional connection (PEC), long-term
relationship (LR), attitude valence (AV), and attitude strength (AS) (Batra et al., 2012).
This dissertation secondly aimed to propose, test, and establish a conceptual framework of
antecedents and consequences of destination brand love in a theme-park tourism context. Data
collected from 427 family visitors at Shanghai Disneytown suggested brand trust and evaluation of
experiential attributes as two significant exogenous latent constructs leading to destination brand
love, which, in turn, impacted sequential stages of destination brand loyalty (cognitive, attitudinal,
and conative loyalty), visitor perceived happiness and their family togetherness. Brand awareness
turned out to have little influence on destination brand love.
The third objective of this dissertation was to test destination brand love’s mediating role in
the relationship between evaluation of experiential attributes and four sequential stages of
destination brand loyalty (cognitive, attitudinal, and conative loyalty). Bootstrapping results
demonstrated that destination brand love functioned as a significant mediating construct in the
relationship between the evaluation of experiential attributes and attitudinal brand loyalty and that
between the evaluation of experiential attributes and conative brand loyalty. However, there was no
significant mediating effect in the evaluation of experiential attributes → cognitive loyalty
relationship.

144
Lastly, the fourth research objective was to examine the moderating role of income in the
link between destination brand love and family togetherness and the moderating role of first-time
versus repeat visitors in the link between the evaluation of experiential attributes and sequential
stages of destination brand loyalty (cognitive, attitudinal, and conative loyalty). Results indicated
that for family visitors at branded destinations, the boosting effect of destination brand love on
family togetherness was more significant for low-income families than for their high-income
counterparts. Additionally, compared with first-time visitors, the influence of evaluation of
experiential attributes on conative brand loyalty was stronger among repeat visitors. As a summary,
the findings supported 15 out of the 20 hypotheses put forward in the Literature Review chapter.
This chapter discusses the results of a few hypotheses testing in the conceptual framework, as
well as mediating assessments. This chapter comprises of ten sections. Section 5.1 provides a
synopsis of the sub-dimensions of destination brand love. Section 5.2 discusses three drivers of
destination brand love, namely, brand awareness, brand trust, and evaluation of experiential
attributes. Section 5.3 discusses the evaluation of experiential attributes in relation to cognitive,
attitudinal, and conative destination brand loyalty. After that, Section 5.4 focuses on destination
brand love’s outcomes from the business (four sequential stages of destination brand loyalty),
familial (family togetherness) and individual (perceived happiness) perspectives. Section 5.5
discusses the mediating effects of destination brand love. The competing model is discussed in
section 5.6. This chapter then presents theoretical and practical implications (Section 5.7), followed
by limitations (Section 5.8), future research directions (Section 5.9), and a conclusion (Section 5.10).

145
5.1 Measurement items of Destination Brand Love
The measurement model testing identified the multi-dimensionality of the construct of
destination brand love. Measurement items under the six sub-dimensions, which are self-brand
integration (SBI), passion-driven behaviours (PDB), positive emotional connection (pec), long-term
relationship (LR), attitude valence (AV), and attitude strength (Batra et al., 2012), all turned out to
be statistically significant at the 99.9% confidence interval level. These measurement items capture
both cognitive (i.e., SBI) and affective (i.e., PDB, PEC, LR, AV, and AS) facets. Therefore, brand
love is multidimensional, an idea echoed by scholars such as Sarkar (2011) and Batra et al. (2012).
The unidimensional brand love items proposed by Carroll and Ahuvia (2006) tend to be single-
faceted and should be used with caution.
Besides, measurement items of destination brand love all turned out to be valid in the context
of theme-park based tourism and thus can be utilized in future tourism-related research. Even though
these sub-dimensions originated from product brand contexts, this study successfully adapted and
applied them in a tourism context and confirmed their validity and reliability. Each sub-dimension of
destination brand love also contains multiple measurements.
5.2 Drivers of Destination Brand Love
This section interprets the results associated with the influences of three drivers of
destination brand love, namely, brand awareness, brand trust, and evaluation of experiential
attributes. Specifically, section 5.2.1, 5.2.2, and 5.2.3 interpret testing results of Hypothesis 1
“Destination brand awareness will have a positive effect on destination brand love”, Hypothesis 2
“Destination brand trust will have a positive effect on destination brand love”, and Hypothesis 3a
146
“Evaluation of experiential attributes will have a positive effect on destination brand love”
respectively.
5.2.1 Brand awareness.
Academia has long recognized that consumer awareness functions as a driver of consumer
perceptions and behaviours (e.g., Carroll & Ahuvia, 2006; Kuenzel & Halliday, 2008). Previous
empirical studies have also indicated that brand awareness positively influences brand love (Albert
& Merunka, 2013; Bergkvist & Bech-Larsen, 2010), brand purchase (Esch, Langner, Schmitt, &
Geus, 2006), and brand image (Esch et al., 2006). For product brands, especially newly launched
product brands, the higher consumers’ brand awareness is, the more probable that they will develop
a sense of love towards this brand. Esch et al. (2006), for example, found that brand awareness
significantly impacts consumers’ current purchases. However, this argument may only hold valid in
product brand contexts. The lack of a statistically significant link between brand awareness and
destination brand love is contrary to a range of existing theories and findings. The results of this
dissertation rejected the prediction that brand awareness significantly affects destination brand love.
Specifically, in the theme park visitation context, visitors’ awareness of a branded destination does
not exert significant influences on their love towards the destination. In other words, brand
awareness is not a determinant for destination brand love.
However, given the context of Disneyland, such results are both predictable and
understandable. The insignificant influence of brand awareness on brand love may arise for at least
three reasons. First, since the first Disneyland in the world opened on July 17, 1955, in Anaheim,
California, Disneyland has been in business for more than 60 years, and its brand image has been
pervasive. Due to China’s Reform and Opening up policy in 1979, a massive influx of western
culture and commercials familiarized Chinese born in the 1980s and later with western brands.

147
Disney, a successful western brand, has immersed in everyday life of young Chinese. It is easy for
these people to recognize Disney retailer products, see Disneyland advertisements, and watch Disney
movies. For some Chinese, although the intense awareness of Disney brand may have existed in
their minds for a long time, the awareness itself does not necessarily mean brand love.
Second, the Disney brand has multiple product and service lines such as cruises, movies,
toys, and theme parks, making the brand even more omnipresent. Disney movies have almost
dominated the cartoon and kid movie industry for many years. Numerous Chinese families with
young kids have watched Disney movies. For some Chinese born in the 1980s, 1990s and later,
classic Disney movies, such as Lion King, become their favourite childhood cartoons or movies.
Shanghai Disneyland’s Disney Theater has the musical Lion King on show all year round, making it
possible for Chinese families to enjoy this famous musical at their home country so that they do not
need to travel abroad to watch it. A famous song from the movie Lion King “Can you feel my love
tonight” is also a popular song in China, which has a translated Chinese version. It is also notable
that Disney is not only famous in mainland China, but also in Taiwan, Hong Kong Special
Administration Region (SAR), and Macao SAR. The various product and service lines of Disney
make the majority of urban Chinese aware of the brand; however, knowing the brand does not
inherently mean a strong and positive emotional bond with the brand.
Third, Shanghai Disneyland is a unique context. Many respondents may have known
Disneyland and may have visited Disneyland in Paris, Tokyo, California, Orlando, or Hong Kong
SAR before visiting the Shanghai one. People could not bump into Disney like bumping into a
stranger in downtown. It is easy for potential visitors to be exposed to Shanghai Disney
advertisements or word of mouth. Before arrival at Shanghai Disney Resort, many visitors must have
already watched Shanghai Disneyland’s advertisements on TVs or video broadcasts, at subway

148
stations, or have heard other people talking about Shanghai Disney. Thus, merely knowing the brand
does not suffice to mean that they will become emotionally connected with Disneyland. Such
considerations provide a coherent and logical explanation for the lack of significant associations
between brand awareness and destination brand love through demonstrating that such findings can
be attributed to the market dynamics and the context of Shanghai Disneyland. Therefore, merely
establishing visitor awareness of a branded designation is far from enough in the establishment of
destination brand love among visitors. DMOs and attraction stakeholders must avoid negative brand
awareness and identify other drivers of destination brand love to which they can direct marketing
efforts.
5.2.2. Brand trust.
Delgado-Ballester et al. (2003) contended that it is crucial to evaluate consumers’ trust in this
brand if a company aims to understand its CBR. Trust functions as the most significant attribute that
a brand might possess. A destination brand should establish its image as reliable, trustworthy,
honest, and genuine (Chaudhuri & Holbrook, 2001; Hess, 1995). This dissertation concluded brand
trust’s antecedent role of fostering destination brand love. The finding is consistent with previous
research. For instance, Albert and Merunka (2013) conducted online research on consumers’
relationship with a brand among 1,505 French survey participants and concluded that two of the
three brand trust dimensions (reliability and honesty) impact people’s brand love. Their data suggest
it is imperative for DMOs to establish trust among visitors if they are to enhance relationships
between visitors and a branded destination.

149
5.2.3. The evaluation of experiential attributes and destination brand love.
Positive evaluation of experiential attributes represents an outcome of relationship marketing
(e.g., Sharifi & Esfidani, 2014). The formation of visitor satisfaction/dissatisfaction requires actual
experiences with a branded destination. Therefore, the evaluation of experiential attributes plays
meaningful roles in visitors’ destination brand love. These experiences are a constellation of peer
interactions, service encounters, weather conditions, accessibility, transportation, and so on, and are
difficult to control. Distinct from products, the production and consumption of visiting experiences
happen simultaneously, making destination brand love more complex than product brand love.
Compared with some pre-existing brand beliefs and brand relationships, i.e., brand awareness and
brand trust, tourists’ satisfaction with actual on-site personal experiences matter most in the
constitution of destination brand love. In other words, it is necessary for DMOs to ensure satisfying
visitor experiences to establish and maintain destination brand love.
As mentioned in the literature review, the present study draws upon Oliver’s (1993) attribute-
level approach of satisfaction conceptualization, also called a cumulative evaluation of satisfaction
by Ha and Perks (2005). Therefore, the construct evaluation of experiential attributes measures
multiple facets, namely, shopping, activities and events, lodging, accessibility, attractions,
environment, and dining (Chi & Qu, 2008). All of these facets are brand touchpoints, as mentioned
in Chapter Two. Visitors’ encounter and experiences with each brand touchpoint influence their
evaluations of branded destinations.
It should also be noted that although customers’ post-consumption satisfaction may produce
emotional attachment with a brand over time through manifold interactions with brand touchpoints
(Thomson et al., 2005), being satisfied with a branded destination does not mean that visitors will
experience brand love (Carroll & Ahuvia, 2006; Roy et al., 2013; Sarkar, 2011). Visitors’

150
satisfaction with a brand must be longstanding for it to be transformed into brand love (Sarkar,
2011). Short-termed customer satisfaction, for example, the satisfaction from short-term price
discount, may not be sufficient to cause brand love (Sarkar, 2011). DMOs and other destination
markers should ensure visitors’ positive evaluation of experiential attributes at each brand touchpoint
and provide visitors with experiences that are delighted, long-term, and unique. Enhancing visitor
satisfaction also prevents visitors from switching to other alternative destinations.
5.3 The Evaluation of Experiential Attributes and Destination Brand Loyalty
This dissertation tested four hypotheses concerning the direct effects of evaluation of
experiential attributes on cognitive, attitudinal, and conative loyalty. It appeared that associations
between the evaluation of experiential attributes and the four sequential stages of loyalty vary in
magnitude. The findings supported the influences of evaluation of experiential attributes on
cognitive loyalty. In other words, statistically strong and meaningful links exist between the
evaluation of experiential attributes and cognitive loyalty. The statistical insignificance of evaluation
of experiential attributes in constituting attitudinal and conative brand loyalty calls our attention
although it has emerged as a vital stage of the development of brand loyalty in a broad range of
existing publications (e.g., Chaudhuri & Holbrook, 2001; Johnson et al., 2006; Keller, 2013; Park &
Jang, 2014).
The findings that evaluation of experiential attributes did not generate significant influences
on attitudinal and conative loyalty are consistent with existing literature (e.g., Oliver, 1999)
concerning the fact that customer satisfaction does not necessarily translate into loyalty. Oliver
(1999, p. 33) emphasized that “satisfaction is a necessary step in loyalty formation but becomes less
significant as loyalty begins to set through other mechanisms.” The researcher conducted a few

151
mediating tests to explore the mediating effects of destination brand love in the evaluation of
experiential attributes →loyalty link, as discussed in Section 4.7.
Cognitive loyalty lies at the most fundamental and foremost level of loyalty development
(Oliver, 1999) and therefore is vulnerable. It mainly depends on brand information that is available
to consumers (Pedersen & Nysveen, 2001). The result of hypothesis 3b (evaluation of experiential
attributes will have a positive effect on cognitive loyalty) showed that a statistically meaningful and
robust link exists between the evaluation of experiential attributes and cognitive loyalty. In other
words, visitor evaluation of on-site experiences holds a notable and significant part in building
cognitive loyalty. As positive visitor evaluation increases, so do their cognitive loyalty levels.
Satisfied visitors tend to be cognitively brand loyal. Promoting theme park visitors’ cognitive loyalty
requires ensuring positive visitor evaluation with multiple on-site experiences, such as service,
products, atmosphere, and transportation. Therefore, Shanghai Disney Resort should ensure that it
provides sufficient positive and attractive destination-related information to visitors to encourage
visitors’ cognitive loyalty. However, this finding is inconsistent with Yuksel et al. (2010), who found
that customer satisfaction does not contribute to cognitive loyalty.
Hypothesis 3c hypothesizes that the evaluation of experiential attributes will have a positive
effect on attitudinal loyalty and the data rejected it. This finding contradicted with previous findings
(e.g., Härtel & Russell-Bennett, 2010; Johnson et al., 2006; Sharifi & Esfidani, 2014) which
suggested that evaluation of experiential attributes is a precursor of attitudinal loyalty. For example,
Sharifi and Esfidani’s (2014) survey of cellphone consumers found that customer satisfaction
positively and significantly impacted attitudinal loyalty. Due to these inconsistencies in the present
findings, more endeavours are needed to identify visitor satisfaction’s influences on attitudinal
loyalty further.

152
In summary, this research confirmed that evaluation of experiential attributes is a necessary
antecedent latent construct affecting cognitive loyalty. Visitors who thought their experiences
satisfactory tend to be cognitively brand loyal. Nevertheless, they did not show a significant
tendency to be attitudinally or cognitively brand loyal. Therefore, a valuable conclusion here is that
not all four dimensions of loyalty play significant roles in every situation where brand loyalty
prevails.
5.4 Business and Familial Outcomes of Destination Brand Love
5.4.1. Destination brand love’s relative impacts on loyalty.
This dissertation found that destination brand love is a significant predictor of cognitive,
attitudinal, and conative loyalty. It, therefore, provides further evidence to the argument that brand
loyalty is an outcome of brand love (Albert & Merunka, 2013; Carroll & Ahuvia, 2006; Dick &
Basu, 1994; Sarkar, 2011; Whang et al., 2004). More importantly, the study results suggested that
destination brand love and destination brand loyalty are two independent and different concepts and
marketing constructs.
Results of Hypothesis 4b (Destination brand love will have a positive effect on attitudinal
loyalty) showed that destination brand love positively affects attitudinal loyalty. This finding
confirmed the importance of affect in strengthening visitor relationships with destinations. What is
worthy of being noted is that destination brand love positively influenced all four sequential stages
of brand loyalty, but it is attitudinal loyalty that was influenced most by destination brand love. The
result echoed Albert and Merunka’s (2013) conclusion that brand love has the most significant
impact on affective brand loyalty and brand commitment.
153
5.4.2 Linkages between destination brand love and family togetherness.
Visiting experiences benefit not only individuals but also families as units. When people visit
a branded destination with their family members, their brand love towards this destination fosters
family togetherness in a significant way. Although very few previous studies have examined the
association between destination brand love and family togetherness, there exists abundant research
that indicates a strong connection between travel and family togetherness. Lehto, Fu, Li, and Zhou
(2017), for instance, mentioned that travel experiences enable families to develop close relationships
and promote a sense of togetherness. Fu, Cai, and Lehto’s (2017) investigation into Chinese tourist
motivations concluded that family togetherness stood out as the second crucial motivational factor in
the nine-dimension motivation framework for Chinese tourists. Their study also stressed that
Chinese tourists value “building a stronger family bond,” “sharing quality time with my family,” and
“communicating better with my family” during travel (Fu et al., 2017, p. 158). In the case of visiting
theme park destinations, this dissertation concluded that visitors’ love towards the brand enhances
their family togetherness.
5.5 Destination Brand Love as a Mediator
The mediation testing results supported all four mediation relationships hypothesized in this
study (H6a, H6b, H6c, and H6d). They differ in magnitude though. Among the four relationships,
two (H6b and H6c) were indirect-only mediation paths, and the other two were complementary
mediation paths (H6a and H6d) (Zhao et al., 2010). The indirect effects of destination brand love
(H6b: evaluation of experiential attributes → destination brand love →attitudinal loyalty; H6c:
evaluation of experiential attributes → destination brand love →conative loyalty) in the research

154
model are significant. These two mediation effects are indirect-only mediation, which means that
even though the direct effect is insignificant, the indirect effect is significant (Zhao et al., 2010).
Consequently, destination brand love mediated these two relationships fully. Destination
brand love largely triggered the significant correlation between the evaluation of experiential
attributes and these two phases of loyalty. It, therefore, is a crucial factor for visitors to develop
certain levels of attitudinal loyalty and conative loyalty towards a branded destination.
5.6 Summary of the Competing Model
In the competing model, all four sequential stages of brand loyalty merged into one construct
named “destination brand loyalty.” Family togetherness and perceived happiness merged into one
construct which is “individual happiness and family togetherness.” Both of these two merges deserve
consideration in future investigations. Theoretically, the four sequential stages of loyalty
development should be distinct from each other (Oliver, 1997) and each latter stage builds upon the
former one. Similarly, perceived happiness and family togetherness are also two different theoretical
constructs (Lyubomirsky et al., 2015; Williams & Anthony, 2015). Part of the reasons that these
constructs merged is that the study context is the Shanghai Disney Resort, a family-oriented vacation
context (Shaw et al., 2008). The literature (e.g., Shaw et al., 2008) suggested that the meaning of
family vacations and family excursions is that families get chances to get together to enjoy some
quality time together, to create happy family memories, and to get rid of mundane daily life and
working schedule. Whether the above constructs would merge again in other consumer behaviour
contexts remains unknown. Future endeavours may collect data in other consumer behaviour settings
to re-test how these factors would combine.

155
5.7 Implications
This dissertation initiated a pioneering empirical investigation of the destination brand love
framework (Figure 2). The discovery of destination brand love’s antecedents, benefits, and the
linkages between antecedents, benefits, and visitor perceptions generated both theoretical and
pragmatic ramifications. The initial design, examination, and establishment of the destination brand
love framework illuminate the branding and destination literature by introducing a new conceptual
model and a set of destination brand love measures. Moreover, the findings can assist academics,
DMOs and other destination marketers and stakeholders in their understanding of the development
of destination brand love in the theme-park based tourism context.
5.7.1 Theoretical contributions.
This dissertation generated several new implications from a theoretical perspective. The main
contribution of the study is the establishment of a conceptual framework of antecedents and
consequences of destination brand love in a theme-park travel context (Figure 2). The framework
covers both business and non-business outcomes of destination brand love. It offers new insights for
academics and practitioners alike in conceptualizing brand-related and experience-related
antecedents and consequences of destination brand love in the context of theme-park based tourism.
Additionally, much existing loyalty research has neglected the cognitive, attitudinal, and conative
constituents of loyalty. This study narrowed this gap by clarifying destination brand love’s impacts
on these three sequential stages of loyalty.
156
5.7.1.1 The destination brand love framework and destination brand love scales.
This study successfully established the multi-dimensional and multi-indicator framework of
antecedents and consequences of destination brand love in a theme-park travel context (Figure 2). In
this conceptual framework, destination brand love functions as a significant mediating construct
between visitors’ pre-visit, visit, and post-visit experiences. This framework informs that destination
brand love brings about ideal business (cognitive, attitudinal, and conative loyalty), individual
(visitor perceived happiness), and familial (family togetherness) outcomes. Visitors’ destination
brand love originates from relational and experiential marketing constructs, i.e., brand trust and
evaluation of experiential attributes. The two antecedent constructs of destination brand love are
brand trust and evaluation of experiential attributes. Outcome constructs include cognitive loyalty,
attitudinal loyalty, and conative loyalty, perceived happiness, and family togetherness. This
framework provides the first quantitative, confirmative, and systematic way of examining
destination brand love in a theme park based tourism context. More importantly, a total of 18
destination brand love measurement items were validated and established. This set of destination
brand love items are ready to be adopted in future destination branding research.
5.7.1.2 Quantitative and confirmatory destination brand love research.
Brand love is a relatively new marketing construct. Existing brand love research is mostly
conducted in product brand contexts (e.g., Carroll & Ahuvia, 2006). Destination brand love is also a
newly introduced construct in tourism studies (e.g., Aro et al., 2018; Swanson et al., 2015a).
Compared with CBR constructs such as emotional attachment, brand romance (Patwardhan &
Balasubramanian, 2011), brand passion (Bauer, Heinrich, & Martin, 2007), and brand trust (Ball,
Simões Coelho, & Machás, 2004; Javed, Roy, & Mansoor, 2015), brand love is a more inclusive and

157
powerful construct in terms of capturing the intense emotional bond between tourists and branded
destinations. Despite its significance, only limited research has been conducted to understand
tourists’ brand love towards destinations. The measurement items of destination brand love have not
yet been clarified quantitatively.
Current studies on brand love in tourism remain qualitative, exploratory, and theoretical (e.g.,
Aro et al., 2018; Swanson et al., 2015a). Swanson et al. (2015a) noted that brand love is new to
destination research and had never been explored in the context of tourism. Swanson et al. (2015a)
employed semi-structured interviews, volunteer-employed photography and consumer collage
creation to explore tourist love in respect of the place they visited. Their findings suggested thirteen
major themes that belong to four categories: “antecedents, relational themes (involving relationships
between others, oneself and the place), experiential themes (relating to the experience of being at the
place) and outcomes” (p. 144). Later, in a qualitative case study of an outdoor resort in Finnish
Lapland, Aro et al. (2018) identified a set of destination brand love antecedents and consequences.
Both of the two studies stayed at the qualitative and conceptual level. Aro et al. (2018) emphasized
that “once destination brand love has been sufficiently explored qualitatively, further studies could
develop quantitative measures” (p. 80).
This study initiated quantitative and confirmatory destination brand love research in tourism.
The establishment of the destination brand love construct and its measurement items illuminate the
literature regarding the multi-faceted tourist-destination relationships. This study provided an
inclusive marketing construct to measure tourist relationship with branded destinations.

158
5.7.1.3 Keller’s CBBE model in tourism research.
Keller’s (2013) CBBE model suggests that brand development involves four primary stages,
brand awareness, brand performance and brand imagery, brand judgement and feeling, and brand
resonance (loyalty). The conceptual framework of antecedents and consequences of destination
brand love in a theme-park visitation context (Figure 2) that was established in this study delineates
the process in which visitors experience branded destinations in three stages: pre-visit, visit, and
post-visit. Visitors’ experience with branded destinations starts from knowing a destination brand to
experiencing it on-site, evaluating it, and ultimately (for some) becoming loyal to it. In this process,
destination brand love plays a key mediating role. The pre-visit, visit, and post-visit process
coincides with the four primary stages in Keller’s (2013) CBBE model, indicating that the CBBE
model is highly applicable in destination research. The conceptual framework (Figure 2) itself serves
as a variation of Keller’s (2013) CBBE model in tourism research.
5.7.1.4 Chinese family visitors in destination branding research.
The market segment of Chinese family visitors is fast emerging. Its growing importance
deserves more scholarly attention especially considering that many theme park brands’ target market
is mainly family visitors (Lehto et al., 2017). However, this market segment has not received as
much scholarly investigation as it warrants (Lehto et al., 2017). Little is known as to Chinese
families’ experiences at theme-park destinations. This study confirmed destination brand love’s
boosting effects in enhancing family visitors’ perceived happiness, family togetherness, and
destination brand loyalty. Therefore, this dissertation bridges the gap that relatively scarce literature
exists on Chinese family visitors’ brand experiences at destinations.

159
5.7.2 Practical implications.
5.7.2.1 A driver of revenue and visitor loyalty.
The results have important implications for DMOs and other destination practitioners. By
applying the multi-dimensional destination brand love scales in tourist surveys, DMOs and other
destination stakeholders can get a better understanding of the constitution of tourist love towards a
destination. The following six sub-dimensions all contribute significantly to tourists’ destination
brand love: self-brand integration, passion-driven behaviours, long-term relationship, positive
emotional connection, attitude valence, and attitude strength (Batra et al., 2012; Bergkvist & Bech-
Larsen, 2010). Given the significant effect of destination brand love on retaining tourist loyalty,
DMOs conduct regular destination brand love surveys to identify areas that need to be improved. For
example, if tourists perceive a low level of integration between their self-identity and destination
images, DMOs should highlight the destination’s connection with tourists’ current and desired self-
images through marketing strategies such as social media promotions. If tourists lack passion-driven
behaviours and are unwilling to spend money and time visiting the destination, it is beneficial to
reshape destination attractiveness and uniqueness. The “fun,” “interesting,” “relaxing,” and
“exciting” images of destinations should be maintained to ensure a positive emotional connection
between destinations and tourists or visitors.
5.7.2.2 Visitor psychological well-being and happiness.
Tourist well-being, happiness, and quality of life have been topics of increasing relevance to
tourism studies (e.g., Filep, 2014). Tourism researchers have focused on understanding tourism or
visitation experiences (e.g., Filep & Deery, 2010; McCabe & Johnson, 2013)) but paid relatively
little attention on how they could extend their findings and methods to help visitors enhance

160
individual and familial well-being. This dissertation abandoned the “brand love only leads to loyalty
or merely business outcomes” paradigm and examined the effects of destination brand love on
enhancing visitor perceived happiness and family togetherness. The results demonstrated that
destination brand love could produce optimal outcomes for individual well-being and family
cohesion. For visitors who experience destination brand love on-site, it is more probable that they
will feel happy regardless of what is going on in life (Lyubomirsky & Lepper, 1999). Compared to
their peers, they tend to regard themselves as happier individuals who enjoy life and get the most out
of everything (Lyubomirsky & Lepper, 1999). They will also feel that they enjoyed the time spent
together as a family and their families get along well with each other (Lyubomirsky & Lepper,
1999). Therefore, family kinship can be enhanced, which eventually lead to enhanced well-being
(Williams & Anthony, 2015). These findings can be used to help visitors gain a better understanding
of the non-business and well-being-related benefits of travel.
5.7.2.3 Low-income families.
Leisure constraints traditionally are classified into structural, interpersonal, and intrapersonal
(Crawford, Jackson, & Godbey, 1991). Income is a typical example of structural barriers which
frequently exert influences on tourism behaviours. Generally, lower-income families are subject to
more or stronger structural constraints which account for nonparticipation in leisure. This study
tested “income” as a structural constraint, and the results suggested that destination brand love
benefits individuals and families significantly through a positive connection with branded
destinations. No matter what the level of visitor income is, destination brand love enhances visitors’
family bonding if they travelled with family members at a branded destination. For relatively low-

161
income families, the boosting impact of destination brand love on family togetherness is stronger
than that for relatively high-income families.
Corporations are usually criticized for only focusing merely on business outcomes, such as
revenue and customer loyalty. Positive experiences at branded destinations could lead to favourable
non-business outcomes and are beneficial for low-income families, whether they are single-parent,
single-earner, or less educated families. Improving access for low-income families to visit branded
destinations could enhance their family cohesion in a significant way. What can branded destinations
do to ensure that low-income families have good chances of visiting as high-income families?
Strategies such as cutting the ticket price, bringing them there for free, providing coupons, free
passes, or free public transportation to the park area will help negotiate structural constraints. Keep
making low-income families happy is a worthwhile topic for DMOs to consider.
5.7.2.4 Brand awareness’s lack of sufficiency.
In brand management practice, brand awareness is an essential component of brand equity
and a key brand performance for assuring successful marketing campaigns (Aaker, 1991: Keller,
2013). Despite its importance, the findings suggested that only focusing on enhancing visitors’
awareness of a branded destination is not sufficient to establish or increase visitors’ destination
brand love, especially when this particular branded destination is highly pervasive and
comprehensive. DMOs and attraction stakeholders of theme-park destinations are advised to monitor
and optimize other brand relationship factors such as visitors’ brand trust and visitors’ positive
evaluation of experiential attributes to ensure long-term sustainable brand development. Both brand
trust and evaluation of experiential attributes play meaningful roles in visitor loyalty, perceived
happiness, and family togetherness. In other words, DMOs and attraction stakeholders should

162
develop tactical initiatives that to make sure that visitors are satisfied with the destination from
multiple perspectives, such as product quality, atmosphere, accessibility, transportation, destination
security, the variety of cuisine choices, and sanitation. Furthermore, they should also ensure that
visitors trust the destination and feel attached to it.
5.8 Limitations
Several limitations exist in the present research. This section discusses two limitations
concerning partial disclosure and feedback effects.
5.8.1 Partial disclosure.
This study involves partial disclosure. The researcher informed participants of the purposes
of this study and notified that they would receive a thank-you gift for agreeing to participate in a
follow-up study before completing the survey. Doing so might influence how participants respond to
the visiting-experience-related questions posed in the study. For example, people may be much more
motivated to complete the questionnaire if they knew about the possibility of receiving the voucher
beforehand. Also, the wording of the disclosure statement and verbal script must limit the potential
influence on people's decision to participate in the follow-up survey.
5.8.2 Feedback effects.
The present model did not include feedback effects among latent constructs in the conceptual
framework. The researcher presented a model that in a one direction linear fashion proceeding from
pre-existing brand beliefs (brand awareness and brand trust) to destination brand perception and

163
evaluation (evaluation of experiential attributes), and finally to business (four sequential stages of
destination brand loyalty), individual (perceived happiness), and familial (family togetherness)
outcomes. It is highly probable that some latent constructs also influence preceding constructs.
Feedback effects might happen from outcome constructs to pre-existing brand belief constructs. The
most salient example may be that strengthened brand loyalty may enhance brand awareness and
brand trust, resulting in the fact that visitors experience a stronger level of destination brand love.
5.8.3 Inclusive family types.
This study examined destination brand love’s influences on family togetherness and
contributed to the branding literature by bringing familial concepts into destination branding studies.
Considering that the focus of this dissertation is to propose and establish a destination brand love
framework, the researcher did not purposefully differentiate between different family types during
the survey. The scope of the study is limited to nuclear families, which mean units where two
individuals live alone by themselves or with their children in the same household, and traditional
extended families where another adult lives with the married couple (Senturk et al., 2011). However,
the ways to define family have changed dramatically in recent years. For example, such untraditional
family types as single-parent families and single person households are fast increasing. The word
family no longer only means “two-parent-single-earner male-headed” households (Rothausen, 1999,
p. 820). The ratio of adults who never marry, no matter with or without children, is also on the rise.
Family’s visiting experiences at a destination may vary according to family types, therefore,
differentiating family types may enable rich findings on the roles destination brand love plays in
enhancing perceived family togetherness. A more inclusive way of examining family togetherness
should look at not only traditional opposite-sex nuclear family but also diverse types of untraditional

164
family, for example, unmarried homosexual partners (and children), married homosexual partners
(and children), unmarried co-habitants, same-sex family, single-parent families.
5.8.4 Non-response bias.
The study is limited due to the convenience sampling method. During the on-site survey,
potential respondents refusing for reasons of inconvenient timing were asked to specify their
preferred time to minimize non-response bias. For example, if a respondent said he or she was
unavailable to participate in the survey because at that time he or she has a young kid to look after,
the researcher asked if half an hour later would work in order to maximize the opportunity of
recruiting this respondent. The researcher recruited visitors who visited Shanghai Disney Resort and
stopped at Starbucks, Food Republic, and BreadTalk in Shanghai Disneytown in this study. Other
visitors who visited Shanghai Disney Resort but did not stay at the above three locations were not
approached. Therefore, a certain level of non-response bias or participation bias is unavoidable. A
longitudinal study in the future can minimize sampling issues.
5.8.5 Behavioural loyalty.
As it relates to the stages of developing loyalty, conative loyalty finally leads to behavioural
loyalty (Dick & Basu, 1994; Oliver, 1997). Behaviour or action loyalty is frequently simplified and
treated as purchase loyalty, and according to Chaudhuri and Holbrook (2001), purchase loyalty
means average consumers’ willingness to repurchase a brand’s products/services. A straightforward
explanation of shopping loyalty of a product brand is the frequency that consumers buy a brand
product and the amount they spend (Keller, 2013). Although behavioural loyalty is usually used to

165
replace (re)purchase loyalty (see Chaudhuri & Holbrook, 2001), recent research suggests that
behavioural loyalty also means spreading positive WoM, recommending the brand to others
(Bergkvist & Bech-Larsen, 2010).
A few studies have suggested that customer satisfaction leads to behavioural loyalty (e.g.,
Baker & Crompton, 2000; Lee et al., 2007; Tsai & Huang, 2007; Yuksel et al., 2010). Thus, satisfied
visitors tend to be behaviourally brand loyal. However, existing research results differ a lot regarding
the relationship between customer evaluation, satisfaction and behavioural loyalty. Back and Parks
(2003) reported an insignificant effect of customer satisfaction on behavioural brand loyalty. They
also found that, although this direct relationship is insignificant, attitudinal brand loyalty mediates
the relationship between customer satisfaction and behavioural brand loyalty significantly. Their
findings are also in line with Oliver (1997) and Fishbein and Ajzen (1975).
The relationship between attitudinal loyalty and behavioural loyalty, their causal ordering,
and their predictive capacity have attracted much debate in brand loyalty literature. For instance,
from a time-sequence perspective, Oliver (1999) considered that attitudinal loyalty happens before
consumers’ intention to patronize a business. Attitudinal loyalty occurs at the early stage of the
loyalty development process (Oliver, 1999). Similarly, Bandyopadhyay and Martell’s (2007) study
indicated that attitudinal loyalty influences behavioural loyalty. More recently, Liu-Thompkins and
Tam (2013) demonstrated that both attitudinal loyalty and habitual factors could trigger purchase
loyalty, although in different ways. However, Pedersen and Nysveen (2001) reported that attitudinal
loyalty does not predict behavioural loyalty correctly, questioning the predictive power of attitudinal
loyalty on behavioural loyalty.
This study did not test behavioural loyalty in the conceptual model. Future studies should
include behavioural loyalty and compare destination brand love’s influences on cognitive,

166
attitudinal, conative, and behavioural loyalty. Behavioural loyalty could be measured using several
approaches to capturing its nuances across different service contexts. These methods include
duration (participation over an extended time period); frequency (visits over a specified time period);
intensity (e.g., hours per week devoted to participation); sequence (e.g., purchase patterns within or
between brands); proportion of investment relative to other product or brand options, and probability
of purchase or participation (Pritchard et al., 1999, p. 345).
5.8.5 Commitment.
Various perspectives of conceptualizing the construct “commitment” exist, while debate
around this topic is always ongoing. A very early work by Salancik (1977) contended that
commitment happens when the following three perceptual states exist: (1) revocability; (2)
publicness; and (3) volition. Revocability deals with consumers’ psychological cost, specifically, the
cognitive cost to re-consider and re-order other choices and possibilities (Salancik, 1977). Publicness
involves “a willingness to be explicitly identified with the images and values of a (brand) preference
by significant others (e.g., friends, family)” (Pritchard et al., 1999, p. 335). Volition means that
people perceive their preferences as freely chosen, rather than dictated by others (Pritchard et al.,
1999; Salancik, 1977). Characterized by people’s resistance to change, the commitment was
believed to have two antecedent processes: the informational process and the identification process
(Crosby & Taylor, 1983). The former features cognitive structure formation of people’s preferences;
whereas the latter refers to the process during which people build up personal attachment to
particular brands (Figure 13).

167
Source: Crosby & Taylor, 1983 (explained in Pritchard et al., 1999)
Figure 13: Two Processes of Commitment Formation
Given that information and publicness can reflect revocability and publicness (Pritchard et
al.,1999), Pritchard et al. (1999) eventually synthesized active precursors of commitments into three
categories: (1) informational, (2) identification (represented by position involvement), and (3)
volitional processes. Pritchard et al. (1999) eventually established a set of formative (not reflexive)
psychological commitment Instrument (PCI) constituted by 13 items under four dimensions—
Information Complexity, Resistance to Change, Position Involvement, and Volitional Choices—were
established and ready to be adopted in other empirical studies (see Figure 14).
Informational process:
Cognitive needs to maintain the consistency of information structure
•to be specific, beliefs and reasons for purchase and repurchase
Identification process:
The build-up of brand identification and attachement
•to be specific, brand values identified to be linked with self-images and personal preferences

168
Figure 14: Pritchard, Havitz, & Howard's (1999) Four-factor PCI Framework
Pritchard et al.’s (1999) validated PCI provides marketing scholars and practitioners with a
set of easy-to-execute measurement tools, not only for capturing and cultivating customer
commitment but also for identifying and evaluating loyal customers. This PCI goes beyond the
partial and traditional commitment measures that focus merely on purchase-related perspectives.
This study did not aim to test brand awareness’ influences on constructs other than
destination brand love. Brand awareness, however, as a proxy to brand identification, might have
impacts on commitment and brand loyalty. In the conceptual framework of this study, commitment
might function as a mediating construct between brand awareness, brand trust, and brand loyalty.
The PCI items developed by Pritchard et al. (1999) may be useful measures to test the mediating role
of commitment.

169
5.8.6 Experiential attributes
Scales under the construct “evaluation of experiential attributes” in this dissertation are called
attribute satisfaction in Chi and Qu (2008). However, these items could also function as strategic
diagnostic tools to evaluate service quality strengths and weaknesses and to facilitate decision-
making. Marketing researchers can adopt them for diagnostic purposes. Specifically, tourism and
hospitality industries, as well as the government tourism administrations, can utilize them to evaluate
service performance from the customers’ perspective and identify weak points of the quality of
service that need to be improved (Fernández & Bedia, 2005; Nadiri, Kandampully, & Hussain,
2009).
5.9 Future Research
5.9.1 More assessment of brand awareness
As a fundamental pre-existing belief that visitors have before arriving at a destination, the
awareness of a branded destination influences visitors’ on-site experiences and post-visiting
evaluations. This research concluded that brand awareness’s influences on destination brand love
were insignificant in the Disney resort context. The results echoed some of the existing findings. For
instance, Esch et al. (2006) concluded that brand awareness did not generate any significant impact
on consumers’ future purchase, brand satisfaction, or brand trust. However, this dissertation did not
examine brand awareness’s influences on other related perceptual and behavioural concepts. Future
research efforts should examine brand awareness’ roles in destination brand loyalty and other
behavioural outcomes such as brand switching behaviour, commitment, and WoM. In particular,
more endeavours are also needed to identify brand awareness’s influences on visitors’ brand love of
newly opened branded destinations.

170
5.9.2 Other tourism or leisure contexts.
While this study employed destination brand love as an independent multi-dimensional
marketing construct to explain the intense emotional relationship between tourists and branded
destinations, more research is required to explore this constructs’ and its measurement items’
applicability in other tourism contexts, such as agricultural tourism, film tourism, eco-tourism,
mountain tourism, dark tourism, and religious tourism. For instance, what unique roles does
destination brand love play in agricultural tourism? Different from highly commercial tourism
destinations, farm-oriented vacation destinations, such as Hawaii, Tuscany in Italy, and the Yilan
County in Taiwan, usually are branded as less commercial and bear strong natural attractiveness.
Under less commercial situations, will the sub-dimensions and measurement items of destination
brand love developed in this study still hold? Will destination brand love still significantly influence
loyalty, perceived happiness, and family togetherness? Another important tourism context is national
park visitation. National parks are usually strong destination brands. Yellow Stones, Grand Canyon,
and Banff National Park attract a significant number of domestic and international visitors every
year. Future studies on destination brand love could explore measures or dimensions that capture
aesthetic, geographical, or scenic characteristics applicable to national parks. Research into these
questions could provide new insights into the line of brand love studies.
5.9.3 Additional antecedents and outcomes of destining brand love.
Future studies may enrich the findings of this study by identifying other marketing constructs
that contribute to and result from destination brand love. Candidate antecedent factors range from
past brand experience, brand personality, and the self-concept of tourists. From the perspective of

171
the feedback effects from outcome constructs to antecedent constructs, candidate outcomes factors
can include but are not limited to enhanced brand trust and brand awareness. Future consumer
researchers should also continue to consider “non-business” outcomes of destination brand love,
such as quality of life, family relationship, and well-being.
5.9.4 Human-interaction-related measures.
Considering that tourist experiences at destinations are a constellation of human interactions,
future research on destination brand love may add some personal interaction measures. For example,
in this dissertation, peer influences are not captured in the destination brand love construct. The
brand love of the kids in a family might influence parents’ emotional responses. How substantial is
this impact? Does it have a positive or a downgrading influence?
Additionally, how can tourists’ interaction with front-line hotel staff influence their
destination brand love and satisfaction? Take Disneyland for example, the reliability,
responsiveness, and empathy of the Disney hotel staff may influence tourists’ satisfaction and
designation brand love (Parasuraman, Zeithaml, & Berry, 1985). It is therefore also beneficial to
explore service-related measures of destination brand love.
5.10 Conclusion
Tourists may develop a robust affective bond with branded destinations. This emotional bond
originates from destinations’ representation of tourists’ self-beliefs, desired self-qualities, passion,
attitudes, and long-term relationships. This emotional bond is different from interpersonal love or
love towards commercial products. It involves emotions and cognitions toward a constellation of
destination images, offerings, services, products, and atmosphere. This dissertation named this

172
prototype of love as destination brand love and defined it as the degree of intense affection a tourist
holds for a branded destination (Carroll & Ahuvia, 2006). Destination brand love stands out as a
more inclusive concept than emotional attachment, place attachment, place bonding, brand romance,
and brand passion, because, firstly, it features a more inclusive collection of sub-dimensions and
measurement items; secondly, it has a more abundant variety of antecedents and consequences (Aro
et al., 2018; Batra et al., 2012). The findings provided empirical evidence for the multi-dimensional
structure of destination brand love (self-brand integration, passion-driven behaviours, positive
emotional connection, long-term relationship, attitude strength, and attitude valence). The researcher
established a set of destination brand love measurement items for future studies in other tourism
contexts.
Brand love is a relatively new concept in consumer behaviour and marketing studies (Roy et
al., 2013). Destination brand love is an even newer concept in destination branding research and
deserves more academic attention. This dissertation combined existing literature on brand love with
research on well-being, quality of life, family cohesion, and brand loyalty. Before this study, there
has been no theoretical framework that explains destination brand love’s brand-related and
experience-related antecedents and outcomes at the business (loyalty-related), individual (happiness-
related), and familial (family-cohesion-related) levels. The main contribution of this dissertation is
the establishment of the multi-dimensional and multi-indicator conceptual framework of antecedents
and consequences of destination brand love in a theme-park based tourism context. In this
framework, destination brand love is achieved through visitors’ trust of destination and positive
evaluation of experiential attributes. Destination brand love, in turn, affects an individual’s cognitive
loyalty towards a branded destination and his/her perceived happiness and family togetherness.

173
The researcher abandoned the “brand love only leads to loyalty” paradigm and examined
both business-related and non-business outcomes of destination brand love. The results demonstrated
that, apart from favourable business-related outcomes (i.e., cognitive, attitudinal, and conative brand
loyalty), destination brand love also produced optimal outcomes for individuals and their families.
Identifying the antecedents and consequences of destination brand love can help DMOs, and other
destination stakeholders understand factors that drive tourists’ love towards branded destinations.
More importantly, it is meaningful for tourists and excursionists to be aware that brand love can also
bring about benefits to their well-being and families.
Earlier studies on destination brand love have been conducted mostly in western cultural
contexts, such as the USA (e.g., Swanson, 2015b) and Finland (Aro et al., 2018). This study initiated
destination brand love research in China. It offered a Chinese perspective on the interplay of its
antecedents and outcomes at the individual, familial, and business levels. Chinese tourists and
excursionists tend to share a collective cultural perspective, different from the individualistic
perspective popular in western countries. The social norms that value collectivism makes family
togetherness an essential pursuit of Chinese families and individuals during travel. For that reason, it
is beneficial to recognize non-business outcomes of destination brand love in this research, and in
studies to come.

174
References
Aaker, J. L. (1997). Dimensions of brand personality. Journal of Marketing Research, 347-356.
Aaker, D. A. (1996). Building strong brands. New York: Free Press.
Aaker, D. A. (1991). Managing brand equity: Capitalizing on the value of a brand name. The Free
Press: New York, NY.
Ahuvia, A. C. (1993). I love it! Towards a unifying theory of love across diverse love objects. Ph.D.
dissertation, Northwestern University, Evanston, IL.
Albert, N., & Merunka, D. (2013). The role of brand love in consumer-brand relationships. Journal
of Consumer Marketing, 30(3), 258-266.
Albert, N., Merunka, D., & Valette-Florence, P. (2008a). When consumers love their brands:
Exploring the concept and its dimensions. Journal of Business Research, 61(10), 1062-1075.
Albert, N., Merunka, D., & Valette-Florence, P. (2008b). The feeling of love toward a brand:
Concept and measurement. Advances in Consumer Research, 36, 300-307.
Albrecht, S., Bahr, H. T., & Goodman, K. (1983). Divorce and remarriage: Problems, adaptations,
and adjustments. Westport, CT: Greenwood.
Alexandris, K., Kouthouris, C., & Meligdis, A. (2006). Increasing customers' loyalty in a skiing
resort: The contribution of place attachment and service quality. International Journal of
Contemporary Hospitality Management, 18(5), 414-425.

175
Ali, F. & Cobanoglu, C. (2017). Using Structural Equation Modeling (SEM) Using Partial Least
Squares (SmartPLS). Webinar slides. Retrieved from http://conference.anahei.org/wp-
content/uploads/SmartPLS-Webinar.pdf
Ajzen, I. (2001). Nature and operation of attitudes. Annual Review of Psychology, 52(1), 27-58.
Anderson, J. C., & Gerbing, D. W. (1988). Structural equation modeling in practice: A review and
recommended two-step approach. Psychological Bulletin, 103, 411–423.
Argyle, M., Martin, M., & Crossland, J. (1989). Happiness as a function of personality and social
encounters. In J. P. Forgas, & J. M. Innes (Eds.), Recent advances in social psychology: An
international perspective (pp. 189–203). North-Holland: Elsevier.
Arkes, H. R., & Blumer, C. (1985). The psychology of sunk cost. Organizational Behavior and
Human Decision Processes, 35(1), 124e140.
Aro, K., Suomi, K., & Saraniemi, S. (2018). Antecedents and consequences of destination brand
love—A case study from Finnish Lapland. Tourism Management, 67, 71-81.
Aron, A., Aron, E. N., Tudor, M., & Nelson, G. (1991). Close relationships as including other in the
self. Journal of Personality and Social Psychology, 60(2), 241.
Aron, A., & Aron, E. N. (1986). Love as Expansion of the Self: Understanding Attraction and
Satisfaction. New York, NY: Taylor & Francis.
Aron, A., & Westbay, L. (1996). Dimensions of the prototype of love. Journal of Personality and
Social Psychology, 70(3), 535.

176
Assaker, G., Vinzi, V. E., & O’Connor, P. (2011). Examining the effect of novelty seeking,
satisfaction, and destination image on tourists’ return pattern: A two factor, non-linear latent
growth model. Tourism Management, 32(4), 890-901.
Ayeh, J. K., Au, N., & Law, R. (2013). Predicting the intention to use consumer-generated media for
travel planning. Tourism Management, 35, 132-143.
Back, K. J. (2005). The effects of image congruence on customers’ brand loyalty in the upper
middle-class hotel industry. Journal of Hospitality & Tourism Research, 29(4), 448-467.
Backman, S. J., & Crompton, J. L. (1991). Differentiating between high, spurious, latent, and low
loyalty participants in two leisure activities. Journal of Park and Recreation Administration,
9(2), 1-17.
Back, K. J., & Lee, J. S. (2009). Country club members’ perceptions of value, image congruence,
and switching costs: An exploratory study of country club members’ loyalty. Journal of
Hospitality & Tourism Research, 33(4), 528-546.
Back, K. J. (2005). The effects of image congruence on customers’ brand loyalty in the upper
middle-class hotel industry. Journal of Hospitality & Tourism Research, 29(4), 448-467.
Back, K. J., & Parks, S. C. (2003). A brand loyalty model involving cognitive, affective, and
conative brand loyalty and customer satisfaction. Journal of Hospitality & Tourism
Research, 27(4), 419-435.
Bagozzi, R. P., Batra, R., & Ahuvia, A. (2014). Brand Love Scales. Retrieved from
http://brandlovecentral.com/wp-content/uploads/2013/02/brandLoveScales.pdf on 20 May
2016.

177
Bagozzi, R. P., & Dholakia, U. M. (2006). Open source software user communities: A study of
participation in Linux user groups. Management Science, 52(7), 1099-1115.
Bagozzi, R. P., & Lee, K. H. (2002). Multiple routes for social influence: The role of compliance,
internalization, and social identity. Social Psychology Quarterly, 65(3), 226-247.
Bagozzi, R. P. (1980). Causal models in marketing. New York, NY: John Wiley & Sons.
Baker, D. A., & Crompton, J. L. (2000). Quality, satisfaction and behavioral intentions. Annals of
Tourism Research, 27(3), 785-804.
Bala, N., & Bromwich, R. J. (2002). Context and inclusivity in Canada's evolving definition of the
family. International Journal of Law, Policy and the Family, 16(2), 145-180.
Baloglu, S., & Mangaloglu, M. (2001). Tourism destination images of Turkey, Egypt, Greece, and
Italy as perceived by US-based tour operators and travel agents. Tourism
Management, 22(1), 1-9.
Baldinger, A. L., & Rubinson, J. (1996). Brand loyalty: the link between attitude and behavior.
Journal of Advertising Research, 36(6), 22-35.
Ball, D., Simões Coelho, P., & Machás, A. (2004). The role of communication and trust in
explaining customer loyalty: An extension to the ECSI model. European Journal of
Marketing, 38(9/10), 1272-1293.
Bandyopadhyay, S., & Martell, M. (2007). Does attitudinal loyalty influence behavioral loyalty? A
theoretical and empirical study. Journal of Retailing and Consumer Services, 14(1), 35-44.

178
Baron, R. M., & Kenny, D. A. (1986). The moderator-mediator variable distinction in social
psychological research: Conceptual, strategic, and statistical considerations. Journal of
Personality and Social Psychology, 51, 1173-1182.
Batra, R., Ahuvia, A., & Bagozzi, R. P. (2012). Brand love. Journal of Marketing, 76(2), 1-16.
Bauer, H. H., Heinrich, D., & Martin, I. (2007). How to create high emotional consumer-brand
relationships? The causalities of brand passion. Paper presented at the 2007 Australian &
New Zealand Marketing Academy Conference (AZMAC) Proceedings (pp. 2189-2198),
December 3-5, Dunedin, New Zealand.
Baumann, C., Elliott, G., & Hamin, H. (2011). Modelling customer loyalty in financial services: a
hybrid of formative and reflective constructs. International Journal of Bank Marketing,
29(3), 247-267.
Bearden, W. O., & Netemeyer, R. G. (1999). Handbook of marketing scales: Multi-item measures
for marketing and consumer behavior research. Sage.
Beatty, S. E., & Kahle, L. R. (1988). Alternative hierarchies of the attitude-behavior relationship:
The impact of brand commitment and habit. Journal of the Academy of Marketing Science,
16(2), 1-10.
Belk, R. W. (1988). Possessions and the extended self. Journal of Consumer Research, 15 (2), 139-
168.
Ben-Nun, P. (2008). Respondent fatigue. In Lavrakas, P. J. (Eds), Encyclopedia of Survey Research
Methods (pp.743-744). Thousand Oaks, CA: Sage Publications.

179
Bentler, P. M., & Bonett, D. G. (1980). Significance tests and goodness of fit in the analysis of
covariance structures. Psychological Bulletin, 88(3), 588.
Bergkvist, L., & Bech-Larsen, T. (2010). Two studies of consequences and actionable antecedents of
brand love. Journal of Brand Management17(7), 504-518.
Bhattacharya, C. B., & Sen, S. (2003). Consumer-company identification: A framework for
understanding consumers’ relationships with companies. Journal of Marketing, 67(2), 76-88.
Binswanger, M. (2006). Why does income growth fail to make us happier? Searching for the
treadmills behind the paradox of happiness. The Journal of Socio-Economics, 35(2), 366-
381.
Blackston, M. (1992). A brand with an attitude-a suitable case for treatment. Journal of the Market
Research Society, 34(3), 231-241.
Blanchflower, D. G., & Oswald, A. (2000). The rising well-being of the young. In Youth
employment and joblessness in advanced countries (pp. 289-328). Chicago:
NBER/University of Chicago Press.
Bimonte, S., & Faralla, V. (2012). Tourist types and happiness a comparative study in Maremma,
Italy. Annals of Tourism Research, 39(4), 1929-1950.
Black, K., & Lobo, M. (2008). A conceptual review of family resilience factors. Journal of Family
Nursing, 14(1), 33-55.
Boo, S., Busser, J., & Baloglu, S. (2009). A model of customer-based brand equity and its
application to multiple destinations. Tourism Management, 30(2), 219-231.
Bowlby, J. (1980). Loss: Sadness and Depression. New York: Basic Books.

180
Bowlby, J. (1979). The making and breaking of affectional bonds. London: Tavistock.
Byrne, B. M. (2008). Structural Equation Modeling with EQS: Basic Concepts, Applications, and
Programming. New York, NY: Psychology Press.
Brocato, E.D. (2006). Place attachment: an investigation of environments and outcomes in service
context. Doctoral Thesis, The University of Texas at Arlington.
Brudvig, S. (2015). Consumer-Based Brand Trust Scales: Validation and Assessment. In Revolution
in Marketing: Market Driving Changes (pp. 17-21). Springer International Publishing.
Carroll, B. A., & Ahuvia, A. C. (2006). Some antecedents and outcomes of brand love. Marketing
Letters, 17(2), 79-89.
Chandralal, L., & Valenzuela, F. R. (2013). Exploring memorable tourism experiences: Antecedents
and behavioural outcomes. Journal of Economics, Business and Management, 1(2), 177-181.
Chang, S. J., Van Witteloostuijn, A., & Eden, L. (2010). From the editors: Common method
variance in international business research. Journal of International Business Studies, 41(2),
178-184.
Chang, L. (1994). A psychometric evaluation of 4-point and 6-point Likert-type scales in relation to
reliability and validity. Applied Psychological Measurement, 18, 205-215.
Chaudhuri, A., & Holbrook, M. B. (2001). The chain of effects from brand trust and brand affect to
brand performance: the role of brand loyalty. Journal of Marketing, 65(2), 81-93.
Chen, S. C. (2012). The customer satisfaction–loyalty relation in an interactive e-service setting: The
mediators. Journal of Retailing and Consumer Services, 19(2), 202-210.

181
Chi, C. G. Q., & Qu, H. (2008). Examining the structural relationships of destination image, tourist
satisfaction and destination loyalty: An integrated approach. Tourism Management, 29(4),
624-636.
Chin, W. W. (1998). The partial least squares approach to structural equation modeling. Modern
Methods for Business Research, 295(2), 295-336.
Choo, H., Park, S. Y., & Petrick, J. F. (2011). The influence of the resident's identification with a
tourism destination brand on their behavior. Journal of Hospitality Marketing &
Management, 20(2), 198-216.
Clavé, S.A. (2007). The Global Theme Park Industry, Cambridge, MA: CABI.
Cohen, E. (2010). Tourism, leisure and authenticity. Tourism Recreation Research, 35(1), 67-73.
Cohen, J. B. (1988). Statistical Power Analysis for the Behavioral Sciences (2nd edition). Hillsdale,
NJ: Erlbaum.
Coltman, T., Devinney, T. M., Midgley, D. F., & Venaik, S. (2008). Formative versus reflective
measurement models: Two applications of formative measurement. Journal of Business
Research, 61(12), 1250-1262.
Crawford, D. W., Jackson, E. L., & Godbey, G. C. (1991). A hierarchical model of leisure
constraints. Leisure Sciences, 13, 309–320
Crompton, J. L. (1979). Motivations for pleasure vacation. Annals of Tourism Research, 6(4), 408-
424.
Crosby, L. A., & Taylor, J. R. (1983). Psychological commitment and its effects on post-decision
evaluation and preference stability among voters. Journal of Consumer Research, 9(4), 413-
431.

182
Crotty, M. (1998, 2003). The foundations of social research: Meaning and perspective in the
research process, Thousand Oaks, CA; Sage.
Cunningham, R. M. (1956). Brand loyalty: What, where, how much? Journal of Marketing, 2, 206.
Dardis, R., Derrick. F., Lehfeld, A., & Wolfe, K. (1981). Cross-section studies of recreation
expenditures in the United States. Journal of Leisure Research, 13(3), 181-194.
Dawes, J. (2008). Do data characteristics change according to the number of scale points used? An
experiment using 5-point, 7-point and 10-point scales. International Journal of Market
Research, 50(1), 61-104.
Day, G. S. (1976). A two-dimensional concept of brand loyalty. In Mathematical models in
marketing (pp. 89-89). Springer: Berlin, Heidelberg.
Day, G. S. (1969). A Two-dimensional Concept of Brand Loyalty. Journal of Advertising Research,
9, 29-35.
del Bosque, I. R., & San Martín, H. (2008). Tourist satisfaction a cognitive-affective model. Annals
of Tourism Research, 35(2), 551-573.
Delgado-Ballester, E. (2004). Applicability of a brand trust scale across product categories: A
multigroup invariance analysis. European Journal of Marketing, 38(5/6), 573-592.
Delgado-Ballester, E., Munuera-Aleman, J. L., & Yague-Guillen, M. J. (2003). Development and
validation of a brand trust scale. International Journal of Market Research, 45(1), 35-54.
Deng, Z., Lu, Y., Wei, K. K., & Zhang, J. (2010). Understanding customer satisfaction and loyalty:
An empirical study of mobile instant messages in China. International Journal of
Information Management, 30(4), 289-300.

183
Desmeules, R. (2002). The impact of variety on consumer happiness: Marketing and the tyranny of
freedom. Academy of Marketing Science Review, online, 1-18.
Dick, A. S., & Basu, K. (1994). Consumer Loyalty: Towards an Integrated Conceptual
Approach. Journal of the Academy Of Marketing Science, 22(2), 99-113.
Donavan, D. T., Janda, S., & Suh, J. (2006). Environmental influences in corporate brand
identification and outcomes. The Journal of Brand Management, 14(1-2), 125-136.
Easterlin, R. A. (2005). Feeding the illusion of growth and happiness: A reply to Hagerty and
Veenhoven. Social Indicators Research, 74(3), 429-443.
Easterlin, R. A. (2004). The economics of happiness. Daedalus, 133(2), 26-33.
Ellemers, N., Kortekaas, P., & Ouwerkerk, J. W. (1999). Self‐categorisation, commitment to the
group and group self‐esteem as related but distinct aspects of social identity. European
Journal of Social Psychology, 29(23), 371-389.
Erdogan, B., Bauer, T. N., Truxillo, D. M., & Mansfield, L. R. (2012). Whistle while you work a
review of the life satisfaction literature. Journal of Management, 38(4), 1038-1083.
Escalas, J. E., & Bettman, J. R. (2005). Self-construal, reference groups, and brand meaning. Journal
of Consumer Research, 32(3), 378-389.
Esch, F. R., Langner, T., Schmitt, B. H., & Geus, P. (2006). Are brands forever? How brand
knowledge and relationships affect current and future purchases. Journal of Product & Brand
Management, 15(2), 98-105.
Evanschitzky, H., & Wunderlich, M. (2006). An examination of moderator effects in the four-stage
loyalty model. Journal of Service Research, 8(4), 330-345.

184
Fazio, R. H. (1995). Attitudes as object-evaluation associations: Determinants, consequences, and
correlates of attitude accessibility. In Petty, R. E., & Krosnick, J. A. (Eds.), Attitude strength:
Antecedents and consequences (pp. 247-282). Hillsdale, NJ: Lawrence Erlbaum Associates.
Fehr, B., & Russell, J. A. (1991). The concept of love viewed from aprototype perspective. Journal
of Personality and Social Psychology, 60, 425-438.
Fernández, M. C. L., & Bedia, A. M. S. (2005). Applying SERVQUAL to diagnose hotel sector in a
tourist destination. Journal of Quality Assurance in Hospitality & Tourism, 6(1-2), 9-24.
Feng, R., & Jang, S. (2007). Temporal destination revisit intention: the effects of novelty seeking
and satisfaction. Tourism Management, 28(2), 580-590.
Fetscherin, M., & Heinrich, D. (2014). Consumer brand relationships: A research landscape. Journal
of Brand Management, 21(5), 366-371.
Fetscherin, M., & Heilmann, T. (2015). Brand Relationship Rule. In: Fetscherin, M., & Heilmann, T.
(Eds) Consumer Brand Relationships: Meaning, Measuring, Managing. New York: Palgrave
Macmillan.
Field, A. (2013). Discovering statistics using IBM SPSS Statistics (4th ed.). Washington, DC: Sage.
Filep, S. (2014). Moving beyond subjective well-being: A tourism critique. Journal of Hospitality &
Tourism Research, 38(2), 266-274.
Filep, S., & Deery, M. (2010). Towards a picture of tourists’ happiness. Tourism Analysis, 15(4),
399-410.
Finn, R. H. (1972). Effects of some variations in rating scale characteristics on the means and
reliabilities of ratings. Educational and Psychological Measurement, 34, 885-892.

185
Finstad, K. (2010). Response interpolation and scale sensitivity: Evidence against 5-point
scales. Journal of Usability Studies, 5(3), 104-110.
Fish, M., & Waggle, D. (1996). Current Income versus Total Expenditure Measures in Regression
Models of Vacation and Pleasure Travel. Journal of Travel Research, 35(2), 70-74.
Fishbein, M., & Ajzen, I. (1975). Belief, attitude, intention, and behavior: An introduction to theory
and research. Reading, MA: Addison-Wesley.
Flint, D. J., Blocker, C. P., & Boutin, P. J. (2011). Customer value anticipation, customer satisfaction
and loyalty: An empirical examination. Industrial Marketing Management, 40(2), 219-230.
Formica, S., & Uysal, M. (1998). Market segmentation of an international cultural-historical event in
Italy. Journal of Travel Research, 36(4), 16-24.
Fornell, C. (1992). A national customer satisfaction barometer: The Swedish experience. Journal of
Marketing, 56(1), 6-21.
Fornell, C., & Bookstein, F. L. (1982). Two structural equation models: LISREL and PLS applied to
consumer exit-voice theory. Journal of Marketing Research, 19 (4), 440-452.
Fornell, C., & Larcker, D. (1981). Evaluating structural equation models with unobservable and
measurement error. Journal of Marketing Research, 18(1), 39–50.
Fournier, S. (1998). Consumers and Their Brands: Developing Relationship Theory in Consumer
Research, Journal of Consumer Research, 24(4), 343-353.
Fu, X., Cai, L., & Lehto, X. (2017). Framing Chinese tourist motivations through the lenses of
Confucianism. Journal of Travel & Tourism Marketing, 34(2), 149-170.
186
Fuchs, C., Schreier, M., & van Osselaer, S. M. (2015). The Handmade Effect: What's Love Got to
Do with It? Journal of Marketing, 79(2), 98-110.
Fuchs, V. (1983). How we live. Cambridge, MA: Harvard University Press.
Furnham, A., & Cheng, H. (2000). Perceived parental behaviour, self-esteem and happiness. Social
Psychiatry and Psychiatric Epidemiology, 35(10), 463-470.
Geisser, S. (1974). A predictive approach to the random effect model. Biometrika, 61(1), 101-107.
Geuens, M., Weijters, B., & De Wulf, K. (2009). A new measure of brand personality. International
Journal of Research in Marketing, 26(2), 97-107.
Gilbert, D., & Abdullah, J. (2004). Holidaytaking and the sense of well-being. Annals of Tourism
Research, 31(1), 103-121.
Gillies, V., Ribbens McCarthy, J. and Holland, J. (2001). Pulling Together, Pulling Apart: The
Family Lives of Young People Aged 16–18. London: Family Policy Studies Centre/ Joseph
Rowntree Foundation.
Gruen, T. W., & Ferguson, J. (1994). Using membership as a marketing tool: Issues and
applications. In J. Sheth & A. Parvatiyar (Eds.), Relationship marketing: Theory,
applications, and practice. Atlanta, GA: Emory University Center for Relationship
Marketing.
Ha, H. Y., & Perks, H. (2005). Effects of consumer perceptions of brand experience on the web:
Brand familiarity, satisfaction and brand trust. Journal of Consumer Behaviour, 4(6), 438-
452.
187
Hair, J. F., Anderson, R. E., Tatham, R. L., & Black, W. C. (1998). Multivariate data analysis with
readings (5th ed). Englewood Cliffs, NJ: Prentice-Hall International.
Hair, J. F., Hult, G. T. M., Ringle, C. M., Sarstedt, M., & Thiele, K. O. (2017). Mirror, mirror on the
wall: a comparative evaluation of composite-based structural equation modeling methods.
Journal of the Academy of Marketing Science, 1-17.
Hair, J. F., Hult, G. T. M., Ringle, C., & Sarstedt, M. (2017). A Primer on Partial Least Squares
Structural Equation Modeling (PLS-SEM) (2nd edition). Thousand Oaks, CA: Sage.
Hair, J. F., Hult, G. T. M., Ringle, C., & Sarstedt, M. (2014). A Primer on Partial Least Squares
Structural Equation Modeling (PLS-SEM). Thousand Oaks, CA: Sage.
Hair, J. F., Black, W. C., Babin, B. J., & Anderson, R. E. (2010). Multivariate data analysis. Upper
Saddle River, New Jersey: Pearson.
Hair, J. F., Ringle, C. M., & Sarstedt, M. (2011). PLS-SEM: Indeed a silver bullet. Journal of
Marketing Theory and Practice, 19(2), 139-152.
Hancock, G. R., & Klockars, A. J. (1991). The effect of scale manipulations on validity: Targeting
frequency rating scales for anticipated performance levels. Applied Ergonomics, 22, 147-154.
Harris, L. C., & Goode, M. M. (2004). The four levels of loyalty and the pivotal role of trust: a study
of online service dynamics. Journal of Retailing, 80(2), 139-158.
Härtel, C. E., & Russell-Bennett, R. (2010). Heart versus mind: The functions of emotional and
cognitive loyalty. Australasian Marketing Journal (AMJ), 18(1), 1-7.
Headey, B., Veenhoven, R., & Wearing, A. (1991). Top-down versus bottom-up theories of
subjective well-being. Social Indicators Research, 24(1), 81-100.

188
Heide, J. B, & Weiss, A. M. (1995). Vendor consideration and switching behavior for buyers in
high-technology markets. Journal of Marketing, 59, 30-43.
Henseler, J., Hubona, G., & Ray, P. A. (2016). Using PLS path modeling in new technology
research: updated guidelines. Industrial Management & Data Systems, 116(1), 2-20.
Henseler, J., Ringle, C. M., & Sarstedt, M. (2015). A new criterion for assessing discriminant
validity in variance-based structural equation modeling. Journal of the Academy of
Marketing Science, 43(1), 115-135.
Henseler, J., Ringle, C., & Sinkovics, R. (2009). The use of partial least squares path modeling in
international marketing. Advances in International Marketing, 20, 277-320.
Hess, J. S. (1995). Construction and Assessment of a Scale to Measure Consumer Trust. In Stern, B.
B., & Zinkhan, G. M. (Eds.), Proceedings of the American Marketing Association Educators’
Conference (pp. 20-26), Vol. 6. American Marketing Association, Chicago, IL.
Hills, P., & Argyle, M. (2002). The Oxford Happiness Questionnaire: A compact scale for the
measurement of psychological well-being. Personality and Individual Differences, 33(7),
1073-1082.
Hong, J., & Chang, H. H. (2015). “I” Follow My Heart and “We” Rely on Reasons: The Impact of
Self-Construal on Reliance on Feelings versus Reasons in Decision Making. Journal of
Consumer Research, 41(6), 1392-1411.
Hellofs, L. L., & Jacobson, R. (1999). Market share and customers’ perceptions of quality: When
can firms grow their way to higher versus lower quality. Journal of Marketing, 63, 16-25.

189
Hidalgo, C. M., & Hernandez, B. (2001). Place attachment: conceptual and empirical questions.
Journal of Environmental Psychology, 21, 273-281.
Hosany, S., & Gilbert, D. (2010). Measuring tourists’ emotional experiences toward hedonic holiday
destinations. Journal of Travel Research, 49(4), 513-526.
Howard, D. R., & Thomason, P. (1984). The critical importance of the distribution variable in
formulating a marketing strategy. Visions in Leisure and Business, 3, 34-40.
Hu, L. T., & Bentler, P. M. (1999). Cutoff criteria for fit indexes in covariance structure analysis:
Conventional criteria versus new alternatives. Structural Equation Modeling: a
Multidisciplinary Journal, 6(1), 1-55.
Hu, L. T., & Bentler, P. M. (1998). Fit indices in covariance structure modeling: Sensitivity to
underparameterized model misspecification. Psychological Methods, 3(4), 424.
Hughes, D. E., & Ahearne, M. (2010). Energizing the reseller's sales force: The power of brand
identification. Journal of Marketing, 74(4), 81-96.
Iwasaki, Y. (2007). Leisure and quality of life in an international and multicultural context: What are
major pathways linking leisure to quality of life?. Social Indicators Research, 82(2), 233-
264.
Jacoby, J., & Kyner, D. B. (1973). Brand loyalty vs. repeat purchasing behavior. Journal of
Marketing Research, 10(1), 1-9.
Jacoby, J. (1971). Brand loyalty: A conceptual definition. In Proceedings of the Annual Convention
of the American Psychological Association (pp. 655-656). American Psychological
Association.

190
Jacoby, J. (1970). An Attitudinal Model of Multibrand Loyalty: Pre- liminary Results and
Promotional Strategies, paper presented at the Spring Conference on Research Methodology,
American Marketing Association.
Jacoby, J. (1969). Toward Developing a Model of Multibrand Loyalty, Paper No. 105, Purdue
Papers in Consumer Psychology, 27.
Jallinoja, R., (2008). Togetherness and being together: family configurations in the making. In
Widmer, E.D. & Jallinoja, R. (Eds.), Beyond the Nuclear Family: Families in a
Configurational Perspective (pp.97-118). Bern: Peter Lang.
Jarvis, C. B., MacKenzie, S. B., & Podsakoff, P. M. (2003). A critical review of construct indicators
and measurement model misspecification in marketing and consumer research. Journal of
Consumer Research, 30(2), 199-218.
Javed, M., Roy, S., & Mansoor, B. (2015). In Fetscherin, M., & Heilmann, T. (Eds.), Consumer
Brand Relationships: Meaning, Measuring, Managing (pp.31-54). Hampshire, UK: Palgrave
Macmillan.
Jarvis, C. B., MacKenzie, S. B., & Podsakoff, P. M. (2003). A critical review of construct indicators
and measurement model misspecification in marketing and consumer research. Journal of
Consumer Research, 30(2), 199-218.
Jarvis, L. P., & Mayo, E. J. (1986). Wining the market-share game. Cornell Hotel and Restaurant
Administration Quarterly, 27(3), 72-79.
Johnson, M. D., Herrmann, A., & Huber, F. (2006). The evolution of loyalty intentions. Journal of
Marketing, 70(2), 122-132.

191
Johns, R. (2005). One size doesn’t fit all: Selecting response scales for attitude items. Journal of
Elections, Public Opinion & Parties, 15(2), 237-264.
Kahneman, D., & Krueger, A. B. (2006). Developments in the Measurement of Subjective Well-
Being. Journal of Economic Perspectives, 20(1), 3-24.
Kaplanidou, K. (2009). Relationships among behavioral intentions, cognitive event and destination
images among different geographic regions of Olympic Games spectators. Journal of Sport
& Tourism, 14(4), 249-272.
Keller, K. (2013). Strategic Brand Management: Building, Measuring, and Managing Brand Equity
(4th ed). Harlow: Pearson Education.
Keh, H. T., & Xie, Y. (2009). Corporate reputation and customer behavioral intentions: The roles of
trust, identification and commitment. Industrial Marketing Management, 38(7), 732-742.
Kemp, E., Williams, K. H., & Bordelon, B. M. (2012). The impact of marketing on internal
stakeholders in destination branding: The case of a musical city. Journal of Vacation
Marketing, 18(2), 121-133.
Kiesler, C. A. (1971). The psychology of commitment: Experiments linking behavior to belief.
Academic Press.
Kim, Y. G., & Eves, A. (2012). Construction and validation of a scale to measure tourist motivation
to consume local food. Tourism Management, 33(6), 1458-1467.
King, L. M., & Prideaux, B. (2009). Exploring the visitor-based brand equity of the wet tropics of
Queensland world heritage Area. Paper presented at the 3rd International Conference on
Destination Branding and Marketing, Macao SAR, China.

192
Kolar, T., & Zabkar, V. (2010). A consumer-based model of authenticity: An oxymoron or the
foundation of cultural heritage marketing? Tourism Management, 31(5), 652-664.
Konecnik, M., & Gartner, F. (2008). Tourism destination brand identity: The case of
Slovenia. Journal of Brand Management, 15(3), 177-189.
Kozak, M., & Rimmington, M. (2000). Tourist satisfaction with Mallorca, Spain, as an off-season
holiday destination. Journal of Travel Research, 38(3), 260-269.
Krejcie, R. V., & Morgan, D. W. (1970). Table for determining sample size from a given population.
Educational and Psychological Measurement, 30, 607-610.
Kretz, G. (2015). Evolution of Luxury Brand love Intensity over Time. In Fetscherin, M., &
Heilmann, T. (Eds.), Consumer Brand Relationships: Meaning, Measuring, Managing
(pp.55-82). Hampshire, UK: Palgrave Macmillan.
Kuenzel, S., & Halliday, S. V. (2008). Investigating antecedents and consequences of brand
identification. Journal of Product & Brand Management, 17(5), 293-304.
Kyle, G., Graefe, A., & Manning, R. (2005). Spatial variation in level and type of place attachment.
Northeastern Recreation Research Symposium Proceedings 14-19.
Lee, J., Graefe, A., & Burns, R. (2007). Examining the antecedents of destination loyalty in a forest
setting. Leisure Science, 29, 463–481.
Lee, K.-H., & Hyun, S. S. (2016). The effects of perceived destination ability and destination brand
love on tourists’ loyalty to post-disaster tourism destinations: The case of Korean tourists to
Japan. Journal of Travel & Tourism Marketing, 33, 613-627.
193
Lee, C. K., Lee, Y. K., & Wicks, B. E. (2004). Segmentation of festival motivation by nationality
and satisfaction. Tourism Management, 25(1), 61-70.
Lehto, X. Y., Fu, X., Li, H., & Zhou, L. (2017). Vacation benefits and activities: Understanding
Chinese family travelers. Journal of Hospitality & Tourism Research, 41(3), 301-328.
Liu, C. T., Guo, Y. M., & Lee, C. H. (2011). The effects of relationship quality and switching
barriers on customer loyalty. International Journal of Information Management, 31(1), 71-
79.
Lindell, M. K., & Whitney, D. J. (2001). Accounting for common method variance in cross-sectional
research designs. Journal of Applied Psychology, 86(1), 114-121.
Lyubomirsky, S., Sheldon, K. M., & Schkade, D. (2005). Pursuing happiness: the architecture of
sustainable change. Review of General Psychology, 9(2), 111.
Lyubomirsky, S., & Lepper, H. S. (1999). A measure of subjective happiness: Preliminary reliability
and construct validation. Social Indicators Research, 46, 137–155.
Ma, J., Gao, J., Scott, N., & Ding, P. (2013). Customer delight from theme park experiences: The
antecedents of delight based on cognitive appraisal theory. Annals of Tourism Research, 42,
359-381.
Miller, G. A. (1956). The magical number seven, plus or minus two: Some limits on our capacity for
processing information. Psychological Review, 63, 2, 81-97.
Naresh, M. & Mark, P. (2006). Basic Marketing Research: A Decision-Making Approach (2nd
edition). Upper Saddle River, NJ: Pearson Prentice Hall.
194
Markus, H. R., & Kitayama, S. (1991). Culture and the self: Implications for cognition, emotion, and
motivation. Psychological Review, 98(2), 224.
Martínez-Espiñeira, R., Loomis, J. B., Amoako-Tuffour, J., & Hilbe, J. M. (2008). Comparing
recreation benefits from on-site versus household surveys in count data travel cost demand
models with overdispersion. Tourism Economics, 14(3), 567-576.
Maxham, J. G., & Netemeyer, R. G. (2002). Modeling customer perceptions of complaint handling
over time: the effects of perceived justice on satisfaction and intent. Journal of Retailing,
78(4), 239-252.
McAlister, L. (1982). A dynamic attribute satiation model of variety-seeking behavior. Journal of
Consumer Research, 141-150.
McCabe, S., & Johnson, S. (2013). The happiness factor in tourism: Subjective well-being and social
tourism. Annals of Tourism Research, 41, 42-65.
McCarthy, J. R. (2012). The powerful relational language of ‘family’: togetherness, belonging and
personhood. The Sociological Review, 60(1), 68-90.
McIntosh, R. W., Goeldner, C. R., & Ritchie, J. R. B. (1995). Tourism: Principles, practices,
philosophies. New York, NY: Wiley.
Milman, A. (2010). The global theme park industry. Worldwide Hospitality and Tourism Themes,
2(3), 220-237.
Milman, A. (2001). The future of the theme park and attraction industry: a management perspective.
Journal of Travel Research, 40(2), 139-147.

195
Murstein, B. I. (1988). A Taxonomy of Love. In Sternberg R.J., & Barnes, M. L. (Eds), The
Psychology of Love (pp. 13-37). New Haven, CT: Yale University Press.
Nadiri, H., Kandampully, J., & Hussain, K. (2009). Zone of tolerance for banks: a diagnostic model
of service quality. The Service Industries Journal, 29(11), 1547-1564.
Nam, J., Ekinci, Y., & Whyatt, G. (2011). Brand equity, brand loyalty and consumer satisfaction.
Annals of Tourism Research, 38(3), 1009-1030.
Netemeyer, R. G., Krishnan, B., Pullig, C., Wang, G., Yagci, M., Dean, D., ... & Wirth, F. (2004).
Developing and validating measures of facets of customer-based brand equity. Journal of
Business Research, 57(2), 209-224.
Nunnally, J. C., & Bernstein, I. H. (1994). Psychometric theory (3rd ed). New York: McGraw-Hill.
Nunnally, J. C. (1978). Psychometric theory (2nd ed.). New York, NY: McGraw-Hill.
Nunnally, J. C. (1967). Psychometric theory. New York, NY: McGraw-Hill.
Oh, H. (2000). The effect of brand class, brand awareness, and price on customer value and
behavioral intentions. Journal of Hospitality & Tourism Research, 24(2), 136-162.
Oliver, R. L. (1999). Whence consumer loyalty?. Journal of Marketing, 63, 33-44.
Oliver, R. L. (1997). Satisfaction: A behavioral perspective on the consumer. New York, NY:
McGraw-Hill.
Oliver, R. L. (1993). Cognitive, affective, and attribute bases of the satisfaction response. Journal of
Consumer Research, 20(3), 418-430.

196
Oshio, T., & Kobayashi, M. (2010). Income inequality, perceived happiness, and self-rated health:
evidence from nationwide surveys in Japan. Social Science & Medicine, 70(9), 1358-1366.
Park, C. W., MacInnis, D. J., Priester, J., Eisingerich, A. B., & Iacobucci, D. (2010). Brand
attachment and brand attitude strength: Conceptual and empirical differentiation of two
critical brand equity drivers. Journal of Marketing, 74(6), 1-17.
Patwardhan, H., & Balasubramanian, S. K. (2011). Brand romance: a complementary approach to
explain emotional attachment toward brands. Journal of Product & Brand
Management, 20(4), 297-308.
Park, J. Y., & Jang, S. S. (2014). Sunk costs and travel cancellation: Focusing on temporal
cost. Tourism Management, 40, 425-435.
Park, C. W., MacInnis, D. J., Priester, J., Eisingerich, A. B., & Iacobucci, D. (2010). Brand
attachment and brand attitude strength: Conceptual and empirical differentiation of two
critical brand equity drivers. Journal of Marketing, 74(6), 1-17.
Parasuraman, A., Zeithaml, V. A., & Berry, L. L. (1985). A conceptual model of service quality and
its implications for future research. Journal of Marketing, 49, 41-50.
Pedersen, P. E., & Nysveen, H. (2001). Shopbot banking: An exploratory study of customer loyalty
effects. International Journal of Bank Marketing, 19(4), 146-155.
Petter, S., Straub, D., & Rai, A. (2007). Specifying formative constructs in information systems
research. MIS quarterly, 69(3), 623-656.

197
Podsakoff, P. M., MacKenzie, S. B., Lee, J. Y., & Podsakoff, N. P. (2003). Common method biases
in behavioral research: a critical review of the literature and recommended remedies. Journal
of Applied Psychology, 88(5), 879-903.
Powdthavee, N. (2007). Economics of happiness: A review of literature and applications.
Chulalongkorn Journal of Economics, 19(1), 51–73.
Preacher, K. J., & Hayes, A. F. (2008). Asymptotic and resampling strategies for assessing and
comparing indirect effects in multiple mediator models. Behavior Research Methods, 40,
879-891.
Preacher, K. J., & Hayes, A. F. (2004). SPSS and SAS procedures for estimating indirect effects in
simple mediation models. Behavior Research Methods, 36(4), 717-731.
Preacher, K. J., Rucker, D. D., & Hayes, A. F. (2007). Addressing moderated mediation hypotheses:
Theory, methods, and prescriptions. Multivariate Behavioral Research, 42(1), 185-227.
Preston, C. C., & Colman, A. M. (2000). Optimal number of response categories in rating scales:
reliability, validity, discriminating power, and respondent preferences. Acta
Psychologica, 104(1), 1-15.
Pritchard, M. P., Havitz, M. E., & Howard, D. R. (1999). Analyzing the commitment-loyalty link in
service contexts. Journal of the Academy of Marketing Science, 27(3), 333-348.
Pritchard, M. P., Howard, D. R., & Havitz, M. E. (1992). Loyalty measurement: A critical
examination and theoretical extension. Leisure Sciences, 14(2), 155-164.
Principles of Questionnaire Construction. (1998). Retrieved from
http://www.analytictech.com/mb313/principl.htm

198
Ismail, A. R., & Spinelli, G. (2012). Effects of brand love, personality and image on word of mouth:
The case of fashion brands among young consumers. Journal of Fashion Marketing and
Management: An International Journal, 16(4), 386-398.
Ramsay, J. O. (1973). The effect of number of categories in rating scales on precision of estimation
of scale values. Psychometrika, 38, 513-533.
Reisinger, Y., & Steiner, C. J. (2006). Reconceptualizing object authenticity. Annals of Tourism
Research, 33(1), 65–86.
Richards, L. (1990). Nobody’s Home: Dreams and Realities in a New Suburb. Melbourne: Oxford
University Press.
Riger, S. & Lavrakas, P. J. (1981). Community ties: patterns of attachment and social interaction in
urban neighborhoods. American Journal of Community Psychology, 9, 55-66.
Rittichainuwat, B. N., Qu, H., & Mongknonvanit, C. (2002). A study of the impactof travel
satisfaction on the likelihood of travelers to revisit Thailand. Journal of Travel & Tourism
Marketing, 12(2-3), 19-43.
Rivera, F. I., Guarnaccia, P. J., Mulvaney-Day, N., Lin, J. Y., Torres, M., & Alegria, M. (2008).
Family cohesion and its relationship to psychological distress among Latino groups. Hispanic
Journal of Behavioral Sciences, 30(3), 357-378.
Rogers, L. Q., Courneya, K. S., Anton, P. M., Hopkins-Price, P., Verhulst, S., Robbs, R. S., Vicari,
S. K., & McAuley, E. (2017). Social Cognitive Constructs Did Not Mediate the BEAT
Cancer Intervention Effects on Objective Physical Activity Behavior Based on Multivariable
Path Analysis. Annals of Behavioral Medicine, 51(2), 321-326.

199
Rothausen, T. (1999). Family in organizational research: A review and comparison of definitions
and measures. Journal of Organizational Behavior, 19, 817-836.
Roy, S. K., Eshghi, A., & Sarkar, A. (2013). Antecedents and consequences of brand love. Journal
of Brand Management, 20(4), 325-332.
Ryan, R. M., & Deci, E. L. (2000). Self-determination theory and the facilitation of intrinsic
motivation, social development, and well-being. American Psychologist, 55(1), 68.
Salancik, G. R. (1977). Commitment and the Control of Organizational Behavior and Belief. In
Staw, B. M., & Salancik, G. R (Eds.), New Directions in Organizational Behavior (PP. 1-54).
Chicago: St. Clair Press.
Samuelson, D., & Yegoiants, W. (2001). The American amusement park. Saint Paul, MN: MBI
Publishing.
Sarkar, A. (2011). Romancing with a brand: a conceptual analysis of romantic consumer-brand
relationship. Management & Marketing, 6(1), 79-94.
Sarstedt, M., & Mooi, E. (2014). A concise guide to market research: The process, data, and
methods using IBM SPSS Statistics (2nd ed.). New York, NY: Springer.
Sarstedt, M., Ringle, C. M., Henseler, J., & Hair, J. F. (2014). On the emancipation of PLS-SEM: A
commentary on Rigdon (2012). Long Range Planning, 47(3), 154-160.
Schiffrin, H. H., & Nelson, S. K. (2010). Stressed and happy? Investigating the relationship between
happiness and perceived stress. Journal of Happiness Studies, 11(1), 33-39.
Seligman, M. E. P. (2011). Flourish. Sydney, New South Wales, Australia: Random House.

200
Senturk, V., Abas, M., Berksun, O., & Stewart, R. (2011). Social support and antenatal depression in
extended and nuclear family environments in Turkey: a cross-sectional survey. BMC
Psychiatry, 11(1), 48.
Sharifi, S. S, & Esfidani, M. R. (2014). The impacts of relationship marketing on cognitive
dissonance, satisfaction, and loyalty: the mediating role of trust and cognitive dissonance.
International Journal of Retail & Distribution Management, 42(6), 553-575.
Shamir, B. (1988). Commitment and leisure. Sociological Perspectives, 31(2), 238-258.
Shaw, S. M., Havitz, M. E., & Delemere, F. M. (2008). “I Decided to Invest in My Kids' Memories”:
Family Vacations, Memories, and the Social Construction of the Family. Tourism Culture &
Communication, 8(1), 13-26.
Sheth, J. N., & Park, C. W. (1974). A Theory of Multidimensional Brand Loyalty. In Ward, S &
Wright, P (ed.), NA - Advances in Consumer Research Volume 01 (pp. 449-459). Ann Abor,
MI: Association for Consumer Research.
Shimp, T. A., Samiee, S., & Madden, T. J. (1993). Countries and their products: a cognitive structure
perspective. Journal of the Academy of Marketing Science, 21(4), 323-330.
Shin, D. C., & Johnson, D. M. (1978). Avowed happiness as an overall assessment of the quality of
life. Social Indicators Research, 5(1-4), 475-492.
Sincero, S. M. (Oct 16, 2012). Online Surveys. Retrieved Jun 29, 2016 from Explorable.com:
https://explorable.com/online-surveys
Singelis, T. M. (1994). The Measurement of Independent and Interdependent Self-Construals.
Personality and Social Psychology Bulletin, 20(5), 580–591.

201
Spiers, A., & Walker, G. J. (2009). The effects of ethnicity and leisure satisfaction on happiness,
peacefulness, and quality of life. Leisure Sciences, 31(1), 84–99.
Stanovich, K. E., & West, R. F. (2000). Individual differences in reasoning: Implications for the
rationality debate? Behavioral and Brain Sciences, 23(5), 645–665.
Sternberg, R. J. (1997). Construct validation of a triangular love scale. European Journal of Social
Psychology, 27(3), 313-335.
Sternberg, R. J. (1986). A triangular theory of love. Psychological Review, 93(2), 119-135.
Stevens, J. (1996). Applied multivariate statistics for the social sciences. Hillsdale, New Jersey:
Lawrence Erlbaum.
Stone, M. (1974). Cross-validatory choice and assessment of statistical predictions. Journal of the
Royal Statistical Society, 36, 111-147.
Sung, H. H., Morrison, A. M., Hong, G. S., & O’Leary, J. T. (2001). The effects of household and
trip characteristics on trip types: a consumer behavioral approach for segmenting the US
domestic leisure travel market. Journal of Hospitality & Tourism Research, 25(1), 46-68.
Swanson. K., Medway. D., & Warnaby. G. (2015a). How to capture tourists’ love for a place:
methodological and technological solutions. Paper presented at the Proceedings of the 46th
TTRA Annual International Conference, 15-17 June, Portland, OR, US.
Swanson, K. (2015b). Place brand love and marketing to place consumers as tourists. Journal of
Place Management and Development, 8(2), 142-146.
Symonds, P. M. (1924). On the loss of reliability in ratings due to coarseness of the scale. Journal of
Experimental Psychology, 7, 456-461.

202
Tabachnick, B. G., & Fidell, L. S. (2013). Using multivariate statistics (6th ed.). Toronto, ON: Pearson.
Terkenli, T. S. (2002). Landscapes of tourism: towards a global cultural economy of space?. Tourism
Geographies, 4(3), 227-254.
Thomson, M., MacInnis, D. J., & Park, C. W. (2005). The ties that bind: Measuring the strength of
consumers’ emotional attachments to brands. Journal of Consumer Psychology, 15(1), 77-91.
Tierney, P. (2000). Internet-based evaluation of tourism web site effectiveness: Methodological
issues and survey results. Journal of Travel Research, 39(2), 212-219.
Thoits, P., & Hannan, M. (1979). Income and psychological distress: The impact of an income-
maintenance experiment. Journal of Health and Social Behavior, 20(2), 120-138.
UNWTO Glossary of Tourism. (2014). Glossary of Tourism Terms. Retrieved on June 28 2016 from
http://cf.cdn.unwto.org/sites/all/files/Glossary+of+terms.pdf
Uysal, M., Gahan, L., & Martin, B. S. (1993). An examination of event motivations: a case study.
Festival Management & Event Tourism, 1(1), 5-10.
Walker, G. J., Deng, J., & Spiers, A. (2009). Leisure, acculturative stress, and immigrants' subjective
well-being. Retrieved from
http://dspace.ucalgary.ca/bitstream/1880/47468/1/Leisure_Acculturative_Stress_Walker_Den
g_Spiers_2009.pdf on 28 May 2016.
Wang, N. (1999). Rethinking authenticity in tourism experience. Annals of Tourism Research, 26(2),
349-370.
203
Whang, Y. O., Allen, J., Sahoury, N., & Zhang, H. (2004). Falling in love with a product: The
structure of a romantic consumer-product relationship. Advances in Consumer
Research, 31(1), 320-327.
Wilcox, J. B., Howell, R. D., & Breivik, E. (2008). Questions about formative measurement. Journal
of Business Research, 61(12), 1219-1228.
Wong, K. K. K. (2013). Partial least squares structural equation modeling (PLS-SEM) techniques
using SmartPLS. Marketing Bulletin, 24(1), 1-32.
Wong, K. K., & Cheung, P. W. (1999). Strategic theming in theme park marketing. Journal of
Vacation Marketing, 5(4), 319-332.
Wold, H. O. A. (1980). Model construction and evaluation when theoretical knowledge is scarce:
theory and application of PLS. In J. Kmenta & J. B. Ramsey (Eds.), Evaluation of
econometric models (pp. 47-74). New York, NJ: Academic Press.
Yoon, Y., & Uysal, M. (2005). An examination of the effects of motivation and satisfaction on
destination loyalty: a structural model. Tourism Management, 26(1), 45-56.
Yuksel, A., Yuksel, F., & Bilim, Y. (2010). Destination attachment: Effects on customer satisfaction
and cognitive, affective and conative loyalty. Tourism Management, 31(2), 274-284.
Zarandian, N., Shalbafian, A., Ryan, C., & Bidokhti, A. A. (2016). Islamic pro-poor and volunteer
tourism—The impacts on tourists: A case study of Shabake Talayedaran Jihad, Teheran—A
research note. Tourism Management Perspectives, 19, 165-169.
Zhao, X., Lynch Jr, J. G., & Chen, Q. (2010). Reconsidering Baron and Kenny: Myths and truths
about mediation analysis. Journal of Consumer Research, 37(2), 197-206

204
Appendix
Appendix I: Brand Love scales (Bagozzi et al., 2014)

205
Appendix II: The English Questionnaire
Theme Park Visitor Perception Survey
Thank you for agreeing to take part in this critical study measuring visitor experiences at Shanghai
Disney Resort. This survey should take around 10 minutes to complete. Some of these questions will
seem very similar because statistically, just asking one question is not reliable. We apologize for the
redundancy. All the responses will be kept confidential and anonymous.
Section 1: Background information
1. When did you visit Shanghai Disney Resort? Year______Month__________
2. Is this your first time visiting Shanghai Disney Resort?
Yes No If No, how many times have you visited here before this time? ____
3. Please indicate your identify when you were/are in Shanghai?
I’m a
tourist
I work, study, or live in
Shanghai but not originally from
Shanghai
I’m a Shanghai local resident
4. If you are not a local resident, how many nights have you stayed in Shanghai during this
trip?
0 (day trip) 1 night 2 nights 3 nights 4 nights
5 nights 6 nights 7 nights or more
Section 2: Experiences with the Disney brand
5. Please answer before today’s visit, have you
Watched a Disney movie over your lifetime? Yes No
Purchased Disney retail merchandises over your lifetime? Yes No
Visited Hong Kong Disneyland? Yes No
Travelled on a Disney cruise over your lifetime? Yes No
Collectively, all the above experiences relate to the overall Disney brand. Please answer the
remaining questions in section 2 in relation to the overall Disney brand.

206
6. Below are the statements about your awareness of the overall Disney brand. Please indicate
the extent to which you agree with the following items.
7. Below are statements about the trust you have towards the overall Disney brand. Please
indicate the extent to which you agree with the following items.
Section 3: Experiences with the Shanghai Disney Resort
Now we want to ask you some questions about your experiences at the Shanghai Disney Resort.
8. What three words would you use to describe your experiences at Shanghai Disney Resort?
Please list the most important three. (you can list both positive and negative words)
Most important word: _______________________________________________________
Second most important word: _________________________________________________
Third most important word: ___________________________________________________
9. In which year did you first hear of the Shanghai Disney Resort?
before 2010 2010 2011 2012 2013
2014 2015 2016
10. Please indicate the extent to which you are agree with the following statements about your
experiences at Shanghai Disney Resort.
Strongly
Disagree …………… Strongly
Agree
10_1: I have heard of positive news about Shanghai
Disney. 1 2 3 4 5 6 7
10_2: I have heard of negative news about Shanghai
Disney. 1 2 3 4 5 6 7
Strongly
Disagree …………………….. Strongly
Agree
6_1: I am very familiar with the Disney brand. 1 2 3 4 5 6 7
6_2: This brand is well known. 1 2 3 4 5 6 7
6_3: I have heard of Disney before. 1 2 3 4 5 6 7
6_4: Disney is very famous. 1 2 3 4 5 6 7
6_5: Disney is visible. 1 2 3 4 5 6 7
Strongly
Disagree …………………….. Strongly
Agree
7_1: Disney is genuinely committed to my satisfaction. 1 2 3 4 5 6 7
7_2: When I see a Disney advertisement, I believe that the
information in it is accurate. 1 2 3 4 5 6 7
7_3: Most of what Disney says about it is true. 1 2 3 4 5 6 7

207
10_3: Shanghai Disney is famous. 1 2 3 4 5 6 7
10_4: I trust Shanghai Disney. 1 2 3 4 5 6 7
10_5: Shanghai Disney’s advertising accurately describes
my true experience. 1 2 3 4 5 6 7
10_6: The quality of merchandise is good 1 2 3 4 5 6 7
10_7: The service is friendly 1 2 3 4 5 6 7
10_8: There is a variety of special events/festivals 1 2 3 4 5 6 7
10_9: The price for activities and events is reasonable 1 2 3 4 5 6 7
10_10: The lodging is unique 1 2 3 4 5 6 7
10_11: The lodging facilities are of good quality 1 2 3 4 5 6 7
10_12: The lodging facilities are clean
10_13: The local transportation is convenient 1 2 3 4 5 6 7
10_14: To access the resort is easy 1 2 3 4 5 6 7
10_15: There is a variety of culture options 1 2 3 4 5 6 7
10_16: The price for sightseeing is reasonable 1 2 3 4 5 6 7
10_17: The atmosphere is restful 1 2 3 4 5 6 7
10_18: Safety and security are good 1 2 3 4 5 6 7
10_19: The food quality is good 1 2 3 4 5 6 7
10_20: There is a variety of cuisine 1 2 3 4 5 6 7
11. Below are statements about your perceived happiness. Please indicate the extent to which
you agree with the following items. (1=Very unhappy; 7=Very happy)
Strongly
Disagree …………… Strongly
Agree
11_1: In general, I consider myself a very happy person. 1 2 3 4 5 6 7
11_2: Compared to most of my peers, I am a happy
person. 1 2 3 4 5 6 7
11_3: I am generally happy. I enjoy life regardless of
what is going on, getting the most out of everything. 1 2 3 4 5 6 7
11_4: I am generally not very happy. Although I am not
depressed, I seldom seem as happy as I might be. (Note:
This indicator was removed from the main survey
questionnaire due to very low factor loading found in the
pilot study. Refer to the pilot study section for
explanations.)
1 2 3 4 5 6 7
12. Are you travelling with family members?
Yes (go to Question no.16) No (go to Question no. 17)
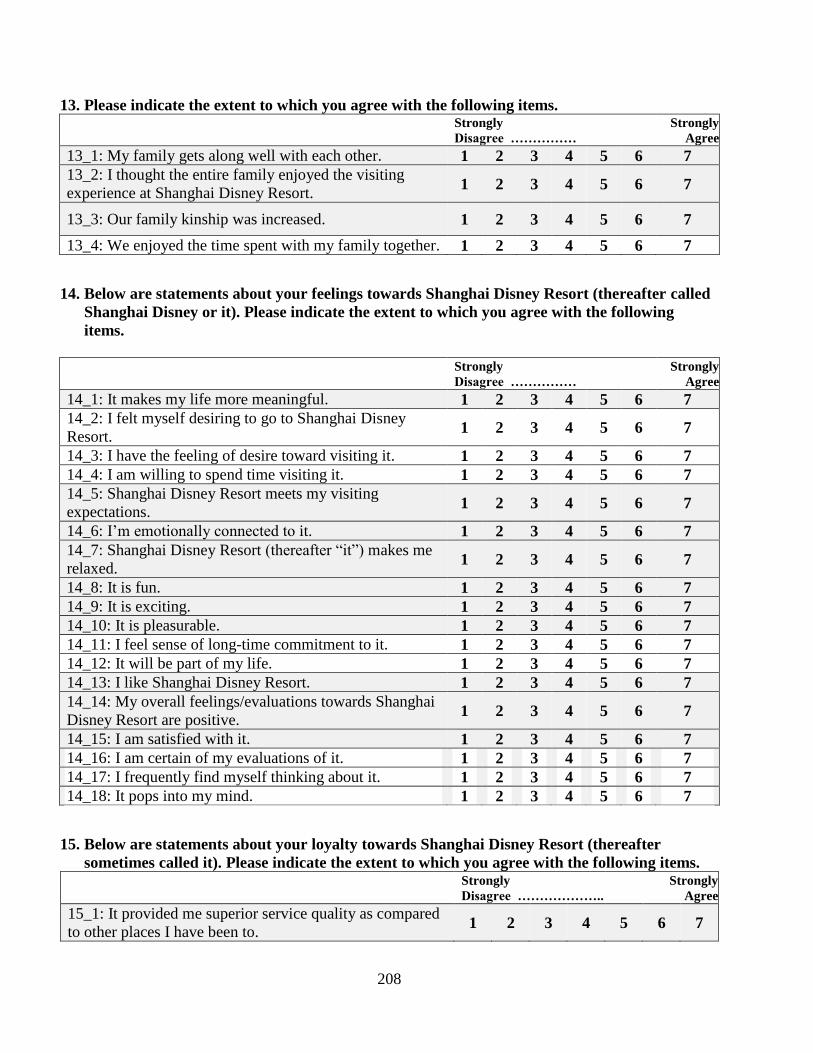
208
13. Please indicate the extent to which you agree with the following items.
Strongly
Disagree …………… Strongly
Agree
13_1: My family gets along well with each other. 1 2 3 4 5 6 7
13_2: I thought the entire family enjoyed the visiting
experience at Shanghai Disney Resort. 1 2 3 4 5 6 7
13_3: Our family kinship was increased. 1 2 3 4 5 6 7
13_4: We enjoyed the time spent with my family together. 1 2 3 4 5 6 7
14. Below are statements about your feelings towards Shanghai Disney Resort (thereafter called
Shanghai Disney or it). Please indicate the extent to which you agree with the following
items.
Strongly
Disagree …………… Strongly
Agree
14_1: It makes my life more meaningful. 1 2 3 4 5 6 7
14_2: I felt myself desiring to go to Shanghai Disney
Resort. 1 2 3 4 5 6 7
14_3: I have the feeling of desire toward visiting it. 1 2 3 4 5 6 7
14_4: I am willing to spend time visiting it. 1 2 3 4 5 6 7
14_5: Shanghai Disney Resort meets my visiting
expectations. 1 2 3 4 5 6 7
14_6: I’m emotionally connected to it. 1 2 3 4 5 6 7
14_7: Shanghai Disney Resort (thereafter “it”) makes me
relaxed. 1 2 3 4 5 6 7
14_8: It is fun. 1 2 3 4 5 6 7
14_9: It is exciting. 1 2 3 4 5 6 7
14_10: It is pleasurable. 1 2 3 4 5 6 7
14_11: I feel sense of long-time commitment to it. 1 2 3 4 5 6 7
14_12: It will be part of my life. 1 2 3 4 5 6 7
14_13: I like Shanghai Disney Resort. 1 2 3 4 5 6 7
14_14: My overall feelings/evaluations towards Shanghai
Disney Resort are positive. 1 2 3 4 5 6 7
14_15: I am satisfied with it. 1 2 3 4 5 6 7
14_16: I am certain of my evaluations of it. 1 2 3 4 5 6 7
14_17: I frequently find myself thinking about it. 1 2 3 4 5 6 7
14_18: It pops into my mind. 1 2 3 4 5 6 7
15. Below are statements about your loyalty towards Shanghai Disney Resort (thereafter
sometimes called it). Please indicate the extent to which you agree with the following items.
Strongly
Disagree ……………….. Strongly
Agree
15_1: It provided me superior service quality as compared
to other places I have been to. 1 2 3 4 5 6 7
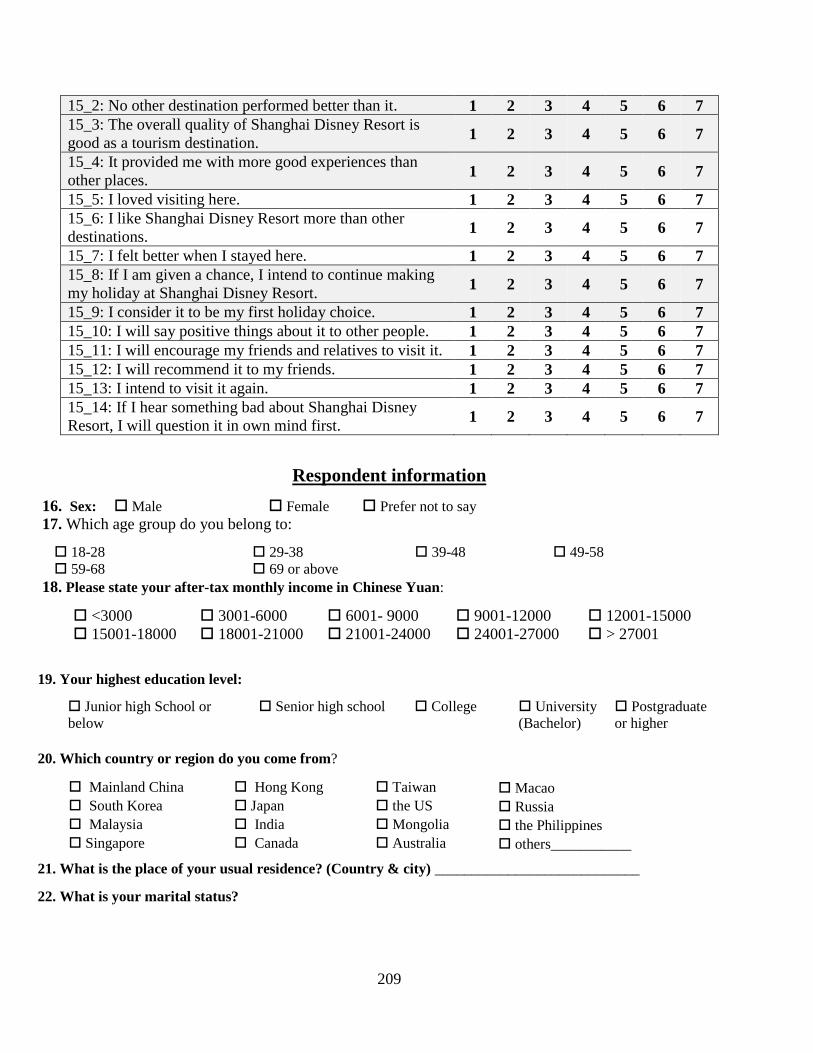
209
15_2: No other destination performed better than it. 1 2 3 4 5 6 7
15_3: The overall quality of Shanghai Disney Resort is
good as a tourism destination. 1 2 3 4 5 6 7
15_4: It provided me with more good experiences than
other places. 1 2 3 4 5 6 7
15_5: I loved visiting here. 1 2 3 4 5 6 7
15_6: I like Shanghai Disney Resort more than other
destinations. 1 2 3 4 5 6 7
15_7: I felt better when I stayed here. 1 2 3 4 5 6 7
15_8: If I am given a chance, I intend to continue making
my holiday at Shanghai Disney Resort. 1 2 3 4 5 6 7
15_9: I consider it to be my first holiday choice. 1 2 3 4 5 6 7
15_10: I will say positive things about it to other people. 1 2 3 4 5 6 7
15_11: I will encourage my friends and relatives to visit it. 1 2 3 4 5 6 7
15_12: I will recommend it to my friends. 1 2 3 4 5 6 7
15_13: I intend to visit it again. 1 2 3 4 5 6 7
15_14: If I hear something bad about Shanghai Disney
Resort, I will question it in own mind first. 1 2 3 4 5 6 7
Respondent information
16. Sex: Male Female Prefer not to say
17. Which age group do you belong to:
18-28 29-38 39-48 49-58
59-68 69 or above
18. Please state your after-tax monthly income in Chinese Yuan:
<3000 3001-6000 6001- 9000 9001-12000 12001-15000
15001-18000 18001-21000 21001-24000 24001-27000 > 27001
19. Your highest education level:
Junior high School or
below
Senior high school College University
(Bachelor)
Postgraduate
or higher
20. Which country or region do you come from?
Mainland China Hong Kong Taiwan Macao
South Korea Japan the US Russia
Malaysia India Mongolia the Philippines
Singapore Canada Australia others___________
21. What is the place of your usual residence? (Country & city) ____________________________
22. What is your marital status?

210
Single, never married Married Widowed Divorced or
separated
Other
23. What was your occupation status prior to this trip?
Employed Unemployed Retired Student Housewife Other
24. With how many people did you travel?
alone 1 person 2 people 3 people
4 people 5 people 6 or more people
25. How much RMB in total did you spend in the resort area? _____________
26. You have done most of the survey, but would you be willing to be contacted to potentially participate
in a follow-up study?
No, I do not want to be contacted.
Yes, you can contact me using my contact information provided
(please print clearly)
Name: ________________________________________________________
Valid email address: _____________________________________________
Wechat or weibo account name: ____________________________________
Section to be completed by the research assistant (As respondent, yon don’t need to fill out the following
part):
Interviewer’s Name: ___________________ Interview Location: ___________________
Interview Date: __________________ Time Used (mins): __________________
Thank you for participating our survey. Your feedback is extremely valuable.
If you indicated on the survey that you would like a copy of the results, they will be sent to you by email
at the address you provided.
We would like to assure you that this study has been reviewed by, and received ethics clearance through
a University of Waterloo Research Ethics Committee. If you have any concerns regarding your
participation in this study, please contact the Chief Ethics Officer, Office of Research Ethics, at 1-519-
888-4567, Ext. 36005 or [email protected].

211
If you have any general comments or questions related to this study, please contact Kai Jiang,
[email protected], Department of Recreation and Leisure Studies.

212
Appendix III: The Simplified Chinese Questionnaire
主题公园参观者调查
感谢您同意参与本调查。问卷需时约 10 分钟。所有答案都为匿名且保密。由于统计分析的要
求,部分问题可能略有重复。
第一部分: 以往参观经历
1. 您哪年哪月参观的上海迪士尼度假区?201___年____月_____日
2. 此次是您第一次参观上海迪士尼度假区吗?
是 否
3. 请选择您参观时在上海的身份:
旅游者(短期参观、旅游、商务活动、或其他) 在上海工作的外地人 上海本地人
4. 若您非本地居民,您此次在上海共停留几晚?
0 (当日返回) 1 晚 2 晚 3 晚 4 晚
5 晚 6 晚 7 晚或更多
第二部分: 对迪士尼品牌的总体感知
5. 请回答在此次参观之前, 您是否:
看过迪士尼出品的电影? 是 否
购买过迪士尼的零售商品? 是 否
参观过香港迪士尼乐园? 是 否
坐过迪士尼的邮轮? 是 否
总体而言,迪士尼出品的电影、零售商品、迪士尼乐园等都属于迪士尼整体品牌的一部分。
请回答如下关于迪士尼整体品牌感知的问题。
6. 以下问题是关于您对迪士尼整体品牌的了解。请圈出在何种程度上,您同意以下选项。
(1= 强烈不同意; 7= 强烈同意)
强烈不同意 强烈同意
我很熟悉迪士尼品牌 1 2 3 4 5 6 7
迪士尼是众所周知的牌子 1 2 3 4 5 6 7
我听说过迪士尼 1 2 3 4 5 6 7

213
迪士尼很有名 1 2 3 4 5 6 7
很容易见到迪士尼 1 2 3 4 5 6 7
7. 以下问题是关于您对迪士尼整体品牌的信任。请选择在何种程度上,您同意以下选项。
(1= 强烈不同意; 7= 强烈同意)
强烈不同意 强烈同意
迪士尼致力于提升我的满意度 1 2 3 4 5 6 7
我相信迪士尼广告里的内容准确 1 2 3 4 5 6 7
如果迪士尼对其产品或服务做出承诺,我相
信是真的 1 2 3 4 5 6 7
第三部分: 上海迪士尼度假区体验
8. 您会用哪三个形容词来描述您在上海迪士尼度假区的体验?请列出最重要的三个形容词
(正面或负面的皆可)
最重要的形容词: _______________________________________________________
次重要的形容词: _______________________________________________________
第三重要的形容词: _____________________________________________________
9. 您第一次听说上海迪士尼度假区是哪一年?
2010 年以前 2010 2011 2012 2013 2014 2015 2016
10. 请圈出在何种程度上,您同意以下描述您在上海迪士尼度假区体验的选项。若未住过上海
迪士尼度假区内的官方酒店,无需回答关于酒店住宿的问题
强烈不同意 强烈同意
我听说过上海迪士尼的正面新闻 1 2 3 4 5 6 7
我听说过上海迪士尼的负面新闻 1 2 3 4 5 6 7
上海迪士尼很有名 1 2 3 4 5 6 7
我信任上海迪士尼 1 2 3 4 5 6 7

214
上海迪士尼的广告准确描述了我的参观体验 1 2 3 4 5 6 7
上海迪士尼的商品质量好 1 2 3 4 5 6 7
上海迪士尼的服务友好 1 2 3 4 5 6 7
上海迪士尼的活动多种多样 1 2 3 4 5 6 7
在上海迪士尼参与活动的价格合理 1 2 3 4 5 6 7
上海迪士尼的酒店住宿是独特的 1 2 3 4 5 6 7
上海迪士尼的酒店住宿设施的质量好 1 2 3 4 5 6 7
上海迪士尼的酒店住宿的卫生状况好 1 2 3 4 5 6 7
上海迪士尼的交通方便 1 2 3 4 5 6 7
上海迪士尼的可进入性较好 1 2 3 4 5 6 7
上海迪士尼的文化元素多种多样 1 2 3 4 5 6 7
上海迪士尼的观光价格合理 1 2 3 4 5 6 7
上海迪士尼的气氛令人感到轻松 1 2 3 4 5 6 7
上海迪士尼的安全和安保措施到位 1 2 3 4 5 6 7
上海迪士尼的食品品质优 1 2 3 4 5 6 7
上海迪士尼的美食多种多样 1 2 3 4 5 6 7
11. 以下问题是关于您的幸福度。请圈出在何种程度上,您同意以下选项。
强烈不同意 强烈同意
总体而言,我比较幸福 1 2 3 4 5 6 7
与其他同伴相比,我认为自己是幸福的 1 2 3 4 5 6 7
我享受生活,不管生活中正在发生什么,总
是能从事情中获得最多正能量 1 2 3 4 5 6 7
总体来说,我不幸福。虽然不觉得不沮丧,
但不那么幸福 1 2 3 4 5 6 7

215
12. 您是否与家人共同参观的上海迪士尼度假区?
是(请回答 17 题) 否 (请回答 18 题)
13. 请圈出在何种程度上,您同意以下选项。
强烈不同意 强烈同意
我们家人之间很和睦 1 2 3 4 5 6 7
我们家人喜欢此次在上海迪士尼度假区的参
观经历 1 2 3 4 5 6 7
参观后,家人之间更亲近了 1 2 3 4 5 6 7
我们享受与家人在一起的时光 1 2 3 4 5 6 7
14. 以下是关于您在上海迪士尼度假区(以下简称上海迪士尼或它)的体验,请圈出在何种程
度上,您同意以下选项。
强烈不同意 强烈同意
上海迪士尼度假区让我的生活更有意思 1 2 3 4 5 6 7
我感到想来参观 1 2 3 4 5 6 7
我有来参观的欲望 1 2 3 4 5 6 7
我愿意花时间参观 1 2 3 4 5 6 7
它达到了我的期待 1 2 3 4 5 6 7
我与上海迪士尼有情感联系 1 2 3 4 5 6 7
它让我感到放松 1 2 3 4 5 6 7
它充满乐趣 1 2 3 4 5 6 7
它令人兴奋 1 2 3 4 5 6 7
它令人感到愉快 1 2 3 4 5 6 7
我是上海迪士尼的长期忠诚顾客 1 2 3 4 5 6 7
它会是我生活的一部分 1 2 3 4 5 6 7
我喜欢上海迪士尼 1 2 3 4 5 6 7
我对它的总体感受和评价是正面的 1 2 3 4 5 6 7
我对它满意 1 2 3 4 5 6 7
我很确定自己对它的评价 1 2 3 4 5 6 7

216
我经常想起上海迪士尼 1 2 3 4 5 6 7
它经常出现在我的脑海里 1 2 3 4 5 6 7
15. 以下问题是关于您对上海迪士尼度假区(以下简称上海迪士尼或它)的忠诚度,请圈出在
何种程度上,您同意以下选项。
强烈不同意 强烈同意
比起其他我去过的旅游目的地,上海迪士尼
度假区提供给我更优质的服务 1 2 3 4 5 6 7
它比其他旅游目的地表现地更好 1 2 3 4 5 6 7
作为一个旅游目的地,它整体的质量很好 1 2 3 4 5 6 7
它给我更多好的体验 1 2 3 4 5 6 7
我喜欢在这里参观 1 2 3 4 5 6 7
我对上海迪士尼忠诚 1 2 3 4 5 6 7
在这里,我感觉更好 1 2 3 4 5 6 7
如果机会允许的话,我打算继续在上海迪士
尼度假 1 2 3 4 5 6 7
上海迪士尼度假区是我的旅游度假第一选择 1 2 3 4 5 6 7
我会在其他人面前夸赞它 1 2 3 4 5 6 7
我会鼓励朋友或家人来这里参观 1 2 3 4 5 6 7
我会向朋友推荐上海迪士尼 1 2 3 4 5 6 7
有机会还会再来 1 2 3 4 5 6 7
我会对关于它的负面消息持怀疑态度 1 2 3 4 5 6 7
被访者信息
16. 您的性别是: 男 女 不想回答
17. 您属于哪个年龄组:
不到 18 岁 18-28 29-38 39-48
49-58 59-68 69 岁及以上
18. 您的税后个人月收入属于哪个区间(人民币):

217
<3000 3001-6000 6001- 9000 9001-12000 12001-15000
15001-18000 18001-21000 21001-24000 24001-27000 > 27001
19. 您的最高学历为:
初中或以下
高中 专科 大学本科 研究生及以上
20. 您的国籍:__________________________________________
21. 您的常居地为:______________________________________
22. 您的婚姻状况:
未婚 已婚 失去配偶 离异或分居 其他
23. 此次参观前,您的就职状态是?
在职 失业 已退休 学生 家庭主妇 其他
24. 这次去上海迪士尼,您与几个人一同参观?
独自参观 与另外 1 人 与另外 2 人 与另外 3 人
与另外 4 人 与另外 5 人 与 6 人或以上
25. 您在上海迪士尼的园区内大约花费了多少人民币? ___________________
26. 您是否愿意留下您的微信号或邮箱地址以参加一个简短的后续调查?
愿意,请通过如下方式联系我 不愿意
姓名: _______邮箱地址:________________微信号:______________

218
Appendix IV: Original and Modified Measures
Original Measures Modified Measures
Brand Awareness
(Oh, 2000)
All were 7-point
click-button scales
The brand name XYZ is very
unfamiliar . . . very familiar
I am very familiar with the Disney
brand
The brand name XYZ is not known
at all . . . very well known
This brand is well known.
The brand name XYZ is not visible
at all . . . very visible
Disney is visible.
The brand name XYZ is never heard
of . . . heard of a lot
I have heard of Disney before
The brand name XYZ is not famous
at all . . . very famous
Disney is very famous
Brand Trust
(Hess, 1995)
All were 5-point
Likert scales;
1=totally disagree;
5=totally agree
____________is genuinely
committed to my satisfaction
Disney is genuinely committed to
my satisfaction
When I see a
__________advertisement I believe
the information in it is accurate
When I see a Disney advertisement,
I believe the information in it is
accurate
Most of what ______________says
about its cars is true
Most of what Disney says about it
is true
Evaluation of
experiential
attributes (Chi & Qu, 2008)
All were 7-point
Likert scales; 1
=very dissatisfied;
7 = very satisfied
Quality of merchandise The quality of merchandise is good
service in restaurants The service is friendly
variety of special events/festivals There is a variety of special
events/festivals
reasonable price for activities and
events
The price for activities and events
is reasonable
uniqueness of lodging The lodging is unique
quality of lodging facilities The lodging facilities are of good
quality
cleanliness of lodging facilities The lodging facilities are clean
convenience of local transportation The local transportation is
convenient
ease of access To access the resort is easy
variety of cultural options There is a variety of culture options
reasonable price for sightseeing The price for sightseeing is
reasonable
restful atmosphere The atmosphere is restful
safety and security Safety and security are good
quality of food The food quality is good
variety of cuisine There is a variety of cuisine
Brand Love
(Batra et al., 2012)
All items were 7-
point Likert scales,
makes life more meaningful It makes my life more meaningful
Feel myself desiring it I felt myself desiring visiting it
feeling of desire toward it I have the feeling of desire toward
visiting it

219
with 1=not at all
and 7=very much”
Willing to spend lot of time I am willing to spend time visiting
it.
meets
expectations
Shanghai Disney Resort meets my
visiting expectations
emotionally connected I’m emotionally connected to it
Relaxed Shanghai Disney Resort makes me
relaxed
Fun It is fun
Exciting It is exciting
Pleasurable It is pleasurable
feel sense of
long-term commitment
I feel a sense of long-time
commitment to it
will be part of life It will be part of my life
Like I like Shanghai Disney Resort
positive My overall feelings/evaluations
towards Shanghai Disney Resort
are positive
satisfaction I am satisfied with it
certainty of evaluations I am certain of my evaluations of it
frequently find myself thinking
about it
I frequently find myself thinking
about it
popping into my head It pops into my mind
Destination Brand
Loyalty
Yuksel et al. (2010)
All items were 5-
point Likert scales
(1 means strongly
disagree; 5 means
strongly agree)
Didim provides me superior service
quality as compared to other places I
have been to
It provided me superior service
quality as compared to other places
I have been to
No other destination performs better
than Didim
No other destination performed
better than it
Overall quality of Didim is the best
as a tourism destination
The overall quality of Shanghai
Disney Resort is the best as a
tourism destination
Didim provides more benefits than
other places
It provided me with more good
experiences than other places
I love staying in Didim
I loved visiting here
I feel better when I stay in Didim
I felt better when I stayed here
I like Didim more than other
destinations
I like Shanghai Disney Resort more
than other destinations
If I am given a chance, I intend to
continue making my holiday in
Didim
If I am given a chance, I intend to
continue making my holiday at
Shanghai Disney Resort
I consider Didim to be my first
holiday choice
I consider it to be my first holiday
choice
Family
togetherness
I get along well with my
friends
My family gets along well with
each other

220
Lee et al. (2004),
Williams and
Anthony (2015)
All items were 5-
point Likert scales:
1=strongly
disagree, 3=neutral
and 5=strongly
agree
I thought the entire family would
enjoy it
I thought the entire family enjoyed
the visiting experience at Shanghai
Disney Resort
To increase family kinship Our family kinship was increased
To spend time with my family
together
We enjoyed the time spent with my
family together
Perceived
Happiness
Lyubomirsky and
Lepper (1999)
All items were 7-
point Likert scales
In general, I consider myself not a
very happy person (1)…….a very
happy person (7)
In general, I consider myself a very
happy person
Compared to most of my peers, I
consider myself less happy
(1)….more happy (7)
Compared to most of my peers, I
am a happy person
Some people are generally very
happy. They enjoy life regardless of
what is going on, getting the most
out of everything. To what extent
does this characterization describe
you? Not at all (1)…..a great deal (7)
I am generally happy. I enjoy life
regardless of what is going on,
getting the most out of everything
Some people are generally not very
happy. Although they are not
depressed, they never seem as happy
as they might be. To what extend
does this characterization describe
you? Not at all (1)…..a great deal (7)
I am generally not very happy.
Although I am not depressed, I
seldom seem as happy as I might
be. (Note: This indicator was
removed from the main survey
questionnaire due to very low
factor loading found in the pilot
study. Refer to the pilot study
section for explanations.) Note: All modified measures are 7-point Likert scales, where 1 means “Strongly Disagree”, 4 means “Neither Disagree
or Agree,” and 7 means “Strongly Agree”.