an electronic blood-cell-counting machine
TRANSCRIPT

1958 13: 398-409
P. CROSLAND-TAYLOR, J. W. STEWART and G. HAGGIS An Electronic Blood-Cell-Counting Machine
http://bloodjournal.hematologylibrary.org/site/misc/rights.xhtml#repub_requestsInformation about reproducing this article in parts or in its entirety may be found online at:
http://bloodjournal.hematologylibrary.org/site/misc/rights.xhtml#reprintsInformation about ordering reprints may be found online at:
http://bloodjournal.hematologylibrary.org/site/subscriptions/index.xhtmlInformation about subscriptions and ASH membership may be found online at:
Copyright 2011 by The American Society of Hematology; all rights reserved.20036.the American Society of Hematology, 2021 L St, NW, Suite 900, Washington DC Blood (print ISSN 0006-4971, online ISSN 1528-0020), is published weekly by
For personal use only. by guest on June 12, 2013. bloodjournal.hematologylibrary.orgFrom

An Electronic Blood-Cell-Counting Machine
By P. CROSLAND-TAYLOR, J. W. STEWART AND G. HAGGIS
I HE METHOD of counting red cells has remained virtually unaltered
since the latter half of the nineteenth century when Cramer introduced
his hemocytometer. It is a tedious and time-consuming method, and many
pathologists have abandoned it altogether for routine u’4
The accuracy of the method when counting all cells in 80 1/400 sq. mm.
squares has a coefficient of variation of about 9.5 per cent.1 This inaccuracy
is due mainly to the small number of cells counted in a comparatively small
field, but there are also a chamber-filling error and a diluting error when
making up the dilute suspension.
A great deal of work has been done in order to produce an instrument
capable of counting blood cells, and the literature contains the descriptions
and results of several machines designed for this purpose. They vary con-
siderably in principle, mode of operation, complexity and cost. The simplest
method is to use the optical properties of a dilute suspension,1#{176} but it has
proved unreliable in the presence of macrocytosis and especially hypochromia.2
A method of counting which employs the measurement of the electrical con-
ductivity of suspensions of blood cells has been devised by Texter et aL,’5
but apparently has not yet proved satisfactory for routine purposes. An im-
proved machine which measures the variations in conductivity as a sus-
pension of cells passes through an orifice has been described by Brecher et
al.’
Moldavan’1 in 1934, suggested a photoelectric apparatus for counting
erythrocytes, and he enumerated the difficulties of counting cells flowing
through a capillary tube. His main difficulty was the insensitivity of the
photoelectric cell. The development of an extremely’ sensitive and powerful
photomultiplier tube enabled Lagercrantz,7 in 1947, to be the first to count
ervthrocytes with a machine. He used dark-ground illumination. Lager-
crantz described an improved apparatus in 1951. Much careful and excellent
work has been done in the development of machines using a mechanical
scanner and an unruled counting chamber. Machines using this principle
have been described by Cooke-Yarborough et al.4 and Poole.’2 A very corn-
plex apparatus using an electronic scanner has been described by Young etal.’7
The purpose of this communication is to describe an electronic blood cell
From The Bland-Sutton Institute of Pathology and The Barnato Joel Laboratories,
The Middlesex Hospital, London, England.
Submitted July 1, 1957; accepted for publication Nov. 18, 1957.
We wish to thank Messrs. Evans Electroselcnum Ltd., Harlow, Essex, for their willing
and patient cooperation and for the use of the production machine we tested We also
thank Petrochemicals Ltd., Urmston, Manchester, for the supply of 0.P.C. 45 detergent.
This is now available only from shell chemicals as “Nonidet P. 40.”
398
For personal use only. by guest on June 12, 2013. bloodjournal.hematologylibrary.orgFrom

..1
0
“p’/
..:.i�I
FIG. 1.-Photograph of E E L automatic blood cell counter.
ELECTRONIC BLOOD-CELL-COUNTING MACHINE 399
counter which has been developed over the past five years, first at the Bland-
Sutton Institute, and then in co-operation with Evans Electroseleneum Ltd.
Description of Counter
The general appearance is illustrated in figure 1. The machine consists of
four distinct parts.
Firstly, a counting-chamber (fig. 2) in which the cells are aligned into
single file. It is mounted on the optical axis of a horizontal dark-ground
microscope. The images of the red cells passing through the chamber are
Projected onto the photomultiplier tube.Secondly, the water-circulating and filtering apparatus which provides a
constant head of water for the counting chamber (fig. 3).
Thirdly, the micropump which supplies a known volume of cell suspension
into the counting chamber.
Fourthly, the electronic apparatus which comprises a photomultiplier, am-
plifiers and scaler unit for recording.
The Chamber
The counting chamber is illustrated diagrammatically in figure 2. it is
based on that described by Crosland-Tavlor� in 1953. The sides are made of
glass, the whole chamber being mounted between the condenser and 2/3-in.
objective of a dark-ground microscope. Clear distilled water supplied by the
circulating system enters the chamber through a wide bore pipe at the base
and is sucked out by a thin, movable, hollow needle known as the vortex
needle, mounted vertically above.
-�----
For personal use only. by guest on June 12, 2013. bloodjournal.hematologylibrary.orgFrom

FIG. 2.-l)iagramatic representation of counting chainboi-.
400 I’. CROSLAND-TAYLOR, J W. STEWART AND G. HAGGIS
- Suction from circulating pump
2. Suction by- pass
3.Valve
4.Upper needle 2
S. Observation area
6. To micro pump
7. Lower needle
8. Filtered water from circulating
pump
The velocity of the water flowing through the chamber is fastest near the
vortex, where it reaches a speed of 100 cm. a second.
A second hollow steel needle enters at the base of the chamber. This lower
needle has another joining it about its middle at a T junction. Blood cells
enter the chamber through this needle from the diluted blood sample which
is placed at its lower end, as shown in the diagram in figure 2. The side
arm is connected to the micropump by means of a polythene tube. The upper
end of this needle lies within the chamber in the stream of circulating water,
so that all red cells leaving it are swept upwards towards the vortex, gaining
in speed as they travel. As the cells enter the vortex they cross the optical
axis of the microscope as a very fine column of cells, not more than 20 � wide.
The large bore pipe, leading from the side of the chamber and known
as the suction by-pass (See figure 2), is connected to the low pressure side of
the water circulating system. This pipe is normally closed by a spring-loaded
valve. On opening the valve, water rapidly flows through the counting
chamber; this results also in a rapid replacement of test-cell suspension in
the lower needle. This “flushing” action is utilized when changing the sample
to be counted.
The Micropump
This is connected to the lower needle at the side arm of the T junction
shown in figure 2. It consists of a steel pin of known diameter, spring-loaded
to maintain contact with a rotating cam geared to an electric motor. Rotation
For personal use only. by guest on June 12, 2013. bloodjournal.hematologylibrary.orgFrom
ELECTRONI( : BLOOD-CELL-COUNTING MACHINE 401
of the cam forces the pin into a small chambei filled with water, and this
( via the polythene tube connected to the lower needle at the T junction)
displaces an equal volume of sample from the lower needle into the chamber.
The vloume of this lower needle is much greater than that of the displace-
ment pump (some 5 to 25 times greater).
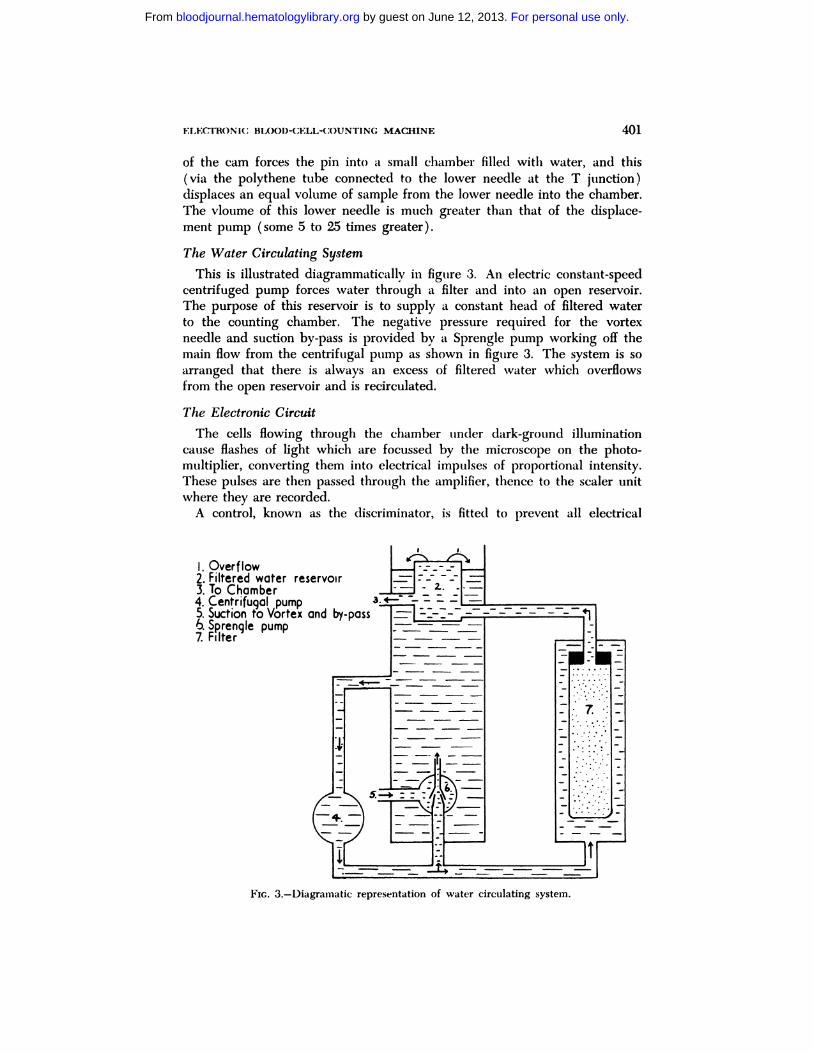
The Water Circulating System
This is illustrated diagrammatically in figure 3. An electric constant-speed
centrifuged pump forces water through a filter and into an open reservoir.
The purpose of this reservoir is to supply a constant head of filtered water
to the counting chamber. The negative pressure required for the vortex
needle and suction by-pass is provided by a Sprengle pump working off the
main flow from the centrifugal pump as shown in figure 3. The system is so
arranged that there is always an excess of filtered water which overflows
from the open reservoir and is recirculated.
The Electronic Circuit
The cells flowing through the chamber under dark-ground illumination
cause flashes of light which are focussed by the microscope on the photo-
multiplier, converting them into electrical impulses of proportional intensity.
These pulses are then passed through the amplifier, thence to the scaler unit
where they are recorded.
A control, known as the discriminator, is fitted to prevent all electrical
I. Overflow L���Li2. Filtered water reservoir - - -
3.To Chamber :�-
4. Centrifugal pump 3.4- - - - - - ________________� �let0p�� and __________
�1ff�J�FIG. 3.-Diagramatic representation of water circulating system.
For personal use only. by guest on June 12, 2013. bloodjournal.hematologylibrary.orgFrom

402 P. CROSLAND-TAYLOR, J. W. STEWART AND G. HAGGIS
pulses of less than the selected voltage from being counted. it is necessary
because minor fluctuations in the electrical circuits and particles such as
platelets in the sample cause very small voltage pulses which must be ex-
eluded from the recorded count if accurate erythrocyte and leukocyte counts
are to be made.
Principle of Operation
A sample pot containing a I : 200 dilution of blood in red cell fluid is
placed on a platform below the hwer needle. By moving a handle the plat-
form is raised so that the end of the lower needle is in the suspension. By
raising the handle to its limit against a spring, the suction by-pass valve is
opened, which forcibly sucks the cell suspension through the lower needle.
As the handle is released the valve closes and the lever comes to rest on a
stop. In this position, the lower needle is still immersed below the surface
of the cell suspension, and the stream of cells flowing upwards into the vor-
tex may be examined through a spy-hole near the photomultiplier in order
to check that alignment is correct. By lowering the handle further the sample
pot containing the cell suspension is taken clear of the lower needle. The
water circulating system is so arranged that the slight negative pressure in
the chamber is not sufficient to overcome the resistance of the capillary at-
traction of the fluid suspension in the lower needle. Under these conditions,
fluid with cells in suspension remains in the lower needle, but any fluid
forced in by the micropump via the T junction on this needle immediately
releases an equal volume of sample from the upper half of the tube, which
is then carried by the water flow through the counting area. The action of
lowering the handle also resets the scaling unit to zero, and the micropump
is started. After 10 seconds the micropump delivers’ is complete and the
number of cells in the delivery volume is shown on the scaler.
Methods Employed in Testing the Machine
1. Repeatability. One hundred counts were made from a single sample of
a 1:200 suspension of normal blood. The recommended procedure is to take
the coefficient of variation of the 100 counts and the 25 averages of four.
2. Calibration. To check the accuracy of the calibration, 23 different red
cell suspensions were counted visually by the standard hemocytometer technic
and, subsequently, by the machine.
Lost Counts Due to Abnormal Cell Suspension3
The extent to which this occurs may be examined by two methods:
1. By examining the fall in the counts as the discriminator voltage is
increased. This effect is due to the removal of smaller pulses before they
reach the counting circuits. The slope of the curve when machine count is
plotted against the discriminator voltage indicates the likelihood of under-
counting. This has been done on (a) a normal cell suspension, (b) a case
of microcytic anaemia, and (c) a case of pernicious anaemia. The abnormal
cases were chosen because the cells showed considerable anisocytosis.
2. By examination of the ratios of visual: machine count for any significant
For personal use only. by guest on June 12, 2013. bloodjournal.hematologylibrary.orgFrom

ELECTRONIC BLOOD-CELL-COUNTING MACHINE 403
correlation between an increased ratio with any particular type of cell sus-
pension.
Lost Counts Due to Diminished Lamp Intensity
The microscope lamp is a low voltage coiled filament lamp and is under-
run by operating the transformer at 200 instead of 230 volts. Using a single
suspension of normal blood, we made a series of four counts at discriminator
voltage settings of 20, 30, 40 and 50 volts, and repeated the process of alter-
ing the lamp transformer voltage to 230 and 160 volts.
Lost Counts Due to Coincident Pulses
A suspension of normal blood was accurately measured and diluted to
give final dilution values of 1 : 100, 1 : 200, 1 : 400 and 1 : 800 parts of diluting
fluid. Ten counts were made on each of these four samples, and the average
of these is recorded in table 4. Any rise of count with dilution, when all are
multiplied to give results as if they had been diluted 1:100, is assumed to
he due to changes in coincidence losses.
RESULTS
1. Repeatability. The repeatability of the Counting Machine is shown in
table 1. The coefficient of variation for single counts is 2.1 per cent, and for
groups of four, it is 1 per cent. The time taken for this experiment was under
one hour.
2. Calibration. The results of visual counts and their comparison with
machine counts is shown in table 2. The mean ratio of the visual:machine
count is 1.007; a mode of distribution is 0.98.
Lost Counts Due to Abnormal Cell Suspensions
Examination of the effect of discriminator voltage on the machine count:
The result of plotting the machine count against the discriminator voltage
TABLE 1.-Coefficient of Variation on Repeat Counts
E E L Machine
Red Count in Millions/cu.mm.
4.26 4.35 4.24 4.43 4.41 4.34 4.47 4.49
4.46 4.25 4.32 4.44 4.33 4.48 4.48 4.33
4.25 4.34 4.44 4.29 4.35 4.38 4.42 4.30
4.37 4.40 4.33 4.46 4.28 4.44 4.39 4.62
4.25 4.20 4.28 4.43 4.32 4.43 4.36 4.45
4.38 4.38 4.47 4.48 4.17 4.48 4.44 4.43
4.36 4.45 4.45 4.39 4.64 4.35 4.26 4.25
4.57 4.39 4.41 4.25 4.26 4.39 4.39 4.164.44 4.25 4.42 4.36 4.46 4.51 4.35 4.31
4.41 4.51 4.41 4.31 4.31 4.30 4.55 4.29
4.37 4.29 4.28 4.31 4.44 4.30 4.28 4.30
4.45 4.49 4.55 4.41 4.43 4.48 4.38 4.41
4.38 4.35 4.41 4.40
Coefficient of Variation Single Counts = 2.1 Per cent.
Coefficient of Variation in Groups of 4 = I Per cent.
For personal use only. by guest on June 12, 2013. bloodjournal.hematologylibrary.orgFrom

4�4 P. CROSLAND-TAYLOR, J. W. STEWART AND G. HAGGIS
TABLE 2
Hb. VISUAL MACHINE VISUAL
(Sm. PCV COUNT COUNT MCHC MCV MACHINE
11.6 32 2.72 2.57 36 124 1.0510.9 32 3.67 3.74 34 85 .98
6.1 19 1.88 1.83 32 104 1.03
12.2 37 4.22 4.30 33 86 .98
9.9 33 3.82 3.80 30 87 1.00
3.3 14 1.90 1.56
3.3 14 1.67 1.57� 24 90 1.15
11.9 36 3.60 3.69 33 97 98
9.1 33 3.60 3.73 28 88 96
10.9 34 3.65 3.65 32 93 1.00
3.3 14 1.80 1.75 24 85 1.09
9.9 30 3.41 3.54 33 85 .96
15.2 46 4.74 4.90 :33 94 .96
5.4 23 2.10 2.14 24 107 .98
11.0 33 4.05 4.13 33 80 .98
9.6 29 2.88 296 33 99 .98
3.2 9.5 0.93 0.84 34 115 1.11
10.6 32 3.40 3.40 33 94 1.00
10.0 36.5 5.36 5.62 27 65 .95
10.3 32 3.80 4.04 32 79 .9414.4 42 4.90 4.54 34 93 1.09
15.0 45 5.40 5.24 33 86 1.03
13.3 38 4.0 4.08 35 93 .98
is shown in figure 4 for normal, hypochromic anemia and macrocytic anemia.
The recommended discriminator voltage is indicated by the arrow.
The slope of the graph for the hypochromic anemia in figure 4 implies
that with microcytic and hypochromic cells the working margin is less than
that for other bloods. This was anticipated, but at the discriminator voltage
recommended we could not detect any error with this type of blood.
Lost Counts Due to Diminished Light Intensity
In the same way that variations in the machine sensitivity or discriminator
voltage alter the count by the machine, so do variations in lamp intensity.
The degree to which this occurs in normal blood is shown in table 3, the
normal discriminator voltage in this machine being 20 volts with 200
volts on the lamp transformer.
The change in count is small for normal blood. The effect on abnormal
blood might be greater, hence the need to under-run the bulb and change
it every three months before it blackens and reduces the light intensity.
Lost Counts Due to Coincident Pulses
When the sample equivalent to 10 million/cu. mm. was subsampled and
diluted to give counts equivalent to approximately 5 million, 2.5 million and
1.25 million, there was an increase in the value of the machine count over
the expected count. This increase is shown in table 4, and is due to coin-
For personal use only. by guest on June 12, 2013. bloodjournal.hematologylibrary.orgFrom

EU
ELECTRONIC BLOOD-CELL-COUNTING MACHINE 405
. . � �. � � ;#{149}#{149}�� :� � :
.E � : - i . . ; . ..
C � �::
� -- 2::
02 . � .:.U �-- . � ,:
.v H!� +- � ..� : � .. : - ! hi
� .. ..
� f� I -�_ � � . �
0 lii
SensUlvity (Bias Vol?aqe�
Fic. 4.-Graph showing bias voltage curves obtained using normal blood and blood
from hypochromic niicrocytic and macrocytic anemias. The arrows indicate recommended
operating voltages on the machines tested.
cidence loss. The change in coincidence loss is small over the range tested,
indicating that the loss itself is small.
DiscussIoN
This machine, developed for counting blood cells, has the advantage of
giving more reproduceable results than visual counts. We tried the machine
on various abnormal specimens, and within the limits of our tests the machine
counted all samples accurately. No difference was detected between macro-
cytic or microcytic samples or with any other abnormality of the erythrocytes
which we tried; the sole exception was in cases of leukemia with high leuko-
TABLE 3.-Sensitivity Test Ofl E E L
Red count in M/cu.mm. at various discriminator voltages and lamp brightnesses
Lamp Voltages Discriniinator Voltages
Lamp Volts 20 30 40 50160 4.93 4.80 4.71 4.35200 5.06 4.97 4.93 4.95230 5.36 5.11 5.01 4.95
For personal use only. by guest on June 12, 2013. bloodjournal.hematologylibrary.orgFrom

406 P. GROSLAND-TAYLOR, J W. STEWART AND G. HAGGIS
TABLE 4
DILUTION OFORIGINAL SAMPLE
AVERAGE MACHINERED CELL COUNT
MULTIPLED TO EQUALFINAL DILUTION 1/100
1/100 10.27 M/cm. 10.271/200 5.23 M/cm. 10.46
1/400 2.65 M/cm. 10.60
1/800 1.318 M/cm. 10.54
cyte counts. Here the leukocytes are counted with the erythrocytes, and
to obtain the latter count, the leukocyte count has to be deducted.
The exact calibration of this machine depends on the calibration of the
micropump. The loss of counts due to coincidence varies with the cell con-
centration and may be calculated theoretically if the pulse duration, dead
time and the counting rate are known. In the machine tested, the pulse
duration was 40 ,� seconds which gives a theoretical loss of 2 per cent for a
SM/cu. mm. count, 4 per cent for a 10 M/cu. mm. count, and 0.5 per cent
for a 1.25 M/cu. mm. count. If table 4 is consulted and the values obtained
there corrected by these factors, then the counts when compensated read as
follows:
Dilution of Multiplied to Equal Count Corrected For
Original Sample Final Dilution 1/100 Coincidence Loss
1/100 10.27 M/cm. 10.67 M/cm.
1/200 10.46 M/cm. 10.66 M/cm.
1/400 10.60 M/cm. 10.70 M/cm.
1/800 10.54 M/cm. 10.59 M/cm.
The actual difference between these counts is not great, and for ordinary
purposes the coincidence losses were assumed to be 2 per cent, whatever
the count. The correction was achieved by deliberately setting the micro-
pump to deliver 2 per cent too much suspension, and thus the answer could
be read directly off the scaler.
The method of checking the calibration of the machine by examination of
the ratios of visual:machine counts has the advantage of giving an immediate
answer to the question of whether the machine count is seriously wrong.
It has already been shown in table 1 that the machine count is reproducible,
and, therefore, any error on its parts will also be reproducible. Thus, any
error of the machine will be seen in the average machine as compared with
average visual count. In this series the mean of the visual:machine ratios
is 1.007 and the mode of the distributions of this value is 0.98. This means
that the average visual and average machine counts agree within 2 per cent,
and, therefore, there is no consistent error in the machine count.
The operation of the machine is quick and simple, a single count taking
just over 10 seconds. It has been our practice to count each sample four
times and to take the average count. By this means, sub-sampling errors are
reduced and the coefficient of variation is only 1 per cent, whereas it is 2.1
per cent for a single count.
For personal use only. by guest on June 12, 2013. bloodjournal.hematologylibrary.orgFrom

ELECTRONIC BLOOD-CELL-COUNTING MACHINE 407
TABLE 5
f�ilution 1:10
Visual count: 6,000
561
508
.547
569
593
542
516
584
616
511
Average = 548.9
TABI.E 6
l)ihition 1 in 200 Visti: il count: 200,0(X)
1093
10081085
1026
1079
1043
1058
1044
1042
1082
.
1048
10991083
1056
1086
1086
986,1085
1088
1021
Maintenance
The regular maintenance which is required is the replacement of the bulb
every three months before signs of blackening are evident, and the change
of filter and circulating water when the glass walls of the chamber are being
cleaned. This must be done every two weeks because a deposit forms . On
the glass chamber walls. This deposit, even in minute amounts, greatly im-
pairs the efficiency of the optical system and might cause the machine to
undercount hypochroinic or microcytic cells.
Leukocyte Counts
\Ve have tested a model using a micropump capable of delivering 1 cu.mm.,
and this model was able to count white cells using a 1: 10 suspension of
blood. The suspension fluid consisted of 1 per cent acetic acid containing
1 per cent of a nonionic detergent (O.P.C. 45, Petrochemicals Ltd.). The
machine count agreed with the visual count, but we have not yet had the
opportunity to fully test the ability of the machine to count leukocytes tinder
all conditions. We have done a small number of coOnts on an experimental
basis, and the results of two short experiments are shown in tables 5 and 6.
For personal use only. by guest on June 12, 2013. bloodjournal.hematologylibrary.orgFrom

408 P. CROSLAND-TAYLOR, J. W. STEWART AND G. HAGGIS
It is important that the blood for leukocyte counts should not be oxalated,
as oxalate crystals are also counted. Sodium citrate, 3 mg./ml. of blood, or
disodium versenate, 1 mg./mI. of blood, are satisfactory anticoagulants.
SUMMARY
An electronic blood cell counting machine operating on a flow principle
is described. it is quick and easy to use; it can perform a red cell count in
ten seconds with an accuracy of ± 2.1 per cent ( that is, 5000 cells counted
in 10 seconds for a 5 M count ) . Leukocyte counts can also be performed in
ten seconds with an accuracy of ± 9 per cent for a single count ( 500 cells
counted in a 5000 cu.cm. count).
SUMMARIO IN INTF.RLINGUA
Es describite tin machina electronic pro le numeration de cellulas de sang-
nine. Su functionamento es basate super le principio del fluxo de cellulas in
“fila indie.” Le uso del machina es rapide e facile. Illo pote completar tin nu-
meration erythrocytic intra dece secundas con un accuratessa de ±2, 1 pro
cento ( i.e. 5.000 cellulas numerate in 10 secundas pro un numeration de SM ).
Numerationes leucocytic es etiam effectuabile in dece secundas. Hic le ac-
curatessa es ±9 pro cento in un numeration unic ( SO cellulas numerate in
10 secundas in un numeration de 5.000 cm3).
REFERENCES
1. Biggs, R. and MacMillan, R. L.: The error of the red cell count. J. Clin. Path.1:288-291, 1948.
2. Brackett, R. S., Mattern, C. F. and Olson, B. F.: Appraisal of instrument for
counting erythrocytes by scatter photometry. Am. J Clin. Path. 23:731-745, 1953.
3. Brecher, C., Schneiderman, M. and Williams, G. Z.: Evaluation of electronic redblood cell counter. Am. J. Clin. Path. 26:1439-1449, 1956.
4. Cooke-Yarborough, E. G. and Whyard, R. E.: The automatic counting of red
blood cells. Brit. J. Applied Physics. Supplement 3:147-156, 1954.
5. Crosland-Taylor, P. J.: A device for counting small particles suspended in a fluid
through a tube. Nature 171:37-38, 1953.
6. Discombe, G: Lancet ii:240, 1957.
7. Lagercrantz, C.: On the theory of counting individual microscopic cells by photo-
electric scanning. An improved apparatus. Act physiol. Scandinav. 26: Supple-
mentum 93, 1952.
8. --: Photo-electric counting of individual microscopic cells. Upsala l#{228}karef. f#{246}rh.
52:287-303, 1947.
9. MacFarlane, R. G., King, E. J., Wotton, I. D. P. and Gilchrist, M.: Determination
of haemoglobin. III Reliability of clinical and other methods. Lancet i:282-286, 1948.
10. Matthes, M. and Scharpf, H.: Clinical studies with a new photo-electric apparatus
for determination of erythrocyte count, leucocyte count and haemoglobin content.
KIm. Wchnschr. 29:266-267, 1951.
11. Moldavan, A.: Photo-electric technique for the counting of microscopical cells.
Science 80:188, 1934.
12. Poole, J. C. P.: The performance of the Radcliffe blood cell counter. Communication
to 5th Intemation�l Congress of Haematology, Paris, 1954.
13. Rajchman, J. A. and Snyder, R. L.: Electronics 13:20, 1940.
14. Shillitoe, A. J.: Lancet ii:295, 1957.
For personal use only. by guest on June 12, 2013. bloodjournal.hematologylibrary.orgFrom

ELECTRONIC BLOOD-CELL-COUNTING MACHINE 409
15. Texter, E. C., Hirsch, F. G., et al.: The electrical conductivity of blood. II Relation
to red cell count. Blood 5:1036-1048, 1950.
16. Whitby, L. E. H. and Britton, C. J. C.: Disorders of the Blood. 7th ed., London,Churchill, pp. 698-698.
17. Young, J. Z. and Roberts, F.: “A flying spot microscope.” Nature 167:231, 1951.
For personal use only. by guest on June 12, 2013. bloodjournal.hematologylibrary.orgFrom