ami corporate update - june 2016s2.q4cdn.com/.../2016/ami-corporate-update-june-2016.pdf ·...
TRANSCRIPT
Corporate UpdateJune 2016

Forward‐Looking Statements
2
Cautionary Statement This presentation contains certain information that constitutes “forward‐looking information” and “forward‐looking statements” as defined under Canadian and U.S. securities laws. All statements inthis presentation, other than statements of historical fact, are forward‐looking statements. The words “expect”, “believe”, “anticipate”, “contemplate”, “may”, “could”, “will”, “intend”, “estimate”,“forecast”, “target”, “budget”, “schedule” and similar expressions identify forward‐looking statements. Forward‐looking statements in this presentation include, without limitation, information as toour strategy, projected gold production from the Young‐Davidson, Hemlo – Williams, Eagle River, Fosterville and Stawell mines, which are not owned by the Company, project timelines, the planned2% net smelter return royalty on future production from the Kemess Underground mine, projected exploration results, resource and reserve estimates, projected production and costs of the KemessUnderground mine, other statements that express our expectations or estimates of future performance, value growth, value creation and shareholder returns, the success of exploration activities,mineral inventory including the Company’s ability to delineate additional resources and reserves as a result of such programs, mineral reserves and mineral resources and anticipated grades,exploration expenditures, costs and timing of any future development, costs and timing of future exploration and the presence of and continuity of metals at Kemess East at modeled grades.
Forward‐looking statements are necessarily based upon a number of factors and assumptions that, while considered reasonable by management at the time of making such statements, are inherentlysubject to significant business, economic and competitive uncertainties and contingencies. Known and unknown factors could cause actual results to differ materially from those projected in theforward‐looking statements. Such factors and assumptions underlying the forward‐looking statements in this presentation include, but are not limited to: changes to current estimates of mineralreserves and resources; fluctuations in the price of gold and copper; changes in foreign exchange rates (particularly the Canadian dollar and U.S. dollar); performance of the Young‐Davidson, Hemlo –Williams, Eagle River, Fosterville and Stawell mines, which may impact the future cash flows associated with the Company’s royalty holdings; the impact of inflation; employee relations; litigation;uncertainty with the Company’s ability to secure capital to execute its business plans; the speculative nature of mineral exploration and development, including the risks of obtaining necessarylicenses, permits, authorizations and/or approvals from the appropriate regulatory authorities for the Kemess Underground project; contests over title to properties; changes in national and localgovernment legislation in Canada and other jurisdictions in which the Company does or may carry on business in the future; risk of loss due to sabotage and civil disturbances; the impact of globalliquidity and credit availability and the values of assets and liabilities based on projected future cash flows; as well as business opportunities that may be pursued by the Company.
Actual results and developments are likely to differ, and may differ materially, from those expressed or implied by the forward‐looking statements contained in this presentation. Such statements arebased on a number of assumptions, including those noted elsewhere in this document, which may prove to be incorrect. Readers are cautioned that forward‐looking statements are not guarantees offuture performance. All of the forward‐looking statements made in this presentation are qualified by these cautionary statements.
There can be no assurance that forward‐looking statements or information will prove to be accurate, accordingly, investors should not place undue reliance on the forward‐looking statements orinformation contained herein. The Company disclaims any intention or obligation to update or revise any forward‐looking statements whether as a result of new information, future events orotherwise, except as required by applicable law.
Cautionary Note to U.S. Investors Concerning Measured, Indicated and Inferred ResourcesThis presentation uses the terms "measured", "indicated" and "inferred” resources. We advise investors that while those terms are recognized and required by Canadian regulations, the United StatesSecurities and Exchange Commission does not recognize them. “Inferred resources” have a great amount of uncertainty as to their existence and as to their economic and legal feasibility. It cannot beassumed that all or any part of an inferred resource will ever be upgraded to a higher category. Under Canadian rules, estimates of inferred mineral resources may not form the basis of feasibility orother economic studies. United States investors are cautioned not to assume that all or any part of measured or indicated mineral resources will ever be converted into mineral reserves. United Statesinvestors are also cautioned not to assume that all or any part of an inferred mineral resource exists, or is economically or legally mineable.
Qualified Person as Defined by National Instrument 43‐101John Fitzgerald, Chief Operating Officer for AuRico Metals Inc. has reviewed and approved the scientific and technical information contained within this presentation. Mr. Fitzgerald is a “QualifiedPerson” as defined by National Instrument 43‐101.

Royalty Portfolio Kemess Gold – Copper Project Young‐Davidson ramp‐up progressing well
Fosterville reserves 34%
Hemlo reserves 12%
Eagle River reserves 13%
Stawell resources 14%
5.7 to 6.1Koz in 2016 attributable production (per guidance)
… and gold is 24% YTD
Resource update (Moz AuE1):
Positive feasibility update:
Delineation of high grade core at Kemess East (upside)
Environmental Assessment Application undergoing 180‐day review by BC EAO
3.2 4.0 3.2
AMI: Recent Developments
3
After‐tax NPV (5%)C$289M
P&P M&I Inferred
(Reserves Only)
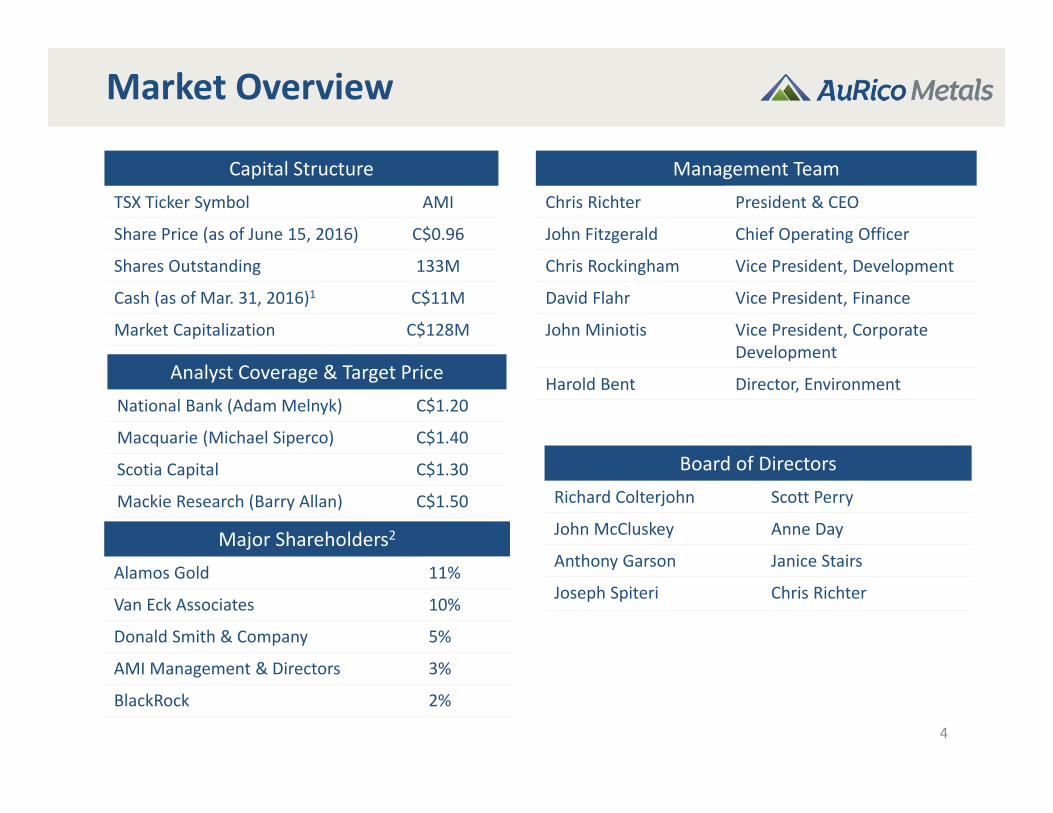
Capital StructureTSX Ticker Symbol AMI
Share Price (as of June 15, 2016) C$0.96
Shares Outstanding 133M
Cash (as of Mar. 31, 2016)1 C$11M
Market Capitalization C$128M
Management TeamChris Richter President & CEO
John Fitzgerald Chief Operating Officer
Chris Rockingham Vice President, Development
David Flahr Vice President, Finance
John Miniotis Vice President, Corporate Development
Harold Bent Director, Environment
Board of DirectorsRichard Colterjohn Scott Perry
John McCluskey Anne Day
Anthony Garson Janice Stairs
Joseph Spiteri Chris Richter
Major Shareholders2
Alamos Gold 11%
Van Eck Associates 10%
Donald Smith & Company 5%
AMI Management & Directors 3%
BlackRock 2%
4
Market Overview
Analyst Coverage & Target PriceNational Bank (Adam Melnyk) C$1.20
Macquarie (Michael Siperco) C$1.40
Scotia Capital C$1.30
Mackie Research (Barry Allan) C$1.50
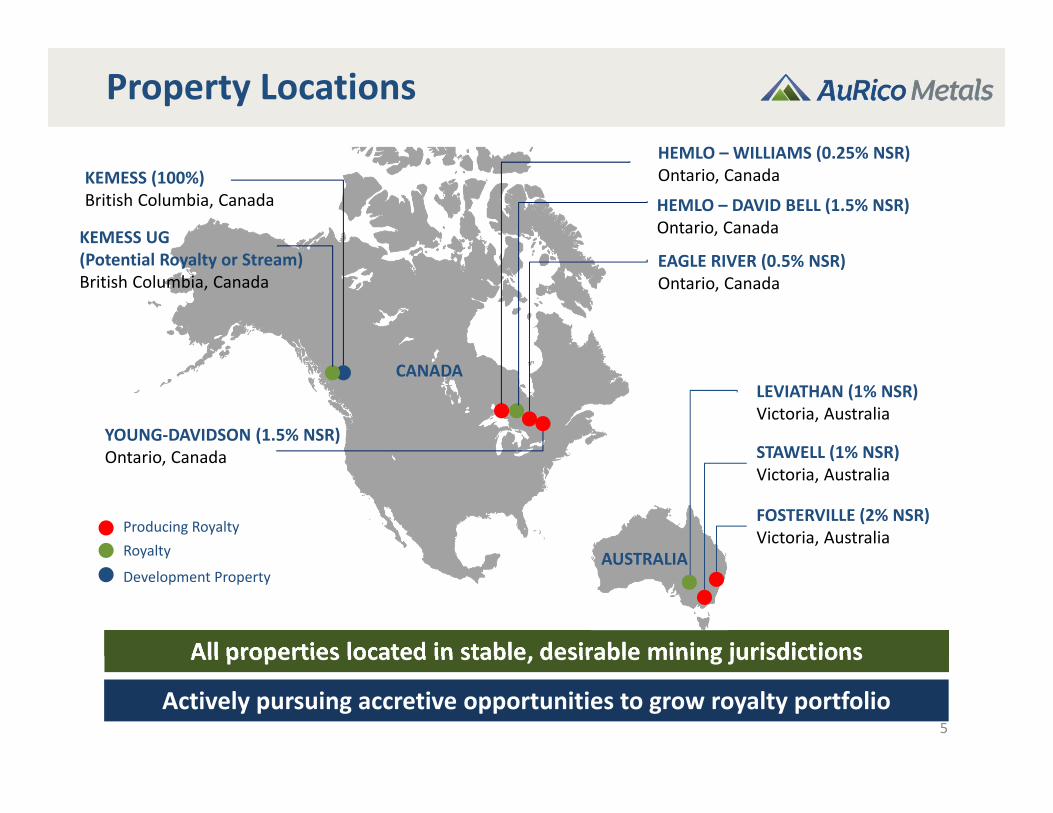
Property Locations
5
All properties located in stable, desirable mining jurisdictions
Development Property
CANADA
AUSTRALIA
KEMESS (100%)British Columbia, Canada
YOUNG‐DAVIDSON (1.5% NSR)Ontario, Canada STAWELL (1% NSR)
Victoria, Australia
FOSTERVILLE (2% NSR)Victoria, Australia
Royalty
LEVIATHAN (1% NSR)Victoria, Australia
KEMESS UG(Potential Royalty or Stream) British Columbia, Canada
HEMLO – WILLIAMS (0.25% NSR)Ontario, Canada
HEMLO – DAVID BELL (1.5% NSR)Ontario, Canada
EAGLE RIVER (0.5% NSR)Ontario, Canada
Actively pursuing accretive opportunities to grow royalty portfolio
Producing Royalty
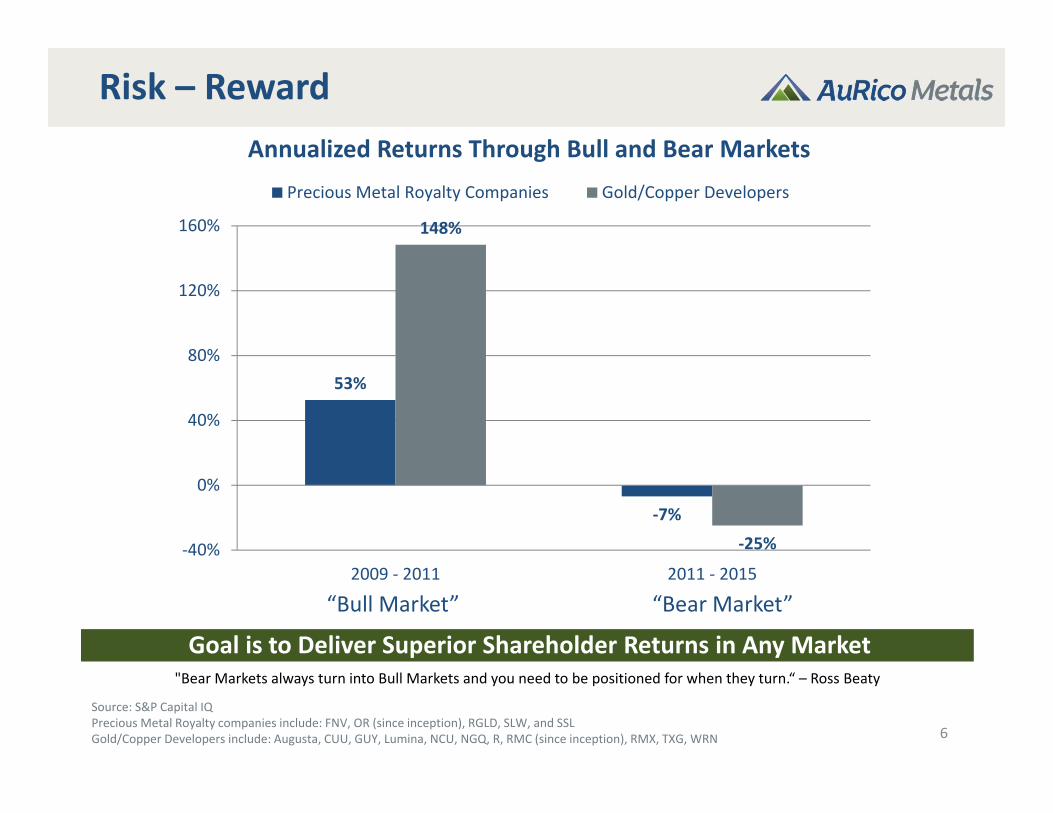
Risk – Reward
Source: S&P Capital IQPrecious Metal Royalty companies include: FNV, OR (since inception), RGLD, SLW, and SSLGold/Copper Developers include: Augusta, CUU, GUY, Lumina, NCU, NGQ, R, RMC (since inception), RMX, TXG, WRN 6
Goal is to Deliver Superior Shareholder Returns in Any Market
“Bull Market” “Bear Market”
53%
‐7%
148%
‐25%‐40%
0%
40%
80%
120%
160%
2009 ‐ 2011 2011 ‐ 2015
Precious Metal Royalty Companies Gold/Copper Developers
Annualized Returns Through Bull and Bear Markets
"Bear Markets always turn into Bull Markets and you need to be positioned for when they turn.“ – Ross Beaty

Royalty Portfolio Overview
7
Royalty Mineral Inventory (years)1
Royalty EBITDA (C$ M) at Various Gold Prices2
Royalty Value Drivers AuRicoRoyalties
Asset Stage
Geographic Location
Core Asset of Operator
High‐Quality Operator
Precious Metals
Mine Life
Cost Profile
Scale of Production
Exploration Upside US$
0
4
8
12
16
20
24
$1,000 $1,200 $1,400 $1,600Kemess UG (dev't stage) Stawell Eagle River Hemlo Fosterville YD
0 5 10 15 20 25
Kemess East(3)
Kemess UG(3)
Stawell
Eagle River
Hemlo
Fosterville
YD
Royalty Mineral Inventory (years)
P&P
M&I
Inferred
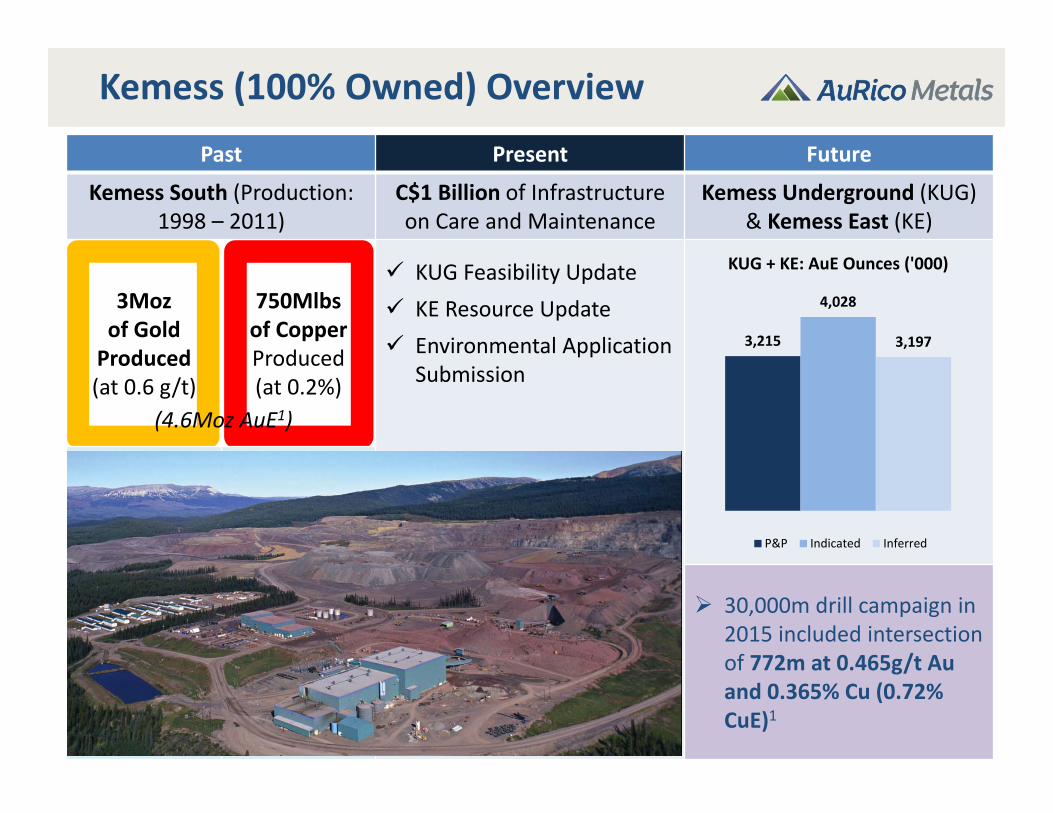
Kemess (100% Owned) Overview
8
Past Present Future
Kemess South (Production: 1998 – 2011)
C$1 Billion of Infrastructure on Care and Maintenance
Kemess Underground (KUG) & Kemess East (KE)
3Mozof Gold Produced(at 0.6 g/t)
750Mlbsof Copper Produced (at 0.2%)
KUG Feasibility Update KE Resource Update Environmental Application
Submission
30,000m drill campaign in 2015 included intersection of 772m at 0.465g/t Au and 0.365% Cu (0.72% CuE)1
(4.6Moz AuE1)
3,215
4,028
3,197
KUG + KE: AuE Ounces ('000)
P&P Indicated Inferred
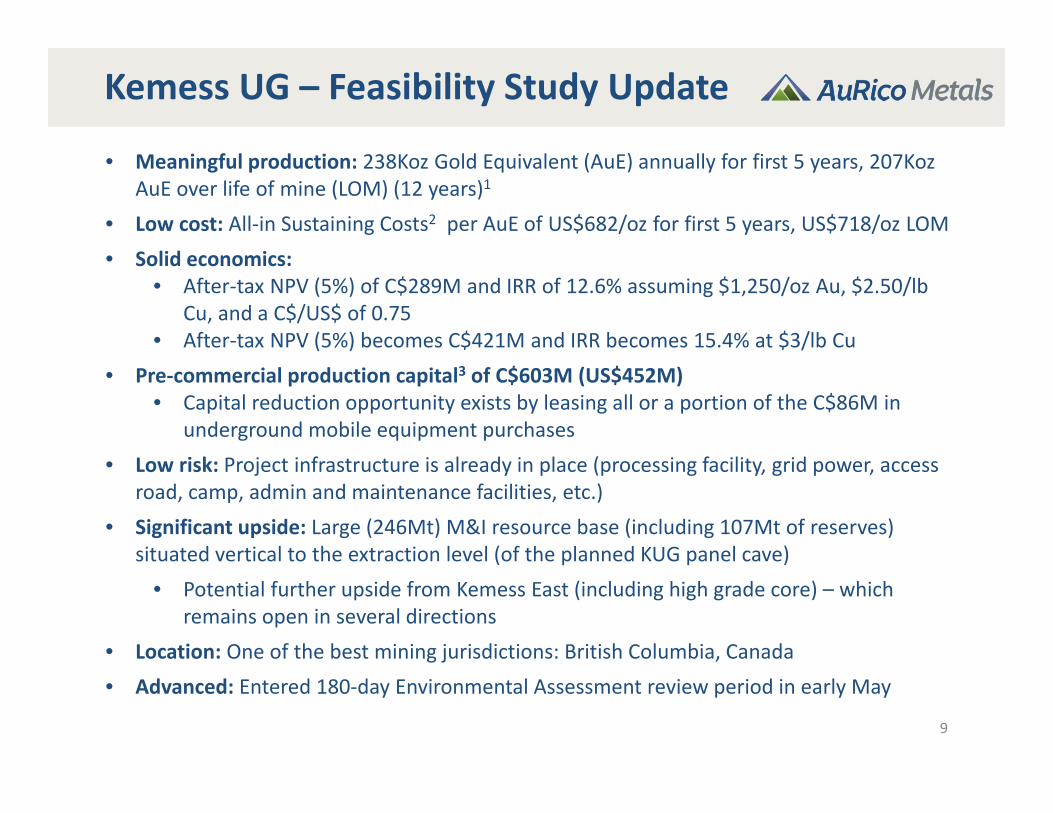
Kemess UG – Feasibility Study Update
9
• Meaningful production: 238Koz Gold Equivalent (AuE) annually for first 5 years, 207Koz AuE over life of mine (LOM) (12 years)1
• Low cost: All‐in Sustaining Costs2 per AuE of US$682/oz for first 5 years, US$718/oz LOM• Solid economics:
• After‐tax NPV (5%) of C$289M and IRR of 12.6% assuming $1,250/oz Au, $2.50/lb Cu, and a C$/US$ of 0.75
• After‐tax NPV (5%) becomes C$421M and IRR becomes 15.4% at $3/lb Cu• Pre‐commercial production capital3 of C$603M (US$452M)
• Capital reduction opportunity exists by leasing all or a portion of the C$86M in underground mobile equipment purchases
• Low risk: Project infrastructure is already in place (processing facility, grid power, access road, camp, admin and maintenance facilities, etc.)
• Significant upside: Large (246Mt) M&I resource base (including 107Mt of reserves) situated vertical to the extraction level (of the planned KUG panel cave)
• Potential further upside from Kemess East (including high grade core) – which remains open in several directions
• Location: One of the best mining jurisdictions: British Columbia, Canada• Advanced: Entered 180‐day Environmental Assessment review period in early May

Kemess: Production and Costs
10
Low Cost Mining
Total LOM cash costs of US$639 and AISC of US$718 per AuE AISC of US$682/oz over first 5 years
Caving initiated in the highest value ore Low ‘break‐even’ in early years allows for rapid debt repayment Payback period of 3.9 years at base case assumptions
0
50,000
100,000
150,000
200,000
250,000
300,000
350,000
0
100
200
300
400
500
600
700
800
900
‐1 1 2 3 4 5 6 7 8 9 10 11 12 13
Annual Gold Equivalent Production vs. USD AISC
Gold Equivalent Production AISC(USD)
$/oz Ounces

Kemess: Initial Capital
11
KemessAdvantages
C$603M (US$452M) in pre‐commercial production capex “Low risk” capex given infrastructure in place; Proven logistics 87% of capital expenditures are C$ denominated Capex is heavily weighted to final 2 years prior to commercial prod’n Opportunity to reduce capex through equipment leasing (C$86M) Project financing opportunity (marketable clean concentrate)
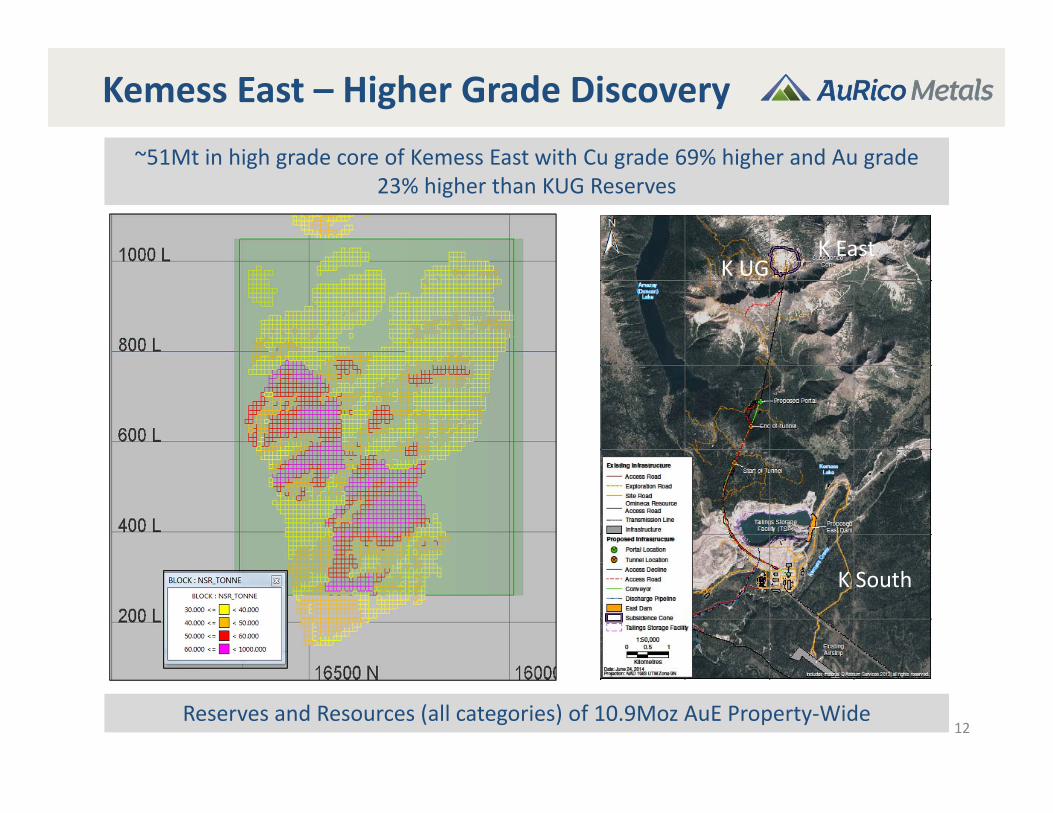
Reserves and Resources (all categories) of 10.9Moz AuE Property‐Wide
Kemess East – Higher Grade Discovery
12
~51Mt in high grade core of Kemess East with Cu grade 69% higher and Au grade 23% higher than KUG Reserves
K UGK East
K South
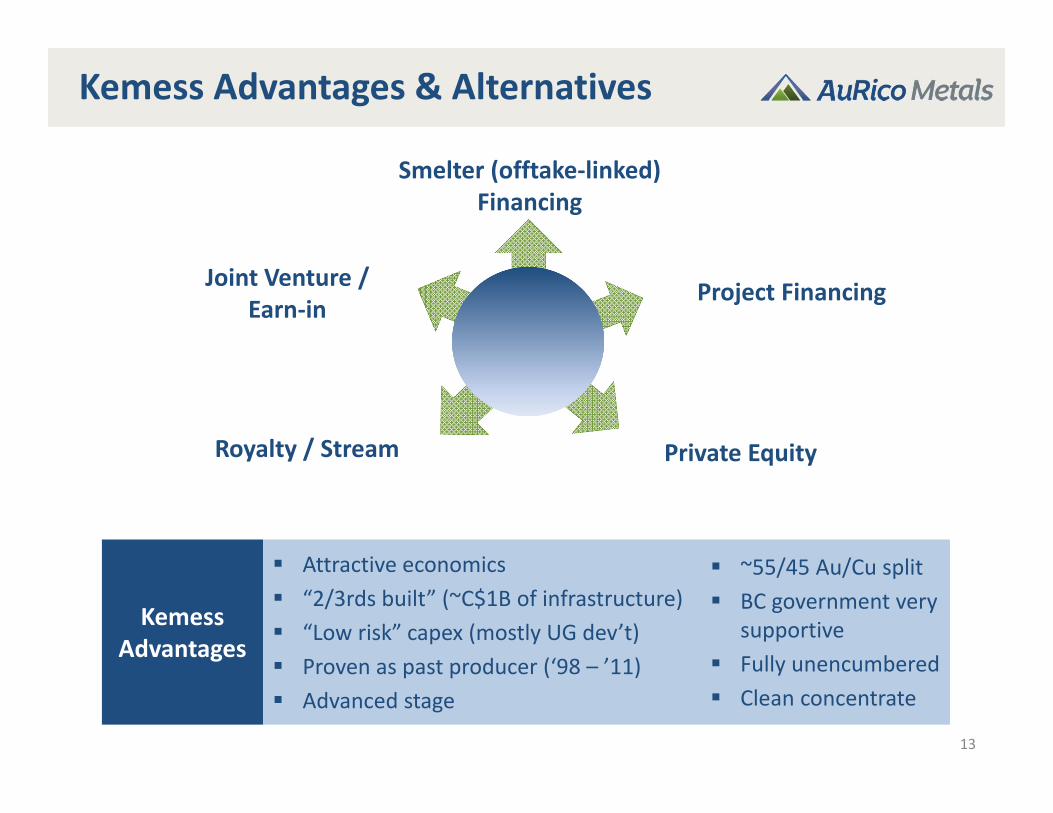
Kemess Advantages & Alternatives
KemessAdvantages
Attractive economics “2/3rds built” (~C$1B of infrastructure) “Low risk” capex (mostly UG dev’t) Proven as past producer (‘98 – ’11) Advanced stage
~55/45 Au/Cu split BC government very
supportive Fully unencumbered Clean concentrate
13
Smelter (offtake‐linked) Financing
Joint Venture / Earn‐in
Project Financing
Royalty / Stream Private Equity
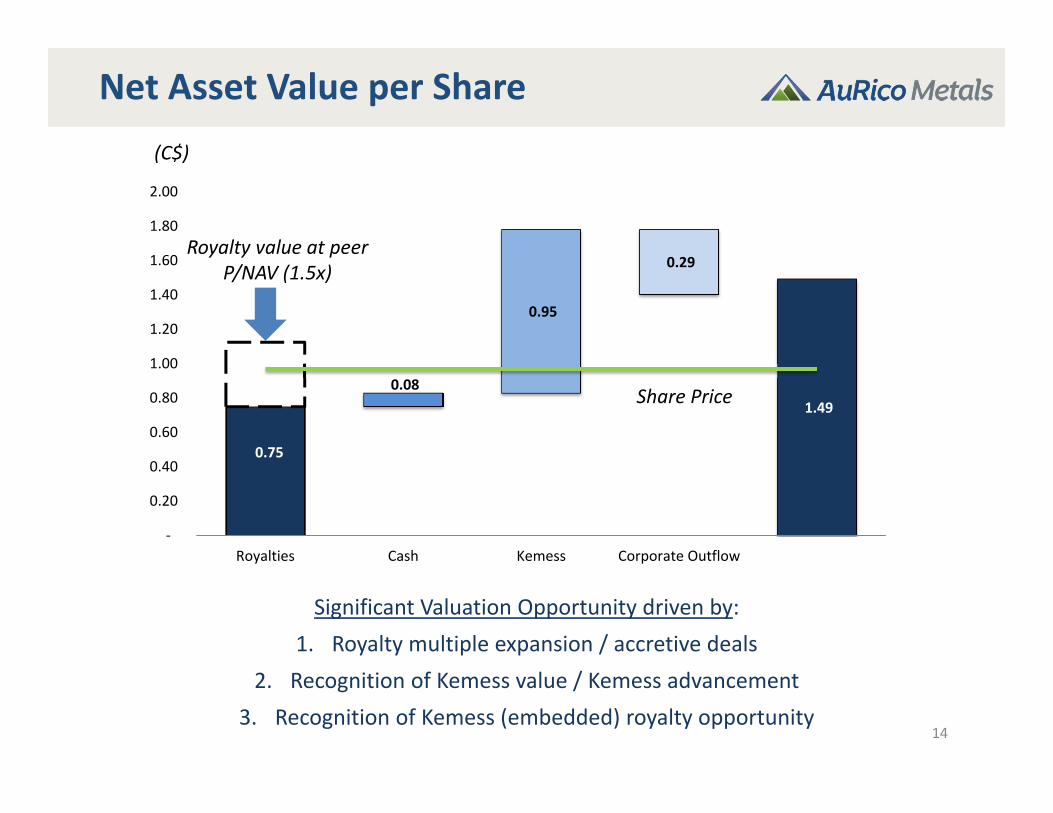
0.75
0.08
0.95
0.29
1.49
‐
0.20
0.40
0.60
0.80
1.00
1.20
1.40
1.60
1.80
2.00
Royalties Cash Kemess Corporate Outflow
Royalty value at peer P/NAV (1.5x)
Share Price
Net Asset Value per Share
14
Significant Valuation Opportunity driven by:1. Royalty multiple expansion / accretive deals
2. Recognition of Kemess value / Kemess advancement3. Recognition of Kemess (embedded) royalty opportunity
(C$)
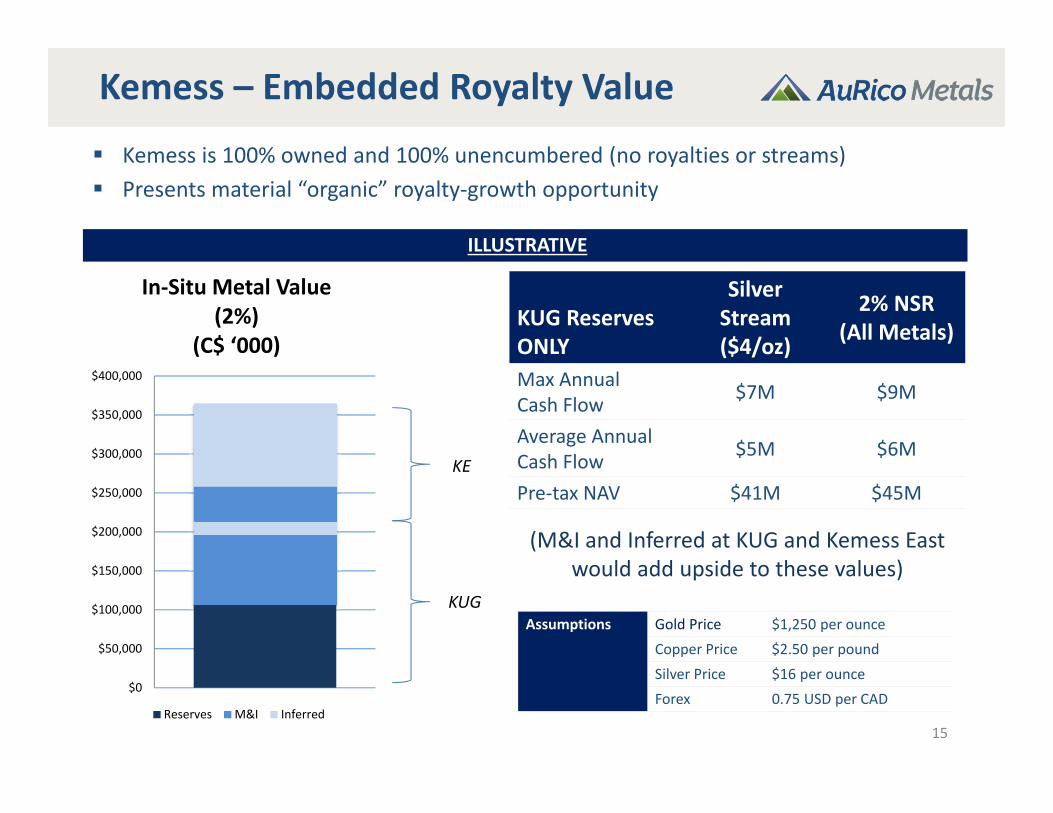
Kemess – Embedded Royalty Value
15
ILLUSTRATIVE
Assumptions Gold Price $1,250 per ounceCopper Price $2.50 per poundSilver Price $16 per ounceForex 0.75 USD per CAD
Kemess is 100% owned and 100% unencumbered (no royalties or streams) Presents material “organic” royalty‐growth opportunity
$0
$50,000
$100,000
$150,000
$200,000
$250,000
$300,000
$350,000
$400,000
In‐Situ Metal Value (2%)
(C$ ‘000)
Reserves M&I Inferred
KE
KUG
KUG Reserves ONLY
Silver Stream ($4/oz)
2% NSR (All Metals)
Max Annual Cash Flow $7M $9M
Average Annual Cash Flow $5M $6M
Pre‐tax NAV $41M $45M
(M&I and Inferred at KUG and Kemess East would add upside to these values)
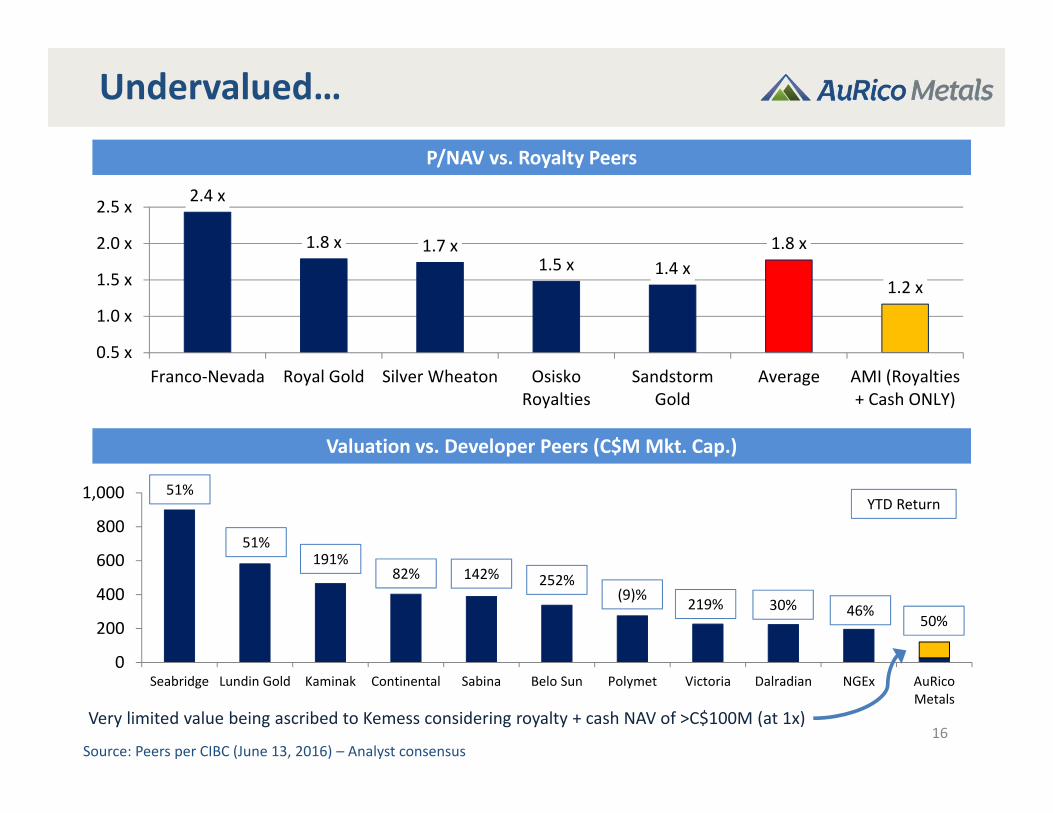
Undervalued…
16
Valuation vs. Developer Peers (C$M Mkt. Cap.)
P/NAV vs. Royalty Peers
Source: Peers per CIBC (June 13, 2016) – Analyst consensus
0
200
400
600
800
1,000
Seabridge Lundin Gold Kaminak Continental Sabina Belo Sun Polymet Victoria Dalradian NGEx AuRicoMetals
YTD Return
2.4 x
1.8 x 1.7 x1.5 x 1.4 x
1.8 x
1.2 x
0.5 x
1.0 x
1.5 x
2.0 x
2.5 x
Franco‐Nevada Royal Gold Silver Wheaton OsiskoRoyalties
SandstormGold
Average AMI (Royalties+ Cash ONLY)
142%
51%
51%
82%191%
30%219%(9)%252%
50%46%
Very limited value being ascribed to Kemess considering royalty + cash NAV of >C$100M (at 1x)
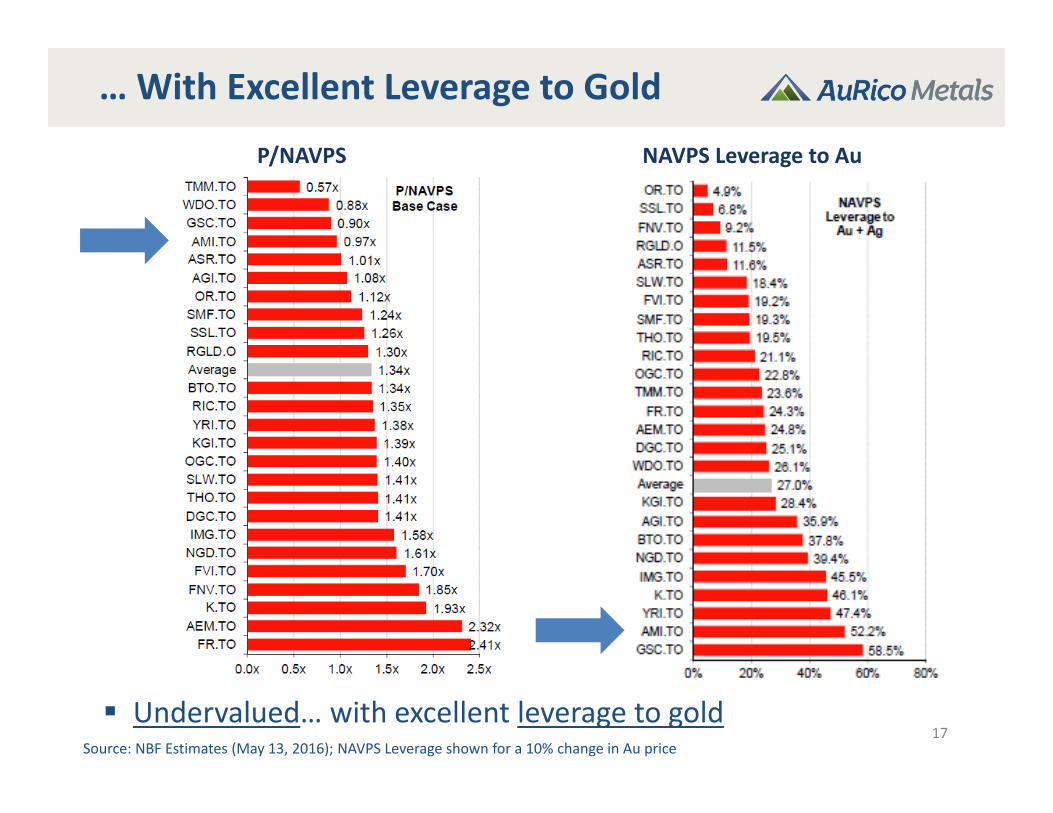
… With Excellent Leverage to Gold
17Source: NBF Estimates (May 13, 2016); NAVPS Leverage shown for a 10% change in Au price
P/NAVPS NAVPS Leverage to Au
Undervalued… with excellent leverage to gold
18
APPENDIX
19
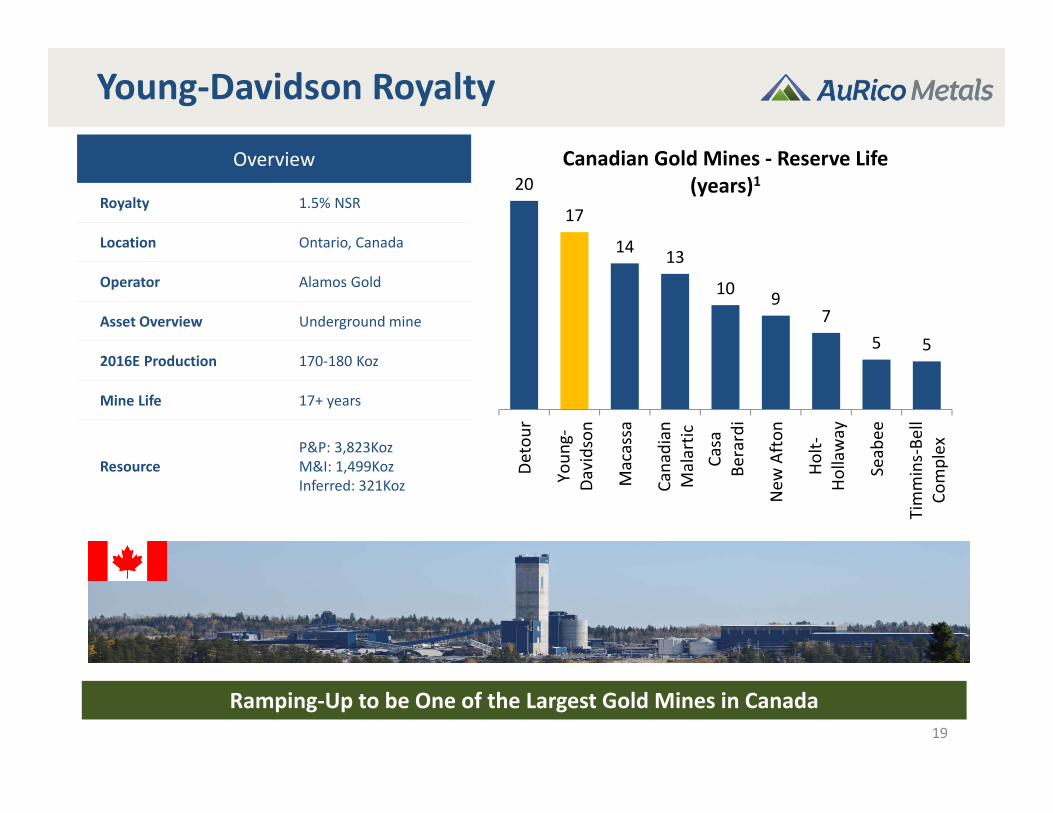
Young‐Davidson Royalty
Ramping‐Up to be One of the Largest Gold Mines in Canada
Overview
Royalty 1.5% NSR
Location Ontario, Canada
Operator Alamos Gold
Asset Overview Underground mine
2016E Production 170‐180 Koz
Mine Life 17+ years
ResourceP&P: 3,823KozM&I: 1,499KozInferred: 321Koz
20
17
14 13
10 97
5 5
Detour
Youn
g‐Da
vidson
Macassa
Canadian
Malartic
Casa
Berardi
New
Afton
Holt‐
Hollaway
Seabee
Timmins‐Be
llCo
mplex
Canadian Gold Mines ‐ Reserve Life (years)1
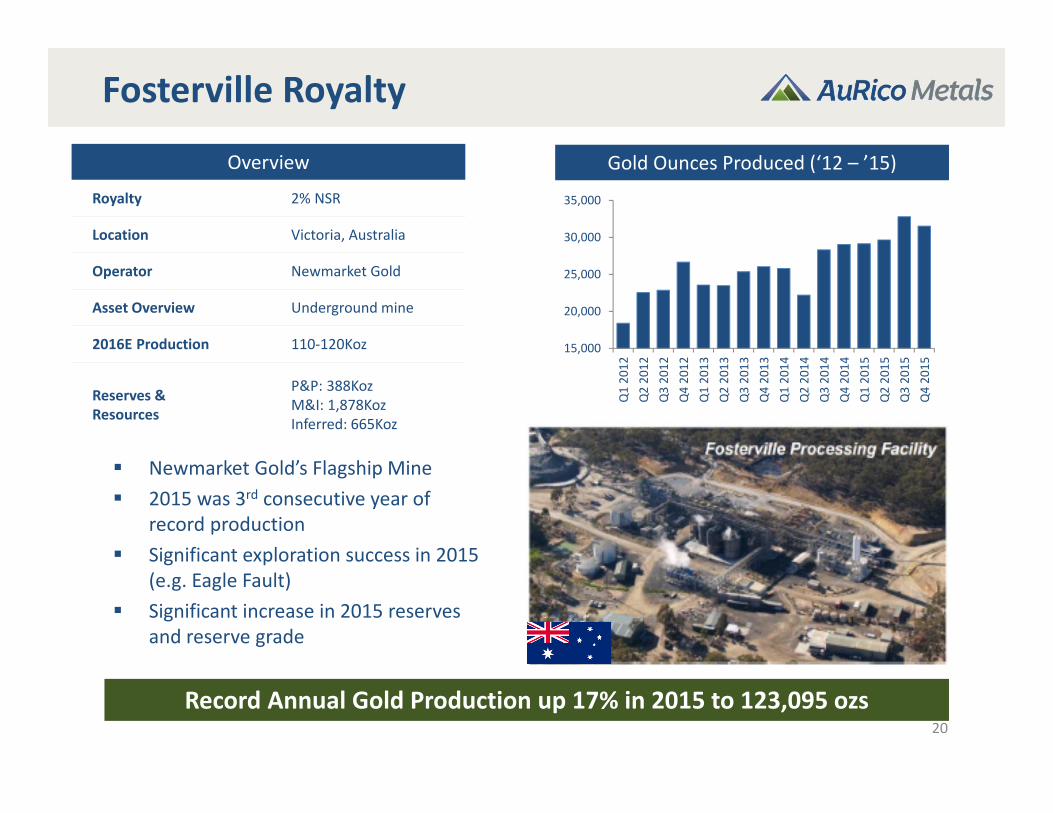
Fosterville Royalty
Overview
Royalty 2% NSR
Location Victoria, Australia
Operator Newmarket Gold
Asset Overview Underground mine
2016E Production 110‐120Koz
Reserves & Resources
P&P: 388Koz M&I: 1,878KozInferred: 665Koz
20
15,000
20,000
25,000
30,000
35,000
Q1 2012
Q2 2012
Q3 2012
Q4 2012
Q1 2013
Q2 2013
Q3 2013
Q4 2013
Q1 2014
Q2 2014
Q3 2014
Q4 2014
Q1 2015
Q2 2015
Q3 2015
Q4 2015
Newmarket Gold’s Flagship Mine 2015 was 3rd consecutive year of
record production Significant exploration success in 2015
(e.g. Eagle Fault) Significant increase in 2015 reserves
and reserve grade
Record Annual Gold Production up 17% in 2015 to 123,095 ozs
Gold Ounces Produced (‘12 – ’15)
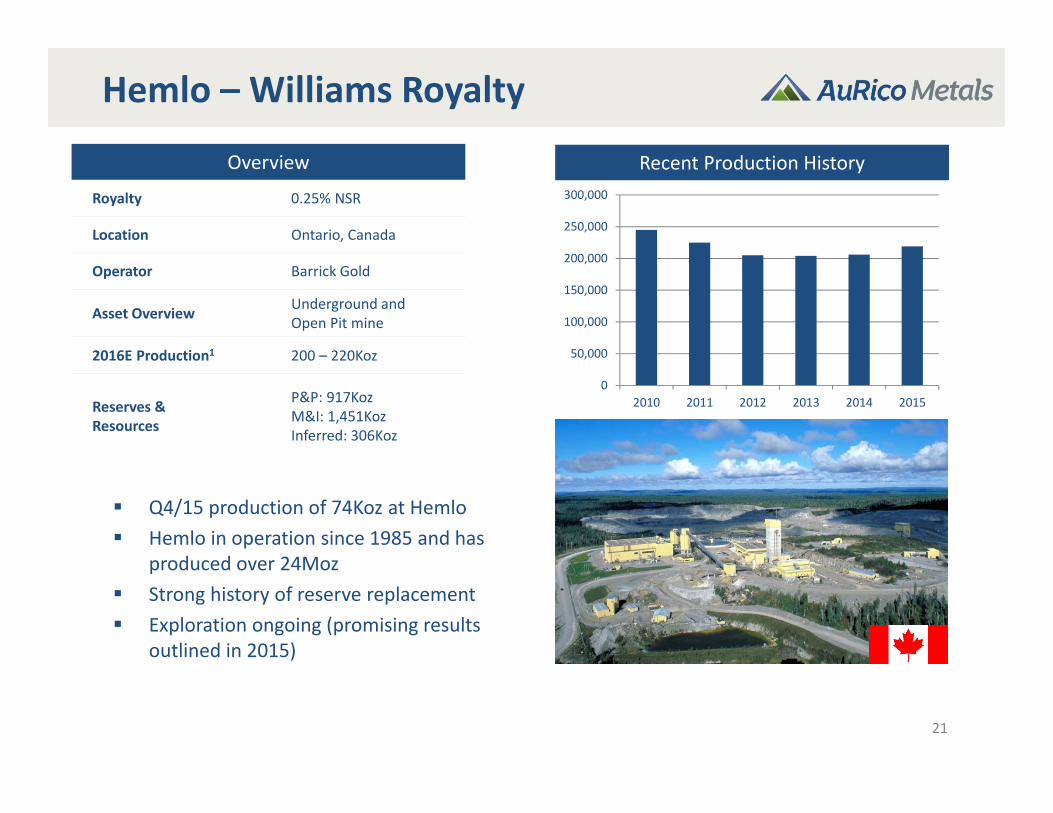
Hemlo – Williams Royalty
Overview
Royalty 0.25% NSR
Location Ontario, Canada
Operator Barrick Gold
Asset Overview Underground and Open Pit mine
2016E Production1 200 – 220Koz
Reserves & Resources
P&P: 917KozM&I: 1,451KozInferred: 306Koz
21
Q4/15 production of 74Koz at Hemlo Hemlo in operation since 1985 and has
produced over 24Moz Strong history of reserve replacement Exploration ongoing (promising results
outlined in 2015)
Recent Production History
0
50,000
100,000
150,000
200,000
250,000
300,000
2010 2011 2012 2013 2014 2015

Eagle River Royalty
Overview
Royalty 0.5% NSR
Location Ontario, Canada
Operator Wesdome Gold Mines
Asset Overview Underground
2016E Production 43 – 47Koz
Reserves & Resources
P&P: 300KozInferred: 170Koz
22
2015 production of 41Koz (at 7.8g/t) Continuous production since 1995
(over 1Moz produced) Long history of reserve replacement Significant upside from continued
exploration of identified ore zones including 300 zone
Recent Production History
0
10,000
20,000
30,000
40,000
50,000
60,000
70,000
2006 2007 2008 2009 2010 2011 2012 2013 2014 2015
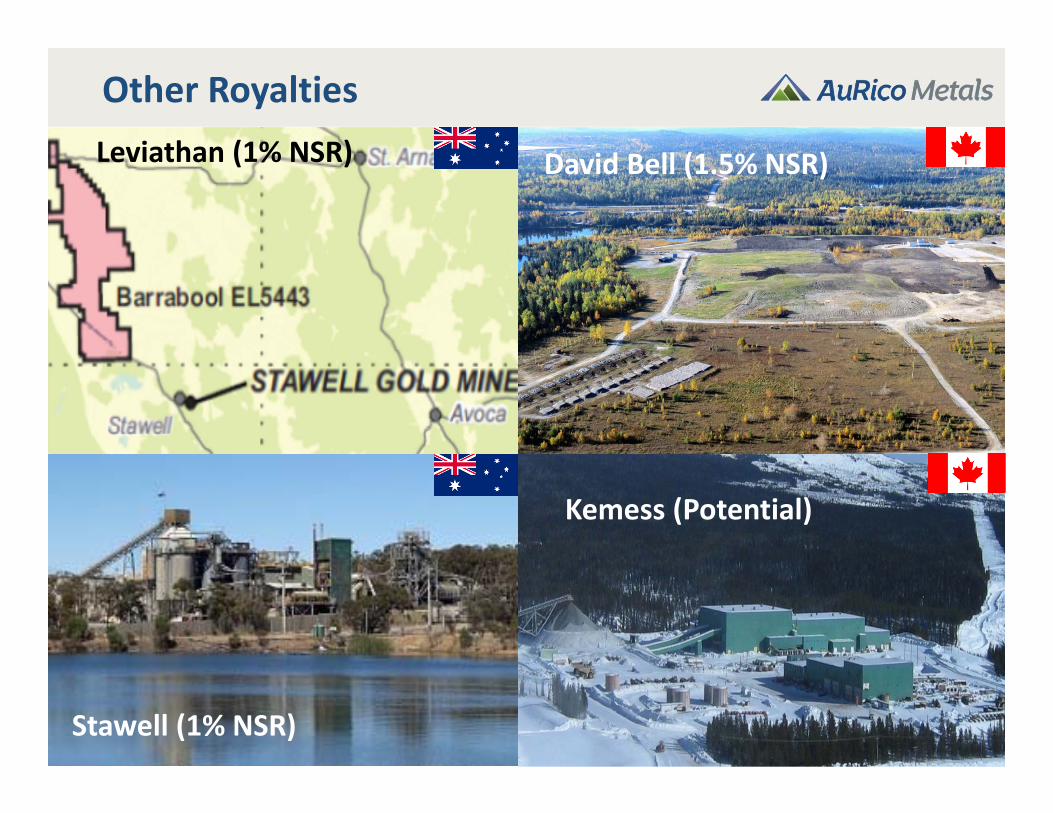
Other Royalties
23
Kemess (Potential)
David Bell (1.5% NSR)
Stawell (1% NSR)
Leviathan (1% NSR)

24
2016 Outlook
Royalty revenue: US$6.6M – US$7.1M After‐tax: US$5.7M – US$6.1M Assumes gold price of US$1,150/oz; Every $50/oz change in gold price has
US$0.3M impact on revenue G&A: ~US$2.5M (excluding stock based compensation) Kemess Care and Maintenance: ~US$4.5M
Targeting a reduction of annualized C&M to US$3M or below by year‐end Kemess project expenditures: US$1.5M – US$2.5M
KUG FS update, KE resource update, EA, permitting, and First Nations activities
Kemess East exploration: US$1.7M
Expect to be FCF positive in 2017 following completion of this year’s investments and with cost cutting measures being pursued at Kemess

Kemess: Low Capital Intensity
25
• Potential to add additional low‐cost ounces at KUG and Kemess East
Source: Canaccord Genuity (March 23, 2016).
26
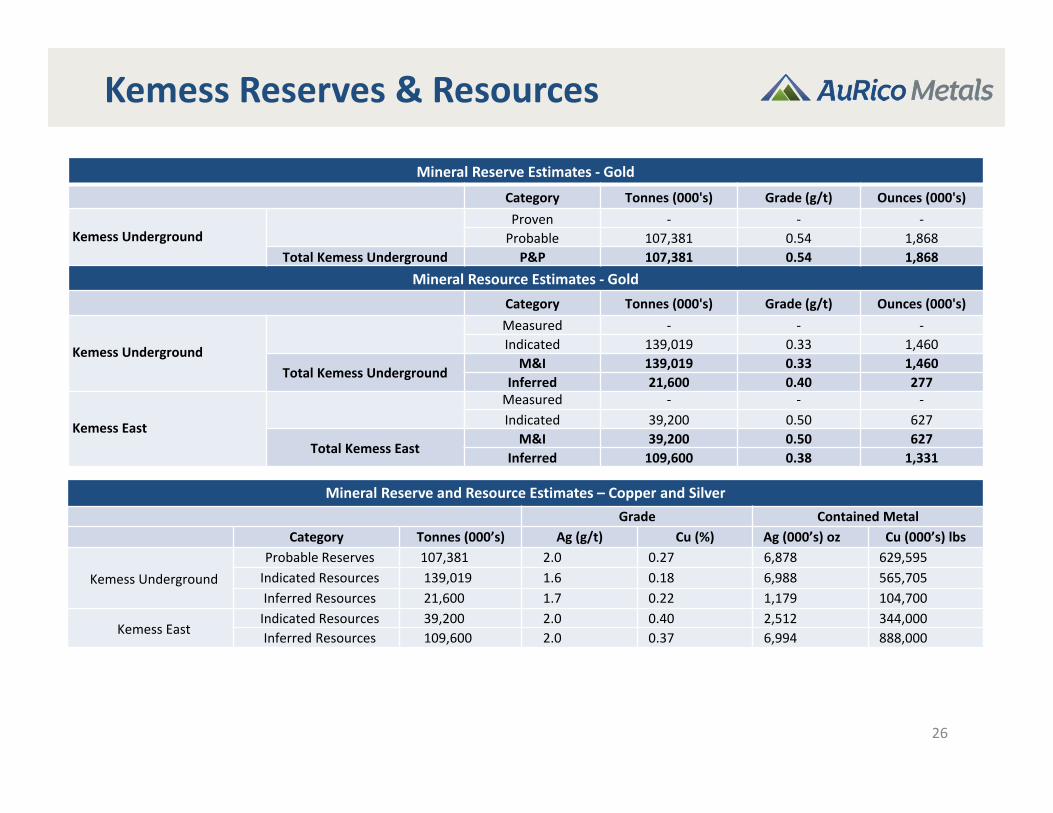
Mineral Reserve Estimates ‐ Gold
Category Tonnes (000's) Grade (g/t) Ounces (000's)
Kemess UndergroundProven ‐ ‐ ‐Probable 107,381 0.54 1,868
Total Kemess Underground P&P 107,381 0.54 1,868Mineral Resource Estimates ‐ Gold
Category Tonnes (000's) Grade (g/t) Ounces (000's)
Kemess Underground
Measured ‐ ‐ ‐Indicated 139,019 0.33 1,460
Total Kemess UndergroundM&I 139,019 0.33 1,460
Inferred 21,600 0.40 277
Kemess East
Measured ‐ ‐ ‐Indicated 39,200 0.50 627
Total Kemess EastM&I 39,200 0.50 627
Inferred 109,600 0.38 1,331
Mineral Reserve and Resource Estimates – Copper and SilverGrade Contained Metal
Category Tonnes (000’s) Ag (g/t) Cu (%) Ag (000’s) oz Cu (000’s) lbs
Kemess Underground Probable Reserves 107,381 2.0 0.27 6,878 629,595Indicated Resources 139,019 1.6 0.18 6,988 565,705Inferred Resources 21,600 1.7 0.22 1,179 104,700
Kemess EastIndicated Resources 39,200 2.0 0.40 2,512 344,000Inferred Resources 109,600 2.0 0.37 6,994 888,000
Kemess Reserves & Resources
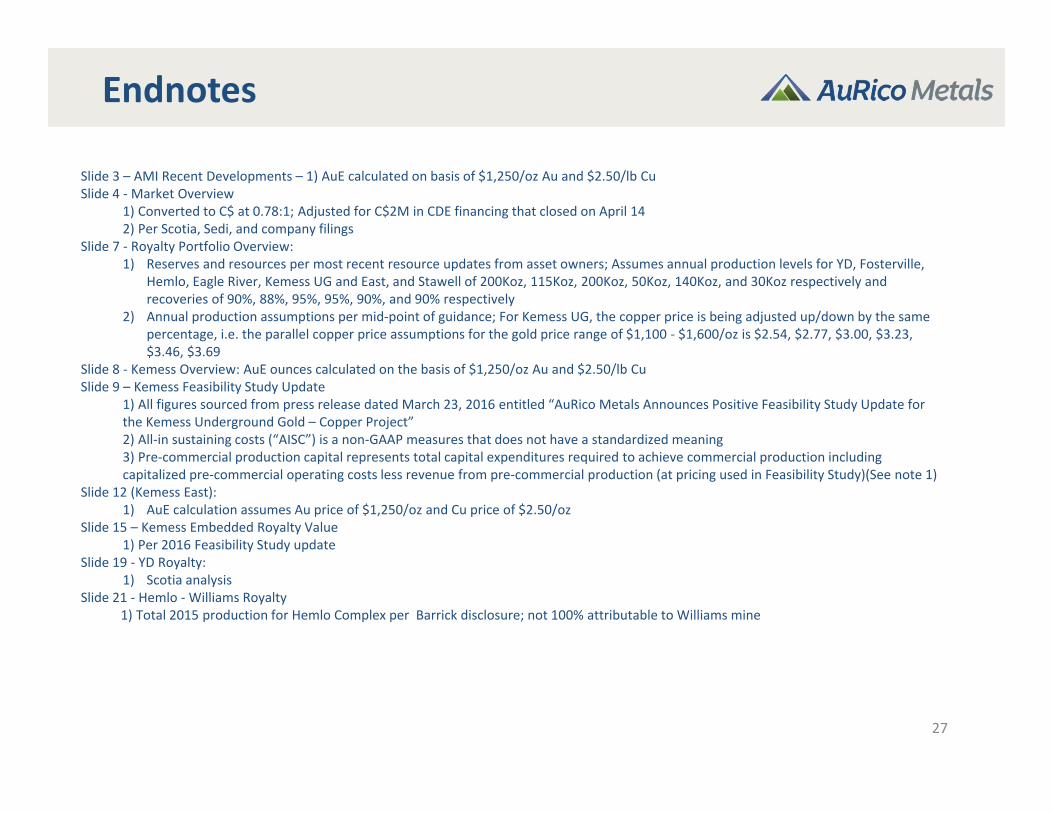
Endnotes
27
Slide 3 – AMI Recent Developments – 1) AuE calculated on basis of $1,250/oz Au and $2.50/lb CuSlide 4 ‐Market Overview
1) Converted to C$ at 0.78:1; Adjusted for C$2M in CDE financing that closed on April 142) Per Scotia, Sedi, and company filings
Slide 7 ‐ Royalty Portfolio Overview:1) Reserves and resources per most recent resource updates from asset owners; Assumes annual production levels for YD, Fosterville,
Hemlo, Eagle River, Kemess UG and East, and Stawell of 200Koz, 115Koz, 200Koz, 50Koz, 140Koz, and 30Koz respectively and recoveries of 90%, 88%, 95%, 95%, 90%, and 90% respectively
2) Annual production assumptions per mid‐point of guidance; For Kemess UG, the copper price is being adjusted up/down by the same percentage, i.e. the parallel copper price assumptions for the gold price range of $1,100 ‐ $1,600/oz is $2.54, $2.77, $3.00, $3.23, $3.46, $3.69
Slide 8 ‐ Kemess Overview: AuE ounces calculated on the basis of $1,250/oz Au and $2.50/lb CuSlide 9 – Kemess Feasibility Study Update
1) All figures sourced from press release dated March 23, 2016 entitled “AuRico Metals Announces Positive Feasibility Study Update for the Kemess Underground Gold – Copper Project”2) All‐in sustaining costs (“AISC”) is a non‐GAAP measures that does not have a standardized meaning3) Pre‐commercial production capital represents total capital expenditures required to achieve commercial production including capitalized pre‐commercial operating costs less revenue from pre‐commercial production (at pricing used in Feasibility Study)(See note 1)
Slide 12 (Kemess East):1) AuE calculation assumes Au price of $1,250/oz and Cu price of $2.50/oz
Slide 15 – Kemess Embedded Royalty Value 1) Per 2016 Feasibility Study update
Slide 19 ‐ YD Royalty:1) Scotia analysis
Slide 21 ‐ Hemlo ‐Williams Royalty1) Total 2015 production for Hemlo Complex per Barrick disclosure; not 100% attributable to Williams mine