allocation patterns in vaccinium vitis - idaea l. and bistorta
TRANSCRIPT
Frida Lindwall
Uppsats för avläggande av naturvetenskaplig kandidatexamen iMiljövetenskap
15 hpInstitutionen för växt- och miljövetenskaper
Göteborgs universitet
Januari 2012
Allocation patterns in Vaccinium vitis-
idaea L. and Bistorta vivipara (L.) Gray
Effects of reindeer grazing
Summary
There is a growing body of evidence that grazing has an effect on the allocation of above- and belowground biomass in plants. Grazing also affects the competitive pressure on plants and may in combination with the current climate change affect the plant community structure; especially in the arctic region, where climate changes rapidly. For individual plants, grazing may have an effect on the allocation pattern, for instance through changes in the root:shoot ratio and leaf- and fine root biomass. In this study, a 15 year old reindeer exclosure was used with the purpose to investigate how grazing affects the allocation of above- and belowground biomass in Vaccinium vitis-idaea L. and Bistorta vivipara (L.) Gray. Plant-soil monoliths were cut out from the soil and brought to a laboratory, where the plants were cleaned from soil, dried and weighted. Analyses of C%, N%, C/N and isotope composition (δ13C and δ15N) in fine roots and leaves analysis were also conducted. In B. vivipara, the leaves in fences were 22% more δ15N depleted than in control plots and the fine roots biomass was 17% larger in fences compared to control plots. However, the total biomass, R:S ratio, above- and belowground biomass, C/N ratio, δ
13C, C% and N%, did not differ significantly between the treatments. The C/N ratio of B. vivipara was lower, which supports that B. vivipara is a food resource of higher quality than V. vitis-idaea. Trends indicated that N% in leaves and fine roots and δ15N in leaves were larger in B. vivipara compared to V. vitis-idaea. Plants that are grazed produce more roots as an adaptation to herbivores. The higher δ15N found in leaves may be a reaction to a higher δ15N in feces compared to the soil, or that δ15N increase with soil depth. In conclusion, plants in the sub arctic tundra are adapted to herbivores; the carbon- and nitrogen allocation pattern may change if the size or species composition of the herbivore population changes. This knowledge is important to keep in mind in future studies, regarding the impact of climate change on the sub-arctic tundra. Keywords: Arctic, Alpine, Biomass allocation, Carbon, Grazing, Nitrogen, Reindeer, Root to shoot ratio, Stabile isotopes, Tundra
Sammanfattning
Fler och fler studier visar att betning har en effekt på växters ovan- och underjordiska biomassafördelning. Bete påverkar också växters konkurrensförmåga och kan tillsammans med inverkan från klimatförändringar leda till att hela ekosystemets struktur förändras, speciellt i arktiska områden där klimatet förändras snabbt. Med syftet att undersöka vilken effekt bete har på biomassafödelningen utfördes en studie, i norra Sverige, där renar utestängdes från tre ytor och tre var kontrollytor, där renar hade fritt tillträde. Vaccinium vitis-idaea L. och Bistorta vivipara (L.) Gray grävdes upp och togs med till ett laboratorium där de tvättades, torkades och vägdes. Analys av C%, N%, C/N och isotop (δ13C och δ15N) utfördes även på finrötterna och bladen. I bladen, från B. vivipara, hade 22 % lägre δ15N innanför stängslena än i kontrollytorna och finrötternas massa var 17 % större i ytorna med stängsel. Den totala biomassan, förhållandet mellan rötter och skott, ovan- och underjordisk biomassa, C/N förhållandet, δ
13C, C% samt N% skiljde sig inte signifikant mellan behandlingarna. Däremot visade det sig att det skiljde desto mer mellan arterna. C/N förhållandet var lägre hos B. vivipara, vilket bekräftar hypotesen att renarna föredrar B. vivipara framför V. vitis-idaea, eftersom den förstnämnda är näringsrikare. Resultaten indikerar också att δ15N i bladen och N% i både blad och rötter skiljer sig mellan arterna. Som en överlevnadsstrategi, mot bete, produceras växter större rotsystem. Renarnas inverkan på δ
15N i bladen hos B. vivipara kan förklaras av en högre δ 15N i renarnas avföring än i marken alternativt en ökning av δ15N med jorddjupet. Slutsatsen är att växterna har adapterats till betestrycket; en förändring i storlek eller artsammansättning av betespopulationen skulle kunna ändra allokeringsmönstret av kol och kväve hos växterna. Detta är viktigt att ha i åtanke vid framtida undersökningar av klimatförändringarnas påverkan på tundran i subarktis. Ämnesord: Arktis, Alpin, Bete, Biomassaallokering, Kol, Kväve, Renar, Rot till skott förhållande, Stabila isotoper

3
Table of contents
Table of contents ............................................................................................................... 3
1. Introduction ................................................................................................................... 4
2. Material and Method...................................................................................................... 6
2.1. Study area ............................................................................................................... 6
2.2. Field method ........................................................................................................... 7
2.3. Biomass and Carbon- and Nitrogen content............................................................. 8
2.4. Data analysis........................................................................................................... 8
3. Results........................................................................................................................... 9
3.1. Total biomass and root to shoot ratio....................................................................... 9
3.2. Above- and below ground biomass........................................................................ 11
3.3. Fine root and leaf biomass..................................................................................... 11
3.4. Carbon- and Nitrogen content ............................................................................... 12
4. Discussion ................................................................................................................... 14
4.1. R:S ratio................................................................................................................ 14
4.2. C/N ratio ............................................................................................................... 14
4.3. Total- and aboveground biomass........................................................................... 15
4.4 Respons in V. vitis-idaea ........................................................................................ 15
4.5. Belowground biomass........................................................................................... 16
4.6. Carbon- and Nitrogen content ............................................................................... 16
5. Concluding remarks..................................................................................................... 18
Acknowledgement ........................................................................................................... 18
References....................................................................................................................... 19
4
1. Introduction
According to Sametinget there is about 250 000 reindeer in Sweden. The herds are mowing according to season; in total the reindeer (Ragnifer tarandus L.) uses 52% of the total Swedish area (Sametinget, 2011). They feed on different plant species during summer- and wintertime. In summer the dominating part of their food are grasses, forbs and leaves while during winter they mostly eat lichens (Cetraria spp. Sterocaulon spp. and Cladonia sp.) but also dwarf shrubs such as Empetrum nigrum L. and Vaccinuim spp (Eriksson et al. 2007). Arctic plants and ecosystems are sensitive to climate. Plants species, which are adapted to the high arctic climate, will, if climate gets warmer, most likely decrease in abundance. The lichen abundance will decrease and the tree line in the arctic will advance as a long-term response to warming, with large effects on the tundra ecosystem functioning (Callaghan 2007, Elmendorf et al. 2011). The native grazers, in arctic and alpine tundra as well as in steppes and arid savannas, play a central role in structuring the vegetation (Oksanen 1990). If herbivores kill plants, they will decrease the plant density and affect the remaining vegetation competitiveness (Svata et al. 1990). Herbivores also affect the light conditions, i.e. more light will reach the ground if grazers reduce the density of shrubs (Mulder 1999). Since both the climate (Callaghan 2007) and herbivores (Oksanen 1990) affect the ecosystem structure and functioning, it is important to understand how plants respond to grazing and thereby how carbon and nutrients are allocated and stored in tundra ecosystems. The effects of herbivory on plants have been studied in several previous studies (Bråthen and Oksanen 2001, Sjögersten et al. 2011, Pujanen et al. 2008, Oba et al. 2006). The method tends to differ into two categories. One method is to protect plants from grazing by excluding the herbivores and compare with unprotected plants. The other method is to remove biomass artificially on individuals and compare with not defoliated plants (Mulder 1999). Reindeer affects the density and species composition (Manseau et al. 1996), but also the species richness (Suomenen & Olofsson 2001). Bråthen and Oksanen (2001) found, in an exclosure study in northern Norway, that reindeers had a strong impact on the forb plant populations. When looking at plants in low densities it seems like the reindeer prefer to eat forbs in favour of other plants (Trudell and White, 1981). Studies made on forbs report decreased probability of flowering when plants were grazed (Mulder 1999). According to Mulder and Harmsen (1995) this is due to the removal of inflorescences and that the allocation to reproduction decreased following defoliation. Not many studies have been made on the effect of grazing on evergreen shrubs, probably because evergreen shrubs are considered unimportant forage for the arctic herbivores. Tolvanen and Laine (1997) showed that the evergreen Vaccinium vitis-idaea L. was less able to recover after artificial defoliation compared to the deciduous Vaccinium myrtillus L.. In the same study it was also found that, when defoliated V. vitis-idaea produced less shoots, and therefore increased the carbohydrate levels in the roots. The time of damage affected the carbon and the nitrogen level in the tissue and the ability to re-grow. A low temperature and a short growing season characterize the arctic and sub-arctic environment. Due to a low temperature in the soil, the nitrogen mineralization rate is low and therefore the available nitrogen for plants is restricted (Marion and Black 1987). When nitrogen availability is low, a high intensity of herbivory will favour plants having high

5
amount of carbon-based defence. High concentrations of defence chemicals are often found in plants with evergreen leaves making the annual investment feasible (Oksanen 1990). For perennial plants an excess of carbohydrates will be stored in the belowground organs, such as rhizomes, tubers, roots or bulbs, which eventually will be developed to large storage organs. This store of carbon will in the following year be used to extend the shoot system. This leads to an advantage when the condition for production is not enough. The store of carbon leads to an independency of the conditions that affect the photosynthesis in the spring (Larcher 2003b). For a well-balanced development of a plant the distribution of assimilates in the plant must meet the needs from the individual tissues and organs, both the amount of carbohydrates that is needed but also at the right time. It is important that less active parts of the plant is not oversupplied and that organs with high requirements receive the needed amount (Larcher 2003b). Grazing has greater consequences under limited resource conditions or when the environment is less favourable. When grazing pressure is low, a shift of plant abundance occurs. The amount of plants having a higher root:shoot (R:S) ratio increases when grazing pressure increases, meaning that high R:S ratio is a tolerance strategy (Evju et al 2009). The roots of a plant are the part where the most intensive exchange of substances between soil and plant take place. The fine roots release organic compounds and take up ions and water (Larcher 2003a). Previous studies (Johnson and Matchett 2001, Glimskär and Ericsson 1999) suggest that plants under nitrogen limitation produce more roots with low quality, i.e. lower nitrogen concentration. In this way plants increases their nutrient use efficiency, NUE (Johnson and Matchett 2001). It is suggested that when the nitrogen availability and nitrogen mineralization rate is low, plants allocates carbon and energy to the roots (Chapin et al. 1987) and when the rate of nutrient supply is low, the roots gets longer and thinner (Fitter 1987). The nitrogen content in the plants determines if the plants are of high or low quality as forage. The nitrogen content must at least match the herbivores minimum requirement for building proteins (White 1978). The mountain in the northern part of Sweden is resource limited, and abiotic factors, such as wind, temperature and length of growing season, are unfavourable for plant growth. The purpose of this study was to investigate how plants allocate carbon and nitrogen between above- and belowground tissue. The plants response in biomass allocation, carbon and nitrogen content and the isotopic composition (δ15N and δ13C) to grazing were examined in Bistorta vivipara (L.) Gray and Vaccinium vitis-idaea. A, 15 year old, exclosure experiment was used, where plants protected from reindeer grazing were compared with plants in the open tundra and unprotected from reindeer. Due to the chemical defence in evergreens (Oksanen 1990) and that reindeer seems to prefer forbs in favour of other plants (Trudell and White, 1981); it was hypothesised that reindeer prefer to eat B. vivipara rather than V. vitis-idaea. Furthermore, I hypothesise that a larger difference in total biomass and R:S ratio would be seen in B. vivipara between control and fence plots, due to a higher grazing pressure, than what would be seen in V. vitis-idaea. Finally, I also hypothesise that there would be a difference in C/N and isotope composition content between the control- and fenced plots.

6
2. Material and Method
2.1. Study area
The study site is located on a mountain in northern Sweden (Figure 1, Table 1) close to the village Ritsem. In 1994 WWF initiated a biodiversity study, to investigate how reindeer affect the species composition and biodiversity (Eriksson et al. 2007). The same study area was used in the present study. The fieldwork was done in mid august 2011. The area consists of dry heath located 840 meter above sea level with an annual mean temperature of -1.8 °C (temperature for Ritsem SMHI weather station nr: 17792) and 510 mm precipitation per year (precipitation for Ritsem SMHI weather station nr: 17792). Species dominating this area were the dwarf shrubs: Empetrum nigrum, Vaccinium vitis-idaea and Vaccinium myrtillus, the graminoids Deshampsia flexuosa L., Calamagrostis lapponica Wahlenb. and Carex bigelowii (Torr. ex Schwein.), the dominating forbs were Bistorta vivipara, Solidago virgaurea L. and Hieracium alpinum L., the mosses were several species of Dicranum and Polytricum, lichens were species of Cladonia, Cetraria and Stereocaulon.
In the study area six plots, 25×25 m, were determined in 1994 and the same plots were used in this study (Figure 2). The corners of the square shaped plots pointed towards north, south, east and west. Three of the plots (plot number 1, 3 and 5) were surrounded by 1.7 m high fences for reindeer exclusion. For comparison all the plots were determined in pairs, one plot with fences and one plot, with similar vegetation, that was unprotected from reindeer (Figure 2). The unprotected plots were used as control plots. Small herbivores, as hares, rodents and insects, had still free access to all the plots; the effect of small herbivores will therefore not be addressed in this study.
Figure 1: The dot showing where in Sweden the study area is located.
Table 1: The plots are located in the northern part of Sweden. Three plots have fences and three are control plots, i.e. are not surrounded by fences. The plots form three pairs (1-2, 3-4 and 5-6), consisting of one control and one plot with fences, making three different blocks.
Block Plot Treatment Coordinates
1 Fence N67°46.454’ E017°32.109’ 1
2 Control N67°46.383’ E017°32.166’
3 Fence N67°46.420’ E017°32.190’ 2
4 Control N67°46.402’ E017°32.130’
5 Fence N67°46.314’ E017°32.024’ 3
6 Control N67°46.384’ E017°32.169’

7
Figure 2: This map shows how the plots were placed in relationship to each other in 1994. The circled plots are the one with fences. The plots were determined in pairs, consisting of one plot with fences and one control plot.
2.2. Field method
From the centre of each plot, one direction (North, South, East or West) was randomly selected by a random number function. A measuring tape was placed in the chosen direction towards the corner of the square. Three B. vivpara and three V. vitis-idaea were collected in each plot. The plants closest to the measuring tape were collected at 5, 10 and 15 meters from the centre. Each sample were cut out from the soil in a 125 cm3 cube (5×5×5 cm) and stored, separately from each other, in plastic bags, and frozen (within a few hours after collection) before analysis.
8
2.3. Biomass and Carbon- and Nitrogen content
The plants were cleaned from soil and the above- and belowground parts of the plant were separated from each other and placed in dishes. The weight of every dish was measured and recorded before use. If more than one plant was found in one sample they were all treated as replicates from that plot and placed in different dishes. To get the dry mass, the samples were first placed in a drier for 24 h at 70°C and the mass of the dish and the sample were then weighted. The dry mass of the sample was calculated as the difference of the dish with the sample and the dish only. After weighing the above- and belowground biomass the leaves and the fine roots were collected and weighted. The three replicates from each plot were put together, to get sufficient amount of sample) and grinded for isotope analysis. A ball mill (Ball Mill Retch MM301) was used for grinding the material, with at frequency of 30 moves per second during one minute. The carbon (C) and nitrogen (N) concentrations and isotopic composition (δ13C or δ
15N = ((Rsample – Rstandard)/Rstandard) × 1000 (‰), where R is the molar ratio 13C/12C or 15N/14N) of fine-grounded material was determined as described by Boström et al. (2007).
2.4. Data analysis
For analysing, how the variables R:S ratio, aboveground-, belowground-, total-, leaf- and fine root biomass, differed between control- and fence plots a nested ANOVA was used. The data consisted of two treatments (control and fence), three blocks (plots in pairs) and six plants in each block. The data were sorted in a hierarchical layout starting with treatments (fix factor), continuing with blocks (random factor) nested in treatments and finally samples (random factor) nested in blocks. To obtain normal distribution and homogeneity of variance all variables were log- transformed. Zero skewness was for all variables reached by adding a constant (for details, see Økland et al. (2001)). For four of the variables (R:S ratio, aboveground biomass, belowground biomass and total biomass) 18 samples were used in the statistical analysis. Because of the limited amount of material all material from each plot was used for fine root and leaf biomass as well as carbon and nitrogen analysis. Thus, for this reason a one way ANOVA was used to test for treatment effect, with treatment as a fix factor, for these variables. However, the limited amount of fine roots of V. vitis-idaea made it impossible to analyse the C/N ratio and C%, N%, δ13C and δ15N for each plot. All fine roots from each treatment were instead put together in one general sample, with no replicates. No statistical analysis was done for the fine roots of V. vitis-idaea since there was just one composite sample from each treatment.
9
3. Results
3.1. Total biomass and root to shoot ratio
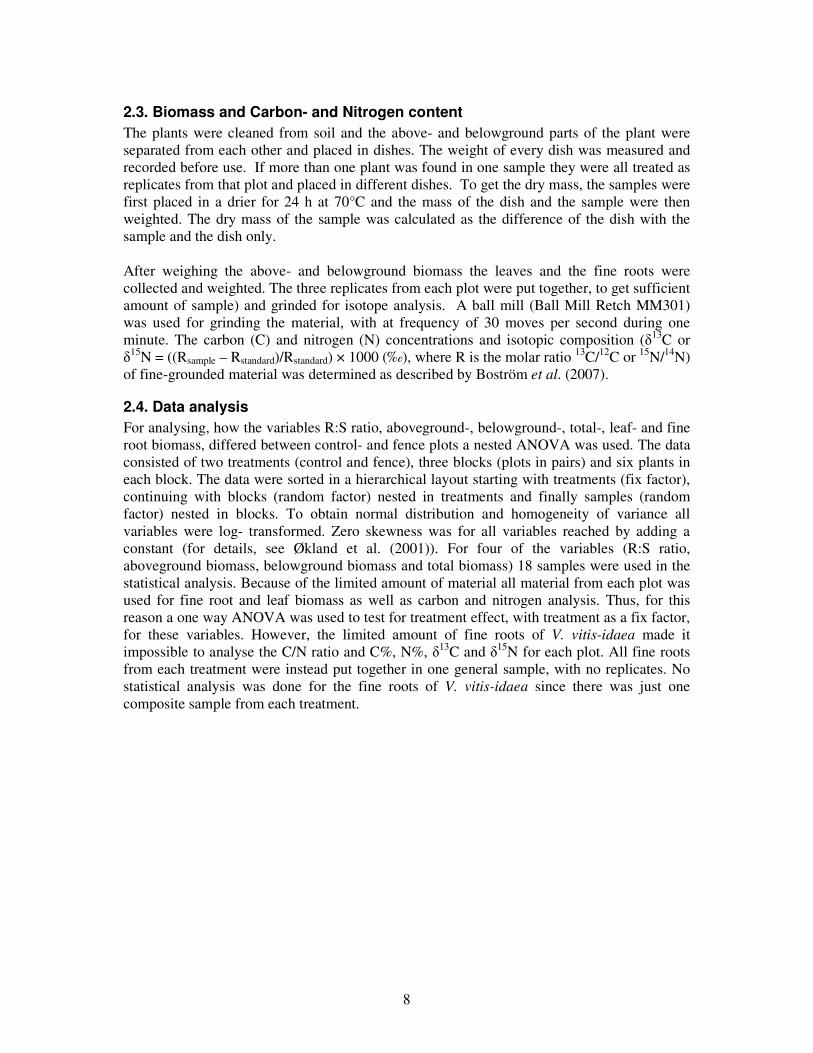
The average total masses for V. vitis-idaea and B. vivipara were larger (33% and 29% respectively) inside the fences than in the control plots (Figure 3). The variance of the data was large and the difference between the treatments was not significant for either of the species (P>0.05). In both control- and fences plots the root biomass of B. vivipara was much larger compared to the aboveground biomass (Table 2, Figure 4, 5). In contrast, V. vitis-idaea had less root biomass than aboveground tissue (Table 2, Figure 5). When excluding reindeer grazing, the mean value of the R:S ratio decreased for B. vivipara (Table 2, Figure 4) but the effect of grazing exclusion was not significant (p>0.05). The same pattern was found for V. vitis-idaea, where the R:S ratio also decreased when protected from reindeer (Table 2, Figure 4), but the difference was not significant (p>0.05). However, the pattern was consistent in both plants. The total biomass was larger inside the fences than outside and that the roots are larger (in relation to the shoot) when plants are unprotected from reindeers (Figure 3, 4).
Figure 3 (left): The untransformed mean total biomass (µg) for B. vivipara and V. vitis-idaea in fence- and control plots. The bars are standard error. B. vivipara had a mean total biomass of 208 µg inside the fences and 161 µg in the control plots. V. vitis-idaea had a mean total biomass of 138 µg inside the fences and 104 µg in the control plots. Figure 4 (right): The untransformed mean root to shoot ratio for B. vivipara and V. vitis-idaea in fence- and control plots. The bars indicate standard error.
10
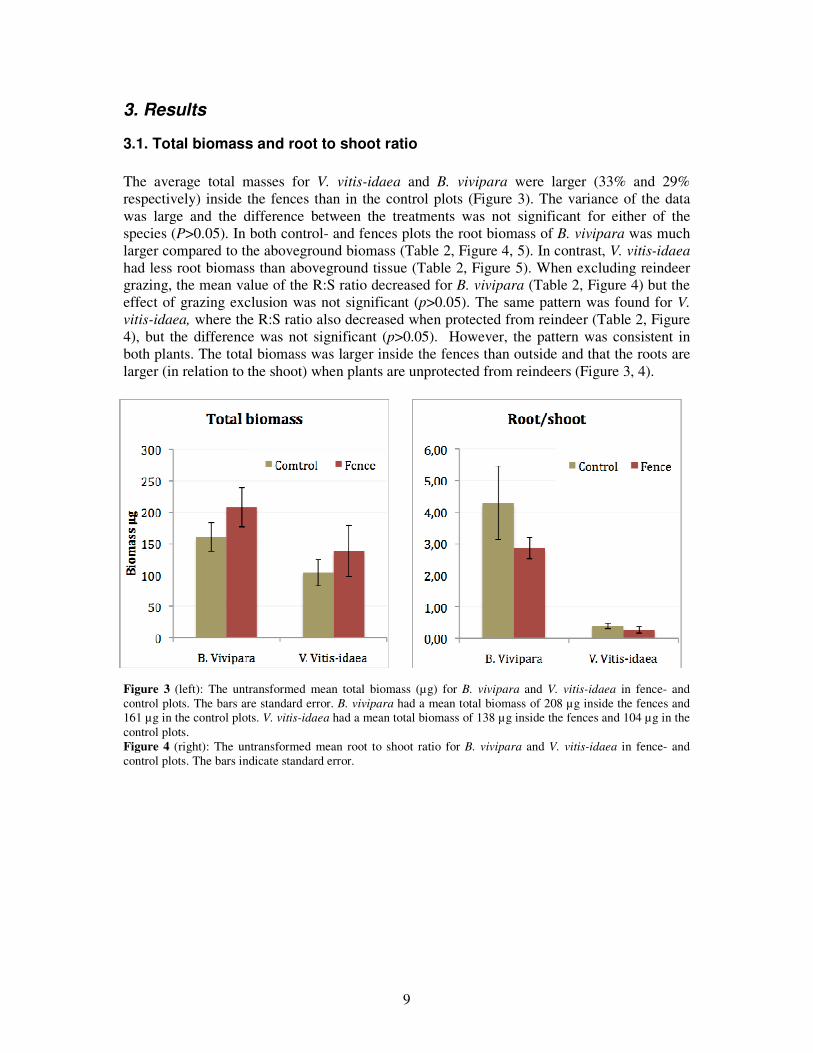
Table 2: The untransformed R:S ratio for B. vivipara and V. vitis-idaea, three replicates in each plot. C is R:S ratio in control plot, F is R:S ratio in plot with fences and C-F is the comparison between R:S ratio in control and fence plots. The last row of the table shows the mean values for C, F and C-F. The R:S ratios inside the fences are smaller than the ones outside the fences for both species. The very high value, 13.48, in block 2, for B. vivipara contribute to a high mean R:S ratio. Without this outlier the mean value for control plots is 3.14 instead of 4.29. .
B. vivipara
V. vitis-idaea
Block C F C-F C F C-F 2.27 2.66 -0.39 0.68 0.1 0.58 2.77 2.45 0.33 0.51 0.45 0.06 1
3.98 3.4 0.58 0.92 0.97 -0.05 2.59 4.66 -2.07 0.04 0.09 -0.06 3.12 3.43 -0.3 0.3 0.27 0.03 2
13.48 3.67 9.81 0.13 0.1 0.03 3.83 1.58 2.25 0.34 0.04 0.3 3 3.25 1.78 1.47 0.28 0.3 -0.02
3.32 2.1 1.22 0.34 0.13 0.21 Mean values 4.29 2.86 1.43 0.39 0.27 0.12
Figure 5: The graph illustrating how the biomass, of the two different species, was divided between the above- and below ground tissue. 100 % is the total weight. The values used in this diagram are untransformed mean values from nine replicates per treatment and species. The belowground biomass was for B. vivipara inside the fences 74% and 71% in the control. The belowground biomass was for V. vitis-idaea 20% inside the fences and 23% in the control.
Above- and belowground
0%
10%
20%
30%
40%
50%
60%
70%
80%
90%
100%
B.v Fence B.v control V.v Fence V.v control
Pe
rce
nta
ge
of
tota
l m
as
s
Below Above

11
3.2. Above- and below ground biomass
For both B. vivipara and V. vitis-idaea there is a trend that the aboveground biomass was larger in the plot with fences (Figure 6). For none of the species this difference was significant (p>0.05). The error bars in the graph (Figure 6) indicate that the variance in the data set was large especially for V. vitis-idaea. The belowground biomass, which not followed the same pattern as the aboveground biomass, was for B. vivipara larger inside the fences than outside. For V. vitis-idaea this was not the case, the belowground biomass was larger in the control plots than inside the fences (Figure 7).
Figure 6: The untransformed mean value for the above ground biomass for B. vivipara and V. vitis-
idaea in fence- and control plots.
Figure 7: The untransformed mean value for belowground biomass is shown for both B. vivipara and V. vitis-idaea in fence- and control plots.
3.3. Fine root and leaf biomass
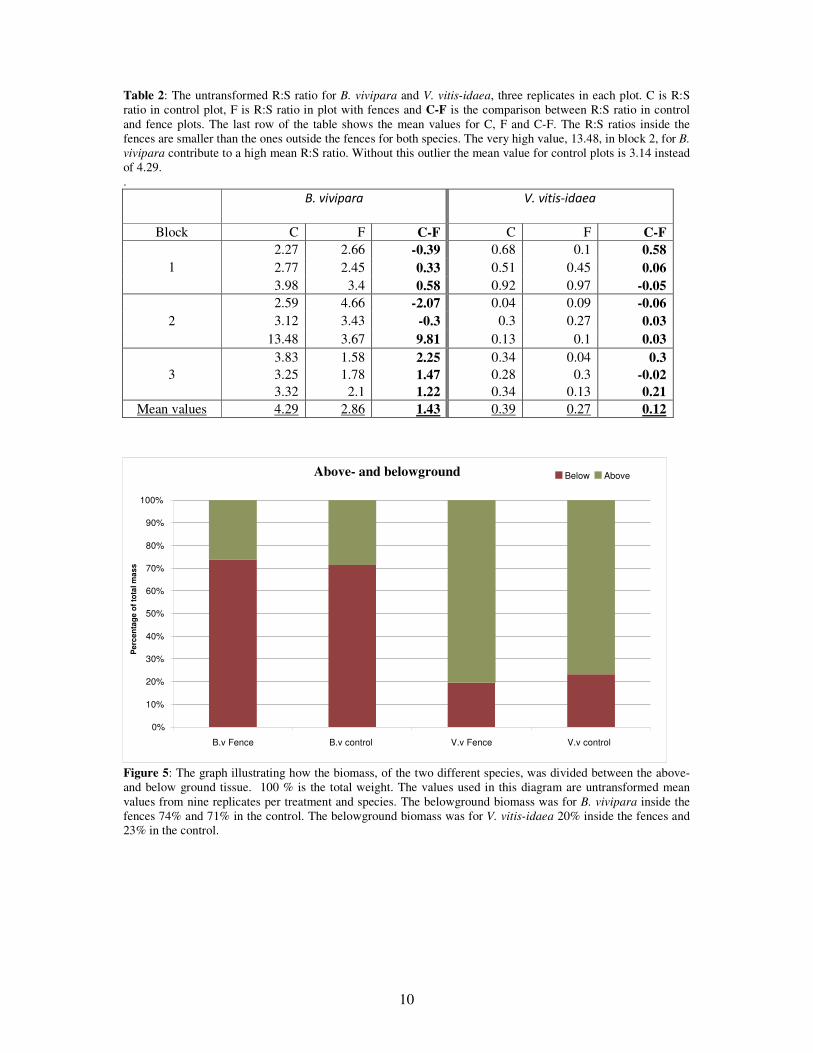
The fine roots of B. vivipara, which was found inside the fences, made up 9.7% of the total weight, 10.7% for the plants found in the control plots. The leaves of B. vivipara found in fences contributed with 12.0% of the total mass and for those found in control the leaves made up 11.5% of the total mass. The fine root biomass of B. vivipara was larger inside the fences than outside (Figure 8), and the difference was significant (p=0.03). The difference in leaf mass on the other hand was not significant (p>0.05), but a trend indicates that the mass of the leaves was higher inside the fences (Figure 9). The difference between fine root mass and leaf mass was not very large (about 5 µg in plots with fences). When comparing with the total weight (about 200 µg in plots with fences, Figure 3) one can see that the leaves and the fine roots contribute with one tenth of the total mass.
The fine roots (average weight of 1µg inside fences and 1.5 µg in the control) of V. vitis-idaea contributed to a very small fraction, 0.07%, of the average total weight (Figure 8). The leaves (average weight of 94.1 µg inside fences and 76.0 µg in the control) on the other hand contributed more, 68.1%, of the total weight. There was a small difference (Figure 8) in the fine root mass between the treatments, but not significantly (p>0.05). From the graph below
12
(Figure 9) it can be seen that the average leaf mass was larger inside the fences than in the control plots but the difference was not significant (p>0.05).
Figure 8: The mass of fine roots of B. vivipara and
V. vitis-idaea in plot with fences and control plots. The value is based on an average of all replicates for each species and treatment (fence or control); the unit for mass is µg. The error bars indicate standard error.
Figure 9: The leaf biomass of B. vivipara and V. vitis-idaea in plot with fences and control plots. The values are averages, of all replicates, for each species and treatment (fence or control), the mass unit is µg. The error bars indicate standard error.
3.4. Carbon- and Nitrogen content
The C% and N% did not differ significantly between the treatments in none of the plants. A trend indicates that the C% was higher in both fine roots and leaves of V. vitis-idaea (mean value for both treatments was 49.5% and 50.2% respectively) compared to B. vivipara (mean value for both treatments of 45.9% and 47.6% respectively). For both species there is also a trend indicating that there was a higher C%, as well as N%, in the leaves compared to the fine roots. In B. vivipara the leaves had a N% of 2.1 as a mean value for both treatments, the corresponding value for the fine roots was 1.4, whereas the leaves of V. vitis-idaea had an N% of 1.2 and the fine roots 0.8%.
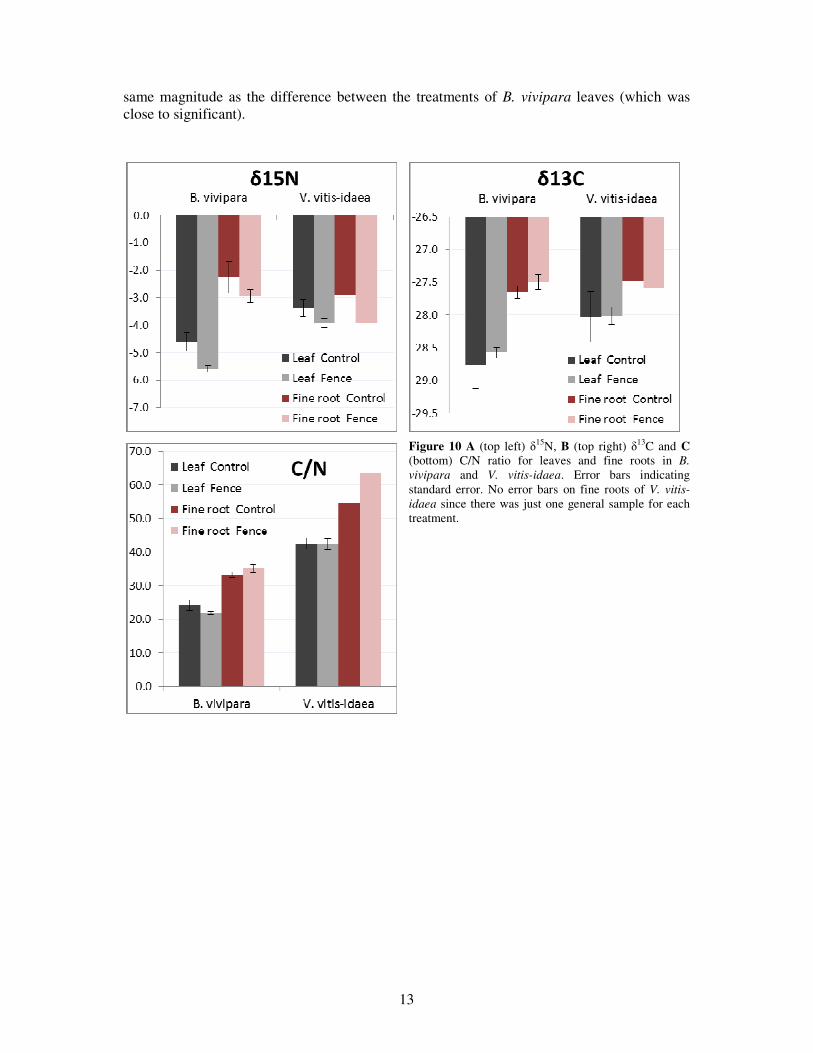
The C/N ratio did not differ significantly between the treatments in none of the plants, but the fine roots of V. vitis-idaea, which could not be statistically analysed, differed more than what the other test did. The C/N ratio in the fine roots of V. vitis-idaea was lower in the control plots than inside the fences, the fine roots of B. vivipara did not differ between the treatments to same extent. There was a difference in C/N ratio between the species; the C/N ratio in the leaves of B. vivipara was 54% of the C/N ratio in the leaves of V. vitis-idaea. The fine roots followed the same pattern; the C/N ratio in B. vivipara was only 58% of the C/N ratio in the fine roots of V. vitis-idaea. (Figure 10C).
The δ13C did not differ between the treatments and not very much between the species either and there was a large variance in the data (Figure 10B). However, the δ15N was lower for B. vivipara than for V. vitis-idaea (especially in the leaves, Figure 10A) and δ15N differed in B. vivipara leaves between the treatments (p=0.051). The fine roots of V. vitis-idaea had lower δ
15N than the fine roots of B. vivipara, and the differences between the treatment were in the
13
same magnitude as the difference between the treatments of B. vivipara leaves (which was close to significant).
Figure 10 A (top left) δ15N, B (top right) δ13C and C (bottom) C/N ratio for leaves and fine roots in B. vivipara and V. vitis-idaea. Error bars indicating standard error. No error bars on fine roots of V. vitis-idaea since there was just one general sample for each treatment.

14
4. Discussion
4.1. R:S ratio
I found that, in a sub-arctic dry heath, the biomass allocation in the two species B. vivipara
and V. vitis-idaea was stimulated by herbivores. The overall pattern indicate that the R:S ratio
was higher in controls than in fence plots. With more roots more nutrients and water can be
absorbed and plants are therefore more able to compensate for biomass losses, i.e. more
resistant to grazing pressure. The difference between the mean R:S ratio seems to be larger
than what can be seen in Figure 5, where the percentage of above and belowground biomass
of total biomass is shown. The reason for this is that one of the aboveground biomasses of B.
vivipara was very small (9 µg compared to the other aboveground biomasses of about 40 µg),
making the R:S ratio very high (13 compared to the other ratios of about 3, see Table 2 block
2). The mean value of R:S ratio is still higher, when ignoring the outlier, in control plots than
in plots with fences (3.14 compared to 2.86). The very small aboveground biomass of one
sample does not contribute, in the same extent, to the mean value of aboveground biomass
shown in Figure 5. However, the R:S ratio and biomasses are still comparable since the same
volume for all replicates were collected. The R:S ratio increases if the plants are stressed due
to grazing. Körner and Renhardt (1987) also found that the R:S ratio increased when the stress
factor increased. They compared herbaceous species on two different latitudes, 600 m a.s.l
and 2600-3200 m a.s.l. The plant growing on the high mountain, affected by a harsher
environment and lower nitrogen availability, produced more roots compared to the plants on
the lower latitude. The shoot axis, flower and leaf petioles decreased in size, the ratio of leaf
mass to total mass were unchanged and the fine roots expanded. A state of stress may cause
impairment of structural (bio membranes, proteins etc.) and functional conditions (chemical
processes, metabolism etc.). If the plants survive the impairment (structural and functional),
they may overcompensate and become more resistance (Larcher 2003c). Thus, it seems like
the plants adopt a tolerance strategy (Evju et al 2009) when affected by grazing. This means
that the plants compensate for the loss in biomass and the stress associated with grazing by
increasing their R:S ratio.
4.2. C/N ratio
The C/N ratio in B. vivipara did not differ significantly between the treatments. However, the
C/N ratio in the fine roots of V. vitis-idaea seems to be lower in the controls. This may be
caused by an addition of nitrogen when herbivores are present. The C/N ratio, which is lower
in B. vivipara than V. vitis-idaea, indicates that B. vivipara actually is of higher quality as
forage. This supports the hypothesis that reindeer prefer to eat B. vivipara instead of V. vitis-
idaea.
15
4.3. Total- and aboveground biomass
The total biomass and the aboveground biomass were larger, for both B. vivipara and V. vitis-
idaea, in the plots with fences. The reason for this reaction may differ between the two
species since reindeer grazing pressure is higher on B. vivipara than V. vitis-idaea. This study
suggests that both B. vivipara and V. vitis-idaea lose biomass because of grazing and
trampling, but V. vitis-idaea may suffer more from grazing since they are slow growing
(Pujanen et al. 2008). It is clear that the two species have different life strategies. V. vitis-
idaea had, in this study, 75-80% of their total biomass aboveground, whereas B. vivipara had
25-30% in aboveground tissue (Figure 5). This was expected since V. vitis-idaea is an
evergreen slow growing dwarf shrub that invest energy in the survival of the aboveground
tissue and defence (Gurevitch et al. 2006), whereas B. vivipara is a forb that invest more
carbon and energy in the roots especially in the bulb (Körner 2003). The larger aboveground
biomass inside the fences may also be explained by a greater competition for light. If the
vegetation, especially shrubs, density is higher less light will reach plants growing close to the
ground. To grow tall will then contribute to a larger supply of light, and this may explain the
larger aboveground biomass seen inside the fences. Still, as seen in Figure 5, the biomass
allocation pattern was consistent. The aboveground biomass may just be a consequence of a
larger total biomass inside the fences. One other aspect is that a very large lemming
population, seen in the field, had a large impact in this area. A lot of trails were seen and in
some areas, close to their nests, all vegetation was vanished. If also excluding the small
herbivores, the aboveground biomass inside the fences may have been even larger.
4.4 Respons in V. vitis-idaea
Wild reindeer have been present in Scandinavia since prehistoric time (Austrheim and
Eriksson 2001) and reindeer herding in a larger scale have been present since 15th century
(Sametinget 2011). A long time impact from reindeer on plants made me believe that the
plants were adapted to the grazing pressure. Since grazing also stimulate V. vitis-idaea, which
is not heavily grazed, I believe that there are more factors contributing to allocation
differences than just biomass losses. I thought when starting this study that differences of
variables between treatments would not exist for V. vitis-idaea. Even though the differences
were not significant the results indicates that there is something going on. V. vitis-idaea’s total
biomass was larger inside the fences than in the control plots. This was not expected and can
be explained by 1) the fact that the reindeer actually eat more of V. vitis-idaea than I believed
and/or 2) that V. vitis-idaea suffer more from a low grazing pressure than expected. As noted
before V.vitis-idaea is less able to compensate for biomass losses since it is slow growing.
Even though V. vitis-idaea is a food resource of low quality, Evju et al (2009) found that the
cover increases when excluding reindeer, which indicate that this plant actually suffer from
the presence of reindeer. Sjögersten et al. (2001) found that the biomass, C storage, C uptake
rate seam to increase in high arctic vascular plants when the impact of herbivores is limited.
This could not be seen in the present study, where the C% in the leaves of V. vitis-idaea did
not differ significantly between the treatments. Still, the presence of herbivores in this area
had an effect on V. vitis-idaea; I believe that this is an effect of the rather low R:S ratio; as
16
noted before R:S ratio is a tolerance strategy (Evju et al. 2009). Since V. vitis-idaea invest
carbon and energy in the aboveground, and not very much in the roots, they suffer from
aboveground biomass losses and have a hard time to compensate, even if the loss is very
small.
4.5. Belowground biomass
There is a trend indicating that the B. vivipara’s biomass belowground was larger in the
control plots. The differences were not significant and, as seen in Figure 5, the biomass
allocation pattern between the treatments was more or less consistent. The belowground
biomass in both species is not the total belowground biomass since the plants were cut out of
the ground in 125 cm3 cubes. Some of the fine roots of B. vivipara might have been left in the
field and in that case was just a small part of the root of V. vitis-idaea included in this study.
The small difference between the treatments may be due to the fact that other herbivores than
reindeer had access to all the plots. As noted before lemmings had large impact in this area.
However, there was a small trend that B. vivipara allocated more biomass to the belowground
tissue when being grazed, this may have been significant if more replicates were investigated.
To allocate more biomass to the root system is an indicator that the limiting factor for the
plant is belowground. Brouwer (1963) found that plants growing at low light allocated more
carbon to the shoots, whereas plants with low nutrient supply allocated more biomass to the
roots. This suggests that if the limiting factor is belowground (water and nutrients), the
belowground tissue will increase and if the limiting factors are aboveground (light and CO2)
the allocation to the aboveground tissue will increase. In the control plots the remaining plants
do not have to compete for the light to the same extent as in the fences. The conditions
belowground may therefore be the limiting factor for plant growth, and biomass was therefore
allocated to the roots. It was also found in the present study that the fine root biomass of B.
vivipara was larger in fences. This could either be an effect of grazing or just that the whole
plant was larger inside the fences. The reason may be that the available nitrogen content is
higher when herbivores are present. Inside the fences N content was lower than in the control
plots. This supports the idea that the production of fine root, with lower nitrogen
concentration, increases when nitrogen availability is limited: and thereby increase the NUE
(Johnson and Matchett 2001). To produce more fine roots and thereby increase the NUE is a
tolerance strategy to nitrogen deficiency.
4.6. Carbon- and Nitrogen content
There was no significant difference between the treatments when testing C% and N% in
leaves and fine roots. But the overall trend indicates that there is a higher N% in B. vivipara
than V. vitis-idaea. The reason for this may be explained by the fact that these two species
form mycorrhizal symbiosis with different mycorrhizal types. B. vivipara form ecto- and
arbuscular mycorrhizal relationships (Björk et al. 2007), whereas V. vitis-idaea form
symbiosis with ericoid mycorrhiza (Björk et al. 2007, Michelsen et al. 1996). It was found in
a study by Michelsen et al. (1996), that species forming symbiosis with ectomycorrhizal fungi
had higher N concentration in their leaves than ericoid mycorrhizal species. This was

17
explained as a consequence of a higher amount of structural carbohydrate in ericoid leaves,
making the N more dilute, which was seen in the present study; V. vitis-idaea had a higher
mean C% in the leaf than B. vivipara had. The same pattern was found when Michelsen et al.
(1996) investigated δ15N; ectomycorrhizal species was less 15N depleted than ericoid
mycorrhizal species. They suggested that the reason, for this difference, was that ericoids rely
on a fraction of organic N whereas ectomycorrhizal species in a higher degree rely on NH4+,
which are more enriched in δ15N than organic N substances. In the present study the δ15N did
not differ significantly between the treatments when testing leaves of V. vitis-idaea. The fine
root could not be tested since I just got one general sample from each treatment. The data still
indicates that the fine roots of V. vitis-idaea were more δ15N depleted inside the fences than in
the control plots. There was also a trend, in both species, indicating that the δ15N, in both
leaves and fine roots, is lower inside the fences compared to the control plots, and also in
roots compared to leaves. The reason for this is unclear but it has been found (Broström et al
2007) that the δ15N increases with the soil depth. Since the whole root system was not
examined in this study a conclusion, suggesting that plant inside the fences has deeper roots,
is hard to warrant. One other possible reason for the differences in δ15N is that the feces from
reindeer may be enriched with 15N. Since heavy isotopes diffuse slower through membranes
than less heavy isotopes (Wolfram 2010) it is likely to believe that feces from herbivores are 15N enriched, which contribute to a higher δ15N in the soil. The variance in the δ15N in leaves,
for both species, is larger in the control plots. This also supports the idea that the reindeer
feces, which is probably not evenly spread out, contribute to patches with more δ15N-depleted
soil.
Reindeer may have both positive and negative effects on primary production and soil nutrient
availability. If the response of biomass loss due to grazing, is to produce new shoots a
consequence may be that less carbon exudates from the roots. This will have an impact on the
microbial activity, and decrease the amount of available nitrogen (Kuzyakov 2002). Johnson
and Matchett (2001) on the other hand found that grazing accelerated the nitrogen cycle and
made more nitrogen available for plants. In the same study they also found that plants
allocated less carbon to the roots when grazed. Due to higher nitrogen availability and losses
of aboveground biomass when grazed the plant produced new shoots instead of invest energy
and carbon in the root system. Furthermore, they found that the shoot growth was carbon
rather than nitrogen limited. In contrast, Stark and Grellman (2002) found that the nitrogen
pool in an arctic tundra heath soil decreased in grazed areas. This is explained by the fact that
the reindeer grazed in the experimental area in a time when nitrogen demand was not that
large. Reindeer grazing change the environmental conditions for the unaffected plants. The
light reaching the remaining plants may increase in the grazing areas, where also the nitrogen
availability may or may not increase. The different patterns seen in the treated plants are hard
to explain since no soil analyses were made. It would be very interesting to investigate the
nitrogen soil pool in this area, and link to the response seen in the plants.

18
5. Concluding remarks
More than one factor contributes to differences in biomass allocation pattern when excluding
grazers. However the general conclusions are that the plants in this area decrease the R:S ratio
when reindeer are excluded; a large R:S ratio is a tolerance strategy against herbivores. The
production of fine roots increases in fences, due to less supply of nitrogen when reindeer are
excluded. The C/N ratio supports the idea that B. vivipara is a food resource of higher quality
than V. vitis-idaea, which support my hypothesis that reindeer eat more of B. vivipara than V.
vitis-idaea. Nevertheless, both species seems to respond when reindeer are excluded, but the
differences are most often not significant between the fence- and control plots. The higher
δ15N in the control plots is due to an addition of δ15N in reindeer feces or because of an
increasing δ15N with soil.
The herbivore population may have large effects on carbon- and nitrogen pools, and this is
important to have in mind when studying the impact of climate change. To enlarge this study
with soil nitrogen pool analyses would be very interesting and also necessary for more
certainty in the conclusions. Since the experiment just included one area, predictions and
conclusion about the whole biome is hard to perform and they would be very uncertain. In all
variables the variance is large, indicating that more replicates are needed. However, utilising a
15-year-old experiment makes increasing the replication more or less impossible.
Acknowledgement
First of all I would like to thank my supervisor, Robert Björk, for helping and supporting me
through the whole process. I’m also grateful to Tage Volwes, helping and supporting me
while working in field. I also thank Thomas Hasper for his advices and support while doing
the laboratory work.
19
References
Austrheim and Eriksson (2001), Plant species diversity and grazing in the Scandinavian mountains - patterns and processes at different spatial scales, ECOGRAPHY 24: 683-695.
Begon et al. (2006), Ecology, from individuals to ecosystems, Blackwell publishing Ltd, United Kingdom ISBN: 978-1-4051-1117-1 pp 83-84, 267-272 Björk et al (2007), Linkages between N turnover and plant community structure in a tundra landscape, Plant Soil (2007) 294:247–26 Boström et al.(2007), Isotope fractionation and 13C enrichment in soil profiles during the decomposition of soil organic matter, Oceologia 153:89-98
Bråthen, K. A. & Oksanen, J. (2001), Reindeer reduce biomass of preferred plant species, Journal of vegetation Science 12: 473-480
Callaghan (2007), Arctic Tundra and Polar Desert Ecosystems In: Arctic Climate Impact Assessment scientific report, ch 7, pp. 243-352
Chapin et al (1987), Plant responses to multiple environmental factors, BioScience 37:49-57.
Elmendorf et al. (2011), Global assessment of experimental climate warming on tundra vegetation: heterogeneity over space and time, Ecology Letters
Eriksson et al.(2007), Use and abuse of reindeer range, Acta phytogeographica suecica 87, Uppsala
Evju et al (2009), Grazing responses in forbs in relation to herbivore selectivity and plant traits in an alpine ecosystem, Oecologia 161:77–85
Fitter A.H (1987), An Architectural Approach to the Comparative Ecology of Plant Root Systems, New Phytologist, Vol. 106, No. 1, Frontiers of Comparative Plant Ecology, pp. 61-77
Glimskär and Ericsson (1999), Relative Nitrogen Limitation at Steady-state Nutrition as a Determinant of Plasticity in Five Grassland Plant Specie, Annals of Botany 84 : 413-420
Gurevitch, J. Et al (2006), Soil, Mineral Nutrition, and Belowground Interactions, In: The ecology of plants, Second edition, Sinauer Associates, Inc, Sunderland USA, ISBN: 9780878932948, (pp. 71-97)
Johnson L.C. and Matchett J.R. (2001), Fire and grazing regulate belowground processes in tallgrass prairie, Ecology, 82(12), 2001, pp. 3377-3389
Kuzyakov (2002), Review: Factos affecting rhizosphere priming effects, Journal of Plant Nutrition and Soil Science, Wiley-VCH verlag GmbH, Weinheim, 165: 382-396
Körner (2003), Alpine plant life- Fuctional plant ecology of high mountain ecosystem, second edition, Springer-verlag, New York, ISBN: 3-540-00347-9, 201-220
Körner and Renhardt (1987), Dry matter partitioning and root length/leaf area ratios in herbaceous perennial plants with diverse altitudinal distribution, Oecologia, Berlin, 74: 411 4l 8 Larcher Walter (2003a), Physiological Plant Ecology, 4th edition, Springer-verlag Berlin Heidelberg
20
New York, ISBN 978-3-540-43516-7, 13-15 Larcher Walter (2003b), Physiological Plant Ecology, 4th edition, Springer-verlag Berlin Heidelberg New York, ISBN 978-3-540-43516-7, 143-170
Larcher Walter (2003c), Physiological Plant Ecology, 4th edition, Springer-verlag Berlin Heidelberg New York, ISBN 978-3-540-43516-7, 345-356
Marion G M and Black C H (1987). The effect of time and temperature on nitrogen mineralisation in arctic tundra soils, Soil Science Society of America Journal. 51: 1501–1508
Mulder C.P.H (1999), Vertebrate herbivores and plants in the Arctic and subarctic: effects on individuals, populations, communities and ecosystems, Perspectives in plant ecology, evolution and systematics, Vol. 2/1, pp 29-55.
Oba et al (2006), Effects of herbivory on above- and below-ground biomass partitioning in two arid-zone dwarf shrubs, African journal of range & forage science, 23:3, 159-164 Økland, R.H., Økland, T. & Rydgren, K. 2001. Vegetation-environment relationships of boreal spruce swamp forests in Østmarka Nature Reserve, SE Norway. - Sommerfeltia 29: 1-190. Oslo. ISBN 82-7420-043-8.
Oksanen L. (1999), Predation, herbivory, and plant strategies along gradients of primary production, In: Graze, J.B & Tillman, D. Perspective on plant competition, pp 445-474
Pujanen et al (2008), The effect of reindeer grazing on the composition and species richness of vegetation in forest-tundra ecotone, Polar boil 31:1233-1244 Ricklefs Robert E. 2008, The economy of nature sixth edition, W.H. Freeman and Company, United Kingdom, pp 302-328 Regeringen, nov 2010: http://www.regeringen.se/sb/d/6410/a/58131
Sametinget 2011: http://www.sametinget.se SFS nr: 1971:437, Svensk författningssamling, Landsbygdsdepartementet, http://www.riksdagen.se/webbnav/index.aspx?nid=3911&bet=1971:437 Sjögersten et al (2011), Recovery of ecosystem carbon fluxes and storage from herbivory, Biogeochemistry 106: 357-370 Smhi weather station 17792 (Ritsem): Temperature: http://data.smhi.se/met/climate/time_series/month_year/normal_1961_1990/SMHI_month_year_normal_61_90_temperature_celsius.txt Smhi weather station 17792 (Ritsem): Precipitation: http://data.smhi.se/met/climate/time_series/month_year/normal_1961_1990/SMHI_month_year_normal_61_90_precipitation_mm.txt Stark, S. and Grellman, D. (2002), Soil microbial responses to herbivory in an arctic tundra heath at two levels of nutrient availability, Ecology, 83(10), pp. 2736-2744

21
Svata M. Louda et al 1990, Herbivore influences on plant performance and competitive interactions, in: Graze, J.B & Tillman, D. Perspective on plant competition, pp 413 -444
Tolvanen, A & Laine, K (1997). Effects of reproduction and artificial herbivory and vegetation growth and resource levels in deciduous and evergreen dwarf shrubs. Canadian journal of botany, 75, pp 656-666
Trudell, J. & White, R.G. (1981), The Effect of Forage Structure and Availability on Food Intake, Biting Rate, Bite Size and Daily Eating Time of Reindeer, journal of applied ecology, pp 63-81
White T.C.R (1978), The Importance of a Relative Shortage of Food in Animal Ecology, Oecologia 33, 7 1 - 8 6
Wolfram (2010), Isotope Efftect, Mass discrimination and Isotopic Fraction, In: Stable Isotope Forensics, , Wiley-Blackwell ISBN: 978-0-470-51705-5, 10-16