alfa 1q18 master - alfa.com.mx · alfa´s first quarter 2018 2 summary of subsidiary performance...
TRANSCRIPT
ALFA, S.A.B. DE C.V.
FIRST QUARTER 2018 FINANCIAL REPORT
ALFA Reports 1Q18 EBITDA of US $629 million, a growth of 19% year-over-year
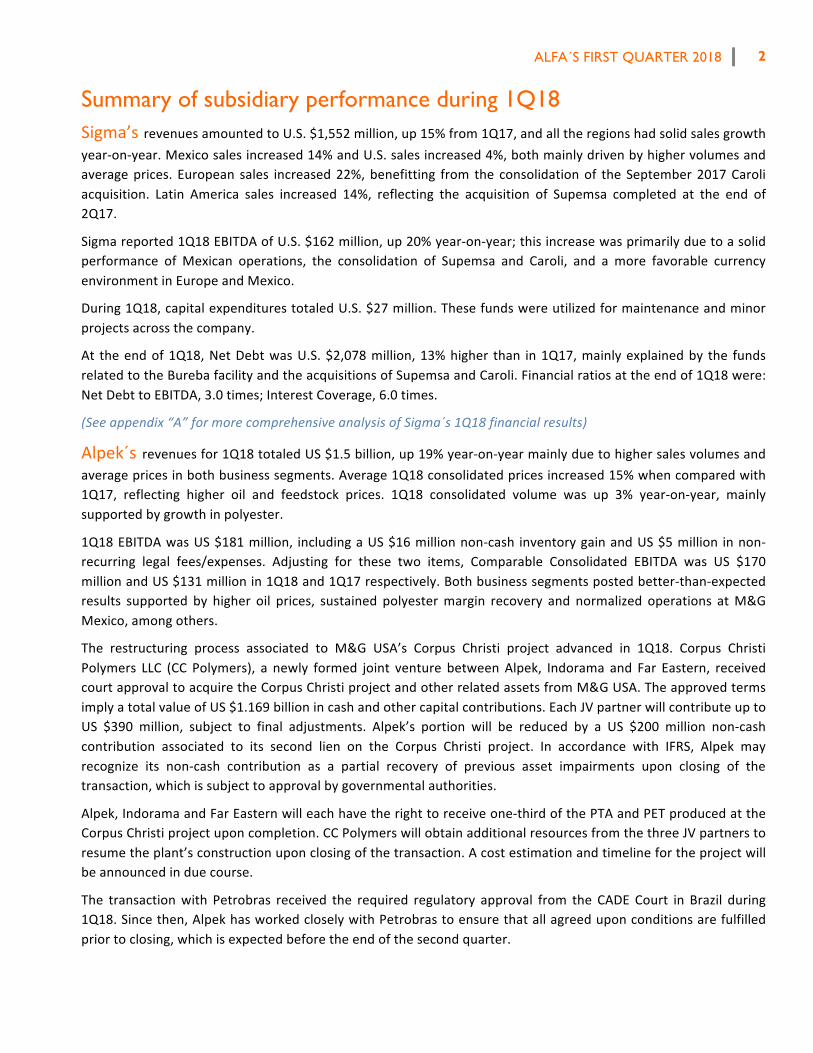
Monterrey,N.L.,Mexico, April 18, 2018.- ALFA, S.A.B. de C.V. (ALFA), a leadingMexican industrial company,reportedtodayits1Q18unauditedfinancialresults.TotalrevenueswereUS$4,576million,up14%year-on-yearduetohighersalesachievedacrossallbusinessunits.EBITDAwasUS$629million,up19%vis-à-vis1Q17.
CommentingontheCompany’sresultsMr.AlvaroFernandez,ALFA’sPresident,said:“ThiswasagoodquarterforALFAasallourbusinessesshowedimprovementduring1Q18.Importantly,weareseeingbetterperformanceacrossmanyregionsandlessvolatilityfromcommodities.Additionally,manyofourportfoliocompanieshadasignificanteventinthequarterastheyexecutedonthe long-termstrategicplan.Bycompany;Sigma’sresultsweredrivenbyastrongperformanceinMexico;Alpeksawhighervolumesandbettermarginsinpolyester,whileNemakbenefitedfromsolidvolumesintheAmericasandlessnegativemetallag.Axtelalsocontinuedtoimproveandcompletedthesaleofthefinaltrancheoftransmissiontowers.Lastly,NewpekadvanceditsstrategytoconcentrateinMexicowithaselectedacreagesaleintheEagleFordShale”.
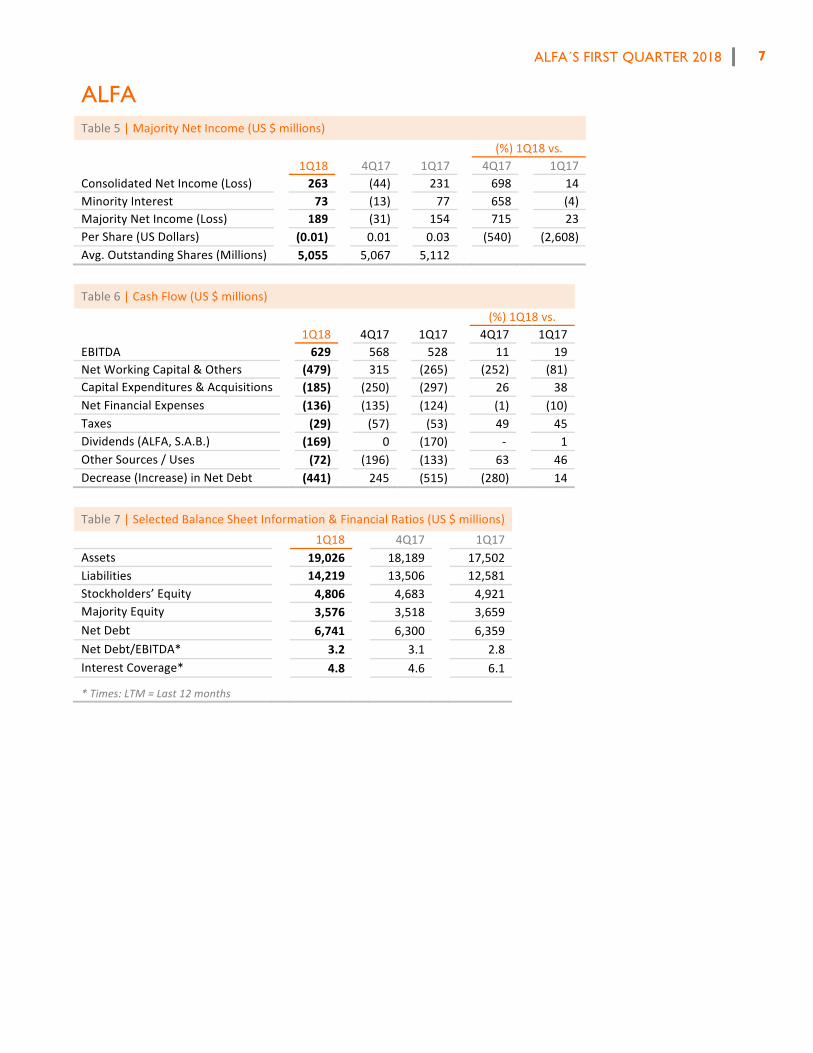
ConsolidatedcapitalexpendituresandacquisitionsamountedtoUS$185millionduring1Q18.NetDebtatthequarterendofUS$6,741millionwas6%higherwhencomparedtotheUS$6,359million in1Q17.Attheendofthequarter,financialratioswere:NetDebttoEBITDA:3.2times;InterestCoverage:4.8times.
MajorityNetIncomewasUS$189millionin1Q18,23%higherthantheUS$154millionreportedin1Q17.Thisimprovementismainlyexplainedbyhigheroperatingincomethatoffset lowerexchangegainsthanthoserecordedin1Q17.SelectedFinancialInformation(US$million)
1Q18 4Q17 1Q17 Var.%
vs.4Q17 Var.%
vs.1Q17
ConsolidatedRevenues 4,576 4,297 3,997 6 14Sigma 1,552 1,593 1,350 (3) 15Alpek 1,532 1,321 1,293 16 19Nemak 1,235 1,094 1,123 13 10Axtel 200 226 181 (12) 11Newpek 33 31 26 7 26
ConsolidatedEBITDA1 629 568 528 11 19Sigma 162 195 135 (17) 20Alpek 181 141 158 29 15Nemak 197 166 190 19 4Axtel 74 77 58 (4) 27Newpek 16 3 (2) 367 913
MajorityNetIncome 189 (31) 154 715 23CapitalExpenditures&Acq. 185 250 297 (26) (38)NetDebt 6,741 6,300 6,359 7 6NetDebt/LTMEBITDA* 3.2 3.1 2.8 LTMInterestCoverage* 4.8 4.6 6.1
*Times.LTM=Last12months1EBTIDA=OperatingIncome+depreciationandamortizationofassets.
CONTENT:SUMMARYOFGROUPS…2|ALFAFINANCIALTABLES…6|ALFAGROUPSFINANCIALINFORMATION…10|
ALFA´S FIRST QUARTER 2018
2
Summary of subsidiary performance during 1Q18 Sigma’srevenuesamountedtoU.S.$1,552million,up15%from1Q17,andalltheregionshadsolidsalesgrowthyear-on-year.Mexicosalesincreased14%andU.S.salesincreased4%,bothmainlydrivenbyhighervolumesandaverageprices. European sales increased22%,benefitting from the consolidationof the September2017Caroliacquisition. Latin America sales increased 14%, reflecting the acquisition of Supemsa completed at the end of2Q17.
Sigmareported1Q18EBITDAofU.S.$162million,up20%year-on-year;thisincreasewasprimarilyduetoasolidperformance of Mexican operations, the consolidation of Supemsa and Caroli, and a more favorable currencyenvironmentinEuropeandMexico.
During1Q18,capitalexpenditurestotaledU.S.$27million.Thesefundswereutilizedformaintenanceandminorprojectsacrossthecompany.
At theendof1Q18,NetDebtwasU.S.$2,078million,13%higher than in1Q17,mainlyexplainedby the fundsrelatedtotheBurebafacilityandtheacquisitionsofSupemsaandCaroli.Financialratiosattheendof1Q18were:NetDebttoEBITDA,3.0times;InterestCoverage,6.0times.
(Seeappendix“A”formorecomprehensiveanalysisofSigma´s1Q18financialresults)
Alpek´srevenuesfor1Q18totaledUS$1.5billion,up19%year-on-yearmainlyduetohighersalesvolumesandaveragepricesinbothbusinesssegments.Average1Q18consolidatedpricesincreased15%whencomparedwith1Q17, reflecting higher oil and feedstock prices. 1Q18 consolidated volume was up 3% year-on-year, mainlysupportedbygrowthinpolyester.
1Q18EBITDAwasUS$181million, includingaUS$16millionnon-cash inventorygainandUS$5million innon-recurring legal fees/expenses. Adjusting for these two items, Comparable Consolidated EBITDA was US $170millionandUS$131millionin1Q18and1Q17respectively.Bothbusinesssegmentspostedbetter-than-expectedresults supported by higher oil prices, sustained polyestermargin recovery and normalized operations atM&GMexico,amongothers.
The restructuring process associated to M&G USA’s Corpus Christi project advanced in 1Q18. Corpus ChristiPolymers LLC (CC Polymers), a newly formed joint venture betweenAlpek, Indorama and Far Eastern, receivedcourtapprovaltoacquiretheCorpusChristiprojectandotherrelatedassetsfromM&GUSA.TheapprovedtermsimplyatotalvalueofUS$1.169billionincashandothercapitalcontributions.EachJVpartnerwillcontributeuptoUS $390 million, subject to final adjustments. Alpek’s portion will be reduced by a US $200 million non-cashcontribution associated to its second lien on the Corpus Christi project. In accordance with IFRS, Alpek mayrecognize its non-cash contribution as a partial recovery of previous asset impairments upon closing of thetransaction,whichissubjecttoapprovalbygovernmentalauthorities.
Alpek,IndoramaandFarEasternwilleachhavetherighttoreceiveone-thirdofthePTAandPETproducedattheCorpusChristiprojectuponcompletion.CCPolymerswillobtainadditionalresourcesfromthethreeJVpartnerstoresumetheplant’sconstructionuponclosingofthetransaction.Acostestimationandtimelinefortheprojectwillbeannouncedinduecourse.
The transactionwith Petrobras received the required regulatory approval from the CADE Court in Brazil during1Q18.Sincethen,AlpekhasworkedcloselywithPetrobrastoensurethatallagreeduponconditionsarefulfilledpriortoclosing,whichisexpectedbeforetheendofthesecondquarter.
ALFA´S FIRST QUARTER 2018
3
TheprocesstofinalizethesaleofAlpek’stwocogenerationpowerplantsinMexicoismovingforwardasthe350MW Altamira plant’s construction is on track to be completed before year-end. However, issues in theimplementationofregulatorychangesinMexicanpowertariffshaveweighedontiming.
1Q18CapexandacquisitionswereUS$56million.Mostof thesefundswere invested intheconstructionof theAltamirapowercogenerationfacilityandtheinitialcontributiontoCCPolymersfortheacquisitionoftheCorpusChristiproject.
NetDebtasoftheendofthequarterwasUS$1,270million,up8%year-on-year,mainlydrivenbytheinvestmentinstrategicprojects,andtheacquisitionofaUS$100millioncreditrelatedtoM&G.Atquarterend,financialratioswereas follows:NetDebt toEBITDA,3.1 times; InterestCoverage,4.8 times.Adjusting for theUS$113millionM&GA/Rprovisionrecordedin3Q17,NetDebttoEBITDAwas2.4timesandInterestCoveragewas6.1times.
Lastly,Alpeksigneda3-year,dollar-denominated,SeniorUnsecuredCreditAgreementofuptoUS$710million.Theloanhasan18-monthavailabilityperiodandcanbeprepaidatanytimeinwholeorinpartwithoutpremiumorpenalty.NetproceedsfromthepotentialsaleofthetwopowercogenerationplantsinMexicowouldbeusedtopaydowntheloan’sbalanceatthattime.ThiscreditfacilityprovidesAlpekwithadditionalfinancialflexibilitytorefinanceexistingshort-termdebtandtemporarilyfinancetheacquisitionofPetroquímicaSuape,CitepeandtheCorpusChristiproject.
(Seeappendix“B”forAlpek´s1Q18financialreport)
Nemak´s1Q18 sales volumewas 13.1million equivalent units, 1% lower than 1Q17, as higher sales inNorthAmerica (NA)was not enough to offset declines in Europe (EU). NA volumeswere highermainly reflecting thecontinuedramp-upofnewprogramsforV6engineapplications. InEU,Nemak´svolumesdeclinedmainlyduetolowerdieselvolumeswhichmorethanoffsethighergasolinevolumesduringtheperiod.RestofWorldvolumeswereflatasadecreaseinChinawasoffsetwithgainsinSouthAmerica.
Revenues were US $1,235 million, up 10% year-over-year, supported by higher aluminum prices and theappreciationoftheeuroagainsttheU.S.dollar.Inturn,1Q18EBITDAtotaledUS$197million,up4%year-on-year,benefitting from operational efficiencies and increased sales of higher value-added products, together withcurrencyeffectsandalessadverseimpactfrommetalpricelagthanin1Q17.1Q18EBITDAperequivalentunitwasUS$15.0,upfromUS$14.4in1Q17.
Capitalexpenditures inthequarteramountedtoUS$106milliontosupportnewprogramlaunchesandtodriveoperationalefficiencyacrossthecompany’sregions.
Net Debt at the end of 1Q18 totaled US $1,377million, up 2% from 1Q17, reflecting the capital expendituresduring theperiod.Financial ratios in1Q18were:NetDebt toEBITDAof1.9 times,and InterestCoverageof8.4times.
(Seeappendix“C”forNemak´s1Q18financialreport)
Axtel´srevenuesinthefirstquartertotaledUS$200million,up11%year-on-year,mainlyexplainedbygrowthinManagedNetworksandITservicesinthecoreEnterpriseandGovernmentsegment.IntheMassMarketsegmentgrowthinFTTxrevenueswasnotenoughtooffsetthedeclineofthelegacyWimaxbusiness.Inpesoterms,totalrevenues increased2% inthequarter.EnterpriseandGovernmentsegmentrepresented81%ofrevenues inthequarter.
1Q18EBITDAwasUS$74million,up27%year-on-year,explainedinpartbyaUS$6millionbenefitfromthesaleofthe final trancheof transmission towers.Excluding thisgain,EBITDA increased16%from1Q17,mainlydue toabetter performance from the Enterprise and Government segment and favorable FX. EBITDA in pesos terms,excludingtowersales,increased8%y-o-y.

ALFA´S FIRST QUARTER 2018
4
CapitalexpenditurestotaledUS$6millionin1Q18(US$29millionexcludingtowersales),includinginvestmentstoprovide last-mile access to connect customers, to deploy IT infrastructure and to further increase data centercapacity in Queretaro, Mexico. At the end of 1Q18, Net Debt was US $1,015 million, down 1% year-on-year.Financialratiosattheendof1Q18were:NetDebttoEBITDAof3.3timesandInterestCoverageof3.4times.
(Seeappendix“D”forAxtel´s1Q18financialreport)
Newpek´srevenueswereUS$33million,up26%from1Q17,reflectinghigherproductionandhigheraverageoilprices.
Attheendof1Q18Newpekhad648producingwellsattheEagleFordShale(“EFS”)inSouthTexas,comparedto628wellsinproductionattheendof1Q17.Additionally,Newpekhas14wellsproducingintheWilcoxformation,and34intheEdwardsformation,bothinSouthTexas,whereNewpekhasa20%workinginterest.Productioninthe US averaged 5.7 thousand barrels of oil equivalent per day (MBOED) during 1Q18, up 13% from 1Q17. InMexico,productionaveraged3.7MBOEDduring1Q18,roughlythesameas1Q17.
1Q18EBITDAwasUS$16million,includingaUS$13millionextraordinarygainfromthesaleofselectedacreageatEFS, which compares with an EBITDA loss of US $2 million in 1Q17. Capital expenditures were US $8 millionexcludingsaleatEFS,whilenetdebtwasUS$27millionattheendofthequarter.
OnMarch27th,Newpekannounced it signedapurchase and sale agreementwith SundanceEnergy, Inc. to sellapproximately1,900netacresofitsEagleFordShaleacreagepositionforUS$19million.TheacreageislocatedinAtascosa, LaSalle, Live Oak and McMullen Counties, Texas with current net production of approximately 200barrelsofoilequivalentperday.
The transaction is being made jointly with Pioneer Natural Resources USA and Reliance Eagleford UpstreamHoldingLP.Uponclosing,whichisexpectedduringthesecondquarterof2018andissubjecttothesatisfactionofcustomaryclosingconditions,Newpek’sacreagepositionintheEagleFordShalewillbeapproximately11,000netacres,allofwhichisheldbyproduction.
As previously announced, the remaining Eagle Ford Shale acreage position is also being divested and for suchpurposesadataroomopenedonMarch29thandisavailableforpotentialinvestors.
(Seeappendix“E”formorecomprehensiveanalysisofNewpek´s1Q18financialresults)
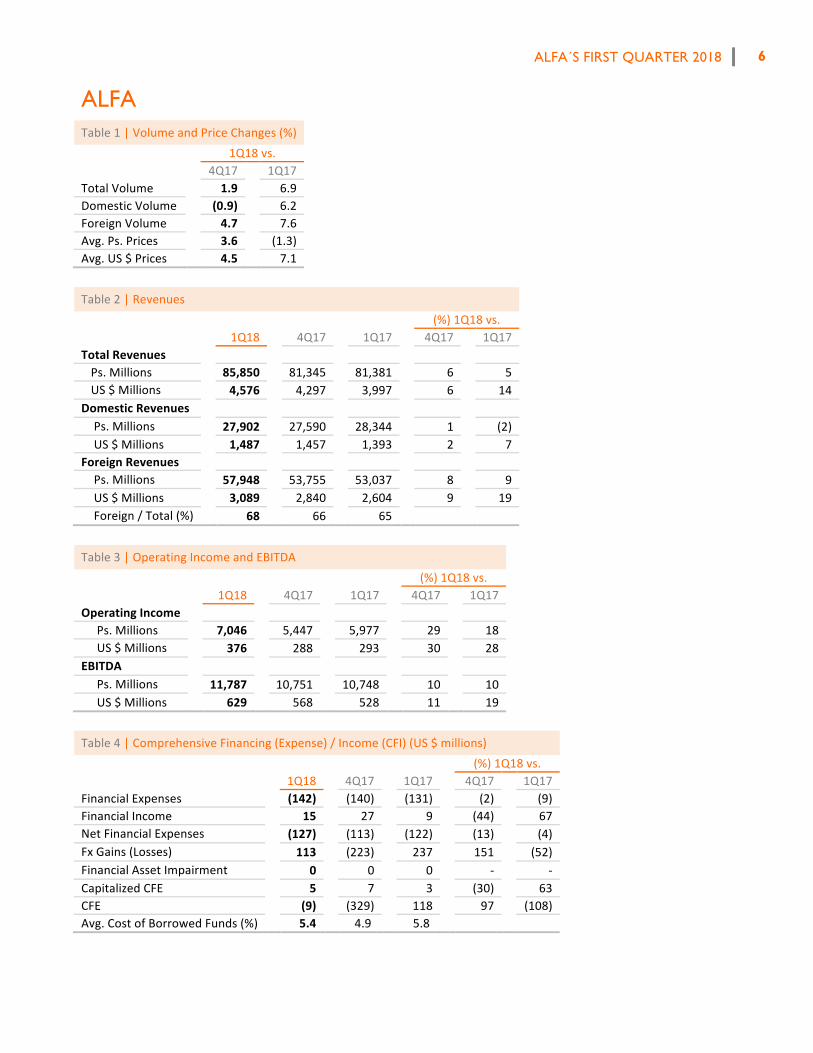
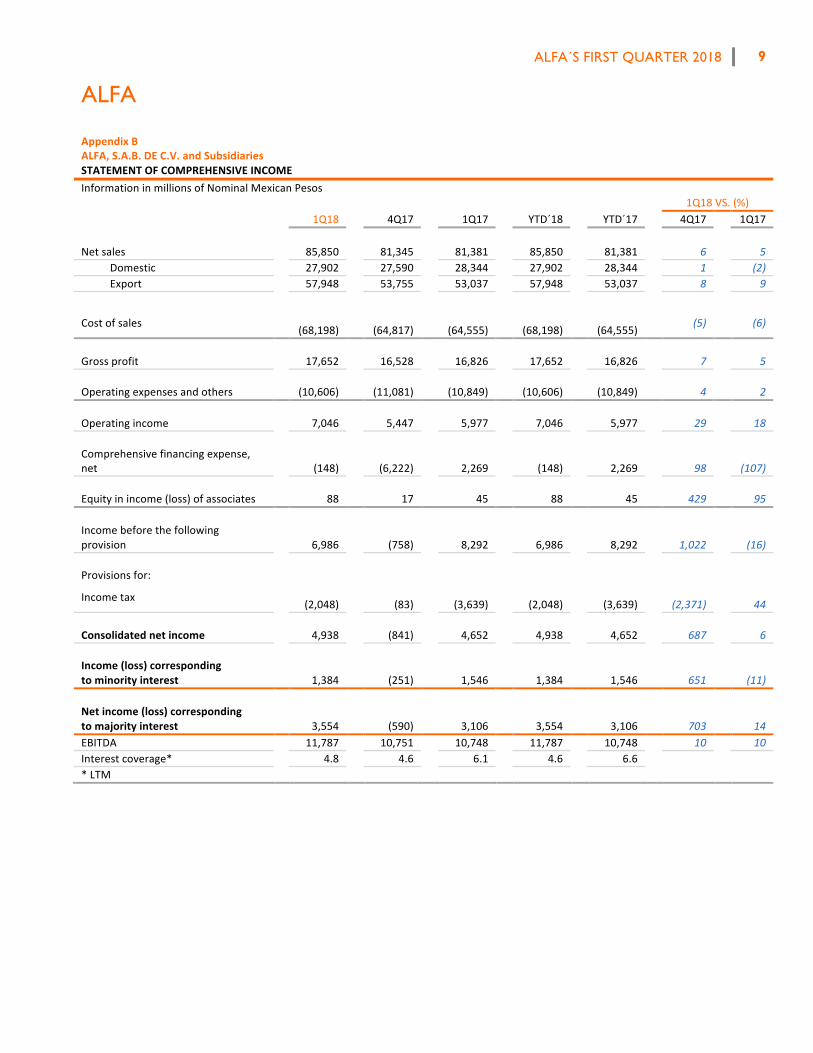
Consolidated financial results 1Q18 consolidated revenues were US $4,576 million, up 14% from US $3,997 million reported in 1Q17. Theincrease is the result of higher sales across all business units andmainly reflects higher volumes and prices inSigmaandAlpekandhigheraluminumpricesinNemak.Duringthequarter,foreignsalesrepresented68%ofthetotal,upfrom65%in1Q17.
1Q18 Consolidated Operating Income totaled US $376 million, up 28% from US $293 million in 1Q17. Factorscontributing to this growth include; higher volumes and better polyester margins in Alpek; for Sigma, betterperformanceinMexicoandthecontributionfromtheacquisitionsofSupemsaandCaroliduringtheyear;Nemak’simprovement in the Americas, alongwith less negativemetal lag effect; for Axtel, growth in IT services in theEnterpriseandGovernmentsegment,aswellasextraordinaryincomeofUS$6millionstemmingfromthesaleoftransmissiontowers.NewpekbenefitedfrombetteroilpricesandextraordinaryincomeofUS$13millionfromthesaleofselectedacreageintheEagleFordShale.
1Q18EBITDAwasUS$629million,up19%year-on-year,reflectingthehigherOperatingIncomeexplainedabove.
ALFA´S FIRST QUARTER 2018
5
ALFA reported 1Q18 Comprehensive Financing Expense (CFE) of US $9 million, compared to ComprehensiveFinancingIncomeofUS$118millionin1Q17,mainlyexplainedbylowerforeignexchangegainsduringthequarter,ascomparedtothoserecordedin1Q17.
Majority Net Income was US $189 million in 1Q18, up 23% from US $154 million in 1Q17. This year-on-yearimprovementismainlyexplainedbyhigherOperatingIncomethatoffsettheincreaseinComprehensiveFinancingExpense(“CFE”)alreadyexplained.
Capital expenditures and acquisitions; Net debt ConsolidatedcapitalexpendituresandacquisitionstotaledUS$185million in1Q18.Allsubsidiariescontinuedtomakeprogressontheir investmentplansasdiscussed in the initial sectionof this report.1Q18ALFA’sNetDebtamountedtoUS$6,741million,US$382millionhigherthan1Q17.Attheendofthequarter,financialratioswere:Net Debt to EBITDA, 3.2 times; Interest Coverage, 4.8 times. These ratios compare to 2.8 times and 6.1 times,respectivelyin1Q17.
ALFA´S FIRST QUARTER 2018
6
ALFA Table1|VolumeandPriceChanges(%)
1Q18vs. 4Q17 1Q17
TotalVolume 1.9 6.9DomesticVolume (0.9) 6.2ForeignVolume 4.7 7.6Avg.Ps.Prices 3.6 (1.3)Avg.US$Prices 4.5 7.1
Table2|Revenues (%)1Q18vs. 1Q18 4Q17 1Q17 4Q17 1Q17TotalRevenues Ps.Millions 85,850 81,345 81,381 6 5US$Millions 4,576 4,297 3,997 6 14
DomesticRevenues Ps.Millions 27,902 27,590 28,344 1 (2)US$Millions 1,487 1,457 1,393 2 7
ForeignRevenues Ps.Millions 57,948 53,755 53,037 8 9US$Millions 3,089 2,840 2,604 9 19Foreign/Total(%) 68 66 65
Table3|OperatingIncomeandEBITDA (%)1Q18vs. 1Q18 4Q17 1Q17 4Q17 1Q17OperatingIncome Ps.Millions 7,046 5,447 5,977 29 18US$Millions 376 288 293 30 28
EBITDA Ps.Millions 11,787 10,751 10,748 10 10US$Millions 629 568 528 11 19
Table4|ComprehensiveFinancing(Expense)/Income(CFI)(US$millions) (%)1Q18vs. 1Q18 4Q17 1Q17 4Q17 1Q17FinancialExpenses (142) (140) (131) (2) (9)FinancialIncome 15 27 9 (44) 67NetFinancialExpenses (127) (113) (122) (13) (4)FxGains(Losses) 113 (223) 237 151 (52)FinancialAssetImpairment 0 0 0 - -CapitalizedCFE 5 7 3 (30) 63CFE (9) (329) 118 97 (108)Avg.CostofBorrowedFunds(%) 5.4 4.9 5.8
ALFA´S FIRST QUARTER 2018
7
ALFA Table5|MajorityNetIncome(US$millions) (%)1Q18vs. 1Q18 4Q17 1Q17 4Q17 1Q17ConsolidatedNetIncome(Loss) 263 (44) 231 698 14MinorityInterest 73 (13) 77 658 (4)MajorityNetIncome(Loss) 189 (31) 154 715 23PerShare(USDollars) (0.01) 0.01 0.03 (540) (2,608)Avg.OutstandingShares(Millions) 5,055 5,067 5,112
Table6|CashFlow(US$millions) (%)1Q18vs. 1Q18 4Q17 1Q17 4Q17 1Q17EBITDA 629 568 528 11 19NetWorkingCapital&Others (479) 315 (265) (252) (81)CapitalExpenditures&Acquisitions (185) (250) (297) 26 38NetFinancialExpenses (136) (135) (124) (1) (10)Taxes (29) (57) (53) 49 45Dividends(ALFA,S.A.B.) (169) 0 (170) - 1OtherSources/Uses (72) (196) (133) 63 46Decrease(Increase)inNetDebt (441) 245 (515) (280) 14
Table7|SelectedBalanceSheetInformation&FinancialRatios(US$millions) 1Q18 4Q17 1Q17Assets 19,026 18,189 17,502Liabilities 14,219 13,506 12,581Stockholders’Equity 4,806 4,683 4,921MajorityEquity 3,576 3,518 3,659NetDebt 6,741 6,300 6,359NetDebt/EBITDA* 3.2 3.1 2.8InterestCoverage* 4.8 4.6 6.1
*Times:LTM=Last12months
ALFA´S FIRST QUARTER 2018
8
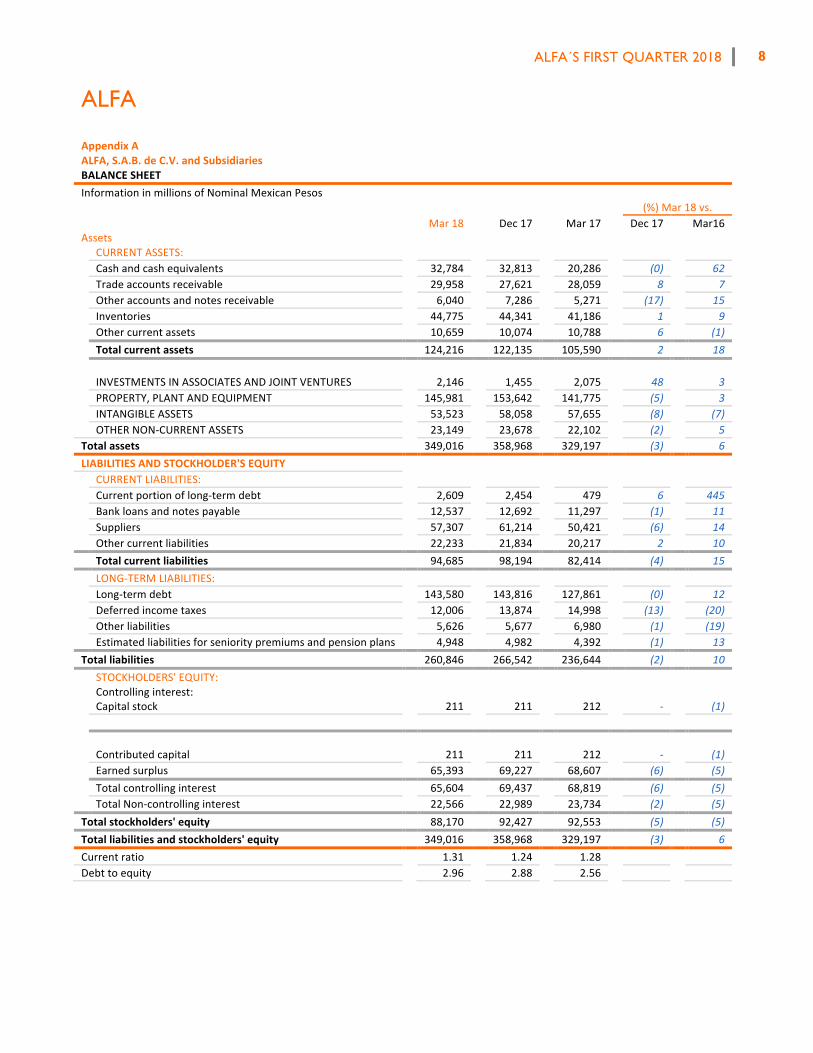
ALFA AppendixAALFA,S.A.B.deC.V.andSubsidiariesBALANCESHEETInformationinmillionsofNominalMexicanPesos (%)Mar18vs. Mar18 Dec17 Mar17 Dec17 Mar16Assets CURRENTASSETS: Cashandcashequivalents 32,784 32,813 20,286 (0) 62 Tradeaccountsreceivable 29,958 27,621 28,059 8 7 Otheraccountsandnotesreceivable 6,040 7,286 5,271 (17) 15 Inventories 44,775 44,341 41,186 1 9 Othercurrentassets 10,659 10,074 10,788 6 (1) Totalcurrentassets 124,216 122,135 105,590 2 18 INVESTMENTSINASSOCIATESANDJOINTVENTURES 2,146 1,455 2,075 48 3 PROPERTY,PLANTANDEQUIPMENT 145,981 153,642 141,775 (5) 3 INTANGIBLEASSETS 53,523 58,058 57,655 (8) (7) OTHERNON-CURRENTASSETS 23,149 23,678 22,102 (2) 5Totalassets 349,016 358,968 329,197 (3) 6LIABILITIESANDSTOCKHOLDER'SEQUITY CURRENTLIABILITIES: Currentportionoflong-termdebt 2,609 2,454 479 6 445 Bankloansandnotespayable 12,537 12,692 11,297 (1) 11 Suppliers 57,307 61,214 50,421 (6) 14 Othercurrentliabilities 22,233 21,834 20,217 2 10 Totalcurrentliabilities 94,685 98,194 82,414 (4) 15 LONG-TERMLIABILITIES: Long-termdebt 143,580 143,816 127,861 (0) 12 Deferredincometaxes 12,006 13,874 14,998 (13) (20) Otherliabilities 5,626 5,677 6,980 (1) (19) Estimatedliabilitiesforsenioritypremiumsandpensionplans 4,948 4,982 4,392 (1) 13Totalliabilities 260,846 266,542 236,644 (2) 10 STOCKHOLDERS'EQUITY: Controllinginterest: Capitalstock 211 211 212 - (1) Contributedcapital 211 211 212 - (1) Earnedsurplus 65,393 69,227 68,607 (6) (5) Totalcontrollinginterest 65,604 69,437 68,819 (6) (5) TotalNon-controllinginterest 22,566 22,989 23,734 (2) (5)Totalstockholders'equity 88,170 92,427 92,553 (5) (5)Totalliabilitiesandstockholders'equity 349,016 358,968 329,197 (3) 6Currentratio 1.31 1.24 1.28 Debttoequity 2.96 2.88 2.56
ALFA´S FIRST QUARTER 2018
9
ALFA AppendixBALFA,S.A.B.DEC.V.andSubsidiariesSTATEMENTOFCOMPREHENSIVEINCOMEInformationinmillionsofNominalMexicanPesos 1Q18VS.(%) 1Q18 4Q17 1Q17 YTD´18 YTD´17 4Q17 1Q17
Netsales 85,850 81,345 81,381 85,850 81,381 6 5Domestic 27,902 27,590 28,344 27,902 28,344 1 (2)Export 57,948 53,755 53,037 57,948 53,037 8 9
Costofsales (68,198)
(64,817) (64,555)
(68,198) (64,555) (5) (6)
Grossprofit 17,652 16,528 16,826 17,652 16,826 7 5 Operatingexpensesandothers (10,606) (11,081) (10,849) (10,606) (10,849) 4 2 Operatingincome 7,046 5,447 5,977 7,046 5,977 29 18 Comprehensivefinancingexpense,net
(148) (6,222) 2,269 (148) 2,269 98
(107)
Equityinincome(loss)ofassociates 88 17 45 88 45 429 95 Incomebeforethefollowingprovision
6,986 (758) 8,292 6,986 8,292 1,022 (16)
Provisionsfor:
Incometax (2,048) (83) (3,639) (2,048) (3,639)
(2,371) 44
Consolidatednetincome 4,938 (841) 4,652 4,938 4,652 687 6 Income(loss)correspondingtominorityinterest
1,384 (251) 1,546 1,384 1,546 651 (11)
Netincome(loss)correspondingtomajorityinterest
3,554 (590) 3,106 3,554 3,106 703 14
EBITDA 11,787 10,751 10,748 11,787 10,748 10 10Interestcoverage* 4.8 4.6 6.1 4.6 6.6 *LTM
ALFA´S FIRST QUARTER 2018
10
LuisOchoa+52(81)[email protected]
Juan Andrés Martín +52(81)[email protected]
Eugenia Villarreal+52(81)[email protected]
InspIR Group Susan Borinelli +1(646)[email protected]
Thisreleasemaycontainforward-lookinginformationbasedonnumerousvariablesandassumptionsthatareinherentlyuncertain.Theyinvolvejudgmentswithrespectto,amongotherthings,futureeconomic,competitiveandfinancialmarketconditionsandfuturebusinessdecisions,allofwhicharedifficultorimpossibletopredictaccurately.Accordingly,resultscouldvaryfromthosesetforthinthisrelease.Thereportpresentsunauditedfinancialinformation.FiguresarepresentedinMexicanpesosorUSDollars,asindicated.Whereapplicable,pesoamountsweretranslatedintoUSDollarsusingtheaverage
exchangerateofthemonthsduringwhichtheoperationswererecorded.FinancialratiosarecalculatedinUSDollars.Duetotheroundingupoffigures,smalldifferencesmayoccurwhencalculatingpercentchangesfromoneperiodtotheother.
APPENDIX: A SIGMA 11 B ALPEK 17 C NEMAK 30 D AXTEL 38 E NEWPEK 47
ALFA´S FIRST QUARTER 2018
11
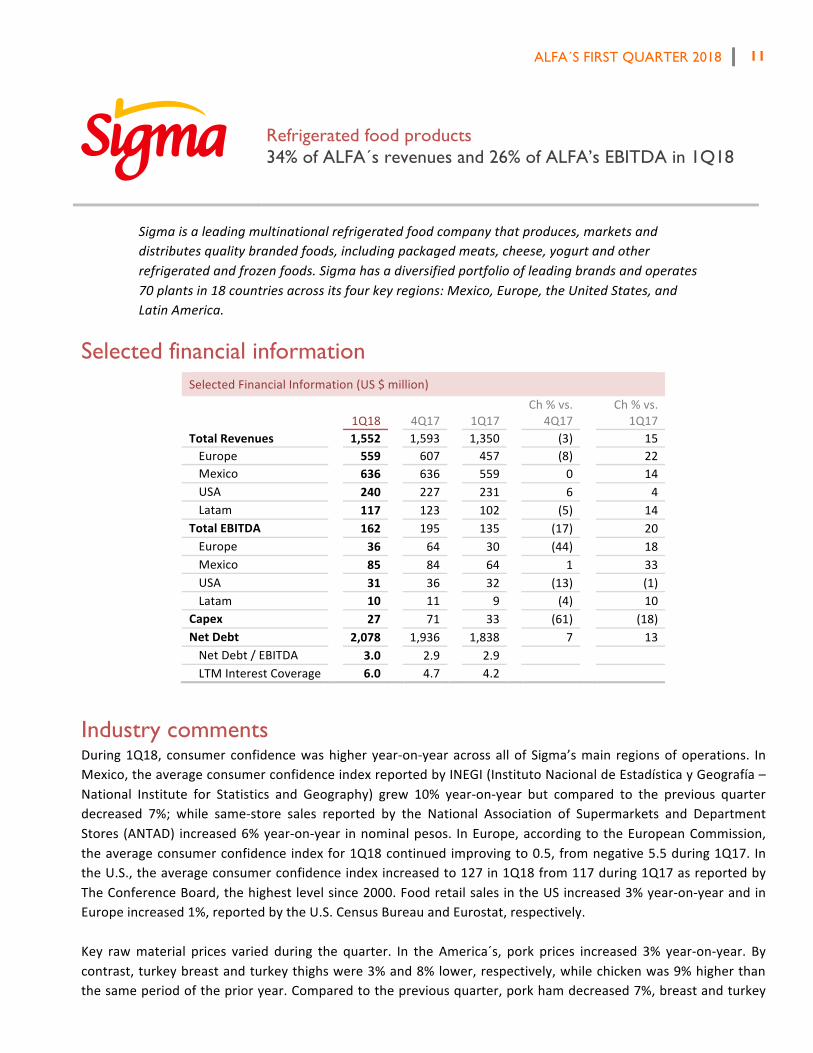
Refrigerated food products 34% of ALFA´s revenues and 26% of ALFA’s EBITDA in 1Q18
Sigmaisaleadingmultinationalrefrigeratedfoodcompanythatproduces,marketsanddistributesqualitybrandedfoods,includingpackagedmeats,cheese,yogurtandotherrefrigeratedandfrozenfoods.Sigmahasadiversifiedportfolioofleadingbrandsandoperates70plantsin18countriesacrossitsfourkeyregions:Mexico,Europe,theUnitedStates,andLatinAmerica.
Selected financial information SelectedFinancialInformation(US$million)
1Q18 4Q17 1Q17 Ch%vs.
4Q17 Ch%vs.
1Q17TotalRevenues 1,552 1,593 1,350 (3) 15Europe 559 607 457 (8) 22Mexico 636 636 559 0 14USA 240 227 231 6 4Latam 117 123 102 (5) 14
TotalEBITDA 162 195 135 (17) 20Europe 36 64 30 (44) 18Mexico 85 84 64 1 33USA 31 36 32 (13) (1)Latam 10 11 9 (4) 10
Capex 27 71 33 (61) (18)NetDebt 2,078 1,936 1,838 7 13NetDebt/EBITDA 3.0 2.9 2.9 LTMInterestCoverage 6.0 4.7 4.2
Industry comments During1Q18, consumer confidencewashigher year-on-yearacrossallof Sigma’smain regionsofoperations. InMexico,theaverageconsumerconfidenceindexreportedbyINEGI(InstitutoNacionaldeEstadísticayGeografía–National Institute for Statistics and Geography) grew 10% year-on-year but compared to the previous quarterdecreased 7%; while same-store sales reported by the National Association of Supermarkets and DepartmentStores (ANTAD) increased6%year-on-year innominalpesos. InEurope,accordingto theEuropeanCommission,theaverageconsumerconfidence indexfor1Q18continuedimprovingto0.5, fromnegative5.5during1Q17. IntheU.S.,theaverageconsumerconfidenceindexincreasedto127in1Q18from117during1Q17asreportedbyTheConferenceBoard,thehighestlevelsince2000.FoodretailsalesintheUSincreased3%year-on-yearandinEuropeincreased1%,reportedbytheU.S.CensusBureauandEurostat,respectively.Key rawmaterial prices varied during the quarter. In the America´s, pork prices increased 3% year-on-year. Bycontrast,turkeybreastandturkeythighswere3%and8%lower,respectively,whilechickenwas9%higherthanthesameperiodoftheprioryear.Comparedtothepreviousquarter,porkhamdecreased7%,breastandturkey

ALFA´S FIRST QUARTER 2018
12
thighs increased1%and21%, respectively,while chickenpriceswere stable. InMexico, theappreciationof thepesovis-a-vistheU.S.dollarhaseasedthecostpressureofrawmaterials,astheindustryparticipantsimportmostoftheirmeatsfromtheUS.InEurope,pricesforhamandporkshoulderdecreasedonaverage10%year-on-year.
Financial results by region Europe
During1Q18,EuropeansalesandEBITDAineurosincreased6%and2%year-on-year,respectively,benefitingfromthe consolidation of the acquisition of Caroli in Romania since September 2017. La Bureba plant continuedproduction for the Spanish and European markets. By the end of the quarter, Sigma started showing marginimprovements from this facility. These efficiencieswere reinvested in additionalmarketing and R&D expenses.EBITDAmarginimprovementsareexpectedduringthesecondhalfoftheyear.
México
FirstquarterMexicansalesinpesosincreased5%year-on-yearbenefitingfromanincreaseinvolumeandhigheraverageprices.1Q18EBITDAincreased23%year-on-yearsupportedmainlybyhighermarginswhencomparedto1Q17.HigheraveragepricesandstableaveragerawmaterialcostsinpesoscontributedtohigherEBITDAmargins.
USA
1Q18U.S. sales increased4%drivenbyhighervolumeandhigheraveragepricesyear-on-year.RevenuegrowthwasdrivenbytheBar-SBrandandtheHispanicbusiness.EBITDAdecreased1%year-on-year,duetoslightlyhigherraw material prices and higher freight costs caused in part by new transportation regulations. The EuropeanHeritagebusiness’EBITDAwasimpactedbyaone-timefixedassetwrite-off.
Latam
Firstquarter2018LatinAmericasalesinUSDincreased14%year-on-yearandEBITDAincreased10%year-on-year,benefited from the acquisition of Supemsa at the end of 2Q17. Supemsa has been exceeding expectations andSigmaisinprocessofimplementingsynergies.
Consolidated financial results During 1Q18, Sigma´s revenues were U.S. $1,552 million, an increase of 15% versus 1Q17. Sigma soldapproximately 427 thousand tons of food products, up 4% from 1Q17with growth across all regions. In dollarterms, average prices increased 11% year-on-year, stemming from higher prices in the USA andMexico and astrongerpesoandeuroagainsttheUSdollar.
SalesinMexicoaccountedfor41%ofthequarter’stotal,whileEuroperepresented36%,theU.S.15%,andLatinAmerica8%.
OperatingincomeandEBITDAwereUS$108millionandU.S.$162millionin1Q18,up27%and20%year-on-year,respectively.This increasewasprimarilyduetoasolidperformanceofMexicanoperations, theconsolidationofSupemsaandCaroli,andamorefavorablecurrencyenvironmentinEuropeandMexico.

ALFA´S FIRST QUARTER 2018
13
Capital expenditures and acquisitions; net debtDuring 1Q18, capital expenditures were US $27million. These funds were utilized formaintenance andminorprojectsacrossthecompany.
Attheendof1Q18,NetDebtwasUS$2,078million,up13%from1Q17,mainlyexplainedbytheoutflowsrelatedto theBureba facilityand theacquisitionsofSupemsaandCaroli. Financial ratiosat theendof1Q18were:NetDebt to EBITDA, 3.0 times; Interest Coverage, 6.0 times. These ratios compare to 2.9 times and 4.2 times,respectivelyin1Q17.
Recent developments OnMarch 22, 2018 Sigma issued a US $500million bond. The notes have a coupon of 4.875% and amaturityperiodof10years.Theproceedswereused to redeem2022notes issuedby itsEuropeansubsidiaryCampofríoFoodGroup.Withthistransaction,thenewaveragelifeofSigma’sdebtwasextendedto7.0years.
As part of its financial strategy, Sigma entered into cross currency swap transactions to change part of its U.S.dollardebttopesos. InMarch2018,Sigmaswapped itsU.S.$250million2019bondand inApril2018,US$250millionofits2026bond.Afterthesetransactions,thedebtcurrencymixisasfollows:48%U.S.dollars,29%eurosand23%pesos.
ALFA´S FIRST QUARTER 2018
14
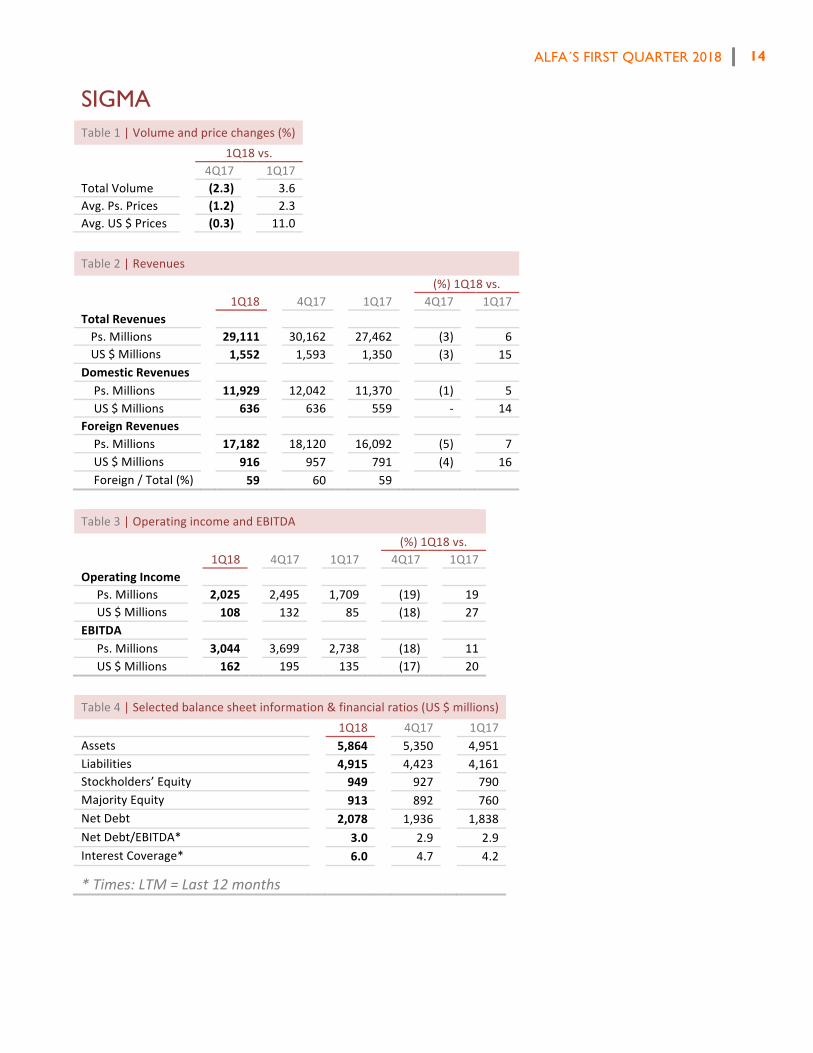
SIGMA Table1|Volumeandpricechanges(%)
1Q18vs. 4Q17 1Q17
TotalVolume (2.3) 3.6Avg.Ps.Prices (1.2) 2.3Avg.US$Prices (0.3) 11.0Table2|Revenues (%)1Q18vs. 1Q18 4Q17 1Q17 4Q17 1Q17TotalRevenues Ps.Millions 29,111 30,162 27,462 (3) 6US$Millions 1,552 1,593 1,350 (3) 15
DomesticRevenues Ps.Millions 11,929 12,042 11,370 (1) 5US$Millions 636 636 559 - 14
ForeignRevenues Ps.Millions 17,182 18,120 16,092 (5) 7US$Millions 916 957 791 (4) 16Foreign/Total(%) 59 60 59
Table3|OperatingincomeandEBITDA (%)1Q18vs. 1Q18 4Q17 1Q17 4Q17 1Q17OperatingIncome Ps.Millions 2,025 2,495 1,709 (19) 19US$Millions 108 132 85 (18) 27
EBITDA Ps.Millions 3,044 3,699 2,738 (18) 11US$Millions 162 195 135 (17) 20
Table4|Selectedbalancesheetinformation&financialratios(US$millions) 1Q18 4Q17 1Q17Assets 5,864 5,350 4,951Liabilities 4,915 4,423 4,161Stockholders’Equity 949 927 790MajorityEquity 913 892 760NetDebt 2,078 1,936 1,838NetDebt/EBITDA* 3.0 2.9 2.9InterestCoverage* 6.0 4.7 4.2
*Times:LTM=Last12months
ALFA´S FIRST QUARTER 2018
15
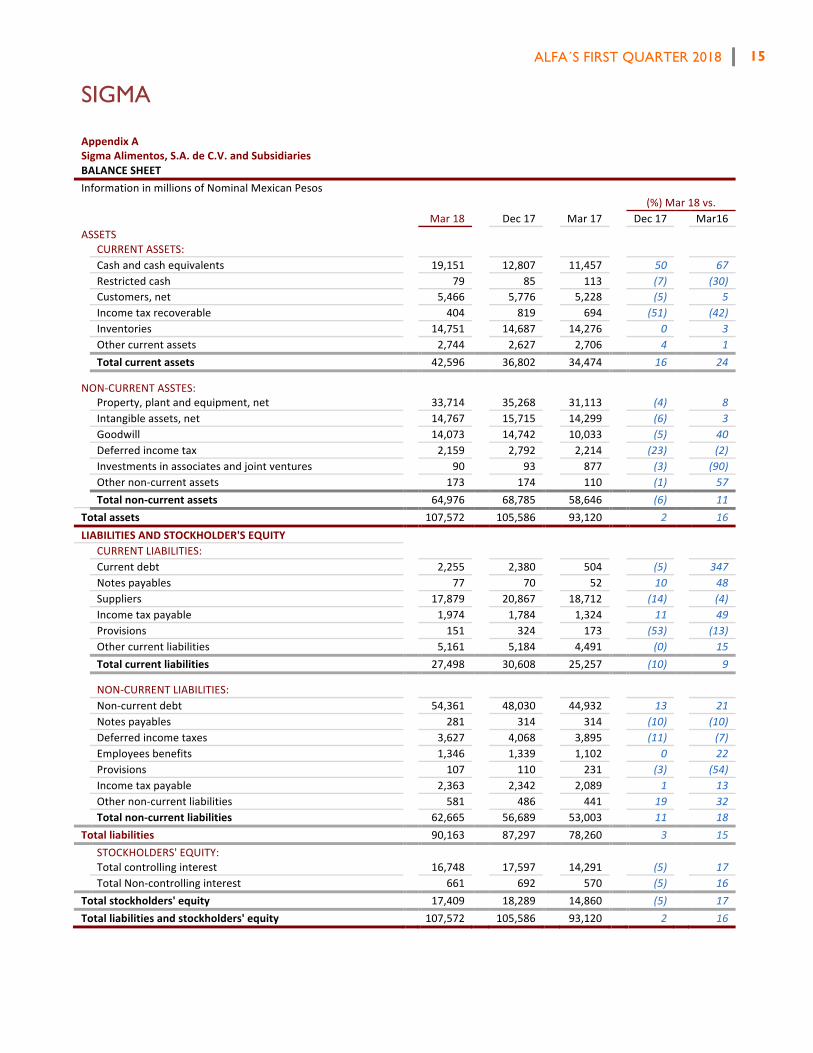
SIGMA AppendixASigmaAlimentos,S.A.deC.V.andSubsidiariesBALANCESHEETInformationinmillionsofNominalMexicanPesos (%)Mar18vs. Mar18 Dec17 Mar17 Dec17 Mar16ASSETS CURRENTASSETS: Cashandcashequivalents 19,151 12,807 11,457 50 67 Restrictedcash 79 85 113 (7) (30) Customers,net 5,466 5,776 5,228 (5) 5 Incometaxrecoverable 404 819 694 (51) (42) Inventories 14,751 14,687 14,276 0 3 Othercurrentassets 2,744 2,627 2,706 4 1 Totalcurrentassets 42,596 36,802 34,474 16 24
NON-CURRENTASSTES: Property,plantandequipment,net 33,714 35,268 31,113 (4) 8 Intangibleassets,net 14,767 15,715 14,299 (6) 3 Goodwill 14,073 14,742 10,033 (5) 40 Deferredincometax 2,159 2,792 2,214 (23) (2) Investmentsinassociatesandjointventures 90 93 877 (3) (90) Othernon-currentassets 173 174 110 (1) 57 Totalnon-currentassets 64,976 68,785 58,646 (6) 11Totalassets 107,572 105,586 93,120 2 16LIABILITIESANDSTOCKHOLDER'SEQUITY CURRENTLIABILITIES: Currentdebt 2,255 2,380 504 (5) 347 Notespayables 77 70 52 10 48 Suppliers 17,879 20,867 18,712 (14) (4) Incometaxpayable 1,974 1,784 1,324 11 49 Provisions 151 324 173 (53) (13) Othercurrentliabilities 5,161 5,184 4,491 (0) 15 Totalcurrentliabilities 27,498 30,608 25,257 (10) 9
NON-CURRENTLIABILITIES:
Non-currentdebt 54,361 48,030 44,932 13 21 Notespayables 281 314 314 (10) (10) Deferredincometaxes 3,627 4,068 3,895 (11) (7) Employeesbenefits 1,346 1,339 1,102 0 22 Provisions 107 110 231 (3) (54) Incometaxpayable 2,363 2,342 2,089 1 13 Othernon-currentliabilities 581 486 441 19 32 Totalnon-currentliabilities 62,665 56,689 53,003 11 18Totalliabilities 90,163 87,297 78,260 3 15 STOCKHOLDERS'EQUITY: Totalcontrollinginterest 16,748 17,597 14,291 (5) 17 TotalNon-controllinginterest 661 692 570 (5) 16Totalstockholders'equity 17,409 18,289 14,860 (5) 17Totalliabilitiesandstockholders'equity 107,572 105,586 93,120 2 16
ALFA´S FIRST QUARTER 2018
16
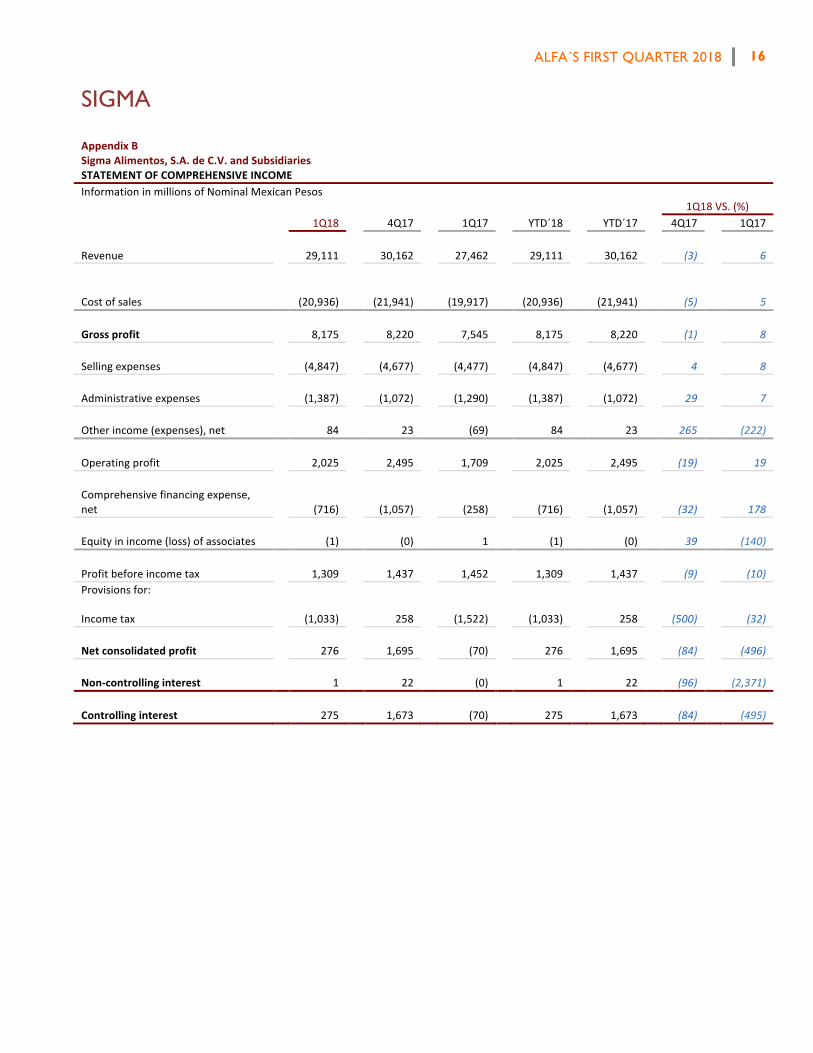
SIGMA AppendixBSigmaAlimentos,S.A.deC.V.andSubsidiariesSTATEMENTOFCOMPREHENSIVEINCOMEInformationinmillionsofNominalMexicanPesos 1Q18VS.(%) 1Q18 4Q17 1Q17 YTD´18 YTD´17 4Q17 1Q17
Revenue 29,111 30,162 27,462 29,111 30,162 (3) 6
Costofsales
(20,936)
(21,941)
(19,917)
(20,936)
(21,941) (5) 5
Grossprofit
8,175 8,220 7,545 8,175 8,220 (1) 8
Sellingexpenses
(4,847) (4,677) (4,477) (4,847) (4,677) 4 8
Administrativeexpenses
(1,387) (1,072) (1,290) (1,387) (1,072) 29 7
Otherincome(expenses),net
84 23 (69) 84 23 265 (222)
Operatingprofit
2,025 2,495 1,709 2,025 2,495 (19) 19
Comprehensivefinancingexpense,net
(716) (1,057) (258) (716) (1,057) (32) 178
Equityinincome(loss)ofassociates
(1) (0) 1 (1) (0) 39 (140)
Profitbeforeincometax
1,309 1,437 1,452 1,309 1,437 (9) (10)Provisionsfor:
Incometax
(1,033) 258 (1,522) (1,033) 258
(500) (32)
Netconsolidatedprofit
276 1,695 (70) 276 1,695 (84) (496)
Non-controllinginterest
1 22 (0) 1 22 (96)
(2,371)
Controllinginterest
275 1,673 (70) 275 1,673 (84) (495)
First Quarter 2018 (1Q18) |
This release contains forward‐looking information based on numerous variables and assumptions that are inherently uncertain. They involve judgments with respect to, among other things, future economic, competitive and financial market conditions and future business decisions, all of which are difficult or impossible to predict accurately. Accordingly, results could vary from those set forth in this release. The report presents unaudited financial information based on International Financial Reporting Standards (IFRS). Figures are stated in nominal Mexican pesos ($) and in current U.S. Dollars (U.S. $), as indicated. Where applicable, peso amounts were translated into U.S. Dollars using the average exchange rate of the months during which operations were recorded. Financial ratios are calculated in U.S. Dollars. Due to the rounding up of figures, small differences may occur when calculating percent changes from one period to the other.
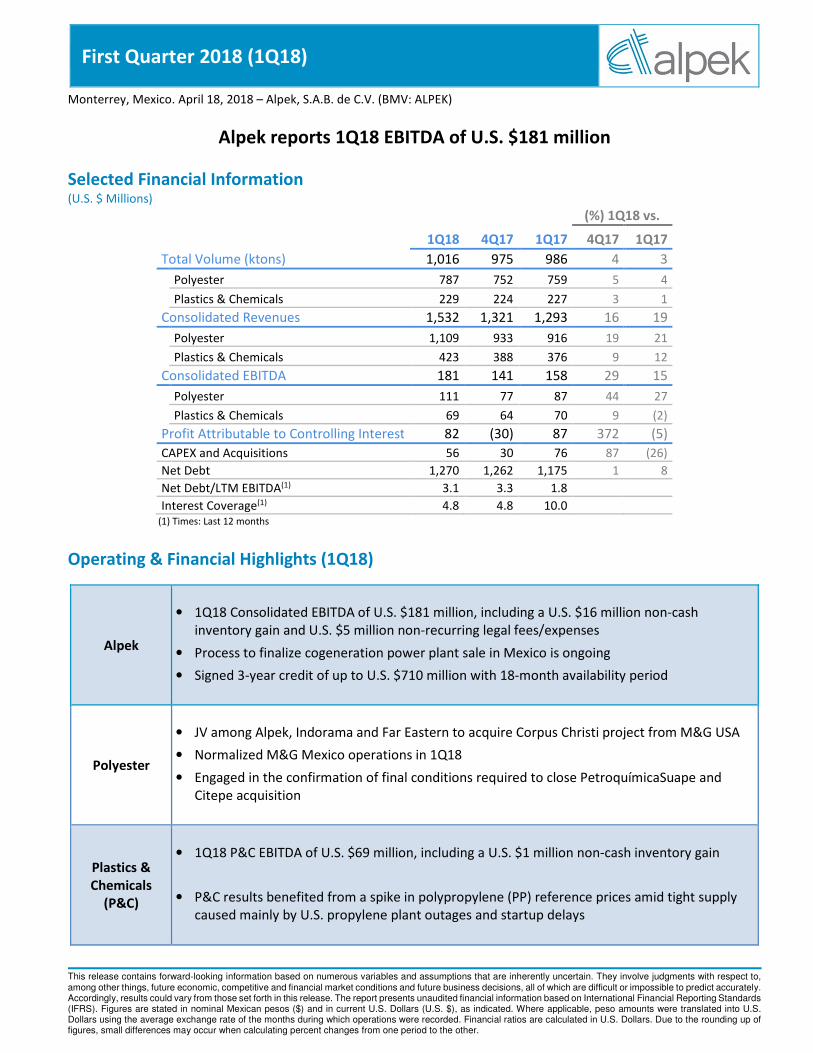
Monterrey, Mexico. April 18, 2018 – Alpek, S.A.B. de C.V. (BMV: ALPEK)
Alpek reports 1Q18 EBITDA of U.S. $181 million
Selected Financial Information (U.S. $ Millions)
(%) 1Q18 vs.
1Q18 4Q17 1Q17 4Q17 1Q17
Total Volume (ktons) 1,016 975 986 4 3
Polyester 787 752 759 5 4
Plastics & Chemicals 229 224 227 3 1
Consolidated Revenues 1,532 1,321 1,293 16 19
Polyester 1,109 933 916 19 21
Plastics & Chemicals 423 388 376 9 12
Consolidated EBITDA 181 141 158 29 15
Polyester 111 77 87 44 27
Plastics & Chemicals 69 64 70 9 (2)
Profit Attributable to Controlling Interest 82 (30) 87 372 (5)
CAPEX and Acquisitions 56 30 76 87 (26)
Net Debt 1,270 1,262 1,175 1 8
Net Debt/LTM EBITDA(1) 3.1 3.3 1.8
Interest Coverage(1) 4.8 4.8 10.0 (1) Times: Last 12 months
Operating & Financial Highlights (1Q18)
Alpek
• 1Q18 Consolidated EBITDA of U.S. $181 million, including a U.S. $16 million non-cash
inventory gain and U.S. $5 million non-recurring legal fees/expenses
• Process to finalize cogeneration power plant sale in Mexico is ongoing
• Signed 3-year credit of up to U.S. $710 million with 18-month availability period
Polyester
• JV among Alpek, Indorama and Far Eastern to acquire Corpus Christi project from M&G USA
• Normalized M&G Mexico operations in 1Q18
• Engaged in the confirmation of final conditions required to close PetroquímicaSuape and
Citepe acquisition
Plastics &
Chemicals
(P&C)
• 1Q18 P&C EBITDA of U.S. $69 million, including a U.S. $1 million non-cash inventory gain
• P&C results benefited from a spike in polypropylene (PP) reference prices amid tight supply
caused mainly by U.S. propylene plant outages and startup delays
First Quarter 2018 (1Q18) |
www.alpek.com 2
Message from the CEO
Alpek’s first quarter 2018 consolidated EBITDA was up 15% versus 1Q17 and 29% higher than 4Q17 driven
mainly by Polyester segment performance. Results reflect a better-than-expected start this year for several relevant
underlying external variables, including higher oil prices, global polyester margin recovery and higher M&G Polímeros
México, S.A. de C.V. (M&G Mexico) PET operating rates, among others.
The average price of Brent crude oil was U.S. $67 per barrel in 1Q18, up 9% versus 4Q17 and U.S. $10 per
barrel higher than Alpek’s 2018 Guidance. Similarly, the average U.S. paraxylene and propylene contract prices
increased 8% quarter-on-quarter. Higher feedstock prices resulted in a U.S. $16 million non-cash inventory gain during
the first quarter.
1Q18 Polyester segment EBITDA was U.S. $111 million, including a U.S. $15 million non-cash inventory gain
and U.S. $5 million in non-recurring legal fees/expenses. Adjusting for these two items, Comparable Polyester EBITDA
was U.S. $102 million, up 48% and 54% when compared with 1Q17 and 4Q17, respectively. Normalized M&G Mexico
PET operations and polyester margin recovery amid a rising feedstock price environment contributed to EBITDA
growth.
M&G Mexico reached normalized PET production levels supported by Alpek through secured financing while
a definitive restructuring plan is presented. Alpek’s priorities in M&G Mexico’s restructuring process are: i) maximizing
the recovery of its claims and ii) maintaining its PTA supply to the restructured entity.
The restructuring process associated to M&G USA’s Corpus Christi project advanced in 1Q18. Corpus Christi
Polymers LLC (CC Polymers), a newly formed joint venture between Alpek, Indorama and Far Eastern, received court
approval to acquire the Corpus Christi project and other related assets from M&G USA. The approved terms imply a
total value of U.S. $1.169 billion in cash and other capital contributions. Each JV partner will contribute up to U.S. $390
million, subject to final adjustments. Alpek’s portion will be reduced by a U.S. $200 million non-cash contribution
associated to its second lien on the Corpus Christi project. In accordance with IFRS, Alpek may recognize its non-cash
contribution as a partial recovery of previous asset impairments upon closing of the transaction, which is subject to
approval by governmental authorities.
Alpek, Indorama and Far Eastern will each have the right to receive one-third of the PTA and PET produced at
the Corpus Christi project upon completion. CC Polymers will obtain additional resources from the three JV partners
to resume the plant’s construction upon closing of the transaction. A cost estimation and timeline for the project will
be announced in due course.
Other relevant events include: i) the acquisition in Brazil of Companhia Petroquímica de Pernambuco
(PetroquímicaSuape) and Companhia Integrada Têxtil de Pernambuco (Citepe) from Petrobras, ii) the sale of our two
cogeneration power plants, and iii) the PET antidumping cases in the United States and Canada.
The transaction with Petrobras received the required regulatory approval from the CADE Court in Brazil during
1Q18. Since then, Alpek has worked closely with Petrobras to ensure that all agreed upon conditions are fulfilled prior
to closing, which is expected before the end of the second quarter.
The process to finalize the sale of our two cogeneration power plants in Mexico is moving forward as the 350
MW Altamira plant’s construction is on track to be completed before year-end. However, issues in the implementation
of regulatory changes in Mexican power tariffs have weighed on timing.
First Quarter 2018 (1Q18) |
www.alpek.com 3
Regarding the PET antidumping cases, the United States Department of Commerce (USDOC) is conducting its
investigations on PET imports from Brazil, Indonesia, Korea, Pakistan and Taiwan. The USDOC is expected to issue its
preliminary determinations and, if applicable, impose provisional duties in 2Q18. Conversely, the Canadian
International Trade Tribunal ruled that PET resin imports from China, India, Oman and Pakistan have not caused injury
and are not threatening to cause injury to the sole Canadian producer. This ruling has been appealed.
1Q18 Capex was U.S. $56 million as progress continued on the investment front. The initial contribution to
CC Polymers for the acquisition of the Corpus Christi project, plus the investment in the Altamira power cogeneration
facility accounted for 70% of Alpek’s first quarter Capex.
Alpek maintains a solid financial position supported by a strong balance sheet and liquidity. At the close of
1Q18, Net Debt totaled U.S. $1.270 billion and Net Debt to EBITDA was 3.1 times or 2.4 times when adjusted for the
U.S. -$113 million M&G A/R provision that affected EBITDA in 3Q17. The balance of Cash and Cash Equivalents was
U.S. $440 million in 1Q18.
Moreover, Alpek signed a 3-year, dollar-denominated, Senior Unsecured Credit Agreement of up to U.S. $710
million with The Bank of Tokyo-Mitsubishi UFJ, Ltd., Citigroup Global Markets Inc., HSBC México, S.A., Institución de
Banca Múltiple, Grupo Financiero HSBC and JPMorgan Chase Bank, N.A. The loan has an 18-month availability period
and can be prepaid at any time in whole or in part without premium or penalty. Net proceeds from the potential sale
of the two power cogeneration plants in Mexico would be used to pay down the loan’s balance at that time. This
provides Alpek with additional financial flexibility to refinance existing short-term debt and temporarily finance the
acquisition of PetroquímicaSuape, Citepe and the Corpus Christi project.
The optimistic outlook we anticipated for the year was reaffirmed by a strong start in 1Q18. First quarter
results are supportive for 2018 EBITDA to be higher than our U.S. $ 569 million Guidance. This will be taken into
consideration when updating our 2018 Guidance in 2Q18 to include pending non-recurrent transactions such as the
acquisition in Brazil and the potential sale of the two power cogeneration plants in Mexico.
First Quarter 2018 (1Q18) |
www.alpek.com 4
Results by Business Segment
Polyester (Purified Terephthalic Acid (PTA), Polyethylene Terephthalate (PET), Polyester fibers – 72% of Alpek’s Net Sales)
Alpek’s first quarter 2018 Polyester revenues were up 21% year-on-year and 19% quarter-on-quarter, driven
by a combination of higher volume and average prices. Average 1Q18 Polyester prices increased 17% and 14% when
compared with 1Q17 and 4Q17, respectively, reflecting the rise in feedstock prices such as paraxylene (Px) and
monoethylene glycol (MEG). The average U.S. contract Px price reached its highest level since 2Q15.
1Q18 Polyester volume was up 4% and 5% when compared with 1Q17 and 4Q17, respectively. Normalized
operations at M&G Mexico and robust demand amid a rising feedstock price environment contributed to Polyester
volume growth.
First quarter 2018 segment EBITDA was U.S. $111 million, including a U.S. $15 million non-cash inventory
gain and U.S. $5 million in non-recurring legal fees/expenses. Adjusting for these two items, Comparable 1Q18
Polyester EBITDA was U.S. $102 million, up 48% and 54% when compared to 1Q17 and 4Q17, respectively. Global
polyester margins continued to recover in 1Q18 from multi-year lows. The reference PTA and PET margins in Asia
reached their highest level since 2011.
Plastics & Chemicals (P&C) (Polypropylene (PP), Expandable Polystyrene (EPS), Caprolactam (CPL), Other products – 28% of Alpek’s Net Sales)
1Q18 P&C revenue increased 12% year-on-year and 9% quarter-on-quarter mainly due to higher average
prices. Average first quarter 2018 P&C prices were up 11% and 6% when compared with 1Q17 and 4Q17, respectively.
Propylene and styrene prices posted a monthly spike in 1Q18.
First quarter 2018 P&C volume was up 1% versus 1Q17 as growth in EPS was partially offset by other P&C
products. When compared to 4Q17, P&C volume increased 3% mainly driven by PP.
Segment EBITDA was U.S. $69 million in 1Q18, including a U.S. $1 million non-cash inventory gain. Adjusting
for the inventory gain, Comparable 1Q18 P&C EBITDA was up 9% and 17% when compared with 1Q17 and 4Q17,
respectively, supported by higher PP margins. PP benefited from a temporary spike in prices amid tight supply caused
mainly by U.S. propylene plant outages and startup delays.
First Quarter 2018 (1Q18) |
www.alpek.com 5
Consolidated Financial Results
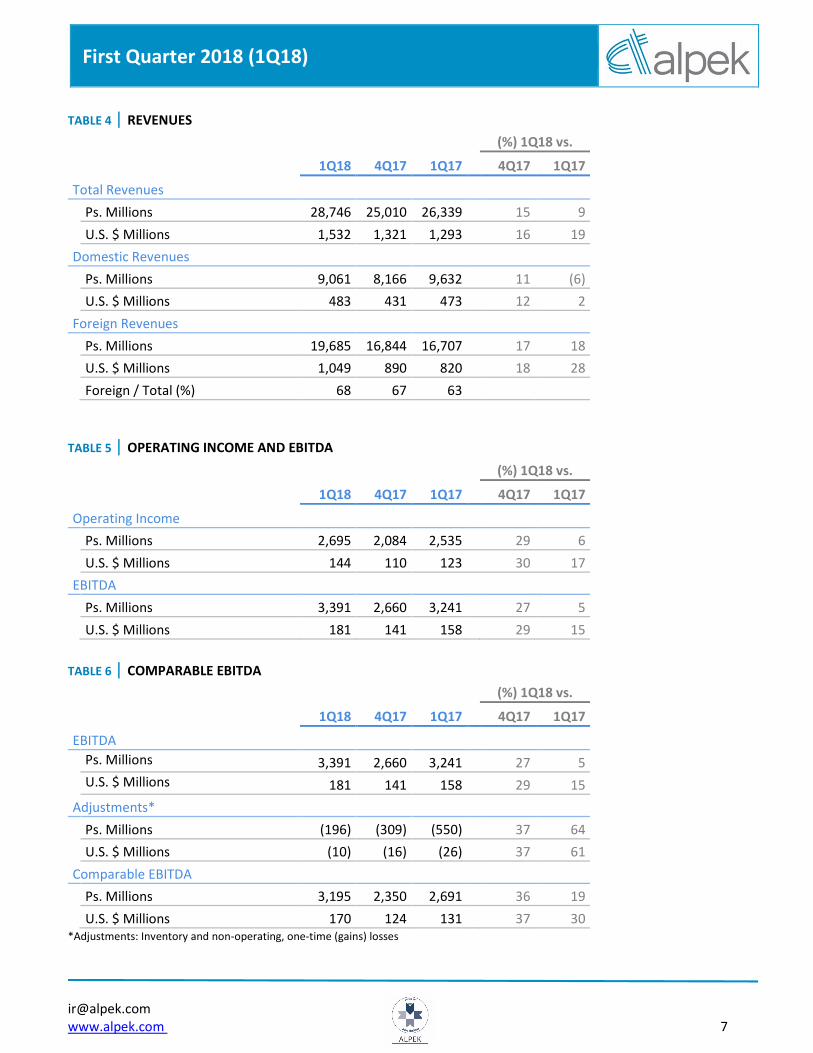
Net Sales: Net Sales for the first quarter totaled U.S. $1.532 billion, up 19% year-on-year and 16% quarter-on-
quarter, mainly due to higher average consolidated prices in both business segments. Average 1Q18 consolidated
prices increased 15% and 11% when compared with 1Q17 and 4Q17, respectively, reflecting the rise in oil and
feedstock prices. 1Q18 consolidated volume was up 3% and 4% year-on-year and quarter-on-quarter, respectively,
supported by growth in Polyester and P&C.
EBITDA: 1Q18 EBITDA was U.S. $181 million, including a U.S. $16 million non-cash inventory gain and U.S. $5 million
in non-recurring legal fees/expenses. Adjusting for these two items, Comparable Consolidated EBITDA was U.S. $170
million, U.S. $124 million and U.S. $131 million in 1Q18, 4Q17 and 1Q17 respectively. Both business segments posted
better-than-expected performance supported by higher oil prices, sustained polyester margin recovery and
normalized operations at M&G Mexico, among others.
Profit (Loss) Attributable to Controlling Interest: Profit Attributable to Controlling Interest for the first
quarter of 2018 was U.S. $82 million, compared to U.S. $87 million and U.S. -$30 million in 1Q17 and 4Q17,
respectively. 1Q18 Profit Attributable to Controlling Interest was 5% lower than 1Q17 which benefited from a higher
non-cash Fx gain.
Capital Expenditures and Acquisitions (Capex): 1Q18 Capex was U.S. $56 million, compared to U.S. $76
million and U.S. $30 million in 1Q17 and 4Q17 respectively. The majority of these funds were invested in the
construction of the Altamira power cogeneration facility and the initial contribution to CC Polymers for the acquisition
of the Corpus Christi project.
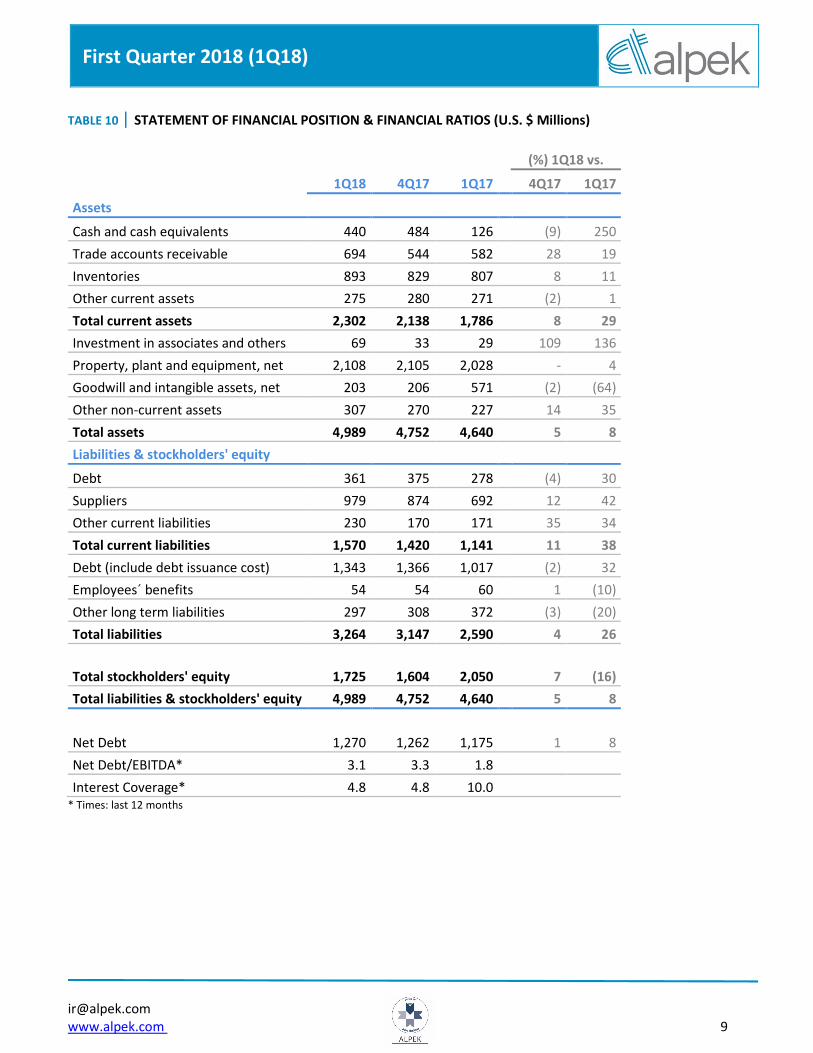
Net Debt: Consolidated Net Debt as of March 31, 2018 was U.S. $1.270 billion, up 8% and 1% versus 1Q17 and
4Q17, respectively. On an absolute basis, Net Debt increased U.S. $7 million year-to-date. As of March 31, 2018,
Gross Debt was U.S. $1.709 billion and Cash totaled U.S. $440 million. Financial ratios at the close of 1Q18 were: Net
Debt to EBITDA of 3.1 times and Interest Coverage of 4.8 times. Adjusting for the U.S. -$113 million M&G A/R
provision in 3Q17, Net Debt to EBITDA was 2.4 times and Interest Coverage was 6.1 times.

First Quarter 2018 (1Q18) |
www.alpek.com 6
Appendix A - Tables
TABLE 1 | VOLUME (KTONS)
(%) 1Q18 vs.
1Q18 4Q17 1Q17 4Q17 1Q17
Total Volume 1,016 975 986 4 3
Polyester 787 752 759 5 4
Plastics and Chemicals 229 224 227 3 1
TABLE 2 | PRICE CHANGES (%)
(%) 1Q18 vs.
4Q17 1Q17
Polyester
Avg. Ps. Prices 13 8
Avg. U.S. $ Prices 14 17
Plastics and Chemicals
Avg. Ps. Prices 5 3
Avg. U.S. $ Prices 6 11
Total
Avg. Ps. Prices 10 6
Avg. U.S. $ Prices 11 15
TABLE 3 | INCOME STATEMENT (U.S. $ Millions)
(%) 1Q18 vs.
1Q18 4Q17 1Q17 4Q17 1Q17
Total Revenues 1,532 1,321 1,293 16 19
Gross Profit 203 162 171 25 18
Operating expenses and others (59) (52) (48) (13) (23)
Operating income 144 110 123 30 17
Financial result, net (5) (68) 17 93 (129)
Equity in income of assoc. and JV - - - - -
Income Tax (35) (62) (34) 43 (5)
Consolidated net income 103 (20) 106 613 (3)
Controlling Interest 82 (30) 87 372 (5)
First Quarter 2018 (1Q18) |
www.alpek.com 7
TABLE 4 | REVENUES
(%) 1Q18 vs.
1Q18 4Q17 1Q17 4Q17 1Q17
Total Revenues
Ps. Millions 28,746 25,010 26,339 15 9
U.S. $ Millions 1,532 1,321 1,293 16 19
Domestic Revenues
Ps. Millions 9,061 8,166 9,632 11 (6)
U.S. $ Millions 483 431 473 12 2
Foreign Revenues
Ps. Millions 19,685 16,844 16,707 17 18
U.S. $ Millions 1,049 890 820 18 28
Foreign / Total (%) 68 67 63
TABLE 5 | OPERATING INCOME AND EBITDA
(%) 1Q18 vs.
1Q18 4Q17 1Q17 4Q17 1Q17
Operating Income
Ps. Millions 2,695 2,084 2,535 29 6
U.S. $ Millions 144 110 123 30 17
EBITDA
Ps. Millions 3,391 2,660 3,241 27 5
U.S. $ Millions 181 141 158 29 15
TABLE 6 | COMPARABLE EBITDA
(%) 1Q18 vs.
1Q18 4Q17 1Q17 4Q17 1Q17
EBITDA
Ps. Millions 3,391 2,660 3,241 27 5
U.S. $ Millions 181 141 158 29 15
Adjustments*
Ps. Millions (196) (309) (550) 37 64
U.S. $ Millions (10) (16) (26) 37 61
Comparable EBITDA
Ps. Millions 3,195 2,350 2,691 36 19
U.S. $ Millions 170 124 131 37 30 *Adjustments: Inventory and non-operating, one-time (gains) losses

First Quarter 2018 (1Q18) |
www.alpek.com 8
TABLE 7 | FINANCIAL RESULT, NET (U.S. $ Millions)
(%) 1Q18 vs.
1Q18 4Q17 1Q17 4Q17 1Q17
Financial Expenses (23) (23) (18) - (31)
Financial Income 6 2 4 213 58
Financial Expenses, Net (17) (21) (14) 18 (24)
Fx Gains (Losses) 13 (47) 31 127 (59)
Financial Result, Net (5) (68) 17 93 (129)
TABLE 8 | NET INCOME (U.S. $ Millions)
(%) 1Q18 vs.
1Q18 4Q17 1Q17 4Q17 1Q17
Consolidated Net Income 103 (20) 106 613 (3)
Non-Controlling Interest 21 10 19 103 9
Controlling Interest 82 (30) 87 372 (5)
Earnings per Share (U.S. Dollars) 0.04 (0.01) 0.04 372 (5)
Avg. Outstanding Shares (Millions)* 2,117 2,117 2,117 * The same number of equivalent shares are considered in the periods presented
TABLE 9 | CASH FLOW (U.S. $ Millions)
(%) 1Q18 vs.
1Q18 4Q17 1Q17 4Q17 1Q17
EBITDA 181 141 158 29 15
Net Working Capital & Others (85) (37) (64) (127) (31)
Capital Expenditures & Acq. (56) (30) (76) (87) 26
Financial Expenses (22) (22) (16) (1) (39)
Income tax (7) (9) (27) 20 72
Dividends - (7) (88) 100 100
Payment affiliated companies - - - - -
Other Sources / Uses (18) (105) (20) 83 12
Decrease (Increase) in Net Debt (7) (70) (134) 90 95
First Quarter 2018 (1Q18) |
www.alpek.com 9
TABLE 10 | STATEMENT OF FINANCIAL POSITION & FINANCIAL RATIOS (U.S. $ Millions)
(%) 1Q18 vs.
1Q18 4Q17 1Q17 4Q17 1Q17
Assets
Cash and cash equivalents 440 484 126 (9) 250
Trade accounts receivable 694 544 582 28 19
Inventories 893 829 807 8 11
Other current assets 275 280 271 (2) 1
Total current assets 2,302 2,138 1,786 8 29
Investment in associates and others 69 33 29 109 136
Property, plant and equipment, net 2,108 2,105 2,028 - 4
Goodwill and intangible assets, net 203 206 571 (2) (64)
Other non-current assets 307 270 227 14 35
Total assets 4,989 4,752 4,640 5 8
Liabilities & stockholders' equity
Debt 361 375 278 (4) 30
Suppliers 979 874 692 12 42
Other current liabilities 230 170 171 35 34
Total current liabilities 1,570 1,420 1,141 11 38
Debt (include debt issuance cost) 1,343 1,366 1,017 (2) 32
Employees´ benefits 54 54 60 1 (10)
Other long term liabilities 297 308 372 (3) (20)
Total liabilities 3,264 3,147 2,590 4 26
Total stockholders' equity 1,725 1,604 2,050 7 (16)
Total liabilities & stockholders' equity 4,989 4,752 4,640 5 8
Net Debt 1,270 1,262 1,175 1 8
Net Debt/EBITDA* 3.1 3.3 1.8
Interest Coverage* 4.8 4.8 10.0 * Times: last 12 months

First Quarter 2018 (1Q18) |
www.alpek.com 10
Polyester
TABLE 11 | REVENUES
(%) 1Q18 vs.
1Q18 4Q17 1Q17 4Q17 1Q17
Total Revenues
Ps. Millions 20,811 17,668 18,670 18 11
U.S. $ Millions 1,109 933 916 19 21
Domestic Revenues
Ps. Millions 4,223 3,679 5,006 15 (16)
U.S. $ Millions 225 194 246 16 (8)
Foreign Revenues
Ps. Millions 16,588 13,989 13,663 19 21
U.S. $ Millions 884 739 670 20 32
Foreign / Total (%) 80 79 73
TABLE 12 | OPERATING INCOME AND EBITDA
(%) 1Q18 vs.
1Q18 4Q17 1Q17 4Q17 1Q17
Operating Income
Ps. Millions 1,538 1,022 1,253 50 23
U.S. $ Millions 82 54 61 52 35
EBITDA
Ps. Millions 2,091 1,467 1,794 43 17
U.S. $ Millions 111 77 87 44 27
TABLE 13 | COMPARABLE EBITDA
(%) 1Q18 vs.
1Q18 4Q17 1Q17 4Q17 1Q17
EBITDA
Ps. Millions 2,091 1,467 1,794 43 17
U.S. $ Millions 111 77 87 44 27
Adjustments*
Ps. Millions (185) (215) (395) 14 53
U.S. $ Millions (10) (11) (19) 13 48
Comparable EBITDA
Ps. Millions 1,905 1,252 1,399 52 36
U.S. $ Millions 102 66 69 54 48 *Adjustments: Inventory and non-operating, one-time (gains) losses
First Quarter 2018 (1Q18) |
www.alpek.com 11
Plastics & Chemicals
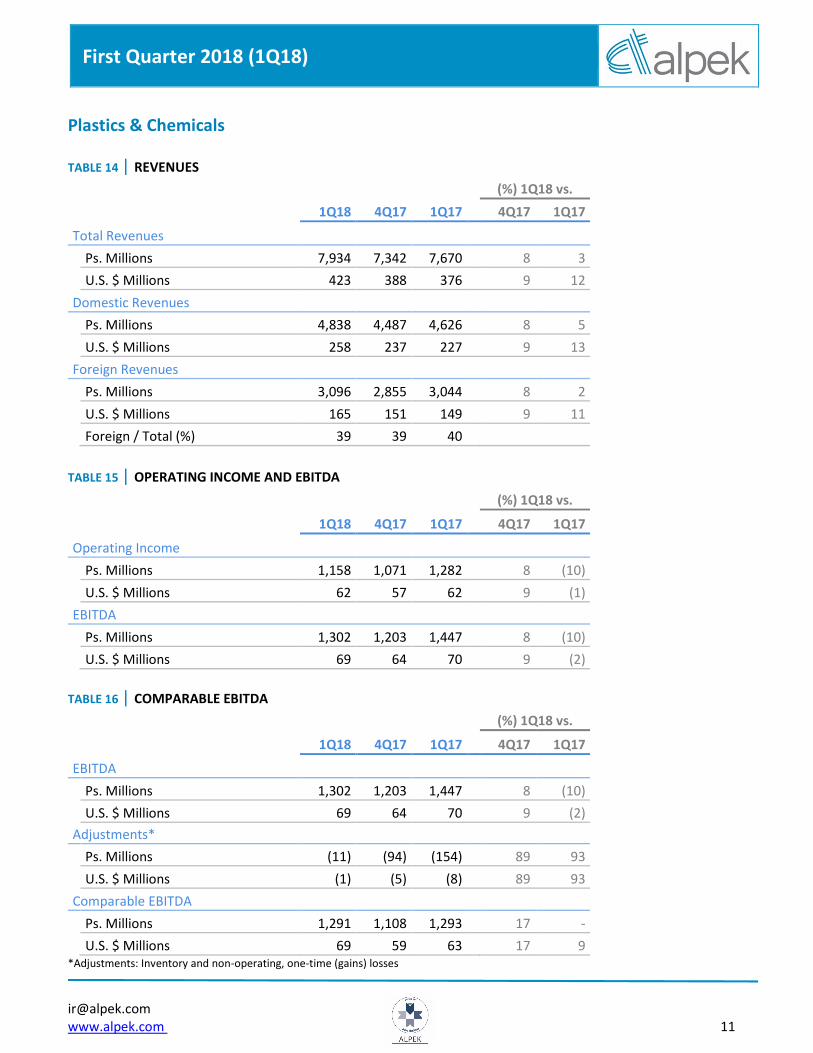
TABLE 14 | REVENUES
(%) 1Q18 vs.
1Q18 4Q17 1Q17 4Q17 1Q17
Total Revenues
Ps. Millions 7,934 7,342 7,670 8 3
U.S. $ Millions 423 388 376 9 12
Domestic Revenues
Ps. Millions 4,838 4,487 4,626 8 5
U.S. $ Millions 258 237 227 9 13
Foreign Revenues
Ps. Millions 3,096 2,855 3,044 8 2
U.S. $ Millions 165 151 149 9 11
Foreign / Total (%) 39 39 40
TABLE 15 | OPERATING INCOME AND EBITDA
(%) 1Q18 vs.
1Q18 4Q17 1Q17 4Q17 1Q17
Operating Income
Ps. Millions 1,158 1,071 1,282 8 (10)
U.S. $ Millions 62 57 62 9 (1)
EBITDA
Ps. Millions 1,302 1,203 1,447 8 (10)
U.S. $ Millions 69 64 70 9 (2)
TABLE 16 | COMPARABLE EBITDA
(%) 1Q18 vs.
1Q18 4Q17 1Q17 4Q17 1Q17
EBITDA
Ps. Millions 1,302 1,203 1,447 8 (10)
U.S. $ Millions 69 64 70 9 (2)
Adjustments*
Ps. Millions (11) (94) (154) 89 93
U.S. $ Millions (1) (5) (8) 89 93
Comparable EBITDA
Ps. Millions 1,291 1,108 1,293 17 -
U.S. $ Millions 69 59 63 17 9 *Adjustments: Inventory and non-operating, one-time (gains) losses
First Quarter 2018 (1Q18) |
www.alpek.com 12
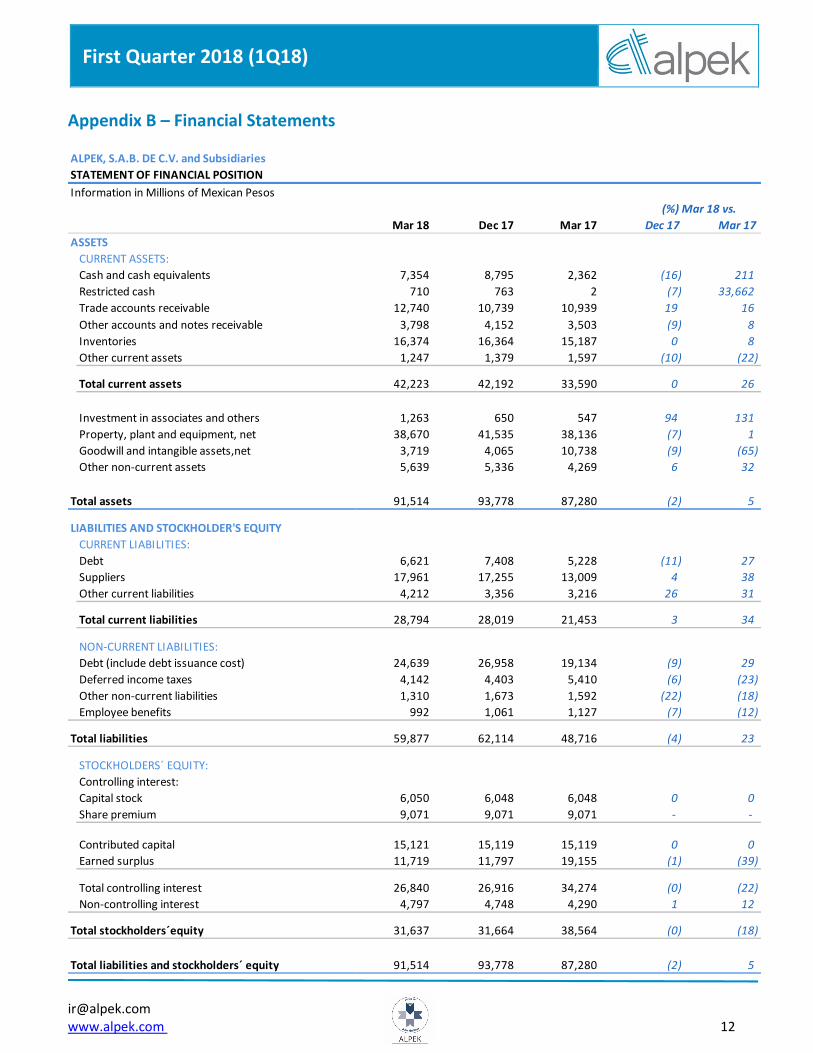
Appendix B – Financial Statements
Mar 18 Dec 17 Mar 17 Dec 17 Mar 17
ASSETS
CURRENT ASSETS:
Cash and cash equivalents 7,354 8,795 2,362 (16) 211
Restricted cash 710 763 2 (7) 33,662
Trade accounts receivable 12,740 10,739 10,939 19 16
Other accounts and notes receivable 3,798 4,152 3,503 (9) 8
Inventories 16,374 16,364 15,187 0 8
Other current assets 1,247 1,379 1,597 (10) (22)
Total current assets 42,223 42,192 33,590 0 26
Investment in associates and others 1,263 650 547 94 131
Property, plant and equipment, net 38,670 41,535 38,136 (7) 1
Goodwill and intangible assets,net 3,719 4,065 10,738 (9) (65)
Other non-current assets 5,639 5,336 4,269 6 32
Total assets 91,514 93,778 87,280 (2) 5
LIABILITIES AND STOCKHOLDER'S EQUITY
CURRENT LIABILITIES:
Debt 6,621 7,408 5,228 (11) 27
Suppliers 17,961 17,255 13,009 4 38
Other current liabilities 4,212 3,356 3,216 26 31
Total current liabilities 28,794 28,019 21,453 3 34
NON-CURRENT LIABILITIES:
Debt (include debt issuance cost) 24,639 26,958 19,134 (9) 29
Deferred income taxes 4,142 4,403 5,410 (6) (23)
Other non-current liabilities 1,310 1,673 1,592 (22) (18)
Employee benefits 992 1,061 1,127 (7) (12)
Total liabilities 59,877 62,114 48,716 (4) 23
STOCKHOLDERS´ EQUITY:
Controlling interest:
Capital stock 6,050 6,048 6,048 0 0
Share premium 9,071 9,071 9,071 - -
Contributed capital 15,121 15,119 15,119 0 0
Earned surplus 11,719 11,797 19,155 (1) (39)
Total controlling interest 26,840 26,916 34,274 (0) (22)
Non-controlling interest 4,797 4,748 4,290 1 12
Total stockholders´equity 31,637 31,664 38,564 (0) (18)
Total liabilities and stockholders´ equity 91,514 93,778 87,280 (2) 5
(%) Mar 18 vs.
STATEMENT OF FINANCIAL POSITION
Information in Millions of Mexican Pesos
ALPEK, S.A.B. DE C.V. and Subsidiaries
First Quarter 2018 (1Q18) |
www.alpek.com 13
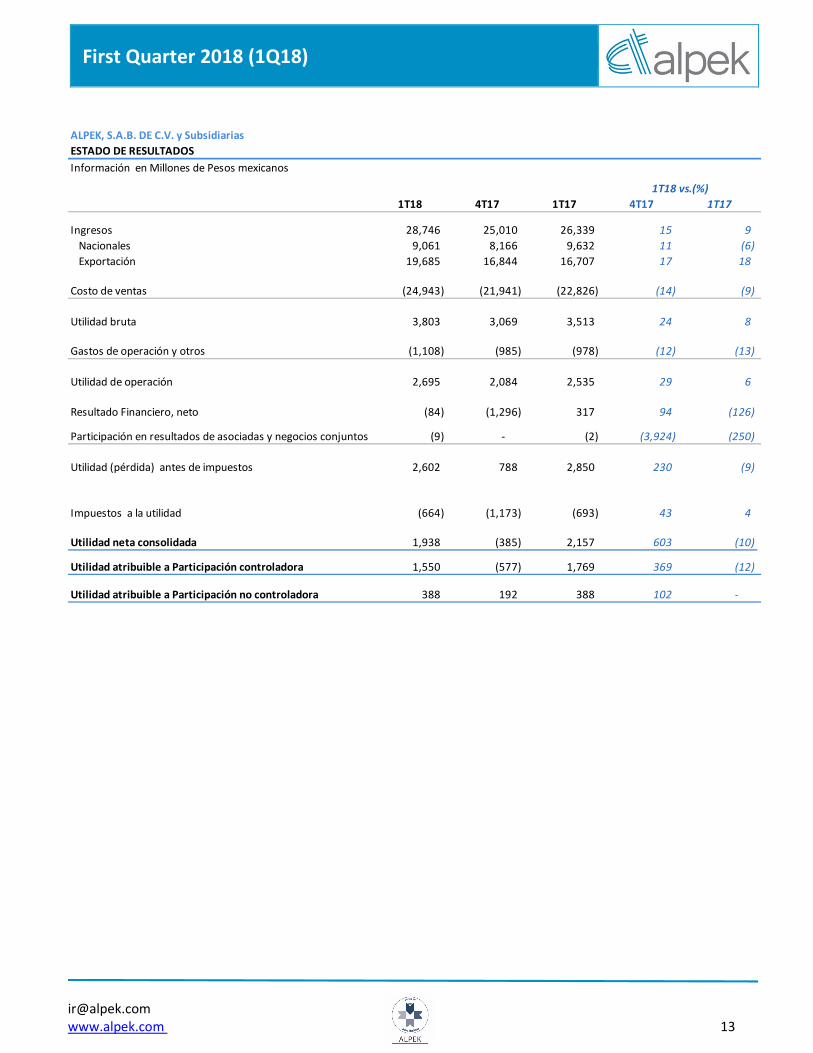
ALPEK, S.A.B. DE C.V. y Subsidiarias
Información en Millones de Pesos mexicanos
1T18 4T17 1T17 4T17 1T17
Ingresos 28,746 25,010 26,339 15 9
Nacionales 9,061 8,166 9,632 11 (6)
Exportación 19,685 16,844 16,707 17 18
Costo de ventas (24,943) (21,941) (22,826) (14) (9)
Utilidad bruta 3,803 3,069 3,513 24 8
Gastos de operación y otros (1,108) (985) (978) (12) (13)
Utilidad de operación 2,695 2,084 2,535 29 6
Resultado Financiero, neto (84) (1,296) 317 94 (126)
Participación en resultados de asociadas y negocios conjuntos (9) - (2) (3,924) (250)
Utilidad (pérdida) antes de impuestos 2,602 788 2,850 230 (9)
Impuestos a la utilidad (664) (1,173) (693) 43 4
Utilidad neta consolidada 1,938 (385) 2,157 603 (10)
Utilidad atribuible a Participación controladora 1,550 (577) 1,769 369 (12)
Utilidad atribuible a Participación no controladora 388 192 388 102 -
ESTADO DE RESULTADOS
1T18 vs.(%)

April 18, 2018 1
}
Nemak reports 1Q18 results
- Quarterly revenues and EBITDA of US$1.2 billion and US$197 million, respectively
- New contracts awarded to Nemak for US$110 million in annual revenues
Monterrey, Mexico. April 18, 2018. - Nemak, S.A.B. de C.V. (“Nemak”) (BMV: NEMAK), a leading provider of innovative lightweighting solutions for the global automotive industry, announced today its operational and financial results for the first quarter of 2018 ("1Q18"). What follows is an overview of the quarter’s main highlights:
Key Figures
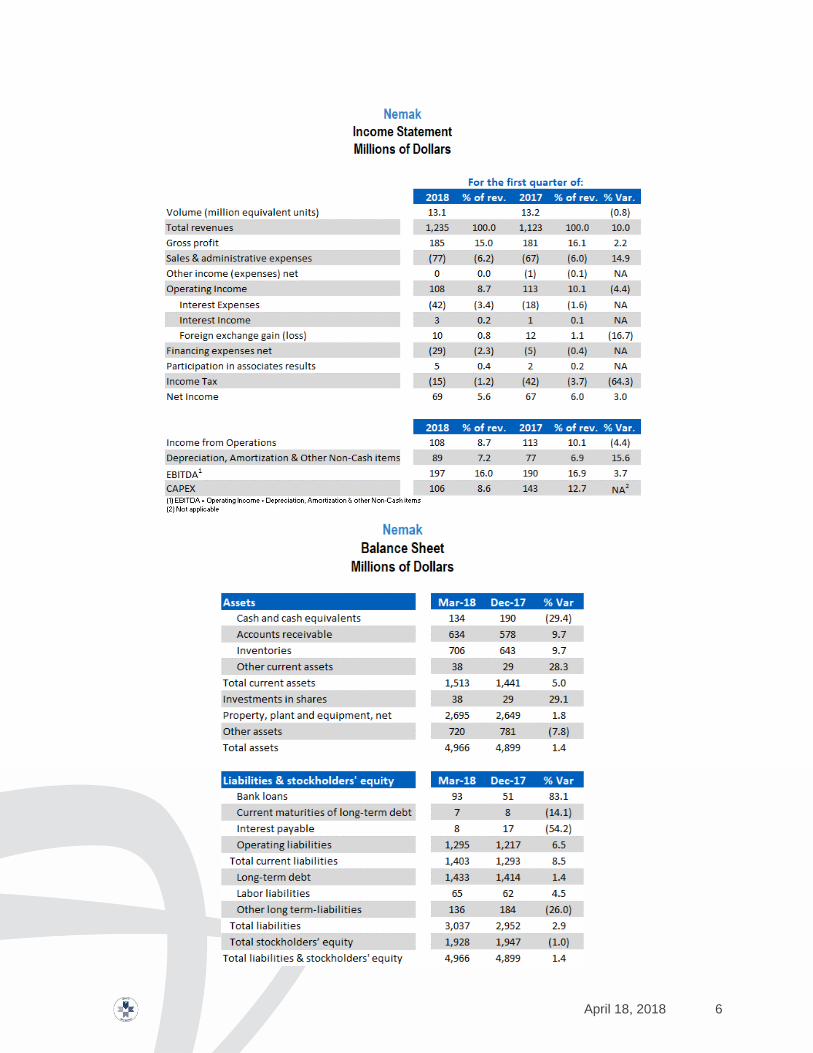
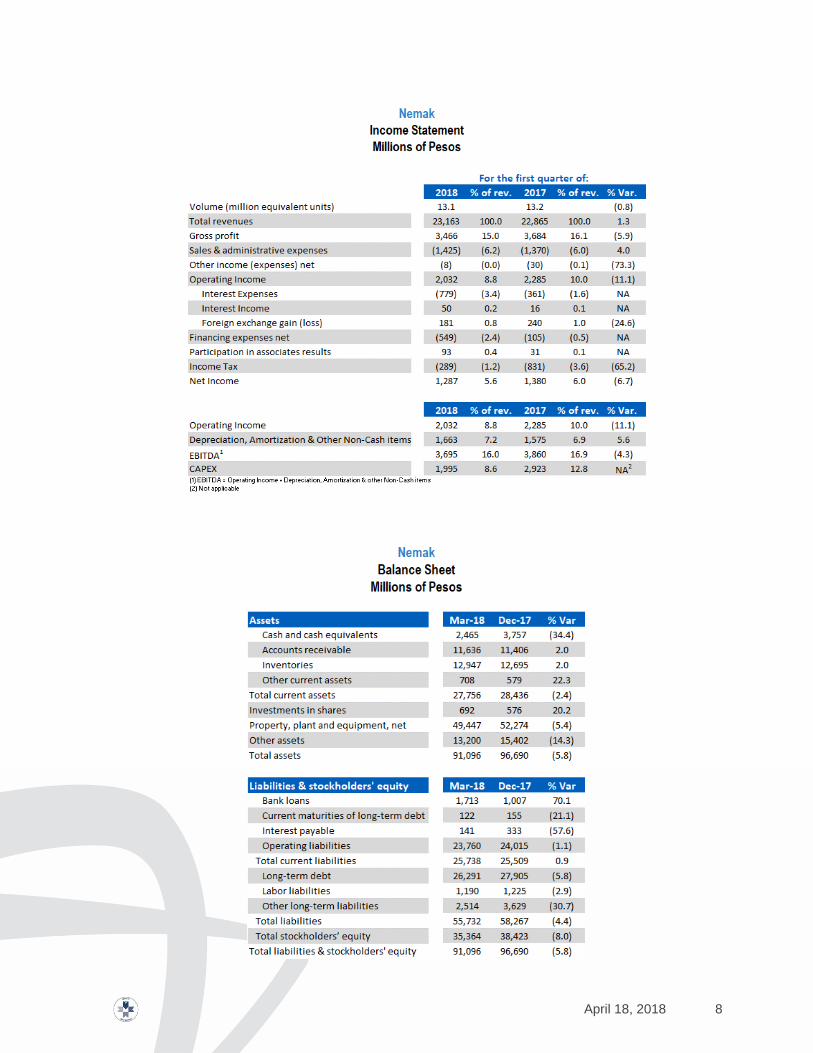
For 1Q18, volumes were 13.1 million equivalent units ("MEU"), 0.8% lower than the 1Q17 figure. North America ("NA") reported growth, while Europe ("EU") showed less volumes year-on-year ("y-o-y"), and Rest of World ("RoW") remained flat. These figures notwithstanding, revenues were US$1,235 million, up 10.0% y-o-y due to the appreciation of the euro against the US dollar and higher average aluminum prices.
1Q18 EBITDA was US$197 million, a 3.7% y-o-y increase. Results benefited from operational efficiencies and increased sales of higher value-added products, together with a less adverse impact from "metal price lag" (effect associated with the delay in passing on aluminum price changes to customers, as stipulated in the company’s contracts) than in 1Q17 and currency effects.
1Q18 capex was US$106 million as Nemak continued investing to meet increased future demand related to recently awarded contracts across its main product lines.
Message from the CEO
We delivered improved results this quarter, thanks to the implementation of cost-reduction initiatives and increased sales of higher value-added products, among other factors. In particular, our North America operation made a positive contribution, as benefits associated with the continued ramp-up of new, high-volume powertrain programs outweighed the impact of lower overall customer demand in the region.
I am also pleased to share that we won new business in structural and electric vehicle components (SC/EV) worth US$50 million in annual revenues, bringing our total order book in this segment to
April 18, 2018 2
approximately US$370 million in annual revenues. These contracts represented several milestones for the company, including: 1) first contract with a leading Asian battery manufacturer for SC/EV; 2) first contract for a mass-market German EV platform; and 3) first program to supply pure electric applications in North America. With the support of a dedicated global organization and top talent, I am confident that we are well positioned to continue growing and reinforcing our competitive position in SC/EV into the future.
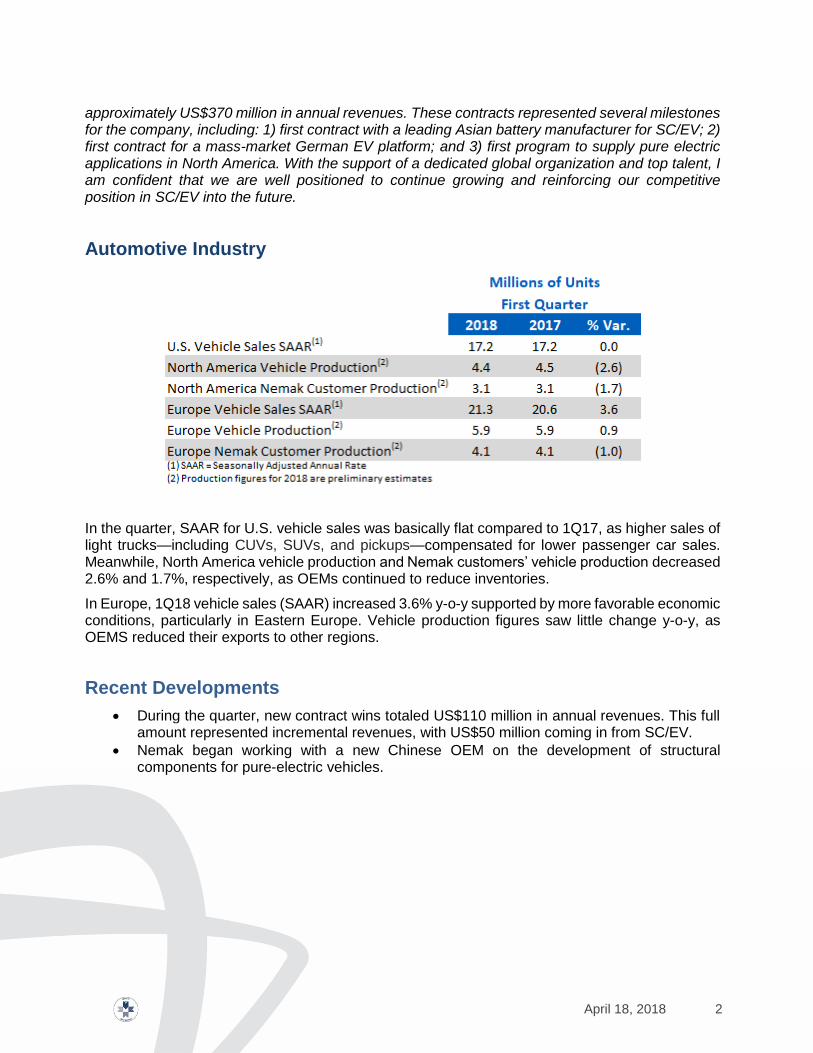
Automotive Industry
In the quarter, SAAR for U.S. vehicle sales was basically flat compared to 1Q17, as higher sales of light trucks—including CUVs, SUVs, and pickups—compensated for lower passenger car sales. Meanwhile, North America vehicle production and Nemak customers’ vehicle production decreased 2.6% and 1.7%, respectively, as OEMs continued to reduce inventories.
In Europe, 1Q18 vehicle sales (SAAR) increased 3.6% y-o-y supported by more favorable economic conditions, particularly in Eastern Europe. Vehicle production figures saw little change y-o-y, as OEMS reduced their exports to other regions.
Recent Developments
During the quarter, new contract wins totaled US$110 million in annual revenues. This full amount represented incremental revenues, with US$50 million coming in from SC/EV.
Nemak began working with a new Chinese OEM on the development of structural components for pure-electric vehicles.

April 18, 2018 3
Financial Results Summary
What follows is an explanation of the results shown in the table above:
1Q18 total volume decreased by 0.8% y-o-y, as higher sales in NA were not enough to offset declines in EU. NA volumes went up reflecting mainly the continued ramp-up of new programs for V6 engine applications. In EU, Nemak´s volumes declined mainly due to lower sales to diesel vehicles which more than offset higher sales to gasoline vehicles during the period. And, 1Q18 RoW volumes were flat as a decrease in China was offset with gains in South America.
Turning to revenues, the appreciation of the euro against the US dollar and higher aluminum prices drove Nemak´s 1Q18 consolidated revenues up 10.0% y-o-y. Meanwhile, 1Q18 operating income decreased 4.4% y-o-y as a result of several contrasting effects: on the one hand, Nemak benefited from operational efficiencies, increased sales of higher value-added products, a less adverse impact from metal price lag than in 1Q17, and currency effects. On the other hand, higher depreciation and amortization and a slight increase in launching expenses more than offset the above-mentioned benefits. Lower operating income translated into an operating margin of 8.7% in 1Q18, 130 basis points below 1Q17.
Despite the above-mentioned decrease in operating income, 1Q18 EBITDA was 3.7% higher y-o-y due mainly to the positive effects described above. 1Q18 EBITDA per equivalent unit was US$15.0, up from US$14.4 in 1Q17.
1Q18 net income increased 3.0% compared to 1Q17 as the effect of items mentioned above together with extraordinary expenses related to new debt issuance were more than offset by lower deferred taxes.
Capital expenditures totaled US$106 million during 1Q18. As explained, investments were made to support new program launches and to drive operational efficiency across the company’s regions.
As of March 31, 2018, Nemak reported Net Debt in the amount of US$1.4 billion. Financial ratios were: Debt, net of Cash, to EBITDA, 1.9 times; and Interest Coverage, 8.4 times. These ratios were slightly higher and lower than those reported at the end of March 2017, respectively.
April 18, 2018 4
Regional Results
North America
In 1Q18, revenues increased 7.5% y-o-y due to a combination of higher aluminum prices and higher volumes. In turn, EBITDA increased 4.3%, due mainly to increased sales of higher value-added products, operational efficiencies, and a less adverse impact from metal price lag.
Europe
In 1Q18, revenues increased 13.6% y-o-y driven by currency effects and higher aluminum prices. Meanwhile, 1Q18 EBITDA increased 9.4 % y-o-y, as operational efficiencies and FX gains more than offset the negative impact of lower volumes.
Rest of the World (RoW)
In 1Q18, revenues in RoW increased by 10.0% y-o-y mainly due to higher aluminum prices. However, EBITDA for the period was down US$4 million due mainly to a combination of lower customer production in China and higher launching expenses in South America.
------------------
April 18, 2018 5
Methodology for presentation of results
The report presents unaudited financial information. Figures are in Mexican pesos or US dollars, as indicated. For income statements, peso amounts were translated into dollars using the average exchange rate of the months during which the operations were recorded. For balance sheets, peso amounts were translated into dollars using the end-of-period exchange rate. Financial ratios were calculated in dollars. Due to rounding, small differences may occur when calculating percent changes from one period to another.
Conference call information
Nemak’s First Quarter 2018 Conference Call will be held on Thursday, April 19, 2018, 11:30 a.m. Eastern Time (10:30 a.m. Mexico City Time). To participate in the conference call, please dial: Domestic U.S.: (877) 407-0784; International: 1-201-689-8560; Mexico Toll Free: 01 800 522 0034. The conference call will be webcast live through streaming audio. If you are unable to participate, the conference call audio and script will be available on Nemak’s website. For more information, please visit investors.nemak.com
Forward-looking statements
This report may contain certain forward-looking statements concerning Nemak’s future performance that should be considered as good faith estimates made by the Company. These forward-looking statements reflect management’s expectations and are based upon currently available data and analysis. Actual results are subject to future events and uncertainties, which could materially impact Nemak’s actual performance and results.
About Nemak
Nemak is a leading provider of innovative lightweighting solutions for the global automotive industry, specializing in the development and manufacturing of aluminum components for powertrain and body structure applications. The company employs more than 22,000 people at 38 facilities worldwide. In 2017, it generated revenues of US$4.5 billion. For more information about Nemak, visit http://www.nemak.com
Three pages of tables to follow
April 18, 2018 6

April 18, 2018 7
April 18, 2018 8
Restricted Internal Use
YTD
In millions 4Q17 1Q17 D%
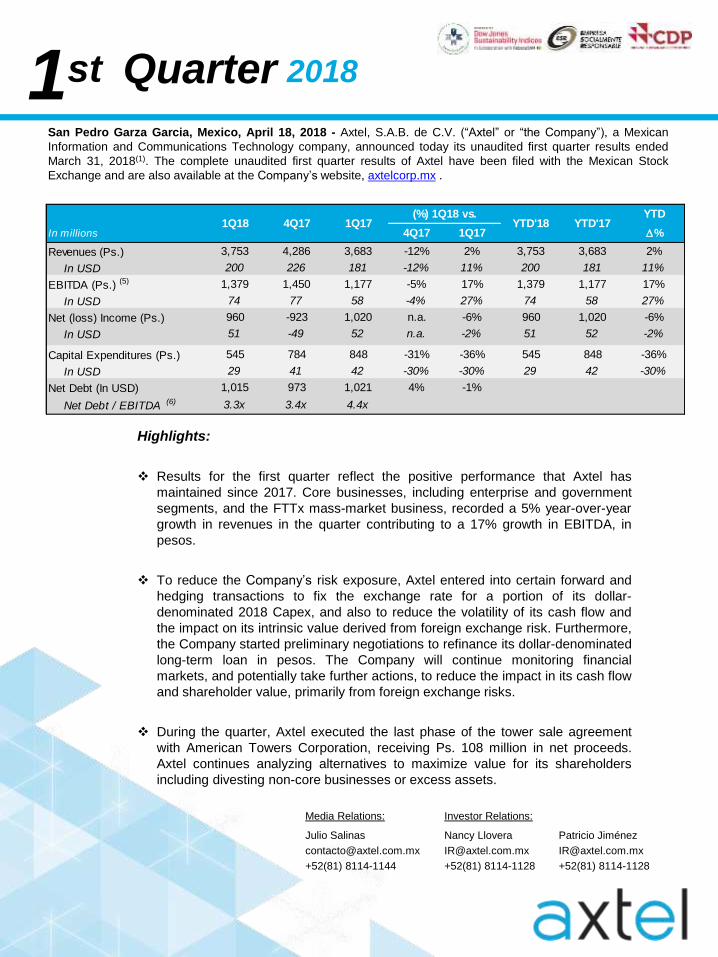
Revenues (Ps.) 3,753 4,286 3,683 -12% 2% 3,753 3,683 2%
In USD 200 226 181 -12% 11% 200 181 11%
EBITDA (Ps.) (5) 1,379 1,450 1,177 -5% 17% 1,379 1,177 17%
In USD 74 77 58 -4% 27% 74 58 27%
Net (loss) Income (Ps.) 960 -923 1,020 n.a. -6% 960 1,020 -6%
In USD 51 -49 52 n.a. -2% 51 52 -2%
Capital Expenditures (Ps.) 545 784 848 -31% -36% 545 848 -36%
In USD 29 41 42 -30% -30% 29 42 -30%
Net Debt (In USD) 1,015 973 1,021 4% -1%
Net Debt / EBITDA (6) 3.3x 3.4x 4.4x
YTD'18 YTD'171Q18 1Q174Q17(%) 1Q18 vs.
Investor Relations:
Nancy Llovera
+52(81) 8114-1128
1st 2018Quarter
Media Relations:
Julio Salinas
+52(81) 8114-1144
Patricio Jiménez
+52(81) 8114-1128
San Pedro Garza Garcia, Mexico, April 18, 2018 - Axtel, S.A.B. de C.V. (“Axtel” or “the Company”), a Mexican
Information and Communications Technology company, announced today its unaudited first quarter results ended
March 31, 2018(1). The complete unaudited first quarter results of Axtel have been filed with the Mexican Stock
Exchange and are also available at the Company’s website, axtelcorp.mx .
Highlights:
Results for the first quarter reflect the positive performance that Axtel has
maintained since 2017. Core businesses, including enterprise and government
segments, and the FTTx mass-market business, recorded a 5% year-over-year
growth in revenues in the quarter contributing to a 17% growth in EBITDA, in
pesos.
To reduce the Company’s risk exposure, Axtel entered into certain forward and
hedging transactions to fix the exchange rate for a portion of its dollar-
denominated 2018 Capex, and also to reduce the volatility of its cash flow and
the impact on its intrinsic value derived from foreign exchange risk. Furthermore,
the Company started preliminary negotiations to refinance its dollar-denominated
long-term loan in pesos. The Company will continue monitoring financial
markets, and potentially take further actions, to reduce the impact in its cash flow
and shareholder value, primarily from foreign exchange risks.
During the quarter, Axtel executed the last phase of the tower sale agreement
with American Towers Corporation, receiving Ps. 108 million in net proceeds.
Axtel continues analyzing alternatives to maximize value for its shareholders
including divesting non-core businesses or excess assets.
Restricted Internal Use
YTD
In million USD 4Q17 1Q17 D%
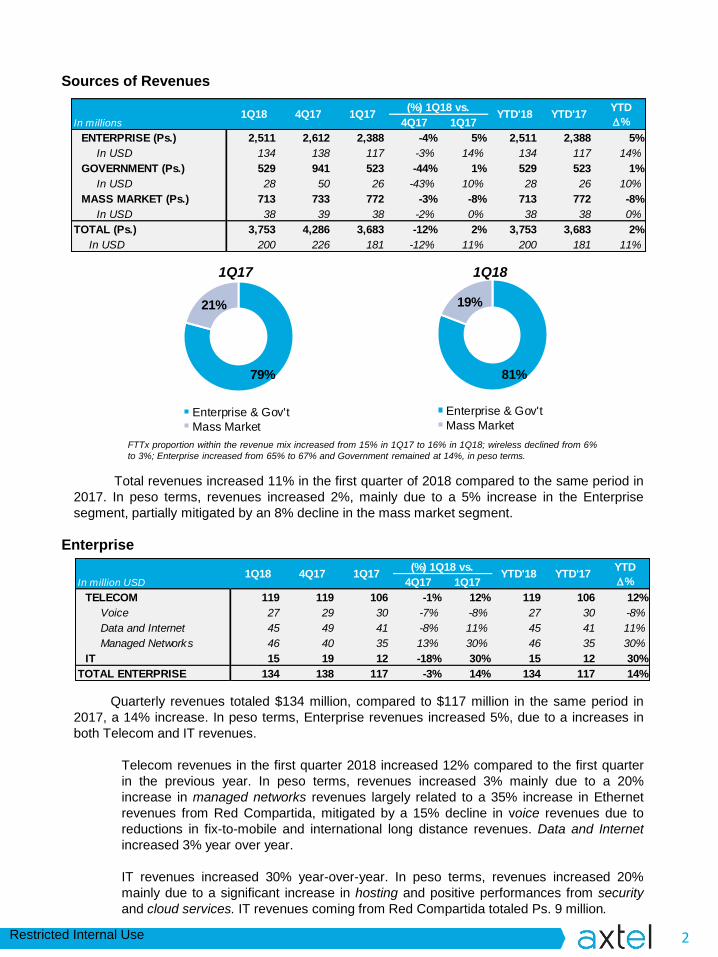
TELECOM 119 119 106 -1% 12% 119 106 12%
Voice 27 29 30 -7% -8% 27 30 -8%
Data and Internet 45 49 41 -8% 11% 45 41 11%
Managed Networks 46 40 35 13% 30% 46 35 30%
IT 15 19 12 -18% 30% 15 12 30%
TOTAL ENTERPRISE 134 138 117 -3% 14% 134 117 14%
(%) 1Q18 vs.YTD'18 YTD'171Q18 4Q17 1Q17
81%
19%
Enterprise & Gov't
Mass Market
79%
21%
Enterprise & Gov't
Mass Market
YTD
In millions 4Q17 1Q17 D%
ENTERPRISE (Ps.) 2,511 2,612 2,388 -4% 5% 2,511 2,388 5%
In USD 134 138 117 -3% 14% 134 117 14%
GOVERNMENT (Ps.) 529 941 523 -44% 1% 529 523 1%
In USD 28 50 26 -43% 10% 28 26 10%
MASS MARKET (Ps.) 713 733 772 -3% -8% 713 772 -8%
In USD 38 39 38 -2% 0% 38 38 0%
TOTAL (Ps.) 3,753 4,286 3,683 -12% 2% 3,753 3,683 2%
In USD 200 226 181 -12% 11% 200 181 11%
YTD'18 YTD'17(%) 1Q18 vs.
1Q18 4Q17 1Q17
2
Sources of Revenues
Quarterly revenues totaled $134 million, compared to $117 million in the same period in
2017, a 14% increase. In peso terms, Enterprise revenues increased 5%, due to a increases in
both Telecom and IT revenues.
Telecom revenues in the first quarter 2018 increased 12% compared to the first quarter
in the previous year. In peso terms, revenues increased 3% mainly due to a 20%
increase in managed networks revenues largely related to a 35% increase in Ethernet
revenues from Red Compartida, mitigated by a 15% decline in voice revenues due to
reductions in fix-to-mobile and international long distance revenues. Data and Internet
increased 3% year over year.
IT revenues increased 30% year-over-year. In peso terms, revenues increased 20%
mainly due to a significant increase in hosting and positive performances from security
and cloud services. IT revenues coming from Red Compartida totaled Ps. 9 million.
Enterprise
Total revenues increased 11% in the first quarter of 2018 compared to the same period in
2017. In peso terms, revenues increased 2%, mainly due to a 5% increase in the Enterprise
segment, partially mitigated by an 8% decline in the mass market segment.
1Q17 1Q18
FTTx proportion within the revenue mix increased from 15% in 1Q17 to 16% in 1Q18; wireless declined from 6%
to 3%; Enterprise increased from 65% to 67% and Government remained at 14%, in peso terms.

Restricted Internal Use
4,634 5,067
5,519
12,980 11,588
12,517 12,646
2012 2013 2014 2015 2016 2017 2018
Alestra Enterprise Government
YTD
In million USD 4Q17 1Q17 D%
TELECOM 19 31 16 -38% 22% 19 16 22%
Voice 2 2 2 -5% -2% 2 2 -2%
Data and Internet 3 5 4 -39% -19% 3 4 -19%
Managed Networks 14 23 9 -41% 45% 14 9 45%
IT 9 19 10 -51% -8% 9 10 -8%
TOTAL GOVERNMENT 28 50 26 -43% 10% 28 26 10%
(%) 1Q18 vs.YTD'18 YTD'171Q18 4Q17 1Q17
3
Government revenues amounted to $28 million in the first quarter 2018, compared to $26
million in the same period in 2017, a 10% increase. In peso terms, Government revenues
increased 1% mainly due to a rise in Telecom revenues, mitigated by a decline in IT revenues.
Recurrent revenues increased 6% compared to the same period in 2017.
Telecom revenues increased 22% year-over-year. In peso terms, revenues increased
12%. Managed networks increased 33% due to a strong increase in VPN solutions from
a service contract signed in the fourth quarter of 2017. However, voice revenues
decreased 9% and data and internet decreased 25% due to a decline in private lines
associated to service contracts to a federal government entity the Company discontinued
billing this quarter.
IT revenues decreased 8% in the first quarter of 2018. In peso terms, revenues
decreased 16%, mainly due to decline in hosting and security services, partially mitigated
by 41% and 37% increases in system integration and managed applications,
respectively.
Government
Enterprise and Government Segment Evolution
(Revenues in MPs.)
* Pro forma figures include Axtel and Alestra as of the beginning of each year.
(Pro forma)*(Pro forma)* LTM
Restricted Internal Use
YTD
In million USD 4Q17 1Q17 D%
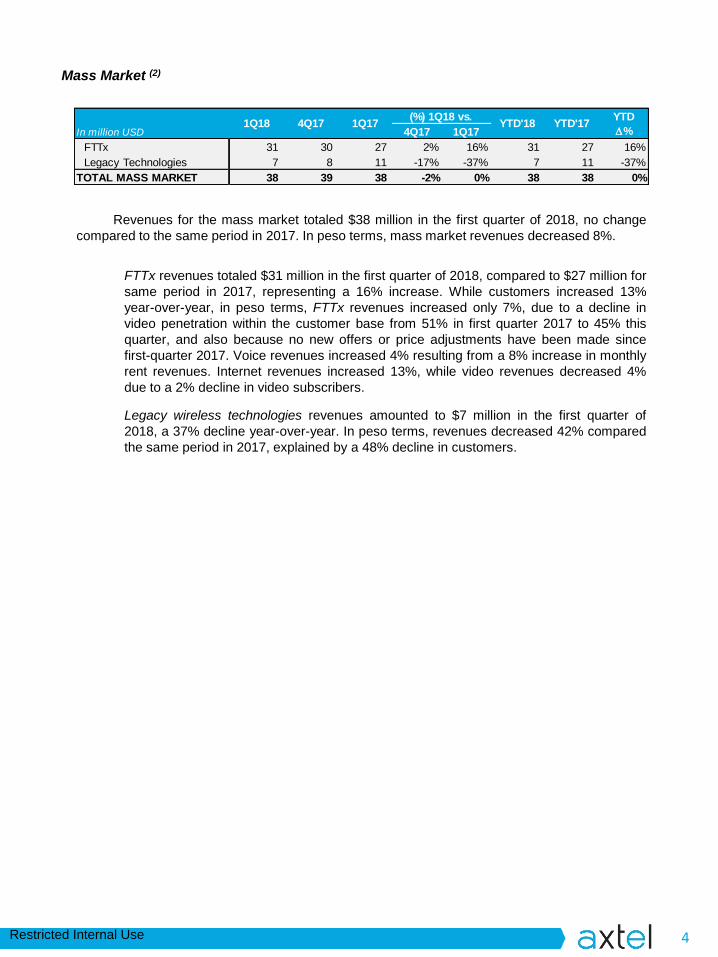
FTTx 31 30 27 2% 16% 31 27 16%
Legacy Technologies 7 8 11 -17% -37% 7 11 -37%
TOTAL MASS MARKET 38 39 38 -2% 0% 38 38 0%
(%) 1Q18 vs.YTD'18 YTD'171Q18 4Q17 1Q17
4
Revenues for the mass market totaled $38 million in the first quarter of 2018, no change
compared to the same period in 2017. In peso terms, mass market revenues decreased 8%.
FTTx revenues totaled $31 million in the first quarter of 2018, compared to $27 million for
same period in 2017, representing a 16% increase. While customers increased 13%
year-over-year, in peso terms, FTTx revenues increased only 7%, due to a decline in
video penetration within the customer base from 51% in first quarter 2017 to 45% this
quarter, and also because no new offers or price adjustments have been made since
first-quarter 2017. Voice revenues increased 4% resulting from a 8% increase in monthly
rent revenues. Internet revenues increased 13%, while video revenues decreased 4%
due to a 2% decline in video subscribers.
Legacy wireless technologies revenues amounted to $7 million in the first quarter of
2018, a 37% decline year-over-year. In peso terms, revenues decreased 42% compared
the same period in 2017, explained by a 48% decline in customers.
Mass Market (2)
Restricted Internal Use
43
43
44
44
79
79
82
82
58
58
74
74
17 1718 18YTDQTR
17 1718 18YTDQTR
17 1718 18YTDQTR
5
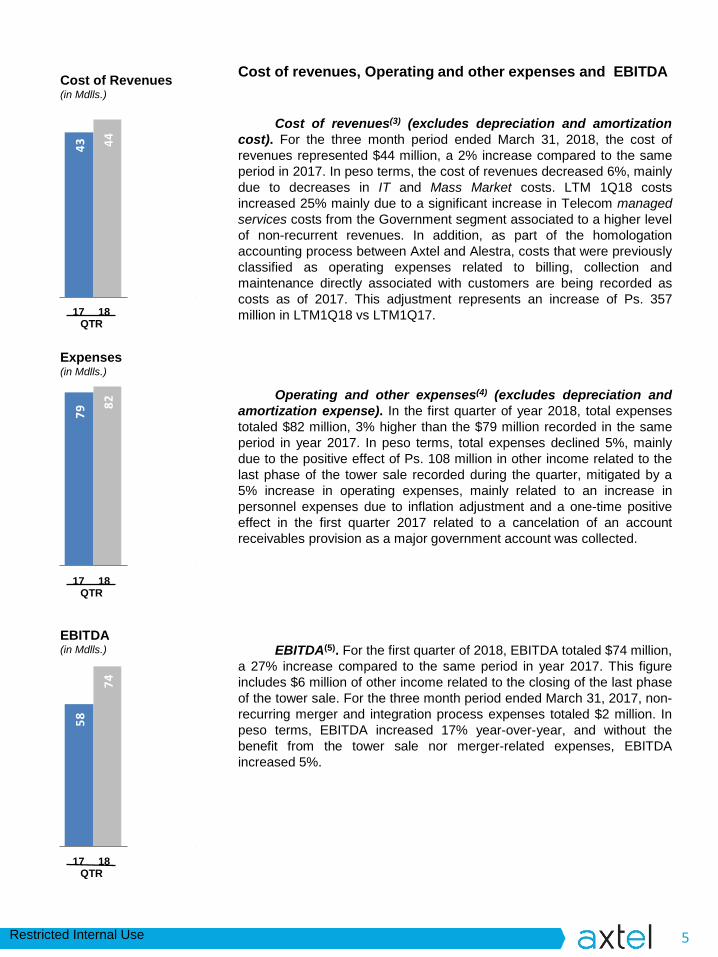
Cost of Revenues(in Mdlls.)
Expenses(in Mdlls.)
EBITDA(in Mdlls.)
Cost of revenues, Operating and other expenses and EBITDA
Cost of revenues(3) (excludes depreciation and amortization
cost). For the three month period ended March 31, 2018, the cost of
revenues represented $44 million, a 2% increase compared to the same
period in 2017. In peso terms, the cost of revenues decreased 6%, mainly
due to decreases in IT and Mass Market costs. LTM 1Q18 costs
increased 25% mainly due to a significant increase in Telecom managed
services costs from the Government segment associated to a higher level
of non-recurrent revenues. In addition, as part of the homologation
accounting process between Axtel and Alestra, costs that were previously
classified as operating expenses related to billing, collection and
maintenance directly associated with customers are being recorded as
costs as of 2017. This adjustment represents an increase of Ps. 357
million in LTM1Q18 vs LTM1Q17.
Operating and other expenses(4) (excludes depreciation and
amortization expense). In the first quarter of year 2018, total expenses
totaled $82 million, 3% higher than the $79 million recorded in the same
period in year 2017. In peso terms, total expenses declined 5%, mainly
due to the positive effect of Ps. 108 million in other income related to the
last phase of the tower sale recorded during the quarter, mitigated by a
5% increase in operating expenses, mainly related to an increase in
personnel expenses due to inflation adjustment and a one-time positive
effect in the first quarter 2017 related to a cancelation of an account
receivables provision as a major government account was collected.
EBITDA(5). For the first quarter of 2018, EBITDA totaled $74 million,
a 27% increase compared to the same period in year 2017. This figure
includes $6 million of other income related to the closing of the last phase
of the tower sale. For the three month period ended March 31, 2017, non-
recurring merger and integration process expenses totaled $2 million. In
peso terms, EBITDA increased 17% year-over-year, and without the
benefit from the tower sale nor merger-related expenses, EBITDA
increased 5%.
Restricted Internal Use
Million dollars 1Q18 4Q17 1Q17
2024 Senior Notes 500 500 -
Bank Facilities 338 325 854
Other loans 198 189 192
Other financing obligations 25 23 27
Accrued interests 16 7 7
Total Debt 1,078 1,045 1,081
(-) Cash and cash equivalents (62) (72) (60)
Net Debt 1,015 973 1,021
6
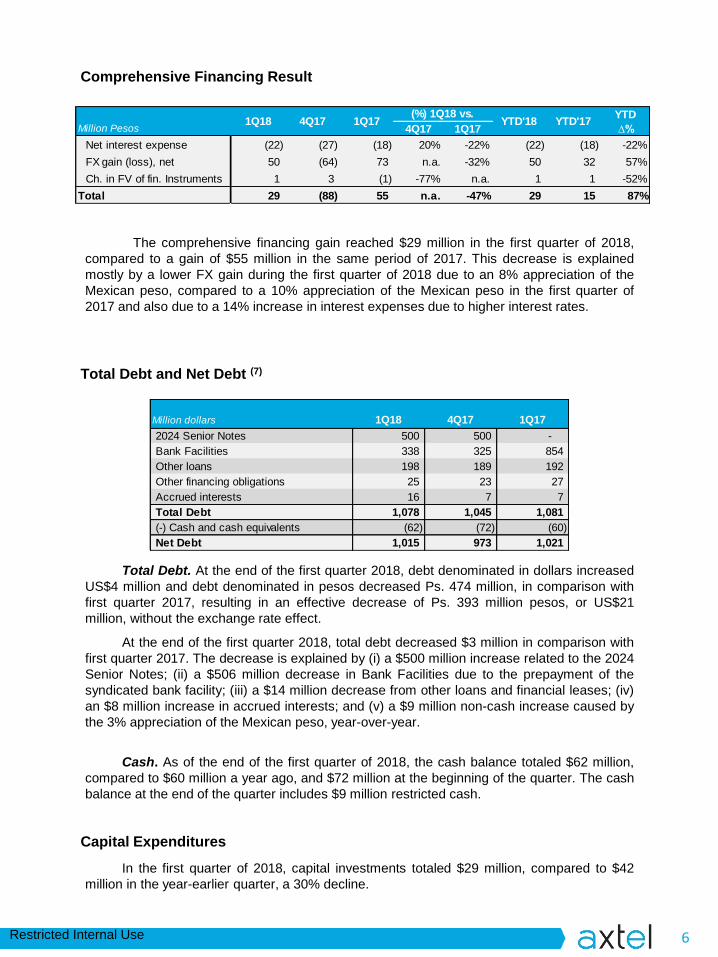
Comprehensive Financing Result
Total Debt. At the end of the first quarter 2018, debt denominated in dollars increased
US$4 million and debt denominated in pesos decreased Ps. 474 million, in comparison with
first quarter 2017, resulting in an effective decrease of Ps. 393 million pesos, or US$21
million, without the exchange rate effect.
At the end of the first quarter 2018, total debt decreased $3 million in comparison with
first quarter 2017. The decrease is explained by (i) a $500 million increase related to the 2024
Senior Notes; (ii) a $506 million decrease in Bank Facilities due to the prepayment of the
syndicated bank facility; (iii) a $14 million decrease from other loans and financial leases; (iv)
an $8 million increase in accrued interests; and (v) a $9 million non-cash increase caused by
the 3% appreciation of the Mexican peso, year-over-year.
Cash. As of the end of the first quarter of 2018, the cash balance totaled $62 million,
compared to $60 million a year ago, and $72 million at the beginning of the quarter. The cash
balance at the end of the quarter includes $9 million restricted cash.
Total Debt and Net Debt (7)
The comprehensive financing gain reached $29 million in the first quarter of 2018,
compared to a gain of $55 million in the same period of 2017. This decrease is explained
mostly by a lower FX gain during the first quarter of 2018 due to an 8% appreciation of the
Mexican peso, compared to a 10% appreciation of the Mexican peso in the first quarter of
2017 and also due to a 14% increase in interest expenses due to higher interest rates.
In the first quarter of 2018, capital investments totaled $29 million, compared to $42
million in the year-earlier quarter, a 30% decline.
Capital Expenditures
YTD
Million Pesos 4Q17 1Q17 ∆%
Net interest expense (22) (27) (18) 20% -22% (22) (18) -22%
FX gain (loss), net 50 (64) 73 n.a. -32% 50 32 57%
Ch. in FV of fin. Instruments 1 3 (1) -77% n.a. 1 1 -52%
Total 29 (88) 55 n.a. -47% 29 15 87%
1Q18 YTD'17YTD'18(%) 1Q18 vs.
1Q174Q17
Restricted Internal Use
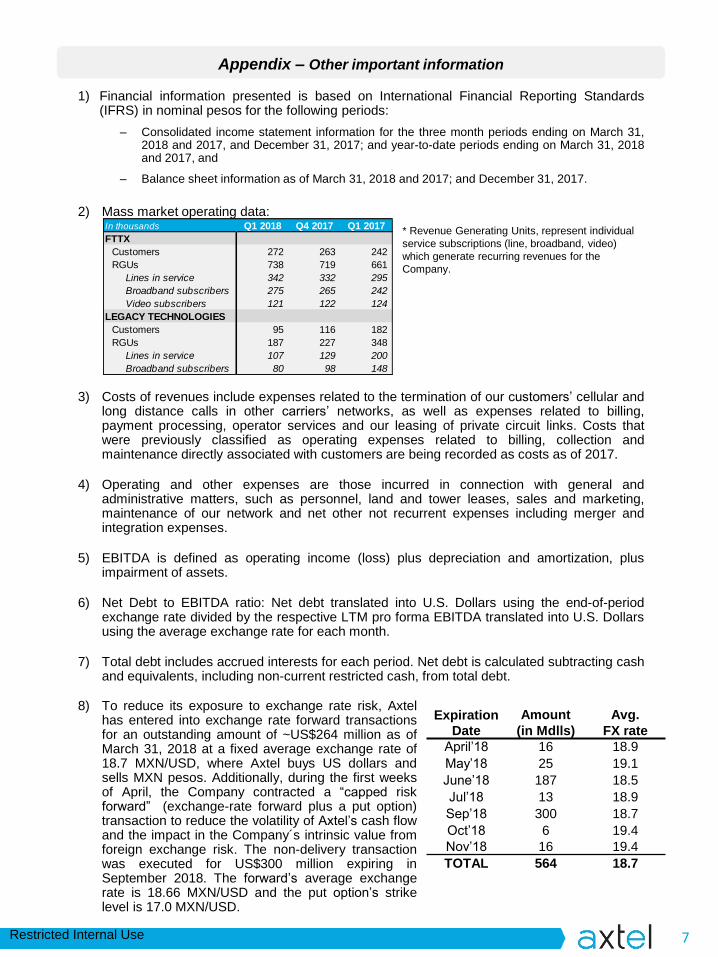
Appendix – Other important information
1) Financial information presented is based on International Financial Reporting Standards(IFRS) in nominal pesos for the following periods:
– Consolidated income statement information for the three month periods ending on March 31,2018 and 2017, and December 31, 2017; and year-to-date periods ending on March 31, 2018and 2017, and
– Balance sheet information as of March 31, 2018 and 2017; and December 31, 2017.
2) Mass market operating data:
3) Costs of revenues include expenses related to the termination of our customers’ cellular andlong distance calls in other carriers’ networks, as well as expenses related to billing,payment processing, operator services and our leasing of private circuit links. Costs thatwere previously classified as operating expenses related to billing, collection andmaintenance directly associated with customers are being recorded as costs as of 2017.
4) Operating and other expenses are those incurred in connection with general andadministrative matters, such as personnel, land and tower leases, sales and marketing,maintenance of our network and net other not recurrent expenses including merger andintegration expenses.
5) EBITDA is defined as operating income (loss) plus depreciation and amortization, plusimpairment of assets.
6) Net Debt to EBITDA ratio: Net debt translated into U.S. Dollars using the end-of-periodexchange rate divided by the respective LTM pro forma EBITDA translated into U.S. Dollarsusing the average exchange rate for each month.
7) Total debt includes accrued interests for each period. Net debt is calculated subtracting cashand equivalents, including non-current restricted cash, from total debt.
* Revenue Generating Units, represent individual
service subscriptions (line, broadband, video)
which generate recurring revenues for the
Company.
7
In thousands Q1 2018 Q4 2017 Q1 2017
FTTX
Customers 272 263 242
RGUs 738 719 661
Lines in service 342 332 295
Broadband subscribers 275 265 242
Video subscribers 121 122 124
LEGACY TECHNOLOGIES
Customers 95 116 182
RGUs 187 227 348
Lines in service 107 129 200
Broadband subscribers 80 98 148
Expiration
Date
Amount
(in Mdlls)
Avg.
FX rate
April’18 16 18.9
May’18 25 19.1
June’18 187 18.5
Jul’18 13 18.9
Sep’18 300 18.7
Oct’18 6 19.4
Nov’18 16 19.4
TOTAL 564 18.7
8) To reduce its exposure to exchange rate risk, Axtelhas entered into exchange rate forward transactionsfor an outstanding amount of ~US$264 million as ofMarch 31, 2018 at a fixed average exchange rate of18.7 MXN/USD, where Axtel buys US dollars andsells MXN pesos. Additionally, during the first weeksof April, the Company contracted a “capped riskforward” (exchange-rate forward plus a put option)transaction to reduce the volatility of Axtel’s cash flowand the impact in the Company´s intrinsic value fromforeign exchange risk. The non-delivery transactionwas executed for US$300 million expiring inSeptember 2018. The forward’s average exchangerate is 18.66 MXN/USD and the put option’s strikelevel is 17.0 MXN/USD.
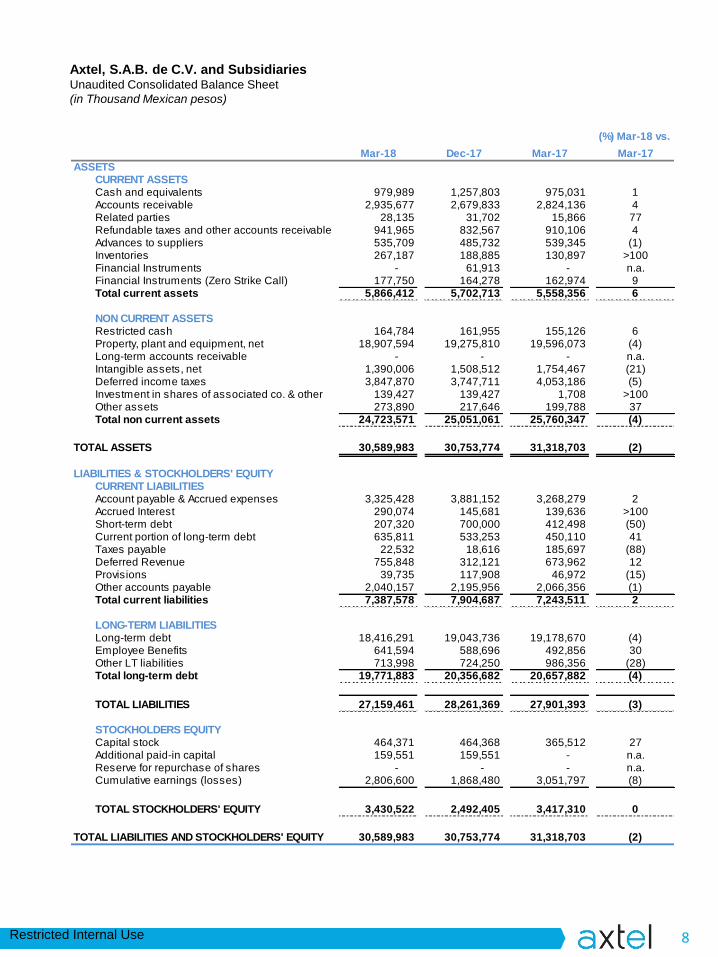
Restricted Internal Use 8
Axtel, S.A.B. de C.V. and SubsidiariesUnaudited Consolidated Balance Sheet
(in Thousand Mexican pesos)
(%) Mar-18 vs.
Mar-18 Dec-17 Mar-17 Mar-17
ASSETSCURRENT ASSETSCash and equivalents 979,989 1,257,803 975,031 1Accounts receivable 2,935,677 2,679,833 2,824,136 4Related parties 28,135 31,702 15,866 77Refundable taxes and other accounts receivable 941,965 832,567 910,106 4Advances to suppliers 535,709 485,732 539,345 (1)Inventories 267,187 188,885 130,897 >100Financial Instruments - 61,913 - n.a.Financial Instruments (Zero Strike Call) 177,750 164,278 162,974 9Total current assets 5,866,412 5,702,713 5,558,356 6
NON CURRENT ASSETSRestricted cash 164,784 161,955 155,126 6Property, plant and equipment, net 18,907,594 19,275,810 19,596,073 (4)Long-term accounts receivable - - - n.a.Intangible assets, net 1,390,006 1,508,512 1,754,467 (21)Deferred income taxes 3,847,870 3,747,711 4,053,186 (5)Investment in shares of associated co. & other 139,427 139,427 1,708 >100Other assets 273,890 217,646 199,788 37Total non current assets 24,723,571 25,051,061 25,760,347 (4)
TOTAL ASSETS 30,589,983 30,753,774 31,318,703 (2)
LIABILITIES & STOCKHOLDERS' EQUITYCURRENT LIABILITIESAccount payable & Accrued expenses 3,325,428 3,881,152 3,268,279 2Accrued Interest 290,074 145,681 139,636 >100Short-term debt 207,320 700,000 412,498 (50)Current portion of long-term debt 635,811 533,253 450,110 41Taxes payable 22,532 18,616 185,697 (88)Deferred Revenue 755,848 312,121 673,962 12Provisions 39,735 117,908 46,972 (15)Other accounts payable 2,040,157 2,195,956 2,066,356 (1)Total current liabilities 7,387,578 7,904,687 7,243,511 2
LONG-TERM LIABILITIESLong-term debt 18,416,291 19,043,736 19,178,670 (4)Employee Benefits 641,594 588,696 492,856 30Other LT liabilities 713,998 724,250 986,356 (28)Total long-term debt 19,771,883 20,356,682 20,657,882 (4)
TOTAL LIABILITIES 27,159,461 28,261,369 27,901,393 (3)
STOCKHOLDERS EQUITYCapital stock 464,371 464,368 365,512 27Additional paid-in capital 159,551 159,551 - n.a.Reserve for repurchase of shares - - - n.a.Cumulative earnings (losses) 2,806,600 1,868,480 3,051,797 (8)
TOTAL STOCKHOLDERS' EQUITY 3,430,522 2,492,405 3,417,310 0
TOTAL LIABILITIES AND STOCKHOLDERS' EQUITY 30,589,983 30,753,774 31,318,703 (2)
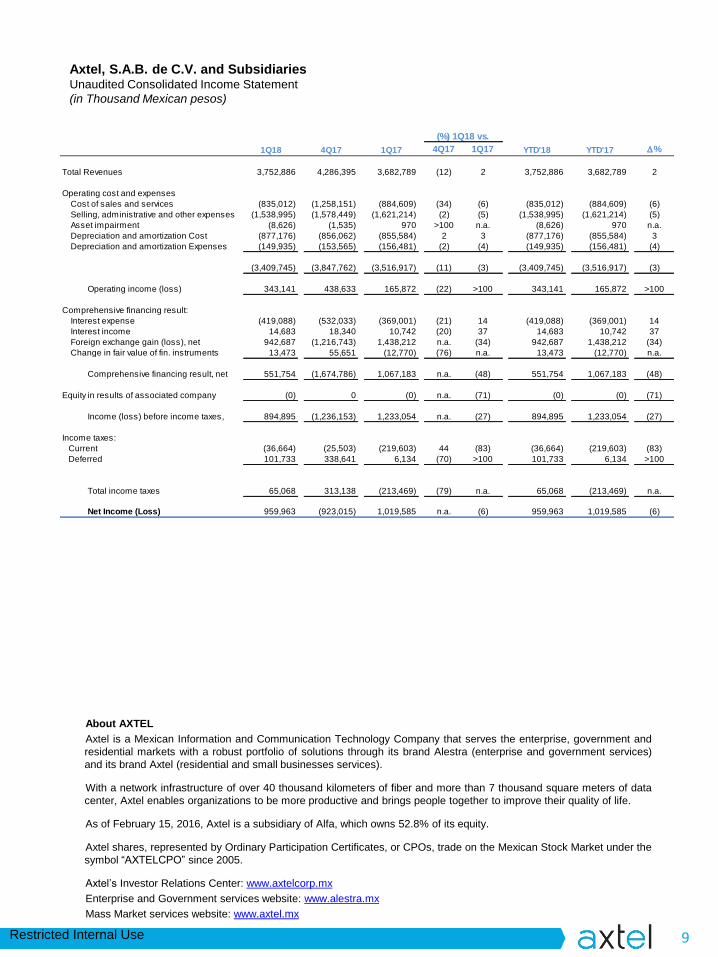
Restricted Internal Use 9
Axtel, S.A.B. de C.V. and SubsidiariesUnaudited Consolidated Income Statement
(in Thousand Mexican pesos)
About AXTEL
Axtel is a Mexican Information and Communication Technology Company that serves the enterprise, government and
residential markets with a robust portfolio of solutions through its brand Alestra (enterprise and government services)
and its brand Axtel (residential and small businesses services).
With a network infrastructure of over 40 thousand kilometers of fiber and more than 7 thousand square meters of data
center, Axtel enables organizations to be more productive and brings people together to improve their quality of life.
As of February 15, 2016, Axtel is a subsidiary of Alfa, which owns 52.8% of its equity.
Axtel shares, represented by Ordinary Participation Certificates, or CPOs, trade on the Mexican Stock Market under the
symbol “AXTELCPO” since 2005.
Axtel’s Investor Relations Center: www.axtelcorp.mx
Enterprise and Government services website: www.alestra.mx
Mass Market services website: www.axtel.mx
1Q18 4Q17 1Q17 4Q17 1Q17 YTD'18 YTD'17 D%
Total Revenues 3,752,886 4,286,395 3,682,789 (12) 2 3,752,886 3,682,789 2
Operating cost and expenses
Cost of sales and services (835,012) (1,258,151) (884,609) (34) (6) (835,012) (884,609) (6)
Selling, administrative and other expenses (1,538,995) (1,578,449) (1,621,214) (2) (5) (1,538,995) (1,621,214) (5)
Asset impairment (8,626) (1,535) 970 >100 n.a. (8,626) 970 n.a.
Depreciation and amortization Cost (877,176) (856,062) (855,584) 2 3 (877,176) (855,584) 3
Depreciation and amortization Expenses (149,935) (153,565) (156,481) (2) (4) (149,935) (156,481) (4)
(3,409,745) (3,847,762) (3,516,917) (11) (3) (3,409,745) (3,516,917) (3)
Operating income (loss) 343,141 438,633 165,872 (22) >100 343,141 165,872 >100
Comprehensive financing result:
Interest expense (419,088) (532,033) (369,001) (21) 14 (419,088) (369,001) 14
Interest income 14,683 18,340 10,742 (20) 37 14,683 10,742 37
Foreign exchange gain (loss), net 942,687 (1,216,743) 1,438,212 n.a. (34) 942,687 1,438,212 (34)
Change in fair value of fin. instruments 13,473 55,651 (12,770) (76) n.a. 13,473 (12,770) n.a.
Comprehensive financing result, net 551,754 (1,674,786) 1,067,183 n.a. (48) 551,754 1,067,183 (48)
Equity in results of associated company (0) 0 (0) n.a. (71) (0) (0) (71)
Income (loss) before income taxes, 894,895 (1,236,153) 1,233,054 n.a. (27) 894,895 1,233,054 (27)
Income taxes:
Current (36,664) (25,503) (219,603) 44 (83) (36,664) (219,603) (83)
Deferred 101,733 338,641 6,134 (70) >100 101,733 6,134 >100
Total income taxes 65,068 313,138 (213,469) (79) n.a. 65,068 (213,469) n.a.
Net Income (Loss) 959,963 (923,015) 1,019,585 n.a. (6) 959,963 1,019,585 (6)
(%) 1Q18 vs.
ALFA´S FIRST QUARTER 2018
47
Natural gas and hydrocarbons1% ALFA´s revenues and 2% of ALFA’s EBITDA in 1Q18
Newpekisanoil&gasexplorationandproductioncompanywithoperationsintheUnitedStatesandMexico.ThecompanyownsmineralrightsinseveralstateswithintheUSwhereitextractsoil,naturalgasandliquids.InMexico,itsoperationsareconcentratedintwomatureoilfieldsunderaserviceagreementwithPetróleosMexicanos(PEMEX)andtherightsfortwolicenseagreementswithCNH.
Industry comments Hydrocarbonpricesshowedbullishbehavior,ascrudeoilpricesduring thequarter rose to levelsnotseensince2015whileaveragenaturalgaspriceswerealsohighercomparedtopriorquarters.WestTexas IntermediateoilpricesaveragedUS$63perbarrel,up13%compared to4Q17,whileHenryHubnaturalgaspricesaveragedUS$3.0perMMBTU,5%higher than thepreviousquarter.During the firstquarter,OPECcommencedcooperationbetweenOPECproducingcountriesanditsallies,suchasRussia,tomaintainproductioncutsthroughouttheyear.With prices on the rise, the US rig count increased 6% compared with 4Q17, thus enabling a higher level ofproductionandexports.HenryHubpricesalso started thequarter risingasweekly inventorydata continued toreflectalowerinjectionrateandtotalinventoriesdroppingbelowtheprevious5-yearaveragelevel.
Operations in the USA Attheendof1Q18,Newpekhad648producingwellsattheEagleFordShale(“EFS”)inSouthTexas,comparedto628wellsinproductionattheendof1Q17.Additionally,Newpekhas14wellsproducingintheWilcoxformation,and34intheEdwardsformation,bothinSouthTexas,whereNewpekhasa20%workinginterest.SalesvolumeintheUS averaged 5.7MBOED during 1Q18, up 13% from 1Q17, reflecting the strong production from thewellsconnectedduring2017.Liquidsandoilrepresented69%ofthetotalvolumeforthequarter,upfrom67%ayearago.Resultsofthetwentywellsconnectedin2017havebeenencouraging.Thenewcompletiontechnique,testinglongerlateralswithhigherintensitycompletions,isprovingtoyieldhighercapitalefficiencythantheoriginalwellsdrilled insimilar locations.All2017wellswerecompletedusingthisnewtechnology.Theprospects intheotherareaswithin theUS remainedonholdduring thequarter,butdrill-ready locationshavebeen identifiedandareexpectedtobedrilledsoon.
Operations in Mexico In Mexico, production averaged 3.7 MBOED during 1Q18, roughly the same as 1Q17. The San Andrés fieldrepresented 71% of the total production for the quarter, essentially flat year-on-year. Therewere 135wells inproductioninMexicoatquarter’send,a2%increasefromthe132wellsinproductionattheendof1Q17.

ALFA´S FIRST QUARTER 2018
48
Financial results; Capital expenditures and acquisition; Net debt Oilpricesincreasedyear-on-year,withWTIOilpriceup21%,meanwhilegaspricesremainedessentiallyflatwithHenryHubnaturalgaspriceslightlyhigherby0.5%resultinginhigherrevenuesinthequarter,whichtotaledUS$33 million in 1Q18, up 26% year-on-year. 1Q18 EBITDA was US $16 million, up 913% year-on-year, as 1Q18benefitted by US $13 million extraordinary income from the sale of Eagle Ford acreage. Capital expendituresamountedtoUS$8millionexcludingthesaleatEFS,whilenetdebtwasUS$27millionattheendofthequarter.
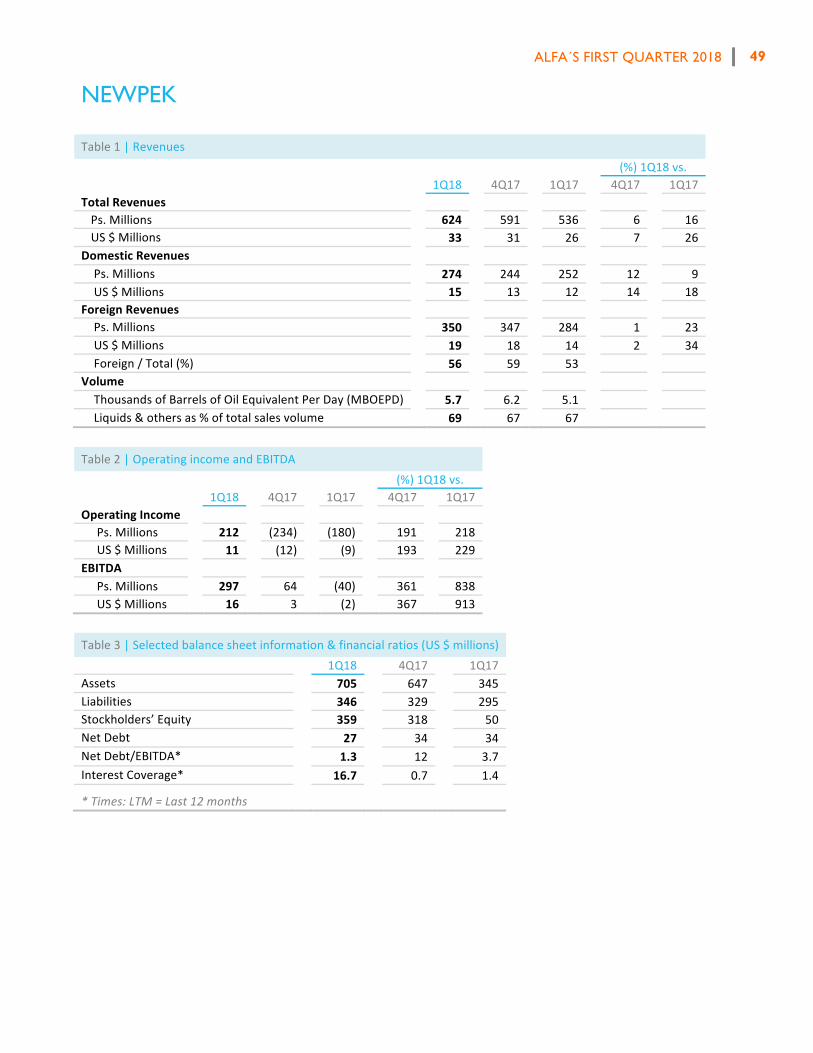
ALFA´S FIRST QUARTER 2018
49
NEWPEKTable1|Revenues (%)1Q18vs. 1Q18 4Q17 1Q17 4Q17 1Q17TotalRevenues Ps.Millions 624 591 536 6 16US$Millions 33 31 26 7 26
DomesticRevenues Ps.Millions 274 244 252 12 9US$Millions 15 13 12 14 18
ForeignRevenues Ps.Millions 350 347 284 1 23US$Millions 19 18 14 2 34Foreign/Total(%) 56 59 53
Volume ThousandsofBarrelsofOilEquivalentPerDay(MBOEPD) 5.7 6.2 5.1 Liquids&othersas%oftotalsalesvolume 69 67 67
Table2|OperatingincomeandEBITDA (%)1Q18vs. 1Q18 4Q17 1Q17 4Q17 1Q17OperatingIncome Ps.Millions 212 (234) (180) 191 218US$Millions 11 (12) (9) 193 229
EBITDA Ps.Millions 297 64 (40) 361 838US$Millions 16 3 (2) 367 913
Table3|Selectedbalancesheetinformation&financialratios(US$millions) 1Q18 4Q17 1Q17Assets 705 647 345Liabilities 346 329 295Stockholders’Equity 359 318 50NetDebt 27 34 34NetDebt/EBITDA* 1.3 12 3.7InterestCoverage* 16.7 0.7 1.4
*Times:LTM=Last12months