1q18 analysts - pds.com.ph
TRANSCRIPT


1Q18 Analysts’ Briefing7 May 2018 | The Globe Tower BGC

1Q18 Performance: Record results on strong demand for data and larger subscriberbase
• Increase in EBITDA due to higher revenues andkeeping costs in check
• EBITDA margin of 47%
• Increase in EBITDA offset higher depreciation and non-operating charges
• Momentum continues with data-related servicesrepresenting 58% of total service revenues
Service Revenues
33.6YoY
+8%
EBITDA
15.8 +18%
Net Income After Tax
+18%4.5Cash Dividend
222 .75/sh
x%
Service Revenues
33.2EBITDA
16.1Net Income After Tax
4.7
Pre-PFRS Post-PFRS
• Record Date: May 17, 2018• Payment Date: June 1, 2018

Broad-based revenue growth as market continues shift towards data
Mobile* Home Broadband*
Fixed Line Voice*
Corporate Data*
Total*
Δ1Q17 +9% +11% +4% -18% +8%
3
• Robust prepaid gross acquisitions drive increase insubscriber base
• New product offers drive strong gross acquisitions forfixed wireless service
+17%+8%58.6million
63.3million
Mobile Subscribers Home Broadband Subscribers
1Q17 1Q18
1.19million
1Q17 1Q18
1.40million
Postpaid Prepaid TM Wireless Wired
* Pre-PFRS
Petabytes
53%
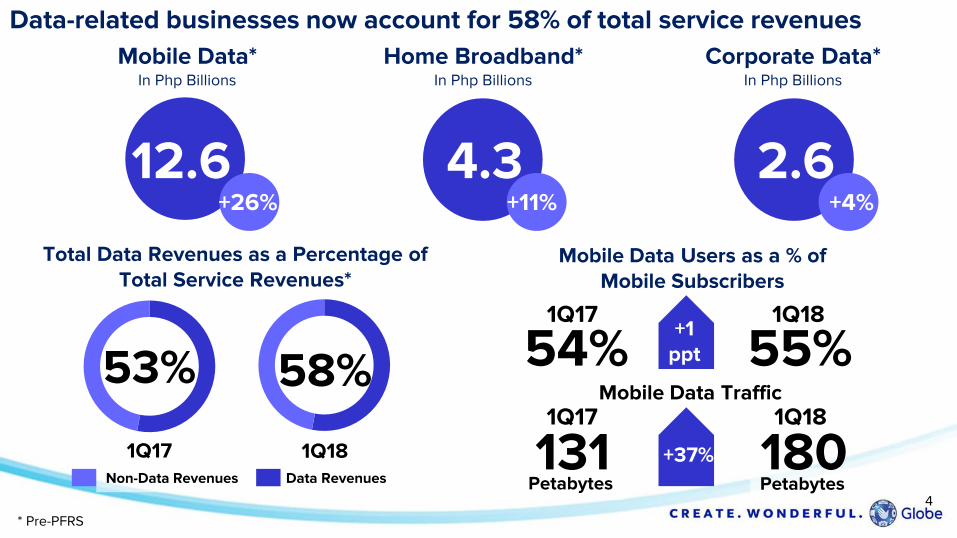
Data-related businesses now account for 58% of total service revenues
Home Broadband*In Php Billions
Corporate Data*In Php Billions
Mobile Data*In Php Billions
Total Data Revenues as a Percentage of Total Service Revenues*
58%
1Q17 1Q18 +35% 180Petabytes
+37%
Mobile Data Users as a % of Mobile Subscribers
Mobile Data Traffic1Q181Q17
55%1Q181Q17 +35%+1
ppt
Non-Data Revenues Data Revenues
12.6 4.3 2.6+26% +11% +4%
4
131
54%
* Pre-PFRS

New products, partnerships and devices geared for the Filipino digital lifestyleGlobe Gaming launched in
partnership with Mineski, Riot
Games, and Garena for esports
Rollout of GCash in more fast food and casual dining outlets, major retailers and gas stations in full swing
GCash and Alipay jointly
launch new GCash QR Code
Discover new journeys with
the Samsung Galaxy S9 and
S9+ powered by ThePLAN
Chow King Max’s Group
Primer Group Robinson’s Retail
5
Shell
Jollibee Shakeys

Up by
low single digitfrom 2017 level
Maintained at
~40%
A look back at our Consolidated Outlook for 2018
Up by
mid single digitfrom 2017 level
Increase to
~mid 40%
• All other original guidance items pertaining to capex, gearing and cost considerations remain
upgrade to
upgrade to
Original Revised
6
Revenues
EBITDA MarginEBITDA Margin
Revenues

Financial Highlights

Consolidated Financial Highlights: Revenue growth of 8%, combined with lowersubsidies, depreciation, and non-operating charges led to an 18% increase in NIAT
* OPEX & Subsidy includes interconnect charges** Core Net Income excludes forex, mark-to-market gains and losses, and non-recurring items
8
3M18
(Pre-PFRS)3M17 YoY% 4Q17 QoQ%
3M18
(Post-PFRS)
Gross Service Revenues 33,638 31,122 8% 32,767 3% 33,178
OPEX and Subsidy (17,878) (17,806) 0% (20,065) -11% (17,097)
EBITDA 15,760 13,316 18% 12,702 24% 16,081
EBITDA Margin 47% 43% 39% 48%
Depreciation (7,285) (6,437) 13% (7,396) -2% (7,285)
EBIT 8,475 6,879 23% 5,306 60% 8,796
Non-Op Charges (1,753) (1,320) 33% (2,027) -14% (1,753)
Provision for Tax (2,266) (1,798) 26% (1,175) 93% (2,362)
Net Income 4,456 3,761 18% 2,104 112% 4,681
Core Net Income 4,572 3,681 24% 2,339 95% 4,797

Changes in Accounting Rules for 2018
Item PFRS 9 PFRS 15 Effect Explanation
Service Revenues Decrease in overall service revenues
• Mobile • Decrease in service revenues due to re-allocation as non-service revenues
• Mobile ARPUs will decrease in line with service revenues
• Broadband / Corporate Data
Effect on service and non-service revenues will be relatively immaterial compared to mobile
Non-Service Revenues
• Increase in non-service revenues as the allocation to equipment will be based on standalone selling price
• Sale of equipment is recognized upfront
Cost of Sales / Operating Expenses
• Decrease as subscriber acquisition costs are amortized over contract period instead of up-front
• Increase as subscriber recontracting costs are now included as part of cost of sales instead of operating expenses.
• Increase due to higher provision for bad debts
EBITDA / EBITDA Margin
• Increase as subscriber acquisition costs are amortized over contract period instead of up-front
• Decrease due to higher provisions for bad debts
9

13,316 15,760
2,516 257 136 402 567 300
3M17 EBITDA Inc. in
Revenues
Dec. in
Interconnect
Charges
Dec. in Staff
Costs
Dec. in
Marketing &
Subsidy
Inc. in Network
Costs
Inc. in
Provisions,
Services &
Other OPEX
3M18 EBITDA
YoYPre-PFRS
(in Php Mn)
+18%
EBITDA growth of 18% driven by the increase in revenues and decreases ininterconnect, staffing, and subsidies, partly negated by increased network costsand provisions, services and other opex
10
12,702 15,760
871 89 1,226 384 505 17
4Q17 EBITDA Inc. in
Revenues
Dec. in
Interconnect
Charges
Inc. in Staff
Costs
Dec. in
Marketing &
Subsidy
Dec. in
Network Costs
Dec. in
Provisions,
Services &
Other OPEX
1Q18 EBITDA
QoQPre-PFRS
(in Php Mn)
+24%

Gain in EBITDA tempered by higher depreciation, non-operating charges and taxes,resulting in 18% increase in net income.
11
3,761 4,456
2,444 848 433 468
3M17 Reported
Net Income
Change in EBITDA Inc. in
Depreciation
Inc. in Non-
operating
expenses
Inc. in Tax 3M18 Reported
Net Income
YoYPre-PFRS
(in Php Mn)
QoQPre-PFRS
(in Php Mn)
+18%
+112%
2,104
4,456 3,058 111 274 1,091
4Q17 Net Income Change in EBITDA Dec. in
Depreciation
Dec. in Non-
operating
expenses
Inc. in Tax 1Q18 Reported
Net Income

2015 2016 2017 2018
Data Business Support Core Others
CAPEX BREAKDOWNIn Php Bn
1Q18 Rollout Update
12
Capital expenditures at approximately Php6.6 billion or USD127 million*, with64% related to data requirements
* Based on FX rate of Php51.887
+508
+59K
LTE SITES
HOME BROADBAND
SUBSCRIBER LINES*
* Composed of wired and wireless
8%
30%
15%
48%
10%
14%
11%
65%
9%
2%
7%
82%
32.136.7
42.5
6.6
20%
14%
2%
64%

Cash Dividends
Rate per Common
Share
Record date:
Payment date:
13
Debt levels remain within covenant ratios
• The financial tests under Globe’s loan agreements include compliance with the following ratios:
• Total Debt-to-Equity not exceeding 2.5:1• Total Debt-to-EBITDA not exceeding 3:1• Debt Service Coverage exceeding 1.3x
22 .75/sh
May 17, 2018
June 1, 2018
YTD March
2018*
YTD Dec
2017
Gross debt (in Php Bn) 127.9 131.5
Gross Debt-to-Equity 1.96x 1.98x
Gross Debt-to-EBITDA 2.25x 2.43x
Debt Service Coverage Ratio 3.09x 3.38x
*Post-PFRS

Globe will divest all or part of its tower assets• UBS appointed as Financial Adviser in project’s preparatory phase
• Towers to be open for lease to potential new and existing players.
• In support of the government’s initiative to open the telco industry to more competition
• To speed up the build and deployment of cellular towers in the Philippines
14


Beginning 1Q18, Globe’s financial reporting will incorporate Philippine FinancialReporting Standard (PFRS) 9, Financial Instruments: Recognition and Measurement,and PFRS 15, Revenue from Contracts with Customers
What is PFRS 9?
PFRS 9, Financial Instruments: Recognition and Measurement,
provides guidance on classifying financial instruments.
What is the impact of adoption of
PFRS 9 to Globe?
The new provisioning methodology,the Expected Credit Loss Model,assigns higher provisions for lowerquality customers (and lowerprovisions for higher qualitycustomers), reflecting the truepicture of portfolio quality based onacquisition, payment behavior, andportfolio outlook.
How will this adjustment be
reflected in Globe’s books?
With the adoption of the modifiedretrospective approach, there will bea deduction to Retained Earnings ofPhp5.58 Billion, net of tax (Php7.98Billion gross) in 1Q 2018.
What is PFRS 15?
What is the impact of adoption of
PFRS 15 to Globe?
How will this adjustment be
reflected in Globe’s books?
PFRS 15, Revenue from Contracts with Customers, provides guidance
on accounting for revenue from contracts with customers.
The new standard changes the long-standing practice of using monthlyservice fees to subsidize upfrontcost of handsets, thus, requiringtelco operators to carry out a"relative fair value" allocationbetween the handset and service.
With the adoption of the modifiedretrospective approach, there will bean addition to retained earningsamounting to Php1.79 Billion, net oftax (Php2.56 Billion gross) as ofMarch 31, 2018.
16

PFRS 15 and 9 Adjustments to Retained Earnings
With Globe’s adoption of the modified retrospective approach, the effects of PFRS 9and 15 on prior year will be booked to Retained Earnings in the Balance Sheet
In Php Mns
Retained Earnings, 12/31/2017 21,708
Add (Deduct) the following:Effect of PFRS 9 (5,587)Effect of PFRS 15 1,790
Retained Earnings, 01/01/2018 17,912
17