akademiska sjukhuset alingsås artclinic göteborg artclinic ... · printed in sweden 2016 elvins...
TRANSCRIPT

Annual Report2016
Primary knee arthroplasties 1975-2015Revision knee arthroplasties 1975-2014
Knee osteotomies 2013-2015
Lund University Department of Clinical Sciences, Orthopedics
Skånes University Hospital, LundSweden
Akademiska sjukhuset Alingsås ArtClinic GöteborgArtClinic JönköpingArvika Bollnäs Borås CarlanderskaDanderyd Eksjö-NässjöElisabethkliniken Enköping Eskilstuna Falun Frölunda Spec, Sjh,Gällivare Gävle Halmstad Helsingborg Huddinge Hudiksvall Hässleholm Jönköping Kalmar Karlshamn Karlskoga Karlstad KarolinskaKullbergska Kungälv Kysthospitalet -DK Lidköping Lindesberg Ljungby Luleå-SensiaLundLycksele Mora MotalaMovement Halmstad Mölndal Nacka NorrköpingNorrtälje NyköpingOrthoCenter IFK klinikenOrthoCenter StockholmOrtopediska husetOskarshamnPiteå S:t Göran SabbatsbergSahlgrenskaSkellefteå Skene Skövde Sollefteå SophiahemmetSunderby SundsvallSödersjukhuset Södertälje Torsby Trelleborg Uddevalla Umeå Varberg Visby Värnamo Västervik Västerås Växjö Ängelholm Örebro Örnsköldsvik Östersund


To our contact surgeons
The statistics section on our website (www.knee.se) has changed considerably since the last report. Now you can specify what information you would like such as types of surgeries, patient profiles as well as perioperative data for the different counties, hospitals and time periods. We hope that you find the information interesting and relevant.
In this report, we have added a section on adverse events that occurred within 90 days of the primary knee replacement. In cooperation with the National Patient Register of the National Board of Health and Welfare we examined the ICD- and surgical codes that were used for the different diseases and surgeries of knee arthroplasty patients treated in the healthcare system after their primary surgeries. The objective was to collect information on health events that may have occurred or become symptomatic as a result of the surgery. Although there may be sources of error such as differences in coding procedures among the hospitals and counties, we are convinced that the data still yield useful information on how common adverse events are following knee arthroplasty surgery and may indicate where additional analyses and improvement measures are motivated.
We want to thank all our contact surgeons and associated staff for their dedicated work throughout the years. Your accurate reporting and focus on quality have resulted in close to complete coverage and your tireless effort of sharing the information has facilitated the implementation of the information into practice
Operating a register is a laborious long-term effort. With revision as the main indicator of failure in combination with the reluctance of Swedish surgeons in testing new implants, reports of early problems are unusual. However, the register has contributed to implants showing inferior results being removed from the market and has stimulated the surgeons to use well documented implants and techniques thereby providing better results for the patients. This, in turn, has resulted in Sweden having the lowest risk for revisions in the world.
The structure of the annual report is similar to previous reports but we would like to draw attention to the following changes:
1) When calculating the incidence we now use information from the tax authorities on where the patients were residing at the time of surgery.2) When calculating the relative risk for the different hospitals we now analyze both uncemented and cemented TKAs inserted for osteoarthritis. 3) The osteotomy register that started in 2013 has its own section at the end of the report.

Printed in Sweden 2016
Elvins Grafiska AB, Helsingborg
ISBN 978-91-88017-12-3
The report consists of four parts.
The first part summarizes the register procedures, the epidemiology, and the general results.
The second part contains information on the data reported to the register in 2015 as well as analyses covering the 10-year period 2005-2014.
The third part concerns the osteotomy registry.
The fourth part is specifically prepared for each individual hospital. It is only delivered to the contact surgeon in charge and the head of department. It provides compilations of what the hospital has reported as well as information on all surgeries reported by the unit for 2015 (sorted by ID and date of surgery). It is our hope that this hospital specific information will be compared to other available information in order to identify and correct potential registration errors. We also provide a USB stick containing all the reported surgeries by the hospital, the annual report and graphics comparing the revision rate of the unit to that of the national average. It is important to inform your colleagues about the report to stimulate discussions in order to initiate improvement efforts.
We would also like to take this opportunity to remind you that the registration is prospective and that a reported revision can only be included in the analyses if the primary procedure was reported previously according to normal routines. This means that if a primary operation is discovered only because of a revision at a later time, neither the primary operation nor the revision will be included in the analyses.
The register office in Lund would like to thank all contact surgeons, operation staff and secretarues for their important contribution throughout the years and ask you to carefully review and distribute the information presented.
On behalf of the Swedish Knee Arthroplasty Register
Martin Sundberg Lars Lidgren Annette W-Dahl Otto Robertsson

CONTENT
Part I Introduction 2 Definitions 4 Completeness concerning primaries reported in 2014 5 Adverse events within 90 days of knee arthroplasty 6 How the Knee Register compares implants 12 Gender and age distribution 13 Incidence and prevalence 15 Incidence in the counties 2009–2015 16 Incidence in different age-groups over time 18 Number of primaries per unit and year 18 Factors that influence the revision rate 20 Part II Type of operations and implants in 2015 25 The most common implants in the counties in 2015 26 Bone cement and minimally invasive surgery in 2015 27 Use of patellar button for TKA in 2015 28 Use of posterior stabilized implants (PS) in 2015 29 Gender distribution in the counties in 2015 31 Distribution of surgery on weeks and months 31 Age distribution and incidence in the counties in 2015 32 Age standardized incidence in the counties in 2015 33 Implants for primary surgery during 2005–2014 33 Revisions 2005–2014 35 CRR in the counties after primary TKA for OA 2005–2014 36 CRR in the counties after primary UKA for OA 2005–2014 40 Relative risk of revision for primary implants 2005–2014 44 – if a liner change during infection is not considered a revision 46 CRR for commonly used TKA implants for OA 2005–2014 48 CRR for commonly used UKA implants for OA 2005–2014 50 Changes in risk of revision over time 51 Relative risk of revision for hospitals 2005–2014 52 – if a liner change during infection is not considered a revision 54 Patient characteristics and case-mix in knee arthroplasty 56 Profylactic antibiotics in knee arthroplasty 58 Antithrombotic prophylaxis in knee arthroplasty 60 Operative techniques in knee arthroplasty 62 Patient reported outcome (PROMs) before and after knee arthroplasty 64
Part III The knee osteotomy register 70 Patient characteristics and case-mix in knee osteotomy 72 Operative techniques and prophylaxis in knee osteotomy 73 Manual for filling out the knee arthroplasty form 76 The form for reporting knee arthroplasty 77 Manual for filling out the knee osteotomy form 79 The form for reporting knee osteotomy 81 ICD10- AND NOMESCO codes for adverse events 83 List of publications 85
Part IV Only for participating units – Data for patients reported in 2015

2 THE SWEDISH KNEE ARTHROPLASTY REGISTER – ANNUAL REPORT 2016 – PART I
The beginning – In the early seventies, knee arthro-plasty was an uncommon procedure restricted for those with severe disability. Little information was to be found in the literature while there was an abun-dant choice of implants which were continuously being modified. In this setting, the Swedish Ortho-pedic Association initiated a nationwide multicenter study in 1975, to prospectively monitor knee arthro-plasty surgery. The orthopedic surgeons realized that it would be impossible for an individual sur-geon to base his choice of optimal operative meth-ods or implants on his own experience. The aim was to collect, analyze and render information that could warn against suboptimal techniques and implants.
Number of units – The vast improvement in qual-ity of life for the majority of patients quickly made the surgery a success and the technique dis-persed to more hospitals and surgeons. Since the start of the registration in 1975, participation has been voluntary. 24 units reported during the first year increasing to 51 in 1985 and to 82 in 1996. In the late nineties, the number of units diminished somewhat due to the merger of hospitals. In 2015, 74 orthopedic units reported to the register, i.e. all units that routinely performed knee arthroplasty surgery in Sweden.
Volumes – Since the registration started, there has been an exponential increase in the number of opera-tions (see page 10). However, in 2013 the increase halted and in 2015 the number of primaries dimin-ished as compared to 2014 by 0.9% or from 13,000 to 12,886. Whatever the reasons may be, we consider it likely that the volumes will increase again as the incidence in Sweden (see page 15) still is lower than in countries such as USA and Germany. Further, even without an additional increase in age specific inci-dence, the expected changes in the age distribution of the population will increase the demand for surgery.
Patient Reported Outcome – The SKAR began early evaluating PROMs and put in effort searching for the most relevant instrument for patients under-going knee arthroplasty surgery which resulted in a thesis published in 2001. Recently there has been a renewed interest in PROMs by the authorities for the purpose of quality improvement. Thus, in 2008 the register started gathering PROM data from Skåne and since then, 8 units from other parts of the country have joined. Results can be found on the pages 64-69.
Registration of osteotomies – Osteotomies have been prospectively registered since 2013. This year the registration has a separate section on page 70.
Reporting to the register – The SKAR recom-mends that the form (page 77) is filled in the opera-tion theater and that one set of the stickers found in the implant and cement packages are stuck on the backside. The form is then sent to the register office in Lund where the information is entered into the database. The hospitals are requested to send the forms to the registry at least once a month. In the case of revisions, a copy of the operation report and discharge letter is required. The majority of the units observe the recommendations. The reason for not having introduced decentralized computer registration is that we consider it important that the registration is done in the operation room. This would call for improved computer solutions as well as a better flow of information from the implant distributors to the register in order to maintain an up-to-date part-number database. In our view, the paper-based system has at present essential advan-tages such as less workload at the surgical units, the most reliable information and fewer input errors. Further, during data entry, register staff can check part numbers against a local database and in the case of new numbers turning up contact the distributors. However, decentralized Internet data entering is used for PROMs. Those units that have decided to participate in the PROM project have an access to a specific Web application for this purpose.
Annual report – Each annual report accounts for primary arthroplasties reported during the previ-ous year (in this report 2015). Analyses concerning the revision rate end one year earlier (2014). The reason for this is that only a few errors in the regis-tration of revisions can have a large impact on the final result and an extra year allows for as complete and correct information as possible. As revisions are often complicated, the forms, discharge letters and operation reports have to be examined thor-oughly. Supplementary information is often needed before the reason for and the type of revision is rea-sonably clear. It also happens that unit’s send com-pleting information after discovering, by examining the annual report and the accompanying lists, that their previous reporting had been incomplete. The register is trying to improve the response times so that waiting an extra year will not be needed. How-
Introduction

THE SWEDISH KNEE ARTHROPLASTY REGISTER – ANNUAL REPORT 2016 – PART I 3
ever, this will demand an increased effort from the register staff as well as a quicker response from the hospitals when asked to complement their report-ing or provide supplementary information.
10-year analyses – Some have wondered why the register most often accounts for a 10-year revision rate while the registration has been going on for more than 30 years. – There are several reasons: The main reason is that the interest usually focuses on relatively modern techniques and implants. Another reason is that survival analyses allow for inclusion of patients during the entire observa-tion period. I.e. implants have been inserted in the beginning as well as in the end of the observation period. This implies that the first part of a revision (survival) curve includes operations performed both during the first and last part of the observa-tion period. The end of the curve (to the right), only includes operations inserted during the first part of the period. The result is that the latter part of the curve represents older techniques and implants as well as mainly the younger patients (those more likely to live to the end of the observation period). In summary, this means that without special selec-tions it is difficult to interpret curves that stretch over long time periods. A description of how the register compares implants can be found on page 12.
Cooperation – The SKAR has had close collabo-ration with the RCSyd (Register Center South) facilitated by the two sharing premises in Lund. As the RCSyd now has moved to new offices we hope to be able to continue the good and fruitful cooperation in spite of a little longer distance. The Nordic countries cooperate through the framework of NARA (Nordic Arthroplasty Register Asso-ciation) performing analyses of combined data-sets (Denmark, Norway, Sweden, Finland). The SKAR and the Australian Joint Replacement Reg-istry have common research projects. Further, the SKAR cooperates with other international orga-nizations such as ISAR (International Society of Arthroplasty Registries) and ICOR (International Collaboration of Orthopedic Registries) as well as with individual scientists in different countries. Besides collaborative projects resulting in inter-esting findings, they give the participants insight into each other´s methods for registration, selec-tion, analyses and reporting. In turn this hopefully will result in the registers approaching each other
so that it will be easier to compare their results in scientific papers and reports in the future.
The reporting form – Knee arthroplasty surgeries as well as osteotomies are reported on a very similar one page form that is used for both primaries and revi-sions (found at the end of the report). One set of the stickers that are found in the packages for the parts that are implanted in the patient (prosthesis, cement, osteotomy plates, bone substitute...) and which contain the part- and lot numbers should be placed on the backside of the form.
Validation of data quality – In order to use register data for scientific studies and quality improvement, it is of greatest importance that the information found in the register is valid. We have previously described our hospital visits which have resulted in improved routines with respect to registration and cooperation. Therefore, we have continued with the onsite validation project but only managed to visit 3 hospitals during the last year.
Feedback – The register reports in several ways; verbally, in print and using the Web. At annual meet-ings, contact surgeons from the participating hospi-tals are informed. Each unit receives their own data annually so they have the opportunity to check their own results. By publication of annual reports and scientific articles, as well as through participation in national and international conferences the register disseminates information to professionals, adminis-trators and other interested bodies.The register has a web-site (www.knee.se) where annual reports can be downloaded and a list of publications are available. There is also a secure server where the contact physicians at the partici-pating units can access the information that their unit has delivered to the registry and which includes information on primaries having been revised else-where. We are in the process of making this web-site more informative and have already introduced a new statistics section in which it is possible to get information for the country as a whole as well as for individual counties and hospitals..We also have a separate web-site aimed at patients where they can find practical information before surgery on how they can prepare themselves, what they can expect and how they can exercise when they come home after surgery (www.gangbar.se).

4 THE SWEDISH KNEE ARTHROPLASTY REGISTER – ANNUAL REPORT 2016 – PART I
Definitions
Revision is defined as a new operation in a previously resurfaced knee in which one or more of the components are exchanged, removed or added (incl. arthrodesis or amputation). This implies that soft tissue operations such as arthroscopy and lateral release are not considered revisions. The reason for this stringent definition is that not all surgeons do not consider some minor surgeries to be related to the arthroplasty or be a complication why reporting of such procedures is inconsequent.
TKA (Total or Tricompartmental Knee Arthro-plasty) is defined as a knee arthroplasty in which the femoral component has a flange and thus all three compartments of the knee are affected. Even in cases where a patellar button is absent, the flange resurfaces half of the femoropatellar compartment and the arthroplasty is still considered to be a TKA.
Bicompartmental arthroplasty (historical) uses two components, one on the femoral and one on the tibial side to resurface both the femorotibial compartments (medial and lateral) but not the fem-oropatellar compartment. Thus, this implant has no femoral flange and is not meant to allow for resur-facing of the patella.
UKA (Unicompartmental Knee Arthroplasty) implies an arthroplasty that separately resurfaces the medial or lateral femorotibial compartment. (med. UKA or lat. UKA). If 2 UKA implants are used to resurface both femorotibial compartments the arthroplasty is named bilateral UKA.
Patello-femoral arthroplasty is an arthroplasty which resurfaces the femoropatellar compartment. Even if this arthroplasty is unicompartmental by definition, it is accounted for separately.
Partial Replacement Knee Arthroplasty (PRKA) are implants (e.g. buttons) that only replace a part of a knee compartment.
Hinged implants. As the name implies these implants only allow for flexion and extension through a fixed axis.
Linked implants (Linked/Rotating hinge) have a mechanical coupling between the femoral and tibial components allowing for flexion and extension as well as for a varying amount of rotation.
Stabilized implants. Even if the hinges and the linked implants are extremely stabilizing, the term stabilized implants is used for a group of prostheses that are a kind of TKA but use the form of the femoral and tibial components to restrict movement in valgus, varus and rotation. The posterior cruciate sacrificing type most often has an eminence in the middle part of
the tibial polyethylene that can be contained by a box in the femoral component that lies between the medial and lateral sliding surfaces. By a camshaft-like prop-erty, the femoral component is forced to slide back during flexion, which simulates the effect of the pos-terior cruciate ligament. The fit between polyethylene and metal is such that it allows for some rotation. In so-called super stabilized implants the congruency has been increased by making the eminence larger with a total fit against the box of the femoral component thus, restricting the rotation and varus/valgus movement. Intermediary forms also occur. Stabilized implants are most often used for revision but also for the more difficult primary arthroplasties.
The ordinary TKA can be made somewhat more stabilized by increasing the congruency between the sliding surfaces. In these instances, there is a slight eminence of the polyethylene that fits against the femoral com ponent. However, the term stabilized is only used for those implants that are more stabilized than usual by use of the above mentioned camshaft construction.
TKA-revision models are TKA that are mainly used for revisions or difficult primaries. These are typically stabilized implants that often are used with stems. Many have proper names making them easy to distinguish from common TKA’s. However, due to the modularity of the modern TKA, a TKA brand may represent either a common TKA or a stabilized stemmed TKA depending on which components have been assembled. For the primary surgeries, this implies that some TKA brands are only used for standard cases while others also may be used for difficult primary cases. This can result in bias when com-paring models. In order to make comparison of revision rates after primary surgery as fair as pos-sible, the SKAR classifies certain TKA as being “revision models” and excludes them from the analyses. Accordingly, revision models with iden-tifiable names are excluded (e.g. NexGen-LCCK, AGC-Dual Articular and F/S-Revision) as well as those modular TKA’s that have been inserted using extra-long stems (5 cm. or more).
For those interested there is an excellent article on the history and the developement of the TKA; Robinson RP; The Early Innovators of Today’s Resurfacing Condylar Knees. J of Arthroplasty 2005 (suppl 1); 20: 1.

THE SWEDISH KNEE ARTHROPLASTY REGISTER – ANNUAL REPORT 2016 – PART I 5
Completeness concerning primaries reported in 2014
It is difficult to estimate how many of the knee arthroplasties performed are reported to the SKAR. It is possible to compare the SKAR with the National Patient Register (NPR), an inpatient register of the health authorities, based on ICD- and surgical codes but it complicates the compari-son that the registers focus on different variables (operations vs. admissions) and that laterality is inconsequently recorded in the NPR.
An additional problem may occur when surger-ies are not reported to the NPR as being performed at a specific hospital but as being from an adminis-trative body containing many hospitals.
To estimate the capture rate by the SKAR during 2014 the register was compared to the NPR. By
assuming that the true number of admissions was the combined number of admissions in both registers the completeness could be estimated. Although there is a possibility for patients having knee arthroplasty surgery without being registered in any of the registers, they are presumably few.
Using this method, we found that the SKAR had captured 96.8% of all admissions and the NPR 96.6%.
Below is a list of the units containing the com-bined number of operations from both registers as well as the completeness for each of the hospitals. Those who do not reach 96% completeness are marked in red. Units with low coverage are encour-aged to investigate if they missed reporting any sur-geries or if their surgical coding was erroneous.
Hospital Number SKAR- NPR percent percent Akademiska sjukhuset 88 96,6 98,9Alingsås 205 98,5 99,0Arvika 170 97,6 97,6Blekingesjukhuset* 4 0 100Bollnäs 409 97,8 97,6Borås** 78 100 94,9Capio Läkargruppen 2 0 100Carlanderska 140 97,9 97,9Danderyd 196 93,9 99,5Eksjö-Nässjö 213 99,1 99,5Elisabethkliniken 7 100 100Enköping 368 99,5 99,5Eskilstuna Mälarsjh. 44 93,2 95,5Falun 358 98,9 95,8Frölunda spec. sjukhus 128 93,8 98,4Gällivara 68 100 100Gävle 136 94,1 94,1Halmstad 192 99,0 99,5Halmstad Capio 284 87,7 99,6Helsingborg 46 95,7 95,7Huddinge 168 98,8 98,8Hudiksvall 61 98,4 98,4Hässleholm 654 97,6 98,3Jönköping Art Clinic 13 100 0Jönlköping Ryhov 168 100 99,4Kalmar 95 95,8 100Karlshamn* 242 100 98,3Karlskoga 129 96,1 100Karlstad 169 96,4 100Karolinska Solna 105 96,2 100Kullbergska 200 99,0 98,5Kungsbacka 2 0 100Kungälv 198 99,0 99,0Lidköping*** 199 100 98,5Lindesberg 172 98,8 100Linköping 1 0 100Ljungby 155 96,1 98,1Lund 99 98,0 97,0Lundby (Capio Gbg) 1 0 100Luleå Sensia 4 100 0Lycksele 94 100 97,9
Hospital Number SKAR- NPR percent percentMalmö 2 0 100Mora 152 98,7 99,3Motala 473 98,3 99,2Nacka 112 99,1 97,3Norrköping Vrinnevisjh. 142 98,6 97,2Norrtälje 87 97,7 98,9NU-sjukvården 2 0 100Nyköpings 98 98,0 100Ortho Center IFK Kliniken 106 96,2 98,1Orthocenter Stockholm 404 99,8 98,8Ortopediska Huset 432 96,8 75,0Oskarshamn 275 97,5 99,6Piteå 260 99,6 98,1S:t Görans 404 94,8 98,0Sabbatsberg 141 100 80,1Sahlgrenska**** 400 74,5 98,0Skaraborgs sjukhus*** 13 0 100Skellefteå 109 98,2 96,3Skene** 104 100 100Skövde*** 115 100 98,3Sollefteå 92 96,7 94,6Sophiahemmet 97 100 0Spenshult 161 96,3 99,4Sundsvall 96 99,0 97,9Södersjukhuset 322 97,5 97,5Södertälje 111 99,1 95,5Södra Älvsborgs sjukhus** 6 0 100Torsby 111 99,1 99,1Trelleborg 703 99,4 99,3Uddevalla 207 100 99,0Umeå 108 94,4 98,1Varberg 155 94,8 98,1Visby 73 95,9 97,3Värnamo 167 97,0 98,8Västervik 97 96,9 99,0Västerås 248 98,4 98,0Växjö 110 99,1 99,1Ängelholm 237 97,5 93,7Örebro 54 100 100Örnsköldsvik 90 97,8 98,9Östersund 110 96,4 98,2
* Blekingesjukhuset includes Karlshamn (that is in the list) as well as Karlskrona.** Södra Älvsborgs sjukhus includes Borås and Skene (which both are in the list).*** Skaraborgs sjukhus includes Lidköping and Skövde (which both are in the list) as well as Falköping och Mariestad.**** Sahlgrenska University hospital also includes Mölndal and Östra (most of the surgeries are performed at Mölndal.

6 THE SWEDISH KNEE ARTHROPLASTY REGISTER – ANNUAL REPORT 2016 – PART I
Adverse events within 90 days of knee arthroplasty
Introduction –Resurfacing a damaged joint considerably
improves quality of life, making joint replace-ments among the most cost-effective interventions. Although the procedure is considered safe with few complications, some patients experience health problems that may have been caused by, or become symptomatic as a result of the surgery.
Of historical and practical reasons, the Knee Arthroplasty Register (SKAR) has focused on reoperations in the knee and not registered other health issues. However, the national patient register (NPR) does that by registering ICD- and procedure codes for all patients treated in the official health system.
The National board of Health and Welfare has in cooperation with the Swedish Association of Local Authorities and Regions (SKL) described adverse events after hip- and knee arthroplasties, in their publication "Open comparisons". These have been based on readmissions using a short list of codes representing medical or surgical issues (http://www.socialstyrelsen.se/indikatorer).
The SKAR has with staff from the National Board of Health and Welfare examined the ICD10 and NOMESCO codes that occur in the NPR during admission for, and after knee arthroplasty. This has resulted in a longer list of codes that may represent adverse events when they occur during the hospital stay or in readmissions within 90 days of surgery.
Description –Patients having primary total knee arthroplasty for osteoarthritis during 2012-2014 were included. If both knees were operated within 90 days only the latter was included and only one knee in the case of simultaneous bilateral surgery. The SKAR sent data on registered patients to the NPR which performed the match. For all the patients it was examined if they had received diagnostic and/or procedure codes that corresponded to the definition of adverse events, during or after the hospital stay and up to 90 days after the primary surgery.
The codes were classified into following groups:A) Surgical procedure codes that include reope-rations of knee implants and other procedures that may represent a complication.DA) Diagnostic codes that imply surgical compli-cations.DB) Diagnostic codes that cover knee related diseases that may have been used for complications
after knee arthroplasty surgery.DC) Diagnostic codes covering cardiovascular events that may be related to the surgery.DM) Diagnostic codes concerning other medical events not related to the knee but that may be rela-ted to the surgery if they occur shortly afterwards.
Additionally it was checked if patients had died during the first 90 days.
The codes and information on how they were used can be found on page 83.
Error sources –The definition of an adverse event is based on diag-nostic and procedure codes and there may be diffe-rences between counties and units in how carefully the coding has been performed. However, informa-tion on death is not dependent on coding.
Inadequate registration in the NPR of secondary surgical dates during the primary hospital stay can result in an adverse event not being included.
Occasional units performing knee arthroplasty surgery do not report to the NPR. For these, adverse events occurring during the primary admission will not be included..
As the information in the NPR on laterality ofthe surgery is uncertain a complication in the oppo-site knee will count as an adverse event. However, we consider it unlikely that a complication or a procedure will be registered in the opposite knee within 90 days of surgery.
Finally it is important to realize that many adverse events (especially the medical ones) do not need to be causally related to the surgery. E.g. a patient might have a heart attack or die even without having an arthroplasty. This implies that regional differences in general health, access to health care and preventive medicine may influence the outcome. Results–
In the following pages we show for the diffe-rent counties and units what adverse events occur-red within 90 days (surgical, cardiovascular, other medical, death and all adverse events). Note that only one adverse event is counted for a patient within each group while the same patient can occur in multiple groups.

THE SWEDISH KNEE ARTHROPLASTY REGISTER – ANNUAL REPORT 2016 – PART I 7
County Surgeries Events Risk/1000
Blekinge 370 17 45.9Dalarna 834 23 27.6Gotland 125 6 48.0Gävleborg 794 19 23.9Halland 1,383 51 36.9Jämtland 249 14 56.2Jönköping 825 25 30.3Kalmar 746 49 65.7Kronoberg 358 16 44.7Norrbotten 575 21 36.5Skåne 2,597 59 22.7Stockholm 3,860 138 35.8Sörmland 575 14 24.3Uppsala 828 61 73.7Värmland 703 23 32.7Västerbotten 498 51 102.4Västernorrland 479 21 43.8Västmanland 433 20 46.2Västra Götaland 2,604 59 22.7Örebro 597 8 13.4Östergötland 1,015 40 39.4The Ccountry 20,448 735 35.9
WOMEN in the countiesAdverse surgical events within 90 days (A, DA & DB)
County Surgeries Events Risk/1000
Blekinge 336 20 59.5Dalarna 659 26 39.5Gotland 112 6 53.6Gävleborg 668 24 35.9Halland 1,107 44 39.7Jämtland 158 14 88.6Jönköping 589 23 39.0Kalmar 554 32 57.8Kronoberg 260 16 61.5Norrbotten 456 15 32.9Skåne 1,924 66 34.3Stockholm 2,717 117 43.1Sörmland 406 19 46.8Uppsala 597 43 72.0Värmland 509 22 43.2Västerbotten 348 37 106.3Västernorrland 382 20 52.4Västmanland 305 12 39.3Västra Götaland 2,120 62 29.2Örebro 462 13 28.1Östergötland 687 46 67.0The Ccountry 15,356 677 44.1
MEN in the countiesAdverse surgical events within 90 days (A, DA & DB)
County Surgeries Events Risk/1000
Blekinge 370 1 2.7Dalarna 834 5 6.0Gotland 125 1 8.0Gävleborg 794 3 3.8Halland 1,383 4 2.9Jämtland 249 2 8.0Jönköping 825 8 9.7Kalmar 746 7 9.4Kronoberg 358 2 5.6Norrbotten 575 5 8.7Skåne 2,597 14 5.4Stockholm 3,860 28 7.3Sörmland 575 7 12.2Uppsala 828 8 9.7Värmland 703 4 5.7Västerbotten 498 8 16.1Västernorrland 479 3 6.3Västmanland 433 9 20.8Västra Götaland 2,604 18 6.9Örebro 597 6 10.1Östergötland 1,015 8 7.9The Ccountry 20 448 151 7.4
Adverse cardiovascular events within 90 days (DC)
County Surgeries Events Risk/1000
Blekinge 336 5 14.9Dalarna 659 12 18.2Gotland 112 2 17.9Gävleborg 668 11 16.5Halland 1,107 12 10.8Jämtland 158 6 38.0Jönköping 589 7 11.9Kalmar 554 4 7.2Kronoberg 260 3 11.5Norrbotten 456 4 8.8Skåne 1,924 19 9.9Stockholm 2,717 24 8.8Sörmland 406 5 12.3Uppsala 597 7 11.7Värmland 509 7 13.8Västerbotten 348 8 23.0Västernorrland 382 6 15.7Västmanland 305 2 6.6Västra Götaland 2,120 18 8.5Örebro 462 7 15.2Östergötland 687 7 10.2The Ccountry 15,356 176 11.5
Adverse cardiovascular events within 90 days (DC)
County Surgeries Events Risk/1000
Blekinge 370 3 8.1Dalarna 834 9 10.8Gotland 125 2 16.0Gävleborg 794 12 15.1Halland 1,383 13 9.4Jämtland 249 6 24.1Jönköping 825 14 17.0Kalmar 746 14 18.8Kronoberg 358 5 14.0Norrbotten 575 4 7.0Skåne 2,597 24 9.2Stockholm 3,860 41 10.6Sörmland 575 7 12.2Uppsala 828 10 12.1Värmland 703 6 8.5Västerbotten 498 9 18.1Västernorrland 479 12 25.1Västmanland 433 2 4.6Västra Götaland 2,604 29 11.1Örebro 597 2 3.4Östergötland 1,015 8 7.9The Ccountry 20,448 232 11.3
Other adverse medical events within 90 days. (DM)
County Surgeries Events Risk/1000
Blekinge 336 4 11.9Dalarna 659 5 7.6Gotland 112 2 17.9Gävleborg 668 7 10.5Halland 1,107 13 11.7Jämtland 158 4 25.3Jönköping 589 14 23.8Kalmar 554 8 14.4Kronoberg 260 7 26.9Norrbotten 456 6 13.2Skåne 1,924 36 18.7Stockholm 2,717 37 13.6Sörmland 406 5 12.3Uppsala 597 11 18.4Värmland 509 8 15.7Västerbotten 348 18 51.7Västernorrland 382 12 31.4Västmanland 305 1 3.3Västra Götaland 2,120 26 12.3Örebro 462 2 4.3Östergötland 687 16 23.3The Ccountry 15,356 242 15.8
Other adverse medical events within 90 days. (DM)

8 THE SWEDISH KNEE ARTHROPLASTY REGISTER – ANNUAL REPORT 2016 – PART I
County Surgeries Events Risk/1000
Blekinge 370 1 2.7Dalarna 834 3 3.6Gotland 125 0 0.0Gävleborg 794 1 1.3Halland 1,383 0 0.0Jämtland 249 1 4.0Jönköping 825 0 0.0Kalmar 746 3 4.0Kronoberg 358 0 0.0Norrbotten 575 2 3.5Skåne 2,597 3 1.2Stockholm 3,860 5 1.3Sörmland 575 3 5.2Uppsala 828 1 1.2Värmland 703 1 1.4Västerbotten 498 0 0.0Västernorrland 479 0 0.0Västmanland 433 0 0.0Västra Götaland 2,604 4 1.5Örebro 597 0 0.0Östergötland 1,015 0 0.0The Ccountry 20,448 28 1.4
WOMEN in the countiesDeath within 90 days
County Surgeries Events Risk/1000
Blekinge 336 1 3.0Dalarna 659 3 4.6Gotland 112 0 0.0Gävleborg 668 1 1.5Halland 1,107 0 0.0Jämtland 158 1 6.3Jönköping 589 3 5.1Kalmar 554 0 0.0Kronoberg 260 0 0.0Norrbotten 456 2 4.4Skåne 1,924 8 4.2Stockholm 2,717 4 1.5Sörmland 406 2 4.9Uppsala 597 0 0.0Värmland 509 0 0.0Västerbotten 348 0 0.0Västernorrland 382 1 2.6Västmanland 305 0 0.0Västra Götaland 2,120 2 0.9Örebro 462 3 6.5Östergötland 687 1 1.5The Ccountry 15,356 32 2.1
MEN in the countiesDeath within 90 days
County Surgeries Events Risk/1000
Blekinge 370 22 59.5Dalarna 834 37 44.4Gotland 125 8 64.0Gävleborg 794 34 42.8Halland 1,383 66 47.7Jämtland 249 21 84.3Jönköping 825 44 53.3Kalmar 746 70 93.8Kronoberg 358 23 64.2Norrbotten 575 30 52.2Skåne 2,597 97 37.4Stockholm 3,860 203 52.6Sörmland 575 28 48.7Uppsala 828 75 90.6Värmland 703 32 45.5Västerbotten 498 61 122.5Västernorrland 479 34 71.0Västmanland 433 28 64.7Västra Götaland 2,604 100 38.4Örebro 597 16 26.8Östergötland 1,015 54 53.2The Ccountry 20,448 1,083 53.0
All adverse events within 90 days (incl. death)
County Surgeries Events Risk/1000
Blekinge 336 29 86.3Dalarna 659 42 63.7Gotland 112 10 89.3Gävleborg 668 39 58.4Halland 1,107 66 59.6Jämtland 158 22 139.2Jönköping 589 46 78.1Kalmar 554 42 75.8Kronoberg 260 23 88.5Norrbotten 456 26 57.0Skåne 1,924 111 57.7Stockholm 2,717 176 64.8Sörmland 406 27 66.5Uppsala 597 57 95.5Värmland 509 36 70.7Västerbotten 348 51 146.6Västernorrland 382 36 94.2Västmanland 305 15 49.2Västra Götaland 2,120 103 48.6Örebro 462 22 47.6Östergötland 687 65 94.6The Ccountry 15,356 1,044 68.0
All adverse events within 90 days (incl. death)
The unadjusted tables, for the counties above and for the hospitals on the following pages, show the adverse events occurring during the primary stay or within 90 days or surgery.
It can be seen that adverse events are more common for men in all the groups. This is also true after adjustment for age (not shown). Four % of the patients experience surgical events which may include aspirations, wound problems, manipula-tion under anesthesia, hematoma etc. The "true" in which implant components are added, removed or exchanged, and which the SKAR focuses on, account for less than one fifth of the adverse events the first three months. 0.9% have cardiovascular events, 1.3% have other adverse medical events
while only 0.17% die within the first 90 days. The overall risk for a patient for experiencing an adverse event during this time is 5.9%.
It may be helpful to have access to this infor-mation when patients are informed about possible risks associated with the surgery. T
It may be problematic to compare the number of adverse events between hospitals and counties as there may be a variation in the routines for coding events. However, the numbers provide useful infor-mation of how common adverse events are at the different locations and may indicate where addi-tional analyses and improvement measures are indicated.

THE SWEDISH KNEE ARTHROPLASTY REGISTER – ANNUAL REPORT 2016 – PART I 9
Hospital (men & women) Surgeries Events Risk/1000
Akademiska sjukhuset 246 15 61.0Alingsås 594 9 15.2Art Clinic Jönköping 22 0 0.0Arvika 425 12 28.2Bollnäs 910 22 24.2Borås 239 14 58.6Carlanderska 352 1 2.8Danderyd 388 15 38.7Eksjö-Nässjö 526 23 43.7Elisabethkliniken 111 3 27.0Enköping 1,068 86 80.5Eskilstuna 101 6 59.4Falun 994 41 41.2Frölunda Spec. 356 5 14.0Gothenburg Med Center 273 1 3.7Gällivare 229 6 26.2Gävle 355 14 39.4Halmstad 642 37 57.6Helsingborg 73 4 54.8Huddinge 369 14 37.9Hudiksvall 197 7 35.5Hässleholm 1,790 68 38.0Jönköping 460 10 21.7Kalmar 247 7 28.3Karlshamn 706 37 52.4Karlskoga 385 7 18.2Karlstad 441 27 61.2Karolinska 284 22 77.5Kullbergska sjukhuset 636 27 42.5Kungälv 447 19 42.5Lidköping 531 21 39.5Lindesberg 526 11 20.9Ljungby 314 15 47.8Luleå-Sensia 9 0 0.0Lund 143 6 42.0Lycksele 224 18 80.4Löwenströmska 1,209 23 19.0Malmö 9 0 0.0Mora 499 8 16.0Motala 1,305 68 52.1Movement Halmstad 650 16 24.6Mölndal 645 13 20.2Nacka-Proxima/Aleris 372 10 26.9Norrköping 397 18 45.3Norrtälje 211 12 56.9Nyköping 244 0 0.0Ortopediska huset 1,162 32 27.5Oskarshamn 754 59 78.2Piteå 790 30 38.0S:t Göran 946 45 47.6Sabbatsberg 386 3 7.8Skellefteå 273 13 47.6Skene 331 8 24.2Skövde 416 13 31.3Sollefteå 274 8 29.2Sophiahemmet 205 6 29.3Spenshult 728 22 30.2Sunderby 3 0 0.0Sundsvall 294 19 64.6Södersjukhuset 766 58 75.7Södertälje 279 15 53.8Torsby 346 6 17.3Trelleborg 1,943 31 16.0Uddevalla 539 17 31.5Umeå 349 57 163.3Varberg 470 20 42.6Visby 237 12 50.6Värnamo 406 15 36.9Västervik 299 15 50.2Västerås 738 32 43.4Växjö 304 17 55.9Ängelholm 563 16 28.4Örebro 148 3 20.3Örnsköldsvik 293 14 47.8Östersund 407 28 68.8The Ccountry 35,804 1,412 39.4,
Adverse surgical events within 90 days (A, DA & DB)
County Surgeries Events Risk/1000
Blekinge 706 2 2.5Dalarna 1,493 6 4.0Gotland 237 0 0.0Gävleborg 1,462 2 1.4Halland 2,490 0 0.0Jämtland 407 2 3.8Jönköping 1,414 3 2.0Kalmar 1,300 3 2.2Kronoberg 618 0 0.0Norrbotten 1,031 4 4.1Skåne 4,521 11 2.4Stockholm 6,577 10 1.5Sörmland 981 4 4.4Uppsala 1,425 1 0.8Värmland 1,212 1 0.7Västerbotten 846 0 0.0Västernorrland 861 1 1.2Västmanland 738 0 0.0Västra Götaland 4,724 6 1.3Örebro 1,059 3 3.1Östergötland 1,702 1 0.5The Ccountry 35,804 60 1.7
Age- and sex adjusted results for the countiesDeath within 90 days
County Surgeries Events Risk/1000
Blekinge 706 47 67.1Dalarna 1,493 79 53.0Gotland 237 17 72.6Gävleborg 1,462 73 50.0Halland 2,490 134 53.8Jämtland 407 43 104.5Jönköping 1,414 89 63.3Kalmar 1,300 111 85.3Kronoberg 618 49 79.5Norrbotten 1,031 56 54.4Skåne 4,521 207 45.8Stockholm 6,577 382 58.1Sörmland 981 54 55.5Uppsala 1,425 132 92.6Värmland 1,212 67 55.6Västerbotten 846 111 130.7Västernorrland 861 71 82.1Västmanland 738 42 57.2Västra Götaland 4 724 202 42.8Örebro 1,059 37 35.2Östergötland 1,702 122 71.4The Country 35,804 2,127 59.4
Age- and sex adjusted results for the countiesAll adverse events within 90 days (incl. death)
The tables above show age- and gender adjusted results for the counties concerning death as well as all adverse events. It can be seen for all adverse events that there is considerable variation between the counties in spite of the adjstment. This is also true for the number of deaths which are differently registered and not affected by differences in coding.
The following tables show the unadjusted number of adverse events in the different hospi-tals. It might be of interest for individual hospitals to receive information om which of their patients were affected. However, as the SKAR only receives aggregated information from the PAR we unfortu-nately do not have access to this information.

10 THE SWEDISH KNEE ARTHROPLASTY REGISTER – ANNUAL REPORT 2016 – PART I
Hospital (men & women) Surgeries Events Risk/1000
Akademiska sjukhuset 246 6 24.4Alingsås 594 6 10.1Art Clinic Jönköping 22 0 0.0Arvika 425 3 7.1Bollnäs 910 4 4.4Borås 239 7 29.3Carlanderska 352 1 2.8Danderyd 388 13 33.5Eksjö-Nässjö 526 10 19.0Elisabethkliniken 111 1 9.0Enköping 1,068 14 13.1Eskilstuna 101 2 19.8Falun 994 13 13.1Frölunda Spec. 356 0 0.0Gothenburg Med Center 273 0 0.0Gällivare 229 1 4.4Gävle 355 11 31.0Halmstad 642 13 20.2Helsingborg 73 1 13.7Huddinge 369 2 5.4Hudiksvall 197 4 20.3Hässleholm 1,790 32 17.9Jönköping 460 8 17.4Kalmar 247 5 20.2Karlshamn 706 7 9.9Karlskoga 385 3 7.8Karlstad 441 7 15.9Karolinska 284 9 31.7Kullbergska sjukhuset 636 7 11.0Kungälv 447 3 6.7Lidköping 531 10 18.8Lindesberg 526 0 0.0Ljungby 314 5 15.9Luleå-Sensia 9 0 0.0Lund 143 4 28.0Lycksele 224 8 35.7Löwenströmska 1,209 7 5.8Malmö 9 0 0.0Mora 499 1 2.0Motala 1,305 9 6.9Movement Halmstad 650 4 6.2Mölndal 645 5 7.8Nacka-Proxima/Aleris 372 0 0.0Norrköping 397 15 37.8Norrtälje 211 6 28.4Nyköping 244 3 12.3Ortopediska huset 1,162 2 1.7Oskarshamn 754 14 18.6Piteå 790 9 11.4S:t Göran 946 16 16.9Sabbatsberg 386 1 2.6Skellefteå 273 3 11.0Skene 331 8 24.2Skövde 416 3 7.2Sollefteå 274 3 10.9Sophiahemmet 205 1 4.9Spenshult 728 1 1.4Sunderby 3 0 0.0Sundsvall 294 7 23.8Södersjukhuset 766 17 22.2Södertälje 279 4 14.3Torsby 346 4 11.6Trelleborg 1,943 19 9.8Uddevalla 539 12 22.3Umeå 349 16 45.8Varberg 470 8 17.0Visby 237 4 16.9Värnamo 406 10 24.6Västervik 299 3 10.0Västerås 738 3 4.1Växjö 304 7 23.0Ängelholm 563 4 7.1Örebro 148 1 6.8Örnsköldsvik 293 14 47.8Östersund 407 10 24.6The Ccountry 35,804 474 13.2
Other adverse medical events within 90 days. (DM)
Hospital (men & women) Surgeries Events Risk/1000
Akademiska sjukhuset 246 3 12.2Alingsås 594 2 3.4Art Clinic Jönköping 22 0 0.0Arvika 425 5 11.8Bollnäs 910 5 5.5Borås 239 2 8.4Carlanderska 352 1 2.8Danderyd 388 4 10.3Eksjö-Nässjö 526 7 13.3Elisabethkliniken 111 0 0.0Enköping 1,068 12 11.2Eskilstuna 101 2 19.8Falun 994 8 8.0Frölunda Spec. 356 0 0.0Gothenburg Med Center 273 1 3.7Gällivare 229 1 4.4Gävle 355 7 19.7Halmstad 642 4 6.2Helsingborg 73 1 13.7Huddinge 369 6 16.3Hudiksvall 197 2 10.2Hässleholm 1,790 12 6.7Jönköping 460 3 6.5Kalmar 247 3 12.1Karlshamn 706 6 8.5Karlskoga 385 6 15.6Karlstad 441 1 2.3Karolinska 284 7 24.6Kullbergska sjukhuset 636 4 6.3Kungälv 447 7 15.7Lidköping 531 5 9.4Lindesberg 526 7 13.3Ljungby 314 3 9.6Luleå-Sensia 9 1 111.1Lund 143 2 14.0Lycksele 224 2 8.9Löwenströmska 1,209 3 2.5Malmö 9 0 0.0Mora 499 9 18.0Motala 1,305 12 9.2Movement Halmstad 650 4 6.2Mölndal 645 4 6.2Nacka-Proxima/Aleris 372 2 5.4Norrköping 397 3 7.6Norrtälje 211 3 14.2Nyköping 244 6 24.6Ortopediska huset 1,162 7 6.0Oskarshamn 754 7 9.3Piteå 790 7 8.9S:t Göran 946 4 4.2Sabbatsberg 386 1 2.6Skellefteå 273 1 3.7Skene 331 5 15.1Skövde 416 1 2.4Sollefteå 274 2 7.3Sophiahemmet 205 1 4.9Spenshult 728 3 4.1Sunderby 3 0 0.0Sundsvall 294 1 3.4Södersjukhuset 766 11 14.4Södertälje 279 3 10.8Torsby 346 5 14.5Trelleborg 1,943 15 7.7Uddevalla 539 8 14.8Umeå 349 13 37.2Varberg 470 5 10.6Visby 237 3 12.7Värnamo 406 5 12.3Västervik 299 1 3.3Västerås 738 11 14.9Växjö 304 2 6.6Ängelholm 563 3 5.3Örebro 148 0 0.0Örnsköldsvik 293 6 20.5Östersund 407 8 19.7The Ccountry 35,804 327 9.1
Adverse cardiovascular events within 90 days (DC)

THE SWEDISH KNEE ARTHROPLASTY REGISTER – ANNUAL REPORT 2016 – PART I 11
Hospital (men & women) Surgeries Events Risk/1000
Akademiska sjukhuset 246 22 89.4Alingsås 594 16 26.9Art Clinic Jönköping 22 0 0.0Arvika 425 20 47.1Bollnäs 910 31 34.1Borås 239 22 92.1Carlanderska 352 2 5.7Danderyd 388 31 79.9Eksjö-Nässjö 526 40 76.0Elisabethkliniken 111 4 36.0Enköping 1,068 106 99.3Eskilstuna 101 10 99.0Falun 994 61 61.4Frölunda Spec. 356 6 16.9Gothenburg Med Center 273 2 7.3Gällivare 229 9 39.3Gävle 355 29 81.7Halmstad 642 51 79.4Helsingborg 73 8 109.6Huddinge 369 23 62.3Hudiksvall 197 13 66.0Hässleholm 1,790 100 55.9Jönköping 460 20 43.5Kalmar 247 15 60.7Karlshamn 706 51 72.2Karlskoga 385 16 41.6Karlstad 441 35 79.4Karolinska 284 38 133.8Kullbergska sjukhuset 636 37 58.2Kungälv 447 28 62.6Lidköping 531 34 64.0Lindesberg 526 18 34.2Ljungby 314 22 70.1Luleå-Sensia 9 1 111.1Lund 143 12 83.9Lycksele 224 25 111.6Löwenströmska 1,209 32 26.5Malmö 9 0 0.0Mora 499 18 36.1Motala 1,305 85 65.1Movement Halmstad 650 23 35.4Mölndal 645 22 34.1Nacka-Proxima/Aleris 372 11 29.6Norrköping 397 34 85.6Norrtälje 211 19 90.0Nyköping 244 8 32.8Ortopediska huset 1,162 41 35.3Oskarshamn 754 78 103.4Piteå 790 46 58.2S:t Göran 946 64 67.7Sabbatsberg 386 5 13.0Skellefteå 273 14 51.3Skene 331 20 60.4Skövde 416 17 40.9Sollefteå 274 13 47.4Sophiahemmet 205 8 39.0Spenshult 728 26 35.7Sunderby 3 0 0.0Sundsvall 294 26 88.4Södersjukhuset 766 84 109.7Södertälje 279 23 82.4Torsby 346 13 37.6Trelleborg 1,943 65 33.5Uddevalla 539 34 63.1Umeå 349 73 209.2Varberg 470 32 68.1Visby 237 18 75.9Värnamo 406 30 73.9Västervik 299 19 63.5Västerås 738 43 58.3Växjö 304 24 78.9Ängelholm 563 23 40.9Örebro 148 4 27.0Örnsköldsvik 293 31 105.8Östersund 407 43 105.7The Ccountry 35,804 2,127 59.4
All adverse events within 90 days (incl. death)
Hospital (men & women) Surgeries Events Risk/1000
Akademiska sjukhuset 246 0 0.0Alingsås 594 0 0.0Art Clinic Jönköping 22 0 0.0Arvika 425 0 0.0Bollnäs 910 0 0.0Borås 239 2 8.4Carlanderska 352 0 0.0Danderyd 388 1 2.6Eksjö-Nässjö 526 3 5.7Elisabethkliniken 111 0 0.0Enköping 1,068 1 0.9Eskilstuna 101 1 9.9Falun 994 5 5.0Frölunda Spec. 356 1 2.8Gothenburg Med Center 273 0 0.0Gällivare 229 1 4.4Gävle 355 2 5.6Halmstad 642 0 0.0Helsingborg 73 3 41.1Huddinge 369 1 2.7Hudiksvall 197 0 0.0Hässleholm 1,790 4 2.2Jönköping 460 0 0.0Kalmar 247 1 4.0Karlshamn 706 2 2.8Karlskoga 385 2 5.2Karlstad 441 1 2.3Karolinska 284 0 0.0Kullbergska sjukhuset 636 2 3.1Kungälv 447 0 0.0Lidköping 531 0 0.0Lindesberg 526 1 1.9Ljungby 314 0 0.0Luleå-Sensia 9 0 0.0Lund 143 0 0.0Lycksele 224 0 0.0Löwenströmska 1,209 1 0.8Malmö 9 0 0.0Mora 499 1 2.0Motala 1,305 1 0.8Movement Halmstad 650 0 0.0Mölndal 645 1 1.6Nacka-Proxima/Aleris 372 0 0.0Norrköping 397 0 0.0Norrtälje 211 1 4.7Nyköping 244 2 8.2Ortopediska huset 1,162 1 0.9Oskarshamn 754 1 1.3Piteå 790 3 3.8S:t Göran 946 2 2.1Sabbatsberg 386 0 0.0Skellefteå 273 0 0.0Skene 331 0 0.0Skövde 416 2 4.8Sollefteå 274 0 0.0Sophiahemmet 205 0 0.0Spenshult 728 0 0.0Sunderby 3 0 0.0Sundsvall 294 0 0.0Södersjukhuset 766 1 1.3Södertälje 279 1 3.6Torsby 346 0 0.0Trelleborg 1,943 4 2.1Uddevalla 539 0 0.0Umeå 349 0 0.0Varberg 470 0 0.0Visby 237 0 0.0Värnamo 406 0 0.0Västervik 299 1 3.3Västerås 738 0 0.0Växjö 304 0 0.0Ängelholm 563 0 0.0Örebro 148 0 0.0Örnsköldsvik 293 1 3.4Östersund 407 2 4.9The Ccountry 35,804 60 1.7
Death within 90 days

12 THE SWEDISH KNEE ARTHROPLASTY REGISTER – ANNUAL REPORT 2016 – PART I
�������
�
�
��
��
��
��
� � � � � � � � � � ��
��� �
���
����
����
��
��������������������������
���
��
�������� �������� ����������
���������������������
������������������������
�������������������
Survival analyses are used for graphical presentation of data. The curves show the Cumulative Revision Rate (CRR) which describes what percentage of the operated patients was expected to become revised with time. The calculation is based on the sum of all the revisions and expresses the rate for surviving patients. Most often the time axis shows a 10-year period. However, it has to be kept in mind that patients are continuously being added during this time. Thus, all the patients have not been followed for the whole period. This implies that if 1,000 patients were operated on each year (and nobody dies), a 10-year study would include 10,000 patients of which only 1,000 had been followed for more than 9 years. The last part of the curve (at the right) therefore expresses the long-term rate of revision for patients operated more than 9 years earlier. As the number of these patients is relatively small, the 95% confidence interval becomes large. When the number of patients at risk is small (at the right of the curve), each revision has a large effect (e.g. 50% are revised when 2 patients are left at risk and one of them has a revision). For this reason, the Register cuts the curves when less than 40 patients are left at risk.
Survival statistics are used to calculate how long an implant is left unrevised. With increasing observation time, the fraction of deceased patients increases (figure below). These patients are not disregarded because they were at risk of becoming revised during their lifetime and are thus allowed to deliver data for the period they lived. The prob-ability for each revision is related to the number of remaining unrevised patients. The sum of all the probabilities is the cumulative risk of revision which specifies the risk for a surviving patient of becoming revised at a given time.
Cox regression allows for taking into account different factors that may vary within groups. The results are expressed as risk ratios (RR) between factors. If a factor is a category (e.g. implant model), one category is defined as a reference with a risk of 1 to which the other categories are compared. An implant or a unit with the risk of 1.2 thus has a 20% increased risk of becoming revised etc. For numerical variables (e.g. age) the risk ratio relates to the change in risk if the variable increases by one unit (e.g. 1 year). When comparing groups where uneven distribution of factors can be expected (e.g. age in cemented vs. uncemented implants) the Cox regression is especially important.
How the register compares implants
It is important to note that as the individual patient also is at risk of dying, the real proportion of revisions is lower than the CRR. As the figure below shows, more than 3/4 of the patients that were operated in 1980 deceased without having been revised Half of those still alive have suffered revision.
Estimating differences between units in risk of revision is complicated by their varying volumes. The reason is that units performing few operations are more likely to have overly good or bad results. Therefore, the register received help from RCSyd statisticians to calculate risks using a “shared gamma frailty model” which takes volume into con-sideration. Still it has to observed that the units may have different “case-mix”, e.g. patients with differ-ent grades of joint destruction, differences in general health, activity etc.. Such factors, which we at are unable to take into account, may influence the risk of revision and thus the results of individual units.
CRR curve example.
100
90
80
70
60
50
40
30
20
10
0 Cop
yrig
ht ©
201
6 S
KA
R
1975 1980 1985 1990 1995 2000 2005 2010 2015
Yearly distribution (%)
Year of operation
Deceased and unrevised
Deceased and revised
Living and unrevised
Living and revised
The present status for each yearly batch of patients operatedsince 1975.
THE SWEDISH KNEE ARTHROPLASTY REGISTER – ANNUAL REPORT 2016 – PART I 13
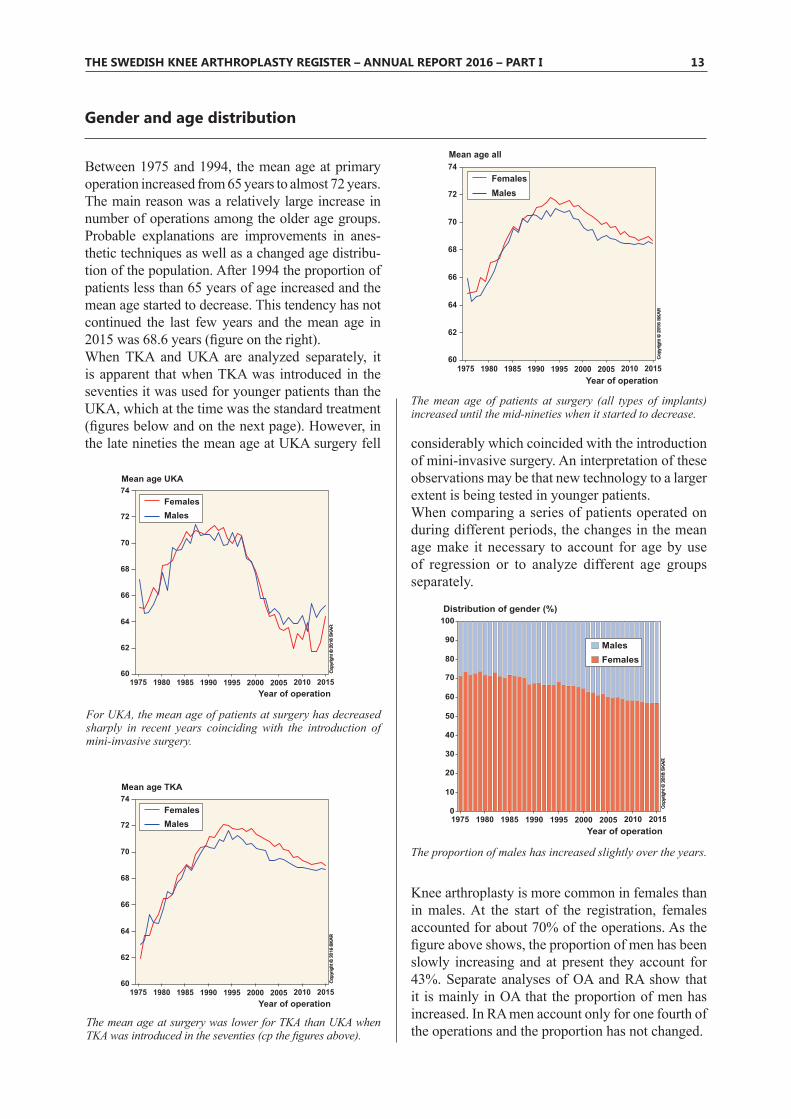
Between 1975 and 1994, the mean age at primary operation increased from 65 years to almost 72 years. The main reason was a relatively large increase in number of operations among the older age groups. Probable explanations are improvements in anes-thetic techniques as well as a changed age distribu-tion of the population. After 1994 the proportion of patients less than 65 years of age increased and the mean age started to decrease. This tendency has not continued the last few years and the mean age in 2015 was 68.6 years (figure on the right).When TKA and UKA are analyzed separately, it is apparent that when TKA was introduced in the seventies it was used for younger patients than the UKA, which at the time was the standard treatment (figures below and on the next page). However, in the late nineties the mean age at UKA surgery fell
Gender and age distribution
74
72
70
68
66
64
62
60 Cop
yrig
ht ©
201
6 S
KA
R
1975 1980 1985 1990 1995 2000 2005 2010 2015
Mean age all
Year of operation
FemalesMales
The mean age of patients at surgery (all types of implants) increased until the mid-nineties when it started to decrease.
The proportion of males has increased slightly over the years.
100
90
80
70
60
50
40
30
20
10
0 Cop
yrig
ht ©
201
6 S
KA
R
1975 1980 1985 1990 1995 2000 2005 2010 2015
Distribution of gender (%)
Year of operation
MalesFemales
74
72
70
68
66
64
62
60 Cop
yrig
ht ©
201
6 S
KA
R
1975 1980 1985 1990 1995 2000 2005 2010 2015
Mean age TKA
Year of operation
FemalesMales
74
72
70
68
66
64
62
60 Cop
yrig
ht ©
201
6 S
KA
R
1975 1980 1985 1990 1995 2000 2005 2010 2015
Mean age UKA
Year of operation
FemalesMales
considerably which coincided with the introduction of mini-invasive surgery. An interpretation of these observations may be that new technology to a larger extent is being tested in younger patients.When comparing a series of patients operated on during different periods, the changes in the mean age make it necessary to account for age by use of regression or to analyze different age groups separately.
The mean age at surgery was lower for TKA than UKA when TKA was introduced in the seventies (cp the figures above).
For UKA, the mean age of patients at surgery has decreased sharply in recent years coinciding with the introduction of mini-invasive surgery.
Knee arthroplasty is more common in females than in males. At the start of the registration, females accounted for about 70% of the operations. As the figure above shows, the proportion of men has been slowly increasing and at present they account for 43%. Separate analyses of OA and RA show that it is mainly in OA that the proportion of men has increased. In RA men account only for one fourth of the operations and the proportion has not changed.
14 THE SWEDISH KNEE ARTHROPLASTY REGISTER – ANNUAL REPORT 2016 – PART I
100
90
80
70
60
50
40
30
20
10
0 Cop
yrig
ht ©
201
6 S
KA
R
1975 1980 1985 1990 1995 2000 2005 2010 2015
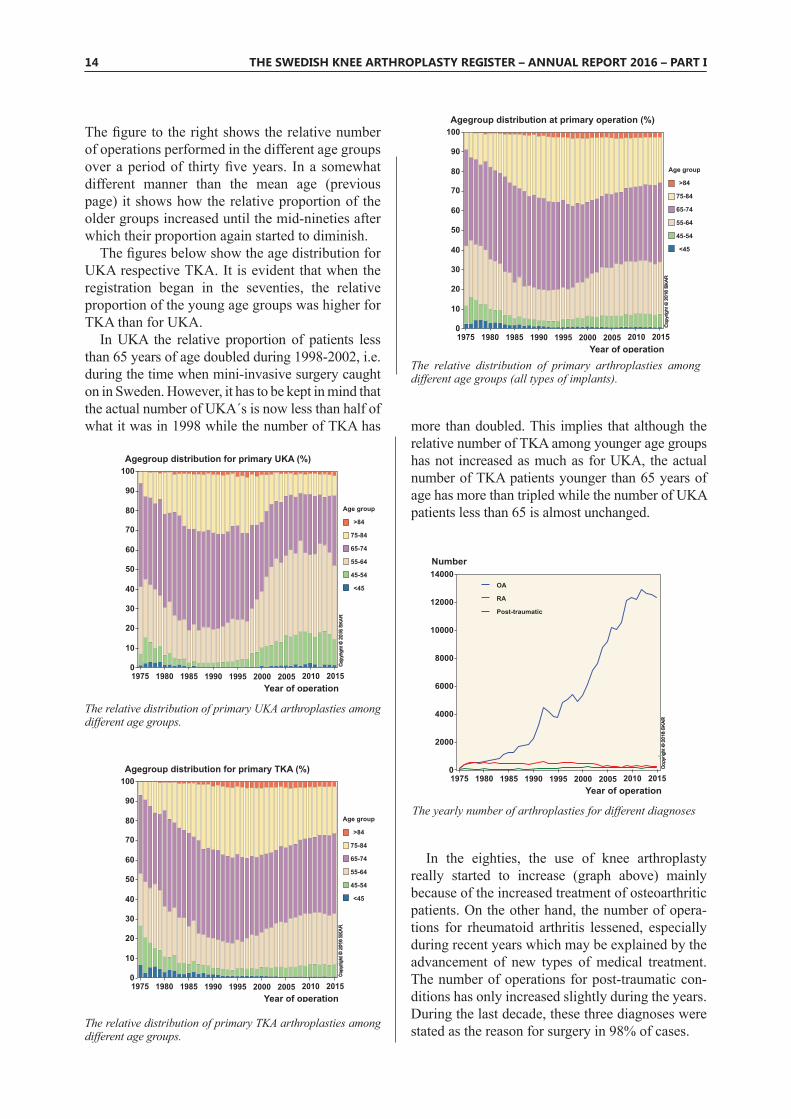
Agegroup distribution at primary operation (%)
Year of operation
Age group
>84
75-84
65-74
55-64
45-54
<45
12000
10000
8000
6000
4000
2000
0
14000
Cop
yrig
ht ©
201
6 S
KA
R
1975 1980 1985 1990 1995 2000 2005 2010 2015
Number
Year of operation
OA
RA
Post-traumatic
In the eighties, the use of knee arthroplasty really started to increase (graph above) mainly because of the increased treatment of osteoarthritic patients. On the other hand, the number of opera-tions for rheumatoid arthritis lessened, especially during recent years which may be explained by the advancement of new types of medical treatment. The number of operations for post-traumatic con-ditions has only increased slightly during the years. During the last decade, these three diagnoses were stated as the reason for surgery in 98% of cases.
The figure to the right shows the relative number of operations performed in the different age groups over a period of thirty five years. In a somewhat different manner than the mean age (previous page) it shows how the relative proportion of the older groups increased until the mid-nineties after which their proportion again started to diminish.
The figures below show the age distribution for UKA respective TKA. It is evident that when the registration began in the seventies, the relative proportion of the young age groups was higher for TKA than for UKA.
In UKA the relative proportion of patients less than 65 years of age doubled during 1998-2002, i.e. during the time when mini-invasive surgery caught on in Sweden. However, it has to be kept in mind that the actual number of UKA´s is now less than half of what it was in 1998 while the number of TKA has
100
90
80
70
60
50
40
30
20
10
0 Cop
yrig
ht ©
201
6 S
KA
R
1975 1980 1985 1990 1995 2000 2005 2010 2015
Agegroup distribution for primary UKA (%)
Year of operation
Age group
>84
75-84
65-74
55-64
45-54
<45
100
90
80
70
60
50
40
30
20
10
0 Cop
yrig
ht ©
201
6 S
KA
R
1975 1980 1985 1990 1995 2000 2005 2010 2015
Agegroup distribution for primary TKA (%)
Year of operation
Age group
>84
75-84
65-74
55-64
45-54
<45
The relative distribution of primary arthroplasties among different age groups (all types of implants).
The yearly number of arthroplasties for different diagnoses
The relative distribution of primary TKA arthroplasties among different age groups.
The relative distribution of primary UKA arthroplasties among different age groups.
more than doubled. This implies that although the relative number of TKA among younger age groups has not increased as much as for UKA, the actual number of TKA patients younger than 65 years of age has more than tripled while the number of UKA patients less than 65 is almost unchanged.

THE SWEDISH KNEE ARTHROPLASTY REGISTER – ANNUAL REPORT 2016 – PART I 15
Incidence and prevalence
The incidence of knee arthroplasty is found by dividing the number of primary knee arthroplas-ties by the number of inhabitants. As the graph to the right shows, the rise in incidence that began in the late eighties leveled off in 2009. A part of the increase in incidence over time reflects aging of the population as knee arthroplasty is mainly used in the elderly.
The figure below shows the incidence among dif-ferent age groups during 2015. It peeks among those between 65 and 84 years of age. At this age, knee arthroplasty is 7.5 times more common than among those 45-54 years old and 4.5 times more common than among those 85 years or older. In 2015, women were overrepresented in all the age groups. A table showing the incidence for the different age groups can be found on page 18.
Incidence of primary knee arthroplasty per 100,000 inhabitants (all types of implants).
Incidence of primary knee arthroplasty in 2015 per 100,000 inhabitants (males and females) in the different age groups.
120
100
80
60
40
20
140
160
180
Cop
yrig
ht ©
201
6 S
KA
R
1975 1980 1985 1990 1995 2000 2005 2010 2015 0
Yearly incidence of knee arthroplasty / 100,000
Year of operation
FemalesMales
As the incidence is so dependent on age, and because the age distribution may vary among dif-ferent nations, it is difficult to compare different countries without performing some form of age standardization.
The increase in the number of operations causes a rise in the number of patients walking around with knee implants. The figure below on the left shows the prevalence, i.e. the number of patients per 1,000 inhabitants in different age groups that were alive with at least one knee implant. As a quarter of the patients have bilateral implants the prevalence of implants is higher than that of patients.
For both men and women in 2015, the preva-lence peaks around 80-85 years of age at which 9% of the women and almost 7% of the men had at least one knee arthroplasty. Comparing the preva-lence in 2015 with that in 2000, it can be seen that it has increased in all age groups. The fact that a large proportion of the older population is walk-ing around with knee-, hip- or other types of joint implants, will probably result in an increase need for revisions in the future as well as as an increased risk of periprosthetic fractures when such patients are exposed to trauma.
Cop
yrig
ht ©
201
6 S
KA
R
50 60 70 80 90 100+
60
50
40
30
20
10
0
70
80
90
100
110Prevalence / 1,000
Age
Females 2015
Males 2015
Females 2000
Males 2000
The prevalence of knee arthroplasty in 2000 and 2015.One of fourteen elderly women has a knee arthroplasty.
< 45 45-54 55-64 65-74 75-84 85-
Cop
yrig
ht ©
201
6 S
KA
R
700
600
500
400
300
200
100
0
Incidence / 100,000 in 2015
Age group
FemalesMales

16 THE SWEDISH KNEE ARTHROPLASTY REGISTER – ANNUAL REPORT 2016 – PART I
Knee arthroplasties per 100,000 inhabitantsCounty 2009 2010 2011 2012 2013 2014 201501 Stockholm 112.0 106.2 106.2 103.6 105.0 99.7 93.403 Uppsala 135.3 144.4 136.1 154.6 174.3 142.9 161.004 Södermanland 181.9 155.2 152.8 153.5 157.5 162.3 145.605 Östergötland 169.1 166.2 146.2 157.3 154.2 135.0 132.706 Jönköping 151.6 131.1 142.6 169.0 147.6 172.4 153.707 Kronoberg 145.6 148.2 124.3 158.7 115.3 149.4 154.508 Kalmar 167.4 146.8 155.2 168.9 175.9 167.0 172.409 Gotland 162.8 166.0 249.6 164.1 178.3 134.6 106.410 Blekinge 153.5 155.0 168.5 178.8 177.7 161.6 165.612 Skåne 122.4 117.3 122.2 125.6 137.1 142.6 144.113 Halland 177.8 155.3 150.0 178.3 165.6 168.7 155.714 Västra.Götaland 127.3 140.0 138.9 132.0 130.6 120.1 126.717 Värmland 188.4 172.7 170.3 179.2 180.3 195.8 184.218 Örebro 140.5 138.4 125.7 146.3 120.3 116.8 105.019 Västmanland 129.7 140.0 130.6 156.3 125.8 134.8 107.220 Dalarna 153.2 208.9 219.6 217.0 231.4 199.5 174.721 Gävleborg 166.6 192.1 173.4 192.1 188.6 213.6 206.122 Västernorrland 136.1 183.7 143.6 145.4 140.9 132.3 140.923 Jämtland 180.6 161.0 162.1 174.3 138.5 95.6 120.424 Västerbotten 152.2 145.2 119.9 122.3 126.2 117.7 117.225 Norrbotten 144.0 122.2 149.7 166.5 150.2 131.0 120.5
The whole country 137.9 137.9 135.8 140.8 139.0 134.6 131.5
Information on domicile is by the Swedish Tax AgencyFor age-standardized incidence in 2015, see page 33
The incidence in the counties 2009-2015 (knee arthroplasties per 100,000 inhabitants)
Halland län(13)
Skåne (12)
Blekinge (10)
Kronoberg län(07)
Gotland (09)Kalmar
(08)
Jönköping (06)
Östergötland (05)
Västra Götaland (14)
Värmland (17)
Örebro (18)
Södermanlands (04)
Stockholm (01)
Uppsala (03)
Västmanland (19)
Dalarna (20)
Gävleborg (21)
Jämtland (23) Västernorrland
(22)
Västerbotten (24)
Norrbotten (25)
County and number of inhabitants 2015No County Inhabitants
01 Stockholm 2,214,74203 Uppsala 351,55304 Södermanland 282,18905 Östergötland 443,88306 Jönköping 346,05007 Kronoberg 190,24908 Kalmar 236,63909 Gotland 57,32310 Blekinge 155,20512 Skåne 1,296,26813 Halland 312,72514 Västra,Götaland 1,640,34717 Värmland 275,29818 Örebro 289,58119 Västmanland 262,99020 Dalarna 279,96621 Gävleborg 280,90322 Västernorrland 243,47923 Jämtland 127,07124 Västerbotten 262,87025 Norrbotten 249,860 Mean population during the year (www.scb.se)

THE SWEDISH KNEE ARTHROPLASTY REGISTER – ANNUAL REPORT 2016 – PART I 17
Incidence for womenCounty 2009 2010 2011 2012 2013 2014 201501 Stockholm 135.3 128.7 128.8 130.0 123.1 113.5 106.603 Uppsala 163.3 185.9 154.1 178.0 193.1 170.6 185.004 Södermanland 180.7 164.2 178.0 179.7 181.2 185.2 155.105 Östergötland 206.6 185.1 163.8 182.1 172.5 159.9 156.406 Jönköping 184.9 152.5 174.3 202.9 174.4 202.1 176.107 Kronoberg 168.8 183.5 147.8 183.1 148.4 165.6 168.308 Kalmar 192.2 158.1 148.9 209.0 201.2 193.1 200.609 Gotland 194.2 204.2 273.4 159.2 208.1 128.5 114.510 Blekinge 167.5 168.7 188.5 188.9 187.5 182.3 168.912 Skåne 145.2 131.0 140.8 140.1 154.1 166.0 169.013 Halland 182.6 182.2 172.8 197.8 188.4 186.6 173.014 Västra.Götaland 146.8 162.1 160.3 147.0 148.2 133.4 145.017 Värmland 208.7 214.8 182.2 201.4 190.1 234.2 205.218 Örebro 155.9 162.4 152.0 158.4 129.6 135.7 127.719 Västmanland 146.4 158.3 151.1 173.6 140.3 157.5 126.520 Dalarna 161.5 233.7 248.3 242.1 260.7 222.4 195.021 Gävleborg 200.4 207.5 198.2 208.4 206.4 232.6 221.422 Västernorrland 164.9 235.1 173.1 163.6 164.6 149.7 154.423 Jämtland 216.0 205.2 212.0 204.7 179.4 107.9 153.624 Västerbotten 178.8 161.4 141.0 150.1 151.4 131.7 136.725 Norrbotten 165.2 137.0 183.8 190.6 170.8 150.2 141.3
The whole country 160.0 160.3 157.6 162.0 158.3 153.6 150.0
Information on domicile is by the Swedish Tax Agency
Incidence for menCounty 2009 2010 2011 2012 2013 2014 201501 Stockholm 88.2 83.2 83.1 76.7 86.6 85.7 80.003 Uppsala 106.9 102.4 117.9 131.0 155.3 115.0 136.904 Södermanland 183.1 146.1 127.3 127.0 133.7 139.3 136.205 Östergötland 131.9 147.5 128.7 132.6 136.1 110.3 109.306 Jönköping 118.3 109.5 110.9 135.2 120.8 143.0 131.607 Kronoberg 122.8 113.5 101.1 134.8 82.8 133.5 141.108 Kalmar 142.6 135.5 161.4 128.7 150.5 141.0 144.609 Gotland 130.8 127.0 225.4 169.1 148.0 140.7 98.210 Blekinge 139.9 141.7 149.2 169.1 168.1 141.4 162.412 Skåne 99.1 103.3 103.2 110.9 119.7 118.7 118.913 Halland 173.0 128.1 127.0 158.6 142.7 150.8 138.414 Västra.Götaland 107.8 117.8 117.4 116.9 113.0 106.8 108.517 Värmland 168.1 130.5 158.4 156.9 170.5 157.4 163.218 Örebro 124.8 114.0 99.0 134.0 110.9 97.9 82.319 Västmanland 112.8 121.7 109.9 139.0 111.2 112.1 88.020 Dalarna 144.9 184.1 191.1 191.9 202.3 176.8 154.621 Gävleborg 132.8 176.7 148.5 175.8 170.8 194.7 190.922 Västernorrland 107.2 132.0 114.0 127.2 117.2 115.1 127.523 Jämtland 145.2 116.8 112.2 143.9 97.9 83.4 87.624 Västerbotten 125.8 129.2 98.9 94.9 101.4 103.8 98.025 Norrbotten 123.4 107.7 116.5 143.3 130.3 112.4 100.4
The whole country 115.7 115.4 113.8 119.4 119.7 115.7 113.0
Information on domicile is by the Swedish Tax Agency
The incidence in the counties 2009-2015 (knee arthroplasties per 100,000 inhabitants)
The incidence calculations for the counties are based on the number of knee arthroplasties their inhabitants received, irrespective of if the surgery was performed in their home county or elsewhere. While the calculations do not consider differences in the age distribution, age-standardized calcula-tions for the year 2015 can be found on page 33.
The calculations are based on information from the Swedish tax authorities concerning the domi-cile of patients at the time of surgery. Note that that only surgeries on patients that are Swedish residents are considered.

18 THE SWEDISH KNEE ARTHROPLASTY REGISTER – ANNUAL REPORT 2016 – PART I
Hospital 1975-2010 2011 2012 2013 2014 2015 Totalt Percent
Akademiska sjukhuset 2,725 79 108 90 86 109 3,197 1.3Alingsås 1,624 189 193 214 204 193 2,617 1.1Art Clinic Göteborg . . . . . 16 16 0Art Clinic Jönköping . . 8 2 13 29 52 0Arvika 1,235 167 156 129 193 171 2,051 0.9Avesta 67 . . . . . 67 0Boden 1,622 . . . . . 1,622 0.7Bollnäs 2,495 305 327 305 402 353 4,187 1.7Borås 2,612 126 103 91 78 72 3,082 1.3Carlanderska 250 162 126 108 137 136 919 0.4Dalslands Sjukhus 81 . . . . . 81 0Danderyd 2,851 192 200 196 185 183 3,807 1.6Eksjö-Nässjö (Höglandssjukh.) 2,598 155 182 173 211 202 3,521 1.5Elisabethkliniken 656 55 58 58 7 1 835 0.3Enköping 1,825 329 342 415 373 393 3,677 1.5Eskilstuna 1,778 40 32 43 41 38 1,972 0.8Fagersta 71 . . . . . 71 0Falköping 1,688 . . . . . 1,688 0.7Falun 4,140 351 356 364 356 205 5,772 2.4Frölunda Spec. 951 116 121 120 120 124 1,552 0.6Gällivare 1,269 81 79 94 68 46 1,637 0.7Gävle 2,995 96 155 164 129 132 3,671 1.5Halmstad 2,697 201 241 232 190 186 3,747 1.6Helsingborg 1,741 20 15 21 44 66 1,907 0.8Huddinge 2,533 130 150 147 166 159 3,285 1.4Hudiksvall 1,412 88 79 73 60 87 1,799 0.7Hässleholm 6,117 666 664 698 683 645 9 473 3.9Jönköping 2,434 168 173 167 168 141 3,251 1.3Kalix 215 . . . . . 215 0.1Kalmar 2,352 105 93 106 91 89 2,836 1.2Karlshamn 2,321 248 264 260 242 249 3,584 1.5Karlskoga 1,658 101 143 129 124 124 2,279 0.9Karlskrona 1,118 . . . . . 1,118 0.5Karlstad 3,762 176 168 192 193 182 4,673 1.9Karolinska 2,304 108 128 140 101 93 2,874 1.2Kristianstad 1,297 . . . . 1 1,298 0.5Kristinehamn 252 . . . . . 252 0.1Kullbergska sjukhuset 1,888 229 228 228 201 157 2,931 1.2Kungsbacka 38 . . . . . 38 0
(cont.)
Number of primary arthroplasties per unit and year
Incidence in different age groups over time (number of arthroplasties/100,000 inhabitants)
MenAge group 1976-1984 1985-1989 1990-1994 1995-1999 2000-2004 2005-2009 2010-2014 2015<45 0,4 0,4 0,5 0,6 0,8 1,4 1,5 1,445-54 5.5 4.6 7.8 12.3 26.7 43.4 51.2 53.555-64 18.7 24.7 60.9 75.4 132.6 206.0 266.7 258.365-74 38.4 73.7 165.4 222.2 312.6 432.4 453.0 435.775-84 29.7 78.2 183.2 231.4 311.4 438.1 492.0 438.4>84 5.0 19.6 45.2 68.5 82.5 122.5 118.7 100.8
Total 8.0 14.6 32.6 42.4 65.0 98.0 116.8 113.0
WomenAge group 1976-1984 1985-1989 1990-1994 1995-1999 2000-2004 2005-2009 2010-2014 2015<45 1.0 0.9 1.0 1.3 1.8 1.8 2.5 2.245-54 13.6 11.1 14.4 24.3 45.0 69.1 89.5 79.755-64 41.8 54.2 96.5 127.3 181.4 271.6 331.9 341.165-74 87.3 146.3 283.7 358.4 445.3 551.5 548.3 508.175-84 59.2 131.0 285.3 365.1 448.3 567.3 614.2 539.7>84 5.0 14.4 51.8 76.1 87.2 118.6 117.4 114.2
Total 20.2 33.3 64.0 81.5 106.1 141.2 158.3 150.0

THE SWEDISH KNEE ARTHROPLASTY REGISTER – ANNUAL REPORT 2016 – PART I 19
Number of primary arthroplasties per unit and year (cont.)Hospital 1975-2010 2011 2012 2013 2014 2015 Total PercentKungälv 1,682 175 142 155 197 215 2,566 1.1Köping 1,605 . . . . . 1,605 0.7Landskrona 1,918 . . . . . 1,918 0.8Lidköping 1,592 169 196 200 199 234 2,590 1.1Lindesberg 1,633 157 199 192 172 162 2,515 1Linköping 1,735 . . . . . 1,735 0.7Linköping medical cent 15 . . . . . 15 0Ljungby 1,537 119 136 81 150 142 2,165 0.9Ludvika 339 . . . . . 339 0.1Luleå 2 . . 7 4 6 19 0Lund 2,591 40 51 87 98 103 2,970 1.2Lycksele 629 60 63 69 94 40 955 0.4Löwenströmska * 2,245 442 432 443 403 431 4,396 1.8Malmö 2,209 15 13 3 . . 2,240 0.9Mora 1,727 166 172 186 150 186 2,587 1.1Motala 3,463 458 536 519 470 510 5,956 2.5Movement Halmstad 985 275 222 218 250 431 2,381 1Mölndal 1,815 266 206 237 297 383 3,204 1.3Nacka 203 . . . . . 203 0.1Nacka-Proxima 382 136 122 145 111 144 1,040 0.4Norrköping 2,311 158 146 144 140 129 3,028 1.3Norrtälje 1,134 81 89 74 85 94 1,557 0.6Nyköping 1,464 120 124 79 100 101 1,988 0.8OrthoCenter IFK klin. ** 672 139 109 96 108 113 1,237 0.5Ortopediska huset 2,925 347 375 390 418 459 4,914 2Oskarshamn 2,230 239 263 260 268 275 3,535 1.5Piteå 1,896 285 321 273 259 244 3,278 1.4S:t Göran 6,630 367 347 400 387 424 8,555 3.5Sabbatsberg (Aleris) 1,658 104 125 125 141 23 2,176 0.9Sahlgrenska 1,535 8 2 1 4 2 1,552 0.6Sala 115 . . . . . 115 0Sandviken 301 . . . . . 301 0.1Sergelkliniken 160 . . . . . 160 0.1Simrishamn 1,021 . . . . . 1,021 0.4Skellefteå 1,272 98 90 97 107 119 1,783 0.7Skene 1,308 106 139 135 104 97 1,889 0.8Skövde 2,600 186 206 145 115 120 3,372 1.4Sollefteå 1,203 102 103 97 89 93 1,687 0.7Sophiahemmet 1,390 74 112 121 98 136 1,931 0.8Spenshult 551 238 331 330 155 . 1,605 0.7Sunderby 391 4 3 . . . 398 0.2Sundsvall 2,702 118 123 114 95 44 3,196 1.3Säffle 484 . . . . . 484 0.2Söderhamn 279 . . . . . 279 0.1Södersjukhuset 4,339 325 285 270 317 280 5,816 2.4Södertälje 1,267 121 87 88 110 113 1,786 0.7Torsby 1,440 80 121 131 114 129 2,015 0.8Trelleborg 5,139 608 673 707 759 791 8,677 3.6Uddevalla 3,365 186 166 229 207 187 4,340 1.8Umeå 2,603 165 160 155 102 146 3,331 1.4Varberg 2,574 167 206 173 149 127 3,396 1.4Visby 1,284 114 93 88 70 60 1,709 0.7Vänersborg-NÄL 939 . . . . . 939 0.4Värnamo 1,829 113 137 142 163 148 2,532 1.1Västervik 1,747 97 114 113 94 90 2,255 0.9Västerås 2,470 280 309 256 246 173 3,734 1.5Växjö 2,031 97 141 98 109 115 2,591 1.1Ystad 1,169 . . . . . 1,169 0.5Ängelholm 1,929 162 172 201 233 220 2,917 1.2Örebro 3,173 117 72 51 54 30 3,497 1.5Örnsköldsvik 1,887 107 102 112 88 115 2,411 1Östersund 1,968 166 182 164 106 120 2,706 1.1Östra sjukhuset 2,100 . . . . . 2,100 0.9
Total 175,464 12,840 13,410 13,360 13,055 12,886 241,015 100
* Lövenströmska was replaced by Stockholms Specialistvård in 2001 and OrthoCenter Stockholm in 2008.
** Gothenburg Medical Center was replaced by OrthoCenter IFK kliniken in 2008.

20 THE SWEDISH KNEE ARTHROPLASTY REGISTER – ANNUAL REPORT 2016 – PART I
0
5
10
15
20
25
0 1 2 3 4 105 6 7 8 9
Cop
yrig
ht ©
201
6 S
KA
R
TKARA All Revisions
-6465-74
75-
Year after index operation
CRR(%)
Agen = 970 n = 961n = 515
Factors that influence the revision rate
0
5
10
15
20
25
0 1 2 3 4 105 6 7 8 9
Cop
yrig
ht ©
201
6 S
KA
R
Year after index operation
Age-64
65-7475-
CRR(%)
OA TKAAll revisions
n = 33,930 n = 42,143n = 31,760
The CRR (2005–2014) for the 3 age groups <65, 65–75, >75 show for TKA (OA & RA) and UKA/OA increasing risk with decreasing age.E.g., younger than 65 have 1.8 times the risk of those over 75 in TKA/OA, 1.5 times in TKA/RA and 2.3 times the risk in UKA/OA.
0
5
10
15
20
25
0 1 2 3 4 105 6 7 8 9
Cop
yrig
ht ©
201
6 S
KA
R
OA UKAAll Revisions
Age-64
65-7475-
CRR(%)
Year after index operation
n = 3,943 n = 1,859n = 766
Comparing the CRR of different time periods, one finds for TKA, that the revision rate has decreased over time. However, for RA the risk is higher during 2006-2014 than the previous period (Cox). The reason for the increase in CRR after UKA in 2006-2014 is mainly an increase in the proportion of younger patients having UKA in recent years and that age is not adjusted for in the figures..
0
15
20
25
30
35
0 2 4 6 8 2010 12 14 16 18
Cop
yrig
ht ©
201
6 S
KA
R
10
5
All Revisions
Year after index operation
OA
CRR(%)
TKA1976-19851986-19951996-20052006-2014
n = 2,801 n = 16,176n = 54,573n = 99,545
0
15
20
25
30
35
0 2 4 6 8 2010 12 14 16 18
Cop
yrig
ht ©
201
6 S
KA
R
10
5
All Revisions
Year after index operation
CRR(%)
TKA1976-19851986-19951996-20052006-2014
RAn = 3,003 n = 4,195n = 4,023n = 2,160
0
15
20
25
30
35
0 2 4 6 8 2010 12 14 16 18
Cop
yrig
ht ©
201
6 S
KA
R
10
5
All Revisions
Year after index operation
OA
CRR(%)
1976-19851986-19951996-20052006-2014
UKAn = 3,558 n = 11,386n = 9,549n = 5,654
Year of operation – For TKA, the risk of revi-sion has decreased over time which not has been as apparent for UKA. However, when using Cox regression we find for TKA/RA that the risk has increased in 2006-2014 as compared to 1996-2005. The reason for this is mainly an increase in revisions for early infections (see next page).
The same is not true for UKA for which the reason for the graph showing a higher CRR in the period 2006-2014 is mainly that the proportion of younger patient has increased during the recent years which is adjusted for in the regression but not in the graph which shows the cumulative revi-sion rate without adjusting for age.
Primary disease – Early it became evident that patients with rheumatoid arthritis (RA) and osteoar-thritis (OA) were different with respect to outcome. Therefore, the registry always showed outcome for these diagnoses separately. However, the modern medical treatment of RA has resulted in a reduced need for knee arthroplasty for these patients (fig. page 14) making statistical differences more diffi-cult to detect.
Age – By dividing patients into separate age groups one can see the large effect that age has on the revision rate both in TKA and UKA. One can only speculate in the reasons for this effect. Pos-sible explanations are that the younger have higher physical activity, higher expectancy of pain relief and a health condition allowing for revision sur-gery. Irrespective of the type of implant, the risk of revision increases with decreasing age.

THE SWEDISH KNEE ARTHROPLASTY REGISTER – ANNUAL REPORT 2016 – PART I 21
0 2 4 6 8 2010 12 14 16 18
Cop
yrig
ht ©
201
6 S
KA
R
0
2
4
6
8
10
Year after index operation
OA
CRR(%)
TKAInfection1976-19851986-19951996-20052006-2014
n = 2,801 n = 16,176n = 54,573n = 96,545
0 2 4 6 8 2010 12 14 16 18
Cop
yrig
ht ©
201
6 S
KA
R
0
2
4
6
8
10
Year after index operation
CRR(%)
TKAInfection1976-19851986-19951996-20052006-2014
RAn = 3,003 n = 4,195n = 4,023n = 2,160
Comparing the CRR, using only revision for infection as end-point, we find an improvement with time for both TKA and UKA. However, in TKA (OA & RA) the risk has invreased in 2006-2014 as compared to the period 1996-2005.
0 2 4 6 8 2010 12 14 16 18
Cop
yrig
ht ©
201
6 S
KA
R
0
2
4
6
8
10
Year after index operation
OA
CRR(%)
UKAInfection1976-19851986-19951996-20052006-2014
n = 3,558 n = 11,386n = 9,549n = 5,654
Using the end-point; revision for infection, the CRR (2005–2014) we find men having a higher risk than women (TKA/OA: RR 1.9 and TKA/RA: RR 2.6). In UKA which has a lower risk of infection men also have a tendency of higher risk than women although the differ-ence is not significant for the current period. In TKA, patients with RA are more affected than those with OA (RR 2.1).
0
2
4
6
8
10
0 1 2 3 4 105 6 7 8 9
Cop
yrig
ht ©
201
6 S
KA
R
Year after index operation
Infection
Gender:MenWomen
CRR(%)
TKARA
n = 613n = 1,833
0
2
4
6
8
10
0 1 2 3 4 105 6 7 8 9
Cop
yrig
ht ©
201
6 S
KA
R
Year after index operation
Infection
Gender:MenWomen
CRR(%)
OA TKA
n = 44,950n = 62,883
0
2
4
6
8
10
0 1 2 3 4 105 6 7 8 9
Cop
yrig
ht ©
201
6 S
KA
R
Year after index operation
Infection
Gender:MenWomen
CRR(%)
OA UKA
n = 3,093n = 3,475
Gender – Using Cox Regression, we have hith-erto not been able to find significant gender dif-ferences in the CRR (all revisions) neither for TKA nor UKA. This year, for 2005-2014 we find a higher risk for men (RR 1.1) that is caused by men having a considerably higher risk of being revised for infection (see figures below), irrespective of if change of inlay is considered being revision or not.
While it is well known that RA patients have a higher risk of infection, being ascribed to the effect of corticosteroid and immunosuppressive medica-tions, it is not obvious why men, more often have their knee arthroplasties revised for infection. That the 10-year risk n spite of this is similar for the genders is partly explained by women more often being revised for instability and early loosening.
When the Knee Register estimates the risk of revision due to infection, it counts the first revision due to infection in the affected knee. It does not matter if it is the primary or any subsequent revision. Over time we have seen a reduction in this risk both for OA and RA. However, for the period 2006-2014 we see an increase in the risk of revisions as compared to the previous 20 years. The increase is mainly due to early liner exchanges performed for infections or suspected infections.
The reason for this may be that surgeons have become more proactive in suspected early infections, among other things because of the PRISS project (Prosthetic Related Infections Shall be Stopped) in which all the hospitals have participated.
UKA have significantly lower risk of infec-tion than TKA and patients with OA have a lower risk than those with RA. This is independent of if changes of inlays due to infection are considered being revisions or not.

22 THE SWEDISH KNEE ARTHROPLASTY REGISTER – ANNUAL REPORT 2016 – PART I
Type of implant – The modern condylar tricom-partmental knee implant (TKA) was developed in the seventies when hinged and unicondylar implants were already available. When the register started in 1975, TKA had just been introduced in Sweden, which is the reason for hinges and uni’s amounting for the larger part of the surgeries at the time (figure right). It was also common to com-bine two uni’s (bilateral UKA) when the knee dis-ease affected more than one compartment. As the use of TKA became more common, the surgeons quit using two UKA’s in one knee. Today, hinges, linked and stabilized implants are mainly used for difficult primary cases, trauma, malignancies and revisions. Ordinary TKA's are most often used for uncomplicated primary cases while some use UKA when the disease is unicompartmental, mainly on the medial side. However, the use of UKA has diminished over the years, both proportionally as well as in number of surgeries. The reason may be that in OA, UKA has a substantially higher CRR than TKA (see figures on page 20). However, serious complications (infections/arthrodeses/ amputations) are less common after UKA.
Use of bone-cement – As the figure below shows, bone cement has been used for the majority of arthro-plasties in recent years. The use of uncemented implants has increased slightly in the last years but this is mainly due to one unit that accounts for more than half of the cases. Looking at the last 10-year period we see no significant difference depending on if cement was used or not. However, for the period 1985–1994 with follow-up until 2014, the risk is higher for cases in which the tibial component was left uncemented (see figure right).
Some years ago we found that TKA after previ-ous UKA did not have a significantly increased risk as compared to the risk for primary TKA’s inserted at the time when the UKA’s were performed. How-ever, the TKA results were rapidly improving and the UKA conversions had the benefit of being compared to older TKA results. This is no longer true and we have fond UKA conversions to have approx. 2 times the risk of primary TKA’s.
100
90
80
70
60
50
40
30
20
10
0 Cop
yrig
ht ©
201
6 S
KA
R
1975 1980 1985 1990 1995 2000 2005 2010 2015
Distribution of fixation methods (%)
Year of operation
HybridNo cementAll cemented
The relative yearly distribution regarding the use of cement for fixation.
The relative yearly distribution of implant types used for primary surgery.
100
90
80
70
60
50
40
30
20
10
0 Cop
yrig
ht ©
201
6 S
KA
R
1975 1980 1985 1990 1995 2000 2005 2010 2015
Distribution of types of implants (%)
Year of operation
PatellaBilat. UKALat. UKAMed. UKATKALinkedHinge
The CRR for TKA inserted 1985-1994 in which the tibial com-ponent was fixed with or without cement.(note that in the 2015 report the y-scale was wrong (went to 25))
Cox regression, adjusting for age, gender, year of operation and use of a patellar component shows that the risk for TKA with an uncemented tibial com-ponent was 1.6 (1.3-1.9) times higher than for those cemented. This is in agreement with registers in Fin-land, England, New-Zealand and California which also have found substantially increased risk of revi-sion for uncemented implants.
0
5
10
15
20
35
0 2 4 6 8 2010 12 14 16 18
Cop
yrig
ht ©
201
6 S
KA
R1985–1994
30
25
OA All Revisions
Year after index operation
TKA
CRR(%)
Uncem. TibiaCem. Tibia
n = 898n = 13,244

THE SWEDISH KNEE ARTHROPLASTY REGISTER – ANNUAL REPORT 2016 – PART I 23
Patellar button in TKA – Estimating how the use of a patellar button affects the revision rate is complex. The use of a patellar button varies with the brand of prosthesis used and its use also has lessened in recent years. During the eighties, when patellar button was used in a good half of the cases, its use had a negative effect. Since then its use has diminished so that it was only used in 2.5% if the TKA cases in 2015 (see figure right). In our 2002 annual report (for the period 1991-2000) we for the first time observed that TKA with a patellar button had a lower risk of revision than those without. The figure below shows the 10-year CRR for TKA inserted during that period. One can see that the TKA without a patellar button had a significantly higher revision rate than those without (RR x 1.3 (CI 1.1-1.4)).
100
90
80
70
60
50
40
30
20
10
0 Cop
yrig
ht ©
201
6 S
KA
R
1975 1980 1985 1990 1995 2000 2005 2010 2015
Distribution (%) of TKA with and withouta patellar component
Year of operation
No patella
Patella
The figure shows the yearly distribution regarding the useof patellar button in TKA.
0
5
10
15
20
25
0 1 2 3 4 105 6 7 8 9
Cop
yrig
ht ©
201
6 S
KA
R
OA
No PatellaPatella
All Revisions
Year after index operation
TKA
CRR(%)
Patella 2005-2014n = 103,104n = 4,729
In 2007 the advantage of using a patellar button started to decrease and in 2010 (for surgeries per-formed 1999-2008) we could not find an advantage of using a button. However, for the current period 2005-2014 (figure left, below) we find the oppo-site of that observed during 1991-2000; TKA with a patellar button now have a higher risk of revision than TKA without a button (RR x 1.3 (CI 1.1-1.5)).
One can only speculate on the reasons for these variations in findings. The insertion of the button takes time and there is an additional component that has to stay fixed to bone and that can wear. This increases the possibility of infection, loosen-ing and wear. Thus, changes in the quality of the poly as well as fixation may explain changes in CRR over time. On the other hand, a number of TKA without a button have a secondary one due to patellar pain. So if the femoral components have become more “patellar friendly” or if the surgeons have discovered that patellar additions not always are successful, the number of such secondary patellar resurfacing would decrease improving the results of those without a primary button as com-pared to those that received one.
It may be debated if one should take the use of patellar button into consideration when units and implants are compared with respect to risk of revi-sion. We have decided to show in the figures the total CRR of all TKA together (with and without a button) giving a general picture of the results for certain groups of patients and implants. When comparing the risk-ratios of implants (page 44-47), we separately account for the results of TKA with, and without a button. Finally, when comparing the risk of revision for the different hospitals (page 52-55), we include the use of patellar button in the regression analysis.
CRR for TKA/OA inserted during the 10-year period 1991-2000, with and without patellar component respectively.TKA without patella has a higher CRR
CRR for TKA/OA inserted during the current 10-year period, with and without patellar component respectively.TKA with patella has a higher CRR.
0
5
10
15
20
25
0 1 2 3 4 105 6 7 8 9
Cop
yrig
ht ©
201
2 S
KA
R
OA
No PatellaPatella
All Revisions
Year after index operation
TKA
CRR(%)
n = 23,920 n = 8,566
Patella 1991-2000

24 THE SWEDISH KNEE ARTHROPLASTY REGISTER – ANNUAL REPORT 2016 – PART I
TKAs without a button had 1.3 (1.3-1.4) times higher risk of becoming revised. As can be seen on the previous page this is similar as what we found in Sweden for the period 1991-2000 when the use of patellar button was relatively more common but that the results had become the opposite in the period 2003-2012 when TKA with patellar button had higher risk of revision than those without.
It is unclear why the policies with respect to use of patellar buttons differ so much between the surgeons in the mentioned countries and regions. However, it is possible that previous bad experi-ence of using metal backed patellar buttons has played a role.
cont. Use of patellar button – The use of a patellar button varies between countries. In its annual report, the Danish knee arthroplasty register (https://www.sundhed.dk/content/cms/99/4699_dkrrapport2015.pdf)) reports that a patellar button was used in 79% of TKA cases (2014) while it was only used in 3% of cases in Norway during 2015 according to the Norwegian arthroplasty register report (http://nrlweb.ihelse.net/Rapporter/Rapport2016.pdf). According to the 2015 annual report of the Aus-tralian Joint Replacement Registry (https://aoanjrr.sahmri.com/home), the use of a patellar button has increased in recent years from 41% of the TKA cases in 2005 to 59% in 2014. They also reported that compared to TKAs using a patellar button,
Implant model (brand) – The implant model is what generates the most interest and which is most often connected to the results of knee arthroplas-ties. As can be seen from what has been said previ-ously, the results are not only affected by the model or design of the implants but also by other factors such as the so called “case-mix”. In the analyses, we try to limit the effect of the case-mix on results by adjusting for factors such as diagnosis, gender, age and the time period during which the opera-tions were performed. However, there is a multi-tude of patient related factors that we do not adjust for, such as grade of joint disease, activity, expec-tations and socioeconomic factors just to mention a few.
An additional important factor, which the reg-ister is unable to adjust for, is the surgical routine of the individual surgeons. It is obvious that sur-geons may be more or less competent with respect to arthroplasty surgery, which may influence the results for specific models, especially if use of that model has been limited to a few surgeons or hospi-tals. Just as it may be claimed that deviating results are being influenced by surgical skill, it could be debated if it is at all fair to account for the results of specific models.
Responding to this, we can only say that the risk of revision for specific brands shows what its users could bring about with that particular model.
The final result is determined by a combination of factors including design, material, durability, accompanying instruments, user-friendliness, safety marginal (how the implant behaves if it is not inserted exactly) together with the surgeons skill and training in using the instruments/implant as well as selecting the appropriate patients for the surgery. The producers together with the distribu-tors have an opportunity to influence many of these factors. Therefore, it cannot be considered inappro-priate to associate the model to the result, in spite of the outcome being affected not only by design, material and durability.
Historically, the most commonly used implants in Sweden have also been those with the lowest CRR. This may be due to a good design but also due to the increased surgical routine when the same implant is used often.
Models that have been found to have consider-ably inferior results have most often been with-drawn from the Swedish market. An exception is the Oxford implant that initially had inferior results but that after modifications and increased training of surgeons showed improved results leading to continued use.

THE SWEDISH KNEE ARTHROPLASTY REGISTER – ANNUAL REPORT 2016 – PART II 25
Type of operations and implants in 2015
Implants for primary TKA Number Percent
NexGen MBT 5,572 45.9PFC-MBT 2,501 20.6Triathlon 1,334 11.0Vanguard 1,079 8.9PFC-APT 914 7.5Legion/GenII Prim 169 1.4Genesis II 157 1.3NexGen TM 150 1.2Attune 26 0.2PFC-RP 6 0.1Link Gemini 6 0.1NexGen APT 5 0.1Others* 229 1.9
Totalt: 12,134 100*Mainly revision models (see separate table) except 13 knee for which
part numbers are missing
Implants for primary UKA Number Percent
Oxford 410 63.6Link 91 14.1ZUK 79 12.2Sigma PKR 31 4.8Triathlon PKR 29 4.5Genesis 2 0.3Ibalance 2 0.3Missing 1 0.2
Total : 645 100
The TKA has become the standard treatment and in 2015 it accounted for 94% of the surgeries (table above). In 1989 UKAs accounted for 44% of the knee arthroplasties but since then it’s use has diminished and in 2015 it was only used in 5% of the cases (fig. page 22). No PRKA (partial replacement knee arthro-plasty) was reported in 2014 but four in 2014.
All 74 units performing elective knee arthroplasties reported to the registry during 2015. Although a few reports may not yet have been turned in, their effect on the total number of operations is expected to be negligible. This summer, 12,886 primaries had been reported for 2015 which is 0.9% less than at the same time in 2014 (13,000).
The use of UKA has diminished for years but in 2015, their use increased by 42% in 2015. The Oxford accounted for 64% of the cases while the proportion for Link diminished to 14%. In spite of the increase, UKAs only account for 5% of the primary cases.
Types of primary arthroplasties
Number Percent
Linked 38 0.3TKA 12,134 94.2UKA medially 631 4.9UKA laterally 14 0.1Fem-Pat 65 0.5Partial (PRKA) 4 0.0
Total : 12,886 100
As compared to last year, TKA had decreased by 2.4%. The same 4 TKA brands as last year domi-nate, accounting for 95% of all the TKA primaries. NexGen from Zimmer was used in almost half of the primaries while PFC from DePuy came second with a good quarter. Triathlon from Stryker and Van-guard from Biomet came in third and fourth. Profix that was had 28 cases in 2014 was not reported in 2015. The group "Others" mainly stands for revision models (see table right).
Revision implants for primary TKA
Antal Procent
NexGen Revision 66 32.8PFC Revision 66 32.8Triathlon Revision 44 21.9Vanguard Revision 14 7.0Legion/Genesis Revision 11 5.5
Total : 201 100
Ordinary TKA implants, used with stems longer than 5 cm on either side, are defined as being revision models. Together with specific revision brands they are not included in our survival analyses for TKA’s as such implants are mainly used for difficult cases and not for typical OA cases.
Besides these revision models, 38 linked implants were used for primary arthroplasty in 2015, mainly rotating hinges for treatment of malignancies, frac-tures and other difficult cases.
916 revisions were reported in 2015 of which 227 were secondary (not the first revision). In 714 cases the primary was a TKA, in 168 it was an UKA, in 24 a linked implant and in 10 cases a Femoro-Patellar implant.
The annual report together with accompanying lists of reported surgeries are sent to the contact sur-geons each year. This usually results in some extra revisions becoming reported. Because few missed revisions can have a large effect on the results and because revisions are complicated procedures for which supplementary information is often needed, our survival analyses end 2014.

26 THE SWEDISH KNEE ARTHROPLASTY REGISTER – ANNUAL REPORT 2016 – PART II
UKA in the counties
Model 1 n Model 2 n Model 3 n Other
01 Stockholm Oxford 130 ZUK 46 Link 29 3203 Uppsala Oxford 1 04 Södermanland Link 2 05 Östergötland Oxford 127 06 Jönköping Link 24 Oxford 20 ZUK 4 07 Kronoberg Oxford 49 08 Kalmar Link 2 09 Gotland 10 Blekinge Oxford 9 12 Skåne Link 18 Oxford 13 Triathlon PKR 8 13 Halland ZUK 13 Sigma PKR 8 14 Västra.Götaland Oxford 61 ZUK 10 Link 3 117 Värmland 18 Örebro ZUK 6 19 Västmanland Genesis 2 Triathlon PKR 1 20 Dalarna 21 Gävleborg Link 11 22 Västernorrland 23 Jämtland 24 Västerbotten Link 2 25 Norrbotten Sigma PKR 13
TKA in the counties
Model 1 n Model 2 n Model 3 n Other
01 Stockholm NexGen 1,072 PFC Sigma 975 Triathlon 111 12103 Uppsala PFC Sigma 395 NexGen 105 Vanguard 1 104 Södermanland PFC Sigma 191 Vanguard 58 NexGen 41 405 Östergötland NexGen 424 Legion/Genesis 60 PFC Sigma 9 1006 Jönköping Vanguard 328 NexGen 141 Other 3 07 Kronoberg Vanguard 108 PFC Sigma 67 NexGen 16 1408 Kalmar NexGen 441 Other 9 09 Gotland PFC Sigma 58 Other 1 10 Blekinge Vanguard 136 NexGen 102 Other 2 12 Skåne Triathlon 1,210 PFC Sigma 282 NexGen 193 9713 Halland NexGen 708 Other 5 14 Västra.Götaland NexGen 923 PFC Sigma 478 Vanguard 371 3317 Värmland NexGen 476 Other 5 18 Örebro Genesis II 157 NexGen 147 Other 2 119 Västmanland NexGen 167 Other 3 20 Dalarna NexGen 199 PFC Sigma 185 Other 5 21 Gävleborg PFC Sigma 519 NexGen 21 Link Gemini 3 122 Västernorrland NexGen 246 Other 4 23 Jämtland NexGen 119 Other 1 24 Västerbotten NexGen 174 Legion/Genesis 106 Other 11 25 Norrbotten PFC Sigma 259 Triathlon 12 Other 4 3
The most common implants in the counties in 2015
The table above shows that in 2015. only 8 of 21 counties reported having used more than 2 ordinary TKA models used (revision models not counted) and that only a 3 counties used 3 models to a greater extent.
The table above shows that only 3 counties. Stockholm, Östergötland and Västra Götaland reported more than 50 UKA's in 2015. Three counties reported between 30 and 50 UKA's, ten counties between 1 and 21 and five counties reported no UKA procedures.
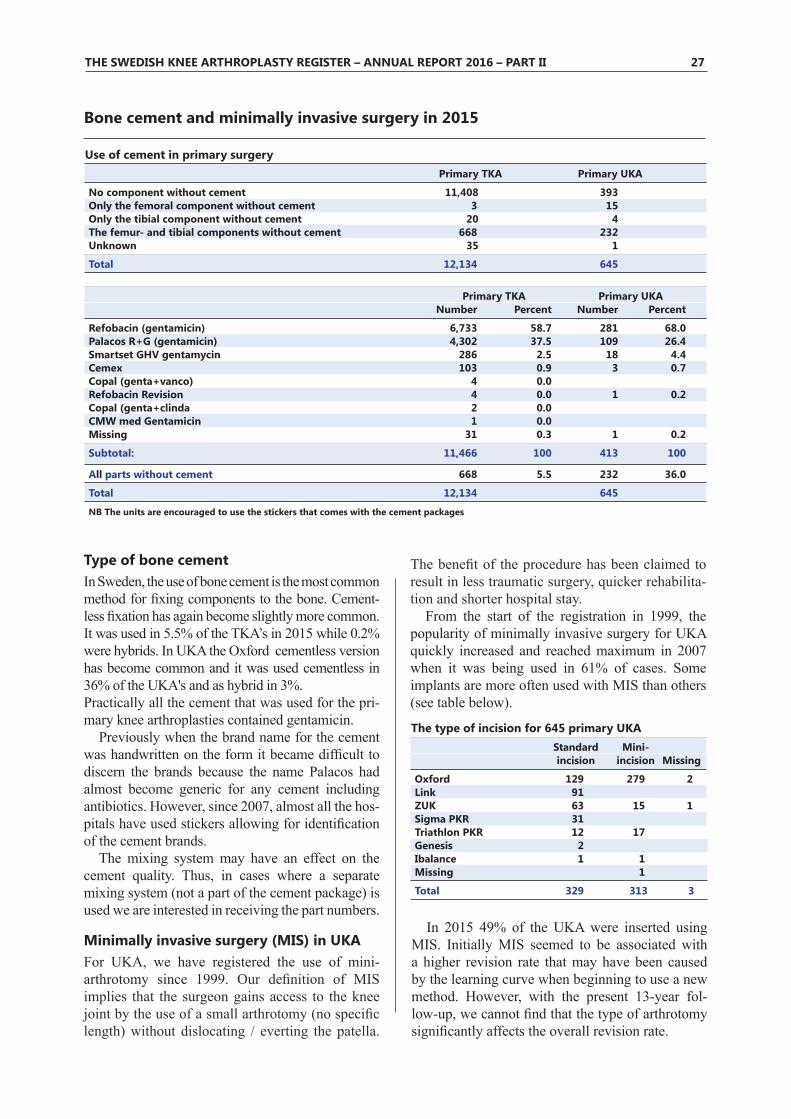
THE SWEDISH KNEE ARTHROPLASTY REGISTER – ANNUAL REPORT 2016 – PART II 27
The type of incision for 645 primary UKA Standard Mini- incision incision Missing
Oxford 129 279 2Link 91 ZUK 63 15 1Sigma PKR 31 Triathlon PKR 12 17 Genesis 2 Ibalance 1 1 Missing 1
Total 329 313 3
Type of bone cementIn Sweden, the use of bone cement is the most common method for fixing components to the bone. Cement-less fixation has again become slightly more common. It was used in 5.5% of the TKA’s in 2015 while 0.2% were hybrids. In UKA the Oxford cementless version has become common and it was used cementless in 36% of the UKA's and as hybrid in 3%. Practically all the cement that was used for the pri-mary knee arthroplasties contained gentamicin.
Previously when the brand name for the cement was handwritten on the form it became difficult to discern the brands because the name Palacos had almost become generic for any cement including antibiotics. However, since 2007, almost all the hos-pitals have used stickers allowing for identification of the cement brands.
The mixing system may have an effect on the cement quality. Thus, in cases where a separate mixing system (not a part of the cement package) is used we are interested in receiving the part numbers.
Minimally invasive surgery (MIS) in UKAFor UKA, we have registered the use of mini-arthrotomy since 1999. Our definition of MIS implies that the surgeon gains access to the knee joint by the use of a small arthrotomy (no specific length) without dislocating / everting the patella.
The benefit of the procedure has been claimed to result in less traumatic surgery, quicker rehabilita-tion and shorter hospital stay.
From the start of the registration in 1999, the popularity of minimally invasive surgery for UKA quickly increased and reached maximum in 2007 when it was being used in 61% of cases. Some implants are more often used with MIS than others (see table below).
Bone cement and minimally invasive surgery in 2015
In 2015 49% of the UKA were inserted using MIS. Initially MIS seemed to be associated with a higher revision rate that may have been caused by the learning curve when beginning to use a new method. However, with the present 13-year fol-low-up, we cannot find that the type of arthrotomy significantly affects the overall revision rate.
Use of cement in primary surgery Primary TKA Primary UKA
No component without cement 11,408 393Only the femoral component without cement 3 15Only the tibial component without cement 20 4The femur- and tibial components without cement 668 232Unknown 35 1
Total 12,134 645
Primary TKA Primary UKA Number Percent Number Percent
Refobacin (gentamicin) 6,733 58.7 281 68.0Palacos R+G (gentamicin) 4,302 37.5 109 26.4Smartset GHV gentamycin 286 2.5 18 4.4Cemex 103 0.9 3 0.7Copal (genta+vanco) 4 0.0 Refobacin Revision 4 0.0 1 0.2Copal (genta+clinda 2 0.0 CMW med Gentamicin 1 0.0 Missing 31 0.3 1 0.2
Subtotal: 11,466 100 413 100
All parts without cement 668 5.5 232 36.0
Total 12,134 645
NB The units are encouraged to use the stickers that comes with the cement packages

28 THE SWEDISH KNEE ARTHROPLASTY REGISTER – ANNUAL REPORT 2016 – PART II
Use of patella button with different TKA implants
No patella % Patella % button button
NexGen 5,636 98.6 79 1.4PFC Sigma 3,240 94.8 178 5.2Triathlon 1,325 99.3 9 0.7Vanguard 1,056 98.4 17 1.6Legion/Genesis 164 97.0 5 3.0Genesis II 152 96.8 5 3.2Attune 26 100.0 . 0PFC Rotating Platform 6 100.0 . 0Link Gemini 6 100.0 . 0Other 220 95.7 10 4.3
Total 11,831 97.5 303 2.5
The use of patella button for TKA in 2015
The use of patellar resurfacing has been decreas-ing since the mid-eighties so that it is now only used in 2.5% of the TKA cases. During 2015 a button was most commonly used in the counties of Gävls-borg and Gotland but not at all in Uppsala, Kalmar, Värmland and Västernorrland (see figure below).
It is not only in Sweden that geographical varia-tions are to be found. The Australian arthroplasty register in the 2009 annual report also found sub-stantial regional differences in the use of patellar buttons (https://aoanjrr.sahmri.com/home).
In Sweden, the use of a patella button has also been heavily related to the implant brand used although this effect has diminished as its use has become more uncommon. In 2015, button was most often used in primary arthroplasty together with the PFC Sigma TKA.
In Sweden, females have their patella resur-faced slightly more often than males whcih some have explained by femoropatellar pain being more common in women. In the whole material, from 1975 to the end of 2015, 13.5% of the women had their patella resurfaced compared to 10.2% of the males, which is a significant difference. During 2015 2.0% of the men had a patella button com-pared to 2.9% of the women which also is a signifi-cant difference.
100
90
80
70
60
50
40
30
20
10
0 Cop
yrig
ht ©
201
6 S
KA
R
< 45 45-54 55-64 65-74 75-84 85 -
Distribution (%) of patellar resurfacingamong different age groups in 2015
No PatellaPatella
Cop
yrig
ht ©
201
6 S
KA
R
01 03 04 05 06 07 08 09 10 12 13 14 17 18 19 20 21 22 23 24 25
100
90
80
70
60
50
40
30
20
10
0
County (no.)
Distribution (%) of patellar resurfacingin the counties 2015
No PatellaPatella
The figure shows the relative proportion of TKA with and without patella button in the different age-groups during 2015.
Looking at the relative use of a patella button in the different age groups during 2015 (see figure below), it can be seen patellar resurfacing was similar in all the age groups except the youngest, in which it is slightly more common. This has varied somewhat in recent years because of the low number of young patients.
How the risk of revision is influenced by the use of a patella button is discussed on page 19 where curves can be found showing the CRR during the current period of 2005-2014, for TKA with and without a button respectively.
The figure shows the relative proportion of TKA with and without patella button in the different counties during 2015(a list and a chart for the counties can be found on page 16).
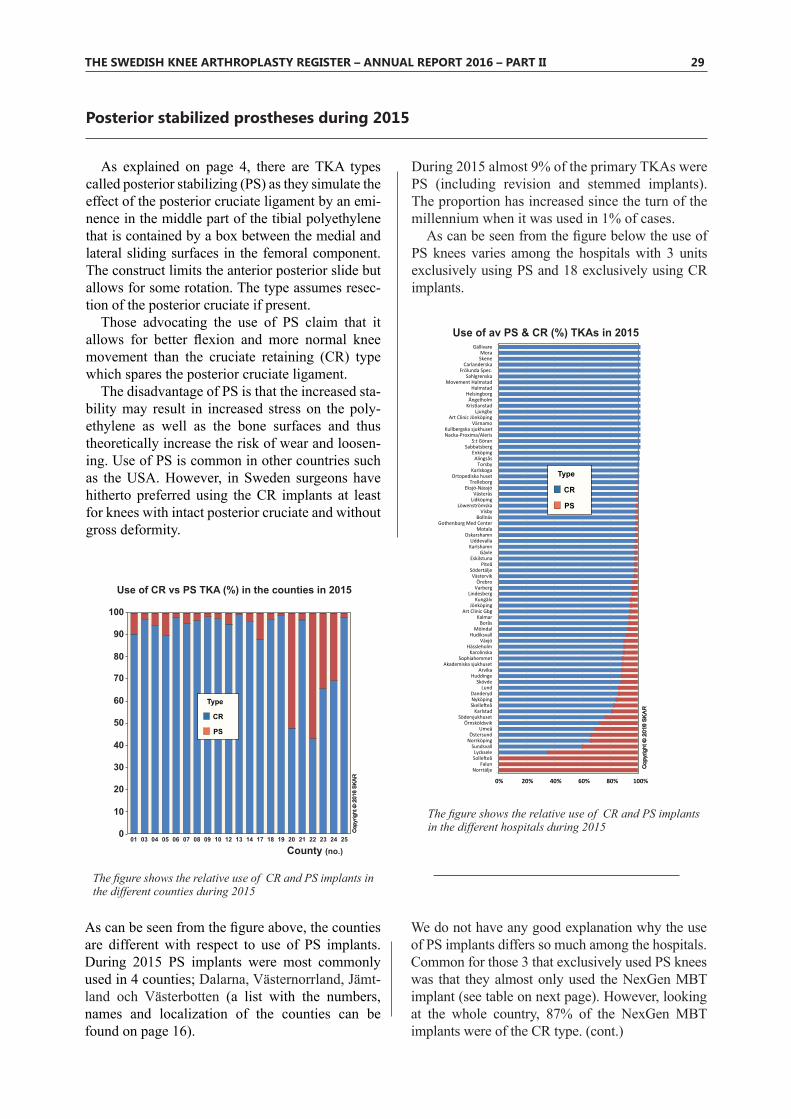
THE SWEDISH KNEE ARTHROPLASTY REGISTER – ANNUAL REPORT 2016 – PART II 29
Posterior stabilized prostheses during 2015
As explained on page 4, there are TKA types called posterior stabilizing (PS) as they simulate the effect of the posterior cruciate ligament by an emi-nence in the middle part of the tibial polyethylene that is contained by a box between the medial and lateral sliding surfaces in the femoral component. The construct limits the anterior posterior slide but allows for some rotation. The type assumes resec-tion of the posterior cruciate if present.
Those advocating the use of PS claim that it allows for better flexion and more normal knee movement than the cruciate retaining (CR) type which spares the posterior cruciate ligament.
The disadvantage of PS is that the increased sta-bility may result in increased stress on the poly-ethylene as well as the bone surfaces and thus theoretically increase the risk of wear and loosen-ing. Use of PS is common in other countries such as the USA. However, in Sweden surgeons have hitherto preferred using the CR implants at least for knees with intact posterior cruciate and without gross deformity.
The figure shows the relative use of CR and PS implants in the different counties during 2015
0% 20% 40% 60% 80% 100%
Cop
yrig
ht ©
201
6 S
KA
R
NorrtäljeFalun
Solle�eåLycksele
SundsvallNorrköpingÖstersund
UmeåÖrnsköldsvik
SödersjukhusetKarlstad
Skelle�eåNyköpingDanderyd
LundSkövde
HuddingeArvika
Akademiska sjukhusetSophiahemmet
KarolinskaHässleholm
VäxjöHudiksvall
MölndalBorås
KalmarArt Clinic Gbg
JönköpingKungälv
LindesbergVarbergÖrebro
VästervikSödertälje
PiteåEskilstuna
GävleKarlshamnUddevalla
OskarshamnMotala
Gothenburg Med CenterBollnäs
VisbyLöwenströmska
LidköpingVästerås
Eksjö-NässjöTrelleborg
Ortopediska husetKarlskoga
TorsbyAlingsås
EnköpingSabbatsberg
S:t GöranNacka-Proxima/AlerisKullbergska sjukhuset
VärnamoArt Clinic Jönköping
LjungbyKris�anstadÄngelholm
HelsingborgHalmstad
Movement HalmstadSahlgrenska
Frölunda Spec.Carlanderska
SkeneMora
Gällivare
Use of av PS & CR (%) TKAs in 2015
Type
CR
PS
As can be seen from the figure above, the counties are different with respect to use of PS implants. During 2015 PS implants were most commonly used in 4 counties; Dalarna, Västernorrland, Jämt-land och Västerbotten (a list with the numbers, names and localization of the counties can be found on page 16).
During 2015 almost 9% of the primary TKAs were PS (including revision and stemmed implants). The proportion has increased since the turn of the millennium when it was used in 1% of cases.
As can be seen from the figure below the use of PS knees varies among the hospitals with 3 units exclusively using PS and 18 exclusively using CR implants.
We do not have any good explanation why the use of PS implants differs so much among the hospitals. Common for those 3 that exclusively used PS knees was that they almost only used the NexGen MBT implant (see table on next page). However, looking at the whole country, 87% of the NexGen MBT implants were of the CR type. (cont.)
The figure shows the relative use of CR and PS implants in the different hospitals during 2015
100
90
80
70
60
50
40
30
20
10
0 Cop
yrig
ht ©
201
6 S
KA
R
01 03 04 05 06 07 08 09 10 12 13 14 17 18 19 20 21 22 23 24 25
County (no.)
Use of CR vs PS TKA (%) in the counties in 2015
Type
CR
PS

30 THE SWEDISH KNEE ARTHROPLASTY REGISTER – ANNUAL REPORT 2016 – PART II
Posterior stabilized prostheses cont. – There was no significant difference in use of PS implants depending on gender. The relative use of PS implants in the different age groups was similar with the exemption that PS was more common in the youngest group. However, the number of surge-ries in that group was small.
The relative proportion of CR and PS implants among the brands used for primary TKA in 2015
CR % PS %
NexGen MBT 4,846 87.2 714 12.8PFC-MBT 2,426 97.0 75 3.0Triathlon 1,292 96.9 42 3.1Vanguard 1,059 98.1 20 1.9PFC-HPT 914 100.0 0 0.0Legion/GenII Prim 149 88.2 20 11.8Genesis II 151 96.2 6 3.8NexGen TM 92 61.3 58 38.7Attune 26 100.0 0 0.0PFC-RP 4 66.7 2 33.3Link Gemini 6 100.0 0 0.0NexGen HPT 5 100.0 0 0.0Others 91 40.1 136 59.9
Total 11,061 91.2 1,073 8.8
100
90
80
70
60
50
40
30
20
10
0 Cop
yrig
ht ©
201
6 S
KA
R
< 45 45-54 55-64 65-74 75-84 85 -
Distribution (%) in use of CR vs PS TKAamong different age groups in 2015
CRPS
As can be seen from the table below, the use of PS implants is most common in the group of "other" implants but the group consists mainly of stem-med and revisions models (see page 34). Among the "ordinary" TKAs, the use of PS is most frequent among the users of NexGen implants. The figure shows the relative use of cruciate retaining (CR)
and posterior stabilized (PS) implants among the different age groups during 2015.
Unfortunately it is not straightforward to com-pare the results of the two types. The reason is that because of their greater stability, many surgeons reserve the use of PS knees for cases having insuf-ficient ligaments or greater deformity.
Even though some hospitals exclusively use one or the other type, the comparison is not straightforward as it is possible that more difficult cases are referred from hospitals exclusively using CR knees to hospi-tals that have more experience with PS knees.
An additional complicating factor is that the use of PS knees is more common in some implant brands as compared to others (see table above).
It is probably necessary to perform a randomized trial in order to estimate the differences in survival between the types.
Please note that tibia components that in order to increase stability use an anterior lip or an extra concave polyethylene (deep dish) are not consid-ered being PS implants. Some can be used both with an intact cruciate ligament as well as when the cruciate is insufficient or absent. However, there are several versions having different degree of conformity and in Sweden relatively few of the more stabilizing versions for substituting the pos-terior cruciate ligament have been used.

THE SWEDISH KNEE ARTHROPLASTY REGISTER – ANNUAL REPORT 2016 – PART II 31
100
90
80
70
60
50
40
30
20
10
0 Cop
yrig
ht ©
201
6 S
KA
R
01 03 04 05 06 07 08 09 10 12 13 14 17 18 19 20 21 22 23 24 25
County (no.)
Gender distribution (%) in the counties 2015
MenWomen
The proportion of females having surgery in the different counties was 51-72% during 2015.
Gender distribution in the counties Type of implants in different age groups
100
90
80
70
60
50
40
30
20
10
0 Cop
yrig
ht ©
201
6 S
KA
R
< 45 45-54 55-64 65-74 75-84 85 -
Distribution (%) of types of implantsamong different age groups in 2015
Fem-PatMed. UKATKALinked
Uncommon models are most often used in patients younger the 45 years. The use of linked implant was limited in 2015 but these are used for serious conditions (tumors. trauma etc.)
100
90
80
70
60
50
40
30
20
10
0 Cop
yrig
ht ©
201
6 S
KA
R
01 03 04 05 06 07 08 09 10 12 13 14 17 18 19 20 21 22 23 24 25
County (no.)
Distribution (%) of surgeries over the week
Weekday
Sun.
Sat.
Fri.
Thur.
Wed.
Tue.
Mon
1600
1400
1200
1000
800
600
400
200
0 Cop
yrig
ht ©
201
6 S
KA
R
Number of surgeries per month in 2014 & 2015
Jan Feb Mar Apr May Jun Jul Aug Sept Oct Nov Dec
20142015
Distribution of surgery on the weekdays and months
Distribution of surgery on the weekdays during 2015. Surgery on Fridays and weekends is uncommon.
The mean number of primary knee arthroplasties inserted each month during 2014 and 2015.
Knee arthroplasty is not often performed on Fridays and weekends. The reasons among others. are reduced working hours on Fridays as well as reduced means for rehabilitation in combination with reduced number of available hospital beds during weekends. This results in arthroplasty sur-gery being concentrated during the first part of the week so that the patients can be discharged not later than Friday.
All the counties perform at least 94% of their surgeries Monday to Thursday. Skåne is the county that most frequently operates on Fridays.
The figure above shows the number of surger-ies during the different months of 2014 and 2015. It is evident how the production drops during the summer as around Christmas.
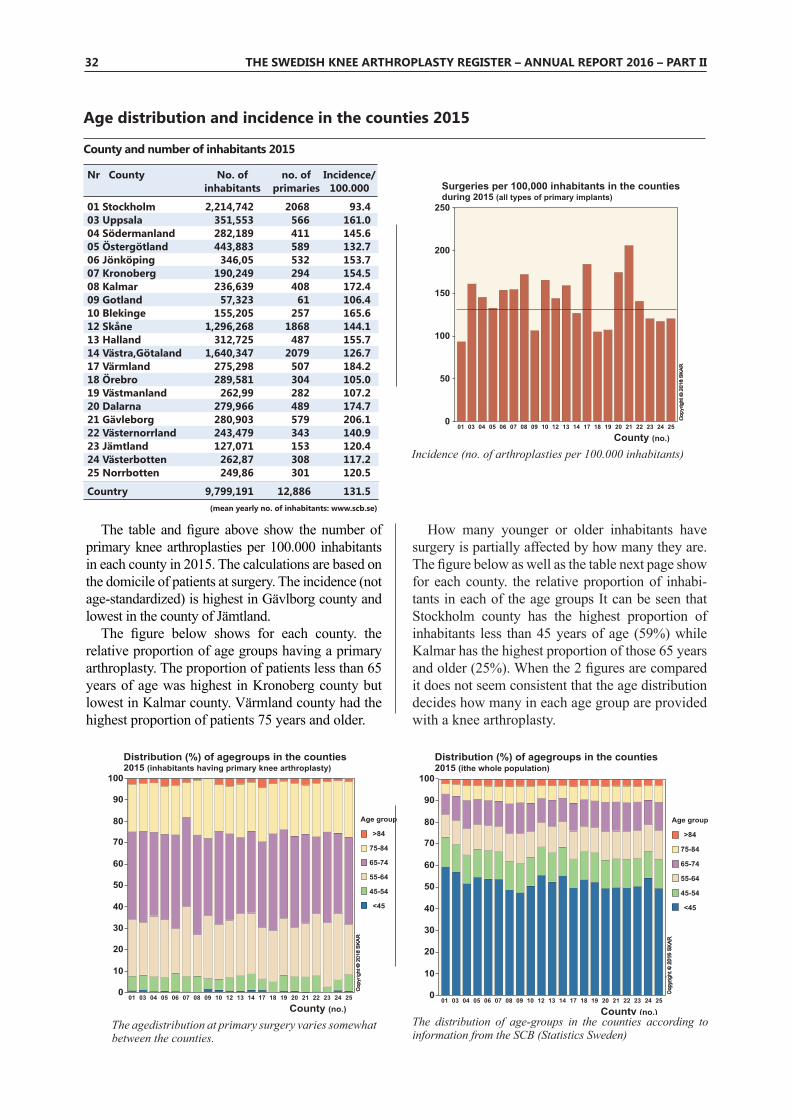
32 THE SWEDISH KNEE ARTHROPLASTY REGISTER – ANNUAL REPORT 2016 – PART II
100
90
80
70
60
50
40
30
20
10
0 Cop
yrig
ht ©
201
6 S
KA
R
01 03 04 05 06 07 08 09 10 12 13 14 17 18 19 20 21 22 23 24 25
Age group
>84
75-84
65-74
55-64
45-54
<45
County (no.)
Distribution (%) of agegroups in the counties2015 (inhabitants having primary knee arthroplasty)
The agedistribution at primary surgery varies somewhat between the counties.
Incidence (no. of arthroplasties per 100.000 inhabitants)
250
200
150
100
50
0 Cop
yrig
ht ©
201
6 S
KA
R
01 03 04 05 06 07 08 09 10 12 13 14 17 18 19 20 21 22 23 24 25
County (no.)
Surgeries per 100,000 inhabitants in the countiesduring 2015 (all types of primary implants)
100
90
80
70
60
50
40
30
20
10
0 Cop
yrig
ht ©
201
6 S
KA
R
01 03 04 05 06 07 08 09 10 12 13 14 17 18 19 20 21 22 23 24 25
Age group
>84
75-84
65-74
55-64
45-54
<45
County (no.)
Distribution (%) of agegroups in the counties2015 (ithe whole population)
The distribution of age-groups in the counties according to information from the SCB (Statistics Sweden)
Age distribution and incidence in the counties 2015
The table and figure above show the number of primary knee arthroplasties per 100.000 inhabitants in each county in 2015. The calculations are based on the domicile of patients at surgery. The incidence (not age-standardized) is highest in Gävlborg county and lowest in the county of Jämtland.
The figure below shows for each county. the relative proportion of age groups having a primary arthroplasty. The proportion of patients less than 65 years of age was highest in Kronoberg county but lowest in Kalmar county. Värmland county had the highest proportion of patients 75 years and older.
County and number of inhabitants 2015
Nr County No. of no. of Incidence/ inhabitants primaries 100.000
01 Stockholm 2,214,742 2068 93.403 Uppsala 351,553 566 161.004 Södermanland 282,189 411 145.605 Östergötland 443,883 589 132.706 Jönköping 346,05 532 153.707 Kronoberg 190,249 294 154.508 Kalmar 236,639 408 172.409 Gotland 57,323 61 106.410 Blekinge 155,205 257 165.612 Skåne 1,296,268 1868 144.113 Halland 312,725 487 155.714 Västra,Götaland 1,640,347 2079 126.717 Värmland 275,298 507 184.218 Örebro 289,581 304 105.019 Västmanland 262,99 282 107.220 Dalarna 279,966 489 174.721 Gävleborg 280,903 579 206.122 Västernorrland 243,479 343 140.923 Jämtland 127,071 153 120.424 Västerbotten 262,87 308 117.225 Norrbotten 249,86 301 120.5
Country 9,799,191 12,886 131.5
( mean yearly no. of inhabitants: www.scb.se)
How many younger or older inhabitants have surgery is partially affected by how many they are. The figure below as well as the table next page show for each county. the relative proportion of inhabi-tants in each of the age groups It can be seen that Stockholm county has the highest proportion of inhabitants less than 45 years of age (59%) while Kalmar has the highest proportion of those 65 years and older (25%). When the 2 figures are compared it does not seem consistent that the age distribution decides how many in each age group are provided with a knee arthroplasty.

THE SWEDISH KNEE ARTHROPLASTY REGISTER – ANNUAL REPORT 2016 – PART II 33
Age standardized incidence in the counties(primaries per 100.000 inhabitants in 2015)
Nr County Incidence01 Stockholm 111.203 Uppsala 170.204 Södermanland 134.405 Östergötland 131.806 Jönköping 149.907 Kronoberg 150.908 Kalmar 145.709 Gotland 112.210 Blekinge 147.112 Skåne 147.613 Halland 148.714 Västra.Götaland 130.217 Värmland 160.918 Örebro 108.719 Västmanland 101.520 Dalarna 150.721 Gävleborg 180.322 Västernorrland 123.623 Jämtland 116.924 Västerbotten 113.625 Norrbotten 104.3
The country 132.2
Age standardized incidence in 2015
The age distribution differs in the counties (table above from the SCB). For a meaningful compar-ison of incidence, i.e. how common it is for the inhabitants of the counties of having knee replace-ment, the age distribution has to be taken into account because a younger population does not have the same need for arthroplasties as an older one. This can be achieved by age standardization in which the incidence is recalculated to what it would have been if the age distribution had been the same in all the counties.
To make it possible to compare different coun-tries we used a 2013 recommendation to the European Commission on a new ”EU-27 + EFTA standard population” (Report of Eurostat’s task force ISBN 978-92-79-31094-2).
The distribution of age groups according to this European standard population is shown in the last line of the table above and the age standardized incidence in the table to the right.
It can be seen that the age-standardized inci-dence is lowest 101.5 in Västmannaland county and highest 180.3 in in Gävleborg county.
Uppsala has 50% higher incidence than Stock-holm but the counties are geographically side by side and both have university hospitals.
We have really no good explanation for the large differences between counties in how often their inhabitants are provided with a knee arthroplasty.
Distribution (%) of age groups in the counties in 2015 (whole population) Age group: 0-44 45-54 55-64 65-74 75-84 85- Stockholm 59.4 13.8 10.6 9.4 4.6 2.2 Uppsala 57.0 12.7 11.3 11.1 5.4 2.5 Södermanland 51.7 13.3 12.2 12.9 6.8 3.1 Östergötland 54.6 13.0 11.6 11.5 6.3 3.0 Jönköping 53.8 13.3 11.7 11.4 6.6 3.3 Kronoberg 53.7 12.8 11.8 11.6 6.7 3.4 Kalmar 48.8 13.2 13.0 13.6 7.8 3.5 Gotland 47.5 13.5 14.0 14.1 7.5 3.3 Blekinge 50.6 13.3 12.1 12.9 7.7 3.4 Skåne 55.6 13.2 11.3 11.0 6.1 2.9 Halland 52.4 13.6 12.0 12.1 6.7 3.1 Västra.Götaland 55.3 13.3 11.6 10.9 6.0 2.8 Värmland 49.7 13.4 12.9 12.9 7.5 3.5 Örebro 53.5 13.0 11.7 12.3 6.4 3.1 Västmanland 52.3 13.7 11.7 12.3 6.9 3.2 Dalarna 49.5 13.0 13.1 13.6 7.4 3.4 Gävleborg 49.9 13.4 12.8 13.5 7.3 3.2 Västernorrland 49.7 13.3 12.9 13.3 7.7 3.2 Jämtland 50.4 13.0 13.0 13.1 7.1 3.4 Västerbotten 54.3 12.3 12.2 11.6 6.7 2.9 Norrbotten 49.5 13.4 13.4 12.9 7.8 3.0
The country 54.8 13.3 11.6 11.3 6.1 2.9
ESP (European Standard Population) 54.0 14.0 12.5 10.5 6.5 2.5

34 THE SWEDISH KNEE ARTHROPLASTY REGISTER – ANNUAL REPORT 2016 – PART II
Implants for primary TKA Number Percent
NexGen 43,958 39.0PFC 30,892 27.4Vanguard 9,489 8.4Triathlon 8,196 7.3AGC 7,626 6.8Duracon 4,113 3.7F/S MIII 2,517 2.2Profix 1,979 1.8PFC-Rotating Platform 1,090 1.0Genesis II, Legion/Gen. 602 0.5Natural II 359 0.3Kinemax 131 0.1Journey 84 0.1Link Gemini 62 0.1Vanguard XP 13 0.0Other TKA's 13 0.0Revision TKA's* 1,518 1.4Missing 66 0.1
Total 112,708 100* For revision models. see table right.
Implants for primary UKA Number Percent
Oxford 2,497 37.0Link 2,054 30.5MillerGalante 811 12.0ZUK 662 9.8Genesis 407 6.0Triathlon PKR 142 2.1Preservation 122 1.8Sigma PKR 40 0.6Ibalance 3 0.0EIUS 2 0.0Missing 1 0.0
Total 6,742 100
Hinged implants (primary) Number Percent
Rotalink 240 40.7Nexgen RHK 170 28.8MUTARS 54 9.2S-ROM Noiles RHK 43 7.3Stryker/Howmedica RHK 35 5.9METS 28 4.7Stanmore 7 1.2Biomet Rotating Hinge 6 1.0Other 6 1.0Missing 1 0.2
Total 590 100
Implants for primary arthroplasty 2005–2014
In the tables below, the implants used during the investigated period 2005-2014 are listed. One must observe that the individual models, espe-cially in case of modular types, may include sev-eral different implant variants. During the 10-year period, NexGen was the most commonly used model followed by the PFC. Vanguard which has replaced the AGC that no longer is used was in the third place followed by Triathlon the successor to Duracon.
Implants that are specifically made for use in revision surgery or standard models with extra-long stems (5cm or longer) are classified as revi-sion models. When used for primary surgery they are excluded from the analyses concerning standard models. The same applies for hinges and linked implants. The most common types are listed below.
Revision Models* for primary TKA Number Percent
NexGen Revision 417 27.5Triathlon Revision 339 22.3PFC Revision 337 22.2Vanguard Revision 113 7.4Duracon Revision 108 7.1AGC Revision 103 6.8Profix Revision 74 4.9Legion/Genesis Revision 25 1.6F/S Revision 2 0.1
Total 1,518 100
*”Revision models” are implants made specifically for revisions. or ordinary models with extra long stems (5 cm or more).
Femoro-Patellar implants Number Percent
Zimmer P-F 193 57.1Avon P-F 57 16.9PFC P-F 31 9.2Link P-F 28 8.3Journey P-F 7 2.1Vanguard P-F 6 1.8Richard /Blazina 5 1.5LCS P-F 5 1.5Other 3 0.9Missing 3 0.9Total 338 100
Femoro-patellar implants are uncommon. Only 338 cases using 8 different brands were reported during the 10 year period.
Among the UKA’s, 2 models account for the majority of surgeries. Of the ten models listed below, seven were used in 2015.

THE SWEDISH KNEE ARTHROPLASTY REGISTER – ANNUAL REPORT 2016 – PART II 35
During the 10-year period, 6,127 first time revi-sions were performed. 3,830 were revisions of TKAs for OA, 230 of TKAs for RA and 1,630 were revi-sions of UKAs for OA. The reasons for the revisions are shown in the diagram to the right. Note that some primary operations may have been performed before the accounted 10-year period. Infection and loosening are now equally often the reason for revision of TKAs while loosening previously dominated. ”Progress” in TKA mainly reflects revisions performed for femoro-patellar arthrosis/ arthritis. ”Patella” includes all kinds of problems associated with the patella in patients that had their primaries inserted with or without a patellar button (excluding loosening and wear). Please note that the distribution of the indications does not have to reflect the risk for revision. The sharp increase in the number of primaries over the years leads to over-representation of early revisions that include infection.
The tables show the different types of revisions (first) that were performed during 2005-2014. There are separate tables depending on if the primary surgery was TKA/OA, TKA/ RA or UKA/OA. It should be noted that in revision surgery, only one type of revision
100
90
80
70
60
50
40
30
20
10
0 Cop
yrig
ht ©
201
6 S
KA
R
TKA-OA TKA-RA UKA-OA
Distribution (%) of indications for revision 2005-2014
OtherProgressInstabilityPatellaFractureWearLooseningInfection
Revisions during 2005–2014
Type of revision in which the primary was a TKA/OA Number Percent
Linked (rot. hinge) 367 9.6TKA 1,033 27.0Exchange of femur comp. 42 1.1Exchange of tibia comp. 272 7.1Exchange of disc/inlay 899 23.5Patella addition 732 19.1Patella exchange 10 0.3Patella removal 36 0.9Total implant removal 394 10.3Arthrodesis 15 0.4Amputation 25 0.7Other 5 0.1
Total 3,830 100
Type of revision in which the primary was a TKA/RA Number Percent
Linked (rot. hinge) 45 19.6TKA 71 30.9Exchange of femur comp. 6 2.6Exchange of tibia comp. 6 2.6Exchange of disc/inlay 46 20.0Patella addition 21 9.1Total implant removal 30 13.0Arthrodesis 2 0.9Amputation 3 1.3
Total 230 100
Type of revision in which the primary was a UKA/OA Number Percent
Linked (rot. hinge) 34 2.1TKA 1,489 91.3UKA 8 0.5Exchange of femur comp. 6 0.4Exchange of tibia comp. 7 0.4Exchange/reposition of poly 61 3.7Patella addition 5 0.3Total implant removal 18 1.1Amputation 2 0.1
Totalt 1,630 100
can be stated. This implies that exclusive patellar sur-gery is listed, but not patellar surgery done in combina-tion with exchange of other components.
For TKA the proportion of revisions in which the poly is exchanged has increased as compared to previ-ously (23% in OA and 20s% in RA) which is because of increased aggressively in revision of early infec-tions. Extensive revisions using linked implants seem more common in RA.
For UKA, it is satisfying to note that revisions using a new UKA are few, as these types of revisions have been found to have a very high rate of re-revision.
When evaluating the survival curves it should be noted that as the part of the curve to the right contains implants with long follow-up it also to a larger extent reflects older models.

36 THE SWEDISH KNEE ARTHROPLASTY REGISTER – ANNUAL REPORT 2016 – PART II
CRR in the counties after primary TKA for OA 2005–2014
The curves are cut when less than 40 patients are left ”at risk”

THE SWEDISH KNEE ARTHROPLASTY REGISTER – ANNUAL REPORT 2016 – PART II 37
The curves are cut when less than 40 patients are left ”at risk”

38 THE SWEDISH KNEE ARTHROPLASTY REGISTER – ANNUAL REPORT 2016 – PART II
CRR in the counties after primary TKA for OA 2005–2014
The curves are cut when less than 40 patients are left ”at risk”

THE SWEDISH KNEE ARTHROPLASTY REGISTER – ANNUAL REPORT 2016 – PART II 39
The curves are cut when less than 40 patients are left ”at risk”

40 THE SWEDISH KNEE ARTHROPLASTY REGISTER – ANNUAL REPORT 2016 – PART II
CRR in the counties after primary UKA for OA 2005–2014
The curves are cut when less than 40 patients are left ”at risk”

THE SWEDISH KNEE ARTHROPLASTY REGISTER – ANNUAL REPORT 2016 – PART II 41
The curves are cut when less than 40 patients are left ”at risk”

42 THE SWEDISH KNEE ARTHROPLASTY REGISTER – ANNUAL REPORT 2016 – PART II
CRR in the counties after primary UKA for OA 2005–2014
The curves are cut when less than 40 patients are left ”at risk”

THE SWEDISH KNEE ARTHROPLASTY REGISTER – ANNUAL REPORT 2016 – PART II 43
The curves are cut when less than 40 patients are left ”at risk”

44 THE SWEDISH KNEE ARTHROPLASTY REGISTER – ANNUAL REPORT 2016 – PART II
The relative risk for implants used in primary arthroplasty during 2005–2014
In order to account for results of relatively modern implants with reasonably long follow-up, the registry uses the latest 10-year period available for analysis. When an implant has been put on the list, it stays on the list as long as there are reasonable numbers to be analyzed even if its use has ceased. One must realize that individual models may repre-sent different variants depending on modularity and marketing. Still, there are usually a few combina-tions that dominate within each brand.
Thus, 92% of the PFC Sigma use the same type of a ”non-porous C/R” femur component which in 44% of cases was inserted with a cemented metal backed tibia component (MBT) and in 40% with an all-poly tibia (APT) component. NexGen had more femoral variants of which 46% were CR Option. On the tibia side, 88% were MBT (of which Option was 88%), 9% had an AP tibia and in 3% had a trabecu-lar metal (TM) tibia component.
As last year we use the PFC Sigma-MBT as the reference for TKAs which is a relatively well defined brand, i.e. it mainly consists of the same type of femur (92%) together with the same type of
tibia baseplate (77%) and with a curved inlay (98%). The risk of revision is one of the many mea-
sures of outcome. Although not accounted for here, the type of the revision should also be considered. Deliberately avoiding the use of patellar button in primary surgery and instead preparing for second-ary resurfacing when needed, may increase the risk of revision, at least in the short term. Therefore, we separately account for OA/TKA when used with and without a patellar button. For the third time we also make separate calculations in which isolated exchanges of inlays due to infection are not consid-ered being revisions. The explanation for doing so is discussed together with the tables on page 46-47.
Below you will find Cox regression tables for TKA/OA and UKA/OA in which the different models are compared to a reference implant. For TKA the reference is as described above the PFC-MBT but for UKA it is the Endo-Link as previously.
The risk of revision (RR) with 95% confidence interval. For TKA the reference is PFC-Sigma MBT and for UKA Link.The Cox regression adjusts for differences in gender. age and year of operation.
OA / TKA n p–value RR 95% CI
PFC-Sigma MBT 17,780 ref. AGC 7,294 <0.01 1.29 1.10-1.51Duracon 3,911 <0.01 1.31 1.08-1.59F/S MIII 2,434 <0.01 1.86 1.53-2.28Genesis II 545 0.50 0.75 0.34-1.69NexGen APT 4,089 0.51 0.93 0.74-1.16NexGen MBT 37,041 0.04 0.88 0.77-0.99NexGen TM 1,106 0.03 0.61 0.39-0.94PFC-Sigma APT 11,972 <0.01 0.77 0.65-0.90PFC-RP 1,019 <0.01 2.14 1.68-2.74Profix 1,855 0.07 1.29 0.98-1.69Triathlon 7,883 0.89 0.99 0.82-1.19Vanguard 9,092 0.08 1.16 0.98-1.37Others 1,811 <0.01 1.64 1.28-2.11
Gender (male is ref.) 0.06 0.93 0.86-1.00Age (per year) <0.01 0.97 0.96-0.97Year of op. (per year) <0.01 1.03 1.01-1.05
Red is significant difference with higher risk ratio.Green is significant difference with lower risk ratio.
OA / UKA n p–value RR 95% CI
Link 2,020 ref. Genesis 398 0.35 1.17 0.85-1.61MillerGalante 788 0.12 1.20 0.95-1.52Oxford 2,437 0.37 0.91 0.74-1.12Preservation 120 0.05 1.57 1.00-2.47Triathlon PKR 138 0.56 1.20 0.65-2.23ZUK 621 0.60 0.92 0.66-1.26Others 46 0.68 0.75 0.18-3.02
Gender (male is ref.) 0.95 0.99 0.85-1.1Age (per year) <0.01 0.97 0.96-0.98Year of op. (per year) 0.02 1.05 1.01-1.09

THE SWEDISH KNEE ARTHROPLASTY REGISTER – ANNUAL REPORT 2016 – PART II 45
The risk of revision (RR) with 95% confidence interval for OA/TKA inserted respectively without and with a patellar button. PFC-Sigma MBT is used as reference.
Without patella button OA / TKA n p–value RR 95% CI
PFC-Sigma MBT 17,302 ref. AGC 6,246 <0.01 1.39 1.18-1.65Duracon 3,411 0.05 1.24 1.00-1.53F/S MIII 1,901 <0.01 2.13 1.72-2.63Genesis II 540 0.35 0.66 0.27-1.59NexGen APT 4,016 0.88 0.98 0.79-1.23NexGen MBT 36,509 0.11 0.90 0.80-1.02NexGen TM 1,077 0.06 0.66 0.42-1.01PFC-Sigma APT 11,645 0.01 0.79 0.67-0.94PFC-RP 803 <0.01 2.14 1.62-2.83Profix 1,684 0.08 1.30 0.97-1.72Triathlon 7,696 0.76 1.03 0.85-1.24Vanguard 8,619 0.01 1.26 1.07-1.50Other 1,654 <0.01 1.70 1.31-2.21
Gender (male is ref.) 0.14 0.94 0.87-1.02Age (per year) <0.01 0.97 0.97-0.97Year of op. (per year) 0.01 1.03 1.01-1.05
With patella button OA / TKA n p–value RR 95% CI
PFC-Sigma MBT 478 ref. AGC 1,048 <0,01 0,39 0,23-0,67Duracon 500 0,61 0,87 0,51-1,49F/S MIII 533 0,02 0,48 0,26-0,90Genesis II 5 0,10 5,59 0,74-42,44NexGen APT 73 1,00 0,00 NexGen MBT 532 0,13 0,61 0,32-1,16NexGen TM 29 1,00 0,00 PFC-Sigma APT 327 0,03 0,37 0,15-0,90PFC-RP 216 0,80 0,93 0,51-1,69Profix 171 0,51 0,75 0,33-1,74Triathlon 187 0,06 0,36 0,13-1,05Vanguard 473 <0,01 0,08 0,02-0,34Other 157 0,39 0,69 0,29-1,61
Gender (male is ref.) 0,05 0,73 0,54-0,99Age (per year) <0,01 0,96 0,94-0,97Year of op. (per year) 0,35 1,04 0,96-1,14
Using our division of TKA implants inserted for OA (left table on the previous page), we have very similar results as last year where the AGC, F/S MIII, Duracon, PFC RP and the combination of “Other” models have significantly higher risk than the refer-ence PFC-MBT. F/S MIII and Duracon were used in Sweden in the nineties, the F/S until 2008 and the Duracon until 2011. The use of AGC, which was our reference for many years, began in the eighties and it was used until 2012. The PFC rotating plat-form was introduced at the start of the millennium and became most popular during 2009-2010 after which its use sharply diminished. Implants with lower risk than the reference were as last year the PFC-APT, NexGen MBT and NexGen TM.
The risk of revision decreases with increasing age but increases with time. The latter may be caused by an increasing number of inlay exchanges in mani-fest or suspected infections. On the next page we have performed the same analysis but without con-sidering such inlay exchanges being revisions and then the effect of the year of surgery disappears.
With respect to UKA inserted for OA (table on the previous page) one can see that 2 models account for the majority of surgeries. The risk increases with time (Op. year) which may indicate that the UKA revision rate has increased over the 10-year period. The only model with higher risk than the Link refer-ence is as last year the Preservation which has not been reported being used since 2011.
Implants lacking sufficient numbers for analysis are shown in italics
Above, the TKA implants have been divided into those without (left) and with (right) a patellar button. This reduces the number of implants avail-able for each of the analyses, especially for the group in which a patellar button was used.
Without a patellar button, only the PFC-Sigma APT has a significantly lower risk of revision than the reference while the NexGen MBT and NexGen TM are no longer ignificantly better. than the refer-ence. The models with higher risk than the refer-ence are the same as when all TKA's are analyzed (table on the previous page).
As compared to last year, the NexGen MBT has no longer significantly lower risk than the refer-ence while the risk for the Duracon has again become significantly higher.
With a patellar button, the number of arthroplas-ties is rather small which makes it more difficult to show significant differences. However, it is inter-esting to see that the AGC, F/S MIII and Vanguard which all had a higher risk than the reference when no button was used have a lower risk when used together with a button.

46 THE SWEDISH KNEE ARTHROPLASTY REGISTER – ANNUAL REPORT 2016 – PART II
OA / TKA n p–value RR 95% CI
PFC-Sigma MBT 17 780 ref. AGC 7,294 0.00 1.57 1.32-1.86Duracon 3,911 0.00 1.38 1.12-1.70F/S MIII 2,434 0.00 2.11 1.71-2.61Genesis II 545 0.82 1.11 0.46-2.69NexGen APT 4,089 0.08 1.23 0.98-1.54NexGen MBT 37,041 0.05 0.87 0.75-1.00NexGen TM 1,106 0.09 0.67 0.42-1.06PFC-Sigma APT 11,972 0.96 1.00 0.84-1.18PFC-RP 1,019 0.00 2.41 1.87-3.12Profix 1,855 0.02 1.44 1.07-1.93Triathlon 7,883 0.44 0.92 0.73-1.14Vanguard 9,092 0.02 1.27 1.05-1.54Others 1,811 0.00 1.65 1.24-2.18
Gender (male is ref.) 0.07 1.08 0.99-1.18Age (per year) <0.01 0.96 0.95-0.96Year of op. (per year) 0.75 1.00 0.98-1.02
The risk of revision (RR) with 95% confidence interval. For TKA the reference is PFC-Sigma MBT and for UKA Link.The exchange of inlay. in case of infection. is not considered to be a revision.
The SKAR defines a revision being a secondary surgery (reoperation) in a knee having an implant during which implant components are exchanged, added or removed.
The reason for other types not being considered is that it was noted early on that many surgeons did not report reoperations which they did not consider directly related to a prior knee arthroplasty. This resulted in different types of soft tissue surgeries never being reported and thus, the register decided to use a stricter definition of revision which surely had some-thing to do with the implant.
It has been claimed that in infected revisions, the strict definition may treat certain implants unfairly. The reason is that almost half of all the revisions for infection are synovectomies during which the inlay is also exchanged (defining them as being revisions). However, a synovectomy in a knee having an implant in which the inlay cannot be exchanged is not counted as a revision, which in turn may favor the type. Thus, the argument has been made that an exchange of inlay in infection should not be considered a revision but a synovectomy.
On the opposite it can be claimed that infected TKA´s with fixed inlays will be treated with a com-plete exchange of components, as a comprehensive synovectomy is not considered possible without removal of the inlay. This could result in a reversed bias when the exchange of an inlay is not considered as being a revision.
Without being able to give a definite answer regarding what is most reasonable, we decided to also produce tables in which the exchange of inlays (for infection) are not considered being revisions. It has to be observed that such exclusion reduces the number of revisions, which in turn reduces the sensitivity of the statistical calculations. During the 10-year period we accordingly excluded 541 TKA and 4 UKA revisions. However, any later revisions of these knees will count instead.
For TKA/OA, without considering patella resurfac-ing (table below), we see in comparison to the table on page 44 that the same implants have an increased risk except that Vanguard and Profix have joined the group. The three that had lower risk than the reference (NexGen MBT, NexGen TM and PFC-Sigma APT) are no longer significantly different. It should be noted that the poly cannot be exchanged in the PFC-APT or the Monoblock NexGen TM (2/3 of the TMs) which as well as the NexGen APT will not benefit for any exclusion of inlay exchanges.
After the exclusion the negative effect of time (year of op.) has disappeared. The cause is prob-ably the increased aggressiveness in recent years in treating early or suspected infections by debride-ment and exchange of inlay when possible. This has resulted in increased number of inlay revisions in recent years causing the negative effect of time in the previous table.
The relative risk for implants used in primary arthroplasty during 2005–2014if the exchange of inlay, in case of infection, is not considered to be a revision
OA / UKA n p–value RR 95% CI
Link 2.020 ref. Genesis 398 0.34 1.17 0.85-1.61MillerGalante 788 0.13 1.20 0.95-1.51Oxford 2,437 0.29 0.90 0.73-1.10Preservation 120 0.05 1.57 1.00-2.46Triathlon PKR 138 0.54 1.21 0.65-2.26ZUK 621 0.62 0.92 0.67-1.27Others 46 0.69 0.75 0.19-3.06
Gender (male is ref.) 0.91 0.99 0.85-1.16Age (per year) <0.01 0.97 0.96-0.98Year of op. (per year) 0.03 1.05 1.01-1.09
Red is significant difference with higher risk ratio.Green is significant difference with lower risk ratio.

THE SWEDISH KNEE ARTHROPLASTY REGISTER – ANNUAL REPORT 2016 – PART II 47
Without patella button OA / TKA n p–value RR 95% CI
PFC-Sigma MBT 17,302 ref. AGC 6,246 <0.01 1.71 1.43-2.04Duracon 3,411 0.04 1.27 1.01-1.60F/S MIII 1,901 <0.01 2.48 1.98-3.09Genesis II 540 0.91 0.94 0.35-2.54NexGen APT 4,016 0.02 1.31 1.04-1.65NexGen MBT 36,509 0.16 0.90 0.78-1.04NexGen TM 1,077 0.18 0.72 0.45-1.16PFC-Sigma APT 11,645 0.67 1.04 0.87-1.24PFC-RP 803 <0.01 2.46 1.84-3.28Profix 1,684 0.01 1.52 1.12-2.07Triathlon 7,696 0.88 0.98 0.79-1.23Vanguard 8,619 <0.01 1.40 1.15-1.70Others 1,654 <0.01 1.68 1.24-2.26
Gender (male is ref.) 0.03 1.11 1.01-1.21Age (per year) <0.01 0.96 0.95-0.96Year of op. (per year) 0.52 0.99 0.97-1.01
With patella button OA / TKA n p–value RR 95% CI
PFC-Sigma MBT 478 ref. AGC 1,048 0.01 0.46 0.26-0.81Duracon 500 1.00 1.00 0.57-1.77F/S MIII 533 0.04 0.49 0.25-0.96Genesis II 5 0.06 7.30 0.95-56.09NexGen APT 73 1.00 0.00 NexGen MBT 532 0.14 0.58 0.28-1.19NexGen TM 29 1.00 0.00 PFC-Sigma APT 327 0.08 0.44 0.18-1.09PFC-RP 216 0.88 0.95 0.5-1.81Profix 171 0.19 0.49 0.17-1.43Triathlon 187 0.03 0.11 0.01-0.79Vanguard 473 0.00 0.09 0.02-0.40Others 157 0.68 0.83 0.35-1.99
Gender (male is ref.) 0.18 0.80 0.57-1.11Age (per year) <0.01 0.95 0.94-0.97Year of op. (per year) 0.23 1.06 0.96-1.17
The risk of revision (RR) with 95% confidence interval for OA/TKA inserted respectively without and with a patellar button. The exchange of inlay. in case of infection. is not considered to be a revision
Implants lacking sufficient numbers for analysis are shown in italics
In summary one can establish that excluding an exchange of inlay in infected cases does affect the results and that the effect negatively affects non-modular implants as compared to modular ones. One explanation may be that a number of debride-ment’s without exchange of inlays in non-modu-lar TKA’s have succeeded in curing the infection (if not cured, a later revision would probably have been performed). Another possibility is that the increased aggressiveness in opening the knee and performing debridement when an inlay can be exchanged may have resulted in knees becoming revised that would have maked it without.
In case of UKA (table previous page right), there were only 4 exchanges of inlays because of manifest or suspected infection during the 10-year period and the table is almost identical to the table on page 44.
Above we have as on page 45 divided the TKA for OA into those that are used without respective with a patellar button.
In the table left above, in which no patella button was used, the result is quite similar to that when all the TKA's were included (table on the page to the left) with the exception that the NexGen-APT now has a significantly increased risk as compared to the reference. Further, an increased risk for women has become significant but it was not when knees with and without patellar button were analyzed together.
As compared to the table on page 45 where change of inlays for infection were considered revisions the only difference is that PFC-Sigma APT is no longer better than the reference and that Profix now has significantly higher risk.
The table above to the right concerns TKA’s in which a patellar button was used. When this table is compared to the table on page 44 the only dif-ference is that the PFC-Sigma APT no longer has a lower risk than the reference PFC-Sigma MBT.

48 THE SWEDISH KNEE ARTHROPLASTY REGISTER – ANNUAL REPORT 2016 – PART II
CRR for commonly used TKA implants for OA 2005–2014
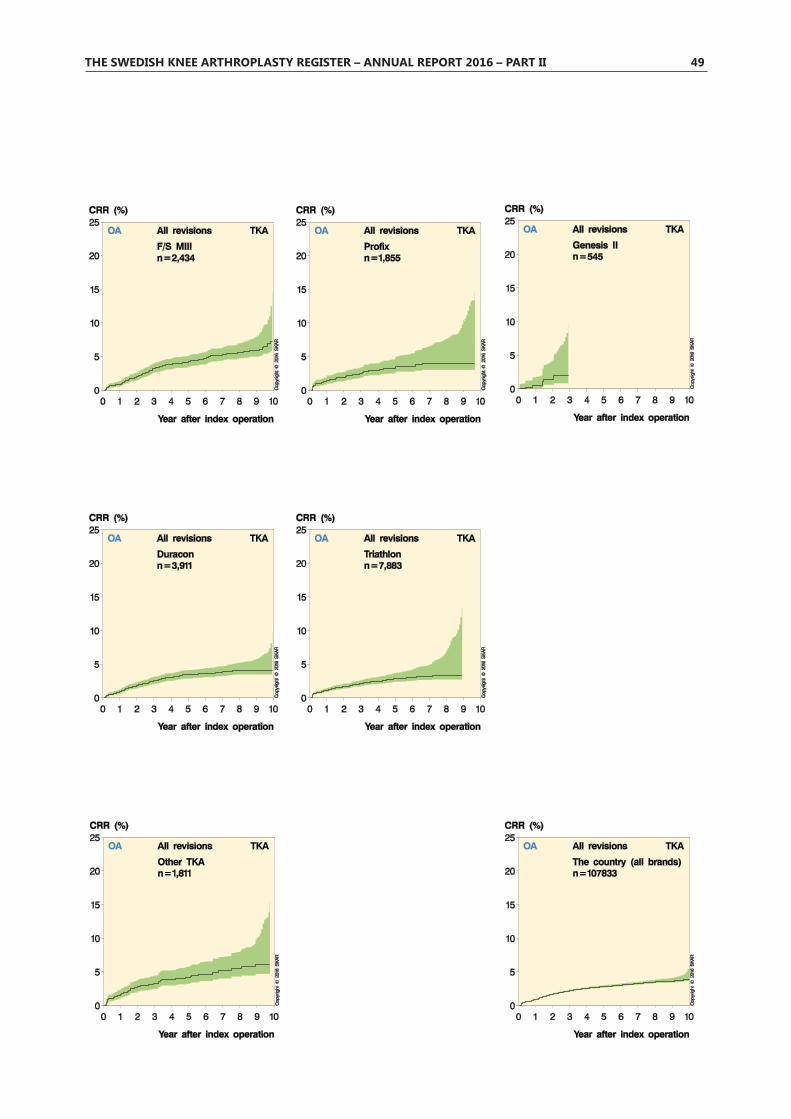
THE SWEDISH KNEE ARTHROPLASTY REGISTER – ANNUAL REPORT 2016 – PART II 49

50 THE SWEDISH KNEE ARTHROPLASTY REGISTER – ANNUAL REPORT 2016 – PART II
CRR for commonly used UKA implants for OA 2005–2014

THE SWEDISH KNEE ARTHROPLASTY REGISTER – ANNUAL REPORT 2016 – PART II 51
Plotting the estimated absolute clinicspecific risk of revisionshows that the absolute distribution has diminished between1985-1994 and 2005–2014 (x-axis = absolute risk of revision)
Total CRR for cemented TKA in OA during the 2 periods1985–1994 and 2005–2014 shows a considerable reduction in CRR over time.
Plotting the relative clinicspecific risk of revision, as compared to the national mean, shows that the distribution of relative risk among the hospitals has not changed between 1985–1994 and 2005–2014 (x-axis = relative risk).
Changes in risk of revision over time (TKA for OA)
that the results have improved overall and at the same time the results for the different units have become more similar (less variance in the results).
However, when looking on the relative specific risk of revision (figure below) it can be seen that the curves for the two periods are similar in shape. This implies that the relative difference between the units has not changed between the two periods and that some units still have a 1.5-2 times higher or lower risk than the average unit. The figures also illustrate the fact that irrespective of improvement, there will always be units with better, or worse, results than the average.
The register is requested to account for hospital specific results which can be found on the next pages. This year, there were 8 hospitals having significantly better results than the average hospital and 10 with inferior results. One can only specu-late on the causes for these differences. An unfor-tunate choice of implants, methods or surgeons may be the explanation, as well as a selection of patients with a higher risk profile (case-mix). We find it appropriate to point out that the results are based on historical data in which the last implants were inserted 2 years ago and the first 12 years ago. Thus, the results do not necessarily reflect the cur-rent risk for patients undergoing surgery.
The figure below shows the overall risk of revi-sion for the current 10-year period, 2005-2014, as compared to the period 1985-1994. It can be observed that the risk for the current period is con-siderably lower than for the earlier period.
When the absolute specific risk of revision for the units is plotted for both periods (figure below left), it can be seen that the risk has become lower and the distribution has diminished. This implies

52 THE SWEDISH KNEE ARTHROPLASTY REGISTER – ANNUAL REPORT 2016 – PART II
Relative risk of revision for unitsCode Hospital no. of TKA Revised RR 95% CI Rank 95% CI
52012 Alingsås 1,806 12 0.39 0.26-0.61 1 1-852013 Skene 834 7 0.50 0.30-0.83 2 1-2450480 Carlanderska 726 6 0.57 0.34-0.96 3 1-3810010 Sabbatsberg (Aleris) 688 4 0.57 0.33-1.00 4 1-4112010 Enköping 2,636 30 0.60 0.43-0.82 5 2-2412481 Elisabethkliniken 603 8 0.62 0.38-1.01 6 1-4311015 Nacka-Proxima 834 9 0.65 0.41-1.04 7 2-4611002 Huddinge 1,106 15 0.66 0.44-0.99 8 2-4125010 Kalmar 988 13 0.68 0.45-1.04 9 2-4642015 Movement Halmstad 1,880 28 0.68 0.49-0.95 10 3-3625011 Oskarshamn 2,348 37 0.69 0.52-0.93 11 4-3553011 Lidköping 1,291 17 0.70 0.47-1.04 12 3-4562011 Örnsköldsvik 1,135 19 0.73 0.50-1.06 13 3-4842011 Varberg 1,487 26 0.76 0.54-1.06 14 5-4842420 Spenshult 1,362 21 0.78 0.54-1.12 15 4-5311013 Löwenströmska* 3,069 55 0.78 0.61-1.00 16 7-4222011 Eksjö-Nässjö (Höglandssjukh.) 1,263 19 0.79 0.54-1.14 17 5-5565012 Gällivare 728 12 0.79 0.51-1.23 18 4-6055010 Örebro 884 17 0.80 0.54-1.18 19 5-5722012 Värnamo 1,172 27 0.80 0.57-1.14 20 5-5413010 Eskilstuna 387 7 0.81 0.49-1.34 21 3-6755012 Lindesberg 1,360 23 0.83 0.58-1.17 22 6-5722010 Jönköping 1,314 23 0.83 0.58-1.18 23 6-57
(cont.)
Relative risk of revision for hospitals 2005–2014 (cemented and uncemented TKA for OA)
The true average result of a certain treatment can only be determined for defined groups of pre-viously treated patients. However, such results only reflect historical circumstances and cannot automatically be used to predict future results. The observed average result of a hospital treatment is not constant. Different selections of patients that get the same treatment have different average results. Thus, the hospital specific variability has to be taken into consideration if comparisons of hospitals are to be meaningful.
The table below shows the number of primary TKA for OA performed at each hospital during the analyzed period and how many of these were revised. The RR (relative risk of revision) is shown with its 95% confidence interval. The RR describes each hospital’s deviation from the national average in multiplicative terms. It has been calculated using ”the shared gamma frailty model” which takes into consideration that units performing few operations more easily suffer far too optimistic or pessimistic risk estimates. Thus, the method “shrinks” such estimates towards the national mean, relative to the amount of information they are based on. For further information; Glidden DV & Vittinghoff E. Modelling clustered survival data from multicenter
clinical trials. Statistics in Medicine 2004; 23: 369-388.
Finally the observed rank for the hospital is shown together with a 95% confidence interval for its ranking, i.e. what rank places lie within the con-fidence interval. The calculations were performed using Monte Carlo simulation. For further informa-tion; Goldstein H, Spiegelhalter DJ. League tables and their limitations: statistical issues in compari-sons of institutional performance. J R Statist Soc (A) 1996;159:384-43.
It is the location for the hospital that decides where the operation is registered. This implies that in spite of any name or ownership changes, the whole period is analyzed for the particular location.
Only units performing more than 50 TKAs for OA during the 10-year period were included (cemented and uncemented). The results are adjusted for dif-ferences in age and gender as well as for differences in use of a patellar button.
Units with significantly better or worse results than the national average are shown in green and red respectively.

THE SWEDISH KNEE ARTHROPLASTY REGISTER – ANNUAL REPORT 2016 – PART II 53
28011 Ängelholm 1,433 25 0.83 0.59-1.17 24 6-5711001 Karolinska 1,282 29 0.84 0.61-1.16 25 7-5665016 Sunderby 72 1 0.87 0.46-1.65 26 3-7553010 Falköping 770 19 0.88 0.60-1.28 27 7-6352011 Borås 922 22 0.88 0.61-1.27 28 8-6362010 Sundsvall 921 18 0.88 0.60-1.30 29 7-6510013 Södersjukhuset 2,571 55 0.89 0.70-1.15 30 13-5513011 Nyköping 872 19 0.94 0.64-1.36 31 9-6754010 Karlstad 1,733 38 0.94 0.71-1.26 32 14-6250010 Östra sjukhuset 476 13 0.96 0.63-1.47 33 9-7010011 S:t Göran 3,282 79 0.97 0.78-1.20 34 20-5864010 Skellefteå 826 19 0.98 0.68-1.43 35 11-6941012 Helsingborg 212 4 0.98 0.56-1.72 36 5-7613012 Kullbergska sjukhuset 1,972 48 0.99 0.76-1.28 37 17-6456010 Västerås 1,835 40 0.99 0.74-1.31 38 17-6562013 Sollefteå 969 24 0.99 0.70-1.40 39 13-6855011 Karlskoga 997 23 1.00 0.70-1.42 40 13-6921014 Motala 4,006 95 1.00 0.82-1.22 41 23-6028013 Simrishamn 200 7 1.00 0.61-1.65 42 7-7554014 Torsby 965 22 1.01 0.71-1.44 43 14-7050020 OrthoCenter IFK klin.** 842 23 1.01 0.71-1.43 44 14-6923010 Växjö 1,021 26 1.01 0.72-1.42 45 15-6965013 Piteå 2,466 60 1.02 0.80-1.29 46 21-6450071 Frölunda Spec. 1,022 26 1.03 0.74-1.45 47 16-7056012 Köping 638 21 1.04 0.72-1.49 48 15-7164011 Lycksele 598 14 1.04 0.69-1.57 49 12-7342010 Halmstad 1,768 47 1.04 0.80-1.36 50 22-6710015 Sophiahemmet 762 24 1.05 0.74-1.49 51 17-7111010 Danderyd 1,393 35 1.05 0.78-1.42 52 20-7024010 Västervik 920 23 1.05 0.74-1.50 53 16-7228012 Hässleholm 5,768 147 1.06 0.90-1.25 54 31-6221013 Norrköping 937 21 1.09 0.76-1.57 55 18-7330001 Malmö 128 5 1.10 0.64-1.87 56 10-7757010 Falun 2,508 63 1.11 0.88-1.41 57 29-6961012 Hudiksvall 617 17 1.12 0.76-1.66 58 18-7553013 Skövde 970 24 1.13 0.80-1.59 59 21-7450001 Sahlgrenska 113 6 1.15 0.68-1.93 60 13-7727011 Karlshamn 1,997 55 1.16 0.90-1.49 61 31-7254012 Arvika 1,330 35 1.16 0.86-1.57 62 27-7464001 Umeå 1,296 43 1.19 0.90-1.57 63 32-7441011 Trelleborg 5,636 162 1.24 1.06-1.44 64 47-7051011 Mölndal 1,504 41 1.24 0.93-1.64 65 34-7541001 Lund 230 7 1.24 0.75-2.05 66 17-7857011 Mora 1,352 42 1.28 0.97-1.69 67 39-7663010 Östersund 1,172 36 1.29 0.96-1.73 68 37-7611011 Södertälje 1,074 38 1.31 0.98-1.75 69 39-7612001 Akademiska sjukhuset 969 43 1.43 1.09-1.89 70 50-7751010 Uddevalla 1,798 63 1.46 1.15-1.84 71 55-7761010 Gävle 742 27 1.46 1.05-2.03 72 47-7826010 Visby 792 33 1.47 1.08-2.00 73 49-7811012 Norrtälje 739 33 1.50 1.10-2.04 74 51-7861011 Bollnäs 2,484 91 1.52 1.24-1.85 75 61-7710016 Ortopediska huset 3,568 146 1.55 1.32-1.82 76 65-7723011 Ljungby 909 37 1.57 1.17-2.10 77 57-7851012 Kungälv 1,472 77 1.97 1.59-2.45 78 74-78
* Lövenströmska was taken over by Stockholms Specialistvård in 2001 and by OrthoCenter Stockholm in 2008.
** Gothenburg Medical Center was discontinued and OrthoCenter IFK kliniken was started in 2008.
Only units that inserted more than 50 TKA for OA during the period are listed
Relative risk of revision for units (continued)Code Hospital no. of TKA Revised RR 95% CI Rank 95% CI

54 THE SWEDISH KNEE ARTHROPLASTY REGISTER – ANNUAL REPORT 2016 – PART II
Relative risk of revision for units. Exchange of inlay, in case of infection, is not considered to be a revision.Code Hospital no. of TKA Revised RR 95% CI Rank 95% CI
52012 Alingsås 1,806 10 0.4 0.25-0.65 1 1-1252013 Skene 834 6 0.51 0.30-0.89 2 1-3025010 Kalmar 988 6 0.52 0.30-0.89 3 1-3253011 Lidköping 1,291 9 0.55 0.34-0.89 4 1-3242015 Movement Halmstad 1,880 18 0.57 0.39-0.85 5 2-2762011 Örnsköldsvik 1,135 11 0.58 0.36-0.91 6 1-3310010 Sabbatsberg (Aleris) 688 3 0.58 0.32-1.08 7 1-4850480 Carlanderska 726 5 0.6 0.34-1.04 8 1-4512481 Elisabethkliniken 603 7 0.63 0.37-1.06 9 1-4611015 Nacka-Proxima 834 7 0.65 0.38-1.09 10 2-4925011 Oskarshamn 2,348 29 0.68 0.49-0.94 11 4-3612010 Enköping 2,636 29 0.7 0.51-0.98 12 4-4042420 Spenshult 1,362 15 0.72 0.47-1.09 13 4-5057010 Falun 2,508 31 0.73 0.53-1.00 14 5-4111002 Huddinge 1,106 15 0.74 0.49-1.12 15 4-5222010 Jönköping 1,314 16 0.75 0.50-1.12 16 4-5222011 Eksjö-Nässjö (Höglandssjukh.) 1,263 14 0.75 0.49-1.15 17 4-5413010 Eskilstuna 387 5 0.76 0.43-1.33 18 3-6342011 Varberg 1,487 22 0.78 0.54-1.12 19 6-5262010 Sundsvall 921 12 0.78 0.50-1.22 20 4-5952011 Borås 922 16 0.79 0.52-1.20 21 5-5865012 Gällivare 728 10 0.81 0.50-1.30 22 5-6355012 Lindesberg 1,360 19 0.85 0.58-1.25 23 8-61
(cont.)
Relative risk of revision for hospitals 2005–2014 (cemented and uncemented TKA for OA)if the exchange of inlay, in case of infection, is not considered to be a revision
possible without removal of an inlay. This would result in a reversed bias if the exchange of an inlay is not considered as a revision. However, on page 44-47 we saw that excluding exchange of the tibia inlay seemed to negatively affect the results of at least some implants with monobloc tibia.
Therefore we also show risk calculations when an exchange of inlay (for infection) is not, consid-ered as being a revision.
If the table below is compared to the one on the previous page, it can be seen that 5 of the 8 units with results better than the average keep their status. Carlanderska, Sabbatsberg and Huddinge are no longer better than the average while Kalmar, Lid-Kalmar, Lid-köping and Örnsköldsvik have become better than the average. At the other end, 8 of 10 units that were significantly inferior to the average keep their status. Trelleborg and Akademiska disappear while Karlshamn appears. As can be expected there are changes in the ranking of units occur.
Karlshamn that became worse than the average used monobloc tibia in more than half their cases while the thee units that lost their status as being better than the average all used modular compo-nents. Thus, although modularity may affect the risk of revision it does not automatically mean that units using modular components benefit from the exclu-sion of inlay exchanges in the ranking table.
As described on page 4, the SKAR defines a revision as being a reoperation in which implant components are exchanged, added or removed.
The reason for this is that shortly after the start of the register it was noted that many surgeons did not report those reoperations which they did not interpret as directly related to the prior knee arthro-plasty. This resulted in different types of soft tissue surgeries never being reported and therefore the register decided to use a stricter definition of revi-sion which definitely was implant related.
As previously mentioned (page 46) it can be claimed that for infected cases this definition may be a disadvantage for certain implant brands and consequently those hospitals using these brands. The reason is that one third of all revisions for infec-tion are debridement surgeries during which the inlay is exchanged (classifying them as revisions). However, a debridement in a knee with a monob-loc tibia, in which no inlay can be exchanged, will not count as a revision which in turn may favor the type. Thus, the argument has been made that exchange of an inlay in the case of an infection should not be considered a revision, but a debride-ment. On the other hand it can be claimed that infected TKA´s with fixed inlays are generally treated with a complete exchange of components, as a comprehensive debridement is not considered

THE SWEDISH KNEE ARTHROPLASTY REGISTER – ANNUAL REPORT 2016 – PART II 55
24010 Västervik 920 14 0.86 0.56-1.32 24 7-6428011 Ängelholm 1,433 21 0.86 0.60-1.25 25 9-6055010 Örebro 884 16 0.87 0.58-1.30 26 8-6322012 Värnamo 1,172 26 0.87 0.60-1.25 27 9-6264010 Skellefteå 826 13 0.88 0.57-1.36 28 7-6541012 Helsingborg 212 2 0.88 0.46-1.67 29 3-7411001 Karolinska 1,282 26 0.88 0.62-1.24 30 10-6065016 Sunderby 72 1 0.89 0.45-1.76 31 3-7554010 Karlstad 1,733 29 0.9 0.65-1.24 32 11-6053010 Falköping 770 17 0.92 0.62-1.37 33 10-6710015 Sophiahemmet 762 17 0.93 0.62-1.38 34 10-6611013 Löwenströmska* 3,069 55 0.93 0.72-1.20 35 17-5755011 Karlskoga 997 17 0.93 0.62-1.39 36 10-6711010 Danderyd 1,393 25 0.94 0.67-1.33 37 12-6565013 Piteå 2,466 45 0.95 0.72-1.24 38 16-6028012 Hässleholm 5,768 107 0.95 0.79-1.15 39 21-5410013 Södersjukhuset 2,571 49 0.96 0.73-1.25 40 17-6050010 Östra sjukhuset 476 11 0.96 0.61-1.52 41 9-7113012 Kullbergska sjukhuset 1,972 41 1.02 0.77-1.36 42 20-6621013 Norrköping 937 15 1.02 0.67-1.55 43 14-7154014 Torsby 965 18 1.03 0.69-1.52 44 15-7121014 Motala 4,006 80 1.04 0.84-1.28 45 26-6242010 Halmstad 1,768 39 1.04 0.78-1.40 46 21-6741011 Trelleborg 5,636 112 1.05 0.87-1.26 47 29-6130001 Malmö 128 4 1.07 0.59-1.91 48 9-7728013 Simrishamn 200 7 1.07 0.64-1.81 49 11-7653013 Skövde 970 18 1.07 0.73-1.59 50 17-7213011 Nyköping 872 19 1.09 0.74-1.60 51 18-7262013 Sollefteå 969 23 1.1 0.77-1.58 52 21-7356010 Västerås 1,835 37 1.11 0.82-1.49 53 25-7010011 S:t Göran 3,282 77 1.12 0.90-1.39 54 32-6750020 OrthoCenter IFK klin.** 842 22 1.12 0.78-1.62 55 21-7350071 Frölunda Spec. 1,022 24 1.13 0.79-1.60 56 22-7363010 Östersund 1,172 25 1.13 0.80-1.60 57 23-7264011 Lycksele 598 13 1.15 0.74-1.78 58 18-7556012 Köping 638 21 1.17 0.81-1.70 59 24-7523010 Växjö 1,021 26 1.18 0.84-1.66 60 26-7464001 Umeå 1,296 37 1.2 0.89-1.62 61 31-7350001 Sahlgrenska 113 6 1.22 0.71-2.09 62 16-7812001 Akademiska sjukhuset 968 31 1.23 0.89-1.69 63 31-7461012 Hudiksvall 617 16 1.25 0.83-1.88 64 26-7751011 Mölndal 1,504 34 1.26 0.92-1.71 65 34-7541001 Lund 230 6 1.28 0.75-2.20 66 19-7854012 Arvika 1,330 32 1.3 0.95-1.78 67 37-7611011 Södertälje 1,074 32 1.31 0.96-1.80 68 37-7657011 Mora 1,352 35 1.32 0.97-1.78 69 39-7627011 Karlshamn 1,997 55 1.4 1.09-1.80 70 49-7611012 Norrtälje 739 26 1.42 1.01-2.01 71 42-7861010 Gävle 742 22 1.46 1.01-2.10 72 42-7851012 Kungälv 1,472 46 1.47 1.12-1.93 73 51-7726010 Visby 792 30 1.59 1.15-2.19 74 53-7823011 Ljungby 909 31 1.6 1.17-2.20 75 56-7851010 Uddevalla 1,798 60 1.69 1.32-2.15 76 64-7861011 Bollnäs 2,484 85 1.73 1.40-2.12 77 67-7810016 Ortopediska huset 3,568 144 1.82 1.54-2.15 78 71-78
* Lövenströmska was taken over by Stockholms Specialistvård in 2001 and by OrthoCenter Stockholm in 2008.
** Gothenburg Medical Center was discontinued and OrthoCenter IFK kliniken was started in 2008.
Only units that inserted more than 50 TKA for OA during the period are listed
(Cont.)Relative risk of revision for units. Exchange of inlay, in case of infection, is not considered to be a revisionCode Hospital no. of TKA Revised RR 95% CI Rank 95% CI

56 THE SWEDISH KNEE ARTHROPLASTY REGISTER – ANNUAL REPORT 2016 – PART II
Patient characteristics and case-mix Hospital Number of Complete % % % % % reports reports % OA Women <55 years BMI 35+ ASA ≥3
Country 12,903 99.8 95.9 57.0 7.5 9.7 17.6
University hospitalsAkademiska 109 98.2 90.8 60.6 15.6 11.2 22.9Huddinge 159 99.4 81.8 65.4 6.3 15.2 42.8Karolinska Solna 93 100.0 80.7 59.1 18.3 11.8 64.5Lund 103 99.0 74.8 63.1 6.8 11.8 55.3Sahlgrenska 2 100.0 0.0 50.0 50.0 0.0 50.0Umeå 146 100.0 92.5 63.0 9.6 15.1 17.2Örebro 30 96.7 90.0 53.3 6.7 10.0 27.6
Private unitsArtClinic Göteborg 16 100.0 93.8 50.0 6.3 6.3 18.8ArtClinic Jönköping 29 100.0 96.6 37.9 13.8 3.5 10.3Bollnäs Aleris 353 100.0 94.6 53.0 4.5 5.1 11.1Carlanderska 136 99.3 97.1 59.7 4.2 8.1 2.2Elisabethkliniken 1 100.0 100.0 100.0 0.0 0.0 0.0Kysthospitalet - DK* 14 78.6 100.0 28.6 0.0 0.0 0.0Luleå- Sensia 6 100.0 100.0 16.7 16.7 0.0 16.7Motala Aleris 511 99.6 95.5 55.2 7.1 8.6 24.1Movement Halmstad 431 100.0 97.5 55.9 12.5 8.6 21.8Nacka Aleris 144 99.3 100.0 53.5 6.9 1.4 2.1OrthoCenter IFK-kliniken 113 100.0 98.2 44.3 12.4 6.2 9.7OrthoCenter Sthlm 431 99.8 97.9 52.4 11.1 3.7 2.1Ortopediska huset 461 99.8 98.3 53.4 9.8 5.4 0.9Sabbatsberg Aleris 23 95.7 100.0 73.9 8.7 0.0 0.0Sophiahemmet 136 100.0 97.8 35.3 11.8 7.4 8.1St Göran 424 100.0 96.9 62.3 6.4 8.0 35.9Ängelholm Aleris 218 100.0 95.0 59.6 7.8 7.3 20.2
* Kysthospitalet in Denmark reports Swedish patients that they opererate but these are not included in the country results
The table shows what was reported for primary knee arthroplasties in 2015.
Topmost is the average for the country as a whole after which the hospitals are classified as being uni-versity hospitals, private hospitals or "other" based on if their reported number of surgeries was less than 100, 100-300 or more than 300.
The first column shows the total number reported and the second the proportion of complete reports. The rest of the information is based only on com-plete reports and shows the proportion of patients having their surgery for OA, of women, of those younger than 55, those with BMI of 35 and over and those having been classified with ASA III or higher. Please note that the percentages may be misleading for units having reported few surgeries.
Among the university hospitals we can see that some units have a higher proportion of surgeries for other diagnoses than OA, of women and that of sicker patients (ASA ≥3) while other university hospitals do not seem to differ so much from the national average. Karolinska sjukhuset in Solna and the Akademiska sjukhuset have a higher pro-portion of patients younger than 55 years.
The private hospitals, with the exemptions of Motala, Movement Halmstad, S:t Göran and Ängelholm , generally report a lower proportion of patients with ASA ≥3.
The County hospitals, not classified as university hospitals, do not differ from the national average with a few exceptions. The proportion of patients with BMI of 35 and over is almost twice the national average in Gävle, Karlstad, Västerås and Växjö while it is half that in Frölunda, Hässleholm, Norrköping, Skene and Sundsvall. The propor-tion of patients with ASA ≥3 is twice the national average in Danderyd, Norrtälje, S:t Göran, Söder-sjukhuset and Södertälje while it is half in Aling-sås, Lidköping, Lindesberg, Ljungby, Karlshamn, Karskoga and Trelleborg.
The variation in patient characteristics is large and it does not seem to be possible to generalize based on if the unit is a university or private hospi-tal or by the number of reported surgeries.
A previous surgery of the index knee (not shown in the table) was reported for 19.5% of the patients. Meniscal surgery was most common (7.4%) fol-lowed by arthroscopy (5.4%), osteotomy (1.6%), cruciate surgery (1.4%) osteosynthesis (0.8%)
Patient characteristics and case-mix at knee arthroplasty surgery

THE SWEDISH KNEE ARTHROPLASTY REGISTER – ANNUAL REPORT 2016 – PART II 57
Patient characteristics and case-mix Hospital Number of Complete % % % % % reports reports % OA Women <55 years BMI 35+ ASA ≥3
< 100 operations/yearBorås 72 100.0 95.8 59.7 4.2 18.1 22.2Eskilstuna 38 100.0 86.8 60.5 7.9 18.4 39.5Gällivare 46 100.0 95.7 52.2 4.4 6.5 10.9Helsingborg 66 100.0 98.5 60.6 9.1 15.2 24.2Hudiksvall 87 100.0 98.9 60.9 8.1 16.1 13.8Kalmar 89 98.9 95.5 58.4 7.9 3.4 5.6Kristianstad 1 100.0 100.0 0.0 0.0 0.0 1.0Lycksele 40 100.0 92.5 47.5 2.5 10.0 10.0Norrtälje 94 98.9 97.9 35.1 1.1 11.8 40.9Skene 97 100.0 97.9 47.4 9.3 1.0 0.0Sollefteå 93 100.0 97.9 54.8 5.4 9.7 8.6Sundsvall 44 100.0 90.9 52.3 2.3 4.6 34.1Visby 60 100.0 93.3 55.0 6.7 11.7 6.7Västervik 90 100.0 97.8 58.9 5.6 3.3 10.0Ängelholm 2 100.0 100.0 100.0 0.0 50.0 50.0
100-300 operations/yearAlingsås 193 100.0 99.5 54.9 4.7 9.3 5.7Arvika 171 100.0 98.3 56.1 4.1 9.4 25.7Danderyd 183 100.0 92.4 54.1 5.5 12.6 50.3Eksjö-Nässjö 202 100.0 98.5 56.4 7.9 8.4 21.8Falun 205 100.0 95.6 57.6 7.3 13.7 17.1Frölunda Spec. sjukhus 124 100.0 100.0 64.5 2.4 3.2 9.7Gävle 132 100.0 93.9 54.6 10.6 16.7 27.3Halmstad 186 99.5 96.2 60.2 9.1 17.3 11.9Jönköping 141 100.0 96.5 61.7 9.9 14.2 20.6Karlshamn 249 100.0 94.8 51.0 6.8 10.8 8.0Karlskoga 124 98.4 99.2 61.3 6.5 15.6 8.9Karlstad 182 98.9 92.9 63.2 7.7 16.7 25.4Kullbergska sjukhuset 157 98.7 94.9 54.8 5.1 3.2 0.7Kungälv 215 100.0 94.0 57.7 8.8 14.4 15.8Lidköping 234 100.0 99.6 62.8 6.8 11.5 5.1Lindesberg 164 97.6 98.8 60.5 2.5 7.5 13.0Ljungby 142 100.0 97.2 53.5 5.6 11.3 8.5Mora 186 100.0 97.9 53.8 3.2 10.2 11.3Norrköping 129 100.0 93.0 69.0 8.5 10.1 8.5Nyköping 101 100.0 95.1 55.5 7.9 6.9 16.8Oskarshamn 275 100.0 96.7 58.2 8.4 14.9 12.4Piteå 244 100.0 92.6 59.8 7.8 4.9 28.3Skellefteå 119 100.0 94.1 59.7 5.9 11.8 27.7Skövde 120 98.3 95.0 47.4 9.3 12.5 21.2Södersjukhuset 280 100.0 94.6 54.3 11.4 14.3 41.8Södertälje 113 100.0 97.4 63.7 4.4 14.2 46.0Torsby 130 100.0 100.0 47.7 3.4 9.2 20.8Uddevalla 187 99.5 94.1 61.5 2.1 10.2 21.0Varberg 127 100.0 92.9 55.1 9.5 7.1 9.5Värnamo 148 100.0 97.3 50.7 10.8 11.5 11.5Västerås 173 100.0 95.4 63.6 4.6 18.5 27.2Växjö 115 100.0 98.3 56.5 9.6 17.4 18.3Örnsköldsvik 115 100.0 97.4 60.9 7.8 12.2 10.4Östersund 120 100.0 90.9 72.5 2.5 7.5 10.8
> 300 operations/yearEnköping 393 99.7 95.2 60.3 4.3 12.0 27.8Hässleholm 644 100.0 98.1 53.6 5.6 4.2 17.4Mölndal 383 99.7 92.4 61.6 9.7 11.3 14.6Trelleborg 791 100.0 99.1 63.0 5.9 10.6 5.9
and "other" (2.1%). For 3.4% of the patients more than one previous surgery was stated. The previ-ous surgeries reported are not comprehensive but
illustrate what the surgeon knew at the time of the primary arthroplasty.

58 THE SWEDISH KNEE ARTHROPLASTY REGISTER – ANNUAL REPORT 2016 – PART II
Prophylactic antibiotics Hospital Number of Complete % having % with dose % having % having reports reports % Cloxacillin 2g x 3 or AB within AB within or Clindamycin 600mg x 2 45-15 min 45-30 min
Country 12,903 99.2 99.5 85.3 79.8 41.7
University hospitalsAkademiska 109 93.6 94.5 71.6 22.9 10.1Huddinge 159 98.7 99.4 98.1 69.2 35.9Karolinska Solna 93 97.8 98.9 84.6 89.3 46.2Lund 103 98.1 99.0 77.2 68.0 36.7Sahlgrenska 2 100.0 50.0 100.0 100.0 50.0Umeå 146 97.9 99.3 97.2 87.0 41.1Örebro 30 100.0 100.0 100.0 73.3 30.0
Private unitsArtClinic Göteborg 16 100.0 100.0 100.0 75.0 50.0ArtClinic Jönköping 29 100.0 100.0 100.0 89.7 65.5Bollnäs Aleris 353 99.7 99.7 99.4 87.8 29.8Carlanderska 136 99.3 100.0 99.3 90.4 49.3Elisabethkliniken 1 100.0 100.0 0.0 100.0 100.0Kysthospitalet - DK* 14 0.0 0.0 0.0 0.0 0.0Luleå- Sensia 6 100.0 100.0 100.0 83.3 33.3Motala Aleris 511 99.0 99.8 98.0 86.1 41.7Movement Halmstad 431 99.5 100.0 98.4 81.7 11.6Nacka Aleris 144 96.5 100.0 98.6 64.6 52.8OrthoCenter IFK-kliniken 113 99.1 99.1 100.0 85.8 71.7OrthoCenter Sthlm 431 98.8 100.0 96.8 95.6 44.8Ortopediska huset 461 100.0 100.0 96.1 90.0 41.0Sabbatsberg Aleris 23 100.0 4.4 100.0 95.7 39.1Sophiahemmet 136 99.3 99.3 89.6 64.0 42.7St Göran 424 99.8 99.8 97.9 92.0 22.2Ängelholm Aleris 218 98.2 100.0 99.1 77.5 28.9* Kysthospitalet in Denmark reports Swedish patients that they opererate but these are not included in the country results
Prophylactic antibiotics for knee arthroplasties
The table shows what was reported for primary knee arthroplasties in 2015.
Topmost is the average for the country as a whole after which the hospitals are classified as being univer-sity hospitals, private hospitals or "other" based on if their reported number of surgeries was less than 100, 100-300 or more than 300.
The first column shows the total number reported and the second the proportion of complete reports. The rest of the information is based only on complete reports. Please note that the percentages may be misleading for units having reported only few surgeries. The choice of the variables shown in the other columns is based on the rec-ommendations of the PRISS project (Prosthetic Related Infections Shall be Stopped). The updated final report is available at www. patientforsakringen.se.
In short, the recommendations are to give Cloxacil-line 2g x 3 i.v.. The first dose 45-30 minutes before start of surgery or inflation of a tourniquet, the second dose 2 hours after the first one and the third after addi-tional 4 hours. In case of penicillin allergy Clindamy-cin is used instead (600mg x 2) with the first dose administrated as for Cloxacilline and the second dose 4 hours after the first one.
The columns "% having Cloxacilline or Clindamycin",
"% with dose 2g x 3 or 600mg x 2" and "% having AB within 45-30 min" thus show the proportion of surgeries in which antibiotics are given according to the current PRISS routines. The column "% having AB within 45-15 min" shows the proportion for which the dose was given within the previously recommended time interval which has been shown in earlier reports.
The majority of the hospitals reported that the adhered to the PRISS recommendations regarding what drug to use. Only one unit reported using Cepha-losporin as prophylaxis. Most of those units that did not follow the dosage recommendations used instead Cloxacilline 2g x 4 and/or Clindamycin 600mg x 3.
At the start of surgery a reasonable tissue concen-tration of the antibiotic should have been reached in order to counteract any bacteria in the field. Due to the short half-life of Cloxacilline it is important that it is administrated within a correct time interval. How-ever, an earlier study from the register found imperfect routines concerning prophylactic antibiotics in 2007 (Stefánsdóttir A et al. 2009).
The registry started to register the time for delivery of the first dose in 2009 after which some improve-ment in the routines was noted with 87% of patients in 2011 being reported to having received the dose

THE SWEDISH KNEE ARTHROPLASTY REGISTER – ANNUAL REPORT 2016 – PART II 59
Prophylactic antibiotics Hospital Number of Complete % having % with dosis % having % having reports reports % Cloxacillin 2g x 3 or AB within AB within or Dalacine 600mg x 2 45-30 min 45-15 min
< 100 operations/yearBorås 72 100.0 100.0 97.2 69.4 48.6Eskilstuna 38 100.0 100.0 79.0 73.7 42.1Gällivare 46 100.0 100.0 100.0 71.7 37.0Helsingborg 66 100.0 100.0 100.0 66.7 28.8Hudiksvall 87 98.9 98.9 97.7 90.8 37.9Kalmar 89 100.0 100.0 89.9 91.0 51.7Kristianstad 1 100.0 100.0 0.0 100.0 0.0Lycksele 40 100.0 100.0 90.0 70.0 57.5Norrtälje 94 97.9 100.0 98.9 71.3 40.4Skene 97 100.0 100.0 89.7 86.6 54.6Sollefteå 93 100.0 100.0 97.9 90.3 86.0Sundsvall 44 100.0 100.0 88.6 77.3 50.0Visby 60 98.3 100.0 88.3 78.3 31.7Västervik 90 100.0 100.0 12.2 75.6 51.1Ängelholm 2 100.0 100.0 100.0 50.0 0.0
100-300 operations/yearAlingsås 193 99.5 100.0 100.0 89.6 64.3Arvika 171 99.4 100.0 99.4 59.1 45.6Danderyd 183 98.9 98.9 68.0 70.0 43.2Eksjö-Nässjö 202 100.0 100.0 99.5 91.1 66.8Falun 205 100.0 100.0 9.3 90.7 46.3Frölunda Spec. sjukhus 124 100.0 100.0 100.0 72.6 47.6Gävle 132 97.0 97.7 98.4 83.3 36.4Halmstad 186 99.5 100.0 94.6 73.7 38.2Jönköping 141 100.0 100.0 97.2 80.1 43.3Karlshamn 249 100.0 100.0 69.9 86.8 23.3Karlskoga 124 98.4 100.0 100.0 66.9 37.9Karlstad 182 98.9 100.0 100.0 58.2 47.8Kullbergska sjukhuset 157 99.4 99.4 98.1 72.0 54.8Kungälv 215 99.5 99.5 99.1 77.7 29.3Lidköping 234 99.6 100.0 98.3 97.4 82.9Lindesberg 164 98.8 100.0 99.4 59.9 42.6Ljungby 142 99.3 99.3 96.5 85.9 54.9Mora 186 98.4 98.4 5.5 72.0 48.9Norrköping 129 100.0 100.0 99.2 81.4 58.9Nyköping 101 99.0 100.0 19.8 56.4 38.6Oskarshamn 275 99.3 100.0 15.6 77.8 30.6Piteå 244 99.6 99.6 100.0 93.4 21.3Skellefteå 119 100.0 100.0 68.1 79.8 51.3Skövde 120 100.0 100.0 98.3 35.8 30.8Södersjukhuset 280 99.6 100.0 98.6 77.5 42.5Södertälje 113 100.0 100.0 99.1 84.1 51.3Torsby 130 100.0 98.5 100.0 83.1 49.2Uddevalla 187 99.5 99.5 97.9 87.7 59.4Varberg 127 98.4 99.2 88.0 94.5 59.1Värnamo 148 100.0 100.0 99.3 78.4 50.7Västerås 173 98.3 100.0 97.1 80.4 45.7Växjö 115 100.0 100.0 99.1 84.4 46.1Örnsköldsvik 115 99.1 100.0 11.3 82.6 50.4Östersund 120 99.2 100.0 99.2 86.7 30.8
> 300 operations/yearEnköping 393 99.5 99.2 99.0 80.9 45.6Hässleholm 644 99.7 99.7 15.1 74.8 23.1Mölndal 383 97.1 99.4 94.2 65.3 45.4Trelleborg 791 99.1 100.0 98.6 80.8 48.0
within the recommended 45-15 minutes. However during 2013-2015 the proportion has lessened to 79%. Only few units (Lidköping och Sollefteå) have imple-mented the latest recommendation. During 2015, only
40% of the patients had their preoperative dose 45-30 min. prior to surgery. The adaption of the prior and present recommendation was low at the Akademiska sjukhuset and in Skövde.

60 THE SWEDISH KNEE ARTHROPLASTY REGISTER – ANNUAL REPORT 2016 – PART II
Antithrombotic prophylaxis Hospital Number of Complete Percent starting Percent Percent treated reports reports % postoperatively having injection for 8-14 days
Country 12,903 99.8 87.1 77.6 77.3
University hospitalsAkademiska 109 100.0 20.2 91.7 89.9Huddinge 159 99.4 97.5 98.7 88.1Karolinska Solna 93 98.9 20.7 98.9 57.0Lund 103 96.1 92.9 96.1 33.0Sahlgrenska 2 100.0 50.0 100.0 50.0Umeå 146 99.3 97.3 2.8 99.3Örebro 30 100.0 80.0 20.0 90.0
Private unitsArtClinic Göteborg 16 100.0 100.0 50.0 100.0ArtClinic Jönköping 29 100.0 100.0 82.8 100.0Bollnäs Aleris 353 100.0 92.9 100.0 96.0Carlanderska 136 100.0 94.9 1.5 98.5Elisabethkliniken 1 100.0 100.0 100.0 100.0Kysthospitalet - DK* 14 100.0 100.0 100.0 0.0Luleå- Sensia 6 100.0 83.3 50.0 100.0Motala Aleris 511 99.4 96.5 99.4 96.9Movement Halmstad 431 99.8 97.9 99.5 0.7Nacka Aleris 144 100.0 96.5 100.0 98.6OrthoCenter IFK-kliniken 113 100.0 95.6 4.4 95.6OrthoCenter Sthlm 431 100.0 96.5 99.5 98.8Ortopediska huset 461 99.8 96.1 100.0 98.7Sabbatsberg Aleris 23 100.0 91.3 100.0 95.7Sophiahemmet 136 100.0 95.6 100.0 40.4St Göran 424 99.8 90.3 99.5 96.5Ängelholm Aleris 218 99.1 96.8 95.0 98.2
* Kysthospitalet in Denmark reports Swedish patients that they opererate but these are not included in the country results
Antithrombotic prophylaxis for knee arthroplasties
The table ”Antithrombotic prophylaxis” shows what the hospitals reported having administrated for primary knee arthroplasties in 2015.
Topmost is the average for the country as a whole after which the hospitals are classified as being univer-sity hospitals, private hospitals or "other" based on if their reported number of surgeries was less than 100, 100-300 or more than 300.
The first column shows the total number reported and the second the proportion of complete reports. The rest of the information is based only on com-plete reports. Please note that the percentages may be misleading for units having reported only few surgeries. As there is no national or international consensus concerning best practice regarding the drug to use, or when to start or end the treatment, we only show what is most commonly reported.
The choice of variables in the three next columns is based on what was reported as being the most common routines. They show respectively the pro-portion of primary knee arthroplasties in which it was planned to start the prophylaxis postoperatively, the proportion in which an injection was used (Frag-
min, Innohep och Klexane) and the proportion for which the planned duration for the treatment was 8-14 days.
As it can be seen in the table, it is most common to start the antithrombotic prophylaxis postoper-atively and only few units report that they more commonly start preoperatively.
For a good three quarters of the surgeries it is reported that it is the intention to use injectable drugs. The proportion has varied between 81-83% during 2011-2013 but was somewhat lower in 2014 and 2015. which indicates increased use of per-oral drugs such as Pradaxa, Xarelto and Eli-qvis.
The duration of the planned prophylaxis has been relatively constant since the register started registration of this variable (see previous reports).
In recent years, 77-79% of the surgeries have had antithrombotic prophylaxis with a planned duration of 8-14 days but now, an increased proportion (15%) have a shorter planned length of treatment as com-pared to before (6-8%).

THE SWEDISH KNEE ARTHROPLASTY REGISTER – ANNUAL REPORT 2016 – PART II 61
Antithrombotic prophylaxis Hospital Number of Complete Percent starting Percent Percent treated reports reports % postoperatively having injection for 8-14 days
Country 12,903 99.8 87.1 77.6 77.3
< 100 operations/yearBorås 72 100.0 93.1 100.0 95.8Eskilstuna 38 97.4 91.9 94.7 92.1Gällivare 46 100.0 95.7 100.0 87.0Helsingborg 66 100.0 86.7 100.0 98.5Hudiksvall 87 100.0 67.8 100.0 94.3Kalmar 89 100.0 91.0 100.0 92.1Kristianstad 1 100.0 100.0 100.0 0.0Lycksele 40 100.0 7.5 100.0 97.5Norrtälje 94 100.0 85.1 27.7 40.4Skene 97 100.0 96.9 100.0 96.9Sollefteå 93 100.0 92.5 98.9 50.5Sundsvall 44 100.0 70.5 18.2 79.6Visby 60 100.0 90.0 98.3 91.7Västervik 90 98.9 79.8 98.9 85.6Ängelholm 2 100.0 100.0 100.0 100.0
100-300 operations/yearAlingsås 193 100.0 94.8 91.7 89.9Arvika 171 99.4 86.0 12.9 91.2Danderyd 183 100.0 88.1 100.0 89.6Eksjö-Nässjö 202 100.0 80.2 99.5 94.6Falun 205 100.0 92.7 7.3 95.6Frölunda Spec. sjukhus 124 100.0 92.8 0.8 99.2Gävle 132 100.0 94.7 99.2 94.7Halmstad 186 100.0 87.1 33.9 67.7Jönköping 141 98.6 35.3 66.0 92.9Karlshamn 249 99.6 95.2 99.6 94.0Karlskoga 124 100.0 12.9 100.0 100.0Karlstad 182 100.0 92.9 7.7 91.2Kullbergska sjukhuset 157 100.0 97.5 100.0 94.3Kungälv 215 100.0 94.0 99.5 94.9Lidköping 234 100.0 91.0 10.7 73.9Lindesberg 164 98.8 78.4 22.2 77.2Ljungby 142 100.0 9.9 99.3 97.9Mora 186 100.0 90.3 11.3 92.5Norrköping 129 100.0 93.0 100.0 97.7Nyköping 101 97.0 91.1 100.0 91.1Oskarshamn 275 100.0 93.8 100.0 98.6Piteå 244 100.0 92.2 7.8 95.5Skellefteå 119 100.0 99.2 100.0 100.0Skövde 120 100.0 92.5 97.5 91.7Södersjukhuset 280 99.3 93.5 95.0 92.9Södertälje 113 100.0 98.2 100.0 79.7Torsby 130 100.0 90.0 9.2 90.0Uddevalla 187 100.0 88.2 100.0 95.2Varberg 127 100.0 85.8 32.3 68.5Värnamo 148 100.0 31.1 100.0 96.0Västerås 173 100.0 91.3 15.0 94.8Växjö 115 100.0 8.7 100.0 86.1Örnsköldsvik 115 100.0 90.4 28.7 87.8Östersund 120 100.0 90.8 100.0 94.2
> 300 operations/yearEnköping 393 100.0 72.0 99.8 69.2Hässleholm 644 100.0 96.0 100.0 3.3Mölndal 383 99.5 90.6 11.5 95.0Trelleborg 791 100.0 98.2 99.8 1.9

62 THE SWEDISH KNEE ARTHROPLASTY REGISTER – ANNUAL REPORT 2016 – PART II
Surgical technique Hospital Number of Complete Percent having Percent Percent Percent Median reports reports % General anesthesia Drainage Tourniquet LIA Op-timeCountry 12,903 99,8 25,1 7,7 60,2 95 74
University HospitalsAkademiska 109 100.0 19.3 1.0 79.8 97.3 75Huddinge 159 98.7 9.4 3.1 22.6 84.9 128Karolinska Solna 93 97.8 15.1 7.5 90.3 81.7 80Lund 103 100.0 51.5 1.9 29.1 94.2 86Sahlgrenska 2 100.0 50.0 0.0 50.0 100.0 141Umeå 146 96.6 11.9 4.8 78.1 90.4 104Örebro 30 100.0 40.0 6.7 100.0 93.3 102
Private unitsArtClinic Göteborg 16 100.0 0.0 0.0 93.8 81.3 92ArtClinic Jönköping 29 100.0 10.3 0.0 100.0 100.0 95Bollnäs Aleris 353 100.0 92.6 2.0 81.9 98.9 58Carlanderska 136 100.0 17.7 20.6 95.6 97.8 57Elisabethkliniken 1 100.0 100.0 0.0 1.0 1.0 116Kysthospitalet - DK* 14 100.0 100.0 0.0 100.0 100.0 75Luleå- Sensia 6 100.0 50.0 0.0 100.0 66.7 77Motala Aleris 511 99.6 5.7 90.8 24.5 99.4 44Movement Halmstad 431 100.0 3.5 0.5 34.8 99.5 68Nacka Aleris 144 100.0 99.3 0.0 2.8 95.1 61OrthoCenter IFK-kliniken 113 99.1 29.5 2.7 1.8 67.3 76OrthoCenter Sthlm 431 100.0 1.9 1.4 71.9 82.8 62Ortopediska huset 461 99.8 14.1 0.2 88.1 96.3 63Sabbatsberg Aleris 23 100.0 17.4 0.0 100.0 100.0 60Sophiahemmet 136 98.5 6.6 55.9 72.8 77.9 75St Göran 424 98.8 28.5 0.7 94.6 95.5 60Ängelholm Aleris 218 100.0 52.3 0.5 72.9 99.5 60
* Kysthospitalet in Denmark reports Swedish patients that they opererate but these are not included in the country results
Surgical technique for knee arthroplasties
The table ”Surgical technique” shows what the hos-pitals reported for having used in their primary knee arthroplasties in 2015.
Topmost is the average for the country as a whole after which the results for the respective hospitals are shown. They have been classified depending on if they are university hospitals, private hospi-tals or for the others depending on if their reported number of surgeries was less than 100, 100-300 or more than 300.
The first column shows the total number repor-ted and the second the proportion of complete reports. The rest of the information is based only on complete reports. Please note that the percen-tages may be misleading for units having reported only few surgeries.
As there is no national or international consensus concerning best practice regarding the drug to use, or when to start or end the treatment, we show what is most commonly reported.
Spinal anesthesia is most common (74%) but the proportion of general anesthesia (25%) has more than doubled since 2011. Bollnäs, Nacka, Karlshamn and Södertälje report more than 80% of their arthroplasties being performed using general anesthesia.
The use of drains has lessened from 26% in 2011 to 8% in 2014. Motala, Sophiahemmet and Kullbergska still use drainage in the majority of their primaries.
More surgeries were in 2015 reported to have been performed without tourniquet than previ-ously. The use tourniquet has lessened from 90% in 2011 to 60% in 2015.
LIA, with or without a catheter being left in the knee, was used in the majority of the surgeries.
The median time for performing a primary varied from 40 minutes to almost two hours. For TKA's it was 74 min., for UKA's 70 min., for fem-oropatellar arthroplasties 68 min. and for linked implants 134 min.
Since 2009, the median operating time for TKA's has varied between 71 and 82 min. and for UKA's between 70 and 80 min..
Bone transplantation is uncommon in primary arthroplasty and almost exclusively using auto transplantation. It was reported in 1.2% of the pri-maries and almost equally as often in the femur (48%) and the tibia (46%).
Computer aided surgery (CAS) was only reported for 19 cases (0.15%) at 14 units (9 in 2014).

THE SWEDISH KNEE ARTHROPLASTY REGISTER – ANNUAL REPORT 2016 – PART II 63
Surgical technique Hospital Number of Complete Percent having Percent Percent Percent Median reports reports % General anaesthesia Drainage Tourniquet LIA** Op-timeCountry 12,903 99,8 25,1 7,7 60,2 95 74
< 100 operations/year Borås 72 98.6 22.2 1.4 97.2 62.5 108Eskilstuna 38 100.0 10.5 7.9 52.6 97.4 107Gällivare 46 100.0 6.5 0.0 39.1 97.8 117Helsingborg 66 100.0 33.3 9.1 4.6 97.0 90Hudiksvall 87 100.0 6.9 0.0 56.3 89.7 79Kalmar 89 100.0 19.1 0.0 1.1 96.3 99Kristianstad 1 100.0 0.0 0.0 0.0 100.0 70Lycksele 40 100.0 100.0 0.0 100.0 52.5 101Norrtälje 94 100.0 22.3 0.0 95.7 83.0 89Skene 97 100.0 14.4 0.0 95.9 91.9 91Sollefteå 93 97.8 8.6 18.3 87.1 97.9 97Sundsvall 44 100.0 2.3 11.4 36.4 100.0 105Visby 60 100.0 26.7 0.0 71.7 100.0 110Västervik 90 98.9 30.3 0.0 25.6 100.0 77Ängelholm 2 100.0 100.0 0.0 50.0 100.0 67
100-300 operations/yearAlingsås 193 100.0 17.1 0.5 96.4 96.4 75Arvika 171 100.0 10.5 0.0 0.6 98.8 74Danderyd 183 100.0 8.7 1.6 72.1 97.3 94Eksjö-Nässjö 202 100.0 23.8 9.4 90.1 98.0 67Falun 205 100.0 14.6 2.4 98.1 100.0 76Frölunda Spec. sjukhus 124 100.0 22.6 0.8 100.0 82.3 46Gävle 132 100.0 37.1 10.6 86.4 96.2 74Halmstad 186 100.0 15.6 15.6 98.4 93.0 86Jönköping 141 99.3 20.7 1.4 96.5 92.2 94Karlshamn 249 99.6 83.9 0.0 87.6 99.2 72Karlskoga 124 99.2 15.3 5.7 75.8 98.4 105Karlstad 182 98.9 18.9 0.6 0.0 98.4 60Kullbergska sjukhuset 157 100.0 20.4 86.6 93.0 94.9 89Kungälv 215 100.0 30.2 0.0 19.5 89.7 88Lidköping 234 100.0 10.7 4.3 13.3 97.0 86Lindesberg 164 98.8 20.4 0.6 98.2 99.4 102Ljungby 142 99.3 32.4 0.7 50.7 97.9 69Mora 186 100.0 8.6 0.5 98.9 98.9 60Norrköping 129 100.0 18.6 0.0 76.7 97.7 93Nyköping 101 99.0 14.0 5.0 10.9 98.0 91Oskarshamn 275 100.0 16.0 1.1 85.8 82.2 71Piteå 244 100.0 8.2 0.4 95.5 98.0 73Skellefteå 119 100.0 1.7 0.8 100.0 100.0 100Skövde 120 100.0 14.2 0.8 75.8 96.7 83Södersjukhuset 280 99.3 17.6 9.3 10.0 92.2 76Södertälje 113 100.0 85.8 2.7 100.0 96.5 74Torsby 130 100.0 13.9 0.0 0.0 97.7 54Uddevalla 187 100.0 9.6 17.7 97.9 100.0 94Varberg 127 99.2 10.3 0.0 55.1 70.1 90Värnamo 148 100.0 11.5 18.9 99.3 96.0 101Västerås 173 100.0 13.3 0.0 52.0 91.9 84Växjö 115 100.0 39.1 0.0 20.9 92.2 97Örnsköldsvik 115 100.0 5.2 0.9 100.0 98.3 84Östersund 120 100.0 11.7 0.0 80.0 99.2 118
> 300 operations/yearEnköping 393 99.5 13.6 1.3 99.0 98.0 74Hässleholm 644 100.0 77.3 0.8 14.4 98.3 40Mölndal 383 99.2 25.1 1.8 1.8 94.0 91Trelleborg 791 100.0 25.4 0.3 55.9 99.4 71
No UKA's were reported having been performed using CAS. Custom made instruments/cutting blocks were reported in 280 (2.2%) of the surgeries which was three times that reported in 2014. 25 units repor-
ted having used such instruments, most having only done a few. Movement Halmstad accoun-ted for a half of the cases (146) while Kungälv (29), Mölndal (24) and Motala (15) accounted for a quarter.

64 THE SWEDISH KNEE ARTHROPLASTY REGISTER – ANNUAL REPORT 2016 – PART II
Patient reported outcome before and after knee arthroplasty
HistoryThe SKAR started early on to ask patients about
their opinion of their knee surgery. In 1997, 94% of all living patients that had undergone a knee arthroplasty answered a mail survey concerning non-reported revisions and patient satisfaction (Robertsson 2000).
In 1998, different patient questionnaires were tested in order to find the most suitable for use after knee arthroplasty and the SF-12 and Oxford-12 were found to be the most relevant. (Dunbar 2001).
defined purpose it is difficult to choose a fitting instrument as well as decide if the response rate can be expected to be adequate. Therefore the SKAR has awaited international consensus on the matter.
The pilot projectThe project started within the Region of Skåne
where PROMs are used as a quality measure of the care provided. In the 2011 report we accounted for PROM data gathered 2008-2009 for TKA patients operated at the arthroplasty center in Trelleborg, which is jointly used by the university hospitals in Lund and Malmö.
In 2012 Hässleholm was included and in 2013 the remaining hospitals in Skåne (Lund, Malmö, Helsing-borg and Ängelholm). In the 2014 and 2015 reports we expanded the reporting of PROM data ton include units outside Skåne (Norrköping, Motala and Oskarshamn).
What we have learned from the project is that it seems difficult to find statistically and clinically sig-nificant differences between units, that there were large variations between individuals and that in spite of some differences in case-mix bertween the two of the largest arthroplasty units in Sweden their differ-ences in PROM results were small. In addition the number of procedures as well as the completeness in reporting varies which makes it difficult to interpret and compare results of different units and for different years of surgery.
The PROM-projectMore and more units have joined the pilot proj-
ect which now can be considered permanent. In 2013 Oskarshamn joined and their one-year results for patients operated in 2013 are presented in this report (see page 63). Kalmar, Karolinska in Solna and OrthoCenter Stockholm started 2014 to report and their preoperative data can also be found in this report. Mölndal has however chosen to only register EQ-5D, VAS pain and satisfaction with the surgery one year postoperatively and not the disease specific KOOS. Still more units joined in 2015 and additional ones have expressed their interest and started the work to establish the project at their hospitals and to find resources for the gath-ering of PROM data. Below there is a summary of the PROM data of patients having primary knee arthroplasty which are presented descriptively for the respective hospitals and the year of surgery.
PROM was the subject for a dissertation in 2001 based on data from the knee register.
We also found that the number of questions affected the answering rate and the proportion of complete answers. Further, non-responders were more often unsatisfied than responders.
Using self-administrated disease specific or general health questionnaires to evaluate results of surgery turned out to be more complicated than expected. There are many reasons for this, includ-ing among others that there is no clear definition of what outcome can be expected after knee arthro-plasty (the aim of the surgery may vary), the initial health status and the expectations of the patients differ and observed changes in health over time need not be related to the surgery of the joint. We have also found that the observed proportion as well as which patients do not experience pain relief one year after total knee arthroplasty is dependent on the type of questionnaire used (W-Dahl et al 2014).
A national pre- as well as post-operative registra-tion of PROM requires a large amount of resources both at a hospital and register level. Without a well-
. Vi har också funnit att den observerade andelen likväl som vilka patienter som inte upplever smärtlindring ett år efter en totalprotes beror på vilket instrument som används (W-Dahl et al 2014).

THE SWEDISH KNEE ARTHROPLASTY REGISTER – ANNUAL REPORT 2016 – PART II 65
Instruments used for the evaluationEQ-5D is a general health instrument measur-
ing quality of life based on the answers of 5 differ-ent questions (mobility, usual activities, self-care, pain/discomfort, anxiety/depression). Each of the questions can be answered by 1= no problem, 2= moderate problem and 3= extreme problem.
The EQ-5D index is calculated from the answers by use of a tariff for the normal population to weight the answers. However, lacking a Swedish tariff the British has been used instead. The lowest value is -0.594 and the highest 1.0 which represents a fully healthy individual. The index is intended to be used for health economic calculations although it has also been used to estimate quality of care which has proved to be somewhat problematic because of the lack of a normal distribution as recently was reported in the Läkartidningen (36, 2011). If one wants to perform statistical analyses using a single value as a measure of the health related quality of life it is possible to use the EQ-VAS. It measures the self-perceived general health of the patient on a scale (0-100) from the best (100 to the worst imag-inable health status (0) (www.euroqol.org).
KOOS is a disease specific questionnaire con-sisting of 42 questions and is designed to be used for short and long time follow-up after knee trauma or osteoarthritis. KOOS consists of 5 subscales; Pain, other Symptoms, Activity in Daily Life func-tion (ADL), Sport and Recreation function (Sport/Rec) and knee related Quality of life (QoL). Stan-dardized answer options are given (5 Likert boxes) and each question gets a score from 0 to 4. A nor-malized score (100 indicating no symptoms and 0 indicating extreme symptoms) is calculated for each subscale (www.koos.nu).
The Visual Analog Scale (VAS) is used to have the patients to estimate their knee pain by marking their pain score on a 0-100 scale (VAS) in which 0= no pain and 100= worst imaginable pain.
Patient satisfaction with the arthroplasty surgery one year postoperatively was also evaluated using a 0-100 scale (VAS) in which 0= the highest imag-inable satisfaction and 100= the worst imaginable satisfaction. The satisfaction (VAS) score was categorized into 5 groups; very satisfied (0-20), satisfied (21-40), moderately satisfied (41-60),
unsatisfied (61-80) and very unsatisfied (81-100).
The Charnley classification is a simple method for judging comorbidity. The modified Charnley classification consists of four classes; class A which stands for a unitlateral knee disease, class B means bilateral disease which is divided into B1 if the knee which is not subject for the present surgery is not healthy and has not been resurfaced with an arthro-plasty and B2 if it has been operated with an arthro-plasty. Class C stands for multiple joint disease and/or another disease that affects the walking ability. The patients answer four questions that the classifi-cation is based on. The proportion of patients with Charnley class C is shown for each hospital in the table on page 69.
Patient selectionOnly primary TKA's are included. Diagnoses
other than OA are excluded as well as the second knee in case of both knees having had an arthro-plasty during the one year follow-up period (left knee in case of simultaneous bilateral arthroplasty). Additionally only patients with complete pre- and one year postoperative data (EQ-5D, EQ-VAS and KOOS) were included. The number pf TKA's reported as well as the number of available PROM reports is shown in the tables on page 67 and 69.
Case-mixA summary of case-mix factors such as gender,
age, diagnosis, BMI and comorbidity is shown for the respective hospitals on page 56-57.
LogisticsThe patients filled in the questionnaires at the
outpatient visit approximately 2-6 weeks prior to surgery. One year postoperatively the same ques-tionnaire was mailed to the patients together with the question on satisfaction with the knee arthroplasty.
UKA and PROMThe number of UKA’s performed for OA in the
hospitals reporting PROM in 2014 was few (87 sur-geries) with one unit performing more than half of the surgeries. Due to the low number of procedures in combination with low completeness (59%) we do not provide PROM-data for UKA's.

66 THE SWEDISH KNEE ARTHROPLASTY REGISTER – ANNUAL REPORT 2016 – PART II
ResultsEQ5DIn order to visualize the change in general health
from surgery until one year postoperatively we have classified 9 combinations of pre- and post-operative EQ-5D answers that are possible for the instrument.
A preoperative answer of extreme problems can be unchanged at the follow-up (3-3) or there can be an improvement from extreme to moderate (3-2) or from extreme to none (3-1).
Moderate problems can stay unchanged (2-2), worsen into extreme (2-3) or improve to none (2-1). Finally no problems preoperatively can stay unchanged (1-1), worsen to moderate (1-2) or become extreme (1-3).
The figure below shows for each of the 9 pos-sible combinations the change from before surgery until one year after. It can be seen that a good half of the patients improved their mobility and expe-rienced pain relief while only a third improved in their daily activities, a fifth had reduced anxiety and only a few improved in self-care. The results are similar to those of previous years.
EQ-VASFor units with high response rates (Hässleholm,
Norrköping, OrthoCenter Stockholm, Oskarshamn and Trelleborg) the differences between the units were small (0-10 points) both pre- and postopera-tively when the patients operated 2013 estimated their general health. For units with few patients and/or low response rate the variation in the patient estimates was slightly larger (2-23 points). In 2015, the preoperative differences were also small (1-15 points).
VAS – Knee painThe difference in preoperative knee pain of
patients operated 2014 in Hässleholm, Norrköping, OrthoCenter Stockholm, Oskarshamn och Trel-leborg was small between the units (1-3 points). One year postoperatively the difference was simi-lar (1-8 points). For the other units the differences were also small, 1-12 points preoperatively and 0-8 points one year postoperatively.
VAS – Satisfaction with the surgery73 % of the patients had one year postoperati-
vely reported their satisfaction with the arthro-plasty surgery. Of these, 85% stated that they were very satisfied (0-20) or satisfied (21-40). Among the units with relatively high response rate, the patients were most often satisfied in Oskarshamn (90%), OrthoCenter Stockholm (89%) and Norr-köping (89%) followed by Hässleholm (84%) and
100
90
80
70
60
50
40
30
20
10
0 Cop
yrig
ht ©
201
6 S
KA
R
EQ5D change - All reporting units
Mobility Self-care Activity Pain Anxiety
1-3 1-2 2-3 3-3 2-2 1-1 2-1 3-2 3-1
Worse
Unchanged
Better
Before - After
The distribution (%) i for the different combinations of pre- and postoperatve (1-year) change for each of the EQ-5D questions.
(1=no problem, 2=some or moderate problems 3=extreme problems)
100
90
80
70
60
50
40
30
20
10
0 Cop
yrig
ht ©
201
6 S
KA
R
VAS Satisfaction (%)
Very satis�edSatis�edModerate satis�edNot satis�edVery unsatis�ed
The distribution (%) for each level of satisfaction one year after surgery for all the units combined as well as for each of the units,
Clinically relevant differencesIn order for changes in points to be considered
clinically relevant, the change on the VAS scale has to be 15-20 points and 8-10 points for each of the KOOS 5 subscales.

THE SWEDISH KNEE ARTHROPLASTY REGISTER – ANNUAL REPORT 2016 – PART II 67
Satisfaction one year after surgery (2014)VAS (0-100) (worst - best)
Number Complete PostopHospital of reports reports (%) Mean (SD)
All units 2,116 73 19 (23)Helsingborg 29 71 21 (32)Hässleholm 508 88 19 (23)Kalmar 47 70 16 (23)Karolinska 20 26 16 (23)Lund 43 70 22 (22)Motala 244 66 15 (22)Norrköping 99 80 14 (20)OrthoCenter Sthlm 302 82 14 (23)Oskarshamn 227 91 14 (19)Trelleborg 599 82 23 (23)Ängelholm 38 60 24 (27)Ängelholm Aleris 96 67 21 (21)
Results for VAS–pain and EQ–VAS preoperatively and 1 year postoperatively. VAS pain EQ-VAS 0–100 ( best - worst) 0–100 ( worst - best)
Group Patients Complete Preop Postop Preop Postop n reports mean (SD) mean (SD) mean (SD) mean (SD)
All2014 2,216 75 64 (18) 18 (20) 67 (22) 76 (19)2015 3,541 92 65 (18) 65 (23) Hospital: Helsingborg 2014 29 73 71 (21) 17 (23) 57 (30) 77 (25)2015 52 83 71 (17) 62 (21) Hässleholm 2014 508 88 62 (18) 17 (19) 72 (21) 77 (18)2015 547 99 62 (18) 71 (22) Kalmar fom 26/3 2014 47 70 64 (14) 17 (20) 66 (21) 74 (24)2015 75 70 64 (20) 64 (21) Karolinska 2014 20 26 72 (16) 15 (15) 54 (18) 79 (12)2015 53 74 71 (17) 57 (23) Kungälv 2015 137 87 66 (17) 63 (21) Lund 2014 45 74 66 (18) 23 (20) 60 (18) 71 (15)2015 56 77 62 (20) 65 (22) Motala 2014 235 63 66 (17) 17 (19) 62 (22) 76 (19)2015 276 81 67 (16) 63 (24) Mölndal 2014 247 75 65 (18) 63 (21)Norrköping 2014 96 79 70 (17) 19 (21) 62 (24) 77 (18)2015 109 93 72 (16) 57 (25) OrthoCenter Sthlm 2014 296 80 65 (17) 14 (18) 64 (22) 79 (17)2015 355 92 66 (18) 63 (22) Oskarshamn 2014 218 88 65 (17) 15 (17) 62 (24) 75 (20)2015 235 92 65 (16) 62 (23) Trelleborg 2014 556 82 63 (19) 22 (20) 70 (21) 75 (19)2015 644 93 65 (19) 70 (21) Ängelholm 2014 38 59 67 (17) 25 (24) 66 (24) 71 (23) Ängelholm Aleris 2014 90 63 60 (14) 18 (18) 60 (20) 78 (19)2015 159 85 65 (14) 56 (24)
Trelleborg (81%). For the other hospitals (Helsing-borg, Karolinska i Solna, Lund, Motala och Äng-elholm) the proportion of satisfied patients varied between 82 and 89% (figure below to the left.).
The table to the right shows the number of com-plete reports together with the mean and standard deviation (SD) for the satisfaction with the surgery one year after it had been performed (in 2013). The average for all the reporting hospitals is shown as well as that of the respective units.
The EQ-VAS and VAS pain are shown in a similar way in the table below. For patients operated in 2014 both the pre- and postoperative results are shown but for patients operated in 2015 only the preoperative results are available.

68 THE SWEDISH KNEE ARTHROPLASTY REGISTER – ANNUAL REPORT 2016 – PART II
KOOSThe differences were small between those units
that in 2014 had a relatively high response rate and reported both pre- and postoperative PROM data (Hässleholm, Norrköping, OrthoCenter Stock-holm, Oskarshamn och Trelleborg). For units with few patients and/or low response rate the results vary and are difficult to interpret. For 2015 the pre-operative differences were also small.
The results for the KOOS 5 subscales are shown as mean and standard deviation for all patients as well as for the respective hospitals. For patients ope-rated in 2014 both the pre- and postoperative results are shown but for patients operated in 2015 only pre-operative results are available (see table on next page).
SummaryThe result of the compilations showed again
small variations between groups in spite of some differences in case-mix. However, it is worthwhile to point out that 89% of the patients in Oskars-hamn, Norrköping and OrthoCenter Stockholm were very satisfied or satisfied one year after their knee arthroplasty surgery.
The results vary for units performing few sur-geries and those that have low response rate which makes it difficult to interpret and compare results between units as well as between different years of surgery.
Kungälv, Mölndal and Ängelholm Aleris began gathering PROM data in 2015 which they enter on-line into our common database.
A number of units (Alingsås, Bollnäs, Eksjö-Nässjö, Karolinska i Huddinge, Karlskoga, Lin-desberg, Södertälje och Örebro) began gathering PROM data in 2016 which they enter on-line into our common database.
Gathering a representative material with one year follow-up will take more than 2 years. Only then, the participating units can begin comparing their results to that of others. Still, the PROM pro-ject will serve as a basis for continued discussion regarding evaluation of patient reported outcomes in registries and hospitals and how the results can be used for clinical improvement.

THE SWEDISH KNEE ARTHROPLASTY REGISTER – ANNUAL REPORT 2016 – PART II 69Re
sult
s fo
r KO
OS
preo
pera
tive
ly (s
urge
ries
201
4 &
201
5) a
s w
ell a
s 1
year
pos
tope
rati
vely
(sur
geri
es 2
014)
Pa
in
Sym
tom
s A
DL
Spor
ts/R
ec.
QoL
G
roup
Pa
tient
s Co
mpl
ete
Char
nley
C
Preo
p Po
stop
Pr
eop
Post
op
Preo
p Po
stop
Pr
eop
Post
op
Preo
p Po
stop
n re
port
s pa
tient
s m
ean
mea
n
mea
n m
ean
mea
n m
ean
mea
n m
ean
mea
n m
ean
%
%
(S
D)
(SD
) (S
D)
(SD
) (S
D)
(SD
) (S
D)
(SD
) (S
D)
(SD
)
All
2014
2
216
75
42.6
41
(15)
80
(18)
47
(17)
76
(17)
46
(15)
79
(18)
12
(14)
37
(27)
23
(14)
64
(23)
2015
3
541
92
43.6
40
(15)
46 (1
8)
45
(16)
11 (1
5)
22
(14)
Hos
pita
l H
elsin
gbor
g
20
14
29
73
31
41 (1
6)
82 (1
7)
51 (2
0)
82 (1
7)
45 (1
5)
83 (1
6)
7 (1
1)
36 (2
6)
18 (1
1)
65 (2
4)20
15
52
83
52
40 (1
4)
46
(19)
43 (1
3)
7
(11)
18 (1
2)
Häs
sleho
lm
2014
50
8 88
42
.5
39 (1
5)
81 (1
8)
46 (1
8)
76 (1
6)
45 (1
5)
79 (1
8)
12 (1
5)
39 (2
7)
24 (1
4)
65 (2
4)20
15
547
99
42.1
40
(15)
47 (1
7)
44
(16)
13 (1
5)
23
(13)
Ka
lmar
fr
om 2
6/3
2014
47
70
44
.7
40 (1
5)
79 (2
19
50 (1
6)
77 (1
9)
49 (1
5)
78 (2
4)
12 (1
9)
40 (2
7)
23 (1
4)
66 (2
4)20
15
75
70
40.5
43
(16)
49 (1
6)
48
(14)
17 (1
8)
23
(13)
Ka
rolin
ska
2014
20
26
52
.6
39 (1
5)
92 (7
) 49
(20)
89
(8)
46 (1
6)
93 (6
) 8
(10)
74
(15)
16
(9)
84 (1
2)20
15
53
74
58.5
37
(15)
41 (1
7)
40
(18)
9 (1
2)
19
(13)
Ku
ngäl
v
20
15
137
87
58.5
39
(14)
44 (1
7)
46
(16)
11 (1
5)
21
(14)
Lu
nd
2014
45
74
57
.8
41 (1
4)
76 (2
0)
51 (1
7)
75 (1
9)
43 (1
3)
76 (1
9)
6 (9
) 29
(28)
19
(13)
60
(22)
2015
56
77
51
.8
41 (1
7)
50
(21)
45 (1
7)
11
(13)
23 (1
6)
Mot
ala
2014
23
5 63
41
.2
40(1
5)
81 (1
8)
45 (1
6)
78 (1
7)
45 (1
5)
79 (1
9)
11 (1
3)
36 (2
6)
23 (1
4)
64 (2
1)20
15
276
81
45.8
39
(16)
43 (1
8)
45
(16)
12 (1
6)
21
(14)
N
orrk
öpin
g
20
14
96
79
48.9
37
(17)
81
(16)
44
(16)
77
(16)
42
(15)
79
(16)
8
(10)
34
(27)
20
(14)
63
(22)
2015
10
9 93
48
.1
37 (1
4)
44
(18)
42 (1
8)
9
(14)
20 (1
4)
Ort
hoCe
nter
Sth
lm
2014
29
6 80
45
.9
43 (1
6)
83 (1
7)
46 (1
7)
77 (1
9)
49 (1
7)
82 (1
6)
13 (1
4)
39 (2
8)
22 (1
4)
64 (2
3)20
15
355
92
39.4
40
(16)
45 (1
8)
49
(17)
12 (1
5)
21
(14)
O
skar
sham
n
20
14
218
88
43.9
40
(16)
82
(18)
47
(18)
78
(16)
45
(15)
79
(18)
10
(14)
36
(26)
22
(14)
65
(23)
2015
23
5 92
47
.6
40 (1
5)
47
(17)
45 (1
5)
11
(14)
21 (1
3 )
Trel
lebo
rg
2014
55
6 82
41
,8
42 (1
5)
78 (1
8)
50 (1
7)
75 (1
79
47 (1
5)
77 (1
9)
13 (1
4)
35 (2
8)
25 (1
4)
62 (2
4)20
15
644
93
37,7
41
(16)
48 (1
8)
47
(16)
11 (1
4)
23
(14)
Änge
lhol
m
2014
38
59
34
.2
41 (1
4)
78 (2
1)
49 (1
7)
73 (1
9)
47 (1
6)
77 (2
1)
10 (1
3)
34 (2
8)
22 (1
6)
64 (2
5)Än
gelh
olm
Ale
ris
2014
90
63
30
,3
41 (1
3)
82 (1
7)
47 (1
7)
78 (1
9)
46 (1
4)
82 (1
7)
14 (1
9)
40 (2
8)
23 (1
2)
67 (2
4)20
15
159
85
45,4
38
(14)
42 (1
6)
43
(15)
9 (1
3)
19
(13)

70 THE SWEDISH KNEE ARTHROPLASTY REGISTER – ANNUAL REPORT 2016 – PART III
Joint preserving surgery – Knee osteotomyHigh tibial osteotomy was introduced in
Sweden in 1969 as a standard treatment for uni-compartmental osteoarthritis by Göran Bauer Professor in Lund. However, after the modern knee implants were introduced in the seventies they quickly became the most common surgical option for osteoarthritis. Since then, the number of osteotomies has constantly diminished. Björn Tjörnstrand estimated 1981 in his thesis; ”Osteot-omy for medial gonarthrosis”, that that one third of the surgical knee reconstructions were osteoto-mies while the SKAR in 1994 estimated that they accounted for 20%.
Of the osteotomies performed around the knee joint, Tibia osteotomy is the most common, most often being used for medial osteoarthritis while its use for lateral arthritis is less common. Oste-otomies of the femur are more infrequent and are used mostly for serious congenital or acquired deformities as well as sometimes for lateral osteo-arthritis.
There are several osteotomy methods and there are different types of fixation which often depend on the method used.
The ”closed wedge” osteotomy is a ”minus osteotomy” in which a bone wedge, of a size that relates to the correction needed, is removed. The osteotomy can be fixed with one or more staples, a plate and screws or with an external frame.
Open wedge osteotomy is a ”plus osteotomy” in which a wedge is opened up in order to gain the decided amount of correction. The osteotomy can be fixed internally, most commonly with plate and screws, with staples or with an external frame. When the osteotomy is opened up during surgery a bone autograft or synthetic bone substitute may be used to fill the gap (see the left figure below). If an external frame is used for fixation it is possible to gradually open the osteotomy over few weeks which is the biological procedure used for bone lengthening which has the name hemicallostasis (see figure to the right below).
Finally there is also the curved or dome oste-otomy which is rarely used in Sweden.
The results after osteotomy are related to how the sur-gery gains and maintains the optimal correction. Thus the operation demands careful preoperative planning with respect to the correction needed, that the correc-tion aimed for is achieved during surgery and that the fixation is stable so it can preserve the level of correc-tion during bone healing. Each of the different techniques has their pros and cons and there has been a continuing development of the procedures and the postoperative care with the aim of improving results.
The choice of method and technique may have an effect on the short- and long-term risk for complications as well as influence a later knee replacement with respect to techniques used and outcome. The health economical perspective is also important for the health providers, the society and not least the patients.
Open wedge osteotomywith staple fixation
Open wedge osteotomywith external fixation
Closed wedge osteotomy using a staple for fixation..The inserted picture above shows the wedge that is removed before the osteotomy is closed..
The knee osteotomy register

THE SWEDISH KNEE ARTHROPLASTY REGISTER – ANNUAL REPORT 2016 – PART III 71
Art Clin
ik Jö
nköpin
g
Capio
Artro C
linic
Eksjö
-Näs
sjöEn
köpin
gEs
kilstu
naGäv
leHels
ingbo
rgHud
iksva
llHäs
sleho
lmJö
nköp
ingKa
lmar
Karo
linsk
aKu
ngälv
Köpin
gLu
ndM
almö
Mot
ala
Mov
emen
t Halm
stad
Möln
dal
Norrkö
ping
Norrtä
lje
Ortope
diska
huse
tOsk
arsha
mn
Piteå
Soph
iahem
met
Sund
erby
Söde
rsjuk
huse
tTr
elleb
orgUdd
evall
aUmeåVisb
yVäs
terås
Växjö
Östersu
nd
0
2
4
6
8
10
12
14
16
18
20
22
24Number of osteotomies and the method(s) used
at each unit in 2015
Open wedge - internal fix.
Open wedge - external fix.
Closed wedge
Distal femur
Other
It is difficult to assess how many of the oste-otomies performed in the country are captured by the register. The surgical code NGK59 (Nomesco) that the health authorities register when an osteot-omy has been performed also applies to those per-formed for other reasons than disease or damage in the knee. The number of osteotomies captured in 2015 was approx. 47% of the total number of sur-geries registered in 2015 by the authorities using the code NGK59 in 2014, irrespective of age or diagnosis. However, so far no children have been reported to the register and if the age interval is limited to patients 15-65 years of age, the propor-tion in the osteotomy register increases to 55%.
With help of the Registerservice by the Swed-ish Association of Local Authorities and Regions we have started a project of selecting reasonable ICD10 diagnostic codes that have to be combined with the surgical code NGK59 in order to better be able to assess the completeness of the osteotomy register.
Sweden became the first country in the world to start a national osteotomy registration as a comple-ment to the knee arthroplasty registry (W-Dahl et al. 2014).
Australia and New Zealand have plans of ana-logous registration together with their respective arthroplasty registries. They will harmonize their registration with the Swedish reporting form faci-litating future co-operation and comparisons. In Great Britain a separate register of osteotomies was initiated in 2014 with a financial help from the industry (Elson et al. 2015).
In 2015, 177 osteotomies were reported from 34 hospitals. As the figure below shows, only 6 hospitals reported having performed 10 or more during the year. The hospital performing most was Motala that did 19. As compared to the previ-ous years it seems that somewhat fewer osteoto-mies have been reported from more hospitals.

72 THE SWEDISH KNEE ARTHROPLASTY REGISTER – ANNUAL REPORT 2016 – PART III
Patient characteristics - osteotomies All Prox. Tibia Dist. Femur n=177 n= 167 (94%) n=10 (6%
Age (years)median (range) 51 (20-69) 51 (20-69) 42 (27-60)
GenderMen - n (%) 107 (60) 106 (63) 1Women - n (%) 70 (46) 61 (37) 9
Preop HKA angle, n=206median (range) 7 (0-30) 7.5 (0-30) 5 (0-15)
ASA classifikation, n=165ASA I - n (%) 101 (61) 94 (61) 7ASA II - n (%) 62 (38) 59 (38) 3ASA III - n (%) 2 (1) 2 (1) 0
OA type, n=189Medial n (%) 143 (91) 143 (95) 0Lateral n (%) 15 (9) 7 (5) 8
OA grade, n=145 Ahlbäck 1 - n (%) 68 (47) 62 (45) 6Ahlbäck 2 - n (%) 53 (37) 52 (38) 1Ahlbäck 3 - n (%) 24 (16) 23 (17) 1
ResultsThe following pages show the results for the
knee osteotomies that were reported in 2015.The knee osteotomy register gathers simi-
lar information as the knee arthroplasty register concerning the patients (BMI, ASA and previous surgeries), the use of antibiotics, antithrombotic prophylaxis as well as the surgical technique.
Patient characteristics60% of the patients were males and the median
age was 51 years that can be compared for the median age in 2015 for patients having TKA (69) and UKA (64). Two thirds of the patients were reported as healthy (ASA class I) and having a BMI less than 30 kg/m2. The majority had medial osteoarthritis of grade 1-2 according to the Ahl-bäck classification and the median axis deviation was 7 degrees. Patients having distal femur oste-otomy were younger, most were women and they had somewhat less axis deviation than those having proximal tibia osteotomy (see below).
Body Mass Index (kg/m2)
BMI group Number Percent
<25 31 17.525-29.9 93 52.530-34.9 35 19.835-39.9 7 440+ 0 0Missing 11 6.2
Total 177 100
Previous surgery in the index knee
Surgery Number Percent
None 59 33.3Fracture surgery 6 3.4Meniscal surgery 36 20.4Cruciate surgery 16 9Arthroscopy 42 23.7Other 4 2.3Missing 14 7.9
Total 177 100
Reason for the osteotomy
Diagnosis Number Percent
Osteoarthritis 158 89.3Acquired deformity 10 5.6Congenital deformity 1 0.6Instability 6 3.4Osteonecrosis 0 0Other 0 0Missing 2 1.1
Total 177 100
Type of osteotomy
Type Number Percent
Open wedge intern fixation 126 71.2Open wedge extern fixation 38 21.5Closed wedge 1 0.6Curved/Dome 1 0.6Distal femur 10 5.6Rotation osteotomy 1 21.4Missing 0 0
Total 177 100
Reason for and type of osteotomy The majority of the surgeries (90%) were per-
formed for osteoarthritis. The most common method was open wedge with internal fixation followed by open wedge with external fixation. Closed wedge osteotomy, which for a long time was the standard treatment for osteoarthritis in Sweden, was only used in one case.
Previous surgeryReporting previous surgery of the index knee,
it is possible to mark more than one alternative. Previous surgery was reported for two thirds of the patients and more than one surgery for 14%. This can be compared to the knee arthroplasty patients for whom 19% were reported to have had previous surgery and 3% more than one. What is reported cannot be considered a comprehensive description of previous surgeries but illustrates what the sur-geon knew at the time of the primary arthroplasty.
Patient characteristics and case-mix in knee osteotomy surgery

THE SWEDISH KNEE ARTHROPLASTY REGISTER – ANNUAL REPORT 2016 – PART III 73
Open wedge osteotomy with internal fixationMany different plates were reported for fixa-
tion of the osteotomies. The Tomofix plate was the most commonly used plate but three types of plates accounted for more than 80% of those used in this type of surgeries (see below).
Type of fixation in open wedge osteotomy with internal fixation
Type Number Percent
Tomofix 69 54.8CountureLock 10 7.9Pudo 23 18.3iBalance 6 4.7OTIS 4 3.2Peek power 1 0.8Other 3 2.4Missing 10 7.9
Total 135 100
Transplantation of boneIn a good half of the open wedge osteotomies
using internal fixation, no bone transplantation was reported. In case of bone transplantation, synthetic bone was most commonly used followed by bank bone and auto transplantation (see table). OSferion was the most commonly used synthetic bone.
Open wedge osteotomy with external fixationFor this type of osteotomies, the Orthofix exter-
nal fixation was used for all but two surgeries (see below).
Type of fixation in open wedge osteotomy with external fixation
Type Number
Orthofix 33Monotube 5
Total 38
Distal femur osteotomyDifferent methods and techniques were used for
this type of osteotomy which is relatively uncom-mon (see below).
Type of fixation for distal femur osteotomy
Type Number
Femur OWO platta 1Tomofix 6Pudo 2Arthrex femur plate 1
Total 10
Simultaneous surgeryAn additional simultaneous surgery was reported
to have been performed together with the osteot-omy in 39 (22%) cases. Arthroscopy was the most common simultaneous procedure (see below).
Simultaneous surgery with the osteotomy
Surgery Number Percent
None 117 66.1Arthroscopy 29 16.4Cruciate surgery 5 2.8Meniscal surgery 0 0Other 5 2.8Missing 21 11.9
Total 177 100
Transplantation of bone in open wedge osteotomy with internal fixation
Bone transplantate Number Percent
None 68 54Auto transplantation 10 7.9Bank bone 7 5.6Synthetic bone 41 32.5Missing 0 0 Total 126 100 Synthetic bone: DePuy/Synthes Chronos 9 Osferion 23 OTIS 7 Missing 2
Technique and prophylaxis for knee osteotomies

74 THE SWEDISH KNEE ARTHROPLASTY REGISTER – ANNUAL REPORT 2016 – PART III
Type of anesthesiaGeneral anesthesia which was used in 58% of cases was the most common method (see table).
.
Operating timeAfter excluding osteotomies performed with
another simultaneous surgery, the median operat-ing time was somewhat shorter for open wedge osteotomies with external fixation (49 min, 21-94) than with internal fixation (64 min, 35-144). Closed wedge osteotomies took longer time (75 min as well as dome osteotomies (109 min) and distal femur osteotomies (76 min, 35-111). The table below shows the median operating times including osteotomies with simultaneous surgeries.
Type of anesthesia
Type Number Percent
General 103 58.2Epidural 2 1.1Spinal 60 33.9Combination 0 0Missing 12 6.8
Total 177 100
Operating time
Type of osteotomy Median (min) Range (Min)
Closed wedge 75Open wedge internal 71 (35-286)Open wedge external 53 (21-155)Dome 109Distal femur 85 (35-156)Rotation osteotomy 190
Computer aided surgery (CAS)No osteotomies were reported to have ben per-
formed with the help of navigation.
Thromboprophylaxis
Substance - time Number Percent
None 15 8.5Fragmin preop 6 3.4Fragmin postop 45 25.4Inohep preop 6 3.4Inohep postop 68 38.4Klexane preop 7 4Klexane postop 13 7.3Eliqvis 3 1.7Macrodex 1 0.6Missing 12 7.3
Total 177 100
Thromboprophylaxis - length of treatment
Days Number Percent
No prophylaxis 15 8.51-7 22 12.48-14 116 65.615-21 6 3.422-28 2 1.129-35 2 1.1>35 2 1.1Missing 12 6.8
Total 177 100
Antithrombotic prophylaxisFragmin och Innohep were the most commonly
used substances. When using Fragmin, Innohep or Klexane, the prophylaxis using was more com-monly started postoperatively. Eight percent of the osteotomy patients did not receive any antithrom-botic prophylaxis at all (see table), unlike the knee arthroplasty patients which almost always receive prophylaxis.
Tromboprophylaxis - length of treatmentThe planned length of treatment varied but two
thirds of the patients were planned to have 8-14 days of treatment (see table).
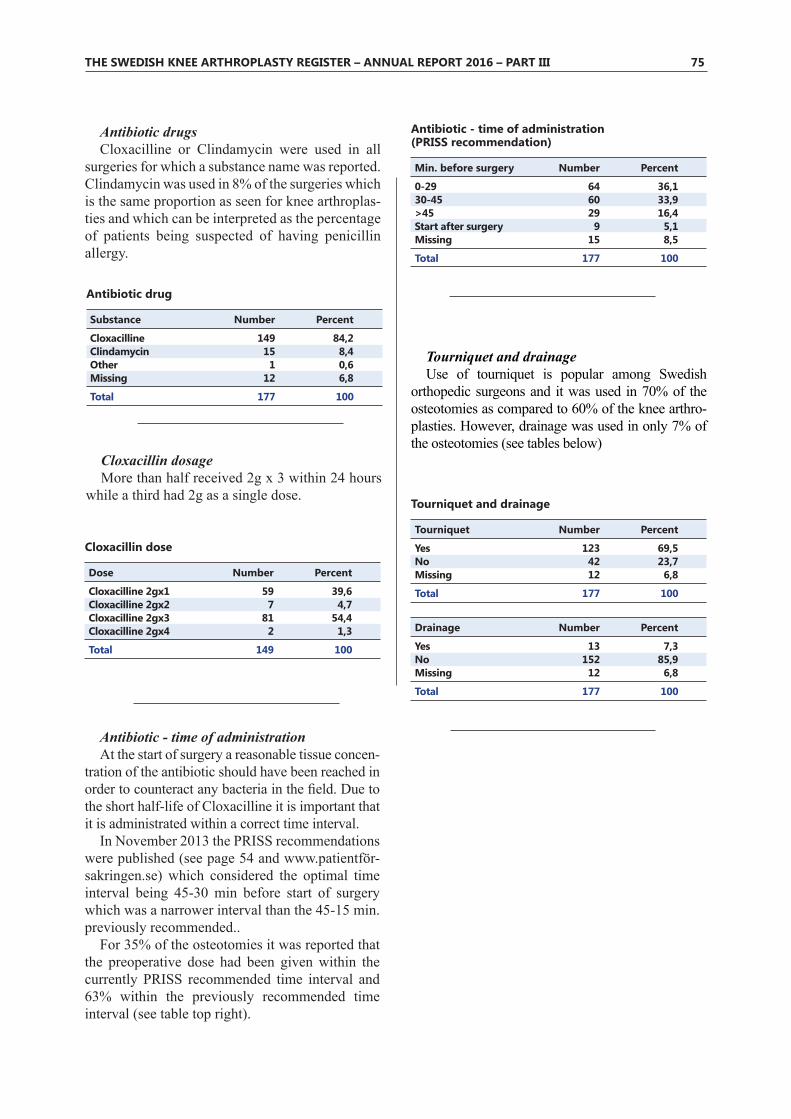
THE SWEDISH KNEE ARTHROPLASTY REGISTER – ANNUAL REPORT 2016 – PART III 75
Antibiotic drug
Substance Number Percent
Cloxacilline 149 84,2Clindamycin 15 8,4Other 1 0,6Missing 12 6,8
Total 177 100
Cloxacillin dose
Dose Number Percent
Cloxacilline 2gx1 59 39,6Cloxacilline 2gx2 7 4,7Cloxacilline 2gx3 81 54,4Cloxacilline 2gx4 2 1,3
Total 149 100
Antibiotic drugsCloxacilline or Clindamycin were used in all
surgeries for which a substance name was reported. Clindamycin was used in 8% of the surgeries which is the same proportion as seen for knee arthroplas-ties and which can be interpreted as the percentage of patients being suspected of having penicillin allergy.
Cloxacillin dosageMore than half received 2g x 3 within 24 hours
while a third had 2g as a single dose.
Antibiotic - time of administrationAt the start of surgery a reasonable tissue concen-
tration of the antibiotic should have been reached in order to counteract any bacteria in the field. Due to the short half-life of Cloxacilline it is important that it is administrated within a correct time interval.
In November 2013 the PRISS recommendations were published (see page 54 and www.patientför-sakringen.se) which considered the optimal time interval being 45-30 min before start of surgery which was a narrower interval than the 45-15 min. previously recommended..
For 35% of the osteotomies it was reported that the preoperative dose had been given within the currently PRISS recommended time interval and 63% within the previously recommended time interval (see table top right).
Antibiotic - time of administration(PRISS recommendation)
Min. before surgery Number Percent
0-29 64 36,130-45 60 33,9>45 29 16,4Start after surgery 9 5,1Missing 15 8,5
Total 177 100
Tourniquet and drainage
Tourniquet Number Percent
Yes 123 69,5No 42 23,7Missing 12 6,8
Total 177 100
Drainage Number Percent
Yes 13 7,3No 152 85,9Missing 12 6,8
Total 177 100
Tourniquet and drainageUse of tourniquet is popular among Swedish
orthopedic surgeons and it was used in 70% of the osteotomies as compared to 60% of the knee arthro-plasties. However, drainage was used in only 7% of the osteotomies (see tables below)

76 THE SWEDISH KNEE ARTHROPLASTY REGISTER – ANNUAL REPORT 2016
Patient ID: 12 digits (preferably stamp or stickers)
Hospital and hospital number:Should be pre-printed upper left. This implies the hospital were the operation was performed
/The hospital which is responsible Specified only if necessary beside the Hospital name.Only in the case of the operation being performed by the assign-ment of another hospital (to which the patients and surgeons belong to).
Date of surgery:Year-month-day
Side:Mark the side operated. If both knees are operated on, use two forms, one for each knee.
Primary arthroplasty:Mark “Yes” or “No”.Revision is defined as a surgery in which implant components are exchanged, added or removed. Note that this includes arthrodesis and amputation during which a previously inserted implant is removed.
Type of primary arthroplasty:Mark one alternative with the exception if more than one type of surgery is performed in the same knee (e.g. medial and lateral UKA).
Reason for primary arthroplasty:Mark the reason for the surgery or write the reason as free text.(OA = Osteoarthritis, RA = Rheumatoid arthritis)In the case of more than one reason, then indicate the main reason for the operation (e.g. underlining)
Previous surgery of the index knee (for primaries only):Mark ”No” or specify the type of surgery. Note that only previous surgeries, known by the surgeon at the time, are to be specified. It is not the intention that information is to be searched in old patient charts.
Type of revision:What has been performed during surgery. More than one alter-native can be chosen, or if necessary, written as a free text.
Reason for the revision:Mark the type of revision or write as free text. In the case of more than one reason, then indicate the main reason for the operation (e.g. underlining).
Implant name:Does not have to be specified if the implant stickers are attached to the back of the form.
Cemented partsMark the use of cement for relevant parts. Note that “stem” includes both fixed and modular stems.
Cement name:Instead of the name of the cement we prefer the stickers for the cement to be attached to the lower back of the form. If separate stickers are avialable for the mixing system please include them.
Bone transplantation:Mark “No” or use the relevant alternatives for the type of bone that has been use. Further mark the location in which the bone transplant was placed.
Navigation:Mark “Yes” or “No”. If Yes, specify what system was used (e.g. Aes-culap, Brain Lab). Preferably the model, if available.
Custom made instruments Mark “Yes” or “No” if the operation has been using instruments or saw blocks specially made for the patient based on MRI or CT.
MIS (Minimal Invasive Surgery):This implies a (small) arthrotomy used to gain access to the joint without the patella having to be everted. This is to be filled in for both TKA and UKA.
Drainage:Mark “Yes” or “No”, specifying if a surgical drain has been left in the knee or not.
Surgeon:The initials of the surgeon or his code. (Voluntary)
Anesthesia:Mark the type of anesthesia used (more than one is allowed if relevant)
Tourniquet:Mark “Yes” or “No”, specifying if a tourniquet was used during the whole, or a part of the operation.
LIA (local infiltration analgesia):Mark “Yes” or “No”. If Yes, specify if a catheter was left in the knee for a later injection.
Antithrombotic prophylaxis:Mark one of the three alternatives. If Yes, then also inform of the drug used, the dose (e.g. Klexane 40 mg x 1) as well as the planned length of treatment (e.g. 10 days).
Antibiotic prophylaxis:Mark “Yes” or “No”. In case of a prophylaxis being used, specify the name of the drug (e.g. Ekvacillin), the dose (e.g. 2g) and the number of times per day it is to be given. Specify the exact time at which the preoperative injection was started (e.g. 07:45). In case the injection was given after the operation started, then also specify the time. Finally, always state the planned length of treatment (e.g. 2 days).
ASA classification (American Society of Anaesthesiologists classification):
State the ASA class which the anesthesia staff recorded for the patient in the charts, prior to surgery.
Weight of the patient:State in kg.
Height of the patient:State in cm.
Start of surgery:The time when the knife goes through the skin (e.g. 11:35)
End of surgery:The time when closing of the skin was completed (ex. 13:15).
On the reverse side:Attach the stickers at their intended spot:The uppermost for the femoral components (e.g. stem, aug-ments, ..)The middle part for the tibial components (e.g. insert, stem, ..)The bottom part for cement and other components (patellar button, ..)
IN CASE OF REVISION:Do not forget to enclose a copy of the operation report and the discharge letter.
Instructions for filling out the SKAR form;

Previous surgery of the index knee:
0 No
2 Osteotomy
4 Cruciate lig. surgery
6 Other (what) ..................................................................................
1 Osteosynthesis
3 Menisceal surgery
5 Arthroscopy
Patient ID: (Unique social security number which includes date of birth)
Reason for the revision:If more than one reason, mark the main reason
1 Loosening (where) ...................................................................
2 Poly wear (where) .....................................................................
3 Fracture (periprosthetic)
4 Deep infection
5 Suspected infection
6 Instability (not of the patella)
7 Femoropatellar problem (pain, disclocation etc.)
8 Suboptimal situs of the previous implant
9 Other (what) ..............................................................................
Reason for primary arthroplasty:If more than one reason, mark the main reason
1 OA
2 RA
3 Fracture (recent (not older than 3 months))
4 Fracture sequelae (damage by earlier fracture)
5 Osteonecrosis
6 Other (what) ...................................................................................
The Swedish Knee Arthroplasty Register
Klinikgatan 22, Wigerthuset, floor 2Lund University Hospital
SE-221 85, LundPhone. +46-(0)46-171345
From: Hospital name (institution No.) / To be used when implant components are inserted, added, exchanged or removed
Side (in case of bilateral operation please use 2 forms, one for each side)
1 Left
2 Right
Date of surgery (y.m.d) 2 0
Type of revision:
1 Total exchange (all previously inserted components exchanged)
2 Exchange of Femoral component
3 Exchange of Tibial component
4 Exchange of Patellar button
5 Exchange of poly/insert
6 Total implant removal (all previously inserted components)
7 Removal of component(s) (what) ......................................
8 Addition of component(s) (what) ........................................
9 Arthrodesis
10 Amputation
11 Other (what) ..............................................................................
LIA: (local infiltration analgesia)
0 No
1Yes
2 Catheter left in knee (for later injection)
Tourniquet:
0 No
1 Yes
Antithrombotic prophylaxis:
0 No
1 Yes start pre-op.
2 Yes start post-op.Name:........................ dose:.................... no. per day:.........................
Planned length of treatment (days): ..............................................
Type of primary arthroplasty:
1 TKA incl. patella
2 TKA excl. patella
3 UKA Medial
4 UKA Lateral
5 Patello-femoral
6 Other (what)..............................
Cemented parts:Femur
1 Cemented
2 Not Cemented
Tibia
1 Cemented
2 Not Cemented
Patella
1 Cemented
2 Not Cemented
Femoral stem
1 Cemented
2 Not Cemented
Tibial stem
1 Cemented
2 Not Cemented
Surgeon (initials or code) : ...........................................................
Navigation:
0 No
1 Yes system used: ......................................
MIS: (minimally invasive surgery)
0 No
1 Yes
Primary arthroplasty
1 Yes
2 No
Prophylactic antibiotics:
0 No
1 Yes: Name:........................... dose:................ no. per day:..........
Start Preop.
0 No
1 Yes Time:............. : .............Planned length of treatment (days): ...............................................
Implant name: ...........................................................................(not needed when implant stickers are provided on the other side)
Cement / mixing system ..................................................(not needed when sticker(s) for the cement are provided on the other side)
ASA classification:(according to anesthesiologist)
1 2 3 4 5
Start of surgery (skin incision) Time: ............. : .............
End of surgery (skin closed) Time: ............. : .............
Weight (kg): ..................... Height: (cm): .....................
1 9
Drainage:
0 No
1 Yes
Bone transplantation:
0 No
1 Pat. own
2 Biobank
3 Synthetic bone (what)
....................................When used, the bone was used in the : Femur
0 No
1 Yes Tibia
0 No
1 Yes Patella
0 No
1 Yes
Remember to put stickers on the back !!! v 2011.2
Anesthesia:
1 General
2 Epidural
3 Spinal
4 Other .................
Custom Made Instruments:
0 No
1 Yes

78 THE SWEDISH KNEE ARTHROPLASTY REGISTER – ANNUAL REPORT 2016
Put stickers for parts used on femur here(femoral component, stem, augments ....)
Put other stickers here(cement, patellar button ....)
remember the cement sticker!
Put stickers for parts used on tibia here(tibia component, inlay, stem, augments ....)
In case of revision:Send a copy of op. report and discharge letter
78

THE SWEDISH KNEE ARTHROPLASTY REGISTER – ANNUAL REPORT 2016 79
Patient ID: 12 digits (preferably stamp or stickers)
Hospital and hospital number:Should be pre-printed upper left. This implies the hospital were the operation was performed
/The hospital which is responsible Specified only if necessary beside the Hospital name.Only in the case of the operation being performed by the assign-ment of another hospital (to which the patients and surgeons belong to).
Date of surgery:Year-month-day
Side:Mark the side operated. If both knees are operated on, use two forms, one for each knee.
Primary Osteotomy:Mark “Yes” or “No”.Revision is defined as a re-operation of a prevous osteotomy. However, knee arthroplasty is not to be reported on this form but on the arthroplasty form.
Type of primary knee osteotomy:Mark an alternative för the method/technique used.
Reason for the primary osteotomy:Mark the reason for the surgery or write the reason as free text.OA = Osteoarthritis. In the case of more than one reason, then indicate the main reason for the operation (e.g. underlining).
Preoperative HKA angle:Note the varus, respektive the valgus hip-kne-ankle angle as measured preoperatively on long X-rays.
Preoperative X-ray grading of OA:Note the preoperative X-ray grading of the osteoarthritis stage according to the Ahlbäck system.
Previous surgery of the index knee (for primaries only):Mark ”No” or specify the type of surgery. Note that only previous surgeries, known by the surgeon at the time, are to be specified. It is not the intention that information is to be searched in old patient charts.
Type of re-operation:Mark if the re-operation was re-osteotomy or removal of osteo-synthesismaterial and/or write som other surgery as a free text..
Reason for the revision:Mark the type of re-operation or write as free text. In the case of more than one reason, then indicate the main reason for the operation (e.g. underlining).
Name of the fixation:For external fixation provide the name of the intstrument and place any stickers concerning the pins on the back of the form.For nternal fixation a neme does not have to be specified if the iimplant stickers are attached to the back of the form.
Bone transplantation:Mark “No” or use the relevant alternatives for the type of bone that has been use. If a synthetic bone was used place any enclosed stickers on the back of the form.
Navigation:Mark “Yes” or “No”. If Yes, specify what system was used (e.g. Aes-culap, Brain Lab). Preferably the model, if available.
Angulation gauge/meter Write the name of any mechanical gauge that was used to evaluate the amount of correction during surgeryDrainage:
Mark “Yes” or “No”, specifying if a surgical drain has been left in the knee or not.
Other coincident surgery during the osteotomy:State what other surgery was performed at the same time as the osteotomy (e.g. arthroscopy, cruciat ligament reconstruction).
Surgeon:The initials of the surgeon or his code. (Voluntary)
Anesthesia:Mark the type of anesthesia used (more than one is allowed if relevant)
Tourniquet:Mark “Yes” or “No”, specifying if a tourniquet was used during the whole, or a part of the operation.
Antithrombotic prophylaxis:Mark one of the three alternatives. If Yes, then also inform of the drug used, the dose (e.g. Klexane 40 mg x 1) as well as the planned length of treatment (e.g. 10 days).
Antibiotic prophylaxis:Mark “Yes” or “No”. In case of a prophylaxis being used, specify the name of the drug (e.g. Ekvacillin), the dose (e.g. 2g) and the number of times per day it is to be given. Specify the exact time at which the preoperative injection was started (e.g. 07:45). In case the injection was given after the operation started, then also specify the time. Finally, always state the planned length of treatment (e.g. 2 days).
ASA classification (American Society of Anaesthesiologists classification):
State the ASA class which the anesthesia staff recorded for the patient in the charts, prior to surgery.
Weight of the patient:State in kg.
Height of the patient:State in cm.
Start of surgery:The time when the knife goes through the skin (e.g. 11:35)
End of surgery:The time when closing of the skin was completed (ex. 13:15).
On the reverse side:For any ostesynthesis material, pins and synthetic bone that was used during surgery, place enclosed stickers on the back of the form.
IN CASE OF REVISION:Do not forget to enclose a copy of the operation report and the discharge letter.
Instructions for filling out the Knee Osteotomy Register form;

80 THE SWEDISH KNEE ARTHROPLASTY REGISTER – ANNUAL REPORT 2016

Previous surgery of the index knee:
0 Nej
2 Fracture surgery
4 Cruciate lig. surgery
6 Other (what) ..................................................................................
1 Osteosynthesis
3 Menisceal surgery
5 Arthroscopy
Reason for re-operation:If more than one reason, mark the main reason
1 Loss of correction
2 Correction was to small
3 Correction was to large
4 Delayed healing
5 Pseudarthrosis
6 Other (what) ................................................................................
Reason for the primary knee osteotomyIf more than one reason, mark the main reason
1 OA medially
2 OA laterally
3 Congenital deformity
4 Acquired deformity (not OA)
5 Osteonecrosis.
6 Other (what) ...................................................................................
The Swedish Knee Osteotomy Register
Klinikgatan 22, Wigerthuset, floor 2Lund University Hospital
SE-221 85, LundPhone. +46-(0)46-171345
From: Hospital name (institution No.) / To be used for osteotomies around the knee
Type of re-operation:
1 Re-osteotomi
2 Removal of osteosynthesis material
3 Other type (what) .....................................................................
Type of primary knee osteotomy
1 Open wedge HTO - internal fixation
2 Open wedge HTO - external fixation
3 Closed wedge HTO
4 Curved / Dome HTO
5 Distal femur osteotomy
6 Other (what).............................................................................
Surgeon (initials or code) :............................................................
Navigation:
0 Yes
1 No what system .....................................
Name of the fixation: ..........................................................(ot needed when implant stickers are provided on the other side)
Drainage:
0 No
1 Yes
Bone transplantation:
0 No
1 Pat. own
2 Biobank
3 Synthetic bone (whatt)
....................................
v 1.0
Preoperative HKA angle: ............ º Varus ............ º Valgus
Preoperative X-ray grading of OA:
0 Ahlbäck 1
1 Ahlbäck 2
2 Ahlbäck 3
3 Ahlbäck 4
4 Ahlbäck 5
In case of revision:Send a copy of the op.report & discharge letter
Rememberstickers on the back side !!
Angulation guide:
0 Nej
1 Ja what...................................
Other coincident surgery
1 Arthroscopy
2 Cruciate ligament reconstruction
3 Other (what) ..............................................................................
Patient ID: (Unique social security number which includes date of birth)
1 9
Side (in case of bilateral operation please use 2 forms, one for each side)
1 Left
2 Right
Date of surgery (y.m.d) 2 0
Primary osteotomy
1 Yes
2 No
Tourniquet:
0 No
1 Yes
Antithrombotic prophylaxis:
0 No
1 Yes start pre-op.
2 Yes start post-op.Name:........................ dose:.................... no. per day:.........................
Planned length of treatment (days): ..............................................Prophylactic antibiotics:
0 No
1 Yes: Name:........................... dose:................ no. per day:..........
Start Preop.
0 No
1 Yes Time:............. : .............Planned length of treatment (days): ...............................................
ASA classification:(according to anesthesiologist)
1 2 3 4 5
Start of surgery (skin incision) Time: ............. : .............
End of surgery (skin closed) Time: ............. : .............
Weight (kg): ..................... Height: (cm): .....................
Anesthesia:
1 General
2 Epidural
3 Spinal
4 Other .................

Put stickers for inserted parts here(plates, screws bone substitute ....)

THE SWEDISH KNEE ARTHROPLASTY REGISTER – ANNUAL REPORT 2016 83
A - Surgical intervention codes If the codes occur during the first admission at a date ofter the primary surgery date or as the main intervention code at a later date
Exact code Starts with NFQ09 NGA.. NFQ19 NGC.. NFQ99 NGE.. NGB59* NGG.. NGF01 NGH.. NGF02 NGJ.. NGF10 NGL.. NGF11 NGS.. NGF12 NGU.. NGF91 NGW.. NGF92 QDB.. NGK09 QDG.. NGK19 NGM09 NGQ09 NGT09 NGT19 QDA10 QDE35 TNG05 TNG10 *enbart vid återinläggning
DA - Surgical diagnoses If the codes occur as a main- or secondary diagnosis during the first admission or as the main diagnosis at a later admission
Exact code Exact code
G978 T840 G979 T840G M966G T843 M968 T843G M969 T844 T810 T844G T812 T845 T813 T845G T814 T847 T815 T847G T816 T848 T817 T848G T818 T849 T818W T888 T819 T889
DB - Diagnoses for knee related events
Exact code Exact code
G573 M235 G574 M240 M000 M245 M000G M246 M002G M256 M008G M659G M009G M860G M220 M861G M221 M866 M236 M866G M244G M895G M621G M662G M663G M843G S342 S800 S810 S830 S831 S834L S834M S835R S835S S835X S840 S841
DC - Cardiovascular diagnoses If the codes occur as a main- or secondary diagnosis during the first admission or as the main diagnosis at a later admission
Exact code Starts with I260 I21.. I269 I24.. I460 I60.. I461 I61.. I469 I62.. I490 I63.. I649 I65.. I770 I66.. I771 I72.. I772 I74.. I819 I82.. I978 I979 J809 J819 T811
DM - Diagnoses for other medical events
Exact code Börjar på Exact code Börjar på
J952 L89 K590 J20.. J953 I80 N991 J21.. J955 J13 J22.. J958 J14 K29.. J959 J15 J981 J16 N990 J17 N998 J18 N999 K25 R339 K26 K27 N17
ICD10- and NOMESCO codes used for definition of unwanted events
If the codes occur as the main diagnosis after the first admission
If the codes occur as a main- or secondary diagnosis during the first admission or as a secondary diagnosis at a later admission
If the codes occur as the main diagnosis after the first admission
If the codes occur as a main- or secondary diagnosis during the first admission or as a secondary diagnosis at a later admission


THE SWEDISH KNEE ARTHROPLASTY REGISTER – ANNUAL REPORT 2016 85
Publications :
W-Dahl A, Robertsson O.Similar outcome for total knee arthroplasty after previous high tibial osteo-tomy and for total knee arthroplasty as the first measure.Acta Orthop. 2016 Aug;87(4):395-400
Nemes S1, Rolfson O, W-Dahl A, Garellick G, Sundberg M, Kärrholm J, Robertsson O.Historical view and future demand for knee arthroplasty in Sweden.Acta Orthop. 2015 Aug;86(4):426-31
Stucinskas J, Robertsson O, Sirka A, Lebedev A, Wingstrand H, Tarasevicius S.Acta Orthop. 2015 Jun 10:1-6. [Epub ahead of print]Moderate varus/valgus malalignment after total knee arthroplasty has little effect on knee function or muscle strength.
Holmberg A, Thórhallsdóttir VG, Robertsson O, W-Dahl A, Stefánsdóttir A.75% success rate after open debridement, exchange of tibial insert, and antibio-tics in knee prosthetic joint infections.Acta Orthop. 2015 Mar 9:1-6.
Robertsson O, W-Dahl A.The Risk of Revision After TKA Is Affected by Previous HTO or UKA.Clin Orthop Relat Res. 2015; 473(1): 90-9.
Comfort T, Baste V, Froufe MA, Namba R, Bordini B, Robertsson O, Cafri G, Paxton E, Sedrakyan A, Graves S.International comparative evaluation of fixed-bearing non-posterior-stabilized and posterior-stabilized total knee replacements.J Bone Joint Surg Am. 2014 Dec 17;96 Suppl 1:65-72
Graves S, Sedrakyan A, Baste V, Gioe TJ, Namba R, Martínez Cruz O, Stea S, Paxton E, Banerjee S, Isaacs AJ, Robertsson O.International comparative evaluation of knee replacement with fixed or mobile-bearing posterior-stabilized prostheses.J Bone Joint Surg Am. 2014 Dec 17;96 Suppl 1:59-64
Namba R, Graves S, Robertsson O, Furnes O, Stea S, Puig-Verdié L, Hoeffel D, Cafri G, Paxton E, Sedrakyan A.International comparative evaluation of knee replacement with fixed or mobile non-posterior-stabilized implants.J Bone Joint Surg Am. 2014 Dec 17;96 Suppl 1:52-8
W-Dahl A, Lidgren L, Sundberg M, Robertsson O.Introducing prospective national registration of knee osteotomies. A report from the first year in Sweden.Int Orthop. 2015 Jul;39(7):1283-8. Epub 2014 Dec 14.
W-Dahl A, Sundberg M, Lidgren L, Ranstam J, Robertsson O.An examination of the effect of different methods of scoring pain after a total knee replacement on the number of patients who report unchanged or worse pain.Bone Joint J. 2014 Sep;96-B(9):1222-6.
Tarasevičius S, Cebatorius A, Valavičienė R, Stučinskas J, Leonas L, Robertsson O.First outcome results after total knee and hip replacement from the Lithuanian arthroplasty register.Medicina (Kaunas). 2014;50(2):87-91
Robertsson O, Ranstam J, Sundberg M, W-Dahl A, Lidgren L.The Swedish Knee Arthroplasty Register: a review.Bone Joint Res. 2014 Jul;3(7):217-22
Stefánsdottir A, Andersson AE, Karlsson IH, Staaf A, Stenmark S, Tammelin A.Erfarenheter av PRISS-projektet: Infektionsförebyggande arbete kan aldrig avslutasLäkartidningen. 2014;111:CZIS.
Gudnason A, Hailer NP, W-Dahl A, Sundberg M, Robertsson O.All-Polyethylene Versus Metal-Backed Tibial Components-An Analysis of 27,733 Cruciate-Retaining Total Knee Replacements from the Swedish Knee Arthroplasty Register.J Bone Joint Surg Am. 2014 Jun 18;96(12):994-999.
Ali A, Sundberg M, Robertsson O, Dahlberg LE, Thorstensson CA, Redlund-Joh-nell I, Kristiansson I, Lindstrand ADissatisfied patients after total knee arthroplasty: a registry study involving 114 patients with 8-13 years of followup.Acta Orthop. 2014 Jun;85(3):229-33.
Borgquist L, W-Dahl A, Dale H, Lidgren L, Stefánsdóttir A.Prosthetic joint infections - a need for health economy studiesActa Orthp. 2014; 85 (3):1–3. Guest Editorial.
Lidgren L, Gomez-Barrena E, Duda GN, Puhl W, Carr AEuropean musculoskeletal health and mobility in Horizon 2020 - SETTING PRIORITIES FOR MUSCULOSKELETAL RESEARCH AND INNOVATIONBone Joint Res 2014;3:48–50. Editorial.
Parvizi J, Ghanem E, Heppert V, Spangehl M, Abraham J, Azzam K, Barnes L, Burgo FJ, Ebeid W, Goyal N, Guerra E, Hitt K, Kallel S, Klein G, Kosashvili Y, Levine B, Matsen L, Morris MJ, Purtill JJ, Ranawat C, Sharkey PF, Sierra R, Ste-fansdottir A.Wound Management.J Arthroplasty. 2014 Feb;29(2 Suppl):84-92
Parvizi J, Hansen E, Belden K, Silibovsky R, Vogt M, Arnold WV, Bicanic G, Bini SA, Catani F, Chen J, Ghazavi MT, Godefroy KM, Holham P, Hosseinzadeh H, Kim KI, Kirketerp-Møller K, Lidgren L, Lin JH, Lonner JH, Moore CC, Papagelo-poulos P, Poultsides L, RaPerioperative AntibioticsJ Arthroplasty. 2014 Feb;29(2 Suppl):29-48.
Lazarinis S, Lidgren L, Stefánsdóttir A, W-Dahl A.Consensus document on prosthetic joint infections.Acta Orthop. 2013 Dec;84(6):507-8
Stefánsdóttir A, Garland A, Gustafson P, SchultzPRISS Samarbete för säkrare protesoperationerOrtopediskt Magasin. 2013, 4:34-36.
Robertsson O, W-Dahl A, Sundberg M, Knutson K.Svenska Knäartroplastikregistret – en berättelse om det första kvalitetsregistretIn: Ledord Ortopedi Reumatologi. Sydsvenska Medicinhistoriska Sällskapets årsskrift 2013. (Ed. Persson BEB, Lidgren L, Saxne T).Elvins Grafiska AB, Hel-singborg.
Lidgren LOrtopedi i Lund och MalmöIn: Ledord Ortopedi Reumatologi. Sydsvenska Medicinhistoriska Sällskapets årsskrift 2013. (Ed. Persson BEB, Lidgren L, Saxne T).Elvins Grafiska AB, Hel-singborg.
Lidgren L, Saxne TFörord: Ledord Ortopedi ReumatologiIn: Ledord Ortopedi Reumatologi. Sydsvenska Medicinhistoriska Sällskapets årsskrift 2013. (Ed. Persson BEB, Lidgren L, Saxne T).Elvins Grafiska AB, Hel-singborg.
Lohmander SLKnee replacement for osteoarthritis: facts, hopes, and fears.Medicographia 2013; 34:181-188.
Gustafson P, Schults T, Stefánsdóttir A.PRISS – Protesrelaterade Infektioner Ska Stoppas – ett nationellt tvärprofessio-nellt samarbete för säkrare protesinfektioner i knä och höft. Slutrapport(Ed. Gustafson P, Schultz T och Stefánsdóttir A). Patientförsäkringen LÖF (Landstingens Ömsesidiga Försäkringsbolag). Ljungbergs Tryckeri AB, januari 2014.
W-Dahl A, Bundesen I-M, Rydén C, Staaf A, Stefánsdóttir A, Östgaard HC.Profylaktiskt antibiotikum vid elektiv knä- och höftprotesoperation. Slutrap-port från expertgrupp 2 PRISS-projektet.
Ricciardi BF, Bostrom MP, Lidgren L, Ranstam J, Merollini KMD, W-Dahl A.Prevention of Surgical Site Infection in Total Joint Arthroplasty: An Internatio-nal Tertiary Care Center Survey.HSS Journal. 2013 Dec (e-pub).
Lazarinis S, Lidgren L, Stefánsdóttir A, W-Dahl A.Consensus document on prosthetic joint infectionsActa Orthop. 2013 Dec;84(6):507-8.
Dunbar MJ, Richardson G, Robertsson O.I can’t get no satisfaction after my total knee replacement: rhymes and reasons.Bone Joint J. 2013 Nov 1;95-B(11 Suppl A):148-52
Juréus J, Lindstrand A, Geijer M, Robertsson O, Tägil M. The natural course of spontaneous osteonecrosis of the knee (SPONK)Acta Orthop. 2013 Jun 25 [Epub ahead of print].
Stefánsdóttir A, Johansson A, Lidgren L, Wagner P, W-Dahl ABacterial colonization and resistance patterns in 133 patients undergoing a pri-mary hip- or knee replacement in Southern Sweden.Acta Orthop. 2013 Feb;84(1):87-91

86 THE SWEDISH KNEE ARTHROPLASTY REGISTER – ANNUAL REPORT 2016
Lidgren L, Alriksson-Schmidt A, Ranstam JArthroplastyWatch--beyond borders, beyond compliance.BMJ. 2013 Feb 19;346:f1013.
Wagner P, Olsson H, Ranstam J, Robertsson O, Zheng MH, Lidgren L.Metal-on-metal joint bearings and hematopoetic malignancy.Acta Orthop. 2012 Dec;83(6):553-8
W-Dahl A, Robertsson O, Lohmander LS.High tibial osteotomy in Sweden, 1998-2007: a population-based study of the use and rate of revision to knee arthroplasty.Acta Orthop. 2012 Jun;83(3):244-8.
Carr AJ, Robertsson O, Graves S, Price AJ, Arden NK, Judge A, Beard DJ. Knee replacement.Lancet. 2012 Apr 7;379(9823):1331-40. Review.
Robertsson O, Mendenhall S, Paxton EW, Inacio MCS, Graves SE.Challenges in Prosthesis Classification.J Bone Joint Surg Am. 2011;93 Suppl 3(E):72-5.
Namba RS, Inacio MC, Paxton EW, Robertsson O, Graves SE.The role of registry data in the evaluation of mobile-bearing total knee arthroplasty.J Bone Joint Surg Am. 2011 Dec 21;93 Suppl 3:48-50.
Havelin LI, Robertsson O, Fenstad AM, Overgaard S, Garellick G, Furnes O.A Scandinavian Experience of Register Collaboration: The Nordic Arthro-plasty Register Association (NARA).J Bone Joint Surg Am. 2011;93 Suppl 3(E):13-9.
Ranstam J, Robertsson O, W-Dahl A, Löfvendahl S, Lidgren L.EQ-5D – ett svårtolkat instrument för kliniskt förbättringsarbete. Läkartidningen 2011; 108 (36): 1707-8.
W-Dahl A, Robertsson O, Stefánsdóttir A, Gustafson P, Lidgren L.Timing of preoperative antibiotics for knee arthroplasties: Improving the routines in Sweden.Patient Saf Surg. 2011 Sep 19;5:22.
Ranstam J, Kärrholm J, Pulkkinen P, Mäkelä K, Espehaug B, Pedersen AB, Mehnert F, Furnes O; NARA study group.Statistical analysis of arthroplasty data. II. Guidelines.Acta Orthop. 2011 Jun;82(3):258-67
Ranstam J, Kärrholm J, Pulkkinen P, Mäkelä K, Espehaug B, Pedersen AB, Mehnert F, Furnes O; NARA study group.Statistical analysis of arthroplasty data. I. Introduction and background.Acta Orthop. 2011 Jun;82(3):253-
Korosh Hekmat, Lennart Jacobsson, Jan-Åke Nilsson, Ingemar F Petersson, Otto Robertsson, Göran Garellick and Carl Turesson.Decrease in the incidence of total hip arthroplasties in patients with rheu-matoid arthritis – results from a well-defined population in south Sweden.Arthritis Res Ther. 2011 Apr 21;13(2):R67.
Wagner P, Olsson H, Lidgren L, Robertsson O, Ranstam J.Increased cancer risks among arthroplasty patients: 30year follow-up of the Swedish Knee Arthroplasty Register.Eur J Cancer. 2011 May;47(7):1061-71.
Jämsen E, Furnes O, Engesaeter LB, Konttinen YT, Odgaard A, Ste-fánsdóttir A, Lidgren LPrevention of deep infection in joint replacement surgery.Acta Orthop. 2010 Dec;81(6):660-6. Review.
W-Dahl A, Robertsson O, Lidgren L.Surgery for knee osteoarthritis in younger patients.Acta Orthop. 2010 Apr;81(2):161-4.
W-Dahl A, Robertsson O, Lidgren L, Miller L, Davidson D, Graves S.Unicompartmental knee arthroplasty in patients aged less than 65.Acta Orthop. 2010 Feb;81(1):90-4.
Robertsson O, Bizjajeva S, Fenstad AM, Furnes O, Lidgren L, Meh-nert F, Odgaard A, Pedersen AB, Havelin LI.Knee arthroplasty in Denmark, Norway and Sweden.Acta Orthop. 2010 Feb;81(1):82-9.
Ranstam J, Robertsson O.Statistical analysis of arthroplasty register data.Acta Orthop. 2010 Feb;81(1):10-4.
Knutson K, Robertsson O.The Swedish Knee Arthroplasty Register (www.knee.se).Acta Orthop. 2010 Feb;81(1):5-7.
Stefánsdóttir A, Robertsson O, W-Dahl A, Kiernan S, Gustafsson P, Lidgren L.Inadequate timing of prophylactic antibiotics in ortho paedic sur-gery: We can do better.Acta Orthop. 2009 Dec;80(6):633-8.
Stefánsdóttir A, Johansson D, Knutson K, Lidgren L, Robertsson O.Microbiology of the infected knee arthroplasty. Report from the Swedish Knee Arthroplasty Register on 426 surgically revised cases.Scand J Infect Dis. 2009;41(11-12):831-840
Tarasevicius S, Stucinskas J, Robertsson O, Wingstrand H.Introduction of total knee arthroplasty in Lithuania: Results from the first 10 years.Acta Orthop. 2009 Feb;80(1):51-4
Stefánsdóttir A, Lidgren L, Robertsson O. Higher Early Mortality with Simultaneous Rather than Staged Bila-teral TKAs: Results From the Swedish Knee Arthroplasty Register. Clin Orthop Relat Res 2008; 466: 3066-3070.
Lidgren L, Robertsson O. Wear and joint registers: Can national joint implant registers detect unexpected tribological failures? Tribos Newsletter 2008; Nr 4: 4-5.
Ranstam J, Wagner P, Robertsson O, Lidgren L. Healthcare quality registers: outcome-oriented ranking of hospitals is unreliable. J Bone Joint Surg (Br) 2008;90-B:1558-61
Ranstam J, Wagner P, Robertsson O, Lidgren L.Ranking in health care results in wrong conclusions.Lakartidningen 2008; Aug 27-Sep 2;105 (35): 2313-4.
Robertsson O and Lidgren L.The short-term results of 3 common UKA implants during different time periods in Sweden. J Arthroplasty 2008 Sep; 23 (6): 801-7.
Lidgren L.Chronic inflammation, joint replacement and malignant lymphoma.J Bone Joint Surg Br 2008 Jan; 90 (1): 7-10.
Robertsson O.Knee Arthroplasty Registers. Review. J Bone Joint Surg (Br) 2007; 89-B: 1-4.
Robertsson O, Stefánsdóttir A, Ranstam J, Lidgren L.Increased long-term mortality in patients less than 55 years old who have undergone knee replacement for osteoarthritis. J Bone Joint Surg (Br) 2007 ; 89-B: 599-603.
Robertsson O, Ranstam J and Lidgren L.Variation in outcome and issues in ranking hospitals: An analysis from the Swedish Knee Arthroplasty Register.Acta Orthop 2006 Jun;77 (3): 487-93.
Bremander AB, Dunbar M, Knutson K, Petersson I F, Robertsson O.Revision in previously satisfied knee arthroplasty patients is the result of their call on the physician, not on pre-planned follow-up: A retrospective study of 181 patients who underwent revision within 2 years.Acta Orthop 2005 Dec; 6 (76): 785-90
Lidgren L, Robertson O.Acrylic bone cements: clinical developments and current status: Scandinavia.Orthop Clin North Am 2005 Jan; 36( 1): 55-61. vi. Review.
Harrysson O L, Robertsson O, Nayfeh J F.Higher Cumulative Revision Rate of Knee Arthroplasties in Younger Patients with Osteoarthritis.Clin Orthop 2004 Apr; 1 (421): 162-168.

THE SWEDISH KNEE ARTHROPLASTY REGISTER – ANNUAL REPORT 2016 87
Dunbar M J, Robertsson O, Ryd L.What’s all that noise? The effect of co-morbidity on health outcome questionnaire results after knee arthroplasty.Acta Orthop Scand 2004 Apr; 75 (2): 119-26.
Robertsson O, Ranstam J.No bias of ignored bilaterality when analysing the revision risk of knee prostheses: analysis of a population based sample of 44,590 patients with 55,298 knee prostheses from the national Swedish Knee Arthroplasty Register.BMC Musculoskelet Disord 2003 Feb 05; 4 (1): 1.
Lidgren L.Arthroplasty and its complications.In: Rheumatology, 3rd edition (Ed. Hochberg M C, Silman A J, Smolen J S, Weinblatt M E, Weissman M H). Mosby 2003; 1055-1065.
Lidgren L, Knutson K, Stéfansdóttir A.Infection of prosthetic joints. Best Pract Res Clin Rheumatol 2003; 17 (2): 209-218.
Lidgren L.Arthroplasty and its complications.In: Osteoarthritis, 2nd ed. (Eds. Brandt K D, Doherty M, Lohmander L S). Oxford Univerity Press, 2003; 9.19: 361-70.
Robertsson O, Knutson K.Knee arthroplasty registers. Prothéses totales du genou. Ed. by Roger Lemaire and Jacques Wit-voet.Éditions scientifiques et médicales Elsevier SAS, 2002.
Dunbar M J, Robertsson O, Ryd L, Lidgren L.Appropriate Questionnaires for Knee Arthroplasty.J Bone Joint Surg [Br] 2001; 83-B: 339-44.
Knutson K.Arthroplasty and its complications. In: Osteoarthritis 2nd ed (Eds. Brandt K D, Doherty M, Lomander LS).Oxford University Press 2001;
Lindstrand A, Robertsson O, Lewold S, Toksvig-Larsen S.The patella in total knee arthroplasty: resurfacing or non-resurfa-cing of patella.Knee Surg Sports Traumatol Arthrosc 2001; 9 Suppl 1: S21-3.
Robertsson O, Knutson K, Lewold S, Lidgren L.The Swedish Knee Arthroplasty Register 1975-1997: an update with special emphasis on 41,223 knees operated on in 1988-1997.Acta Orthop Scand 2001; Oct;72 (5): 503-13.
Robertsson O, Knutson K, Lewold S, Lidgren L. The routine of surgical management reduces failure after uni-compartmental knee arthroplasty.J Bone Joint Surg [Br] 2001; 83-B: 45-9.
Robertsson O, Dunbar M J.Patient satisfaction compared with general health and disease-spe-cific questionnaires in knee arthroplasty patients.J Arthroplasty 2001 Jun;16 (4): 476-82.
Dunbar M J, Robertsson O, Ryd L, Lidgren L.Translation and validation of the Oxford-12 item knee score for use in Sweden.Acta Orthop Scand 2000 Jun; 71 (3): 268-74.
Robertsson O, Scott G and Freeman MAR.Ten-year survival of the cemented Freeman-Samuelson primary knee arthroplasty. Data from the Swedish Knee Arthroplasty Regis-ter and the Royal London Hospital.J Bone Joint Surg [Br] 2000 May;82(4):506-7.
Robertsson O, Lewold S, Knutson K, Lidgren L.The Swedish Knee Arthroplasty Project. Acta Orthop Scand 2000 Jun; 71 (1): 7-18.
Robertsson O, Dunbar M J, Knutson K, Lidgren L.Past incidence and future need for knee arthroplasty in Sweden.
A report from the Swedish Knee Arthroplasty Register regarding the affect of past and future population changes on the number of arthroplasties performed. Acta Orthop Scand 2000; 71 (4): 376-80.
Robertsson O, Dunbar MJ, Knutson K, Lidgren L.Patient satisfaction after knee arthroplasty: a report on 27,372 knees operated on between 1981 and 1995 in Sweden.Acta Orthop Scand 2000 Jun; 71 (3): 262-7
Robertsson O.Unicompartmental arthroplasty. Results in Sweden 1986-1995.Orthopäde 2000 Jun;29 Suppl 1:S6-8
Sandmark H, Hogstedt C, Vingard E.Primary osteoarthrosis of the knee in men and women as a result of lifelong physical load from work.Scand J Work Environ Health. 2000 Feb;26(1):20-5.
Lidgren L, Lohmander L S.Knäartros [Arthrosis of the knee]. Socialstyrelsens faktadatabas, : 1999.
Robertsson O, Borgquist L, Knutson K, Lewold S, Lidgren L.Use of unicompartmental instead of tricompartmental prosthe-ses for unicompartmental arthrosis in the knee is a cost-effective alternative. 15,437 primary tricompartmental prostheses were compared with 10,624 primary medial or lateral unicompartmental prostheses.Acta Orthop Scand 1999; 70 (2): 170-5.
Robertsson O, Dunbar M J, Knutson K, Lewold S, Lidgren L.Validation of the Swedish Knee Arthroplasty Register: a postal survey regarding 30,376 knees operated on between 1975 and 1995.Acta Orthop Scand 1999; 70 (5): 467-72.
Robertsson O, Dunbar M J, Knutson K, Lewold S, Lidgren L.The Swedish Knee Arthroplasty Register: 25 Years Experience. Bulletin Hospital for Joint Diseases 1999; 58 (3): 133-8.
Sandmark H, Högstedt C, Lewold S, Vingard E.Osteoarthrosis of the knee in men and women in association with overweight, smoking, and hormone therapy.Ann Rheum Dis 1999; 58 (3): 151-5.
Sandmark H, Vingard E .Sports and risk for severe osteoarthrosis of the knee. Scand J Med Sci Sports 1999; Oct;9 (5): 279-84.
Knutson K.Arthroplasty and its complications. In: Osteoarthritis 1st ed (Eds. Brandt K D, Doherty M, Lomander LS).Oxford University Press 1998; 9.17: 388-402.
Lewold S, Robertsson O, Knutson K, Lidgren L.Revision of unicompartmental knee arthroplasty: outcome in 1,135 cases from the Swedish Knee Arthroplasty study.Acta Orthop Scand 1998; 69 (5): 469-74.
Blunn G W, Joshi A B, Minns R J, Lidgren L, Lilley P, Ryd L, Engel-brecht E, Walker P S.Wear in retrieved condylar knee arthroplasties. A comparison of wear in different designs of 280 retrieved condylar knee prostheses.J Arthroplasty 1997; 12 (3): 281-90.
Knutson K, Lewold S, Lidgren L, Robertsson O. Knie-TEP Revisionseingriffe. Lösungsmöglichkeiten bei Beschwer-den nach Implantation einer KnieendoprotheseGeorg Thieme verlag 1997; ISBN 3-13-104711-9: 107-12
Robertsson O, Knutson K, Lewold S, Goodman S, Lidgren L.Knee arthroplasty in rheumatoid arthritis. A report from the Swe-dish Knee Arthroplasty Register on 4,381 primary operations 1985-1995.Acta Orthop Scand 1997; 68 (6): 545-53.
Robertsson O, Knutson K, Lewold S, Goodman S, Lidgren L. Selected Scientific Exhibits - Knee arthroplasty in rheumatoid arthritis.Archives of the American Academy of Orthopaedic Surgeons 1997; 1 (1): 44-50.

88 THE SWEDISH KNEE ARTHROPLASTY REGISTER – ANNUAL REPORT 2016
Stenström S, Lindstrand A, Lewold S.Unicompartmental knee arthroplasty with special reference to the Swedish Knee Arthroplasty Register.Cahiers d´enseignement de la SOFCOT 1997 ; 159-62.
Lewold S, Olsson H, Gustafson P, Rydholm A, Lidgren L.Overall cancer incidence not increased after prosthetic knee repla-cement: 14,551 patients followed for 66,622 person-years.Int J Cancer 1996; 68 (1): 30-3.
Toksvig-Larsen S, Ryd L, Stentström A, Dansgard F, Jonsson K, Robertsson O, Lindstrand A.The Porous-Coated Anatomic total knee experience. Special emp-hasis on complications and wear.J Arthroplasty 1996; 11 (1): 11-7.
Lewold S, Goodman S, Knutson K, Robertsson O, Lidgren L.Oxford meniscal bearing knee versus the Marmor knee in uni-compartmental arthroplasty for arthrosis. A Swedish multicenter survival study.J Arthroplasty 1995; 10 (6): 722-31.
Knutson K, Lewold S, Robertsson O, Lidgren L.The Swedish knee arthroplasty register. A nation-wide study of 30,003 knees 1976-1992.Acta Orthop Scand 1994; 65 (4): 375-86.
Lidgren L.Low virulent bacteria in joint implant infection. Zentralblatt für Bakteriologie 1994; Suppl 27: 363-7.
Lewold S, Knutson K, Lidgren L.Reduced failure rate in knee prosthetic surgery with improved implantation technique.Clin Orthop 1993; (287): 94-7.
Blunn G W, Joshi A B, Lilley P A, Engelbrecht E, Ryd L, Lidgren L, Hardinge K, Nieder E, Walker P S.Polyethylene wear in unicondylar knee prostheses. 106 retrieved Marmor, PCA, and St Georg tibial components compared.Acta Orthop Scand 1992; 63 (3): 247-55.
Goodman S, Lidgren L.Polyethylene wear in knee arthroplasty. A review. Acta Orthop Scand 1992; 63 (3): 358-64.
Lindstrand A, Stenstrom A, Lewold S.Multicenter study of unicompartmental knee revision. PCA, Marmor, and St Georg compared in 3,777 cases of arthrosis.Acta Orthop Scand 1992; 63 (3): 256-9.
Bengtson S, Knutson K.The infected knee arthroplasty. A 6-year follow-up of 357 cases.Acta Orthop Scand 1991; 62 (4): 301-11.
Odenbring S, Egund N, Knutson K, Lindstrand A, Toksvig-Larsen S.Revision after osteotomy for gonarthrosis. A 10-19-year follow-up of 314 cases.Acta Orthop Scand 1990; 61 (2): 128-30.
Bengtson S, Knutson K, Lidgren L.Treatment of infected knee arthroplasty.Clin Orthop 1989; (245): 173-8.
Bengtson S, Carlsson A, Relander M, Knutsson K, Lidgren L.Prothèse du genou exposèe - traitement. [An exposed knee pros-thesis--treatment]. Rev Chir Orthop Reparatrice Appar Mot 1988; 74 (Suppl 2): 322-3.
Bengtson S, Borgquist L, Lidgren L.Cost analysis of prophylaxis with antibiotics to prevent infected knee arthroplasty.British Medical Journal 1989; 299 (6701): 719-20.
Bengtson S, Carlsson A, Relander M, Knutson K, Lidgren L.Treatment of the exposed knee prosthesis.Acta Orthop Scand 1987; 58 (6): 662-5.
Bengtson S, Blomgren G, Knutson K, Wigren A, Lidgren L.Hematogenous infection after knee arthroplasty.Acta Orthop Scand 1987; 58 (5): 529-34.
Rööser B, Boegard T, Knutson K, Rydholm U, Lidgren L.Revision knee arthroplasty in rheumatoid arthritis.Clin Orthop 1987; (219): 169-73.
Bengtson S, Knutson K, Lidgren L.Revision of infected knee arthroplasty.Acta Orthop Scand 1986; 57 (6): 489-94.
Knutson K, Lindstrand A, Lidgren L.Survival of knee arthroplasties. A nation-wide multicentre investi-gation of 8000 cases.J Bone Joint Surg (Br) 1986 ; 68 (5): 795-803.
Rosenqvist R, Bylander B, Knutson K, Rydholm U, Rooser B, Egund N, Lidgren L.Loosening of the porous coating of bicompartmental prostheses in patients with rheumatoid arthritis.J Bone Joint Surg (Am) 1986; 68 (4): 538-42.
Knutson K, Lindstrand A, Lidgren L.Arthrodesis for failed knee arthroplasty. A report of 20 cases.J Bone Joint Surg (Br) 1985; 67 (1): 47-52.
Knutson K, Tjörnstrand B, Lidgren L.Survival of knee arthroplasties for rheumatoid arthritis.Acta Orthop Scand 1985; 56 (5): 422-5.
Rydholm U, Boegard T, Lidgren L.Total knee replacement in juvenile chronic arthritis.Scand J Rheumatol 1985; 14 (4): 329-35.
Tjörnstrand B, Lidgren L.Fracture of the knee endoprosthesis. Report of three cases of tibial component failure.Acta Orthop Scand 1985; 56 (2): 124-6.
Boegard T, Brattström H, Lidgren L.Seventy-four Attenborough knee replacements for rheumatoid arthritis. A clinical and radiographic study.Acta Orthop Scand, 55(2): 166-71, 1984.
Knutson K, Bodelind B, Lidgren L.Stability of external fixators used for knee arthrodesis after failed knee arthroplasty.Clin Orthop 1984; (186): 90-5.
Knutson K, Hovelius L, Lindstrand A, Lidgren L.Arthrodesis after failed knee arthroplasty. A nationwide multicen-ter investigation of 91 cases.Clin Orthop 1984; (191): 202-11.
Knutson K, Leden I, Sturfelt G, Rosen I, Lidgren L.Nerve palsy after knee arthroplasty in patients with rheumatoid arthritis.Scand J Rheumatol 1983; 12 (3): 201-5.
Knutson K, Lidgren L.Arthrodesis after infected knee arthroplasty using an intramedul-lary nail. Reports of four cases. Arch Orthop Trauma Surg 1982; 100 (1): 49-53.
Blader S, Knutson K, Surin V.[Swedish experience with total endoprostheses of the knee (author’s transl)]. Acta Chir Orthop Traumatol Cech 1981; 48 (3): 234-41.
Knutson K, Jonsson G, Langer Andersen J, Lárusdottir H, Lidgren L. Deformation and loosening of the tibial component in knee arthro-plasty with unicompartmental endoprostheses. Acta Orthop Scand 1981; 52 (6): 667-73.
Jonsson G, Knutson K, Lidgren L, Lindstrand A.Knäartrodes [Knee joint arthrodesis]. Läkartidningen 1980; 77 (22): 2115-7.

THE SWEDISH KNEE ARTHROPLASTY REGISTER – ANNUAL REPORT 2016 89

90 THE SWEDISH KNEE ARTHROPLASTY REGISTER – ANNUAL REPORT 2016 – PART II
The Svedish Knee Arthroplasty Registerwww.knee.se
www.gangbar.se
Annual Report 2016
ManagerOtto Robertsson, MD, PhD
Deputy ManagerAnnette W-Dahl, RN, associate professor
Register holderMartin Sundberg, MD, associate professor
Register AssociatesAnna Stefánsdóttir, MD, PhD
Kaj Knutson, MD, associate professorLars Lidgren, MD, professor
Project SecretaryCatharina Nilsson
Consulting StatisticiansJonas Ranstam, CStat, biostatistician, Ystad
Tomasz Czuba, MSc, RC Syd
Steering groupMartin Sundberg,MD, associate professor, Skåne University Hospital, Lund
Ingela Adler, patient representantive. The Swedish Rheumatism AssociationJohan Kärrholm, MD, professor, Sahlgrenska University Hospital, Göteborg
Helene Andersson Molina, MD, Vinnevrisjukhuset, NorrköpingKjell G. Nilsson, MD, professor, Norrland University Hospital, Umeå
Jonas Ranstam, CStat, independent biostatistician, YstadOtto Robertsson, MD, PhD, Skåne University Hospital, Lund
Annette W-Dahl, RN, associate professor, Skåne University Hospital, LundAnna Wilhelmsson Sahlin, physiotherapist, Skåne University Hospital
Per Wretenberg, professor, Örebro University Hospital
Visiting addressKlinikgatan 22, Wigerthuset, 2nd floor
Skånes University Hospital, Lund, SE-221 85.
Phone: +46-(0)46-171345, e-mail: [email protected]
Copyright © 2016
ISBN 978-91-88017-12-3