agricultural development in ethiopia: are …€¦ · agricultural development in ethiopia ......
TRANSCRIPT

AGRICULTURAL DEVELOPMENT IN ETHIOPIA: ARE THERE ALTERNATIVES TO FOOD AID?
BY
MULAT DEMEKE FANTU GUTA
TADELE FEREDE DEPARTMENT OF ECONOMICS
ADDIS ABABA UNIVERSITY
ADDIS ABABA ETHIOPIA
OCTOBER, 2004
Table of Contents List of Tables............................................................................................................................................ i List of Figures ......................................................................................................................................... ii SECTION ONE: INTRODUCTION AND BACKGROUND............................................................... 1
1.1 Description of the Problem...............................................................................................1 1.2 Objectives of the Study ....................................................................................................2 1.3 Methodology of the Study and Data Sources ...................................................................2 1.4 Organization of the Study.................................................................................................2
SECTION TWO: DESCRIPTION AND ANALYSIS OF FOOD SECURITY SITUATION............... 3 2.1 Description and Analysis of Food Supply and Demand ..................................................3 2.3 Determinants of Food Consumption in Rural Ethiopia....................................................6 2.4 Food Gap and Food Aid ...................................................................................................9 2.5 Food aid administration, logistics and distribution ........................................................10 2.6 Food Security in Ethiopia...............................................................................................12 2.7 Trends in the number of food-assisted people................................................................14 2.8 Malnutrition and under-nutrition....................................................................................16 2.9 Trends in poverty levels .................................................................................................16 2.10 National food security strategy.....................................................................................18
SECTION THREE: IMPORTANCE OF FOOD AND AGRICULTURE SECTOR AND PUBLIC SUPPORT ............................................................................................................................................. 20
3.1 Overview of the Economy..............................................................................................20 3.2. Importance and Performance of the Food and Agriculture Sector................................23
3.2.1 Crop sub-sector........................................................................................................23 3.2.2. Livestock sub- sector..............................................................................................26 3.2.3. Fishery sub-sector...................................................................................................27 3.2.4. Forestry sub-sector .................................................................................................27
3.3 Major Constraints to Food Security and Agricultural Development..............................28 3.3.1 Erratic Weather Conditions .....................................................................................28 3.3.2 Environmental degradation .....................................................................................29 3.3.3 Rapid population growth and declining farm size...................................................30 3.3.4 Technological gaps..................................................................................................30 3.3.5 Infrastructural, institutional and other constraints...................................................32
3.4 Agricultural Strategies and Policies ...............................................................................33 3.4.1 Pre-1991 ..................................................................................................................33 3.4.2 The Socialist/ Military Regime ...............................................................................34 3.4.3 Post-1991.................................................................................................................36
3.5 Role of Civil Societies in Policy Formulation and Implementation...............................39 3.6 Pattern of Support and Terms of Trade ..........................................................................39
3.6.1 Budgetary Allocation...............................................................................................39 3.6.2 Terms of trade..........................................................................................................44
3.7 Private sector development............................................................................................46 SCTION FOUR: ASSESSING THE IMPACT OF FOOD IMPORT/AID DEPENDENCE ............... 48
4.1 Theoretical Framework of Macroeconomic Analysis of Food Aid Impacts ..................48
4.2 Theoretical Framework for Analysis of Food Aid Impacts at Households Level..........50 4.3 Data Sources, Estimation and Results of Macro-economic Impacts of Food Aid .........50 4.4 Data Sources, Estimation and Analysis of Food Aid Impacts at Household Level .......55
SECTION FIVE: OPTIONS FOR SUSTAINABLE AGRICULTURAL DEVELOPMENT AND FOOD SECURITY ............................................................................................................................... 57
5.1 Opportunities for Agricultural Development and Food Security ...................................57 5.1.1 Natural Resources....................................................................................................57 5.1.2 Human Resources....................................................................................................58
5.2 Support Measures Required to Tap the Potentials of the Country .................................59 5.2.1 Institutional Reform.................................................................................................59 5.2.2 Supply-Side Interventions .......................................................................................61 5.2.3 Demand Side Interventions ...................................................................................63
5.3 Expand non-agricultural employment ............................................................................65 5.4 Safety nets for the Vulnerable ........................................................................................66
5.5 Enhance Investment in Agriculture ................................................................................................. 67 REFERENCES...................................................................................................................................... 74

List of Tables Table 2.1: Trends in food availability............................................................................................. 3 Table 2.2: Food imports (in metric tons) ........................................................................................ 4 Table 2.3: Projected food supply and requirements (in metric tons) .............................................. 6 Table 2.4: Determinants of food consumption per capita in rural Ethiopia.................................................. 7 Table 2.5: Cost of food aid (in million USD) ..................................................................................... 12 Table 2.6: Classification of food insecure households in Ethiopia ....................................................... 13 Table 2.7: Drought/disaster affected population ................................................................................. 14 Table 2.8: Regional distribution of relief food assisted population (in '000')......................................... 15 Table 2.9: Child wasting and stunting in Ethiopia (children aged between 6-59 months)....................... 16 Table 2.10: Structure of household income and food consumption (percent) ........................................ 17 Table 2.11: Real annual consumption expenditure (in Birr) ................................................................ 17 Table 2.12: Trends in poverty........................................................................................................... 17 Table 3.1: Growth Episodes, 1960 – 2002 (in percent) ...................................................................... 20 Table 3.2: Trends in other macroeconomic indicators (in percent)....................................................... 22 Table 3.3: Trends in inflation (%) ..................................................................................................... 22 Table 3.5: Rainfall variability and trends of the agricultural growth rate .............................................. 29 Table 3.6: Number of Households by size of holding (1997/98).......................................................... 30 Table 3.7: Modern inputs in the peasant sector (2000/01) ................................................................... 31 Table 3.9: Share of recurrent budget in the total government budget (1980/81 to 2000/01) ................... 42 Table 3.10: Breakdown of federal budget, 2002/03 (000 birr) ............................................................. 43 Table 3.11: Ratio of teff and maize price to DAP price (1986-2001) ................................................... 46 Table 4.1: Results of the Estimation (t-ratios are given in parenthesis) ................................................ 51 Table 4.2: Reduced form Coefficients (Impact Multipliers) ................................................................ 52 Table 4.3: Interim, Cumulative and total Multiplier Effects of Food Aid ............................................. 54 Table 5.1: Urban and Rural Labour Forces................................................................................................. 59
i
List of Figures Figure 2.1: Trends in per capita food availability and requirement (kg/head/year) ....................... 3 Figure 2.2: Daily per capita calorie supply of cereals and animal products ................................... 4 Figure 2.3: Patterns of food imports ............................................................................................... 5 Figure 2.4: Food supply by source (cereals, roots and tuber) (cal/cap/day) ................................... 5 Figure 2.5: The share of food aid in domestic food production...................................................... 9 Figure 3.1: Pattern of GDP growth rate of agricultural, industrial and service sectors (at constant prices)
over the period 1962-2002........................................................................................................ 21 Figure 3.2: Trends in yield per hectare for cereals, pulses and oilseeds ................................................ 26 Figure 3.3: Government expenditure in agriculture ........................................................................... 40 Figure 3.4: Sectoral comparison of government recurrent expenditure allocation ................................. 41 Figure 3.5: Sectoral comparison of government capital expenditure allocation..................................... 42
ii

SECTION ONE: INTRODUCTION AND BACKGROUND
1.1 Description of the Problem Africa faces the world’s gravest hunger problems, and these problems are getting worse. According to the Food and Agriculture Organization (FAO) estimates, 186 million Africans are going hungry today. Even more disturbing, Africa is the only continent where hunger problem is projected to worsen over the next two decades. Currently, sub-Saharan Africa produces less food per person than three decades ago and remains one of the most malnourished regions in the world (Mulugeta and Etalem, 2003; Degefa, 2002). The Ethiopian economy is among the most vulnerable in sub-Saharan Africa. It is heavily dependent on the agricultural sector, which has suffered from recurrent droughts and extreme fluctuations of output. Agricultural production, for instance, has been growing by about 2.3% during 1980-2000 while population was growing on average at a rate of 2.9% per year, leading to a decline in per capita agricultural production by about 0.6% per year. According to the UNDP, the proportion of people in Ethiopia who are absolutely poor in the year 2001 was 44%. The levels of poverty also show significant variation among rural/urban areas and across regional states. Income distribution in Ethiopia seems to be more unevenly distributed in both rural and urban areas compared to other Sub-Saharan African countries. The overall consumption Gini coefficient for 2000 is found to be 0.572, signaling a polarization of the society regarding availability of income. Income inequality appears to be higher in urban areas than in rural areas. Poverty situation of the country has shown no sign of improvement over time. The number of food insecure households in Ethiopia has been increasing since the 1960s. Domestic food production has failed to meet the food requirements of the country. The annual food deficit increased from about 0.75 million ton in 1979/80 to 1.4 million tons in 2000 (Mulat 1999; Mulugeta and Etalem, 2003). The country has been receiving on average 700 thousand tons of food aid per annum in the last fifteen years. Increasing reliance on food aid is now a serious concern among experts and policy makers in the country. The available evidence suggests that the support provided to the agricultural sector has been less than satisfactory (Mulat 1999; Taye 1992). Government expenditure in agriculture in relation to total expenditure has shown a declining trend, from 9.1% in 1991/92 to 7.6% in 1997/98 and the same pattern has continued to this date (MOFED, 2002). The agriculture sector, despite its dominance in the economy, has been receiving little support and budgetary injections in the last four decades. Limited support to agriculture has severely constrained agricultural development. The problem is further compounded by land degradation, which is linked to inadequate property rights. These and other factors are responsible for the country’s faltering struggle to grow even at a rate of the population growth. Despite the fact that Ethiopia is currently food insecure, it has been argued that the country has a great potential for increasing agricultural production and productivity and thereby ensuring food security. Ethiopia is well endowed with potentially cultivable land resources, has an immense untapped irrigation and hydroelectric potential, has diverse climatic features to grow a large variety of crops and sustain pastoral activities, and has the largest livestock population in Africa. The question then is why the country cannot tap its potential instead of relying on food aid? Why is the agriculture, despite its potential significance to economic growth, attracting less support from government and other development partners? What are the impacts of food aid dependence on Ethiopian agriculture sector? And what needs to be done to ensure sustainable food security and agricultural development in the country?
1
1.2 Objectives of the Study The central objective of this study was to explore how Ethiopia could disentangle itself from food aid dependency and attains a sustainable food security, agricultural development and economic growth. The specific objectives of the study are to:
• Describe and analyse domestic food production, flow of food aid/imports and food security situation of the country.
• Analyse the evolution and trends of support provided to the development of the agricultural sector.
• Assess (quantitatively and qualitatively) the impact of food aid on long term food security and agricultural development of the country
• Recommend concrete policy and support options. 1.3 Methodology of the Study and Data Sources
In order to address the stated objectives, both descriptive and econometric techniques are employed. In doing so, trend analysis of time series data both at national and regional levels have been employed to assess the pattern of selected variables. In addition, econometric modelling has also been used both at national as well as household level with the objective of examining the impact of food aid on the agricultural sector. These methods are used to analyse the link between food aid on the one hand and food security, agricultural production and productivity on the other hand. The data for this study have come from various sources including National Income Account Statistics, rural and urban household surveys conducted by the Department of Economics of Addis Ababa University, report on Household Income, Consumption, and Expenditure surveys (1995/96 and 1999/2000), National Labour Force Survey (1999), Publication by DPPC, Agricultural census and sample surveys, Population and Housing Censuses, Welfare Monitoring Surveys, and Population Censuses etc. 1.4 Organization of the Study The study is organized in eight sections. Section 2 provides description and analysis food security situation. Section 3 discusses the importance of food and agriculture sector and public support. Sections 4 and 5 deal with, respectively, the impact of food aid/ import dependence and options for sustainable agricultural development and food security. Finally, summary and conclusions of the study are given section 6.
2
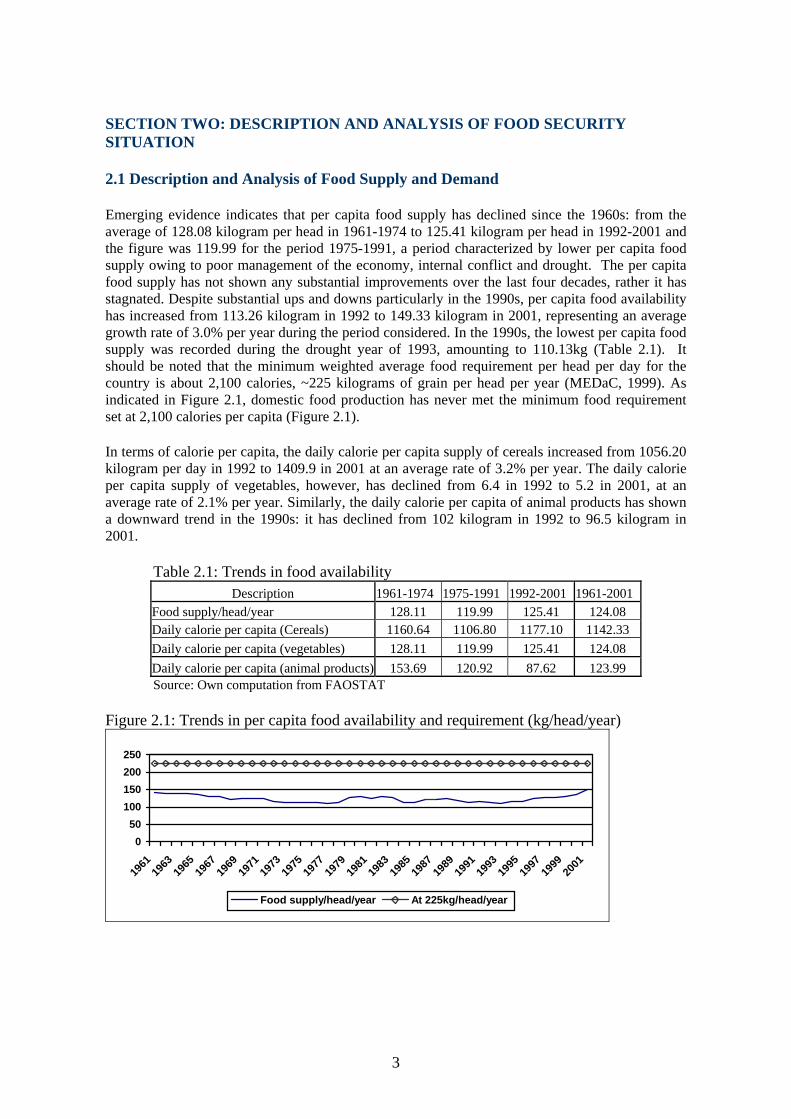
SECTION TWO: DESCRIPTION AND ANALYSIS OF FOOD SECURITY SITUATION 2.1 Description and Analysis of Food Supply and Demand Emerging evidence indicates that per capita food supply has declined since the 1960s: from the average of 128.08 kilogram per head in 1961-1974 to 125.41 kilogram per head in 1992-2001 and the figure was 119.99 for the period 1975-1991, a period characterized by lower per capita food supply owing to poor management of the economy, internal conflict and drought. The per capita food supply has not shown any substantial improvements over the last four decades, rather it has stagnated. Despite substantial ups and downs particularly in the 1990s, per capita food availability has increased from 113.26 kilogram in 1992 to 149.33 kilogram in 2001, representing an average growth rate of 3.0% per year during the period considered. In the 1990s, the lowest per capita food supply was recorded during the drought year of 1993, amounting to 110.13kg (Table 2.1). It should be noted that the minimum weighted average food requirement per head per day for the country is about 2,100 calories, ~225 kilograms of grain per head per year (MEDaC, 1999). As indicated in Figure 2.1, domestic food production has never met the minimum food requirement set at 2,100 calories per capita (Figure 2.1). In terms of calorie per capita, the daily calorie per capita supply of cereals increased from 1056.20 kilogram per day in 1992 to 1409.9 in 2001 at an average rate of 3.2% per year. The daily calorie per capita supply of vegetables, however, has declined from 6.4 in 1992 to 5.2 in 2001, at an average rate of 2.1% per year. Similarly, the daily calorie per capita of animal products has shown a downward trend in the 1990s: it has declined from 102 kilogram in 1992 to 96.5 kilogram in 2001.
Table 2.1: Trends in food availability Description 1961-1974 1975-1991 1992-2001 1961-2001
Food supply/head/year 128.11 119.99 125.41 124.08 Daily calorie per capita (Cereals) 1160.64 1106.80 1177.10 1142.33 Daily calorie per capita (vegetables) 128.11 119.99 125.41 124.08 Daily calorie per capita (animal products) 153.69 120.92 87.62 123.99 Source: Own computation from FAOSTAT
Figure 2.1: Trends in per capita food availability and requirement (kg/head/year)
050
100150200250
1961
1963
1965
1967
1969
1971
1973
1975
1977
1979
1981
1983
1985
1987
1989
1991
1993
1995
1997
1999
2001
Food supply/head/year At 225kg/head/year
3

Figure 2.2: Daily per capita calorie supply of cereals and animal products
0.00200.00400.00600.00800.00
1,000.001,200.001,400.001,600.00
1961
1963
1965
1967
1969
1971
1973
1975
1977
1979
1981
1983
1985
1987
1989
1991
1993
1995
1997
1999
2001
Cereals Animal products
It should be noted that most of the increase in per capita daily calorie in the 1990s could be attributable to an increase in availability of cereal products via domestic production and import. According to the available evidence, though fluctuating, the size of food imports has shown an increasing trend over time both in volume and value terms: increased from 119.6 million USD in 1993 to 175.2 million USD in 2002, representing an average annual growth rate of 1.7% per year. Cereal imports have contributed to such high food imports during the period considered: increased from 75.9 million USD (~449,330 metric tons) in 1993 to 108.3 million USD (~697,017 metric tons) in 2002. Specifically, wheat imports have been the dominant food imports since the late 1970s and have risen substantially in the 1980s and 1990s, followed by sorghum and fruits and vegetables. For instance, wheat imports have increased from 56.8 million USD (~358,100 metric tons) in 1993 to 98.5 million USD (~657,000 metric tons) in 2002 (Table 2.2). It seems that the size food import has to do with the performance of the domestic agricultural production in which food imports tend to decline during good harvest years and rise during bad years or seasons. For instance, cereal imports have reached its peak during the period 2000 and 2001 where there was severe drought and declined the following year owing to increased domestic production (figure 2.3). Table 2.2: Food imports (in metric tons) Item 1992 1993 1994 1995 1996 1997 1998 1999 2000 2001 2002
Cereals 1,047,405 449,330 1,158,372 640,240 394,280 283,727 586,455 703,676 1,265,320 1,092,451 697,017Maize 166 21,000 36,300 24,500 20,500 26,800 30,000 35,000 12,011 6,361 3,189 Rice 13,371 13,170 10,264 1,333 2,100 3,600 5,491 9,095 2,695 4,713 10,777 Wheat 830,000 358,100 553,583 509,500 295,000 187,200 463,000 550,000 1,164,000 1,031,000 657,000Pulses 31,200 16,900 15,315 4,696 4,696 4,696 4,696 6,531 25,190 17,300 2,190 Sorghum 63,200 19,900 102,875 100,354 50,000 10,000 50,000 49,000 7,400 8,500 10,000 Source: FAOSTAT
4
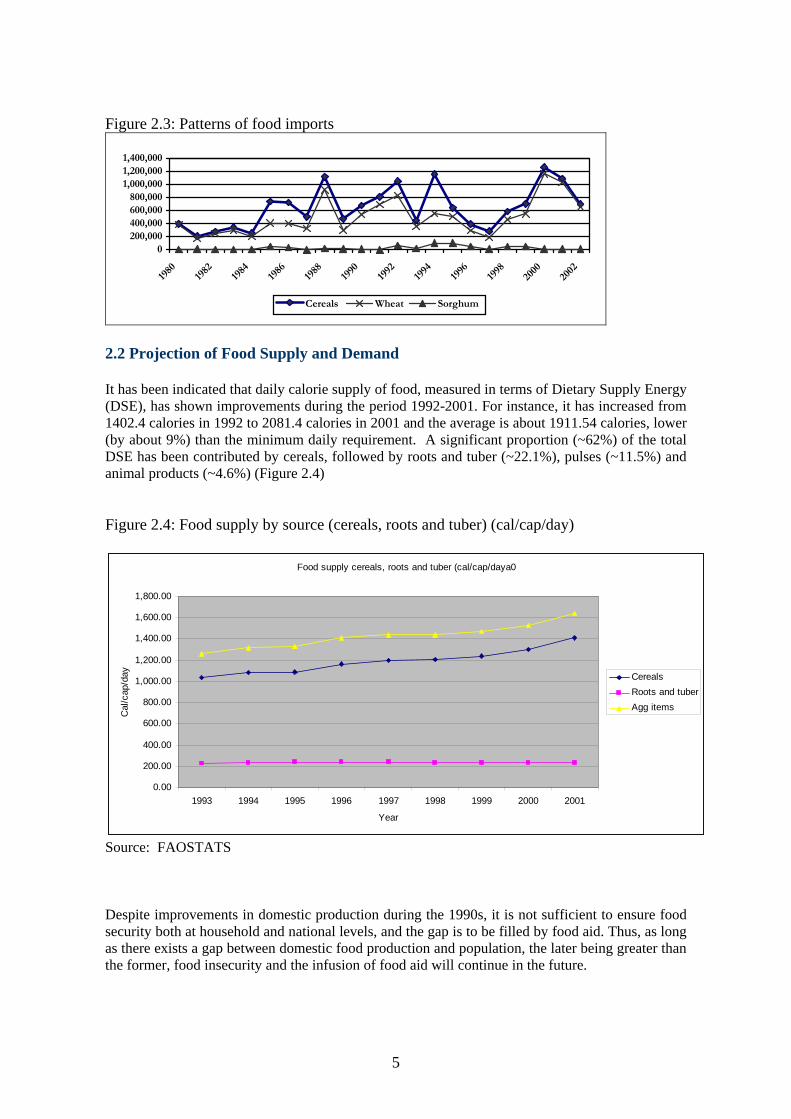
Figure 2.3: Patterns of food imports
0200,000400,000600,000800,000
1,000,0001,200,0001,400,000
1980
1982
1984
1986
1988
1990
1992
1994
1996
1998
2000
2002
Cereals Wheat Sorghum
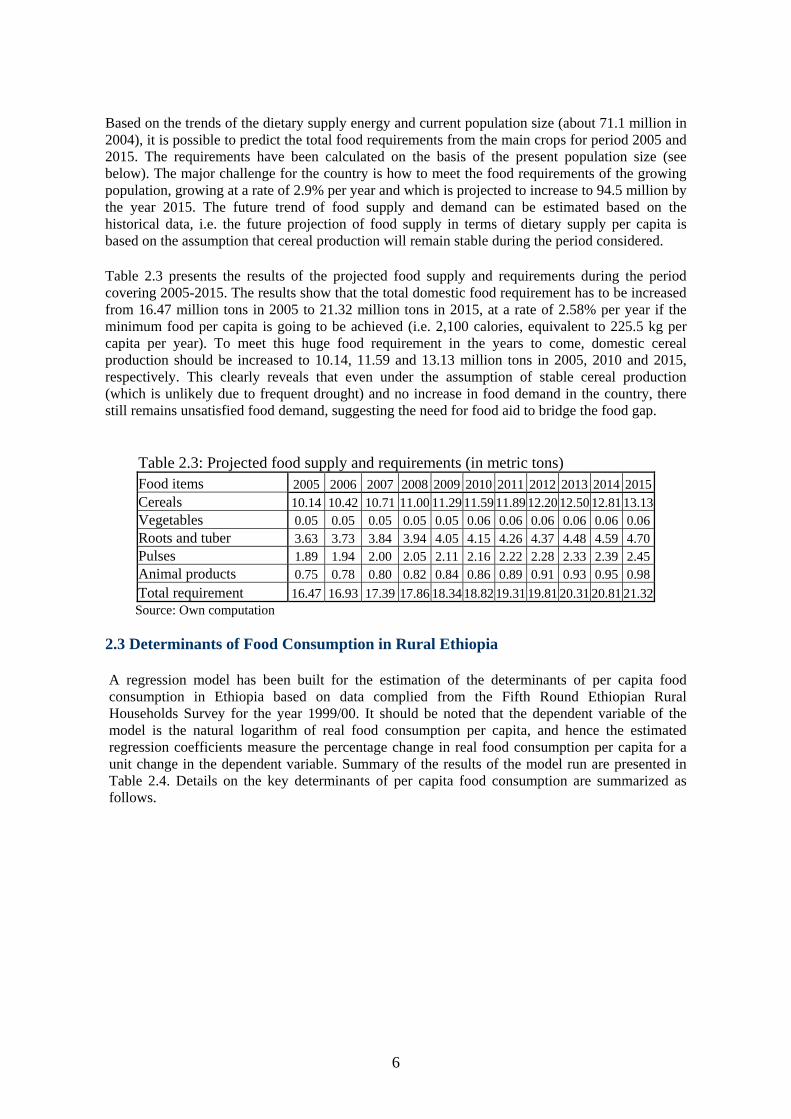
2.2 Projection of Food Supply and Demand It has been indicated that daily calorie supply of food, measured in terms of Dietary Supply Energy (DSE), has shown improvements during the period 1992-2001. For instance, it has increased from 1402.4 calories in 1992 to 2081.4 calories in 2001 and the average is about 1911.54 calories, lower (by about 9%) than the minimum daily requirement. A significant proportion (~62%) of the total DSE has been contributed by cereals, followed by roots and tuber (~22.1%), pulses (~11.5%) and animal products (~4.6%) (Figure 2.4) Figure 2.4: Food supply by source (cereals, roots and tuber) (cal/cap/day)
Food supply cereals, roots and tuber (cal/cap/daya0
0.00
200.00
400.00
600.00
800.00
1,000.00
1,200.00
1,400.00
1,600.00
1,800.00
1993 1994 1995 1996 1997 1998 1999 2000 2001
Year
Cal
/cap
/day Cereals
Roots and tuberAgg items
Source: FAOSTATS Despite improvements in domestic production during the 1990s, it is not sufficient to ensure food security both at household and national levels, and the gap is to be filled by food aid. Thus, as long as there exists a gap between domestic food production and population, the later being greater than the former, food insecurity and the infusion of food aid will continue in the future.
5
Based on the trends of the dietary supply energy and current population size (about 71.1 million in 2004), it is possible to predict the total food requirements from the main crops for period 2005 and 2015. The requirements have been calculated on the basis of the present population size (see below). The major challenge for the country is how to meet the food requirements of the growing population, growing at a rate of 2.9% per year and which is projected to increase to 94.5 million by the year 2015. The future trend of food supply and demand can be estimated based on the historical data, i.e. the future projection of food supply in terms of dietary supply per capita is based on the assumption that cereal production will remain stable during the period considered. Table 2.3 presents the results of the projected food supply and requirements during the period covering 2005-2015. The results show that the total domestic food requirement has to be increased from 16.47 million tons in 2005 to 21.32 million tons in 2015, at a rate of 2.58% per year if the minimum food per capita is going to be achieved (i.e. 2,100 calories, equivalent to 225.5 kg per capita per year). To meet this huge food requirement in the years to come, domestic cereal production should be increased to 10.14, 11.59 and 13.13 million tons in 2005, 2010 and 2015, respectively. This clearly reveals that even under the assumption of stable cereal production (which is unlikely due to frequent drought) and no increase in food demand in the country, there still remains unsatisfied food demand, suggesting the need for food aid to bridge the food gap.
Table 2.3: Projected food supply and requirements (in metric tons) Food items 2005 2006 2007 2008 2009 2010 2011 2012 2013 2014 2015 Cereals 10.14 10.42 10.71 11.00 11.29 11.59 11.89 12.20 12.50 12.81 13.13 Vegetables 0.05 0.05 0.05 0.05 0.05 0.06 0.06 0.06 0.06 0.06 0.06 Roots and tuber 3.63 3.73 3.84 3.94 4.05 4.15 4.26 4.37 4.48 4.59 4.70 Pulses 1.89 1.94 2.00 2.05 2.11 2.16 2.22 2.28 2.33 2.39 2.45 Animal products 0.75 0.78 0.80 0.82 0.84 0.86 0.89 0.91 0.93 0.95 0.98 Total requirement 16.47 16.93 17.39 17.86 18.34 18.82 19.31 19.81 20.31 20.81 21.32
Source: Own computation 2.3 Determinants of Food Consumption in Rural Ethiopia A regression model has been built for the estimation of the determinants of per capita food consumption in Ethiopia based on data complied from the Fifth Round Ethiopian Rural Households Survey for the year 1999/00. It should be noted that the dependent variable of the model is the natural logarithm of real food consumption per capita, and hence the estimated regression coefficients measure the percentage change in real food consumption per capita for a unit change in the dependent variable. Summary of the results of the model run are presented in Table 2.4. Details on the key determinants of per capita food consumption are summarized as follows.
6

Table 2.4: Determinants of food consumption per capita in rural Ethiopia Robust Logarithm of real food consumption per capita (Dep.
Variable) Coef. Std. Err t P>|t| Age of head of household 0.002 0.002 1.110 0.269 Sex of household head -0.002 0.044 -0.060 0.955 Persons 0-6 years old -0.099 0.020 -4.980 0.000 Persons 7-17 years old -0.177 0.015 -11.530 0.000 Males 18-64 years old -0.232 0.026 -8.960 0.000 Females 18-64 years old -0.155 0.028 -5.560 0.000 Persons aged 65 or older -0.201 0.037 -5.410 0.000 Number of persons employed in agricultural sector -0.007 0.022 -0.320 0.745 Number of persons employed in industrial sector 0.047 0.075 0.630 0.531 Number of persons employed in service sector 0.029 0.017 1.680 0.094 Number of literate adult males 0.146 0.041 3.520 0.000 Number of literate adult Females -0.030 0.040 -0.730 0.463 Number of adult males who completed primary education -0.102 0.059 -1.720 0.085 Number of adult females who completed primary education 0.014 0.049 0.280 0.778 Highest level of education of any adult in the household 0.001 0.003 0.160 0.870 Number of income sources 0.077 0.018 4.210 0.000 Dummy for use of any modern agricultural inputs 0.009 0.046 0.200 0.845 Dummy for security of land tenure 0.030 0.096 0.310 0.753 Dummy for food crops -0.016 0.116 -0.140 0.890 Dummy for horticultural crops 0.255 0.051 4.980 0.000 Dummy for cash crops -0.062 0.059 -1.040 0.298 Dummy for presence of markets -0.150 0.039 -3.840 0.000 Dummy for participate in the new extension programme 0.135 0.052 2.600 0.009 Logarithm of landholding size 0.107 0.022 4.930 0.000 Ownership of livestock 0.022 0.036 0.630 0.530 Square of adult equivalent household size 0.006 0.001 8.610 0.000 Dummy variable for Amhara region 0.320 0.080 3.990 0.000 Dummy variable for Oromiya region -0.272 0.074 -3.670 0.000 Dummy variable for Debreziet district 0.970 0.097 9.950 0.000 Dummy variable for Adel Tike district 0.627 0.088 7.150 0.000 Dummy variable for Sodere district 0.520 0.099 5.260 0.000 Dummy variable for Shashemene district 0.453 0.103 4.390 0.000 Dummy variable for Bako district 0.011 0.102 0.110 0.914 Dummy variable for Endibr district -0.403 0.099 -4.080 0.000 Dummy variable for Durame district -0.241 0.102 -2.360 0.018 Constant term 6.864 0.142 48.270 0.000 Regression with robust standard errors Number of obs = 1339 F (37, 1301) = 20.29 Prob > F = 0.000 R-squared = 0.348 Root MSE = 0.576
Demographic variables: From the estimated regression model, it can be seen that there is a strong negative relationship between real consumption per capita and household size i.e. households with larger family size have lower per capita food consumption and they are likely to suffer from food
7

shortfall and hence easily vulnerable to shocks. This is true for the five variables measuring the number of persons in the household, disaggregated by age and sex. It should be noted that the estimated coefficient of the square of household size is found to statistically significant, suggesting a U-shaped relationship between consumption per capita and household size. However, the effect of age and sex of head of household on the per capita consumption is insignificant even at 20% level. Education: Results of the regression model show that the number of literate adult males in the household tends to significantly positively influence the per capita food consumption. However, number of literate adult females and number of adult males and females who completed primary education have no significant effects on per capita food consumption.
Employment and income sources: Per capita food consumption is found to be insignificantly influenced by the sector (agricultural, industrial, and service) in which members of the household are employed. Nevertheless, per capita food consumption is relatively higher in households with more number of persons employed in the service sector and lower for those with more members employed by the agricultural sector. Households with multiple income sources are better off in terms of food consumption and are less susceptible to shocks. It has been argued that one of the persistent and chronic food insecurity problem in the country is lack of off-farm employment opportunities.1 Even if such employment opportunities exist, they are directly or indirectly influenced by rainfall and other factors such as land tenure and border conflict. 2 Size of landholding and number of farm animals: While landholding size has significant positive effects on per capita food consumption, the number of farm animals tends to have insignificant effects at least at 5%.
Access to infrastructure: As expected participation in the new extension programme has a positive effect on food consumption per capita. The new extension program involves diffusion of improved modern inputs such as fertilizer, improved seeds, herbicides etc with close monitoring of farmers and this would increase productivity and hence crop income. Although not capture by the model above, HIV/AIDS is now one of the major causes of vulnerability in both urban and rural areas. A terrible HIV/AIDS crisis is currently killing the prime labour force of the country, with 10.6 percent of the adult population reported to be already infected. AIDS is the leading cause of death for those aged 15 to 49, and the number of AIDS orphans is growing by the day (as reflected by the rising number of street children in major urban. With the world’s third largest population of HIV/AIDS patients, the impact of the disease is likely to be more catastrophic than even the worst drought years. High level of poverty, widespread hopelessness among the youth (due to lack of employment) and demobilisation of soldiers (which took place twice between 1991 and 2001) has undermined the effort to control the spread of the disease. 1 According to the available evidences, a quarter of households in Amhara region had one or more members migrate nearby rural areas during dry season in search of work and one in three migrants had difficulty of securing employment while half back without food or income to their families (FSCO, 1999 cited in Devereux, 2000). 2 Before the war with Eritrea, many Tigrayans used to travel to Eritrea to labour but this opportunity is lost following closure of the border (Devereux, 2000).
8

2.4 Food Gap and Food Aid The imbalance between domestic food production and food demand shows the amount of food shortfall at national level, which has shown an increasing trend in recent years. It has been documented that this gap has been largely met via external food aid. The size of food aid has increased, with significant ups and downs, from 239 thousand metric tons in 1980 to 409 metric thousand tons in 2001, repressing an average growth rate of about 2.5% per year. The flow of food aid increased substantially in the 1980s. The highest amount of food aid, accounting for some 27% of the total domestic food production, was received during the severe drought of 1984. The average food aid delivered was about 620.7 thousand tons during the 1980s while the figure for the 1990s was 583.1 thousand tons, indicating a slight reduction in food aid dependency. Although the absolute magnitude of food aid has declined in recent years compared to the early 1980s, food aid continues to be an important resource in bridging the food gap (Figure 2.5). Figure 2.5: The share of food aid in domestic food production
0%
5%
10%
15%
20%
25%
30%
1980
1981
1982
1983
1984
1985
1986
1987
1988
1989
1990
1991
1992
1993
1994
1995
1996
1997
1998
1999
2000
2001
Ethiopia was food self-sufficient and used to export food crops until the late 1950s. However, this trend changed and the country for the first time received food aid in 1959 when drought and crop infestation affected harvest in some parts of the country (Alemayehu, 1988 cited in Getinet, 1995). Since then the country has remained one of the major recipient of food aid in the world. Food aid delivery in Ethiopia has taken the form of emergency, project and program food aid for the most part. Emergency food aid: This is urgent food aid delivered in response to natural calamities (floods) and man-made problems (such as war) which are dominant in the country. Of the total food aid, more than 70% was in the form of emergency food aid until the 1990s. Components of this category include storable foodstuffs, tinned, compressed, clothing, provision of fresh water, treatment of survivors and injured persons. Project food aid: is mainly used in development related activities in the form of food-for-work (such activities may include soil and water conservation, afforestation, and other public works) in which food aid is used as a wage and complimentary feeding projects targeted for groups with inadequate level of nutrition. In carrying out public works via food-for-work programs, wages are paid in terms of food (i.e. in kind not in cash) and it is one form of generating employment and income.
9

Program food aid: refers to food supplied for bulk sale or distribution as part of budgetary or balance of payment support, price stabilization, or for reserve purposes. In terms of size, this type of food aid is the least compared to the above two types in Ethiopia. 2.5 Food aid administration, logistics and distribution
The entire food assistance or aid in the country is managed and administered by the Disaster Prevention and Preparedness Commission (DPPC), formerly known as the Relief and Rehabilitation Commission (RRC), which was established in 1974/75 following the outbreak of famine in the two northern provinces of Ethiopia, namely, Wollo and Tigray. Since then, it has undergone several transformations, the latest of which is its re-establishment in August 1995 as the DPPC under Proclamation No-10/1995. The major objectives of DPPC include prevent disasters by way of removing the basic causes thereof (i.e. Prevention), build, in advance, the capacity necessary to alleviate the extent of damages that could be caused by disasters (i.e. Preparedness), and ensure the timely arrival of necessary assistance to victims of disasters (i.e. Response).
To address these objectives, the Federal Government has adopted a National Policy on Disaster Prevention and Management (NPDPM) since 1993 which aims at tackling disasters and ensuring that famine situations are addressed in ways that reduce people’s vulnerability to disasters. The National Disaster Prevention and preparedness Strategy (NDPPS) provides the institutional framework for drought-induced mitigation and prevention and setting the broad outlines of a move from relief to development that puts Employment Generation Schemes (EGS) at the center of its implementation modalities targeted at food insecure and able bodied. 3Within this policy framework and strategy, the major activities of the DPPC include the following (DPPC, 2001):
Prevention: The first important function of the DPPC is to tackle root causes of vulnerability to disasters and to promote food security, i.e. prevention. This can be done in the form of promoting Employment Generation Schemes (EGS), which are the main mechanisms through which relief is provided to able-bodied disaster victims in exchange for work. EGS help build assets and reduce the risk of vulnerability of the would be affected populations. Many development works have been undertaken in different regions using relief food through EGS. The development efforts currently being undertaken towards overcoming famine conditions and attaining food self-sufficiency have already demonstrated positive effects. The government has further formulated a food security program, for which EGS is one of the major instruments contributing to the efforts of attaining food security at the household level. Preparedness: Preparedness, which is another function of the Commission, refers to building up of capabilities to mitigate the negative effects of disasters. The major preparedness modalities are Early Warning System (EWS), Emergency Food Security Reserve (EFSR), National Disaster Prevention and Preparedness Fund (NDPPF) and Logistics. Some of the key preparedness components have already been in place. At present, maximum efforts are being exerted to further strengthen them. Highlights of the major preparedness modalities are given below. Early Warning System (EWS): The Ethiopian EWS, which was established in 1976, is a management information system that uses data from and provides information to a large number of government and non-governmental agencies. It is an inter-agency management information system which involves different relevant government institutions. The system has been decentralized according to the regionalization policy and bottom-up planning approach since 1993. It is now
3 The major strengths and weakness of the current food security strategy can be found in Senait Seyoum (2001).
10

operational at federal, regional, zonal (Zonal DPPC (ZDPPC)) and woreda (district or Woreda DPPC (WDPPC)) levels. The main objective of the EWS is “to provide timely and accurate early warning information on impending and actual emergencies, so that swift, appropriate and effective measures can be taken to avoid suffering.” The focus of the System is on identification of areas and population groups needing relief assistance. As part of the regular activity of the programme, all relevant indicators of food security are monitored often on a monthly basis culminating in an annual nation-wide crop assessments. Pastoral area assessments are also carried out in the livestock dependent regions, while disaster assessments are conducted as and when emergency situations arise. Early warning reports are regularly issued and distributed to the Government, donors and the international community (Ibid, 2001). Emergency Food Security Reserve (EFSR): The Reserve was first established in 1982 as a project within the then Relief and Rehabilitation Commission (RRC). In view of revitalizing the operation and functioning of the EFSR as one of the major preparedness modalities in disaster management, it was re-institutionalized in 1992 as an autonomous entity whereby donors are represented in the decision making body over the management and utilization of commodities in the reserve. The objective of the EFSR is to provide adequate capacity to prevent disasters through provision of loans of food and non-food emergency items to agencies that are engaged in relief activities. At present, there are five Food Reserve locations: Nazareth, Kombolcha, Shashemene, Dire Dawa and Mekelle. The present physical capacity of the warehouses for the Food Reserve stands at 224,000 MT and additional warehouses with a capacity of 91,500 MT are under construction. The National Disaster Prevention and Preparedness Fund: A National Disaster Prevention and Preparedness Fund (NDPPF), which has the objective of maintaining a readily available cash reserve for a quick response to emergency situations, has been established. The Fund also aims to cover funding shortfalls for development programmes. It provides drawal rights to regions and implementing NGOs to support relief programmes based on prioritized needs in the event that resources required for such programmes cannot be secured in time. The Fund is to operate mainly as a revolving fund through loans. Logistics: It is clear that timely response to disaster crucially depends on the effectiveness of logistically infrastructure. In this regard, the Commission used to transport relief cargo to different distribution sites through its own Relief Transport Projects (RTPs), NGOs and UN transport fleets had also played a significant role in this regard. However, in line with the free-market economic policy of the Government the RTPs, NGOs and UN trucks have been privatized. Since then, the DPPC and its partners have been able to dispatch relief food and other emergency items to disaster prone areas using the private sector trucks. Given the poor infrastructure in the country, however, full reliance on the private sector for the transport of emergency relief items particularly, to remote areas is not possible. The Government has recently established Emergency Relief Transport Enterprise in order to avoid the risk of delays and subsequent consequences in relief delivery. Emergency responses: During emergencies, timely relief interventions such as provision of food, potable water, shelter and medical services to disaster victims are undertaken with the aim of saving lives. After emergency situations, recovery and rehabilitation measures through provision of draught oxen, seeds and hand tools in cropping areas and to some extent, restocking of depleted livestock resources in the pastoral areas are also required to be undertaken in order to sustain the livelihoods of victims.
11
As indicated earlier, demand for food aid is estimated at woreda (district) level. When a disaster is about to happen in a certain woreda, the Woreda DDPC (WDDPC) assesses and review the degree as well as the coverage of the event and then submit to the Zonal DPPC. The ZDPPC, after reviewing and appraising woreda reports and identifying the affected population, will submit a summarized report to the regional DPPC (RDPPC). The RDPPC through its Releif and Rehabilitation Bureau (RRB) will compile zonal reports and work out regional logistics including transportation of relief commodities and submit it to the national DPPC. Finally, the NDPPC will appraise, prioritise and approve regional reports and channel resources accordingly to regions. The contribution of NGOs involved in relief activities will be determined by the national DPPC. Regional DPPCs receive food aid, from the center, which has come from different donors, and then each region allocates relief commodities to affected woredas.
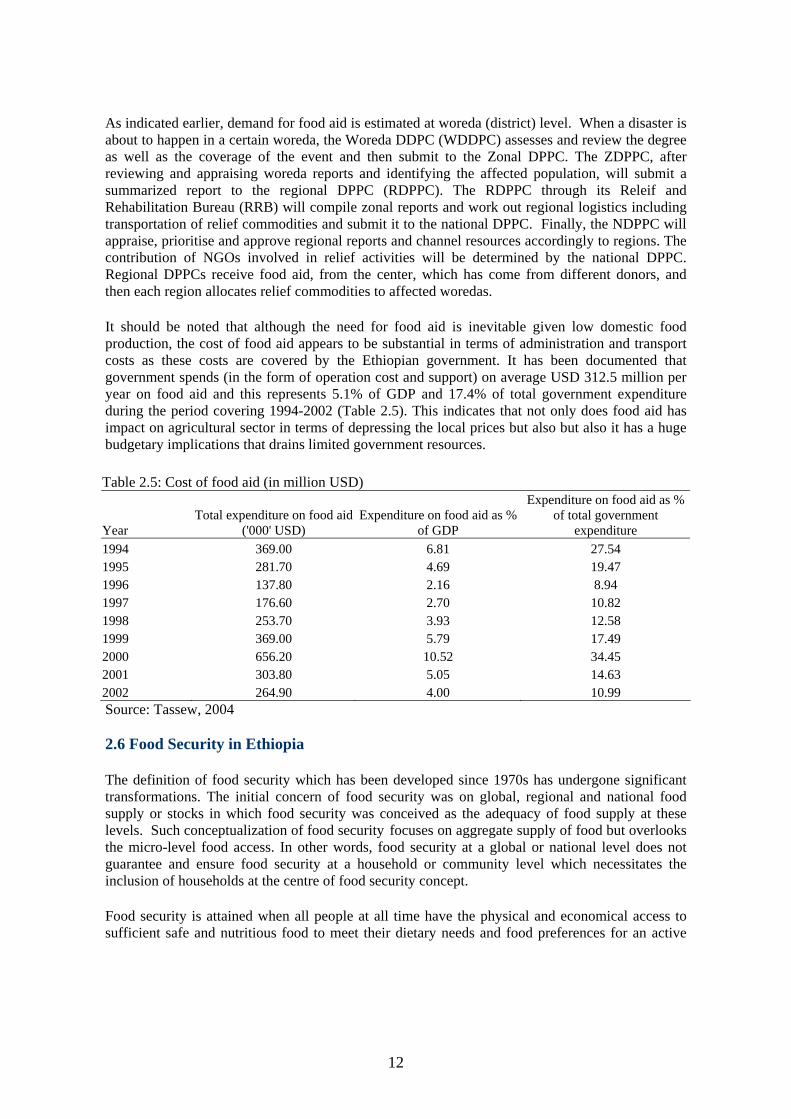
It should be noted that although the need for food aid is inevitable given low domestic food production, the cost of food aid appears to be substantial in terms of administration and transport costs as these costs are covered by the Ethiopian government. It has been documented that government spends (in the form of operation cost and support) on average USD 312.5 million per year on food aid and this represents 5.1% of GDP and 17.4% of total government expenditure during the period covering 1994-2002 (Table 2.5). This indicates that not only does food aid has impact on agricultural sector in terms of depressing the local prices but also but also it has a huge budgetary implications that drains limited government resources. Table 2.5: Cost of food aid (in million USD)
Year Total expenditure on food aid
('000' USD) Expenditure on food aid as %
of GDP
Expenditure on food aid as % of total government
expenditure 1994 369.00 6.81 27.54 1995 281.70 4.69 19.47 1996 137.80 2.16 8.94 1997 176.60 2.70 10.82 1998 253.70 3.93 12.58 1999 369.00 5.79 17.49 2000 656.20 10.52 34.45 2001 303.80 5.05 14.63 2002 264.90 4.00 10.99 Source: Tassew, 2004 2.6 Food Security in Ethiopia The definition of food security which has been developed since 1970s has undergone significant transformations. The initial concern of food security was on global, regional and national food supply or stocks in which food security was conceived as the adequacy of food supply at these levels. Such conceptualization of food security focuses on aggregate supply of food but overlooks the micro-level food access. In other words, food security at a global or national level does not guarantee and ensure food security at a household or community level which necessitates the inclusion of households at the centre of food security concept. Food security is attained when all people at all time have the physical and economical access to sufficient safe and nutritious food to meet their dietary needs and food preferences for an active
12

and healthy life, without undue risk of losing such access4. In this definition, people can have access to food via production, purchase, exchange or gifts. It has been argued that households may fail to command access of sufficient food due to inadequate landholding, opportunities of off-employment, access to credit and other inputs and these people are vulnerable groups of the society. Sufficiency indicates the calories necessary for an active and healthy life, and availability, which is the supply-side indicator of food security, refers to sufficient supplies of food of appropriate quality are continuously available (stability indicator of food security) for individuals. With average adult equivalent per capita daily caloric consumption estimated by FAO to be approximately 1810 kcal – i.e., among the lowest in the world5, a large number of Ethiopians are clearly not consuming sufficient food to be able to lead productive healthy lives. The estimates range between a third and half of the total population in this category. Depending on time dimension, food insecurity, a situation in which individuals do not have the physical nor economic access to the nourishment they need, can be chronic or transitory. The former occurs when there is a constant failure of food acquisition while the latter refers to a temporary failure of acquisition caused by drought, war, short-term variability in food prices, production, and incomes. The consequences of household food insecurity are as many as its causes which require different responses. Poor households are the most food insecure households and they are highly prone to shocks. In rural areas, households who do not have land, oxen, headed by female households, elderly, and newly established settlers are food insecure households. Unemployed people, single-family-headed households with dependents, elderly people living alone, and destitute and homeless people are food insecure in urban Ethiopia (Table 2.6). Table 2.6: Classification of food insecure households in Ethiopia
Rural Households Urban Households Others
Chronic
Landless or land scarce Without oxen Poor pastoralists Female-headed households Elderly Poor non-agricultural households Newly established settlers
Low income urban households outside the labour market Elderly Displaced Households-headed by female HIV/AIDS victim families
Refugees Ex-soldiers
Transitory
Farmers and other on drought prone areas Pastoralists Less resource poor households vulnerable to shocks (not drought) Others vulnerable to economic shocks in low potential areas
Urban poor vulnerable to shocks
Groups affected temporarily Civil unrest
Source: Food security strategy, 1996 In any one year, more than five million people are enlisted for a daily relief food per annum over the last decade. A combination of factors has resulted in serous and growing problem of food insecurity. According to the government report (MOFED, 2002), ‘adverse climatic changes (droughts) combined with high population pressure, environmental degradation, technological and institutional factors have led to a decline in the size of per capita land holding. This was
4 World Food Summit Plan of Action, Rome 1996; available at http:/www.fao.org/docrep/003/w3613e00.htm#PoA 5 Compared to Chad – 2140; North Korea – 2080; India – 2430. 1997-99 data from FAO, 2001 as quoted in Barry Riley, et al. 2002. The Impact Of Title Ii Food Aid On Food Security In Ethiopia, United States Agency for International Development Food and Humanitarian Affairs Office, Consultancy Report, USAID/Ethiopia..
13
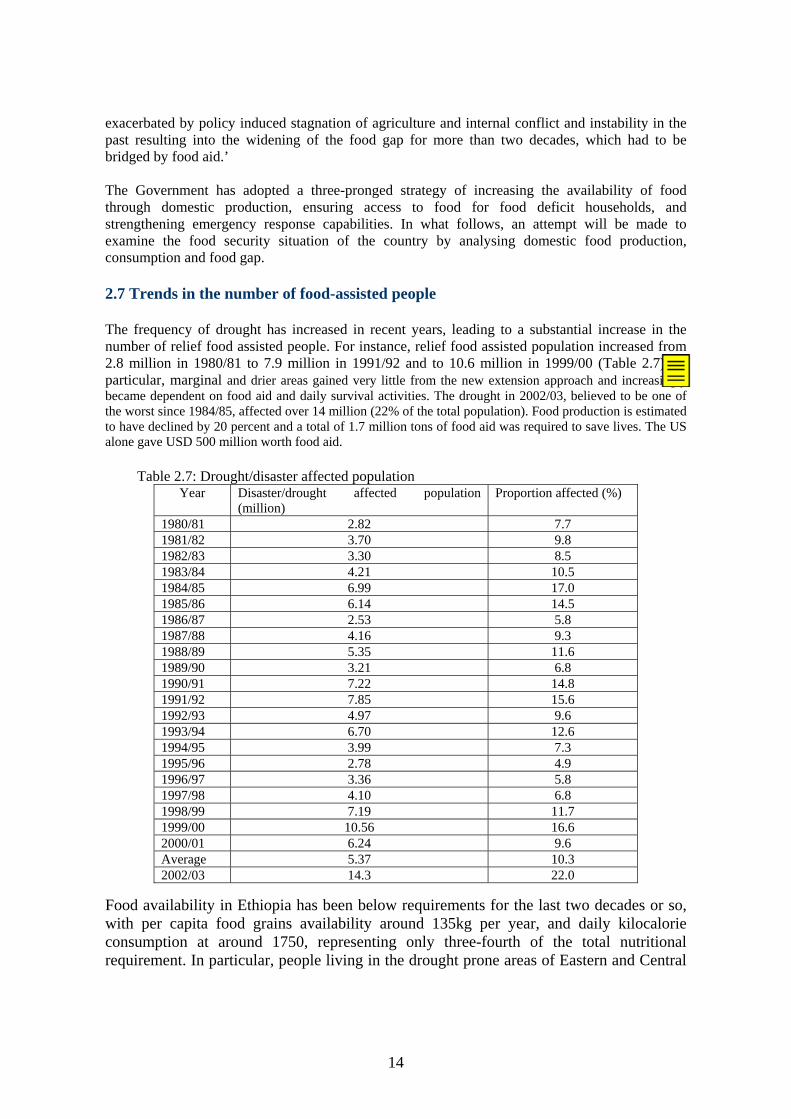
exacerbated by policy induced stagnation of agriculture and internal conflict and instability in the past resulting into the widening of the food gap for more than two decades, which had to be bridged by food aid.’ The Government has adopted a three-pronged strategy of increasing the availability of food through domestic production, ensuring access to food for food deficit households, and strengthening emergency response capabilities. In what follows, an attempt will be made to examine the food security situation of the country by analysing domestic food production, consumption and food gap. 2.7 Trends in the number of food-assisted people The frequency of drought has increased in recent years, leading to a substantial increase in the number of relief food assisted people. For instance, relief food assisted population increased from 2.8 million in 1980/81 to 7.9 million in 1991/92 and to 10.6 million in 1999/00 (Table 2.7). In particular, marginal and drier areas gained very little from the new extension approach and increasingly became dependent on food aid and daily survival activities. The drought in 2002/03, believed to be one of the worst since 1984/85, affected over 14 million (22% of the total population). Food production is estimated to have declined by 20 percent and a total of 1.7 million tons of food aid was required to save lives. The US alone gave USD 500 million worth food aid.
Table 2.7: Drought/disaster affected population Year Disaster/drought affected population
(million) Proportion affected (%)
1980/81 2.82 7.7 1981/82 3.70 9.8 1982/83 3.30 8.5 1983/84 4.21 10.5 1984/85 6.99 17.0 1985/86 6.14 14.5 1986/87 2.53 5.8 1987/88 4.16 9.3 1988/89 5.35 11.6 1989/90 3.21 6.8 1990/91 7.22 14.8 1991/92 7.85 15.6 1992/93 4.97 9.6 1993/94 6.70 12.6 1994/95 3.99 7.3 1995/96 2.78 4.9 1996/97 3.36 5.8 1997/98 4.10 6.8 1998/99 7.19 11.7 1999/00 10.56 16.6 2000/01 6.24 9.6 Average 5.37 10.3 2002/03 14.3 22.0
Food availability in Ethiopia has been below requirements for the last two decades or so, with per capita food grains availability around 135kg per year, and daily kilocalorie consumption at around 1750, representing only three-fourth of the total nutritional requirement. In particular, people living in the drought prone areas of Eastern and Central
14

Zone of Tigray (Tigray region), Wello, North Gondar and North Shoa (Amhara region), and Borena, and Haraghe (Oromiya region) are severely affected by lack of food. The number of people requiring food assistance is largest in Amhara, Oromiya and Tigray regions, accounting for about 71% of the total food aid recipients during the period 1994–2003. On average, about 1.6 million people required food assistance in the Amhara region over the period from 1994 to 2003. The corresponding figures for Oromiya and Tigray regions were 1.4 and 1.1 million, respectively. Even during good agricultural years such as 1995, 1996, 1998 and 2002, the number of people requiring food assistance in the three regions was more than 2 million, implying that there are structural problems such as limited access to technology and markets as well as minimal employment opportunities, besides recurrent drought (Table 2.8). The proportion of food-aid dependent population was highest in Tigray (on average 31% during the period 1994-2003) followed by Somali (8%), Afar (17%) and Ben-Gambella (16%) (Table 2.8). The percent of food insecure population increased significantly during poor agricultural years such as 2000 and 2003. Farm households most affected in each region are asset-poor with limited access to arable land, low productivity and insufficient purchasing power to secure their food requirements from the market.
Table 2.8: Regional distribution of relief food assisted population (in '000') Region\Year 1994 1995 1996 1997 1998 1999 2000 2001 2002 2003 Average
Tigray 1085.00 764.40 751.20 675.00 1201.00 998.40 1717.80 938.50 917.20 2011.40 1105.99
(34.87) (23.87) (22.80) (19.92) (34.46) (27.86) (46.60) (24.75) (23.52) (50.15) (30.88)
Amahara 2096.80 1201.60 868.00 822.10 2022.20 278.70 3569.80 2130.00 172.50 3123.00 1628.47
(15.28) (8.51) (5.97) (5.50) (13.15) (1.76) (21.94) (12.73) (1.00) (17.64) (10.35)
Oromiya 1995.00 902.00 395.40 547.80 709.60 1562.50 1902.80 1129.00 1051.40 3733.70 1392.92
(10.75) (4.71) (2.00) (2.69) (3.38) (7.22) (8.53) (4.91) (4.44) (15.28) (6.39)
SNNPR 840.00 822.00 361.40 331.70 0.00 718.50 1410.00 869.80 303.30 1439.30 709.60
(8.17) (7.74) (3.29) (2.93) (0.00) (5.95) (11.30) (6.75) (2.28) (10.48) (5.89)
Afar 215.00 100.00 50.00 264.20 0.00 160.60 306.60 127.70 22.50 786.20 203.28
(20.41) (9.27) (4.53) (23.36) (0.00) (13.54) (25.25) (10.27) (1.77) (60.32) (16.87)
Somali 250.00 100.00 210.00 600.00 50.00 864.80 1489.70 981.00 894.80 1063.50 650.38
(7.90) (3.08) (6.30) (17.55) (1.43) (24.04) (40.37) (25.91) (23.04) (26.70) (17.63)
Beni-shangul-Gumuz 83.00 20.00 35.00 13.10 0.00 0.00 4.20 0.00 9.00 0.00 16.43
(18.13) (4.26) (7.26) (2.65) (0.00) (0.00) (0.79) (0.00) (1.60) (0.00) (3.47)
Gambella 27.00 10.00 25.00 41.50 72.30 17.00 46.60 0.00 32.80 58.40 33.06
(14..99) (5.41) (13.17) (21.30) (36.15) (8.28) (22.12) (0.00) (14.78) (25.65) (16.32)Source: FDRE, 2003, The New Coalition for Food Security in Ethiopia, vol. I. Note: Figures in parentheses refer to the share of food-assisted population from the respective total regional population.
15
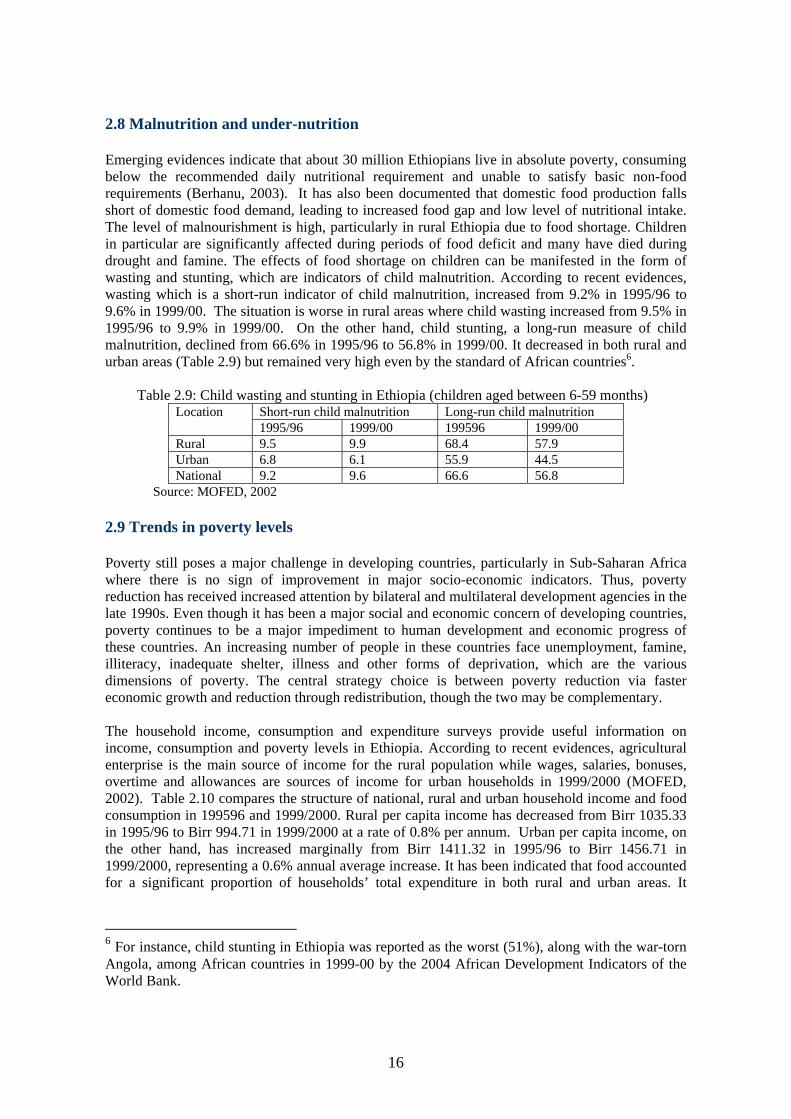
2.8 Malnutrition and under-nutrition Emerging evidences indicate that about 30 million Ethiopians live in absolute poverty, consuming below the recommended daily nutritional requirement and unable to satisfy basic non-food requirements (Berhanu, 2003). It has also been documented that domestic food production falls short of domestic food demand, leading to increased food gap and low level of nutritional intake. The level of malnourishment is high, particularly in rural Ethiopia due to food shortage. Children in particular are significantly affected during periods of food deficit and many have died during drought and famine. The effects of food shortage on children can be manifested in the form of wasting and stunting, which are indicators of child malnutrition. According to recent evidences, wasting which is a short-run indicator of child malnutrition, increased from 9.2% in 1995/96 to 9.6% in 1999/00. The situation is worse in rural areas where child wasting increased from 9.5% in 1995/96 to 9.9% in 1999/00. On the other hand, child stunting, a long-run measure of child malnutrition, declined from 66.6% in 1995/96 to 56.8% in 1999/00. It decreased in both rural and urban areas (Table 2.9) but remained very high even by the standard of African countries6.
Table 2.9: Child wasting and stunting in Ethiopia (children aged between 6-59 months) Short-run child malnutrition Long-run child malnutrition Location 1995/96 1999/00 199596 1999/00
Rural 9.5 9.9 68.4 57.9 Urban 6.8 6.1 55.9 44.5 National 9.2 9.6 66.6 56.8
Source: MOFED, 2002 2.9 Trends in poverty levels Poverty still poses a major challenge in developing countries, particularly in Sub-Saharan Africa where there is no sign of improvement in major socio-economic indicators. Thus, poverty reduction has received increased attention by bilateral and multilateral development agencies in the late 1990s. Even though it has been a major social and economic concern of developing countries, poverty continues to be a major impediment to human development and economic progress of these countries. An increasing number of people in these countries face unemployment, famine, illiteracy, inadequate shelter, illness and other forms of deprivation, which are the various dimensions of poverty. The central strategy choice is between poverty reduction via faster economic growth and reduction through redistribution, though the two may be complementary. The household income, consumption and expenditure surveys provide useful information on income, consumption and poverty levels in Ethiopia. According to recent evidences, agricultural enterprise is the main source of income for the rural population while wages, salaries, bonuses, overtime and allowances are sources of income for urban households in 1999/2000 (MOFED, 2002). Table 2.10 compares the structure of national, rural and urban household income and food consumption in 199596 and 1999/2000. Rural per capita income has decreased from Birr 1035.33 in 1995/96 to Birr 994.71 in 1999/2000 at a rate of 0.8% per annum. Urban per capita income, on the other hand, has increased marginally from Birr 1411.32 in 1995/96 to Birr 1456.71 in 1999/2000, representing a 0.6% annual average increase. It has been indicated that food accounted for a significant proportion of households’ total expenditure in both rural and urban areas. It
6 For instance, child stunting in Ethiopia was reported as the worst (51%), along with the war-torn Angola, among African countries in 1999-00 by the 2004 African Development Indicators of the World Bank.
16
accounted for, on average, 60% in 1995/96 and 65% in 1999/2000 (MEDaC, 1999; MOFED, 2002). Table 2.10: Structure of household income and food consumption (percent)
1995/96 1999/2000 Description\Year
Income per capita (in Birr)
Food Consumption (%)
Income per capita (in Birr)
Food Consumption (%)
Rural households 1035.33 60 994.73 67 Urban households 1411.32 56 1452.54 56 National 1087.83 60 1056.71 65
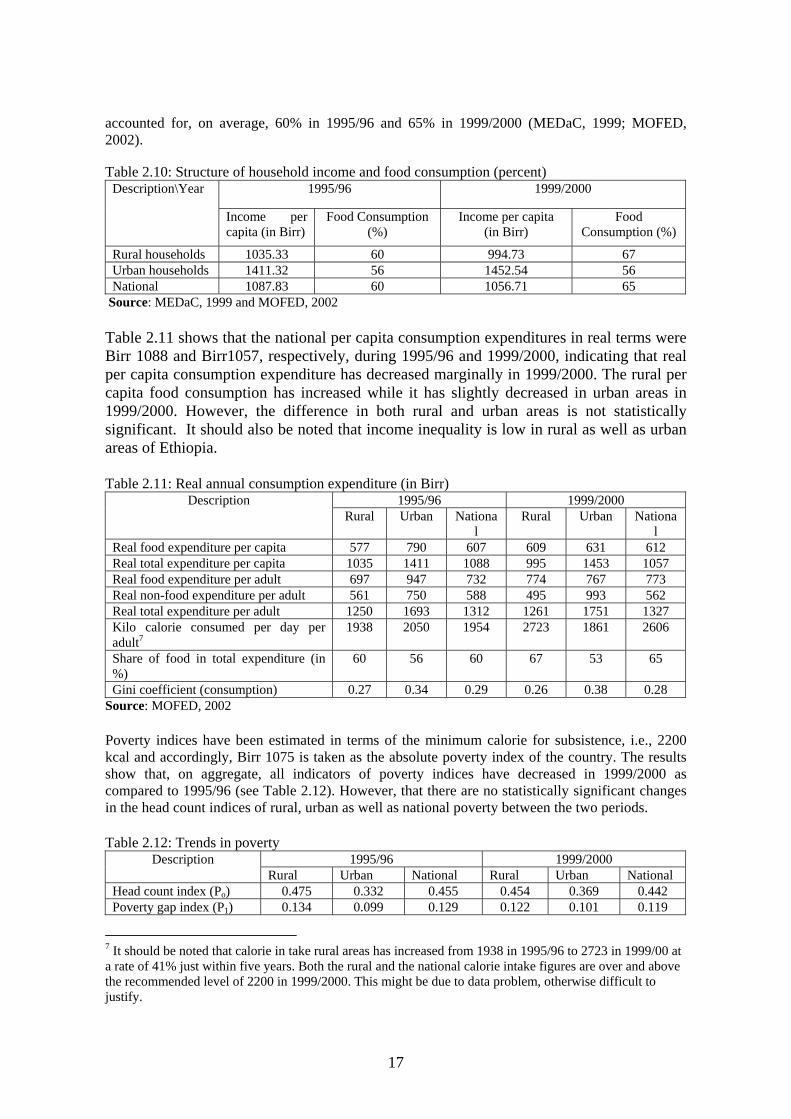
Source: MEDaC, 1999 and MOFED, 2002 Table 2.11 shows that the national per capita consumption expenditures in real terms were Birr 1088 and Birr1057, respectively, during 1995/96 and 1999/2000, indicating that real per capita consumption expenditure has decreased marginally in 1999/2000. The rural per capita food consumption has increased while it has slightly decreased in urban areas in 1999/2000. However, the difference in both rural and urban areas is not statistically significant. It should also be noted that income inequality is low in rural as well as urban areas of Ethiopia. Table 2.11: Real annual consumption expenditure (in Birr)
1995/96 1999/2000 Description Rural Urban Nationa
l Rural Urban Nationa
l Real food expenditure per capita 577 790 607 609 631 612 Real total expenditure per capita 1035 1411 1088 995 1453 1057 Real food expenditure per adult 697 947 732 774 767 773 Real non-food expenditure per adult 561 750 588 495 993 562 Real total expenditure per adult 1250 1693 1312 1261 1751 1327 Kilo calorie consumed per day per adult7
1938 2050 1954 2723 1861 2606
Share of food in total expenditure (in %)
60 56 60 67 53 65
Gini coefficient (consumption) 0.27 0.34 0.29 0.26 0.38 0.28 Source: MOFED, 2002 Poverty indices have been estimated in terms of the minimum calorie for subsistence, i.e., 2200 kcal and accordingly, Birr 1075 is taken as the absolute poverty index of the country. The results show that, on aggregate, all indicators of poverty indices have decreased in 1999/2000 as compared to 1995/96 (see Table 2.12). However, that there are no statistically significant changes in the head count indices of rural, urban as well as national poverty between the two periods. Table 2.12: Trends in poverty
1995/96 1999/2000 Description Rural Urban National Rural Urban National
Head count index (Po) 0.475 0.332 0.455 0.454 0.369 0.442 Poverty gap index (P1) 0.134 0.099 0.129 0.122 0.101 0.119
7 It should be noted that calorie in take rural areas has increased from 1938 in 1995/96 to 2723 in 1999/00 at a rate of 41% just within five years. Both the rural and the national calorie intake figures are over and above the recommended level of 2200 in 1999/2000. This might be due to data problem, otherwise difficult to justify.
17
Squared poverty gap (P2) 0.053 0.041 0.051 0.046 0.039 0.045 Source: MOFED, 2002 2.10 National food security strategy In Ethiopia, attempts are made to ensure that all citizens have a right to aid in times of crisis. A key focus of the Disaster Prevention and Preparedness Commission (DPPC) is to prevent a repeat of occurrence of the types of famines that struck Ethiopia in the 1970s and 1980s in which thousands of people died. Since information is critical for providing assistance, a number of institutions are engaged in disaster early warning, baseline information and food security surveillance activities. In addition to DPPC, government agencies engaged in such activities include the Central Statistical Agency, the Welfare Monitoring Unit of the Ministry of Finance and Economic Development, and various line ministries. Famine Early Warning System (FEWS) of the USAID produces a monthly food security report using secondary data generated through the Early Warning Working Group consisting of DPPC, Save the Children – UK, World Food Programme (WFP), CARE and other government and non-governmental organizations. FEWS also makes use of satellite imagery for spatial analysis, which it receives directly from NASA and NOAA (National Oceanographic and Atmospheric Agency) every ten days. WFP’s Vulnerability Analysis and Mapping (VAM) department uses state of the art mapping technologies to identify areas where people are most vulnerable to hunger and to estimate their needs. The annual FAO/WFP Crop and Food Supply Assessment mission (October/November) estimates national cereal and pulse production, import requirements and needs for emergency food aid (Lautze, et al, 2003). Despite the numerous early warning and surveillance systems and the long history of the early warning system of DPPC, there is no working capacity for meta-analysis of the different data and no single organization utilizes the full range of information generated. The objective is to identify only numbers needing various levels of emergency food aid without indicating the nature and causes of vulnerability among diverse livelihood. This has become a regular task of DPPC and emergency food aid appeals have been made in years of bumper harvest and deficit alike in almost ritualistic fashion. In deed, not a single year has passed, in its 27 years of existence, when the Commission has not made an appeal for emergency food aid (Lautze, et al, 2003). Distribution of food assistance has received as much attention as early warning and surveillance system since the 1983/84 famine. The process by which areas and households are selected to receive emergency food aid has also been blamed for the limited impact of food distribution programs. Targeting the real poor has not been easy as different districts apply different criteria in distributing relief: some give it to all households for the sake of social cohesion and generalized need, hence no one actually receiving sufficient quantities to have the intended effect, while others attempt to target the poorest of the poor using asset ownership as the major criterion. A study by Clay et al (1999) found that there were large errors of inclusion and exclusion in the selection of districts as well as households. The primary beneficiaries were found to be the relatively most well-off and the poorest, with the middle two groups were excluded. The former group appears to be using its
18
status and resources to influence food aid distribution. It has also been observed that livestock holdings are considered as the only criterion in many areas and a significant number of households sell livestock to qualify for relief distribution (Lautze, et al, 2003). In 2003/04, budget requested for food security increased significantly, accounting for 57% of the total allocated for food security, agriculture and natural resources. The budget for food security is intended to finance the operation of the Disaster Prevention and Preparedness Commission (DPPC) for the purpose of administration, general services, early warning department, and management of information services. Resettlement activities are also expected to constitute a major component of the food security programs. The government is hoping that a significant proportion of the capital budget allocated for food security will be financed through donations (54%) and loan funds (13%).8 Past experience, however, shows that aid and loans do not come on time and actual expenditure is bound to be much lower (Tassew, 2004).
8 About 91% of the total budget (1.8 billion birr) is planned for capital budget.
19
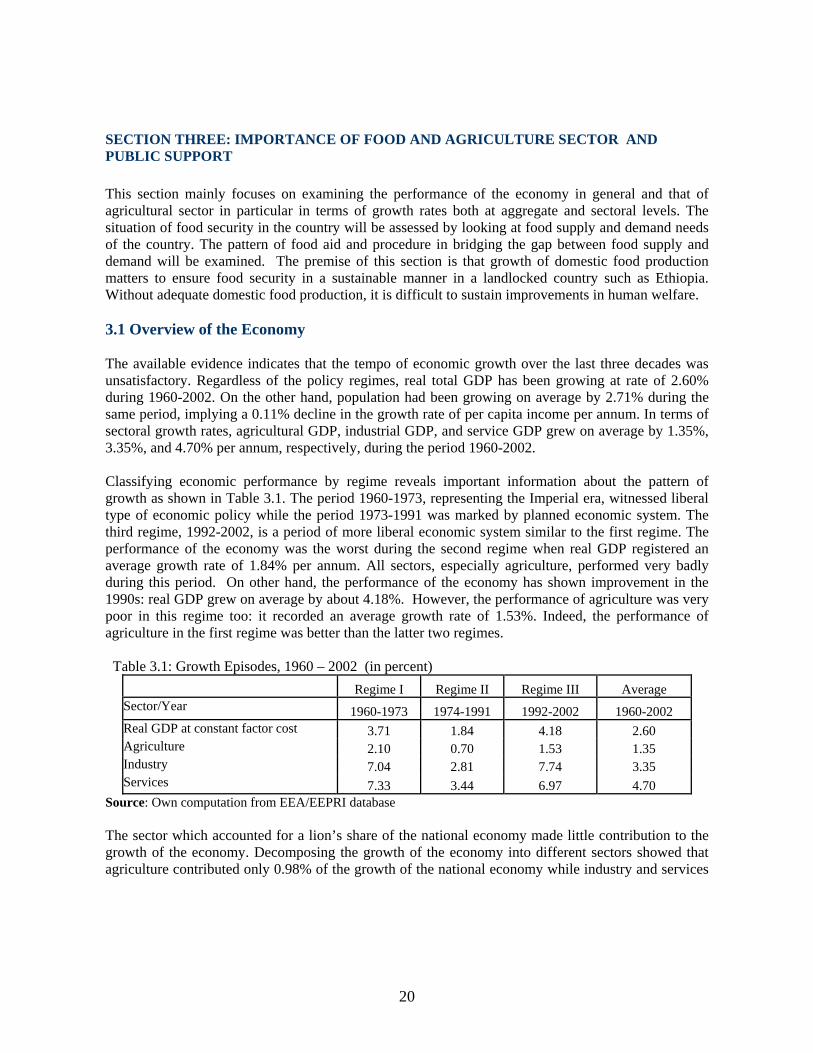
SECTION THREE: IMPORTANCE OF FOOD AND AGRICULTURE SECTOR AND PUBLIC SUPPORT This section mainly focuses on examining the performance of the economy in general and that of agricultural sector in particular in terms of growth rates both at aggregate and sectoral levels. The situation of food security in the country will be assessed by looking at food supply and demand needs of the country. The pattern of food aid and procedure in bridging the gap between food supply and demand will be examined. The premise of this section is that growth of domestic food production matters to ensure food security in a sustainable manner in a landlocked country such as Ethiopia. Without adequate domestic food production, it is difficult to sustain improvements in human welfare. 3.1 Overview of the Economy The available evidence indicates that the tempo of economic growth over the last three decades was unsatisfactory. Regardless of the policy regimes, real total GDP has been growing at rate of 2.60% during 1960-2002. On the other hand, population had been growing on average by 2.71% during the same period, implying a 0.11% decline in the growth rate of per capita income per annum. In terms of sectoral growth rates, agricultural GDP, industrial GDP, and service GDP grew on average by 1.35%, 3.35%, and 4.70% per annum, respectively, during the period 1960-2002. Classifying economic performance by regime reveals important information about the pattern of growth as shown in Table 3.1. The period 1960-1973, representing the Imperial era, witnessed liberal type of economic policy while the period 1973-1991 was marked by planned economic system. The third regime, 1992-2002, is a period of more liberal economic system similar to the first regime. The performance of the economy was the worst during the second regime when real GDP registered an average growth rate of 1.84% per annum. All sectors, especially agriculture, performed very badly during this period. On other hand, the performance of the economy has shown improvement in the 1990s: real GDP grew on average by about 4.18%. However, the performance of agriculture was very poor in this regime too: it recorded an average growth rate of 1.53%. Indeed, the performance of agriculture in the first regime was better than the latter two regimes. Table 3.1: Growth Episodes, 1960 – 2002 (in percent)
Regime I Regime II Regime III Average Sector/Year 1960-1973 1974-1991 1992-2002 1960-2002 Real GDP at constant factor cost 3.71 1.84 4.18 2.60 Agriculture 2.10 0.70 1.53 1.35 Industry 7.04 2.81 7.74 3.35 Services 7.33 3.44 6.97 4.70
Source: Own computation from EEA/EEPRI database The sector which accounted for a lion’s share of the national economy made little contribution to the growth of the economy. Decomposing the growth of the economy into different sectors showed that agriculture contributed only 0.98% of the growth of the national economy while industry and services
20

contributed 0.47% and 1.75%, respectively, during the period 1960-2002. 9 The growth of the economy was largely attributed to the growth of the service sector. The growth in the service sector was in turn attributed to expansion in administration and defence expenditures. It had little to do with expansion in health services (believed to improve stock of capital) and improvement in trade, transport and communications services (believed to widen markets) (Zerihun, 2003). Although the economy has shown better performance in the 1990s, the improvements failed to be sustained as the economy continued to suffer from fluctuations in weather conditions. Figure 3.1 shows the pattern of GDP annual growth rates of agricultural, industrial and service sub-sectors. The pattern shows that agricultural GDP has been highly unstable probably due to war, drought, and policy failures. It also portrays the variability in the growth rates of industrial and service GDP, although the extent of fluctuations is lower than agriculture. Figure 3.1: Pattern of GDP growth rate of agricultural, industrial and service sectors (at constant
prices) over the period 1962-2002
-30%
-20%
-10%
0%
10%
20%
30%
40%
1961/62 1967/68 1973/74 1979/80 1985/86 1991/92 1997/98
Year
Gro
wth
rate
s (in
%)
Agriculture Industry Services
Source: Own calculation from EEA/EEPRI database A look at the pattern of growth rates by regime reveals that the growth rate of agriculture was relatively stable during the imperial era (1961-1973) while other sectors were highly subject to
9 The contribution of each sector to the national economy can be determined using the simple total factor productivity accounting technique. Let Y denotes real GDP; YA YI and YS refer, respectively, to agricultural GDP, Industrial GDP and Service GDP. From the national income accounts,
SIA YYYY ++= Taking the total derivate of Y and dividing both sides of the equation by Y and rearranging yields,
⎥⎦⎤
⎢⎣⎡
⎥⎦
⎤⎢⎣
⎡+⎥⎦
⎤⎢⎣⎡
⎥⎦
⎤⎢⎣
⎡+⎥⎦
⎤⎢⎣⎡
⎥⎦
⎤⎢⎣
⎡=
YY
YdY
YY
YdY
YY
YdY
YdY S
S
SI
I
IA
A
A ***
The above specification can be reduced to
SSIIAA SrSrSrg ++= where g is the growth rate of real GDP; rA, rI and rS refere to, respectively, the growth rates of agriculture, industry and services. And SA, SI and SS are the shares of agriculture, industry and services, respectively.
21
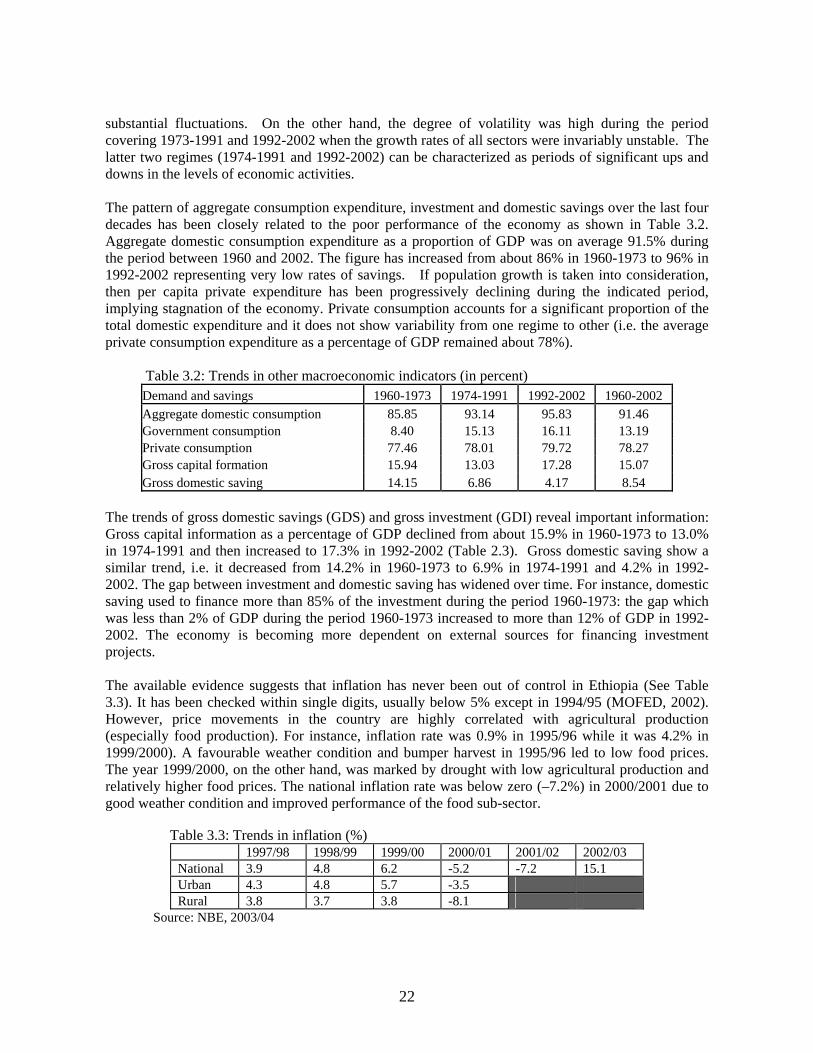
substantial fluctuations. On the other hand, the degree of volatility was high during the period covering 1973-1991 and 1992-2002 when the growth rates of all sectors were invariably unstable. The latter two regimes (1974-1991 and 1992-2002) can be characterized as periods of significant ups and downs in the levels of economic activities. The pattern of aggregate consumption expenditure, investment and domestic savings over the last four decades has been closely related to the poor performance of the economy as shown in Table 3.2. Aggregate domestic consumption expenditure as a proportion of GDP was on average 91.5% during the period between 1960 and 2002. The figure has increased from about 86% in 1960-1973 to 96% in 1992-2002 representing very low rates of savings. If population growth is taken into consideration, then per capita private expenditure has been progressively declining during the indicated period, implying stagnation of the economy. Private consumption accounts for a significant proportion of the total domestic expenditure and it does not show variability from one regime to other (i.e. the average private consumption expenditure as a percentage of GDP remained about 78%). Table 3.2: Trends in other macroeconomic indicators (in percent)
Demand and savings 1960-1973 1974-1991 1992-2002 1960-2002 Aggregate domestic consumption 85.85 93.14 95.83 91.46 Government consumption 8.40 15.13 16.11 13.19 Private consumption 77.46 78.01 79.72 78.27 Gross capital formation 15.94 13.03 17.28 15.07 Gross domestic saving 14.15 6.86 4.17 8.54
The trends of gross domestic savings (GDS) and gross investment (GDI) reveal important information: Gross capital information as a percentage of GDP declined from about 15.9% in 1960-1973 to 13.0% in 1974-1991 and then increased to 17.3% in 1992-2002 (Table 2.3). Gross domestic saving show a similar trend, i.e. it decreased from 14.2% in 1960-1973 to 6.9% in 1974-1991 and 4.2% in 1992-2002. The gap between investment and domestic saving has widened over time. For instance, domestic saving used to finance more than 85% of the investment during the period 1960-1973: the gap which was less than 2% of GDP during the period 1960-1973 increased to more than 12% of GDP in 1992-2002. The economy is becoming more dependent on external sources for financing investment projects. The available evidence suggests that inflation has never been out of control in Ethiopia (See Table 3.3). It has been checked within single digits, usually below 5% except in 1994/95 (MOFED, 2002). However, price movements in the country are highly correlated with agricultural production (especially food production). For instance, inflation rate was 0.9% in 1995/96 while it was 4.2% in 1999/2000). A favourable weather condition and bumper harvest in 1995/96 led to low food prices. The year 1999/2000, on the other hand, was marked by drought with low agricultural production and relatively higher food prices. The national inflation rate was below zero (–7.2%) in 2000/2001 due to good weather condition and improved performance of the food sub-sector.
Table 3.3: Trends in inflation (%) 1997/98 1998/99 1999/00 2000/01 2001/02 2002/03 National 3.9 4.8 6.2 -5.2 -7.2 15.1 Urban 4.3 4.8 5.7 -3.5 Rural 3.8 3.7 3.8 -8.1
Source: NBE, 2003/04
22
3.2. Importance and Performance of the Food and Agriculture Sector Agriculture remains the main activity in the Ethiopian economy. It is the most important contributor to the country’s GDP: accounted, on the average, 65.5%, 52.7% and 47.1% of the GDP during 1960-1973, 1974-1991 and 1992-2002, respectively. Agriculture accounts for about 90% of the total export earnings of the country. About two-third of the total foreign exchange earnings is generated from coffee export. Exports from the livestock products that include mainly hides and skins, live animals and leather products are other main source of foreign exchange. Although the employment share of agriculture has declined over time (from 89% in 1984 to 80% in 1999.1011), it is still the main source of livelihood for a sizable majority of the proportion of the population: over 80% of the population earns their living from the sector. The employment share of agriculture has tended to decline, although slightly. There seems to be some shift to other sectors of the economy, particularly to the wholesale, retail trade and catering services (from ~4% in 1984 to ~10% in 1999). Undoubtedly, given its importance in the overall economy as a generator of income and employment, agriculture is potentially a vital sector in the country to achieve self-sufficiency in food production, reduce rural poverty and trigger a sustainable economic development. Agricultural production is dominated by smallholder households which produce more than 90% of agricultural output and cultivate more than 90% of the total cropped land. Smallholders drive their income either in cash or through own-consumption from agricultural production. According to the national accounts, the agricultural sector consists of crop, livestock, fishery and forestry sub-sectors. Crop production is the dominant sub-sector within agriculture, accounting for more than 60% of the agricultural GDP followed by livestock which contributes more than 20% of the agricultural GDP. The contributions of forestry, hunting and fishing do not exceed 10%.
3.2.1 Crop sub-sector Crop production is mainly exercised in the highland areas where the climate is suitable for sedentary agriculture. The sub-sector is dominated by small-scale farmers who cultivate less than one hectare of land under rain-fed farming system (see section IV). Because of the diverse agro-ecological zones, topography and natural vegetations, Ethiopian small farmers have developed complex farming methods and cropping patterns. Accordingly, seven different cereal crops, six pulse crops, seven oilseed crops, and a number of different other and tree crops are grown. Diversification has allowed farmers to cope with the drought or erratic rains but identifying the right technological package for the various ecologies and crops has been of considerable challenge to researchers and extension systems. Details on total crop production, area harvested and yield are given in Table 3.4. Cereal production grew by a mere 0.74% per annum (using long linear growth rate) between 1980 and 2001. The growth rates of pulses and oilseeds were even lower, 0.5 to 0.6% per annum. More importantly, extensification (area expansion) rather than intensification (yield increase) has been the major contributing factor in the increase in production. Over the period 1980-2001, yield of cereals, pulses 11 It should be noted that the 1984 employment share is based on the Population and Housing Census while the 1999 share is based on the National Labour Survey (CSA, 1984, 1999).
23

and oilseeds increased by only 0.17, 0.15 and 0.10% per annum, respectively, while the cultivated area for cereals, pulses and oilseeds increased annually by 0.57, 0.45, and 0.39% respectively. Hence, 78% of the growth in cereal production for the period 1980-2001 was achieved by extensification. Likewise, area expansion accounts for 76% and 80% of the growth in production of pulses and oilseeds, respectively. Therefore, the growth rate of area under cultivation has a much higher share in the growth rate of production for all crops than the growth rate of yield12.
12 The growth rate (in log linear) of production is the sum of the growth rates of area under cultivation and yield per hectare.
24

Table 3.4: Nation wide total area harvested, production and yield of Cereals, Pulses and Oil seeds
CEREALS PULSES OIL SEEDS
Total Production
Total Area Harvested
Cereal yield
Total Production
Total AreaHarvested
Pulses yield
Total Production
Total AreaHarvested
Oilseed yield
YEAR In ( ' 000 quintals)
In ( ' 000 hectares)
qt/ha in ( ' 000 quintals)
in ( ' 000 hectares)
qt/ha in ( ' 000 quintals)
in ( ' 000 hectares)
1980 53214.9 4501.236 11.82 8682.613 749.204 11.59 971.072 190.082 5.111981 50833.49 4384.166 11.59 8412.205 801.949 10.49 816.421 223.552 3.651982 64058.1 4777.449 13.41 9918.659 808.116 12.27 1246.418 260.894 4.781983 55019.31 4735.654 11.62 7342.502 784.935 9.35 1000.75 260.378 3.841984 39372.13 4535.617 8.68 5125.275 756.601 6.77 1024.201 279.578 3.661985 44192.51 4688.208 9.43 4829.103 692.426 6.97 992.921 289.304 3.431986 52363.77 4519.559 11.59 5431.51 593.854 9.15 822.885 211.885 3.881987 51105.21 4340.569 11.77 5338.517 699.863 7.63 773.578 188.129 4.111988 50754.51 4133.632 12.28 5574.606 610.266 9.14 719.936 203.327 3.541989 54438.72 4141.129 13.15 6319.359 598.883 10.55 897.243 224.186 4.001990 54265.74 3976.603 13.65 9778.026 687.582 14.22 995.884 248.003 4.011991 46584.79 3911.863 11.91 6366.677 714.622 8.91 887.431 212.313 4.181992 53186.79 3961.72 13.43 5956.071 723.73 8.23 719.071 215.019 3.341993 52737.34 4084.585 12.91 5352.903 725.166 7.38 788.076 207.323 3.801994 64188.31 5993.088 10.71 8055.569 916.255 8.79 1202.089 350.125 3.431995 82697.14 6652.56 12.43 8141.44 904.39 9.00 1952.61 391.58 4.991996 86293.32 6688.56 12.90 8026.28 905.35 8.87 2132.79 478.45 4.461997 64987.83 5601.88 11.60 6801.92 837.61 8.12 1836.96 410.01 4.481998 76829.91 6744.71 11.39 7319.76 875.38 8.36 1567.4 374.78 4.181999 77412.63 6747.46 11.47 9594.49 1044.98 9.18 1794.91 408 4.402000 92960.34 7636.65 12.17 10736.14 1233.94 8.70 2383.3 561.37 4.252001 87068.28 6370.11 13.67 10212.15 1016.79 10.04 2081.36 426.13 4.88Growth rate (log-linear)% 0.74 0.574 0.166 0.595 0.449 0.146 0.48 0.386 0.095 Source: CSA, Agricultural Sample Survey, Various issues As shown in Figure 3.2, yields have tended to stagnate over the years, despite the government’s effort to expand the use of fertilizer and increase the coverage of extension (see section V). It should be mentioned that the area expansion was achieved through cultivation of hillsides with high slopes, reducing or eliminating fallow land, and converting pasture, woodland and forest areas into farmland, with obvious negative implications for sustainable agriculture (Mulat, 1999)
25
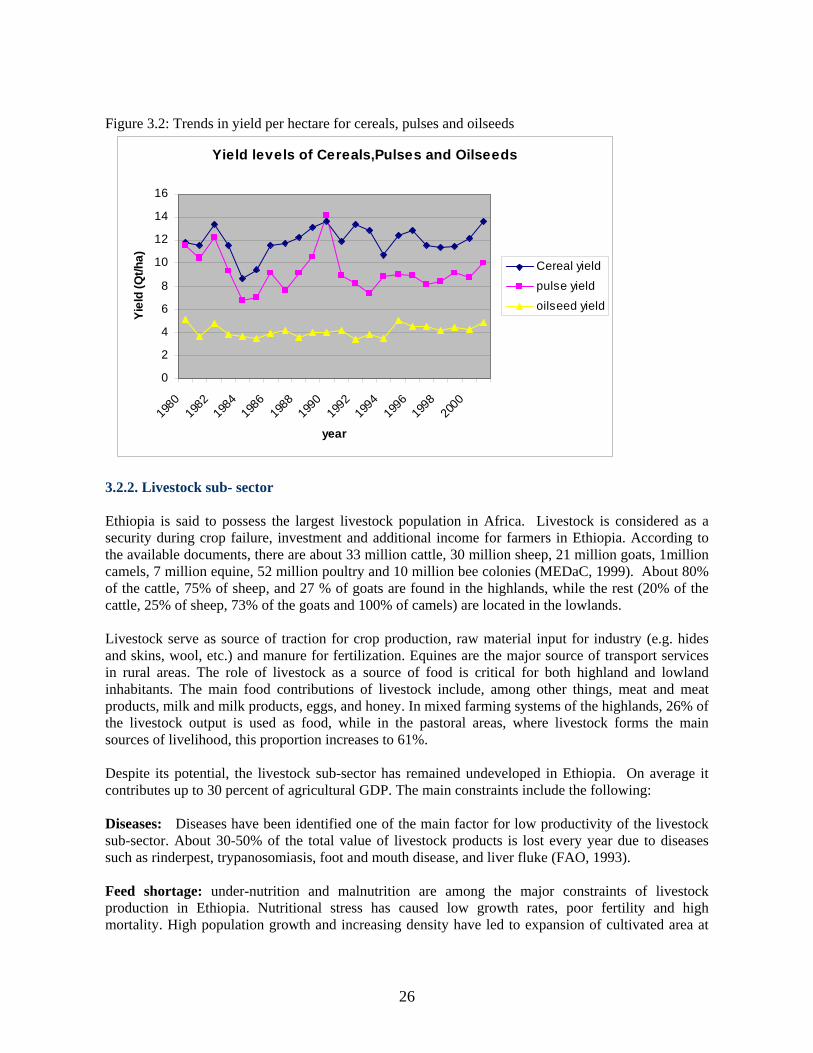
Figure 3.2: Trends in yield per hectare for cereals, pulses and oilseeds
Yield levels of Cereals,Pulses and Oilseeds
0
2
4
6
8
10
12
14
16
1980
1982
1984
1986
1988
1990
1992
1994
1996
1998
2000
year
Yiel
d (Q
t/ha) Cereal yield
pulse yield
oilseed yield
3.2.2. Livestock sub- sector Ethiopia is said to possess the largest livestock population in Africa. Livestock is considered as a security during crop failure, investment and additional income for farmers in Ethiopia. According to the available documents, there are about 33 million cattle, 30 million sheep, 21 million goats, 1million camels, 7 million equine, 52 million poultry and 10 million bee colonies (MEDaC, 1999). About 80% of the cattle, 75% of sheep, and 27 % of goats are found in the highlands, while the rest (20% of the cattle, 25% of sheep, 73% of the goats and 100% of camels) are located in the lowlands. Livestock serve as source of traction for crop production, raw material input for industry (e.g. hides and skins, wool, etc.) and manure for fertilization. Equines are the major source of transport services in rural areas. The role of livestock as a source of food is critical for both highland and lowland inhabitants. The main food contributions of livestock include, among other things, meat and meat products, milk and milk products, eggs, and honey. In mixed farming systems of the highlands, 26% of the livestock output is used as food, while in the pastoral areas, where livestock forms the main sources of livelihood, this proportion increases to 61%. Despite its potential, the livestock sub-sector has remained undeveloped in Ethiopia. On average it contributes up to 30 percent of agricultural GDP. The main constraints include the following: Diseases: Diseases have been identified one of the main factor for low productivity of the livestock sub-sector. About 30-50% of the total value of livestock products is lost every year due to diseases such as rinderpest, trypanosomiasis, foot and mouth disease, and liver fluke (FAO, 1993). Feed shortage: under-nutrition and malnutrition are among the major constraints of livestock production in Ethiopia. Nutritional stress has caused low growth rates, poor fertility and high mortality. High population growth and increasing density have led to expansion of cultivated area at
26
the cost of grazing land on which smallholder livestock production depends. Permanent pastureland is believed to have declined by close to 60% over the last three decades. It should be note that in areas where there is intensive cultivation, crop residues have become the main source of animal feed. In the lowlands, shortage of feed and water in drought years has resulted in loss of a large number of the animal population (Befekadu and Berhanu, 1999/00). Demand constraint: underdevelopment of roads and other infrastructure has hindered livestock take-off. It has been indicated that as income declines for a variety of reasons, livestock products are the first to be selected or removed from the menu by the majority of consumers. Also, during fasting seasons (which are many) of Christians, livestock products are not part of the daily menu, i.e. they are not entirely consumed which influences the demand for products negatively. Institutional and policy constraints: there are also institutional and policy related problems such as lack of institutional stability that could promote the sub-sector, lack of appropriate policies to promote and increase production and productivity of the sub-sector. Inadequate capital and recurrent budget allocations to the livestock sub-sector have also contributed to its low productivity. 3.2.3. Fishery sub-sector Ethiopia has a large body of inland waters, comprising eight principal lakes, numerous rivers and reservoirs. These water bodies host enormous wealth of fish resources. The fish production potential of these water bodies is estimated at about 30,000 – 40,000 metric tons (MT) per year. . Despite its high potential, the share of fishing in agricultural GDP is insignificant. Current annual fish production in Ethiopia is estimated at about 4, 400 MT (Mulat et al, 2003), which accounts for less than 15 percent of the available water bodies fish potential. More than half of the fish catch comes from principal lakes (lakes Abaya, Chamo and Ziway) that comprise only 20% of the total inland water bodies. A large part of the country has no access to lakes or rivers with fishing potential. Fish harvesting and processing technologies adopted by fishermen are traditional, leading to low quality and quantity of fish catch. Poor transport facilities have restricted the scope of marketing to the nearest local outlets where fish can be sold fresh immediately after catching. The fact that fish is not recognized as a diet by most Ethiopians has also constrained the development of the fish sub-sector.
3.2.4. Forestry sub-sector Forest resources are very important for economic development and for the maintenance of ecological balance. Forests are also good for the control of run-offs (erosion), replenishment of ground waters, and the maintenance of hydrological cycles that produce rainfall. The Ethiopian forests are being depleted at an alarming rate. At the turn of the last century, around the year 1900, the forest cover in Ethiopia was 40%, and recent estimates put it at only 3.6%. It is estimated that the current rates of depletion of forest cover is about 100, 000 hectares per year. At this rate of depletion, it will only take 15 years from now to exhaust all the forest covers. The primary cause of deforestation is cutting trees in order to open up new farmland to feed the ever-growing population. Widespread use of wood as fuel has also contributed to the deforestation. Making and selling charcoal is a major non-farm employment along the main roads of the country. Due to lack of adequate plan to conserve and use forest resource, the contribution from the sub-sector to the national economy is minimal. The forestry sub-sector contributes less than 6 % to the agricultural GDP and only 3% to the entire GDP of the country.
27
3.3 Major Constraints to Food Security and Agricultural Development Increasing agricultural productivity and expanding its productive capacity is the prerequisite for sustained economic growth in the country. It is impossible to stabilize the macro-economy without stabilizing the food economy. Unfortunately, agricultural development efforts of the last three decades have failed to address the problem of food security in Ethiopia. A review of key constraints to food security and agricultural development is essential to chart out an effective development path.
3.3.1 Erratic Weather Conditions
Much of Ethiopia is subject to a high degree of inter- and intra-seasonal climatic variability. Rains in Ethiopia are highly erratic and uneven. Often it is not changes in rainfall totals (i.e., those associated with climatological drought), but changes in the patterns of rainfall vis-à- vis moisture needs of key crops and animals that is key in productivity. High coefficient of variation in monthly, seasonal, and annual rainfall is particularly true in the semi-arid and arid districts where most of Ethiopia’s food insecure people are found.
Since rain-fed agriculture dominates the national economy, the performance of the sector is closely associated with availability of rainfall. Annual agricultural growth rates were fluctuating and show negative signs in eight years over the period 1981 to 2001 (see Table 3.5). These fluctuations are generally attributed to changes in rainfall and weather conditions. For instance, agricultural output declined by 21% during the major drought year of 1984. Rainfall was only 90% of the average for period 1980-2001 in 1984.
28
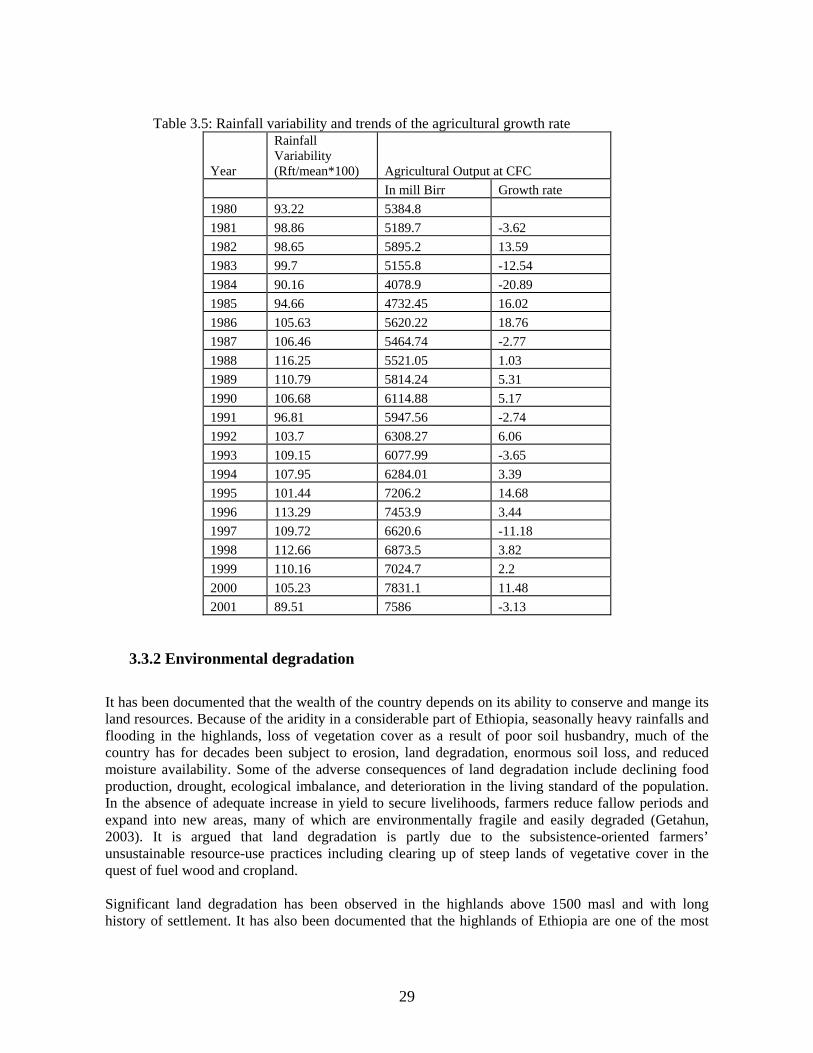
Table 3.5: Rainfall variability and trends of the agricultural growth rate
Year
Rainfall Variability (Rft/mean*100) Agricultural Output at CFC
In mill Birr Growth rate 1980 93.22 5384.8 1981 98.86 5189.7 -3.62 1982 98.65 5895.2 13.59 1983 99.7 5155.8 -12.54 1984 90.16 4078.9 -20.89 1985 94.66 4732.45 16.02 1986 105.63 5620.22 18.76 1987 106.46 5464.74 -2.77 1988 116.25 5521.05 1.03 1989 110.79 5814.24 5.31 1990 106.68 6114.88 5.17 1991 96.81 5947.56 -2.74 1992 103.7 6308.27 6.06 1993 109.15 6077.99 -3.65 1994 107.95 6284.01 3.39 1995 101.44 7206.2 14.68 1996 113.29 7453.9 3.44 1997 109.72 6620.6 -11.18 1998 112.66 6873.5 3.82 1999 110.16 7024.7 2.2 2000 105.23 7831.1 11.48 2001 89.51 7586 -3.13
3.3.2 Environmental degradation It has been documented that the wealth of the country depends on its ability to conserve and mange its land resources. Because of the aridity in a considerable part of Ethiopia, seasonally heavy rainfalls and flooding in the highlands, loss of vegetation cover as a result of poor soil husbandry, much of the country has for decades been subject to erosion, land degradation, enormous soil loss, and reduced moisture availability. Some of the adverse consequences of land degradation include declining food production, drought, ecological imbalance, and deterioration in the living standard of the population. In the absence of adequate increase in yield to secure livelihoods, farmers reduce fallow periods and expand into new areas, many of which are environmentally fragile and easily degraded (Getahun, 2003). It is argued that land degradation is partly due to the subsistence-oriented farmers’ unsustainable resource-use practices including clearing up of steep lands of vegetative cover in the quest of fuel wood and cropland. Significant land degradation has been observed in the highlands above 1500 masl and with long history of settlement. It has also been documented that the highlands of Ethiopia are one of the most
29

severely degraded lands in Africa (El-Swaify and Hurni, 1996 cited in Bewket and Sterk, 2002). Soil erosion by rain is the biggest problem in the country and average soil removal is about two billion tons per year. If this trend continues, then per capita income of the highlands would be reduced by about 30% by the year 2010. Soil degradation is not limited to highland areas. Pastoralists and agro-pastoralists of lowland areas are being affected by declining soil fertility, erosion and desertification.
3.3.3 Rapid population growth and declining farm size A very high population growth rate is also a typical feature of rural Ethiopia. The total population more than doubled during the past three decades, from 29.1million in 1972 to 67.2 million in 2002 (NOP, 2000).13 The sharp increase in the annual growth rate of population from 0.2% at the beginning of the century to 3% in the 1980s was mainly due to an increase in fertility rate and a decline in mortality. The high fertility rate of rural people (~6.99 per woman in rural areas compared to ~3.3 in urban areas) is the main reason for the rapidly increasing population. The main reasons for such high fertility rate in rural areas include, among others, early marriage, lack of access to family planning, economic value attached to children, etc. Rapidly growing population with limited possibility of expanding the area under rain-fed agriculture and lack of employment opportunities outside agriculture have led to a sharp decline in farm sizes. About 39% of the farming households in the country cultivate less than 0.5 hectares and about 89% cultivate less than 2 hectares. Only 0.75% of the farmers own more than 5 hectares of land (Table 3.6.). Small farm sizes under rain-fed conditions have reinforced subsistence production, in which production activities are guided by home consumption requirements. Small-scale farmers produce about 94% of food crops and 98% of coffee. State and private commercial farms account for the rest of production. Table 3.6: Number of Households by size of holding (1997/98) Items < .10 .10-.50 .51-1.0 1.01-2.0 2.01-5.0 5.01-10.0 >10.01 Total
No. of household (000) 583.5 3,020.63
2,500.09 2,137.4 982.89 64.06 4.36
9,292.9
% of households 6.28 38.78 65.69 88.7 99.26 99.95 100 100
No. of holders (000) 584.4 3,086.50 2,537.3 2,188.3 1,035.2 75.96 6.24
9,513.9
% of holders 6.14 38.58 65.25 92.2 99.71 99.98 100 100
Total land use (000 ha) 31.39 896.57 1,842.4 3,015.1 2,777.8 407.9 89.53 9,060.6
% of total land use 0.35 10.24 30.6 63.9 94.51 99.01 100 100 Average land holding/ household (ha) 0.05 0.3 0.74 1.41 2.83 6.37 20.53 0.98 Average land holding/ holder (ha) 0.05 0.29 0.73 1.38 2.68 5.37 14.35 0.95
Source: CSA, Land Utilization, Private peasant holdings, 1997/98 Addis Ababa, December 1998
3.3.4 Technological gaps
13 It should be noted that 67.2 million is the projected population size in the year 2002.
30
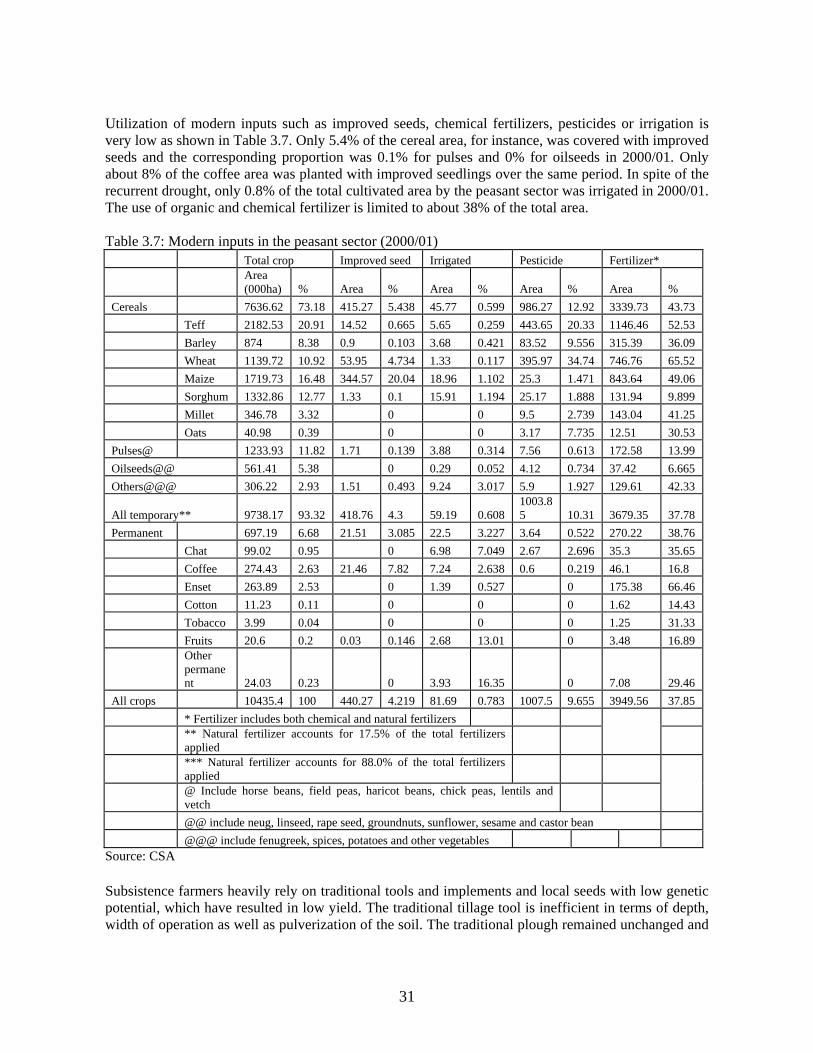
Utilization of modern inputs such as improved seeds, chemical fertilizers, pesticides or irrigation is very low as shown in Table 3.7. Only 5.4% of the cereal area, for instance, was covered with improved seeds and the corresponding proportion was 0.1% for pulses and 0% for oilseeds in 2000/01. Only about 8% of the coffee area was planted with improved seedlings over the same period. In spite of the recurrent drought, only 0.8% of the total cultivated area by the peasant sector was irrigated in 2000/01. The use of organic and chemical fertilizer is limited to about 38% of the total area. Table 3.7: Modern inputs in the peasant sector (2000/01)
Total crop Improved seed Irrigated Pesticide Fertilizer*
Area (000ha) % Area % Area % Area % Area %
Cereals 7636.62 73.18 415.27 5.438 45.77 0.599 986.27 12.92 3339.73 43.73 Teff 2182.53 20.91 14.52 0.665 5.65 0.259 443.65 20.33 1146.46 52.53 Barley 874 8.38 0.9 0.103 3.68 0.421 83.52 9.556 315.39 36.09 Wheat 1139.72 10.92 53.95 4.734 1.33 0.117 395.97 34.74 746.76 65.52 Maize 1719.73 16.48 344.57 20.04 18.96 1.102 25.3 1.471 843.64 49.06 Sorghum 1332.86 12.77 1.33 0.1 15.91 1.194 25.17 1.888 131.94 9.899 Millet 346.78 3.32 0 0 9.5 2.739 143.04 41.25 Oats 40.98 0.39 0 0 3.17 7.735 12.51 30.53 Pulses@ 1233.93 11.82 1.71 0.139 3.88 0.314 7.56 0.613 172.58 13.99 Oilseeds@@ 561.41 5.38 0 0.29 0.052 4.12 0.734 37.42 6.665 Others@@@ 306.22 2.93 1.51 0.493 9.24 3.017 5.9 1.927 129.61 42.33
All temporary** 9738.17 93.32 418.76 4.3 59.19 0.608 1003.85 10.31 3679.35 37.78
Permanent 697.19 6.68 21.51 3.085 22.5 3.227 3.64 0.522 270.22 38.76 Chat 99.02 0.95 0 6.98 7.049 2.67 2.696 35.3 35.65 Coffee 274.43 2.63 21.46 7.82 7.24 2.638 0.6 0.219 46.1 16.8 Enset 263.89 2.53 0 1.39 0.527 0 175.38 66.46 Cotton 11.23 0.11 0 0 0 1.62 14.43 Tobacco 3.99 0.04 0 0 0 1.25 31.33 Fruits 20.6 0.2 0.03 0.146 2.68 13.01 0 3.48 16.89
Other permanent 24.03 0.23 0 3.93 16.35 0 7.08 29.46
All crops 10435.4 100 440.27 4.219 81.69 0.783 1007.5 9.655 3949.56 37.85 * Fertilizer includes both chemical and natural fertilizers
** Natural fertilizer accounts for 17.5% of the total fertilizers applied
*** Natural fertilizer accounts for 88.0% of the total fertilizers applied
@ Include horse beans, field peas, haricot beans, chick peas, lentils and vetch
@@ include neug, linseed, rape seed, groundnuts, sunflower, sesame and castor bean @@@ include fenugreek, spices, potatoes and other vegetables
Source: CSA
Subsistence farmers heavily rely on traditional tools and implements and local seeds with low genetic potential, which have resulted in low yield. The traditional tillage tool is inefficient in terms of depth, width of operation as well as pulverization of the soil. The traditional plough remained unchanged and
31
requires several passes to prepare land for planting (Mulat, 1999). Apart from its labour-intensive nature and requiring many draught animals, the present technology of land preparation is of little use for turning the subtle and weeds into the soil. It has been repeatedly argued that the food crisis in the country necessitates the importance of promoting technological innovations for increasing food production and minimising post-harvest losses. The apparent lack of problem solving technical innovations in the agriculture has led to yield stagnation (Getahun, 2003).
3.3.5 Infrastructural, institutional and other constraints
The importance of infrastructure such as roads cannot be overemphasized in boosting agricultural production and productivity. The transport and communication systems are virtually underdeveloped and the country’s road network is one of the least even by African standards with a density of 17.3km per 1000 sq. km in the 1990s, indicating that a large part of the country’s potentially productive areas are inaccessible. Studies indicate that about three-fourth of Ethiopian farmers live more than half-a-day walk from all-weather roads. Geographical barriers to inter-regional trade are accentuated by the fact that all major roads converge on Addis Ababa, and agricultural distribution and marketing are predominantly focused on the city. Inadequate road networks increase transport costs and constrain the viability of grain trade that would otherwise moderate price fluctuations. Transaction costs such as handling and transport costs are high due to small quantities that farmers bring to market places via small bags carried on head or on the back of pack animals (Mulat, 1999). An estimate of 30% of the total grain output has been lost due to inadequate storage and poor transport facilities (Getahun, 2003). It has been argued that a more efficient marketing system calls for a more timely and widely dissemination of market information. Input markets are extremely inefficient in Ethiopia. For instance, fertilizer market is dominated by a parastatal and a few companies with connections to the local governments. Improved seeds are not available in the open market and the government, through its different agencies like the Ethiopian Seed Enterprises, is in charge of distributing improved seeds to farmers. Delays in input delivery14 and lack of coordination of seed supply, fertilizer distribution, credit and output marketing are the major limiting factor for technological adoption and retards agricultural production in the peasant sector. The land market is underdeveloped in Ethiopia mainly due to the land policy that restricted ownership of land to the state and gave only usufruct right to farmers. It is widely believed that the existing land policy has contributed to fragmentation and underutilization of the country’s land resources. Consolidation of holdings into larger and more efficient farm size cannot be undertaken by efficient farmers since transfer of land by way of lease or sale has always been severely curtailed. With regard to social development such as education and health indicators, Ethiopia has one of the highest adult and youth illiteracy rates in the world as well as in sub-Sahara African countries. The adult illiteracy rates for males and females were 57 and 68 in 1999/2000, respectively, (MOFED, 2002). The youth illiteracy rates for males and females were 46 and 48, respectively. Emerging evidences show that a quarter of the Ethiopian population live some 6 kms or more and 19.3 kms away
14 Recent evidences indicate that 31% of farmers who bought DAP complain about late delivery of chemical fertilizers. In terms of regional disagreggation, the highest complain was observed in SNNPR (49%) and Oromiya (41%) than in Tigray (3%) and Amhara (18%). These delays can largely be attributed to the long process of organizing and processing bid procurement. Late arrival is believed to have contributed to lower yields, hence lower profitability of fertilizer (DSA, 2001; Mulat, 2003).
32

from primary secondary schools respectively (MOFED, 2002). The rural-urban divide is enormous in terms of accessibility of educational infrastructure, where the situation is even worse in rural areas. The majority of the Ethiopian population do not have access to adequate health facilities. The average distance from the residence of a household to the nearest health centre was 7 kms in Ethiopia (See Table 4.4). About 50% of the population in the country reside over 6 kms away from health centres. More importantly, the rate of HIV/AIDS infection is rising and some 7.3 to 10% of the adult population is reportedly HIV positive. The country is losing its prime labor force with serious social and economic implications. 3.4 Agricultural Strategies and Policies The effort to develop the rural and agricultural sectors began in the 1960s with the launching of the comprehensive and minimum package agricultural projects in high potential areas using the free market policy framework. A new approach designed to transform the rural areas along the socialist mode of production was introduced in the mid 1970s. The communist experiment ended in 1991 when a new development strategy called Agricultural Development Led Industrialization (ADLI) was introduced and the policy of market liberalization was announced. This section examines past strategies and polices with the aim of establishing the implications for the poor performance of the sector. 3.4.1 Pre-1991 The Imperial regime Until the late 1960s, peasant agriculture was not given due emphasis by policy makers and planners. Bimodal strategy for agricultural development was adopted in the late 1960s, namely large-scale mechanized commercial farms and the establishment and development of package projects. Large-scale mechanized commercial farms require extensive area of land under cultivation with the use of modern agricultural inputs such as modern technology, machinery, equipment (tractors and combiners), spray airplanes for pesticides, chemical fertilizers, and hired labor contrary to the family labor used in the small scale farming systems. These farms were producing mainly food and fibber that were used as inputs for the industrial establishments. The government took some kind of fiscal measures to encourage the expansion of these farms in the country. Among the policy measures adopted by the government were tax concession- low tax land use and tax-free import of heavy machinery and equipment. Despite all the encouragements made by the government, the achievement of these farms was less than satisfactory. The commercial farming accounted for 5% of the total agricultural output and 3% of the total area cultivated. Investment in the commercial farming accounted for about 13.7% and 21.3% of the total investment in the agriculture sector during its First-Five-Year (1957-1961) and Second-Five-Year (1963-1967) development plans, respectively, (Belay, 2003). Although this investment is relatively meager, but has lead to some expansion of commercial farms engaged in the production of cash crops for exports and raw materials for domestic industries. Because of dissatisfaction with the poor performance and continued stagnation of commercial farms and pressure from international donor agencies, the government started acknowledging the impotence of small farm households and made attempts to modernize it. As a result, the first integrated rural development project, the Chilalo Agricultural Development Unit (CADU), was introduced in one of
33
the high potential area of the country, Arsi, South of Addis Ababa, in 1967. The project, CADU, aimed at a general socio-economic development including agronomic research, diffusion of research results, provision of modern farm inputs, marketing and credit facilities, promotion of cooperative societies, price stabilization, and training of local project employees. Based on the experience of CADU15, two other comprehensive package projects with similar objectives were initiated: the Wolamo Agricultural Development Unit (WADU) in Wolaita in 1970 and the Ada District Development Project (ADDP) in Debre Zeit, in 1972. However, it appeared that the comprehensive package project was found to be too costly in financial terms and in terms of availability of skilled manpower to replicate in other regions of the country. Thus, the then government adopted another package which thought to be compatible with the available resources and less expensive to replicate in different areas of the country such as the Minimum Package Project (MPP) in 1971. Like the comprehensive package project, the impact of MPP on peasant agriculture was below expectation mainly due to lack of appropriate agricultural technologies adaptable to the different agro-ecological zones of the country. Interventions under the Imperial regime focussed on introduction of new technologies and promotion of commercial agriculture in high potential areas. It was generally felt that the major beneficiaries were members of the ruling class and a few elites that owned land and had access to government finance and incentives. A growing gap between the rich and the poor and dictatorial rule by the emperor triggered protests and opposition against the Government. There was very little attempt to arrest environmental degradation and moisture stress in marginal areas. The only option for farmers in the degraded and drought-prone areas of the north was to settle in the southern, western and the Rift Valley areas through spontaneous and planned settlement schemes. A relatively small number of peasants are believed to have relocated their residence in more fertile areas. Traditional agriculture in the north increasingly failed to sustain life for the increasing population, culminating in the Wollo famine of 1972-74 that led to the overthrow of the 2,000 year old feudal system of rule in 1974.
3.4.2 The Socialist/ Military Regime
The uprising in 1974 that led to the overthrow of the Emperor was accompanied by changes in the ideological thinking in favor of socialist principles. It was followed by an overall shift in the economic policies of the country in which state control of the economy was over-extended. The official policy in agriculture became expansion of state and collective farms and all rural lands became public property and private ownership of land was banned following the 1975 land reform. It was declared that land would be distributed to tillers without compensation to former owners (landlords). There were no circumstances which had been encouraging private sector participation in economic activity. The new policy paradigm was also manifesting itself in the different sectors of the economy. The proclamation limited the size of land to a maximum of 10 hectares and transfer of land by any means such sale, exchange, lease, etc was strictly prohibited. The reform was also made provisions for the formation of peasant associations (Pas), the main instrument for implementing the land reform program. The
15 CADU managed to increase wheat yield from 13 quintal per hectare in 1967 to 20 quintals per hectare in 1974. It also helped farmers to increase milk yield from 300 liters per lactation period per cow in 1967 to 1000 liters per lactation period per cow in 1974. As a result, the per capita income of Arssi doubled the national average in rural areas that was Birr 450 per year in 1967 to Birr 939 per year in 1974. On top of these, marketing facilities had been made easy through the construction of feeder roads (MOE, 2002).
34

formation of Service and Producers’ Cooperatives was highly encouraged. A villagization program, designed to bring distant households into small village clusters, was also initiated in the mid 1980s to expedite the process of collectivization. The MPP launched during the Imperial regime continued in the Derg regime. The government, however, favoured state-owned large-scale farms and Producer Cooperatives in the form of offering low cost fertilizer, interest free loans, and relatively fertile farmlands. The impact of these measures on the performance of the agricultural sector was disastrous: low production of food grains and high grain prices in urban areas. This forced the government to establish a parastatal marketing agency known as the Agricultural Marketing Corporation (AMC) with the aim of stabilizing grain prices in the urban areas at the expense of farmers. AMC purchased grain from farmers at artificially low price and sold to urban dwellers at a reduced price. The whole operation was assisted by compulsory grain delivery imposed on farmers. Restrictions on inter-regional grain movement by private traders and quota system discouraged farmers from producing more and investing in agriculture. Because of the poor performance of the agriculture and their dissatisfaction with the government policies and strategies of the government, donors withdrew their support to the MPP. Hence, the minimum package project was phased out in the mid 1985 and replaced by the Peasant Agricultural Development Extension Program (PADEP) with the objective of increasing food production, promoting rural employment opportunities, developing the production of cash crops for exports and raw materials for domestic industries. Due to disagreement between the government and donors, the implementation of PADEP was terminated. Despite emphasis of the government on state and collective farms in terms of providing credit and investment, their performance was less than satisfactory. The socialist regime failed to tackle the root causes of food insecurity in low potential areas. Top-down approach in policy formulation and implementation excluded farmers from participation in the development process. Farmer organizations were brought under the direct complete control of the Government and the ruling party, Workers Party of Ethiopia. Independent initiative was stifled. Investment in irrigation was very limited and the entire focus of the Government was rather on collective and state farms in high potential areas and early warning system and coordination of relief activities in low potential areas. The Relief and Rehabilitation Commission (RRC) was given the responsibility of gathering information to identify areas which may suffer widespread food shortages in following years. At the end of each harvest season, a food supply prospect report was produced along with an assistance requirement report for the donor community. RRC also produced a quarterly pastoral area assessment report covering the vulnerability and food needs of the pastoral areas (Caldwell, 1992). Attempts to build the productive capacity of the farmers and thereby break the cycle of dependence on food aid were non-existent. On the contrary, public ownership of land made it very difficult for farmers to invest on land. Farmers were also observed to reduce their livestock size in order to meet the selection criteria and make themselves eligible for relief distribution (Debebe, 2001). Resettlement of farmers from drought-prone areas became a major undertaking in the 1980s especially after the 1984 disastrous famine. The scheme was meant to relieve the population pressure of the vulnerable areas, promote food security and to bring about the environmental rehabilitation of these areas. In the period 1984-86, the Military Government resettled some 600,000 people mostly in the lowlands of western Ethiopia. It is estimated that 33,000 settlers lost their lives due to disease, hunger, and exhaustion, and thousands of families were broken up. Apart from the huge loss of life and
35
financial cost, losses due to environmental damage, livestock death and loss of property are reported to be significant (Dessalign, 2004). 3.4.3 Post-1991
Protracted civil war and the consequent deepening crisis in the political and economic situation of the country led to the change in government and the establishment of the Transitional Government of Ethiopia (TGE) in July 1991. The then TGE, backed by World Bank and IMF, adopted the Transitional Economic Policy, which continued to be the official economic document of the country, and further strengthened and deepened by initiating a series of reform measures with the objective of revitalizing and reversing the centralized economic system into a more market-based economy. The adoption of the new economic policy laid a corner-stone for a conducive policy environment that dissolved producer cooperatives, encouraged small holder and private commercial farms, reduced public investment in state farms, removal of input subsidy, devaluation (and subsequent depreciation of the real exchange rate), market (both input and output) liberalization, and abolition of inter-regional trade movements. As part of the economic reform program, the government has also embarked upon an extensive privatization program with a view to curtail the role of the government in the production and distribution of goods and services. A development strategy popularly known as agricultural development-led-industrialization (ADLI) which emphasizes on the development of peasant agriculture and on making the agricultural sector the driving force of the national economy was adopted. At the heart of this strategy lies, the attainment of food self-sufficiency, increase and diversify production of raw materials and thereby promote the linkage of the agricultural sector with the industrial sector. The main premises of the strategy are that agriculture acts as the springboard of the overall development process on account of its superior growth linkages; and it has also been widely recognized and accepted that Ethiopia cannot progress without strengthening of agricultural production and productivity. This strategy aims at improving the production and productivity of smallholder agriculture through generation, adoption and diffusion of new farm technologies in the form of improved inputs and farming methods. In order to mobilize small farmers and dissemination of better farming practices, the development strategy has been operationalized via Participatory Demonstration and Extension Training System (PADETS). The main features of PADETS, among others, include sizeable demonstration plots in the field of the farmer himself/ herself, provision of input credit, and market led inputs and output markets. Since the operationalization of PADETS in the country in the mid 1990s, fertilizer and selected seeds have witnessed widespread and increased rates of adoption in different regions. The quantity of commercial fertilizer used by the peasant sector increased from 107,457 tons in 1993 to 297,907 in 2000, although declining to 230,000 in 2002. Moreover, the number of participating farmers has shown an increasing trend, covering about 40 percent of the farming population. (The number of extension participant farmers rapidly expanded from 32,047 in 1995 to over 4 million in 2001). Recognizing the complexity and intractable nature of poverty, the Government has prepared Sustainable Development and Poverty Reduction Strategy Program (SDPRP). SDPRP calls for empowering local community and demand-driven approach to technology generation and dissemination. The Government has also committed itself to the devolution of power to woredas (districts) and kebeles (villages) facilitating the direct participation of the people in growth and
36

poverty reduction endeavors. Lack of independent grassroots organizations (e.g. association of producers (dairy, wheat, maize, etc.), farmers union, etc.) is perhaps the biggest challenge to the realization of the decentralization objective. In order to address the food insecurity challenges of Ethiopia, a consultative process has been undertaken to establish a partnership between the Government and its development partners. A high level workshop was organized by the Government on 11-12 June 2003 to search for a lasting solution to the issue of chronic food insecurity. The workshop gave rise to the formation of the New Coalition for Food Security. The Coalition established a Technical Group comprising of specialists representing both Government and development partners who were given the mandate to draft a plan and an action plan to drastically reduce food insecurity. The five-year goal is to attain food security for five million chronically food insecure people, while, at the same time, improving and sustaining the overall food security of an additional ten million people. Although the Collation signals a major departure from traditions and practices in the past, it is still the same top-down intervention with no or little participation of the actual stakeholders, the farming community. The Federal Food Security Steering Committee (FSSC) is chaired by the Deputy Prime Minister, it is composed of four Government representatives and four elected donor representatives. It will provide policy and strategic advice to the government. The Regional Food Security Coordination Offices will continue to be the focal point for the overall coordination and secretary of the Regional Food Security Steering Committee. All food security activities at the woreda level are discussed in most localities by the Woreda Development Committee. A Woreda Food Security Desk oversees the practical implications of the various elements of the program, provides guidance to each sector and stakeholders involved in the woreda, coordinates priorities and capacity building efforts, in close liaison with regional level. This is hardly a reflection of inclusive institutions. A wider ownership of the program by stakeholders does not exist. Both the SDPRP and the New Coalition for Food Security attach significance to the role of resettlement in reducing the pressure exerted on land in drought-prone areas. Intra-regional voluntary settlement schemes in sparsely populated and under-utilized areas is considered as one of the key instruments to attain food security. The scheme is expected to involve 440,000 heads of households (totaling 2.2 million people including their families) in four regions (Amhara, Oromiya, Southern Nations, Nationalities and Peopels (SNNP) and Tigray). Preliminary study puts serious doubt about the Government claim on the presence of abundant unoccupied land suitable for cultivation even in regions with more favorable weather and fertile land such as Oromiya and SNNP (Alemneh, 2003). It should be noted that governments in Ethiopia resort to resettlement following their failure to develop the non-agricultural sector (to absorb the surplus rural labor) and promote intensification on the farm (to increase the absorptive capacity of the land). The Federal Government has chosen to uphold the land policy of the former socialist government on the ground that private freehold system would lead to sales of land at times of drought or shocks, with subsequent massive migration to urban centers. According to the December 1994 Constitution, ‘… the right to ownership of rural and urban land, as well as of all natural resources is exclusively vested in the state and the peoples of Ethiopia. Land is common property of the nations, nationalities and Peoples of Ethiopia and shall not be subject to sale or to other means of transfer’. Some regions (eg. Tigray) have recently introduced land titles to proved more security and encourage investment. However, a study in Tigray reported that land certification, although a positive initiative, it cannot
37

address issues of insecurity, ownership and transfer of land (Atakilte, 2003). The efficiency cost of tenure insecurity appears to be very high.
38

3.5 Role of Civil Societies in Policy Formulation and Implementation Community organizations and institutions are vital in promoting people’s participation for provision of services and resources for human development, improving resource allocation and for ensuring effective public service delivery. Grassroots institutions have proved to be the most effective partners in the fight against poverty. Farmers, women and youth in rural areas have never been able to organize their own independent association to protect their rights and interests. Trade, teachers and student unions as well as business associations in urban came into being and operated under a generally unfavorable political environment where independent associations and organizations outside the tutelage and control of the state were viewed with suspicion. The Military government violently smashed any attempt of the unions to maintain independence. It purged their leaders in the late 1970s and replaced them with those that were zealous supporters of the government and its ideology.16 It also created national associations such as the Revolutionary Ethiopia Farmers Association (REFA), Revolutionary Ethiopia Youth Association (REYA), and Revolutionary Ethiopia Women’s Association (REWA) to serve as an instrument for its policy of control and suppression. The present government came to power in 1991 with a promise of democratic freedom and multi-party politics. Nonetheless, it has been equally unwilling to tolerate independent unions or associations. According to Dessalegn17, ‘its favored tactic since the early 1990s has been to force a split in trade unions considered hostile to its policies and then give its support in favor of leaders friendly to it. On occasion, independent minded leaders have been harassed, thrown in jail on trumped up charges, or forced to flee the country’. One of the major reasons for lack of sustained development in Ethiopia is lack of adequate mechanism to articulate the interest of peasants and ensure their active participation in planning and execution of development projects. Independent farmers’ unions, interest groups, union of wageworkers and associations/network of craft workers have never been part of the rural life. In the absence of civic organisations to protect their interest, interactions with public officials have placed a large burden on poor people. They are unable to take advantage of new economic opportunities or engage in activities outside their immediate zone of security, i.e. subsistence farming18. 3.6 Pattern of Support and Terms of Trade 3.6.1 Budgetary Allocation
Public expenditure in agriculture is one of the indicators of government’s commitment to the sector. Despite the dominance and significance of agriculture in the overall economy, the level of government resources invested has been very much limited particularly in the 1980s. Government expenditure in agriculture was, on average, 1.6% of GDP during the period spanning 1980-2001 and the trend increased only marginally from 1.3% in 1992 to 1.5% in 2001 (Figure 3.3).
16 See for instance, Taketel Abebe. 2000. ‘Civil Society: Some Theoretical and Conceptual Issues’ in Alemu Mekonnen and Dejene Aredo (eds), op cit.; Dessalegn Rahmato. 2002. ‘Civil Society Organizations in Ethiopia’ in Bahru Zewde and S. Pausewang (eds), op cit. 17 Dessalegn Rahmato. 2002. ‘Civil Society Organizations in Ethiopia’ in Bahru Zewde and S. Pausewang (eds), op cit. 18 Mulat Demeke. 2001. Off-farm income generation opportunities in Ethiopia: with particular reference to food-insecure woredas, Department of Economics, Addis Ababa University, unpublished report.
39
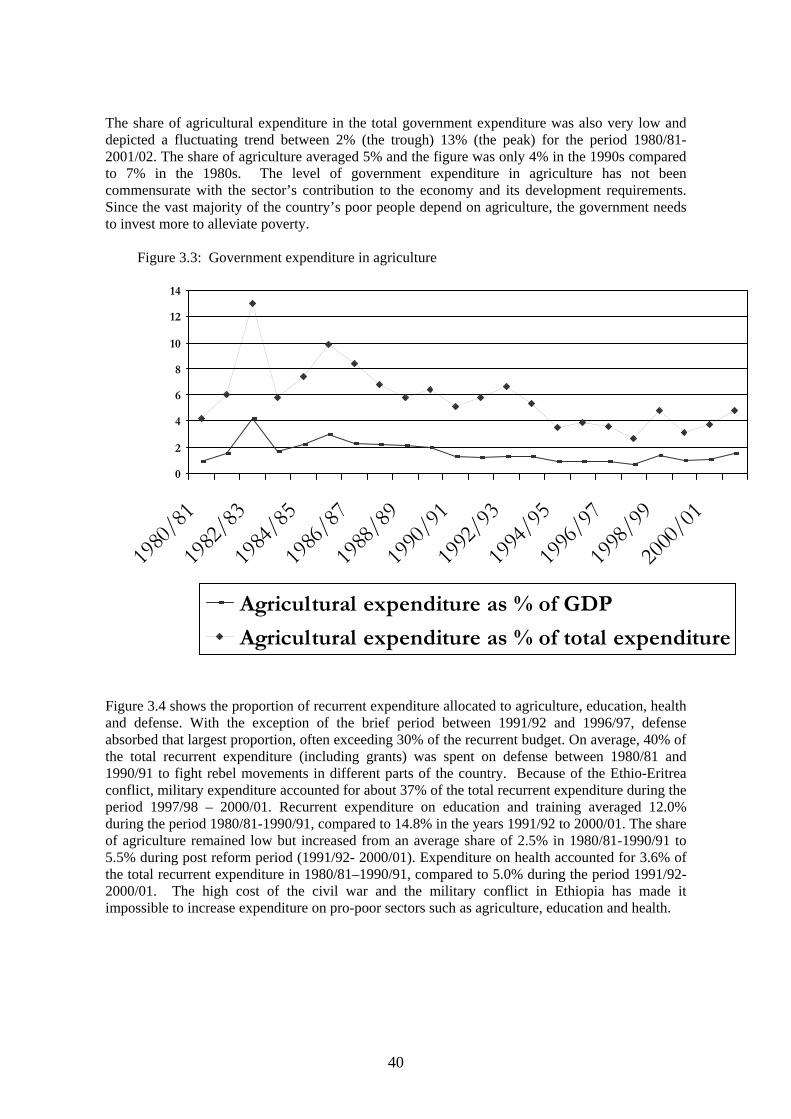
The share of agricultural expenditure in the total government expenditure was also very low and depicted a fluctuating trend between 2% (the trough) 13% (the peak) for the period 1980/81-2001/02. The share of agriculture averaged 5% and the figure was only 4% in the 1990s compared to 7% in the 1980s. The level of government expenditure in agriculture has not been commensurate with the sector’s contribution to the economy and its development requirements. Since the vast majority of the country’s poor people depend on agriculture, the government needs to invest more to alleviate poverty.
Figure 3.3: Government expenditure in agriculture
0
2
4
6
8
10
12
14
1980/81
1982/83
1984/85
1986/87
1988/89
1990/91
1992/93
1994/95
1996/97
1998/99
2000/01
Agricultural expenditure as % of GDP
Agricultural expenditure as % of total expenditure
Figure 3.4 shows the proportion of recurrent expenditure allocated to agriculture, education, health and defense. With the exception of the brief period between 1991/92 and 1996/97, defense absorbed that largest proportion, often exceeding 30% of the recurrent budget. On average, 40% of the total recurrent expenditure (including grants) was spent on defense between 1980/81 and 1990/91 to fight rebel movements in different parts of the country. Because of the Ethio-Eritrea conflict, military expenditure accounted for about 37% of the total recurrent expenditure during the period 1997/98 – 2000/01. Recurrent expenditure on education and training averaged 12.0% during the period 1980/81-1990/91, compared to 14.8% in the years 1991/92 to 2000/01. The share of agriculture remained low but increased from an average share of 2.5% in 1980/81-1990/91 to 5.5% during post reform period (1991/92- 2000/01). Expenditure on health accounted for 3.6% of the total recurrent expenditure in 1980/81–1990/91, compared to 5.0% during the period 1991/92-2000/01. The high cost of the civil war and the military conflict in Ethiopia has made it impossible to increase expenditure on pro-poor sectors such as agriculture, education and health.
40
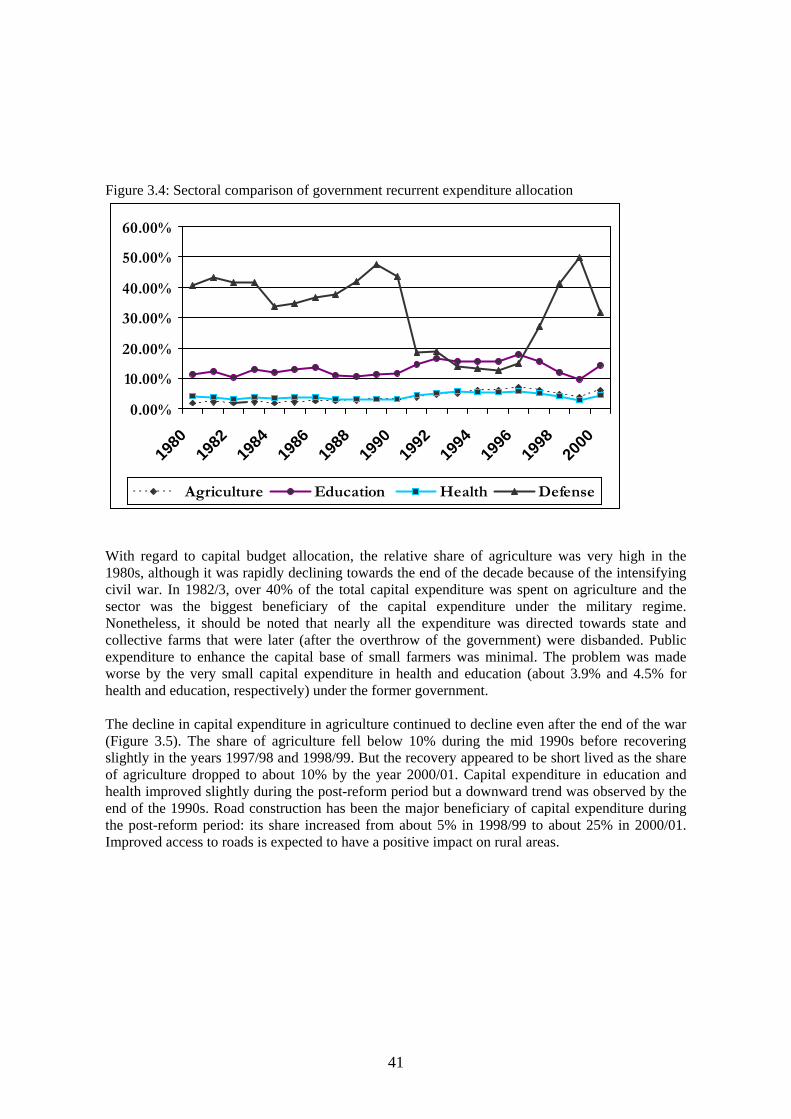
Figure 3.4: Sectoral comparison of government recurrent expenditure allocation
0.00%
10.00%
20.00%
30.00%
40.00%
50.00%
60.00%
1980
1982
1984
1986
1988
1990
1992
1994
1996
1998
2000
Agriculture Education Health Defense
With regard to capital budget allocation, the relative share of agriculture was very high in the 1980s, although it was rapidly declining towards the end of the decade because of the intensifying civil war. In 1982/3, over 40% of the total capital expenditure was spent on agriculture and the sector was the biggest beneficiary of the capital expenditure under the military regime. Nonetheless, it should be noted that nearly all the expenditure was directed towards state and collective farms that were later (after the overthrow of the government) were disbanded. Public expenditure to enhance the capital base of small farmers was minimal. The problem was made worse by the very small capital expenditure in health and education (about 3.9% and 4.5% for health and education, respectively) under the former government. The decline in capital expenditure in agriculture continued to decline even after the end of the war (Figure 3.5). The share of agriculture fell below 10% during the mid 1990s before recovering slightly in the years 1997/98 and 1998/99. But the recovery appeared to be short lived as the share of agriculture dropped to about 10% by the year 2000/01. Capital expenditure in education and health improved slightly during the post-reform period but a downward trend was observed by the end of the 1990s. Road construction has been the major beneficiary of capital expenditure during the post-reform period: its share increased from about 5% in 1998/99 to about 25% in 2000/01. Improved access to roads is expected to have a positive impact on rural areas.
41

Table 3.8: Sectoral structure of capital budget allocation (in %) Sector 1980 1981 1982 1983 1984 1985 1986 1987 1988 1989 1990 1991 Average
Agriculture 21.56 27.66 41.56 21.73 33.37 35.29 29.69 23.28 17.41 21.64 19.97 15.99 25.76 Road construction 27.18 27.18 27.18 27.18 27.18 27.18 27.18 27.18 27.18 27.18 27.18 27.18 27.18 Education 4.51 4.51 4.51 4.51 4.51 4.51 4.51 4.51 4.51 4.51 4.51 4.51 4.51
Health 3.86 3.86 3.86 3.86 3.86 3.86 3.86 3.86 3.86 3.86 3.86 3.86 3.86
1992 1993 1994 1995 1996 1997 1998 1999 2000
Agriculture 19.24 13.85 9.26 10.04 8.36 8.12 16.94 14.19 10.95 12.33 Road construction 10.99 15.38 23.75 18.99 19.02 25.88 24.80 25.90 24.88 21.07 Education 4.95 9.50 8.53 12.40 9.85 10.96 10.66 7.46 11.43 9.53
Health 3.73 2.54 3.80 4.32 5.71 6.97 4.33 4.34 5.61 4.59
Source: Own computation from MOFED data
Figure 3.5: Sectoral comparison of government capital expenditure allocation
0.00%
10.00%
20.00%
30.00%
40.00%
50.00%
1980
1982
1984
1986
1988
1990
1992
1994
1996
1998
2000
Agriculture Road construction Education Health
The share of recurrent expenditure in the total budget is very high in Ethiopia: it averaged 72.8% during the period 1980/81-1991/92, compared to 67.4% in 1992/93-2000/01 (Table 3.9). Despite the slight decline during the post-reform period, recurrent budget, which is largely made up of salary payments, accounts for a sizeable proportion of the total government expenditure. Limited public investment has resulted in inadequate infrastructure in both rural and urban areas, which in turn has discouraged private investment in agriculture, industry and other sectors of the economy. Table 3.9: Share of recurrent budget in the total government budget (1980/81 to 2000/01) 1980/81 1981/82 1982/83 1983/84 1984/85 1985/86 1986/87 1987/88 1988/89 1989/90 1990/91
Recurrent 1791.20 1934.60 2562.40 2265.00 2737.50 2659.40 2754.00 3596.15 3972.63 3929.10 3767.36Total 2281.52 2629.76 3786.15 3168.99 3823.38 4062.23 4003.07 4820.80 5725.92 5282.99 4854.42Share of recurrent (in %) 78.51 73.56 67.68 71.47 71.60 65.47 68.80 74.60 69.38 74.37 77.61
1991/92 1992/93 1993/94 1994/95 1995/96 1996/97 1997/98 1998/99 1999/00 2000/01
Recurrent 3365.21 3607.83 4657.81 5517.94 5996.23 5750.40 7190.52 10533.06 13676.49 10441.24
Total 4205.39 5219.39 7094.01 8371.95 9144.82 10014.88 10798.85 14677.22 17531.59 15737.27
Share of recurrent (in %) 80.02 69.12 65.66 65.91 65.57 57.42 66.58 71.76 78.01 66.35 Source: MOFED
42
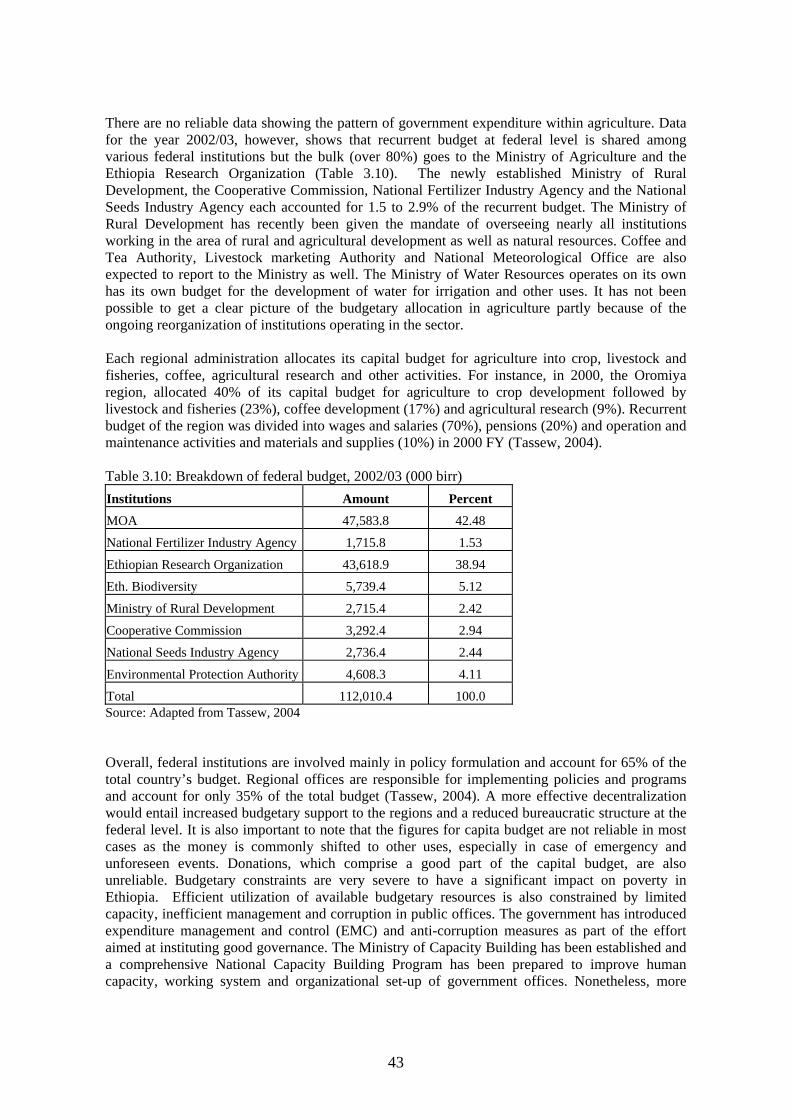
There are no reliable data showing the pattern of government expenditure within agriculture. Data for the year 2002/03, however, shows that recurrent budget at federal level is shared among various federal institutions but the bulk (over 80%) goes to the Ministry of Agriculture and the Ethiopia Research Organization (Table 3.10). The newly established Ministry of Rural Development, the Cooperative Commission, National Fertilizer Industry Agency and the National Seeds Industry Agency each accounted for 1.5 to 2.9% of the recurrent budget. The Ministry of Rural Development has recently been given the mandate of overseeing nearly all institutions working in the area of rural and agricultural development as well as natural resources. Coffee and Tea Authority, Livestock marketing Authority and National Meteorological Office are also expected to report to the Ministry as well. The Ministry of Water Resources operates on its own has its own budget for the development of water for irrigation and other uses. It has not been possible to get a clear picture of the budgetary allocation in agriculture partly because of the ongoing reorganization of institutions operating in the sector. Each regional administration allocates its capital budget for agriculture into crop, livestock and fisheries, coffee, agricultural research and other activities. For instance, in 2000, the Oromiya region, allocated 40% of its capital budget for agriculture to crop development followed by livestock and fisheries (23%), coffee development (17%) and agricultural research (9%). Recurrent budget of the region was divided into wages and salaries (70%), pensions (20%) and operation and maintenance activities and materials and supplies (10%) in 2000 FY (Tassew, 2004). Table 3.10: Breakdown of federal budget, 2002/03 (000 birr) Institutions Amount Percent MOA 47,583.8 42.48
National Fertilizer Industry Agency 1,715.8 1.53
Ethiopian Research Organization 43,618.9 38.94
Eth. Biodiversity 5,739.4 5.12
Ministry of Rural Development 2,715.4 2.42
Cooperative Commission 3,292.4 2.94
National Seeds Industry Agency 2,736.4 2.44
Environmental Protection Authority 4,608.3 4.11
Total 112,010.4 100.0 Source: Adapted from Tassew, 2004 Overall, federal institutions are involved mainly in policy formulation and account for 65% of the total country’s budget. Regional offices are responsible for implementing policies and programs and account for only 35% of the total budget (Tassew, 2004). A more effective decentralization would entail increased budgetary support to the regions and a reduced bureaucratic structure at the federal level. It is also important to note that the figures for capita budget are not reliable in most cases as the money is commonly shifted to other uses, especially in case of emergency and unforeseen events. Donations, which comprise a good part of the capital budget, are also unreliable. Budgetary constraints are very severe to have a significant impact on poverty in Ethiopia. Efficient utilization of available budgetary resources is also constrained by limited capacity, inefficient management and corruption in public offices. The government has introduced expenditure management and control (EMC) and anti-corruption measures as part of the effort aimed at instituting good governance. The Ministry of Capacity Building has been established and a comprehensive National Capacity Building Program has been prepared to improve human capacity, working system and organizational set-up of government offices. Nonetheless, more
43
attention should be given to public and civil society participation if the government efforts are to bear fruit and become sustainable. 3.6.2 Terms of trade The extent of farm production, productivity, level of farm income and investment in modern inputs are determined by the pattern of relative price of agricultural products with prices of other price of non-agricultural products. The role of price is particularly significant in an economy where the production system is market oriented. Available evidence indicates that the terms of trade between the Ethiopian agriculture proxied by food prices and non-agricultural sectors represented by prices of DAP fertilizer, clothing and footwear and household equipments have been biased towards the non-agricultural sector (i.e. against agriculture). For instance, price index of food items has increased by about 12% during the period 1995-2000 while the figures of DAP fertilizer and transport and communication are 76.6% and 65.2%, respectively (Samuel, 2003). In order to provide incentives for efficient fertilizer use and encourage competitive market, the National Fertilizer Policy, introduced in 1993, called for gradual elimination of pan-territorial pricing and subsidies. Accordingly, the pricing system was deregulated in stages: retail price was deregulated as of January 31, 1997 and total fertilizer prices have been completely deregulated since February 1998. Fertilizer subsidy has thus been withdrawn since February 1997. The impact on fertilizer prices was dramatic: DAP rose from Birr 107 per qt in 1992 to Birr 287 Birr per qt in 2001. The fertilizer market has not become more competitive as envisaged in the Fertilizer Policy and the Structural Adjustment Program. In other words, the problems faced before liberalization, (eg. delays in distribution and intervention by government bureaucrats) have continued. None of the benefits associated with liberalization has materialized. Similar to the input market, the grain market remained inefficient and unfavorable to the small producers after the 1991 liberalization policy that ended the monopoly of the parastatal Agricultural Marketing Corporation. Eleni, Gezahegn and Wolday (2003) noted that poor smallholders in Ethiopia face markets that are characterized by large information asymmetry, high transaction costs and high uncertainty, implying thin, volatile and segmented markets, which inhibit smallholders from specializing and becoming high-yield producers and marketers of a large share of total output. Subsistence production has remained the dominant activity, with only 28% of total farm output being marketed in 1996. Smallholders function in the subsistence economy, not served by well-functioning input and output markets. Contrary to expectations that the private sector would more efficiently stabilize prices by engaging in temporal and spatial arbitration, the market constraints enumerated above have led to greater volatility than in pre-reform periods. Continued involvement of the Ethiopian Grain Trading Enterprise (EGTE) (the former Agricultural Marketing Corporation) as a buyer of last resort to stabilize prices or control price swings through market mechanisms has proven largely unsustainable and ineffective. Inefficient output markets have resulted in low and variable prices thereby reducing the profitability of new technologies in agriculture. The impact of unfavourable input and output market on farmers is revealed by the declining terms of trade. The extent to which fertilizer prices have changed relative to output prices can be gauged by looking at the ratio of DAP (the most widely used fertilizer used in Ethiopia) price to price of major cereals. A price study in some urban centers located in surplus producing areas has indicated that there has been a sharp decline in output price in recent years, particularly in 2000/01 meher season. For instance, the ratio of DAP to teff price increased from 0.55 in 1992 to 1.94 in 2001. In
44

other words, only 0.55 quintal of teff (mixed) was required to buy 1 quintal of DAP in 1992, compared to 1.94 quintal in 2001 (Table 3.11). The change represents a 13.4 % increase in the amount of teff required to buy a quintal of DAP. Producers were clearly faced with rising fertilizer prices on the one hand and declining output prices on the other hand (Development Studies Associates, 2001). Maize producers suffered the most as a result of the unfavorable price changes in recent years. In 1992, the cost of one quintal of DAP was only 1.23 quintals of maize. In 2001, farmers were forced to sell 8.2 quintals of maize to buy a quintal of DAP, representing a 670 percent increase over 1992 (Table 3.11).
45

Table 3.11: Ratio of teff and maize price to DAP price (1986-2001) Year Average teff price Average maize
price DAP Price DAP/Teff DAP/Maize
1986 70.00 32.00 81.40 1.16 2.54
1987 80.00 32.00 79.75 1.00 2.49
1988 123.00 37.00 81.40 0.66 2.20
1989 104.50 45.50 96.60 0.92 2.12
1990 126.50 45.25 88.80 0.70 1.96
1991 163.67 64.25 91.00 0.56 1.42
1992 196.33 87.25 107.10 0.55 1.23
1993 151.67 65.00 149.77 0.99 2.30
1994 187.00 99.75 143.35 0.77 1.44
1995 201.00 105.33 178.00 0.89 1.69
1996 150.33 61.00 200.00 1.33 3.28
1997 154.67 82.75 248.84 1.61 3.01
1998 184.33 92.25 238.13 1.29 2.54
1999 213.67 120.50 249.82 1.17 2.03
2000 206.00 103.50 282.06 1.37 2.64
2001 148.33 33.75 287.06+ 1.94 8.23
* Grain prices for selected sites obtained from the Ethiopian Grain Trade Enterprise (EGTE). The grain prices of 2001 are averages for the period January to July. ** Fertilizer prices refer to prices observed at the same or nearby locations of grain price See also Development Studies Associates, Fertilizer Marketing and Credit Study in Ethiopia, Final Report (Volume I), National Fertilizer Industry Agency, Addis Ababa, December, 2001. 3.7 Private sector development It is believed that private investment has a vital role in the development of agriculture. The provision of inputs and credit services to farmers very much depends on strength private dealers, transporters and financial institutions. Farmers equally need efficient and competitive markets and processing facilities to be adequately rewarded for their produce. The government has been implementing measures aimed at liberalising the private investment climate and the investment Code has been revised several times to encourage the private sector. However, the sector is still in its infancy as recovery from the nationalization and discrimination policy of the previous government is taking more time than expected. Privatisation of public enterprises initiated in 1994 is also progressing slowly due to bureaucratic hurdles and limited capacity of local investors. Foreign direct investment is limited to a few sectors (e.g. hotel and construction) and is dominated by one investor19.
19 Foreign direct investment in Ethiopia was only 0.09 percent of GDP over 1992-98. The Midroc group, a company owned by a Saudi Arabian with an Ethiopian mother, accounts for a large share of whatever investment the country was able to attract.
46
Private investment in manufacturing, agriculture, agro-business and mining is constrained by several factors. Some of the major constraints include limited access to land for investment purpose, lack of finance, weak physical infrastructure, policy uncertainties (because of limited participation of the private sector in policy formulation and implementation, lack of networking and joint action within the business community, limited access to external finance, and uneven playing field by the operation of party affiliated companies. Public utility companies such as the Ethiopian Telecommunication Authority and the Ethiopian Light and Power Authority have no competitors and have remained inefficient and bureaucratic. The government blames the private sector for showing a tendency towards ‘rent-seeking’ rather than ‘value-adding’, while representatives of the private sector (mainly through the Chamber of Commerce) often complain about lack of government commitment to develop the sector (e.g. companies created by the ruling party are reported to receive preferential treatment) (Easterly, 2002. The need for forging public-private partnership cannot be overemphasized in the country’s effort to ensure food security and alleviate poverty.
47

SCTION FOUR: ASSESSING THE IMPACT OF FOOD IMPORT/AID DEPENDENCE
This section will focus on establishing the theoretical framework that will capture the effects of food aid on the macro-economy and households. In this theoretical framework attempt will be made to discuss how the effects of food aid dependence affects the macro-economy as well as agricultural production at household level.
4.1 Theoretical Framework of Macroeconomic Analysis of Food Aid Impacts The theoretical framework for the analysis of macroeconomic effects of food aid dependence is established using the interaction between food supply and demand. It can be argued that total food supply from domestic production depends on producers' price for food grains, lagged food supply from domestic production, and the rainfall, which affects the level of domestic production of food grains. Therefore, the domestic supply equation can theoretically be formulated as:
( RFQSPPFGfQS tttt ,, 11 −= )
)
(4.1)
Where: QS - total supply of food grains from domestic production PPFG - producers' price for food grains RF - weather index The supply response of cereals production to a change in producers' price is expected to be positive. During the then military regime producers' price was used to be set by the government, while currently the market forces determine it. An increase in producers' price stimulates producers' to produce more food grains in the long run. To control for technological and institutional factors that may influence current supply of grains, lagged domestic production is included in the model. The other reason for including lagged domestic supply in the model is to reflect the structural rigidities of the Ethiopian agriculture. The other factor that may explain the movement in domestic supply of food grains is the level of rainfall. It is expected that this variable will have a positive sign as good monsoon rains may result in bumper harvest. On the demand side of the macro economy, per capita domestic demand for food grains is assumed to depend on retail price of food grains, per capita consumers' disposable income and prices of food grains substitutes. All the explanatory variables in this model are standard variables expected to influence the per capita quantity demanded of food grains. Following standard economic theory, the price of substitutes and per capita consumers' income are expected to have positive relationship assuming food grain is a normal good. Similarly, it expected that retail price for food grains will have a negative sign as an increase in retail price dampens the per capita quantity demanded of food grains. As there is no separate concessional or fair shop market for distributing food received in the form of food aid, there is no need to separately model demand for food aid imports. Hence the domestic demand equation for food grains can theoretically be given by:
( PSYDRPFGfQD tttt ,,2= (4.2)
Where: QD - per capita domestic demand for food grains RPFG - retail price for food grains YD - per capita consumers' disposable income PS - price of food grain substitutes Since part of food grain consumers' are the producers' as well we can hypothesize that per capita consumers' disposable income partly depends on the domestic supply of food grains. The index of non-agricultural production is included in the model that determines the per capita income of consumers' for that reason that agricultural products are used as inputs into the non-agricultural sector of the economy, no matter the linkage between the agricultural and non-agricultural sectors
48
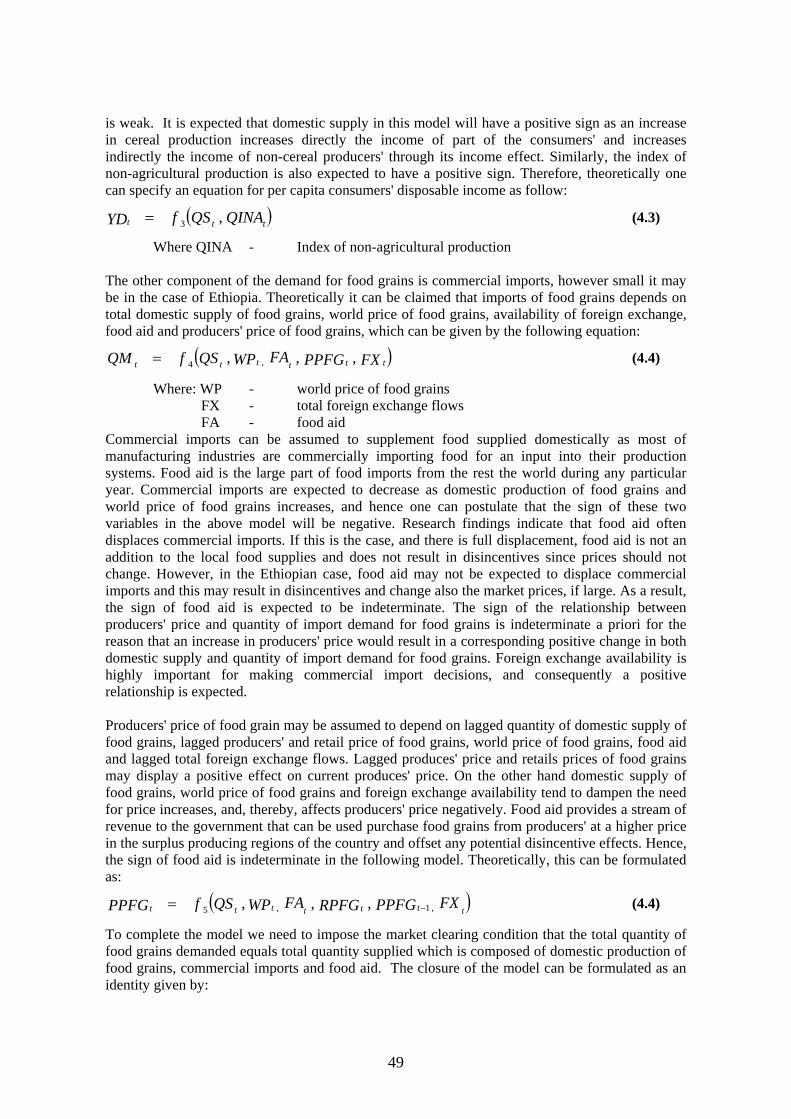
is weak. It is expected that domestic supply in this model will have a positive sign as an increase in cereal production increases directly the income of part of the consumers' and increases indirectly the income of non-cereal producers' through its income effect. Similarly, the index of non-agricultural production is also expected to have a positive sign. Therefore, theoretically one can specify an equation for per capita consumers' disposable income as follow:
( QINAQSfYD ttt ,3= ) (4.3)
Where QINA - Index of non-agricultural production The other component of the demand for food grains is commercial imports, however small it may be in the case of Ethiopia. Theoretically it can be claimed that imports of food grains depends on total domestic supply of food grains, world price of food grains, availability of foreign exchange, food aid and producers' price of food grains, which can be given by the following equation:
( )FXPPFGFAWPQSfQM ttt ttt ,,, ,4= (4.4)
Where: WP - world price of food grains FX - total foreign exchange flows FA - food aid Commercial imports can be assumed to supplement food supplied domestically as most of manufacturing industries are commercially importing food for an input into their production systems. Food aid is the large part of food imports from the rest the world during any particular year. Commercial imports are expected to decrease as domestic production of food grains and world price of food grains increases, and hence one can postulate that the sign of these two variables in the above model will be negative. Research findings indicate that food aid often displaces commercial imports. If this is the case, and there is full displacement, food aid is not an addition to the local food supplies and does not result in disincentives since prices should not change. However, in the Ethiopian case, food aid may not be expected to displace commercial imports and this may result in disincentives and change also the market prices, if large. As a result, the sign of food aid is expected to be indeterminate. The sign of the relationship between producers' price and quantity of import demand for food grains is indeterminate a priori for the reason that an increase in producers' price would result in a corresponding positive change in both domestic supply and quantity of import demand for food grains. Foreign exchange availability is highly important for making commercial import decisions, and consequently a positive relationship is expected. Producers' price of food grain may be assumed to depend on lagged quantity of domestic supply of food grains, lagged producers' and retail price of food grains, world price of food grains, food aid and lagged total foreign exchange flows. Lagged produces' price and retails prices of food grains may display a positive effect on current produces' price. On the other hand domestic supply of food grains, world price of food grains and foreign exchange availability tend to dampen the need for price increases, and, thereby, affects producers' price negatively. Food aid provides a stream of revenue to the government that can be used purchase food grains from producers' at a higher price in the surplus producing regions of the country and offset any potential disincentive effects. Hence, the sign of food aid is indeterminate in the following model. Theoretically, this can be formulated as:
( )FXPPFGRPFGFAWPQSfPPFG t ttt ttt ,1,5 ,,, −= (4.4)
To complete the model we need to impose the market clearing condition that the total quantity of food grains demanded equals total quantity supplied which is composed of domestic production of food grains, commercial imports and food aid. The closure of the model can be formulated as an identity given by:
49

FAQMQSQD tttt ++= (4.5)
4.2 Theoretical Framework for Analysis of Food Aid Impacts at Households Level Food aid might be claimed to have a disincentive effects on household decision to produce food grains partly because food aid is provided to the recipients through the food- for-work programme, which competes for the labour force that would have been allocated for the domestic production of food grains and partly because it lowers producers' price of food grains. Household level production of food grains can be assumed to be a function of producers' price of food grains, per capita food grains aid, use of modern inputs, participation in the new extension programme, number of livestock and acreage, which can be formulated in the form an equation as:
( ADAQFPNEPFAPPPFGfQP iiitiii ,,,,,6= ) (4.6)
Where: QP - quantity food grain production FAP - food aid per capita PNEP - participation in the new extension programme QF - quantity of fertilizer used DA - possession of draught animals A - land holding size An increase in producers' price may give an incentive to farmers' to produce more food grains, which imply that producers' price may display a positive effect on quantity of food grain production. Increase in food aid per capita is expected to dampen the domestic production as food aid is provided to the recipients through food for work, which competes for the labour force available for domestic production, and hence the effect of food aid on domestic production can be hypothesized to be negative. All the remaining variables described as factors that affect quantity of domestic production are expected to have positive signs.
4.3 Data Sources, Estimation and Results of Macro-economic Impacts of Food Aid The data used in this analysis is a time series data from 1980 to 2001. Data on domestic production at macro level was obtained from the Annual Agricultural survey reports of the Central Statistical authority. Data on per capita demand for food grains was taken from a paper by Getahun Bikora titled "The Food Security Challenges in Ethiopia." National accounts statistics is the sole source of the per capita disposable national income and index of non-agricultural production. Retail and producers' prices of food grains are variables for which data were obtained from the annual publications of the Central Statistical Authority on prices of commodities. Food aid data was obtained from various publications of the Disaster Prevention and Preparedness Commission. Average rainfall data, which is collected by the Ethiopian Metrological Services, was obtained from same institutions. Foreign exchange availability, which is the major determinant of commercial imports, was taken as the foreign exchange reserve of the nation and obtained from the various publications of the National Bank of Ethiopia. Finally, unavailability of world price for food grains forced us to proxy it by wheat price in the United States of America. The system of equations specified in the model that determine the macroeconomic effects of food aid consists of six equations (five stochastic equations and one identity describing the equilibrium condition between the demand and supply for food grains) with six endogenous variables (QSt, QDt, YDt, QMt, PPFGt, QTDt), and six exogenous variables (RFt, QINAt, WPt, FAt, RPFGt, FXt). This system of equations was estimated in the linearized double-log form using three-stage least squares. The log forms were better fit the data than the linear forms. Table 4.1 below provides the estimated model used for the subsequent analysis.
50
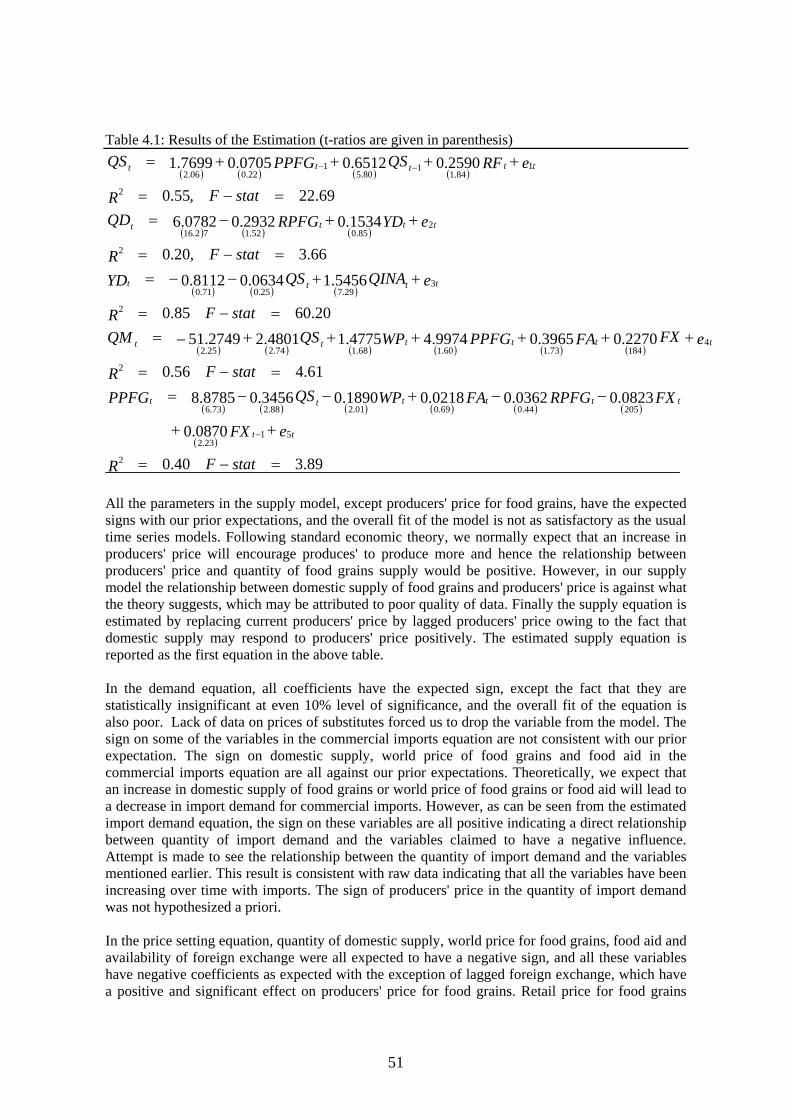
Table 4.1: Results of the Estimation (t-ratios are given in parenthesis)
( ) ( ) ( ) ( )
( ) ( ) ( )
( ) ( ) ( )
( ) ( ) ( ) ( ) ( ) ( )
( ) ( ) ( ) ( ) ( ) ( )
( )
89.340.02 =−=
0870.0
0823.00362.00218.01890.03456.08785.861.456.0
2270.03965.09974.44775.14801.22749.5120.6085.0
5456.10634.08112.066.3,20.0
1534.02932.00782.669.22,55.0
2590.06512.00705.07699.1
5123.2
20544.069.001.288.273.6
2
418473.160.168.174.225.2
2
329.725.071.0
2
285.052.172.16
2
184.1
180.5
122.006.2
++
−−+−−==−=
++++++−==−=
++−−==−=
++−==−=
++++=
−
−−
eFX
FXRPFGFAWPQSPPFGstatFR
eFXFAPPFGWPQSQMstatFR
eQINAQSYDstatFR
eYDRPFGQDstatFR
eRFQSPPFGQS
tt
tttttt
tttttt
tttt
tttt
ttttt
statFR
All the parameters in the supply model, except producers' price for food grains, have the expected signs with our prior expectations, and the overall fit of the model is not as satisfactory as the usual time series models. Following standard economic theory, we normally expect that an increase in producers' price will encourage produces' to produce more and hence the relationship between producers' price and quantity of food grains supply would be positive. However, in our supply model the relationship between domestic supply of food grains and producers' price is against what the theory suggests, which may be attributed to poor quality of data. Finally the supply equation is estimated by replacing current producers' price by lagged producers' price owing to the fact that domestic supply may respond to producers' price positively. The estimated supply equation is reported as the first equation in the above table. In the demand equation, all coefficients have the expected sign, except the fact that they are statistically insignificant at even 10% level of significance, and the overall fit of the equation is also poor. Lack of data on prices of substitutes forced us to drop the variable from the model. The sign on some of the variables in the commercial imports equation are not consistent with our prior expectation. The sign on domestic supply, world price of food grains and food aid in the commercial imports equation are all against our prior expectations. Theoretically, we expect that an increase in domestic supply of food grains or world price of food grains or food aid will lead to a decrease in import demand for commercial imports. However, as can be seen from the estimated import demand equation, the sign on these variables are all positive indicating a direct relationship between quantity of import demand and the variables claimed to have a negative influence. Attempt is made to see the relationship between the quantity of import demand and the variables mentioned earlier. This result is consistent with raw data indicating that all the variables have been increasing over time with imports. The sign of producers' price in the quantity of import demand was not hypothesized a priori. In the price setting equation, quantity of domestic supply, world price for food grains, food aid and availability of foreign exchange were all expected to have a negative sign, and all these variables have negative coefficients as expected with the exception of lagged foreign exchange, which have a positive and significant effect on producers' price for food grains. Retail price for food grains
51
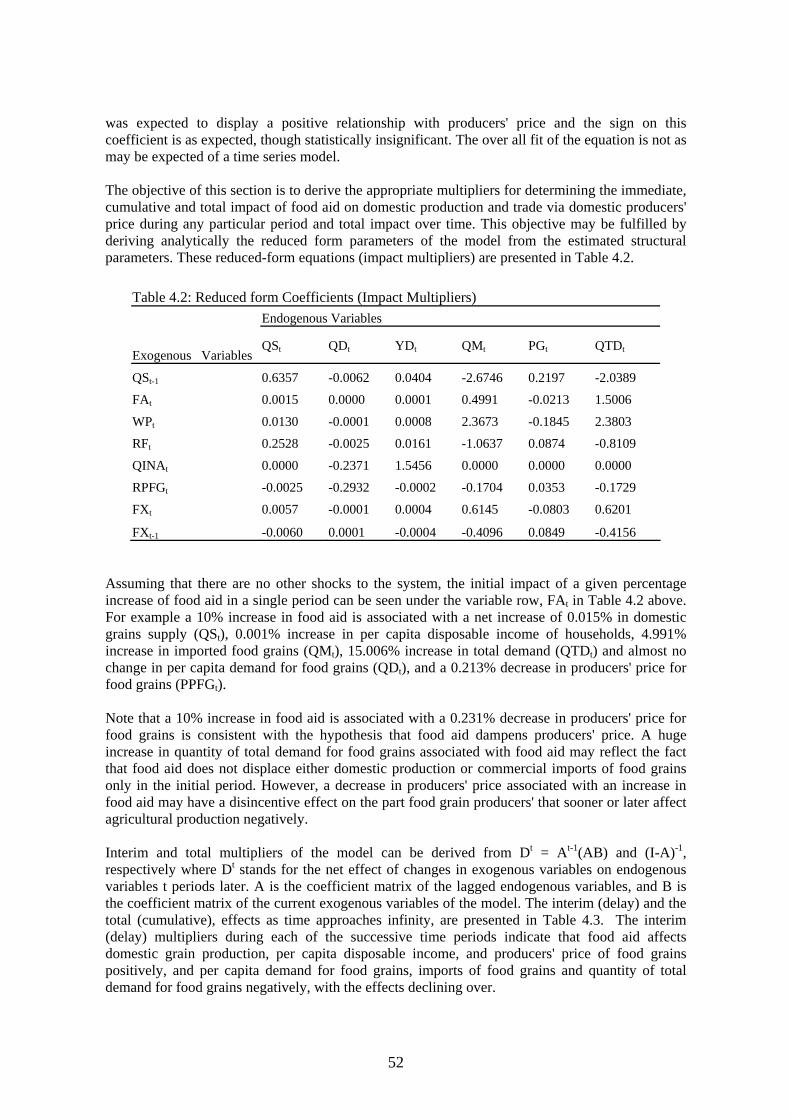
was expected to display a positive relationship with producers' price and the sign on this coefficient is as expected, though statistically insignificant. The over all fit of the equation is not as may be expected of a time series model. The objective of this section is to derive the appropriate multipliers for determining the immediate, cumulative and total impact of food aid on domestic production and trade via domestic producers' price during any particular period and total impact over time. This objective may be fulfilled by deriving analytically the reduced form parameters of the model from the estimated structural parameters. These reduced-form equations (impact multipliers) are presented in Table 4.2.
Table 4.2: Reduced form Coefficients (Impact Multipliers) Endogenous Variables
Exogenous Variables QSt QDt YDt QMt PGt QTDt
QSt-1 0.6357 -0.0062 0.0404 -2.6746 0.2197 -2.0389
FAt 0.0015 0.0000 0.0001 0.4991 -0.0213 1.5006
WPt 0.0130 -0.0001 0.0008 2.3673 -0.1845 2.3803
RFt 0.2528 -0.0025 0.0161 -1.0637 0.0874 -0.8109
QINAt 0.0000 -0.2371 1.5456 0.0000 0.0000 0.0000
RPFGt -0.0025 -0.2932 -0.0002 -0.1704 0.0353 -0.1729
FXt 0.0057 -0.0001 0.0004 0.6145 -0.0803 0.6201
FXt-1 -0.0060 0.0001 -0.0004 -0.4096 0.0849 -0.4156 Assuming that there are no other shocks to the system, the initial impact of a given percentage increase of food aid in a single period can be seen under the variable row, FAt in Table 4.2 above. For example a 10% increase in food aid is associated with a net increase of 0.015% in domestic grains supply (QSt), 0.001% increase in per capita disposable income of households, 4.991% increase in imported food grains (QMt), 15.006% increase in total demand (QTDt) and almost no change in per capita demand for food grains (QDt), and a 0.213% decrease in producers' price for food grains (PPFGt). Note that a 10% increase in food aid is associated with a 0.231% decrease in producers' price for food grains is consistent with the hypothesis that food aid dampens producers' price. A huge increase in quantity of total demand for food grains associated with food aid may reflect the fact that food aid does not displace either domestic production or commercial imports of food grains only in the initial period. However, a decrease in producers' price associated with an increase in food aid may have a disincentive effect on the part food grain producers' that sooner or later affect agricultural production negatively. Interim and total multipliers of the model can be derived from Dt = At-1(AB) and (I-A)-1, respectively where Dt stands for the net effect of changes in exogenous variables on endogenous variables t periods later. A is the coefficient matrix of the lagged endogenous variables, and B is the coefficient matrix of the current exogenous variables of the model. The interim (delay) and the total (cumulative), effects as time approaches infinity, are presented in Table 4.3. The interim (delay) multipliers during each of the successive time periods indicate that food aid affects domestic grain production, per capita disposable income, and producers' price of food grains positively, and per capita demand for food grains, imports of food grains and quantity of total demand for food grains negatively, with the effects declining over.
52

Increasing food aid, for example, by 10% leads to an increase of 0.01% in domestic food grains supply, 0.001% increase in per capita demand for food grains, and a 0.0033% increase in producers' price for food grains in the first period after the initial shock. Similarly, a 10% increase in food aid will lead to a decline of 0.0001% in per capita demand for food grains, 0.04% decline in commercial imports and a 0.0306% decline in quantity of total demand for food grains. Most of the interim effects approach zero after the tenth year with the exception of commercial imports and quantity of total demand for food grains. The long-run cumulative multipliers, which describe the total effect of a sustained level of food aid increase on the endogenous variables of the model, are shown in the last row of Table 4.3. Using a convergence criterion of five decimal places, total multipliers are reached by the twelfth year for domestic supply for food grains, by the second year for per capita demand for food grains, by the sixth year for per capita disposable income, by the fifteenth year for commercial imports and quantity of total demand for food grains, and by the tenth year for producers' price for food grains. These multipliers suggest that a sustained 10% increase in food would result in increased food grains supply of about 0.04%, a per capita income increase of 0.0026%, commercial imports growth of about 4.8812% and increase in quantity of total demand for food grains of 14.9223%, while per capita demand and producers' price for food grains would decline by 0.0004% and 2.038%, respectively.
53
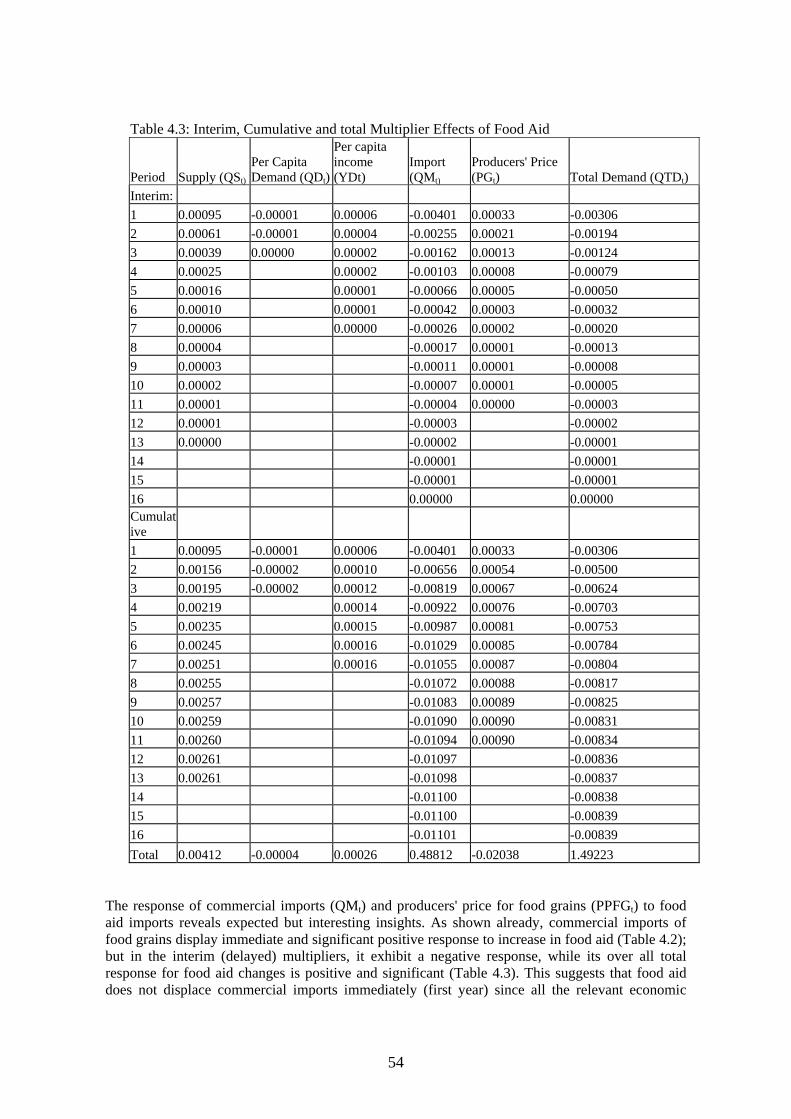
Table 4.3: Interim, Cumulative and total Multiplier Effects of Food Aid
Period Supply (QSt)
Per Capita Demand (QDt)
Per capita income (YDt)
Import (QMt)
Producers' Price (PGt) Total Demand (QTDt)
Interim: 1 0.00095 -0.00001 0.00006 -0.00401 0.00033 -0.00306 2 0.00061 -0.00001 0.00004 -0.00255 0.00021 -0.00194 3 0.00039 0.00000 0.00002 -0.00162 0.00013 -0.00124 4 0.00025 0.00002 -0.00103 0.00008 -0.00079 5 0.00016 0.00001 -0.00066 0.00005 -0.00050 6 0.00010 0.00001 -0.00042 0.00003 -0.00032 7 0.00006 0.00000 -0.00026 0.00002 -0.00020 8 0.00004 -0.00017 0.00001 -0.00013 9 0.00003 -0.00011 0.00001 -0.00008 10 0.00002 -0.00007 0.00001 -0.00005 11 0.00001 -0.00004 0.00000 -0.00003 12 0.00001 -0.00003 -0.00002 13 0.00000 -0.00002 -0.00001 14 -0.00001 -0.00001 15 -0.00001 -0.00001 16 0.00000 0.00000 Cumulative 1 0.00095 -0.00001 0.00006 -0.00401 0.00033 -0.00306 2 0.00156 -0.00002 0.00010 -0.00656 0.00054 -0.00500 3 0.00195 -0.00002 0.00012 -0.00819 0.00067 -0.00624 4 0.00219 0.00014 -0.00922 0.00076 -0.00703 5 0.00235 0.00015 -0.00987 0.00081 -0.00753 6 0.00245 0.00016 -0.01029 0.00085 -0.00784 7 0.00251 0.00016 -0.01055 0.00087 -0.00804 8 0.00255 -0.01072 0.00088 -0.00817 9 0.00257 -0.01083 0.00089 -0.00825 10 0.00259 -0.01090 0.00090 -0.00831 11 0.00260 -0.01094 0.00090 -0.00834 12 0.00261 -0.01097 -0.00836 13 0.00261 -0.01098 -0.00837 14 -0.01100 -0.00838 15 -0.01100 -0.00839 16 -0.01101 -0.00839 Total 0.00412 -0.00004 0.00026 0.48812 -0.02038 1.49223
The response of commercial imports (QMt) and producers' price for food grains (PPFGt) to food aid imports reveals expected but interesting insights. As shown already, commercial imports of food grains display immediate and significant positive response to increase in food aid (Table 4.2); but in the interim (delayed) multipliers, it exhibit a negative response, while its over all total response for food aid changes is positive and significant (Table 4.3). This suggests that food aid does not displace commercial imports immediately (first year) since all the relevant economic
54

actors may need some time to adjust to a given food aid infusion into the economy. However, as time passes and receipts of food aid are expected by the government, commercial imports of food may be substituted by food aid. In the long-run, both domestic supply and commercial imports food grains would be stimulated as food aid effects are felt throughout the economy. As indicated in the cumulative interim multipliers, food aid also dampens he quantity of total demand for food grains in the long-run but has a positive impact in the immediate period as indicated in the impact multipliers (Table 4.3). As per this analysis, food aid increases the total domestic supply of food grains (Table 4.3). However, a sustained increase in food aid has a dampening effect on producers' price for food grain, which may have a negative effect on domestic production of food grains. Hence, the effects of food aid on the agricultural sector of the economy appear to be negative from this empirical work as it puts a downward pressure on producers’ prices of food grains. Although the empirical results indicate the direction of the effect of food aid on the overall economy, it is by no means sufficient in laying down a solid foundation for conclusive and concrete policy formulation regarding food aid at macro level. There is a need for a detailed assessment of producer, household behaviour and non-agricultural labour responses in an economic environment influenced by food aid, hence, the developmental consequences of food aid remain cloudy. 4.4 Data Sources, Estimation and Analysis of Food Aid Impacts at Household Level The source of data for the estimation and analysis of the effect of food aid at households level is the fifth round Ethiopian Rural Households Survey data for the year 1999/00. This data is a cross sectional data comprising of 1469 agricultural households of which data on 771 households is valid for the estimation of the model econometrically. The theoretically specified model that displays the relationship between production of food grains and its determinants is estimated in a linearized double-log form, and given as below where the t-ratios are given in parenthesis. The t-ratios in parenthesis were all based on robust standard errors as the model exhibited a problem of heteroscedasticity, which a common phenomena in the cross-section data analysis.
( ) ( ) ( ) ( ) ( ) ( )
( ) ( ) ( )
63.29)762,8(27.0
0732.00806.03134.0
0814.03510.01504.000002.01038.04041.5
2
00.113.247.4
88.161.790.192.088.136.22
==
++−+
+++−+=
FR
eACRSAA
PLQFPNEPFAPPPFGQP
iiii
iiiiii
In this estimated model, the variable PL denotes households' possession of livestock, which replaced the variable draft an animals (DAi) in the original specification. Two more new variables have been introduced to the original specification of the model, namely the square of the size of land holding and access to credits in the form of dummy variable taking a value of 1 if the house hold has taken credit and 0 otherwise. The sign of all explanatory variables are as expected, except the fact that some of the estimated parameters are statistically insignificant. The positive sign on producers' price indicate that an increase in producers' price will lead to an increase in the level of food grains output, which is consistent with standard economic theory. The sign on food aid per capita is negative as expected, however, its coefficient is statistically insignificant. Both participation in the new extension programme and possession of livestock have signs as expected a priori and they are significant at 10% level. The negative sign on square size of land holding is negative indicating that output increases at decreasing rate with an increase in size of land holding. Given the above estimated
55
relationship between the level food grains output and food aid per capita, there is no strong evidence to claim that food aid has a disincentive effect on food grains output. It should be noted that not all households received food aid during the survey period (1999/00) and only 30% received food aid in some drought-prone woredas in Amhara, Oromiya, SNNP and Tigray regions. To account for the effects of food aid on these specific localities, it was necessary to truncate the sample and the model was re-estimated based on a sample of 324 households. Similar to the results of the above model, the effect of food aid on household production of food grains is clearly negative and is statistically significant. This supports the argument that food aid has a strong disincentive effect on farm production and produces a dampening effect on producers' prices as a result of high food supply in the local markets and hence, can be regarded as one of the causes for continuous dependency on food aid. Since most food aid in the country has been delivered via food-for-work programs such as Employment Generation Scheme (EGS), diversion of labour from farm production to such activities entails loss of farm output, i.e. EGS competes the scarce labour farm household. Even worse, the continual inflow of food aid during good harvest years which, given weak local markets, further leads to a downward pressure on prices in domestic markets and this discourages farmers to use modern inputs and produce more grain for the next crop season. In the drought prone areas such as the northern parts of the country, increased inflow of food aid has already created dependency syndrome where people are entirely reliant on food aid from year to year and this will undermine the effort to achieve sustainable food security in the country. This is consistent with the emerging evidence that increased reliance on food aid has a negative effect both at national and household level. The re-estimated model is as given below.
( ) ( ) ( ) ( ) ( )
( ) ( ) ( )
79.12)315,7(18.0
3533.00251.03675.0
1078.03337.05071.01248.0437.5
2
34.221.152.2
09.167.275.232.105.9
==
++−+
++−+=
FR
eACRSAA
PLQFFAPPPFGQP
iiii
iiiii
56

SECTION FIVE: OPTIONS FOR SUSTAINABLE AGRICULTURAL DEVELOPMENT AND FOOD SECURITY
5.1 Opportunities for Agricultural Development and Food Security The prospect of development in Ethiopia is not totally bleak and gloomy. There are many untapped potentials and options to bring about sustainable development in the country. The country is endowed with rich natural resources and a large pool of labour force. 5.1.1 Natural Resources Land and climate: Ethiopia is endowed with abundant resources, which are suitable for agricultural production. About 66% of the total area (1,133,380 sq km), is said to be suitable for agricultural production. Less than 22% of the potential arable land is estimated to be under cultivation for the production of both annual and perennial crops (MEDaC, 1999). The Ethiopian highlands represent about 36% of the total land area and hosts more than 85% of the human population and 70% of the livestock population. The lowlands (below 1,500 masl) account for about 64% of the land area. Ethiopian soils are reported to be fertile, but are undergoing severe mining of nutrients due to continuous cultivation and erosion. Red soils, the most productive soils in the country, are found distributed throughout the highlands. Nutrients in these soils accumulate in the upper horizons where they are readily available for plant growth and, as a result, they have high inherent fertility. The only drawback of such soils the lack of phosphorous, particularly in older soils. The erosion prone central and northern highlands have low nitrogen content and relatively high phosphorous content. Soils in the south and southwestern part have also high nitrogen and low phosphorous. High level of agricultural productivity can be achieved in less degraded areas provided measures are taken to compensate for deficient nutrients and management practices are improved to protect against erosion (Alemneh, 2003).
The climate in Ethiopia varies mainly according to elevation. The lowland areas have an average annual temperature of over 27° C and receive less than 450mm of rain annually. Most of the highland plateaus lie between 1,500 and 2,300 masl (mid-highland) and have an average temperature of about 25° C with an annual rainfall ranging from 500 to 1,500 mm. Above 2,300 m is a temperate zone with an average temperature of about 16° C and an annual rainfall between 900 and 1,500 mm. The main rainy season occurs between mid-June and September, followed by a dry season that may be interrupted in February or March by a short rainy season.
The diversity of soil, climate, and elevation allows production of a wide range of agricultural commodities. The agricultural sector spans diverse agro ecological zones with corresponding diversity in crop production. There are, for instance, 18 major agro ecological zones with different physical and biological potentials. Nearly all types of tropical and temperate crops can be grown in the highland areas (with altitude of ~1500asl). The climate is ideal to grow various kinds of horticultural crops. Coffee and tea are grown in the moist mid-highland areas. With irrigation, lowland areas can be used to grow important industrial crops such as cotton and sugar cane. The potential to grow citrus fruits is also very high. Lowland pastures could be improved and used for commercial livestock production.
57

Water resources: Ethiopia has a substantial amount of water resources, though its distribution and occurrences through time and space is erratic. The surface water potential amounts to over 110 billion cubic meters per annum. There are 12 major river basins, with the Abay (Blue Nile) Basin alone accounting for about 53% of the total annual runoff. Ethiopia, known as the ‘water tower’ of northeastern Africa, is faced with the fact that all its major rivers (except Awash) leave the country and flow into neighboring countries. About 90% of the annual runoff goes to the rivers that flow into the Sudan, Egypt, Somalia and Kenya (Admasu, 2003).
It is estimated that less than 1% of the annual surface water is used for irrigation. The potential irrigable land is about 3.6 million hectares but only 4.6% have been developed. No effort has been made to tap into the country’s underground water resources are estimated at 2.6 billion cubic meters. Irrigation received minimal attention in the country’s development policy despite the chronic problem of drought. Water harvesting in the form of micro ponds has been made the focus of the recent food security program, but the amount of water collected is believed to be too small to have a significant impact. The country’s huge potential in small, medium and large-scale irrigation projects should be tapped.
Genetic resources: Ethiopia has an important place in its richness and diversity of the flora and fauna and endemic plants. The number of Ethiopia’s flora is estimated at over 6,000 species. It is the primary gene centre for several of the world’s important crops including Arabica coffee, teff, ensete noug, and the Ethiopian rape. Ethiopia is also the main centre for sorghum, finger millet, fieldpea, chickpea, perennial cotton and sesame. The unique landscape and climate regimes have made the country a veritable island in the eastern Sahel. Most major plants communities found north of the equator in Africa are found in Ethiopia. The natural vegetation is widely used for food, fuel, construction, fodder, fibre, medicine, etc. However, the disappearance of the genetic pool and the diversity of known plants and species have been accelerating in the past decades and a concerted effort is required to protect this erosion of diversity at farm and community level (Alemneh, 2003). It is possible to identify crop or any other plant species of economic value that would perform very well under marginal and moisture-stress conditions provided appropriate research is conducted. Livestock resources: Ethiopia has one of the largest livestock populations in Africa. Animals are primarily part of the mixed subsistence farming system, providing inputs (draught, transport and manure) to the cropping system and generate consumables and saleable products (meat, milk, manure, eggs, hides and skins). A high degree of crop-livestock integration and production is made possible by the availability of suitable grazing free of trypansomiasis and other major animal diseases. The lowlands are generally low rainfall zones where crop production has considerable risk due to drought and pastoral-based livestock production dominate. Pastoralists raise mainly sheep and goats with some cattle and/or camel. Sheep farming dominate highland areas with altitude of over 3000 masl. Cattle thrive in the 1,500 to 3000 m range. However, farmers and pastoralists in Ethiopia rely on unimproved pasture for forage and more frequently on crop by-products (Caldwell, 1992). Food insecure districts would greatly benefit from a comprehensive package aimed at improving the feed, veterinary and marketing services of the livestock sector. 5.1.2 Human Resources The total labour force has increased from 14.7 million in 1984 to 26.5 million in 1994 and labour force participation rate increased from 0.35 in 1984 to 0.50 in 1994 (Table 5.1). Both urban and rural labour force participation rates increased between the two census periods. Accordingly, urban labour force increased by annual average of 6.4% between 1984 and 1994, compared to an average urban population growth of 2.3% per annum. Rural labour force, on the other hand, increased by 6.0% per annum over the same period.
58
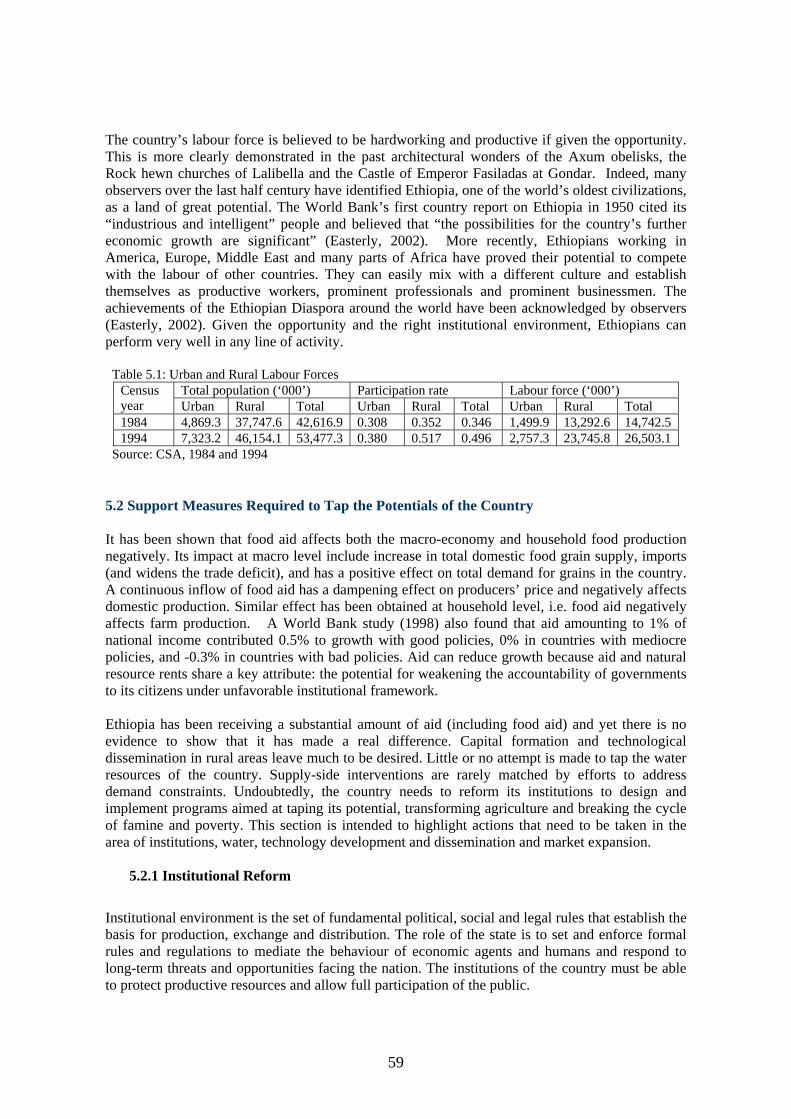
The country’s labour force is believed to be hardworking and productive if given the opportunity. This is more clearly demonstrated in the past architectural wonders of the Axum obelisks, the Rock hewn churches of Lalibella and the Castle of Emperor Fasiladas at Gondar. Indeed, many observers over the last half century have identified Ethiopia, one of the world’s oldest civilizations, as a land of great potential. The World Bank’s first country report on Ethiopia in 1950 cited its “industrious and intelligent” people and believed that “the possibilities for the country’s further economic growth are significant” (Easterly, 2002). More recently, Ethiopians working in America, Europe, Middle East and many parts of Africa have proved their potential to compete with the labour of other countries. They can easily mix with a different culture and establish themselves as productive workers, prominent professionals and prominent businessmen. The achievements of the Ethiopian Diaspora around the world have been acknowledged by observers (Easterly, 2002). Given the opportunity and the right institutional environment, Ethiopians can perform very well in any line of activity. Table 5.1: Urban and Rural Labour Forces
Total population (‘000’) Participation rate Labour force (‘000’) Census year Urban Rural Total Urban Rural Total Urban Rural Total 1984 4,869.3 37,747.6 42,616.9 0.308 0.352 0.346 1,499.9 13,292.6 14,742.5 1994 7,323.2 46,154.1 53,477.3 0.380 0.517 0.496 2,757.3 23,745.8 26,503.1
Source: CSA, 1984 and 1994 5.2 Support Measures Required to Tap the Potentials of the Country It has been shown that food aid affects both the macro-economy and household food production negatively. Its impact at macro level include increase in total domestic food grain supply, imports (and widens the trade deficit), and has a positive effect on total demand for grains in the country. A continuous inflow of food aid has a dampening effect on producers’ price and negatively affects domestic production. Similar effect has been obtained at household level, i.e. food aid negatively affects farm production. A World Bank study (1998) also found that aid amounting to 1% of national income contributed 0.5% to growth with good policies, 0% in countries with mediocre policies, and -0.3% in countries with bad policies. Aid can reduce growth because aid and natural resource rents share a key attribute: the potential for weakening the accountability of governments to its citizens under unfavorable institutional framework. Ethiopia has been receiving a substantial amount of aid (including food aid) and yet there is no evidence to show that it has made a real difference. Capital formation and technological dissemination in rural areas leave much to be desired. Little or no attempt is made to tap the water resources of the country. Supply-side interventions are rarely matched by efforts to address demand constraints. Undoubtedly, the country needs to reform its institutions to design and implement programs aimed at taping its potential, transforming agriculture and breaking the cycle of famine and poverty. This section is intended to highlight actions that need to be taken in the area of institutions, water, technology development and dissemination and market expansion.
5.2.1 Institutional Reform
Institutional environment is the set of fundamental political, social and legal rules that establish the basis for production, exchange and distribution. The role of the state is to set and enforce formal rules and regulations to mediate the behaviour of economic agents and humans and respond to long-term threats and opportunities facing the nation. The institutions of the country must be able to protect productive resources and allow full participation of the public.
59

Protective Institutions Protective institutions refer to rules and regulations that define and support control and access rights over land and use of other assets central to human well-being. Institutions that restrain arbitrary and free access to assets are essential from assets to thrive. Restrain is necessary for forests, fishing lakes and grazing fields to yield sustained benefits when population density, changes in technology or preferences, and other developments increase the demand on their use. A special subset of protective institutions is private property right that entails well-delimited rights of use and decision-making for an owner, typically including rights to sell or lease an asset. The state must have the capacity to enforce property rights (police or judges) and provide the assurance that the government itself respects those rights (World Bank, 2003). In Ethiopia, severe degradation and asset depletion in rural areas indicate that protective institutions have yet to be developed. The failure to invest in soil conservation, land improvement and afforestation is attributed to institutional deficiencies. In particular, lack of tenure security, together with the frequent redistribution of land by government authorities, has exacerbated the problems of diminishing farm size and environmental degradation is the land tenure system. According to the 2001 Rural Development Policies, Strategies and Tactics, public ownership of land is necessary in order to initiate land redistribution as deemed necessary by the government. This, however, would mean that tenure insecurity would continue to deprive farmers the necessary incentive to invest in land. Farm size diminishes as land is inherited by several children or redistributed by officials20. At the same time, yield levels have not increased in most cases due to declining soil fertility and lack of technological breakthroughs and limited effort to use surplus labor to intensify production. There is neither consolidation nor intensification due to the land policy that does not encourage investment to improve land productivity. A well-defined full ownership right of arable land policy is needed in order to instill sense of security and release local potentials to take care of the land.
Government commitment is also needed to develop protective institutions. Respect for the rule of law and efficient judiciary in rural areas are very vital for asset creation. The security of property rights is closely associated with the rule of law.
Informal institutions need to be strengthened to complement formal institutions. Protective informal norms, values and sanctions are as important as formal institutions such as the laws and police to ensure capital accumulation. It is important to build up on indigenous village-community organizations. Inclusive Institutions A society in which the majority has no voice can lose because the potential creativity and productivity resting in the majority of the people is ignored or valued only in part. Suppressing the productivity of the public would also translate into inefficient use of physical assets. In other words, loss of the contributions from human creativity and physical assets implies a society cannot benefit from its human and capital resources, the two most important sources of growth and development (World Bank, 2003). When institutions are more inclusive to listen to and support more people, a broader range of assets can thrive. For communal and natural assets (roads, water, fish or forests), more inclusive 20 Land redistribution was carried in Yetmen and most other parts of the Amhara region in 1996. Households whose members had some association (eg. served as member of a committee) with the Imperial or the Military government lost all their land in excess of 1 ha to landless members of the community.
60
institutions deepen the support for their provision, so that their quality and quantity can rise. The different governments in Ethiopia have not succeeded in providing the right institutional infrastructure to foster long-term investment. The tradition of a non-inclusive government motivated by ‘control’, not participation, must change. Institutional reform is necessary in Ethiopia to ensure participation and empower the farming community. The Imperial as well the socialist institutions have made individuals feel that others are responsible for their life. Paternalistic attitude is still very strong in various actions and programs of the Government, despite the move towards decentralization and democratization. Farmers, women and youth in rural areas have never been able to organize their own independent association to protect their rights and interests. Independent farmers’ unions, interest groups, union of wageworkers and associations/network of craft workers have never been part of the rural life. As a consequence, the public, in particular the rural population seems to have lost motivation, self-initiative and creativity.
In the absence of civic organisations to protect their interest, interactions with public officials have placed a large burden on poor people. They are unable to take advantage of new economic opportunities or engage in activities outside their immediate zone of security, i.e. subsistence farming21. It should be stressed that countries which have experienced rapid improvement in their economy and standard of living owe much of their success to favourable institutional infrastructure.
5.2.2 Supply-Side Interventions
A significant rise in agricultural labor productivity and poverty alleviation would only come about as a result of widespread adoption of scientific agricultural techniques including improved seeds and chemical fertilizers using irrigation. We now know such success as ‘Green Revolution’ (GR). A phenomenal growth of yields was recorded in parts of India, Pakistan, Thailand, parts of South and Central America and the Philippines in the late 1960s and 1970s. India changed from a major recipient of food aid to an exporter of rice by the end of the 1970s. Government investment in irrigation, in addition to intensive plant breeding and investment in roads and other infrastructure, has contributed to the success. Invest in Irrigation According to FAO, while only 20% of the world’s farmland is irrigated, it produces 40% of our food supply. Yields obtained on irrigated plots are more than double the highest yields from rain-fed agriculture. However, irrigated agriculture has not expanded as fast it should in the past because of two main considerations. One consideration is cost: irrigation has been described as ‘one of the most subsidized activities in the world’, and some studies have cast doubts on the economic returns on investment in large-scale irrigation schemes. The environmental costs of conventional irrigation are also high. High-intensity schemes are often blamed for water logging and soil salinization, which now affects 30% of irrigated land. Salinization is reducing the existing area under irrigation by up to 2% a year. To increase irrigation’s contribution to food production, FAO argues, what is needed is improved efficiency in the use of irrigation water. High costs and negative rates of returns have been primarily due to design and technical flaws, management failure and political difficulties. Failure of responsible agencies to respond in time to field level problems, excessive centralization of management taken away from farmers, poor training and
21 Mulat Demeke. 2001. Off-farm income generation opportunities in Ethiopia: with particular reference to food-insecure woredas, Department of Economics, Addis Ababa University, unpublished report.
61

skill levels, uncontrolled overhead costs, etc are some of the other reasons for the poor performance of many large scale irrigation systems. 22
Investment in irrigation in Ethiopia should also be accompanied by attention to water conservation, soil conservation, soil conditioning and soil productivity. Crop to be grown under irrigation should be carefully selected to maximize the return from investment in irrigation. Most cereals may not be as profitable as industrial crops (cotton, sugarcane, etc.), horticultural crops (fruits and vegetables) or floricultural crops. Ethiopia has a comparative advantage (weather and proximity to major markets such as Europe and Middle East) in a number of high value horticultural crops. Fishing activities in the irrigation dams and ponds could also provide additional income and food for the population. Arrest Soil Degradation Environmental degradation and eco-system stress will intensify in many parts f the country because of population pressure, poverty and absence of land use plan and control. Attempts to undertake conservation and afforestation through food-for-work programs have not reversed the rapid depletion of the country’s natural resources. In addition to collective or community level efforts, individual farmers should be encouraged (e.g. through incentives and more clearly defined land rights) and supported (e.g. through credit) to invest in micro dams, water run-off catchments, terracing, afforestation,, etc. Free grazing of livestock should be replaced with controlled and zero grazing as a matter of urgency in the highlands, especially severely degraded areas. The development of alternative house building materials and alternative fuel sources should be given priority. The use of animal dung as fuel should be discouraged and wheelbarrows and animal drawn carts should be promoted to assist the application of manure and organic matter as organic fertilizer. Strengthen Agricultural Research As indicated above, low level of technology utilization is one of the major factors behind the poor performance of food grain production. Local seeds with low genetic potential have resulted in low yield. Although the total research budget23 (in nominal terms) appears to have increased over time, the share of agricultural research is less than 1% of the agricultural GDP, well below the recommendation that at least 2% of agricultural GDP has to be invested in research.24 Budgetary expenditure on technology development is inadequate especially when viewed against the diversity of agricultural production in the country. Lack of adequate resources is also among the major factors constraining broad-based technical change in agriculture. It has also become increasingly difficult to retain senior researchers as wages and working conditions (including schools for children) in the research centers are unattractive relative to jobs in the major cities or opportunities abroad. Since private research is non-existent in Ethiopia, largely due to the absence of a strong commercial agriculture, individuals resigning from research often join a non-research profession (Mulat et al, 2003). The fact that research is financed mainly through grants and donations25 has also meant that it is very difficult to ensure long-term continuity in research activities. Research agenda tend to change with the interest and preference of the donors.
22 FAO web site, Agriculture Section, Magazine, Spotlight: Improving Irrigation Technology, 2003 23 Currently, the budget for the national agricultural research system comes from three sources: the federal government, the regional states and external sources. 24 ISNAR. 1988. Role of Research in Transforming Traditional Agriculture: An Emerging Perspective. The Hague, International Service for National Agricultural Research. 25 About 52% and 79% of the total fund was allocated from Agricultural Research and Training Project (ARTP) in 2001 and 2002 respectively. ARTP is financed by the loan obtained from the World Bank for training and capacity building.
62
Agricultural research should be geared towards bringing about broad-based technical change. Research on soil fertility management must be steeped up to reverse the decline in soil fertility due to the breakdown in traditional soil fertility restoring techniques such as fallowing and crop rotation especially in densely populated areas. In view of the massive problems of nutrient mining and land degradation, both organic and inorganic supply of nutrients must be expanded.26 Research on irrigation agronomy and high value crops should be given adequate attention. Location specific agronomic research on land preparation, crop rotation, and level of fertilization and control of weed, insects and diseases could have a substantial impact on land and labour productivity. Improve the supply of farm inputs, services and equipment Input markets are highly underdeveloped in Ethiopia. Fertilizer and improved seeds are distributed largely through government direct and indirect involvement, rather than free markets. Rural credit is limited to short-term input credit and the credit is administered by regional and local administrators. There are no organized markets for improved farm implements and transportation equipment. Mechanization services are unavailable except in few isolated cases. Policies should be designed to involve the private sector and develop a more sustainable system of input distribution and marketing. Exercise caution with respect to Resettlement Schemes Spontaneous migration to more productive areas has always been the tradition in Ethiopia. Households used to constantly search for more fertile land and settle in new areas in order to practice extensive agriculture (with long fallow period), instead of making the costly adjustment (in terms of additional labour effort and investment) for transition to intensive farming in the original settlement sites. Government-sponsored resettlement schemes have been receiving special attention since the 984/85 disastrous drought. However, the schemes have rarely been successful. Apart from the acute infrastructural constraints and various health hazards to humans and livestock in most resettlement areas, human activities in the country’s most fragile eco-system has exacerbated the problem environmental degradation. In particular, the same cultivation practices, which led to ecological disaster in the old settlement areas (highlands), are being applied in destination areas (lowlands). It is evident that governments in Ethiopia resort to resettlement when they fail to bring about sustainable intensification of agriculture (to increase the absorptive capacity of the land). Resettlement also reflects the failure of successive policies and strategies in Ethiopia to bring about structural transformation of the economy and increase the employment share of the non-agricultural sector.
5.2.3 Demand Side Interventions
Develop Domestic Market It has already been discussed that the dominance of agricultures in the economy and total employment has constrained the domestic market. This is more clearly reflected in the collapse of grain prices following a small increase in production. The small urban areas are inhabited by informal sector operators with low level of income or low purchasing power.
26 Eicher, C. K. and D. Byerlee. 1997. ‘Accelerating Maize Production: Synthesis’ in C. K Eicher and D. Byerelee (eds.), Africa’s Emerging Maize Revolution’, Lynne Rienner Publishers, Boulder.
63
Cities are resource centers and powerhouses of development. The process of agglomeration and specialization in urban areas removes demand bottleneck for both urban and rural areas. Larger and expanding urban centers create better opportunities for agriculture and small enterprises to grow, innovate and expand. Urbanization is also associated with lower population growth, modern attitude, etc. Rural growth and diversification require a substantial input from urban development. 27 The domestic agricultural market is also poorly developed in Ethiopia partly due to lack of specialization based on comparative advantages of each agro-ecological zone. Farmers in every part of the country are advised to produce food crops for home consumption with no change to age-old traditional practices. Such production systems, along with the low share of the non-agricultural population and inadequate transport and communication network between the different regions (discussed above), have limited the scope of grain trade in the country. While high potential areas are encouraged to intensify and commercialize food crop production using external inputs under rain-fed condition, low potential areas may need to concentrate on root crops, fruits and vegetables, high value pulses and oilseeds, tree growing, livestock husbandry, bee-keeping and fishery using irrigation as well as rains (depending on the specific circumstances of each location). It should be noted that rehabilitation of some areas – very sloppy and heavily degraded ones – through enclosure and strict land use plan could be the only option. Areas with good access to large urban markets and export outlet (eg. Addis Ababa Airport) would have competitive and comparative in high value horticultural crops, while lowland areas specialize in fruits and industrial crops.
Specialization based on agro-ecological potential cannot be effective unless markets are sufficiently developed to ensure efficient trade between different areas. For instance, trucks transporting grain from surplus to food-deficit areas could carry livestock and livestock products back to surplus areas on their return leg. At the same time, trade in inputs and consumer goods should also expand to facilitate commercialization of the rural areas. As a major participant in processing and marketing activities, the promotion of the private sector should be at the center of the effort to expand the domestic market. Take Advantage of the External Market Environment Despite some progress in the second half of the 1990’s, Ethiopia’s export bundle remains relatively small and concentrated, both in terms of products and markets. Mulat et al (2003) have shown that the various reform measures undertaken throughout the 1990s failed to bring about diversification in the external trade sector. Ethiopia’s exports remained excessively dependent on a few primary products, like coffee, hides and skins, oilseeds and pulses. In terms of product bundle, the top six export products (coffee, chat, ovine leather products, gold, sesame seeds and raw sugar in a descending order) represented 90% of the export bundle in 1995 and 86% in 2000. Coffee export accounted for 66% in 1995/96, 53% in 1999/00 and 39% in 2000/01. Production and supply constraints related to limited capacity of production constitute the major impediments to the expansion of export trade. Lack of product diversification is another impediment for the expansion of export trade in the country. Underdeveloped infrastructure facilities and lack of timely and accurate market information has also adversely affected the performance of the export sector.
27 Douglas, M. ‘A Regional network strategy for reciprocal rural-urban linkages: An agenda for policy research with reference to Indonesia’, Third World Planning Review, Vol 20, No.1, 1998.
64

In 1997, Ethiopia took several initiatives to promote its international trade environments, and it became an observer at the WTO, but without applying for the future membership. Ethiopia’s major trading partners such as the EU, United States and Japan are members of the WTO. Thereofre, if Ethiopia continues to stay out or be part of the system, this will have a negative long-run effect as domestic and foreign trade will eventually depend on the international standards and policies will more likely be geared against the yardstick of commonly accepted policies. Moreover, failing to meet these criteria may result in international criticism and possibly retaliation and further marginalization. More importantly, when preferential access to the EU and other developed countries phases out, market access will be more difficult for a non-WTO member. Accordingly, Ethiopia cannot be an exception to the process of globalization and it should learn how to survive in a competitive world as soon as it could (Mulat et al, 2003). At a regional level, Ethiopia is a member of the Common Market for Eastern and Southern Africa (COMESA). COMESA was established, among other things, to take advantage of large market size and to allow greater social and economic cooperation with an ultimate objective of creating economic community. The key mechanism for trade liberalization is the removal of tariff and non-tariff barriers to intra-COMESA trade. In this regard, COMESA has adopted a program for the reduction and eventual elimination of tariff and non-tariff barriers on intra-COMESA trade. However, a few Member States have failed to comply with the commitments they have made. Ethiopia is one of those countries that have failed to comply with the agreement it signed to establish a Free Trade Area. COMESA has not been a force of market diversification for Ethiopia. Exports to COMESA members remained stable during the last half of the 1990s and represented only 10% and 13% of total exports in 1995 and 2000 respectively, with Djibouti absorbing 90% and 85% of the export to COMESA in 1995 and 2000 respectively. The other 19 members of COMESA received only 2% of Ethiopia’s export. This is not surprising given that Ethiopia does not grant nor receive any significant tariff preference from its COMESA partners. Export to COMESA member would significantly increase provided measures are taken to remove tariff and non-tariff barriers. Duty free access to the markets of COMESA members will not only provide a significant increase in exports, but will also help in diversifying Ethiopia’s export bundle. The anticipated increase in exports of cereals (barley and maize) and meat products to COMESA members in a preferential trade environment would be of direct benefit to poor producers (surplus producing farmers) who are constrained by thin, fragmented and volatile locals markets. Provided that the marketing ability of poor producers is enhanced through an appropriate balance of policy interventions, infrastructure and institutions discussed above, COMESA may be a source of a much needed market outlet that could help ease the shortcomings of local markets. Increased trade among COMESA members, extending well beyond traditional primary and semi-processed products to manufactured goods, producer goods from the mining sector and energy would increase welfare for all concerned, would enhance wealth creation through specialization and would be a step towards poverty alleviation, socio-economic development and conflict resolution in the region. As such, the GoE should take the initiative and make the appropriate quid pro quo tariff concessions to strategic regional partners to enhance trade in the region. 5.3 Expand non-agricultural employment Attention to urban centers has remained minimal in the past 30 years. Since the 1976 nationalization of urban land and all extra houses and buildings, residential and commercial buildings have been neglected with very little maintenance. Much of the urban infrastructure is in very bad shape. Business activities are limited to informal activities.
65

Many of the food-insecure districts have 98% of their population in rural areas. There is very limited local market opportunity for perishable items such as vegetables, milk, etc. Developing small urban centers should be as part of the overall need to change the structure of employment in favor of the non-agricultural sector. It is only through rapidly expanding employment opportunities in the urban areas that the proportion of the agriculture-dependent population is reduced (from its current level of 85%, one of the highest in the world). There are ample opportunities in the manufacturing sector for substituting imports to save foreign exchange and generate employment. Some of the manufacturing activities with significant potential could be:
- Leather products including footwear - Labor-intensive garment industry - Traditional cloths - traditional weaving - Textile mills - need to be salvaged - Silver and gold smiths - Plastic goods, ceramic products, building materials, etc.
Tourism is perhaps the most promising activity to generate employment in Ethiopia. The country is endowed with spectacular geological and geographic contracts, including mountains and plains, valleys and desert, and rivers and lakes. Ethiopia has a long history of independence and its own script, unique in Africa. Associated with the long history are the Axum obelisks, the Rock hewn churches of Lalibella, the Castle of Emperor Fasiladas at Gonder, the isolated and secluded churches in different parts of the country, the town of Negash in Tigary- historical place for the Muslim community. Ethiopia is also the origin of mankind, Luci or Dinknesh. The country is truly a tourist paradise. In addition to generating foreign exchange, the tourism industry has the potential of creating considerable employment opportunities. To date, mining has been of only marginal importance to the Ethiopian economy. However, the potential reserve of gold and other precious metals is reported to be high. Gold reserves are conservatively estimated at 60-200 tonnes. Substantial reserves of coal, iron ore, tantalum, bicarbonate and potassium were also partly prospected in the 1980s, although a number of significant deposits are in inaccessible locations. Limestone, clay and marble are produced in large quantities, and the output of non-metallic minerals has been boosted by the upsurge in construction activity since 1991. Developing the mining potential of the country is believed to generate significant employment opportunities.
In general, non-agricultural employment opportunities should be developed in order to ease population pressure in food insecure areas. No effort was made in the past to avert the build up of population beyond the carrying capacity of the land. Development strategies and policies (e.g. the land policy) should encourage, not systematically discourage, out migration. 5.4 Safety nets for the Vulnerable The number of people who are chronically food insecure and vulnerable groups appears to be increasing due to climatic shocks, worsening land degradation and HIV/AIDS pandemic. Most of poor live in the "drought prone" districts. Given the high frequency of drought, vulnerability to climatic shock is cumulative in Ethiopia. Families are often exposed to another shock before they fully recover from an earlier shock, which had resulted in the sell of vital animals and other assets in order to survive. For the extremely poor households, there is no exit from the vicious cycle of poverty and pursuit of
66

unsustainable livelihoods. A substantial number of people in food-secure districts are also food insecure due to limited access to land, soil degradation and lack or loss of of basic assets. Families affected by HIV/AIDS are also prone to selling key productive assets and fall into poverty trap. Measures necessary to prevent the poor from sliding further into poverty may include: Use of food aid delivery and other support systems to assist very poor households
to build their asset base and income generation capacity; For instance, food aid could be combined with financial support and/or credit aimed at establishing a sustainable livestock farm (e.g. small ruminants) for female- and child-headed as well as other households with labour shortages. Similarly, free or subsidized inputs could be provided for a specified period to increase production and eventually enable the family farm pay for itself;
Reducing risks in vulnerable areas by introducing new conservation-based farming systems (including tree crops and livestock), building irrigation infrastructure, and encouraging seasonal labour migration, and supporting off-farm activities; and
Supporting families and orphans affected by HIV/AIDS through community-based programs with long-term commitments; Communities should be assisted to ensure that orphans are getting education while their food requirements are met;
5.5 Enhance Investment in Agriculture Reliance on food import/ aid to meet the food requirements of the country has only generated more dependence with little or no change in the poverty conditions of the country. Food aid has not prevented depletion of farm assets since its arrival is often uncertain and very late. More importantly, the amount delivered to the needy households is often too small to prevent distress sales. The effectiveness of food aid is also limited by the large errors of inclusion and exclusion in the selection of districts as well as households. Food aid has not helped surplus producers: the collapse of grain prices in recent years is partly attributed to continuous supply of food aid, especially in years of good harvest. Food aid is also absorbing a sizeable amount of public resources: the cost of transporting and distributing relief food to affected areas has been consuming about 17% of the total government expenditure during the period 1994-2002. Ethiopia should also realize that the future of food aid donations is uncertain since surplus production in major donor nations is likely to decline (hence limited chance for giving food aid) due to reduced support for agriculture as a result of budgetary constraints and the need to comply with WTO commitments. Improving the production capacity of farmers through increasing public and private investment in agriculture should be at the centre of the government policy in the sector. Public investment is necessary to build physical, natural, human, social and technological capital in agriculture and thereby induce private (includes farmers) investment. Farmers in Ethiopia will start investing their labour, financial and other resources on irrigation, conservation, technology, etc. provided they are assisted through more public investment, favourable property right regime and improved access to credit facilities. Structural adjustment was introduced to stabilize the economy, but cuts in human capital development, agricultural research and extension, infrastructure and irrigation will have detrimental long-term impacts on agricultural production and productivity growth. Care
67

must be taken not to undermine long-term growth. Existing public expenditure patterns should also be closely reviewed to channel resources to agriculture where the payoff in terms of poverty alleviation and sustainable development is very high. In this regard, the huge expenditure on administering, transporting and distributing imported relief food needs to be shifted to investment activities. A substantial amount of budgetary resources could also be secured (for rural and agricultural development) by concluding a lasting peace agreement with neighbouring countries, hence reducing defence budget. Nevertheless, it should be reiterated that Ethiopia is one of the poorest countries in the world, and it cannot be expected to exit from the poverty trap it finds itself in on its own solo effort. National saving rates are too low to mobilize sufficient resources for investment in capital formation. Annual food shipment and various grants have not made an impact on the country’s chronic and complex problems. The donor community must show more commitment and support investment aimed at addressing the root causes of the problem, rather than the symptoms. The US alone spent over 500 million US dollar on food aid during the recent 2002/03 drought. Donors should rather step up their development assistance to complement public and private investment in agriculture. According to Jeffery Sachs, the Coordinator of the UN Millennium Project, and his colleagues, only a Big Push through well-targeted infusion of foreign assistance can end Africa’s poverty trap28.
In other words, we argue not for endless flows of increased aid, and not for aid as simple charity, but rather for increased aid as an exit strategy from the poverty trap. For those who fear that aid increases dependency, our response is that aid that is ambitious enough would actually end Africa’s dependency.
28 J. Sachs, J. W. McArther, G. Schmidt-Traub, M. Kruk, C. Bahadur, M. Faye, and G. McCord, Ending Africa’s Poverty Trap, Brookings Papers on Economic Activity, 1:2004
68

SECTION SIX: SUMMARY AND CONCLUSIONS The relationship between food aid and agricultural production in food insecure countries has received increased attention in recent years. One of the important issues addressed at the Johannesburg world summit on sustainable development 2002 was the importance and consequences of the food aid. There is a growing concern that food aid that comes from subsidies in donor countries depresses domestic agriculture market in recipient countries. Although food aid is commonly viewed as a humanitarian aid, it presents a mixture of self-interest and altruism. For instance, food aid is known to have originated in the USA as a surplus disposal tool. An attempt to establish high domestic prices for farm products led to the agriculture surpluses, which then required government purchase and then used as food aid. The main objective of this study was to explore how Ethiopia could disentangle itself form food aid dependency and ensure a sustained growth in agriculture. More specifically, the study assessed the situation of food security, structure of agricultural production, consumption, types of food aid, evolution of agricultural support measures, and opportunities in the agricultural sector. The effects of food aid on the macro-economy and household farm production was examined using econometric models. The Ethiopian economy is among the most vulnerable economies in Africa and its performance has been less than satisfactory. Regardless of the different policy regimes, real GDP has been growing at rate of 2.60% during the period spanning 1960-2002. On the other hand, population had been growing on average by 2.71% during the same period, implying a 0.11% decline in the growth rate of per capita income per annum. In terms of sectoral growth rates, agricultural GDP, industrial GDP, and service GDP grew on average by 1.35%, 3.35%, and 4.70% per annum, respectively, during the period 1960-2002. The agricultural sector is dominated by low-input, low-output and low productivity rain-fed smallholder production. Rainfall is the chief determinant of Ethiopia’s economic performance. The sector contributes more than half of GDP; employs more than 80% of the total population; and accounts for more than 90% of the total export earnings. The dominance of agriculture has not changed over time mainly because of its poor performance in terms of generating surplus that could be invested in other sectors of the economy. Agricultural production, for instance, has been growing by about 2.3% per annum during 1980-2000 while population was growing on average at a rate of 2.9%, leading to a decline in per capita agricultural production by about 0.6% per year.
Despite improvement in food grain production particularly in the 1990s, per capita food production has been progressively declining for the last four decades or so. Drought, soil, degradation, policy failures, population pressure, and institutional constraints have been identified as the main causes of the sluggish performance of the agricultural sector. Although efforts have been put in place under different regimes to transform the agricultural sector, it has become almost impossible to address the problem of food production in Ethiopia. Supports provided to the sector under different regimes have not been commensurate with its contribution to the economy and the development of the sector. Atrocious conditions of poverty, lack of the capacity to break out of the vicious circle of low income, low investment and poor growth have weakened the prospects of sustainable development in the country.
The poor performance of agriculture is accompanied by worsening socio-economic situations: more than half of the rural population live in food poverty and food insecure conditions. Domestic food production has never met domestic demand for food and the number of food insecure population has increased over time. Fluctuations in food availability and consumption, caused by crop failure and other factors, have increased the risk of consumption shortfall. Households in
69

marginal areas are food insecure due to low consumption level and because their access to food is variable and unpredictable from one harvest season to the next.
Results of the determinants of rural food consumption indicate that there is strong relationship between demographic characteristics and the level of household food consumption. In other words, households with larger family size are more likely to suffer from consumption shortfalls or fall into poverty than those with smaller family size. The results of the study indicate that measures used to reduce dependency at household level will help increase food consumption. In addition, it has been documented that reducing fertility will have a beneficial impact on women’s health, labor force participation and productivity. The results of the analysis also show that education is important in bringing about sustained growth and increase food consumption at household level. The impact of education in increasing food consumption and reducing food insecurity is significant in rural areas, i.e. households with higher levels of literacy are more likely to earn more income and enjoy increased food consumption than those households with lower levels of literacy. Households with multiple income sources are also better off in terms of food consumption and are less vulnerable to adverse economic and other shocks. Hence, investment in education and creation of alternative employment opportunities are among the key measures necessary to increase food consumption and reduce food insecurity. Ethiopia remains one of the largest food aid recipient countries in the world due to local food production shortfalls. The gap has been largely met via external food aid. Although food aid is meant to bridge transitory food shortfalls (transitory food insecurity), it has become an institutionalised response to a structural food problem for a long period of time. The size of food aid has increased, with significant ups and downs. The highest amount of food aid, accounting for some 27% of the total domestic food production, was received during the severe drought of 1984. About 15 million people (22% of the rural population) required food assistance in 2002/03. Empirical examinations undertaken have shown that food aid increases the total domestic supply of food grains. However, a sustained increase in food aid has a dampening effect on producers' price for food grain, which may have a negative effect on domestic production of food grains. An attempt was made to estimate the interim (delay) multipliers during each of the successive time periods and the result indicates that food aid affects domestic grain production, per capita disposable income, and producers' price of food grains positively, however, the effect appears to be negative on per capita demand for food grains, imports of food grains and quantity of total demand for food grains, with the effects diminishing over time. With regard to the long-run cumulative multipliers, which describe the total effect of a sustained level of food aid increase on the endogenous variables, it has been shown that a sustained 10% increase in food aid would entail an increase in the supply of food grains by about 0.04%, per capita income by 0.003%, commercial imports by 4.88% and quantity of total demand for food grains by about 14.92%, while per capita demand and producers' price for food grains would decline by about 0.0004% and 2.04%, respectively. Not only a continuous increase in food aid has a disincentive effect on domestic agricultural production, through depressing producers’ prices, but also it creates a huge pressure on the demand for foreign exchange earnings which otherwise will be used for importing other goods. This research finding at macro level is not sufficient in laying down a solid foundation for conclusive and concrete policy formulation regarding food aid. There is a need for a detailed assessment of producer household behavior and non-agricultural labor responses in an economic environment influenced by food aid, hence, the developmental consequences of food aid remain cloudy. However, the ultimate consequence for the agricultural sector depends on the behavior on rural households. To examine the household level effects of food aid, a separate econometric model was built and the result indicates that the effects of food aid on rural farm households could have a negative impact.
70
The central message of this study is that sustained inflow of food aid may have a deleterious effect in the over all economy in the interim and long-run and the country may not achieve food security unless alternatives responses to structural and transitory food deficits have been designed. The available evidences indicate that even future prospects for increasing food production in the country are precarious as the Horn of Africa, according to the predictions of models of global warming, has been identified as one of most vulnerable regions with the resultant reduction in cereal yields by about 30% by the year 2030. This indicates that, at present productivity levels of the agricultural sector which is one of the lowest in the world, the country will continue to receive food aid and which further affects the sector negatively, i.e. the country will remain food insecure.
The big question is: what are the alternatives to food aid? This necessitates looking at options for a sustainable agricultural development and food security. The natural resource potential of the country is undoubtedly considerable, with abundant land resources and diverse agro-ecological conditions. The diversity of soil, climate, and elevation allows production of a wide range of agricultural commodities. Ethiopia has also an important place in its richness and diversity of the flora and fauna and endemic plants. Ethiopia has a substantial amount of water resources. The surface water potential amounts to over 110 billion cubic meters per annum and Ethiopia is known as the ‘water tower’ of northeastern Africa.
The country’s labor force is very large and it is believed to be hardworking and productive if given the opportunity. Ethiopians working in America, Europe, Middle East and many parts of Africa have proved their potential to compete with the labor of other countries.
The proportion of the rural population is extremely high in Ethiopia, reaching 98% in most food insecure districts and 85% at national level. There are ample potential employment opportunities in the manufacturing sector, tourism and other service sectors. Tourism is perhaps the most promising activity in Ethiopia. The country is endowed with spectacular geological and geographic contracts, including mountains and plains, valleys and desert, and rivers and lakes. Ethiopia has a long history of independence and its own script, unique in Africa. Its historical sites have the potential of attracting millions of visitors if properly managed. Expansion of non-agricultural employment opportunities would ease the pressure on land rural areas and create market opportunities for agricultural products.
The country needs to design and implement programs aimed at taping its potential, transforming agriculture, breaking the cycle of famine and poverty and thereby eliminating dependence on food aid. The task of reversing the fortunes of the country calls for comprehensive and integrated measures. To begin with, the institutional environment must be change to firmly establish fundamental political, social and legal rules that create the basis for efficient production, exchange and distribution. The institutions of the country must be able to protect productive resources and allow full participation of the public. Government commitment is needed to develop and facilitate the formation of institutions to ensure respect for the rule of law and efficient judiciary in rural areas. Strengthening protective and inclusive institutions is vital for asset creation and trigger independent initiatives by million of farmers. For instance, the land policy should be revisited to remove insecurity and enhance transfer transactions so as to encourage consolidation and out-migration from densely populated areas. There is a consensus that tenure insecurity is a major factor behind the massive land degradation and desertification. The existing land policy has discouraged investment in land improvement, irrigation and tree planting.
Second, the need for reducing the dependence on rainfall and mitigating volatility in crop production cannot be overemphasized in Ethiopia. It is important to increase yield and stabilize agricultural production via investment in irrigation. Effort should be made to contain costs and reduce environmental hazards of irrigation through improved designs and effective management,
71
close attention to water conservation, soil conservation, soil conditioning and soil productivity, and careful selection of crops to be grown in order to maximize return. Agricultural research is needed to generate new technologies, introduce new crops and develop productive agronomic practices under irrigation. It should be stressed that Ethiopia has a comparative advantage (weather and proximity to major markets such as Europe and Middle East) in a number of high value horticultural crops.
Third, diversification of the economy away from uncertain agriculture towards more certain and productive non-agricultural sectors would not only make the economy less vulnerable but also remove the demand constraint for agricultural development. Cities are powerhouses for processing farm products and supplying inputs to rural areas. Larger and expanding urban centers create better opportunities for agriculture and small enterprises to grow, innovate and expand. Fourth, the domestic market needs to be developed through encouraging specialization based on comparative advantages of each agro-ecological zone. Farmers in different parts of the country must be able to grow different types of crops and raise different kinds of animals. Marginal areas can specialise in root crops, fruits and vegetables, high value pulses and oilseeds, tree growing, livestock husbandry, bee-keeping and fishery using irrigation as well as rains (depending on the specific circumstances of each location) for local as well as export markets. Production for market (domestic or export) in Ethiopia is constrained by high transport cost and lack of information. Transportation and communication networks are extremely inadequate. There is very limited local market opportunity for agricultural products, especially perishable items such as vegetables and milk, in rural areas. Thus, it is important to invest in infrastructure and build capacity of the private sector to foster domestic marketing and trade both within regions and neighbouring countries. Production activities must also be guided by the principle of comparative and competitive advantages to benefit from globalization movements (e.g. WTO) and regionalization (e.g. African Union and COMESA). Fifth, increased productivity and competitiveness in world market result from education and improved health and nutrition of the population. The future development of the country will critically depend on a flexible, educated and healthy workforce. Since the natural resource base of the country is being depleted and is subject to long-run price declines, the focus should be on training and upgrading the skill of the labour force. Demographic transition to reduce population growth will also require education, especially for women. Sixth, a significant number of households have lost their valuable assets as a result of recurrent drought, severe land degradation, HIV/AIDS, etc. and are pursuing unsustainable livelihoods. In the absence of a national safety net program, food aid could be as the only supplementary source of income for survival. However, the approach to food aid assistance must change to avoid dependency. In this regard, the twin track approach of FAO could be very useful: the approach combines (i) resource mobilization for agricultural and rural development to create opportunities for the poor and hungry to improve their livelihoods, with (ii) measures to meet the immediate food and nutrition needs of the seriously malnourished so that they can take advantage of such opportunities. For instance, food assistance could thus be combined with financial support and credit with the goal of establishing a sustainable livestock farm (e.g. small ruminants) in the case of poor female- and child-headed households as well as other poor households with labour shortages. Similarly, free or subsidized inputs could be provided for a specified period to time with the aim of increasing production and eventually enabling the family farm pay for itself.
Finally, measures must be taken to mobilize public, private and donor resource in order to undertake to necessary investment and lay the foundations for sustainable growth and
72
development in agriculture. Budgetary allocations must increase through reducing expenditures on food-aid handling, defence, and other unproductive activities. Investment in agriculture and related areas (indicated above) should receive the highest priority as the payoff in terms of poverty alleviation and sustainable development is certainly the highest.
73

REFERENCES Admasu Gebeyehu. 2003. ‘Research and development in land and water resources’, in P. G
McCornick, A. B. Kamara and Girma Tadesse (eds.), Integrated Water and Land management Research and Capacity Building Priorities for Ethopia, Proceedings of MoWR/EARO/WMI/ILRI International Workshop held at ILRI, Addis Ababa, Ethiopia, 2-4 December 2002.
Alemneh Dejene. 2003. Integrated Natural Resources Management to Enhance Food Security: The case of community-based approaches in Ethiopia, Environment and Natural Resources Service Sustainable Development Department, FAO, Rome.
Atakilte Beyene. 2003. Soil Conservation, Land Use and Property Rights in Northern Ethiopia: Understanding environmental change in smallholder farming systems, Ph D Thesis, Department of Rural Development Studies, Swedish University of Agricultural Sciences, Uppsala.
Befekadu Degefe and Berhanu Nega. 1999/00. Annual Report on the Ethiopian Economy, the Ethiopian Economic Association, Vol I, 1999/00, Addis Ababa.
Berhanu Adnew, Klaus Deininger, Mulat Demeke, Samuel Gebre-Selassie and Songquing Jin (2003) Market and non-market transfers of land in Ethiopia: Implications for efficiency, equity, and non-farm development, World Bank Working Paper No. 2292, Washington D.C.
Bewket, W. and Sterk, G. (2002) Farmers’ participation in soil and water conservation activities in the Chemoga Watershed, Blue Nile Basin, Ethiopia, Land Degradation and Development 13: 189-200, John Wiley & Sons Ltd, InterScience (www.interscience.wiley.com).
Bruan et al (1992) Improving food security of the poor: Concepts, policy and programs, IFPRI, Washington D.C.
Caldwell, R. M. Ethiopia: A Country Profile for Famine Mitigation Planning and Implementation, Agency for International Development Bureau for Food and Humanitarian Assistance Office of U.S Foreign Disaster Assistance, Unpublished research report.
Clay, D., Daniel Molla, Debebe Habtewold (1999). Food aid Targeting in Ethiopia: A Study of who needs it and who gets it, Food Policy, 24, 391-409.
Debebe Habtewold (2001) Food Aid and Its Impacts on Peasant Livelihood Strategies, in proceedings of the Symposium of the Forum for Social Studies, Addis Ababa, March 10-11, 2000, Yared Amare(ed.), Addis Ababa.
Degefa Tolosa (2002) Household Seasonal Food Insecurity in Oromiya zone, Ethiopia: Causes, Addis Ababa, Ethiopia.
Dessalign Rahmato. 2004. Large-scale Resettlement in Ethiopia: Is it a viable option?, Forum for Social Studies, Addis Ababa.
Devereux, S. (2000) Food Security in Ethiopia, A discussion paper for DFID, IDS, Sussex.
DPPC (2001) Overview of DPPC, http://www. Dppc.gov.et/about_dppc/overview.htm
Easterly, W. 2002. Grwoth in Ethiopia: Retrospect and Prospect, Centre for Global Development Institute for International Economics, April
Edilegnaw Wale (2003) The opportunity of cost of growing traditional wheat varieties: Implications for the design of targeting principles for adoption of improved varieties in
74

Ethiopia, in proceedings of the National Workshop on Technological Progress in Ethiopian Agriculture, Mulat Demeke, Alemu Mekonnen, Assefa Admassie and Dejene Aredo (eds.), Addis Ababa, Ethiopia.
El-Swaify, SA, Hurni, H. (1996) Transboundary effects of soil erosion and conservation in Nile basin. Land Husbandry 1: 6-21.
Etalem Engida and Mulugeta Zewdue (2002) Food Insecurity and shortage in Ethiopia, Term paper submitted to the Department of Economics of Addis Ababa University, Ethiopia.
FAO (1986) Ethiopian Highlands Reclamation Study, Ethiopia. Final report, Rome, Italy.
FDRE (2003) The New Coalition for Food Security in Ethiopia: Food Security Programme, Vol. I, Addis Ababa, Ethiopia.
Getachew Deriba (1995) Economy at the crossroad: Famine and Food security in Rural Ethiopia, CARE International in Ethiopia, Commercial Printing Enterprises, Addis Ababa.
Lautze, S., Yacob Akililu, A. Raven-Roberts, H. Young, Girma Kebede, J. Leaning. (2003). Risk and Vulnerability in Ethiopia: Learning from the Past, Responding to the Present, Preparing for the Future, A Report for the USAID, Feinstein International Famine Center and Inter-University Initiative on Humanitarian Studies & Field Practice.
MEDaC (1999) Survey of the Ethiopian Economy: Review of Post-Reform Developments (1992/93-1997/98), Addis Ababa.
MOFED (2002), Ethiopia: Sustainable Development and Poverty Reduction Program, Addis Ababa.
Mulat Demeke (1999) The Challenge of increasing food production in Ethiopia, in proceedings of the Eighth Annual Conference on the Ethiopian Economy, Alemayehu Geda and Birhanu Nega (eds.), Addis Ababa, Ethiopian Economic Association.
Mulat Demeke (2000), “ Ethiopian Agriculture Since 1991: Its performance and Challenges Faced”, Paper presented at symposium for Reviewing Ethiopia’s Socioeconomic performance, 1991-1999, organized by the Inter-African Group, UN conference Hall, Addis Ababa, April 26-29, 2000.
Mulat Demeke, Theodros Negash, Bekele Hundie and Techane Adugna (2003) African imperatives in the New World Trade Order: The case of the agricultural sector of Ethiopia (Interim Report) (unpublished).
Mulat Demeke, Theodros Negash, Bekele Hundie and Techane Adugna (2003) African imperatives in the New World Trade Order: The case of the agricultural sector of Ethiopia (Interim Report) (unpublished).
National Office of Population (NOP) (2000) The Ethiopian Population Profile: 1999, Ministry of Economic Development and Cooperation, Addis Ababa, Ethiopia.
Riley, Barry, et al. (2002) The Impact Of Title Ii Food Aid On Food Security In Ethiopia, United States Agency for International Development Food and Humanitarian Affairs Office, Consultancy Report, USAID/Ethiopia.
Samuel Gebre-Sellasie (2003) Summary Report on Recent Economic and Agricultural Policy, paper prepared for the Roles of Agriculture International Conference, October 20-22, 2003, Rome Italy.
Senait Seyoum (2001) Government Policy on food security in Ethiopia: Some strengths and weaknesses, in proceedings of the Symposium of the Forum for Social Studies, Addis Ababa, March 10-11, 2000, Yared Amare(ed.), Addis Ababa.
75

Shiferaw, B. and Holden, S. (2003) Poverty, Resource scarcity and Incentives for soil and water conservation: Analysis of interactions with Bio-Economic model, paper presented at the 25th International Conference of Agricultural Economists, August 16-23, Durbin, South Africa.
Tassew W/Hanna (2004) New pro-poor policies, pre-PRSP experiences and the 2003/04 budget in relation to agriculture and food security in Ethiopia, in Tassew W/Hanna and Walter Eberlei (eds.), Pro-poor Budgeting and the role of Parliament in the implementation of PRSP in Ethiopia, Addis Ababa.
Taye Mengistae (1992) Public Policy, Markets and Technical Progress in the Grain-Plough Culture, in proceedings of the First Annual Conference on the Ethiopian Economy, Mekonen Taddesse (ed.), Addis Ababa, Ethiopian Economic Association.
Tekabe Ayalew (1998) Food Security in Ethiopia, paper presented at the CTA conference: Food insecurity in ACP countries: From policy and program interventions to vulnerable Groups, Leuven, Belgium, CTA 26-30 October.
UNFAO (1993) Agriculture in 2010, Rome, Italy.
Webb P., von Bruan, J. (1994) Famine and Food Security in Ethiopia: Lessons for Africa.John Wiley, London, UK.
World Bank (1998) Assessing Aid: What Works, What Doesn’t and Why, New York
Zerihun Gudeta Alemu (2003) Agriculture Supply Response in Ethiopia, Department of Agricultural Economics, University of the Free State Bloemfontein, Ph D Dissertation.
76