agricultural production and children’s diets in ethiopia
TRANSCRIPT
Agricultural Production and Children’s Diets
Kalle Hirvonen (IFPRI – ESSP, Addis Ababa)
John Hoddinott (Cornell University and IFPRI)
June 15, 2015Addis Ababa, Ethiopia
Institution logo here
Introduction (1)
• Both children and adults need to consume a diverse set of foods• For children, consumption of animal source foods , fruits and vegetables is necessary for linear growth
and for micronutrients• For adults, a diverse diet reduces mortality risks from cardiovascular diseases and certain cancers
• Many interventions aimed at improving aspects of adult and child nutrition (eg PSNP, nutrition BCC) implicitly assume that households have good access to food markets
• Where this does not hold, diversity in household food consumption may depend on diversity of household agricultural production. In economics jargon, consumption and production decisions are non-separable
• For example, Hoddinott, Headey & Dereje (2015) find that household milk production is associated with increased milk consumption and improvements in children’s growth, but not in villages that have access to markets
Introduction (2)
• Making progress on this has been hampered by lack of data• Standard agricultural surveys have data on production diversity but not household
consumption nor food consumption by children• Standard nutrition surveys (eg DHS) have data on food consumption by children but not
household agricultural production• If data come from narrowly defined agro-ecological localities, there may be little variability in
production
• We use newly collected data to assess the links between the diversity of household agricultural production and pre-school children’s dietary diversity in Ethiopia and how this is mediated by market access
• Important because many pre-school children in Ethiopia consume a monotonous diet
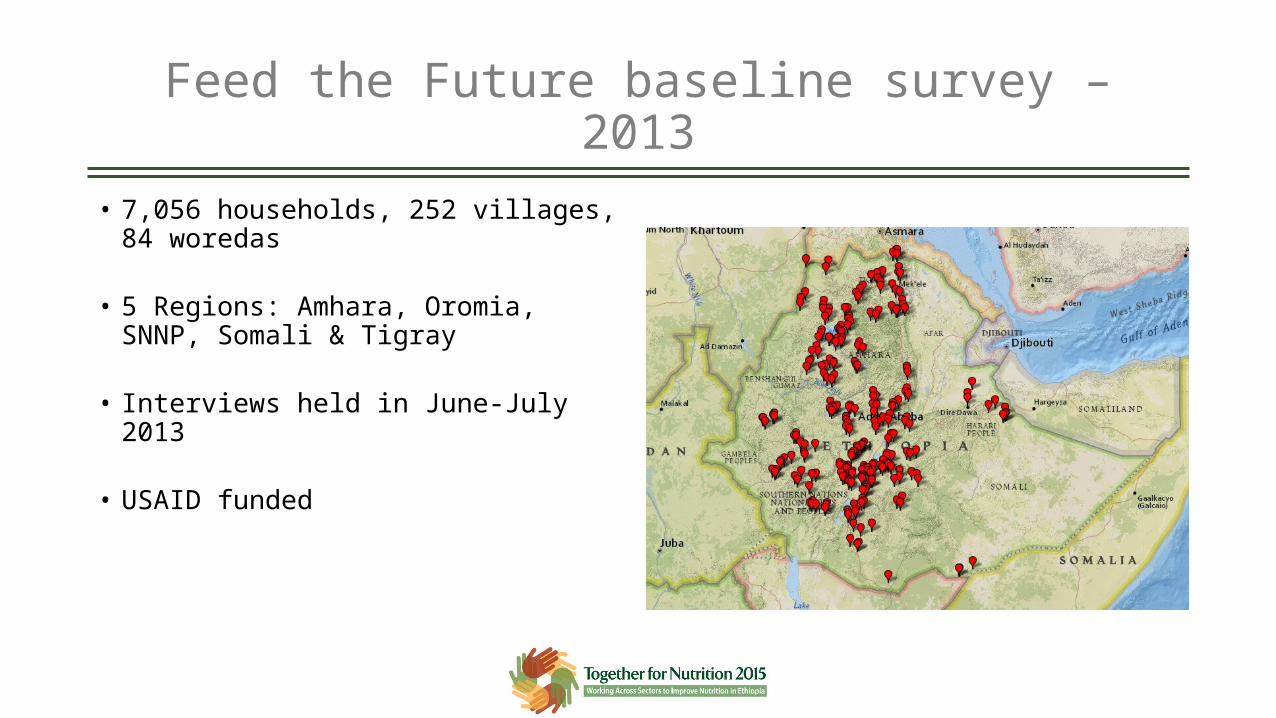
Feed the Future baseline survey – 2013
• 7,056 households, 252 villages, 84 woredas
• 5 Regions: Amhara, Oromia, SNNP, Somali & Tigray
• Interviews held in June-July 2013
• USAID funded
FtF Data are uniquely suited to study links between child diets and agricultural production
o Diet diversity questions at the individual level• 4,213 children (6 months to 6 years)• Previous day (24h recall)• Diet diversity score: 7 food groups (WHO – IYCF 2008)
o Production diversity from comprehensive crop and livestock modules (measured at the household level)• Last year (12 month recall)• Production diversity score: same 7 food groups

Average child consumes from 1.46 food groups
• About 96% of all children eat from 3 of fewer groups
• Diets vary considerably across regions• Dairy consumption highest in Somali
(52%) and Oromia (32%)• Fruit and vegetable consumption highest
in SNNP (55%)
0.03
0.26
0.04
0.03
0.23
0.31
0.55
Other fruits and vegetables
Vitamin A rich fruits and vegetables
Eggs
Flesh foods
Dairy products
Legumes and nuts
Grains, roots and tubers
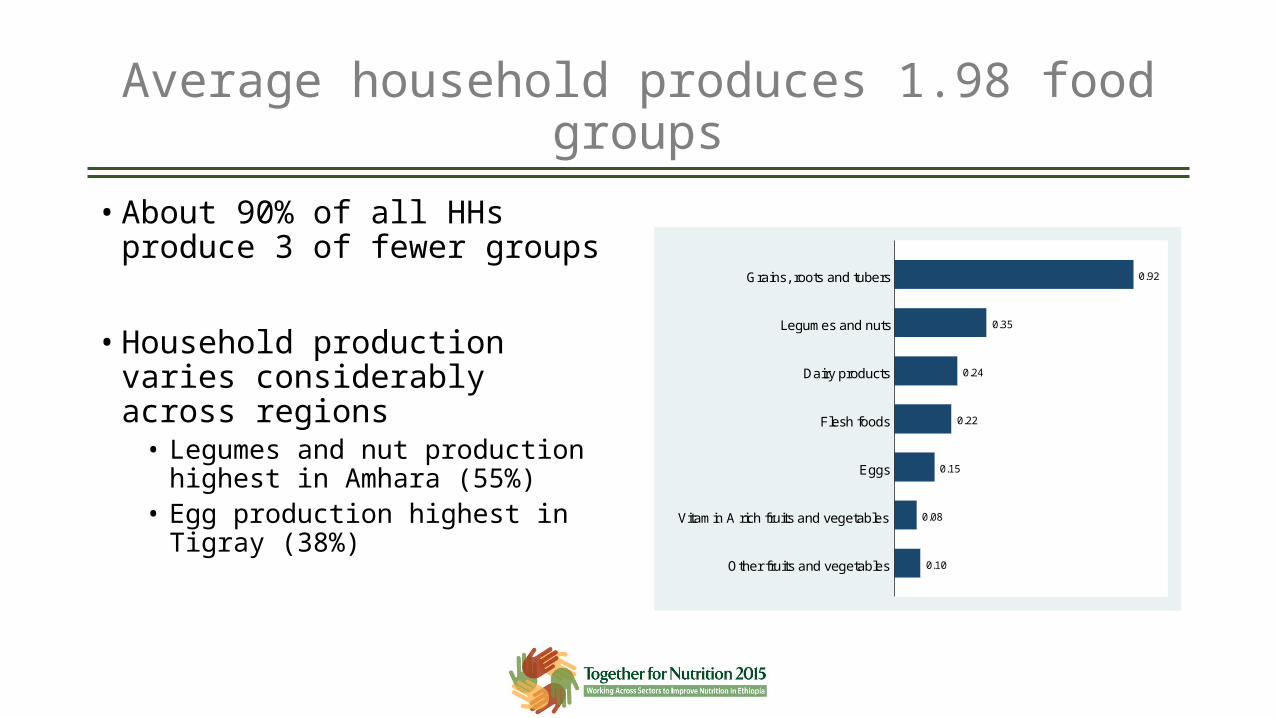
Average household produces 1.98 food groups
• About 90% of all HHs produce 3 of fewer groups
• Household production varies considerably across regions
• Legumes and nut production highest in Amhara (55%)
• Egg production highest in Tigray (38%)
0.10
0.08
0.15
0.22
0.24
0.35
0.92
Other fruits and vegetables
Vitamin A rich fruits and vegetables
Eggs
Flesh foods
Dairy products
Legumes and nuts
Grains, roots and tubers
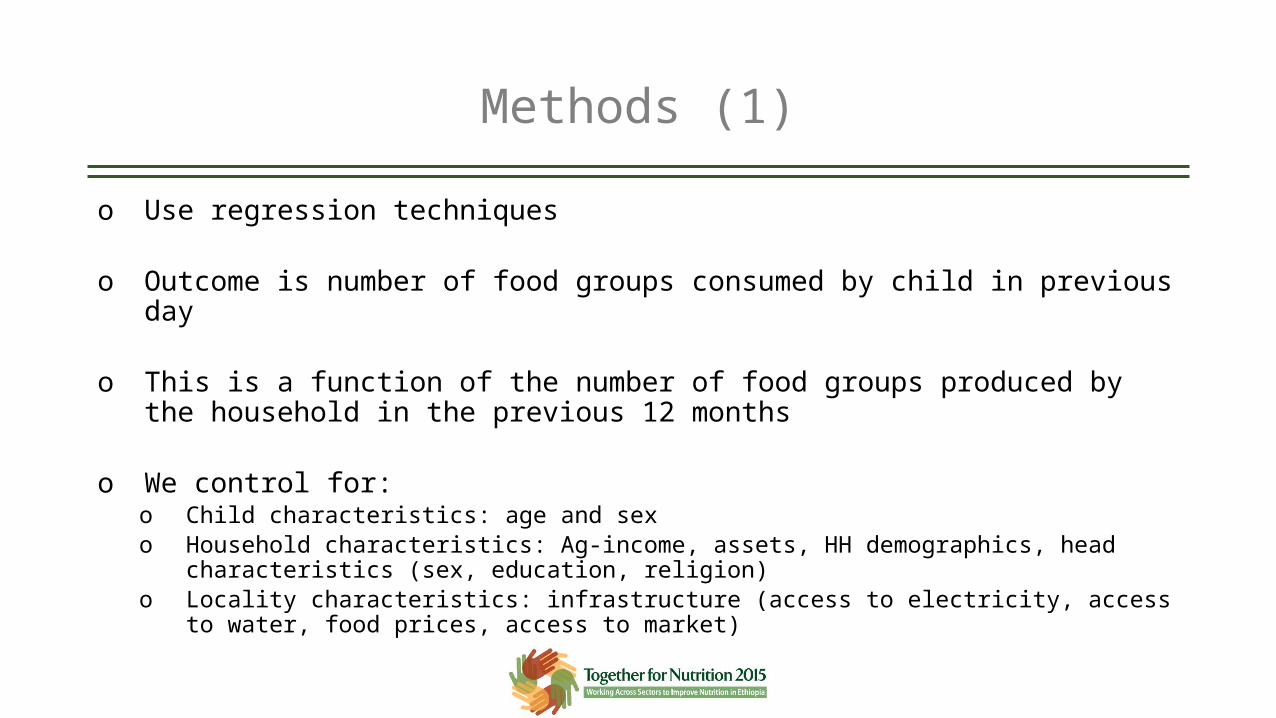
Methods (1)
o Use regression techniques
o Outcome is number of food groups consumed by child in previous day
o This is a function of the number of food groups produced by the household in the previous 12 months
o We control for:o Child characteristics: age and sexo Household characteristics: Ag-income, assets, HH demographics, head characteristics (sex,
education, religion)o Locality characteristics: infrastructure (access to electricity, access to water, food prices,
access to market)
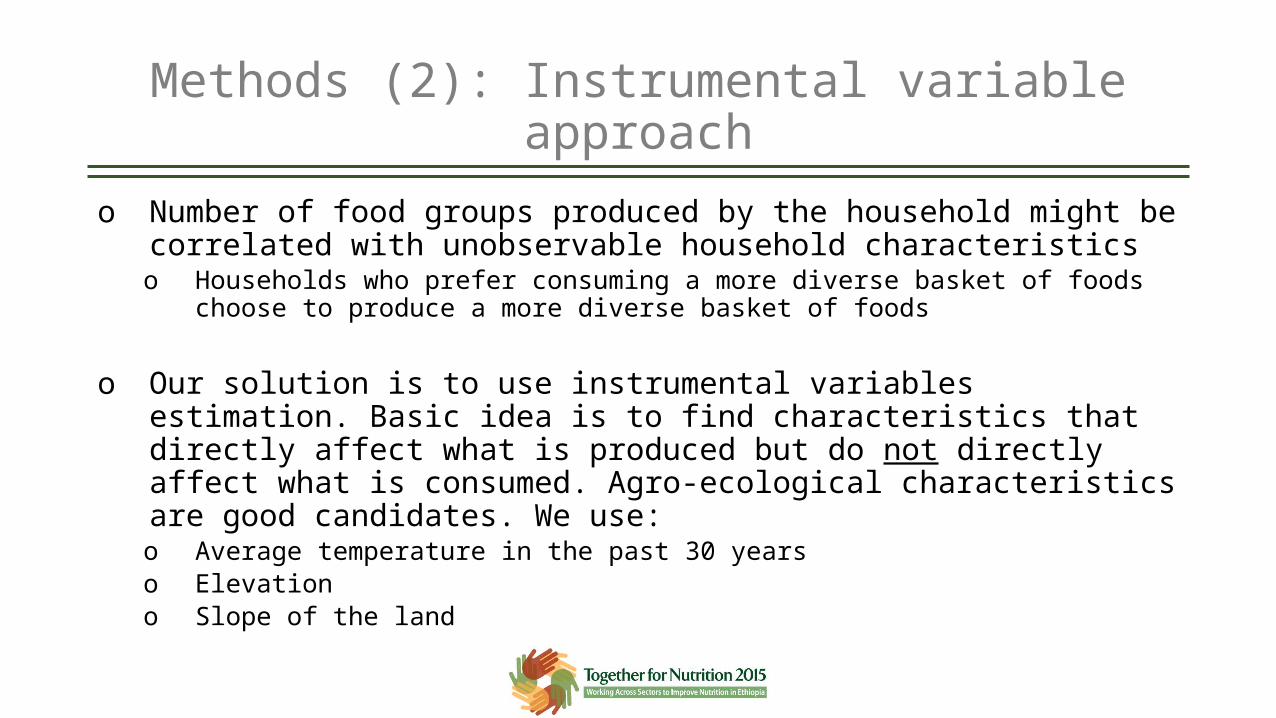
Methods (2): Instrumental variable approach
o Number of food groups produced by the household might be correlated with unobservable household characteristics o Households who prefer consuming a more diverse basket of foods choose to produce a
more diverse basket of foods
o Our solution is to use instrumental variables estimation. Basic idea is to find characteristics that directly affect what is produced but do not directly affect what is consumed. Agro-ecological characteristics are good candidates. We use:o Average temperature in the past 30 yearso Elevationo Slope of the land
Results
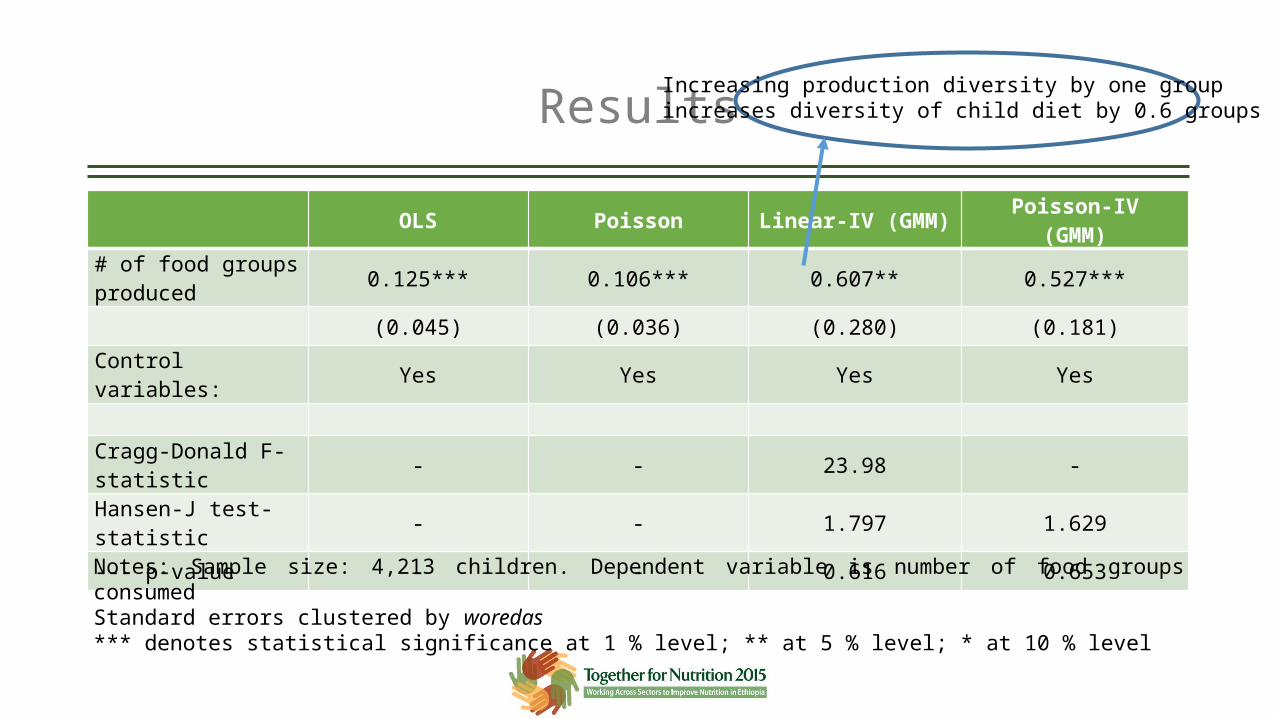
OLS Poisson Linear-IV (GMM) Poisson-IV(GMM)
# of food groups produced 0.125*** 0.106*** 0.607** 0.527***
(0.045) (0.036) (0.280) (0.181)
Control variables: Yes Yes Yes Yes
Cragg-Donald F-statistic - - 23.98 -
Hansen-J test-statistic - - 1.797 1.629
--- p-value - - 0.616 0.653
Notes: Sample size: 4,213 children. Dependent variable is number of food groups consumedStandard errors clustered by woredas*** denotes statistical significance at 1 % level; ** at 5 % level; * at 10 % level
Increasing production diversity by one group increases diversity of child diet by 0.6 groups
Interim conclusion
• We find strong and causal relationship between HH production and children’s diets.
• We therefore reject the separability of household production and consumption decisions.
• But does this mean that rural households must produce a wider range of agricultural outputs in order to improve their children’s diets?
Results by market access
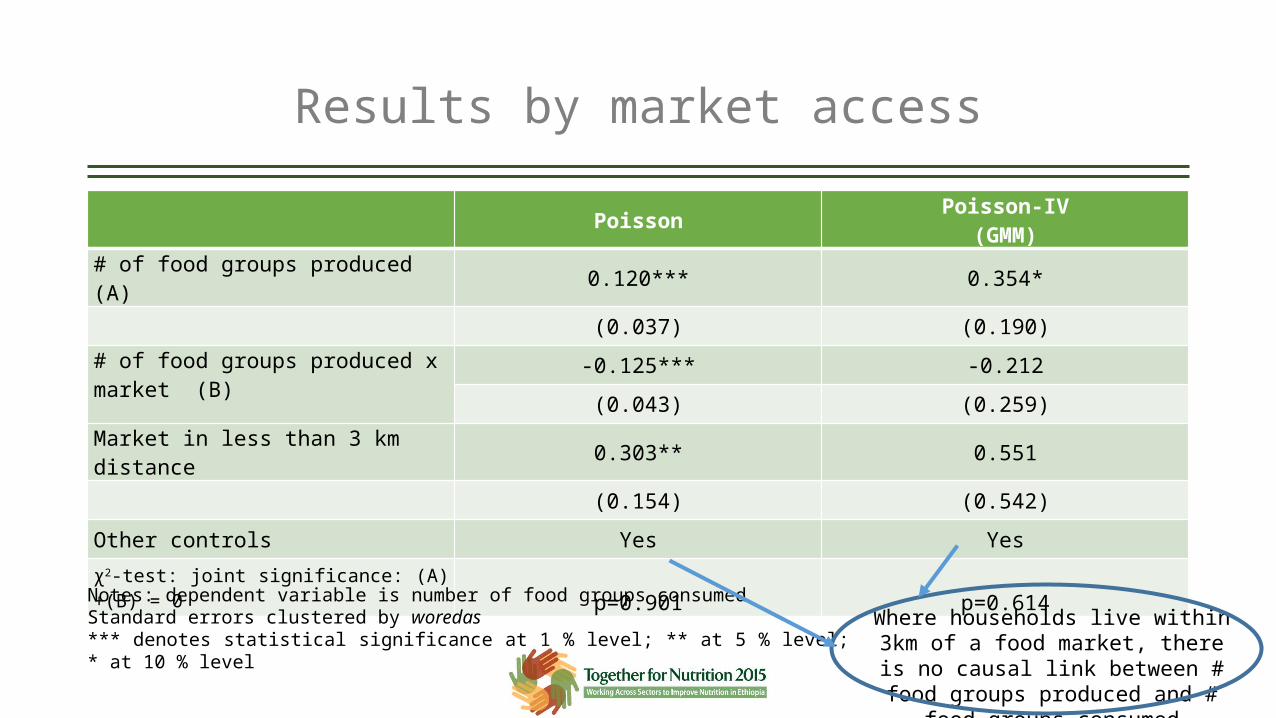
Poisson Poisson-IV(GMM)
# of food groups produced (A) 0.120*** 0.354*
(0.037) (0.190)# of food groups produced x market (B) -0.125*** -0.212
(0.043) (0.259)Market in less than 3 km distance 0.303** 0.551
(0.154) (0.542)
Other controls Yes Yes
χ2-test: joint significance: (A)+(B) = 0 p=0.901 p=0.614
Notes: dependent variable is number of food groups consumedStandard errors clustered by woredas*** denotes statistical significance at 1 % level; ** at 5 % level; * at 10 % level
Where households live within 3km of a food market, there is no causal link between # food groups produced and # food groups
consumed
Conclusions #1
• Children’s diets strongly depend on households’ production choices.
• Note that there is no difference in impact between girls and boys, between younger (6-24m) and older (24-60m) children or by maternal education
• In Economics jargon: consumption and production decisions are non-separable.
• But this relationship does not hold for households with ready access to markets where they can buy and sell food products.
Should all HHs be encouraged to produce a diverse basket of foods?
No: This neglects the basic economic notion of production based on comparative
advantage and the limits imposed by agro-climatic conditions
Rather: Agricultural should work jointly with nutrition interventions to do the following:
• Increase productivity (incomes)
• Use behavior change communication to ensure some of increased income is
used to diversify child (and household) food consumption
• Link households to markets