agricultural production in ethiopia: key results of the ... · agricultural production in ethiopia:...
TRANSCRIPT

Agricultural production in Ethiopia:
Results of the 2012 ATA Baseline Survey
21 April 2013
Nicholas Minot
Bradley Sawyer
International Food Policy Research Institute
Washington, DC

i
INTERNATIONAL FOOD POLICY RESEARCH INSTITUTE
The International Food Policy Research Institute (IFPRI) was established in 1975. IFPRI is one of 15 agricultural research centers that receive principal funding from governments, private foundations, and international and regional organizations, most of which are members of the Consultative Group on International Agricultural Research (CGIAR).
RESEARCH FOR ETHIOPIA’S AGRICULTURE POLICY (REAP): ANALYTICAL SUPPORT FOR THE AGRICULTURAL TRANSFORMATION AGENCY (ATA)
IFPRI gratefully acknowledges the generous financial support from the Bill and Melinda Gates Foundation (BMGF) for IFPRI REAP, a five-year project to support the Ethiopian ATA. The ATA is an innovative quasi-governmental agency with the mandate to test and evaluate various technological and institutional interventions to raise agricultural productivity, enhance market efficiency, and improve food security. REAP will support the ATA by providing research-based analysis, tracking progress, supporting strategic decision making, and documenting best practices as a global public good.
DISCLAIMER
This report has been prepared as an output for REAP and has not been reviewed by IFPRI’s Publication Review Committee. Any views expressed herein are those of the authors and do not necessarily reflect the policies or views of IFPRI.
AUTHORS
Nicholas Minot, International Food Policy Research Institute
Senior Research Fellow, Markets, Trade and Institutions Division
Bradley Sawyer, International Food Policy Research Institute
Senior Research Assistant, Markets, Trade and Institutions Division

ii
Table of Contents
1. Introduction ...................................................................................................................................... 1
2. Crop production and yield ................................................................................................................ 1
3. Agricultural inputs ............................................................................................................................ 6
3.1. Fertilizer .................................................................................................................................... 6
3.2. Seed ........................................................................................................................................ 10
4. Agronomic Practices ....................................................................................................................... 14
4.1. Soil conservation practices ..................................................................................................... 14
4.2. Mechanization ........................................................................................................................ 15
5. Irrigation ......................................................................................................................................... 16
6. Crop marketing ............................................................................................................................... 17
7. Cooperatives ................................................................................................................................... 22
8. Access to Services .......................................................................................................................... 23
9. Characteristics of the heads of household ..................................................................................... 23
Appendix 1: Methods of the 2012 ATA Baseline Survey....................................................................... 27

iii
List of tables
Table 1. Crop production per household growing each crop ................................................................ 2
Table 2. Crop yield per household (kg/ha) ............................................................................................. 3
Table 3. Crop yield in 2011-12 compared to normal by crop ................................................................ 4
Table 4. Reason for increase in yield by crop......................................................................................... 5
Table 5. Reason for decrease in yield by crop ....................................................................................... 6
Table 6. Percentage of plots of each crop receiving inorganic fertilizer................................................ 7
Table 7. Average fertilizer application rate by crop ............................................................................... 8
Table 8. Percentage of plots receiving manure by crop ........................................................................ 9
Table 9. Frequency of manure use by region (percent of plots)............................................................ 9
Table 10. Use of other organic inputs applied this season by region (percentage of plots) ............... 10
Table 11. Types of other organic inputs by region among those using ............................................... 10
Table 12. Source of purchased seed by region .................................................................................... 10
Table 13. Source of purchased seed by crop ....................................................................................... 11
Table 14. Percentage of farmers using improved seed by crop .......................................................... 11
Table 15. Average seed application rate by crop ................................................................................. 12
Table 16. Main problems with variety for selected grains .................................................................. 13
Table 17. Main problem with variety for selected grains (cont.) ........................................................ 13
Table 18. Main problem with varieties for selected grains (cont.) ...................................................... 14
Table 19. Tree planting by region (percentage of plots with trees) .................................................... 14
Table 20. Use of erosion control by region (percentage of plots) ....................................................... 14
Table 21. Use of specific erosion control methods by region (percentage of plots) ........................... 15
Table 22. Type of cultivation by region (percentage of plots) ............................................................. 15
Table 23. Type of cultivation by farm size category (percentage of plots) .......................................... 16
Table 24. Importance of irrigation by region ....................................................................................... 16
Table 25. Price farmers received for their crop sales .......................................................................... 17
Table 26. Total revenue from sales among growers by crop ............................................................... 18
Table 27. Main place where farmers sell produce ............................................................................... 19
Table 28. Main buyers of crop ............................................................................................................. 20
Table 29. Percentage of farmers under contract sale agreement by crop .......................................... 21
Table 30. Percentage of post-harvest storage loss per household by crop ......................................... 22
Table 31. Percentage of farmers that are members of primary cooperatives .................................... 22
Table 32. Satisfaction with cooperative services among members ..................................................... 23
Table 33. Travel time from house to roads and markets ..................................................................... 23
Table 34. Sex of head of household by region ..................................................................................... 23
Table 35. Schooling and literacy of head by region ............................................................................. 24
Table 36. Schooling and literacy of head by sex .................................................................................. 24
Table 37. Age of head by region .......................................................................................................... 25
Table 38. Age of head by sex of head .................................................................................................. 25

iv
Table 39. Marital status of head by sex of head .................................................................................. 25
Table 40. Main activity of head by sex of head.................................................................................... 26
Table A1. Characteristics of the sample ............................................................................................... 28

1
1. Introduction
To support the activities of the Ethiopian Agricultural Transformation Agency (ATA), the International Food Policy Research Institute (IFPRI) carried out a baseline survey in 2012. One goal of the survey was to provide background information about agricultural production, marketing, and related topics. This information will help ATA program directors make informed decisions on how to design interventions to boost agricultural productivity and market efficiency. The second goal of the survey was to serve as a baseline to assess the impact of certain interventions implemented by the ATA.
The survey was based on a stratified random sample of 3,000 households in the four main regions of Ethiopia: Tigray, Amhara, Oromiya, and the Southern Nations, Nationalities, and People’s (SNNP) region. The selected households were dispersed across 100 woredas and 200 kebeles. In order to gather more in-depth information on the 83 woredas, initially identified as the ATA zone, these woredas were oversampled. In other words, 67 of the 83 ATA woredas were included in the sample.
The analysis uses sampling weights to offset the over-sampling of the ATA woredas. All means and percentages presented in this report are weighted estimates using the sampling weights. In addition, the standard errors are calculated by accounting for the sampling design, which includes stratification and clustering. The standard error indicates the amount of sampling error in the estimate, given the variability in the variable itself across households and the sampling design. There is a 95% chance that the true mean is within 1.96 standard errors of the estimated mean.
This report describes the main results of the survey on a range of key indicators identified by the ATA. It covers crop production and yields, agricultural inputs, agronomic practices, crop marketing, cooperatives, irrigation, access to services, and household characteristics. Future reports will address each topic listed above in more detail.
2. Crop production and yield
Table 1 shows the average production of each crop per household growing the crop. It does not show, however, the overall importance of the crop because some crops (such as maize) are grown by a large share of farmers, while other crops (such as red peppers) are grown by a few. The average production of each cereal was 400-800 kilograms (kg) per household growing the crop. Since the average production of cereals per household is less than the average yield of cereals (discussed below), this indicates that, on average, farmers grow less than one hectare of each cereal crop. With pulses, most farmers grew 100-250 kg of each crop, except for grass peas, which are grown in larger quantities. The standard error is an estimate of the sampling error and can be used to construct confidence intervals around the estimates. For example, the 95% confidence interval is roughly twice the standard error, so production of white teff per farmer is 435 kg ± 92 kg.
Yield is the volume of the crop harvested divided by the area of cultivated land. The highest yields among cereals were in maize at nearly 2500 kg/ha, while wheat, barley, and sorghum were in the range of 1200 to 1500 kg/ha. The two types of teff had yields below 900 kg/ha. These yield estimates are lower than official estimates of cereal yields, although they are in the range of yield estimates from the 2013 IFPRI survey of teff growers and the 2008 Ethiopian Agricultural Marketing Household Survey.

2
Table 1. Crop production per household growing each crop
Mean production
(kg/household)
Standard Error
White teff 435.0 46.8
Black/mixed teff 295.0 23.1
Barley 454.4 60.0
Wheat 742.9 100.4
Maize 758.2 151.0
Sorghum 579.9 56.8
Finger millet 251.6 22.8
Other cereals 680.0 119.7
Faba/horse bean 238.7 25.4
Field peas 143.2 21.0
Haricot beans 198.1 34.9
Chick-peas 223.4 23.8
Grass peas/vetch 474.7 106.7
Other pulses 102.9 24.5
Neug 91.6 12.0
Sesame 741.1 126.0
Other oilseeds 166.5 42.7
Cabbage 464.3 155.4
Red peppers 297.6 75.6
Other vegetables 468.2 158.3
Onion 783.8 406.3
Potato 640.6 86.0
Taro/godere 434.4 59.9
Other root crops 613.5 169.3
Banana 557.3 240.9
Other fruit 367.4 74.8
Chat 163.0 43.1
Coffee 277.7 43.7
Hops 289.0 73.4
Enset 595.6 91.7
Other permanent 2,280.7 978.6
Source: 2012 Ethiopia ATA Baseline Survey
In pulses, the highest yields were above 1300 kg/ha for haricot beans and grass peas. The oilseeds had relatively low yields of less than 800 kg/ha. On the other hand, vegetables, fruit, and root crops had high yields, but the effect on profitability is partially offset by the higher costs of production (particularly labor) and higher risks in production and marketing.

3
Table 2. Crop yield per household (kg/ha)
Mean yield (kg/ha)
Standard Error
White teff 850 67
Black/mixed teff 660 45
Barley 1,247 64
Wheat 1,368 102
Maize 2,496 569
Sorghum 1,129 108
Finger millet 784 104
Other cereals 1,400 151
Faba/horse bean 1,123 98
Field peas 735 82
Haricot beans 1,384 411
Chick-peas 965 157
Grass peas/vetch 1,328 243
Other pulses 590 99
Neug 357 48
Sesame 478 52
Other oilseeds 752 92
Cabbage 9,466 3,755
Red peppers 1,975 331
Other vegetables 33,171 29,951
Onion 3,832 768
Potato 4,886 654
Taro/godere 8,471 1,454
Other root crops 6,112 928
Banana 8,759 1,503
Other fruit 125,333 88,369
Chat 2,174 620
Coffee 2,378 793
Hops 7,667 2,941
Enset 6,146 1,216
Other permanent 18,914 3,642
Source: 2012 Ethiopia ATA Baseline Survey
The survey team asked farmers to compare their yields in 2011-2012 to a typical harvest in past years. The survey respondents reported that their 2012 harvest was close to their normal returns in prior years. A majority (78%) reported little to no change in yield from the last few years. However, 18% of farmers said their yield was much lower than normal, compared to just 4% who said their yield was higher than normal. Table 3 shows the results by crop. There were only two crops where more than 10% of growers reported that yields were much higher than normal (grass peas and other root crops), but three crops for which more than 30% of farmers reported much lower yields (neug, sesame, and red peppers). For another dozen crops, more than 20% of growers reported that yields were much lower than normal.

4
Table 3. Crop yield in 2011-12 compared to normal by crop
Yield compared to normal
Crop Much higher
A little higher
Roughly the
same
A little lower
Much lower
Total
White teff 4 21 27 26 22 100
Black/mixed teff 3 20 24 27 27 100
Barley 5 16 32 28 20 100
Wheat 6 20 28 31 15 100
Maize grain 4 16 28 30 22 100
Sorghum 3 15 24 32 26 100
Finger millet 3 17 32 25 24 100
Other cereals 9 21 31 21 18 100
Faba/horse bean 3 16 32 27 21 100
Field peas 4 16 30 23 27 100
Haricot beans 0 7 46 32 15 100
Chick-peas 5 10 43 23 19 100
Grass peas/vetch 12 15 44 14 15 100
Other pulses 6 13 34 26 22 100
Neug 2 12 32 17 38 100
Sesame 5 13 24 26 32 100
Other oilseeds 4 11 56 19 11 100
Cabbage 1 16 73 7 2 100
Red peppers 3 14 28 22 33 100
Other vegetables 2 26 32 26 14 100
Onion 6 15 26 24 29 100
Potato 9 14 30 27 20 100
Taro/godere 2 9 69 8 12 100
Other root crops 11 17 50 14 8 100
Banana 2 12 61 17 8 100
Other fruit 2 6 66 20 6 100
Chat 1 12 40 33 14 100
Coffee 1 14 35 27 23 100
Hops 6 15 69 9 1 100
Enset 2 8 72 11 7 100
Other permanent 1 8 74 9 7 100
Total 4 15 39 24 18 100
N= 659 2,475 7,069 3,865 2,683 16,751
Source: 2012 Ethiopia ATA Baseline Survey
The survey also asked farmers for the reasons why their crop yields varied. Among farmers reporting an increase in crop yields, 64% attributed the increase to good rainfall, 23% to fertilizer use, and 5% to better seeds. Table 4 shows the reasons for above-normal yields, listed by crop. Although rainfall is the main explanation for most crops, fertilizer is commonly given as a reason in the case of several cereals (particularly black/mixed teff and wheat), vegetables, onions, and potatoes. This is not surprising since these crops are more likely to be fertilized, as discussed below. Because few farmers apply fertilizer to sorghum, taro, or coffee, high yields could not be associated with its use.

5
Table 4. Reason for increase in yield by crop
Reason for increase
Crop Rainfall Fertilizer use
Seed use
Other chemicals
Soil degrad-
ation
Pests or
disease
Other Total
White teff 50 34 13 3 0 0 0 100
Black/mixed teff 48 50 1 0 0 0 0 100
Barley 72 20 1 0 2 0 4 100
Wheat 46 45 8 0 0 0 1 100
Maize grain 58 28 7 3 0 0 3 100
Sorghum 89 2 0 2 1 2 4 100
Finger millet 53 26 0 0 0 11 10 100
Other cereals 75 20 4 2 0 0 0 100
Faba/horse bean 67 14 0 1 0 16 1 100
Field peas 62 17 3 0 0 17 0 100
Haricot beans 60 13 10 8 0 0 9 100
Chick-peas 63 0 22 0 0 14 0 100
Grass peas/vetch 89 0 2 0 1 9 0 100
Other pulses 86 2 12 0 0 0 0 100
Neug 64 0 4 0 21 0 12 100
Sesame 73 17 1 0 1 3 5 100
Other oilseeds 96 3 1 0 0 0 0 100
Cabbage 22 64 2 1 1 0 9 100
Red peppers 54 39 2 3 0 0 3 100
Other vegetables 16 2 39 2 0 26 15 100
Onion 42 45 4 0 0 4 5 100
Potato 59 23 5 0 0 0 12 100
Taro/godere 100 0 0 0 0 0 0 100
Other root crops 72 12 11 0 3 0 3 100
Banana 77 0 0 0 8 0 16 100
Other fruit 69 9 9 1 0 0 12 100
Chat 87 0 0 0 6 0 7 100
Coffee 79 1 0 0 11 1 7 100
Hops 87 0 0 5 0 0 9 100
Enset 87 0 1 0 0 0 12 100
Other permanent 90 6 2 0 0 0 2 100
Pasture/grazing 99 0 0 0 0 0 0 100
Planted trees 76 24 0 0 0 0 0 100
Others 76 16 7 0 0 0 1 100
Total 64 23 5 1 1 2 3 100
N= 1,813 877 187 40 39 33 134 3,123
Source: 2012 Ethiopia ATA Baseline Survey
Farmers who reported a below-normal yield were also asked for a list of reasons. The most common response was poor rainfall, given by 62% of the farmers. The second-most common response was pest and disease, cited by 16% of the farmers. Soil degradation was given by 9% of the respondents. About 9% of farmers said that the cause of low yields was fertilizer use, which could refer to insufficient fertilizer or poor quality fertilizer. Table 5 shows the reasons by crop. A few farmers growing cereals cited pests and diseases as a problem (9-20%), but a higher percentage was seen with farmers growing vegetables and onions (one-third) and those growing pulses and oilseeds (over one-quarter).

6
Table 5. Reason for decrease in yield by crop
Reason for decrease
Crop Rainfall Fertilizer Seed use
Other chemicals
Soil degrad-
ation
Pests or
disease
Other Total
White teff 61 11 3 2 16 5 3 100
Black/mixed teff 69 6 1 0 10 11 2 100
Barley 75 5 1 0 8 6 4 100
Wheat 60 8 3 0 8 20 0 100
Maize grain 62 11 5 1 8 9 6 100
Sorghum 70 1 3 0 10 11 4 100
Finger millet 58 6 0 0 22 11 3 100
Other cereals 64 6 0 0 8 16 5 100
Faba/horse bean 51 2 3 0 4 31 9 100
Field peas 52 1 1 0 2 31 14 100
Haricot beans 55 16 3 2 5 14 5 100
Chick-peas 58 0 3 1 6 31 1 100
Grass peas/vetch
59 3 1 0 6 29 2 100
Other pulses 55 0 14 0 6 24 0 100
Neug 42 5 8 1 22 20 2 100
Sesame 59 1 4 0 5 28 3 100
Other oilseeds 66 4 0 0 2 23 4 100
Cabbage 58 0 0 2 3 36 0 100
Red peppers 51 3 1 0 7 35 3 100
Other vegetables 21 0 24 0 3 50 1 100
Onion 38 1 2 1 5 43 10 100
Potato 79 1 3 0 3 13 2 100
Taro/godere 87 0 0 0 11 2 0 100
Other root crops 59 6 10 0 12 13 0 100
Banana 63 0 0 0 19 18 0 100
Other fruit 43 0 0 0 4 21 32 100
Chat 88 0 4 0 1 6 1 100
Coffee 43 1 1 2 13 37 4 100
Hops 62 0 0 0 1 15 22 100
Enset 41 0 0 0 12 44 3 100
Other permanent 85 0 1 1 8 2 3 100
Total 62 5 3 1 9 16 4 100
N= 3,607 418 234 55 584 1,266 341 6,505
Source: 2012 Ethiopia ATA Baseline Survey
3. Agricultural inputs
3.1. Fertilizer
Table 6 shows the percentage of plots for each crop that received inorganic (chemical) fertilizer during the 2001-2012 growing season. Over 60% of the plots dedicated to white teff, black/mixed teff, and wheat were fertilized, and over one-third of the barley, maize, onion, and potato plots were fertilized. On the other hand, pulses, oilseed, fruit crops, and other perennial crops were rarely fertilized.

7
Table 6. Percentage of plots of each crop receiving inorganic fertilizer
Percentage of farmers
Standard Error
White teff 65.0 9.0
Black/mixed teff 61.1 6.2
Barley 42.6 6.3
Wheat 64.6 7.0
Maize grain 39.9 4.4
Sorghum 9.5 3.6
Finger millet 31.2 8.2
Other cereals 57.5 9.5
Faba/horse bean 15.6 4.5
Field peas 14.3 4.3
Haricot beans 7.9 4.3
Chick-peas 1.0 0.8
Grass peas/vetch 0.2 0.2
Other pulses 7.2 3.8
Neug 1.5 0.7
Sesame 13.9 3.2
Other oilseeds 16.8 4.1
Cabbage 15.7 5.3
Red peppers 27.2 10.9
Other vegetables 34.3 8.3
Onion 39.9 9.0
Potato 36.5 8.0
Taro/godere 6.8 5.1
Other root crops 20.0 6.6
Banana 0.0
Other fruit 0.0
Chat 1.3 0.7
Coffee 0.0 0.0
Hops 0.0
Enset 0.1 0.1
Other permanent 5.0 3.8
Source: 2012 Ethiopia ATA Baseline Survey
The application rate refers to the amount of input use, measured in kilograms of inputs per hectare of land. The ATA Baseline Survey collected information on the amount of seed and fertilizer used, but not the quantity of pesticides used. This is because pesticides are sold in different concentrations— a liter of pesticide is not a standard quantity. Estimates of the application rates should be interpreted with some caution because farmers do not always know the quantities used or the size of their plots. Or they may use local units that are difficult to convert to standard units.
Table 7 provides the average fertilizer application rate including those plots that are not fertilized. The fertilizer application rates for teff, wheat, maize, and barley are generally in the range of 50 to 100 kg/ha. The average application rate for sorghum is much lower, 6 kg/ha, partly because just 10% of the plots have any fertilizer. The fertilizer application rate for vegetables is also high, which is not surprising given that they are high-value crops that respond well to fertilizer. Red peppers have the highest rate of fertilizer application (140 kg/ha), although it is important to recognize that red peppers and other vegetables are typically grown on very small plots. Potatoes, onions, and other vegetables have fertilizer application rates of more than 45 kg/ha. The fertilizer application rates are very low

8
(below 10 kg/ha) for chickpeas, grass peas, oilseeds, banana, other fruit trees, coffee, chat, and other perennial crops.
Table 7. Average fertilizer application rate by crop
Mean fertilizer
application rate (kg/ha)
Standard Error
White teff 81.5 14.9
Black/mixed teff 58.4 10.5
Barley 46.7 9.3
Wheat 94.9 17.0
Maize grain 67.4 17.4
Sorghum 6.5 2.8
Finger millet 20.1 6.4
Other cereals 61.0 9.8
Faba/horse bean 17.7 4.3
Field peas 13.5 4.8
Haricot beans 8.9 5.7
Chick-peas 0.8 0.8
Grass peas/vetch 0.0 0.0
Other pulses 6.7 4.1
Neug 0.6 0.4
Sesame 6.9 1.9
Other oilseeds 7.7 3.3
Cabbage 13.6 5.7
Red peppers 139.6 98.9
Other vegetables 76.9 31.7
Onion 55.9 14.1
Potato 46.1 11.8
Taro/godere 9.8 6.8
Other root crops 33.6 13.8
Banana 0.0
Other fruit 0.0
Chat 0.9 0.5
Coffee 0.1 0.1
Hops 0.0
Enset 0.0 0.0
Other permanent 11.1 7.5
Source: 2012 ATA Baseline Survey
Table 8 shows the percentage of plots receiving manure (organic fertilizer). An important question is whether farmers substitute chemical fertilizer with manure or use both together. Looking at all 36 crops, there is no clear relationship, but when focusing on cereals, there is a negative relationship. The two types of teff, wheat, and other cereals are often fertilized (more than 50% of the plots) but less commonly receive manure (less than 15% of the plots). In contrast, maize, barley, sorghum, and millet are less commonly fertilized (less than 50% of the plots), but receive manure more often (more than 15% of the plots).
Looking at the regional patterns, manure use is most common in Tigray, followed by the SNNP region (see Table 9. In Tigray, almost half of the plots receive manure, and 32% of plots receive manure every year or most years; this may be related to more widespread production of livestock, particularly cattle.

9
Table 8. Percentage of plots receiving manure by crop
Percentage of plots
Standard Error
White teff 9.8 2.7
Black/mixed teff 6.8 1.9
Barley 24.5 3.1
Wheat 13.1 2.7
Maize grain 37.3 4.2
Sorghum 20.9 5.1
Finger millet 15.8 6.4
Other cereals 6.8 1.7
Faba/horse bean 19.1 3.2
Field peas 13.5 4.9
Haricot beans 7.5 2.8
Chick-peas 8.3 4.9
Grass peas/vetch 2.1 1.0
Other pulses 10.7 5.4
Neug 1.3 0.7
Sesame 6.2 3.7
Other oilseeds 10.9 5.4
Cabbage 60.0 11.8
Red peppers 30.1 5.7
Other vegetables 29.5 7.8
Onion 36.4 12.6
Potato 53.1 6.4
Taro/godere 35.5 7.5
Other root crops 38.6 7.3
Banana 23.5 5.8
Other fruit 13.3 3.9
Chat 27.1 5.8
Coffee 23.9 6.3
Hops 39.2 7.8
Enset 57.7 3.8
Other permanent 17.2 5.5
Source: 2012 Ethiopia ATA Baseline Survey
Table 9. Frequency of manure use by region (percent of plots)
Region
Manure frequency Tigray Amhara Oromiya SNNP Total
Every year 23 13 16 20 16
Most years 8 2 4 5 4
Some years 17 4 6 8 6
Rarely 2 1 1 2 1
Never 51 81 72 65 74
Total 100 100 100 100 100
N= 1,740 5,508 5,613 5,228 18,089
Source: 2012 Ethiopia ATA Baseline Survey
The percentage of plots that receive other organic inputs, such as mulch, crop residues, and so on, is relatively small. As shown in Table 10, only 8% of plots receive other organic inputs, ranging from 4% to 12% across regions. Among the small number of households using other organic inputs, household

10
refuse is the most common in Tigray and the SNNP region, while mulch is the most common type in Amhara and crop residue is most common in Oromiya (see Table 11).
Table 10. Use of other organic inputs applied this season by region (percentage of plots)
Region
Other organic inputs Tigray Amhara Oromiya SNNP Total
Yes 12 10 7 4 8
No 88 90 93 96 92
Total 100 100 100 100 100
N= 1,740 5,455 5,316 4,994 17,505
Source: 2012 Ethiopia ATA Baseline Survey
Table 11. Types of other organic inputs by region among those using
Region
Type of organic input Tigray Amhara Oromiya SNNP Total
Household refuse 59 15 25 73 26
Mulch/compost 38 84 16 3 52
Crop residue 3 1 58 24 21
Other/mixed 0 0 0 0 0
Total 100 100 100 100 100
N= 180 511 339 186 1,216
Source: 2012 Ethiopia ATA Baseline Survey
3.2. Seed
Overall, about 56% of farmers bought seed for at least one crop during 2011-12. It is important to note that purchased seed is not necessarily certified seed or even an improved variety, since it includes seed purchased from other farmers and grain traders. The share of farmers using purchased seed was highest in the SNNP region (70%) and lowest in Tigray (34%).
The ATA Baseline Survey did not ask farmers about their use of “improved” seed because of the difficulties defining it. The source of purchased seed, however, is a strong indicator of improved seed varieties. Table 12 shows the distribution of purchased seed according to the place where it was purchased. In general, over half the seed purchases are from other farmers, while another 16% are from grain traders. Cooperatives and the Bureau of Agriculture (BoA) represent about 31% of seed purchases, but these percentages vary by region. Cooperatives are an important source in Tigray and Amhara, while the BoA plays a larger role in the SNNP region. Other sources, such as agro-input dealers, research institutes, and non-governmental organizations are very minor sources of seed.
Table 12. Source of purchased seed by region
Source of purchased seed
Region Farmer Grain trader
Coop Bur of Ag
Other Total
Tigray 63 13 22 1 1 100
Amhara 56 6 35 0 3 100
Oromiya 64 15 8 11 2 100
SNNP 21 34 9 35 1 100
Total 52 16 19 12 2 100
N= 926 381 528 212 40 2,087
Source: 2012 ATA Baseline Survey

11
Table 13 shows the source of purchased seed by crop instead of by region. Cooperatives play a relatively important role in distributing maize, wheat, and white teff seed, and account for more than a quarter of the purchases of each crop. The Bureau of Agriculture was cited as the source for 26% of the maize seeds and 15% of the haricot bean seed. Farmers are the most common source of purchased seed for all cereals and pulses except maize and haricot beans.
Table 13. Source of purchased seed by crop
Source of purchased seed
Grain Farmer Grain trader
Coop Bur of Ag
Other Total
White Teff 58 8 27 7 0 100
Black/mixed Teff 89 10 1 0 0 100
Barley 61 29 5 3 2 100
Wheat 48 10 29 9 4 100
Maize 27 13 32 26 2 100
Sorghum 88 12 0 0 0 100
Finger millet 84 16 0 0 0 100
Faba/horse beans 76 23 1 0 0 100
Field beans 63 31 0 0 6 100
Haricot beans 42 43 0 15 0 100
Chick-peas 67 19 5 0 10 100
Lentils 85 9 0 0 6 100
Total 52 16 19 12 2 100
N= 926 381 528 212 40 2,087
Source: 2012 ATA Baseline Survey
Table 14 shows the percentage of farmers that used improved cereal and pulse seeds, based on purchases from an official source such as a cooperative, agro-input dealer, or the BoA. For the major cereal crops, improved seed was purchased by more than 15% of the maize growers, 4% of wheat growers, and about 3% of white teff growers. For the other cereals and pulses, less than 1% of farmers purchased improved seed. The standard error is blank in a few cases because if the households in the sample did not purchase improved seed, it is not possible to calculate the standard error.
Table 14. Percentage of farmers using improved seed by crop
Percentage of farmers
Standard Error
White Teff 2.7 1.1
Black/mixed Teff 0.0 0.0
Barley 0.6 0.3
Wheat 3.9 0.8
Maize 15.3 3.2
Sorghum 0.0 0.0
Finger millet 0.0
Faba/horse beans 0.0 0.0
Field beans 0.0
Haricot beans 0.6 0.5
Chick-peas 0.1 0.1
Lentils 0.0
Source: 2012 Ethiopia ATA Baseline Survey

12
The seed application rate is the quantity of seed (or planting material) used per hectare of cultivated land. As shown in Table 15, wheat and barley have high seed application rates, over 150 kilograms/hectare (kg/ha). Faba beans and grass peas also have seeding rates above 100 kg/ha. Maize and sorghum have seeding rates of 37 and 29 kg/ha, respectively. The seed application rate for both white teff and black/mixed teff is about 45 kg/ha. Root crops require planting materials rather than seeds per se, which explains the high quantities used for onions, potatoes, taro, and other root crops.
Table 15. Average seed application rate by crop
Mean application
rate (kg/ha)
Standard Error
White teff 43.9 3.7
Black/mixed teff 45.0 3.8
Barley 177.4 12.2
Wheat 160.2 6.4
Maize grain 37.0 5.1
Sorghum 29.1 4.4
Finger millet 24.4 2.5
Other cereals 113.4 14.0
Faba/horse bean 128.6 10.7
Field peas 98.1 13.2
Haricot beans 70.4 9.9
Chick-peas 92.3 7.9
Grass peas/vetch 100.7 8.1
Other pulses 95.2 27.5
Neug 16.2 2.5
Sesame 9.1 0.7
Other oilseeds 46.3 4.1
Cabbage 268.0 107.3
Red peppers 81.8 65.7
Other vegetables 128.8 75.4
Onion 647.6 177.2
Potato 1,165.6 94.3
Taro/godere 1,073.0 211.2
Other root crops 972.0 335.6
Banana 251.4 138.0
Other fruit 19.6 10.5
Chat 205.5 117.4
Coffee 207.1 45.3
Hops 212.5 145.0
Enset 575.4 212.2
Other permanent 209.3 101.6
Source: 2012 ATA Baseline Survey
As Table 16 through Table 18 demonstrates, a large majority of respondents (84% to 98%) did not report any problems with the variety of seed they obtained for most crops. Maize was the only exception, where only 75% of farmers did not report a problem. The most common problem reported was that the variety needed additional inputs to perform well. Other problems cited by at least 5% of growers included vulnerability to drought (black/mixed teff), low prices (faba beans), and poor-quality straw (field beans).

13
Table 16. Main problems with variety for selected grains
Grain
Main problem with variety White Teff
Black/mix Teff
Barley Wheat
No problems 84 86 94 93
Needs inputs 5 4 2 3
Low price 0 0 3 0
Poor taste 0 0 0 0
Poor feed 0 2 0 0
Too costly 1 0 0 0
Can't save 0 0 0 0
Vulnerable to drought 0 5 0 0
Vulnerable to flooding 3 0 0 1
Poor straw 3 0 0 0
Others 3 2 1 2
Total 100 100 100 100
N= 172 99 220 268
Source: 2012 ATA Baseline Survey
Table 17. Main problem with the variety for selected grains (cont.)
Grain
Main problem with variety Maize Sorghum Finger millet
No problems 75 85 92
Needs inputs 9 0 7
Low price 1 1 1
Poor taste 1 6 0
Poor feed 1 0 0
Too costly 1 2 0
Can't save 1 2 0
Vulnerable to drought 1 0 0
Vulnerable to flooding 0 4 0
Poor straw 4 0 0
Shelf life 1 0 0
Others 3 0 0
Total 100 100 100
N= 806 115 25
Source: 2012 ATA Baseline Survey

14
Table 18. Main problem with varieties for selected grains (cont.)
Grain
Main problem with variety Faba/horse beans
Field beans
Haricot Chick-peas
Lentils
No problems 89 89 99 95 98
Needs inputs 4 0 0 0 0
Low price 6 0 0 0 0
Poor taste 0 0 0 0 0
Poor feed 0 2 0 1 0
Too costly 0 0 0 0 2
Can't save 0 0 0 0 0
Vulnerable to drought 0 1 0 4 0
Vulnerable to flooding 0 1 0 0 0
Poor straw 0 7 0 0 0
Others 0 0 0 0 0
Total 100 100 100 100 100
N= 136 68 95 40 42
Source: 2012 ATA Baseline Survey
4. Agronomic Practices
This section describes some of the agronomic practices of Ethiopian farmers. It focuses on soil conservation methods (Section 5.1) and mechanization (Section 5.2).
4.1. Soil conservation practices
Soil conservation practices, including tree planting, terracing, drainage, and trash lines, were reported with noticeable variation across regions. Overall, 11% of the plots were planted with trees, but this was over seven times more common among farms in Oromiya than it was in Tigray (see Table 19).
Table 19. Tree planting by region (percentage of plots with trees)
Region
Tree on plot Tigray Amhara Oromiya SNNP Total
Yes 2 9 15 7 11
No 98 91 85 93 89
Total 100 100 100 100 100
N= 1,740 5,509 5,614 5,229 18,092
Source: 2012 Ethiopia ATA Baseline Survey
Overall, other erosion control techniques were used on about one-third of plots. They were widely used in Tigray (71% of plots), but much less common in Oromiya (25%) and the SNNP region (6%) (see Table 20).
Table 20. Use of erosion control by region (percentage of plots)
Region
Erosion control Tigray Amhara Oromiya SNNP Total
Yes 71 53 25 6 34
No 29 47 75 94 66
Total 100 100 100 100 100
N= 1,740 5,508 5,614 5,229 18,091
Source: 2012 Ethiopia ATA Baseline Survey

15
Table 21 shows the proportion of plots in each region that use selected types of erosion control. About 60% of the plots in Tigray and 36% of those in Amhara use stone terraces. About 10% of the plots in Amhara had some form of drainage. Soil bunds, which reduce water runoff, were used in 21% of the plots in Tigray and 13% of the plots in Amhara. Other erosion control techniques were used on less than 10% of the plots in each region.
Table 21. Use of specific erosion control methods by region (percentage of plots)
Region Stone terrace
Fanya juu
Other terrace
Drainage Trash lines
Soil bund
Tigray 60 0 0 1 0 21
Amhara 36 1 1 10 3 13
Oromiya 9 1 3 9 4 6
SNNP 2 0 0 1 1 2
Total 20 1 1 7 3 9
N= 18,644 18,644 18,644 18,644 18,644 18,644
Source: 2012 Ethiopia ATA Baseline Survey
4.2. Mechanization
The survey asked about the methods used to prepare fields for planting. The three main methods used in Ethiopia are cultivation by hoe, animal traction, and tractors. As shown in Table 22, 84% of the plots in the four main regions of Ethiopia are prepared using animal traction. Another 15% are prepared with hoes. Less than 0.5% of the plots are cultivated with a tractor. These proportions vary substantially by region. In Tigray and Amhara, over 90% of the plots are prepared with animal traction. In Oromiya, the percentage is somewhat less, 87%, with greater use of hoes (11%). In the SNNP region, however, hoe cultivation is the most common method used for plots (56%). Animal traction is used on most of the remaining plots (42%).
Table 22. Type of cultivation by region (percentage of plots)
Region
Type of ploughing Tigray Amhara Oromiya SNNP Total
Hoe 4 5 11 56 15
Animal 93 94 87 42 84
Tractor 2 0 0 0 0
Mixed 1 0 1 1 1
Other 0 0 1 0 0
Total 100 100 100 100 100
N= 1,682 4,936 4,441 3,896 14,955
Source: 2012 Ethiopia ATA Baseline Survey
The method of cultivation is also correlated with farm size. Table 23 shows that the percentage of plots cultivated with a hoe declines as a farm size increases: 46% of the farms with 0.5 hectares or less use a hoe, while just 7% of farms with more than 2 hectares use a hoe. Conversely, the use of animal traction rises from 53% in the smallest farm-size category to 92% in the largest farm-size category. The use of tractors for most farm sizes is rare, even among the large farms.

16
Table 23. Type of cultivation by farm size category (percentage of plots)
Farm size category
Type of ploughing <= 0.5 h 0.5-1.0 1.0-2.0 > 2.0 ha Total
Hoe 46 20 10 7 15
Animal 53 78 88 92 84
Tractor 0 0 0 0 0
Mixed 0 2 1 0 1
Other 0 1 1 0 0
Total 100 100 100 100 100
N= 1,666 3,008 4,446 5,835 14,955
Source: 2012 Ethiopia ATA Baseline Survey
5. Irrigation
How widespread is irrigation? Almost 14% of the farms in the four main regions of Ethiopia have irrigation on at least one plot of land for at least one of the two planting seasons (see Table 24). The percentage of farms with irrigated land is highest in Oromiya (23%) and less than 10% in the other three regions.
Table 24. Importance of irrigation by region
Percentage of
households with
irrigation
Standard Error
Percentage of crop land
that is irrigated
Standard Error
Tigray 9.5 4.1 1.7 0.7
Amhara 8.2 2.4 1.4 0.5
Oromiya 22.8 4.4 5.8 1.1
SNNP 6.6 2.3 1.8 0.8
Total 13.7 2.1 3.2 0.6
Source: 2012 ATA Baseline Survey.
The survey data also allows us to calculate the percentage of agricultural land that is irrigated. Overall, about 3% of cropland is irrigated. Again, the percentage is highest in Oromiya (almost 6%) and less than 2% in the other three regions (see Table 24).

17
6. Crop marketing
This section provides a few key indicators related to crop marketing in the four main regions of Ethiopia. The average price farmers received for each crop varies substantially across crops, as shown in Table 25. On a per-kg basis, the most valuable crop is chat, which is worth 140 Birr/kg on average. Chat is followed by “other vegetables,” hops, coffee, and sesame, where the average price ranges from 20 to 50 Birr/kg. Among the cereals, the average prices for the two types of teff are just over 10 Birr/kg, followed by wheat at 5 Birr/kg and maize and barley at around 2 Birr/kg.
Table 25. Price farmers received for their crop sales
Crop Mean price (Birr/kg).
Standard Error
White teff 11.2 3.5
Black/mixed teff 10.6 5.4
Barley 1.9 0.7
Wheat 5.1 1.6
Maize grain 2.0 0.4
Sorghum 1.7 0.2
Finger millet 0.6 0.2
Other cereals 5.2 3.2
Faba/horse bean 5.5 1.3
Field peas 7.6 2.3
Haricot beans 18.9 14.9
Chick-peas 4.9 1.2
Grass peas/vetch 5.3 0.4
Other pulses 14.8 3.8
Neug 6.8 0.8
Sesame 21.5 6.8
Other oilseeds 16.5 6.6
Cabbage 12.9 9.2
Red peppers 15.2 2.6
Other vegetables 48.6 37.8
Onion 15.7 8.7
Potato 2.1 0.5
Taro/godere 3.4 2.4
Other root crops 9.2 3.2
Banana 2.4 0.4
Other fruit 3.9 1.1
Chat 140.5 45.3
Coffee 26.1 3.2
Hops 38.6 19.2
Enset 1.0 0.2
Other permanent 28.3 12.3
Source: 2012 Ethiopia ATA Baseline Survey

18
The average revenue earned per household for each crop (excluding non-growers) is shown in Table 26. The figures include cash sales of crops, excluding the value of crops that households consume. As expected, revenue for smallholder farmers varies by crop depending on price and average volume sold. Overall, chat, haricot beans, and other vegetables generated the most revenue for farmers; however, the standard error of these estimates is sizeable, implying a large variation in revenue across farmers. Within the cereals, the average revenue for white and black/mixed teff is substantially higher than the average revenue for any other cereals, followed by wheat. The average maize revenue is fairly modest. These figures should not be interpreted as measuring the overall importance of each crop in the rural economy for two reasons. First, these figures are averages among growers, so they exclude non-growers. Second, these values exclude the value of home consumption, which is important for other cereals such as maize.
Table 26. Total revenue from sales among growers by crop
Revenue per
household growing the
crop (Birr/year)
Standard Error
White teff 768.2 206.3
Black/mixed teff 1,041.4 535.1
Barley 101.2 16.3
Wheat 488.5 169.0
Maize grain 110.7 29.6
Sorghum 146.0 20.6
Finger millet 55.0 21.6
Other cereals 503.1 324.4
Faba/horse bean 389.8 57.3
Field peas 562.7 187.9
Haricot beans 1,860.9 1,483.2
Chick-peas 450.0 99.8
Grass peas/vetch 528.8 41.3
Other pulses 1,164.5 420.7
Neug 474.3 105.0
Sesame 1,824.8 691.8
Other oilseeds 919.5 297.5
Cabbage 623.4 453.2
Red peppers 326.6 74.1
Other vegetables 2,079.5 1,546.1
Onion 1,520.6 867.7
Potato 154.0 26.5
Taro/godere 337.5 238.6
Other root crops 741.3 281.3
Banana 21.3 5.6
Other fruit 168.3 35.7
Chat 3,249.7 1,487.7
Coffee 1,042.4 246.2
Hops 1,262.1 612.4
Enset 52.9 23.1
Other permanent 639.2 218.7
Source: 2012 Ethiopia ATA Baseline Survey

19
Overall, 90% of the crop sales transactions took place at local markets (see Table 27). For most of the cereals, pulses, oilseeds, vegetables, and root crops, over 90% of the sales were at local markets. In the case of millet, potato, taro, and fruit, the percentage sold at local markets is somewhat lower but still over 70%. The only crops for which sales at the farm account for more than a quarter of the total are bananas and chat. Cooperatives play a negligible role in crop marketing except for coffee, with 14% marketed through cooperatives.
Table 27. Main place where farmers sell produce
Place of sale
Crop On farm Local market
Cooperative Other Total
White teff 6 92 0 2 100
Black/mixed teff 2 93 0 5 100
Barley 1 93 0 6 100
Wheat 3 91 0 5 100
Maize grain 2 95 0 2 100
Sorghum 1 96 0 3 100
Finger millet 0 85 0 15 100
Other cereals 1 93 0 6 100
Faba/horse bean 1 96 0 4 100
Field peas 1 92 0 7 100
Haricot beans 3 97 0 0 100
Chick-peas 0 97 0 3 100
Grass peas/vetch 2 95 0 3 100
Other pulses 1 95 0 4 100
Neug 0 95 0 5 100
Sesame 5 71 3 21 100
Other oilseeds 0 97 0 3 100
Cabbage 1 96 1 1 100
Red peppers 3 96 0 2 100
Other vegetables 1 97 0 2 100
Onion 5 93 0 2 100
Potato 16 83 0 1 100
Taro/godere 16 81 0 3 100
Other root crops 2 98 0 0 100
Banana 31 67 0 2 100
Other fruit 21 77 0 2 100
Chat 29 68 0 3 100
Coffee 3 83 14 0 100
Hops 7 87 0 6 100
Enset 4 95 0 2 100
Other permanent crops 15 82 0 2 100
Total 6 90 1 3 100
N= 331 4,752 52 329 5,464
Source: 2012 Ethiopia ATA Baseline Survey
The survey also collected information on the type of buyer. As shown in Table 28, nearly three out of four crop sales were made to a trader. The second most common type of buyer was a consumer, accounting for 16% of all sales transactions. A common example of this is when a farmer goes to a local market and sells his or her own crop directly to consumers. In the case of enset, 53% of the sales were made directly to consumers, but for many crops the percentage was just 10-30%. Again, the

20
role of cooperatives is minor, with the possible exception of coffee. About 8% of coffee sales were made to a cooperative (the difference between this figure and the 14% in the previous table may be cases where the farmer considered the cooperative to be facilitating the sale rather than actually buying the crop).
Table 28. Main buyers of crop
Main buyer
Crop Farmer Trader Cooperative Consumer Other Total
White teff 16 64 0 17 2 100
Black/mixed teff 8 59 0 32 0 100
Barley 12 71 0 17 0 100
Wheat 7 76 0 15 1 100
Maize grain 7 80 1 13 0 100
Sorghum 16 63 0 21 0 100
Finger millet 21 44 0 35 0 100
Other cereals 2 72 0 26 0 100
Faba/horse bean 5 77 0 18 0 100
Field peas 16 60 0 24 0 100
Haricot beans 15 74 0 11 0 100
Chick-peas 4 87 0 9 0 100
Grass peas/vetch 4 73 0 23 0 100
Other pulses 14 78 0 8 0 100
Neug 6 84 0 10 0 100
Sesame 0 87 3 0 10 100
Other oilseeds 6 80 0 14 0 100
Cabbage 3 61 1 34 0 100
Red peppers 3 89 0 8 1 100
Other vegetables 2 73 0 25 0 100
Onion 1 83 0 16 0 100
Potato 22 61 0 15 2 100
Taro/godere 27 47 0 26 0 100
Other root crops 3 81 0 16 0 100
Banana 2 80 0 18 0 100
Other fruit 3 82 0 15 0 100
Chat 8 79 0 13 0 100
Coffee 3 86 8 2 0 100
Hops 28 51 0 13 7 100
Enset 7 40 0 53 0 100
Other permanent 21 63 0 16 0 100
Total 9 74 1 16 1 100
N= 365 4,114 49 876 47 5,451
Source: 2012 Ethiopia ATA Baseline Survey

21
For each crop sold, the questionnaire asked whether the farmer had a contract to sell to the buyer— either written or oral and including both pre-planting and pre-harvest contracts. Even with this broad definition of contract farming, only a small fraction of sales transactions (1.7%) were under contract. And of the contract sales, most were contracts negotiated after planting but before harvest. Less than 0.5% of sales transactions involved a pre-planting contract. The crops with the largest percentage of sales under contract (of any type) were sesame (8.4), bananas (6.1%), and chat (6.1%).
Table 29. Percentage of farmers under contract sale agreement by crop
Avg. Standard Error
White teff 0.1 0.0
Black/mixed teff 0.1 0.1
Barley 0.6 0.4
Wheat 1.2 0.7
Maize grain 0.1 0.1
Sorghum 0.4 0.2
Finger millet 0.0
Other cereals 1.2 1.1
Faba/horse bean 0.1 0.1
Field peas 0.2 0.2
Haricot beans 0.7 0.7
Chick-peas 0.3 0.2
Grass peas/vetch 0.0
Other pulses 0.2 0.2
Neug 0.0
Sesame 8.4 2.2
Other oilseeds 0.1 0.1
Cabbage 0.2 0.2
Red peppers 0.0
Other vegetables 0.3 0.3
Onion 2.2 1.6
Potato 0.2 0.1
Taro/godere 0.0
Other root crops 0.1 0.1
Banana 6.1 3.3
Other fruit 3.7 3.1
Chat 6.1 3.2
Coffee 3.3 1.9
Hops 0.5 0.5
Enset 0.0
Other permanent 0.0
Source: 2012 Ethiopia ATA Baseline Survey

22
The survey did not ask about post-harvest losses, because it is difficult for farmers to determine their losses during harvesting and threshing. The survey did ask about the loss of cereals and pulses during storage. Respondents reported extremely low storage losses. Less than 0.5% of crop production was lost due to any reason when stored after the harvest in either the Belg or Meher seasons of 2011-12.
Table 30. Percentage of post-harvest storage loss per household by crop
Avg. Standard Error
White teff 0.2 0.1
Black/mixed teff 0.2 0.1
Barley 0.3 0.1
Wheat 0.4 0.1
Maize grain 0.4 0.1
Maize cob 0.3 0.1
Sorghum 0.4 0.1
Finger millet 0.1 0.1
Source: 2012 Ethiopia ATA Baseline Survey
7. Cooperatives
The household and cooperative surveys of the 2012 ATA Baseline Survey provided considerable information about cooperative membership, services provided by cooperatives, and reasons for using or not using cooperative services. This section provides a brief introduction of some results related to cooperative membership and satisfaction with cooperative services. Overall, 36% of farm households, in the four main regions of Ethiopia, have at least one person who is a member of an agricultural cooperative. The percentage varies by region, being over 50% in Tigray and Amhara, but less than one-quarter in Oromiya, and just 11% in the SNNP region.
Table 31. Percentage of farmers that are members of primary cooperatives
Percentage of farm
households
Standard Error
Tigray 51.7 3.4
Amhara 59.5 5.9
Oromiya 23.5 4.6
SNNP 11.4 3.1
Total 36.1 3.5
Source: 2012 Ethiopia ATA Baseline Survey
The level of satisfaction with cooperative membership depends partly on how the question is asked. Table 32 presents two measures of satisfaction with cooperative membership. One question asked whether farmers think they have benefited from cooperative membership. Overall, two-thirds of members say they have benefited. Over 70% respond positively in Tigray and Amhara, but only 62% in Oromiya and about half in the SNNP region. If asked whether the cooperative has problems providing services, close to one-third said yes. Those who said cooperatives do have problems providing services, varies from 19% in the SNNP to almost 40% in Amhara.

23
Table 32. Satisfaction with cooperative services among members
Percentage who say
they have benefited
from membership
Standard Error
Percentage who say
coop has problems providing services
Standard
error
Tigray 71.2 3.0 21.7 2.7
Amhara 74.4 2.0 39.6 2.2
Oromiya 61.6 2.8 30.4 2.7
SNNP 49.1 4.8 19.0 3.9
Total 67.9 1.4 31.5 1.4
Source: 2012 Ethiopia ATA Baseline Survey
8. Access to Services
The 2012 ATA Baseline Survey asks about access to roads and markets. Because access depends on both distance and means of transportation, the survey includes questions about travel time to different types of services when using normal modes of transportation. Farm households reported that it takes an average of 47 minutes to get to a dry-season road, almost two hours to get to an all-weather road, and close to four hours to get to the nearest asphalt road (see Table 33). On average, it takes more than an hour to get to a market or an agricultural cooperative, roughly two hours to travel to an agro-input dealer, and about three hours to get to the nearest woreda center.
Table 33. Travel time from house to roads and markets
Avg. time (minutes)
Standard Error
Dry season road 47 8.5
All weather road 110 23.7
Asphalt road 234 NA
Market place 85 6.1
Woreda center 196 31.0
Ag. cooperative 73 8.0
Agro-input deal 118 NA
Source: 2012 ATA Baseline Survey
9. Characteristics of the heads of household
This section describes some basic characteristics of the household heads in the four main regions of Ethiopia. The results are based on Section A of the household questionnaire of the 2012 ATA Baseline Survey. As shown in Table 34, about 14% of the households are female-headed, though the share is higher in Tigray and lower in Amhara.
Table 34. Sex of head of household by region
Region
Sex Tigray Amhara Oromiya SNNP Total
Male 78 89 84 86 86
Female 22 11 16 14 14
Total 100 100 100 100 100
N= 480 840 870 810 3,000
Source: 2012 ATA Baseline Survey
24
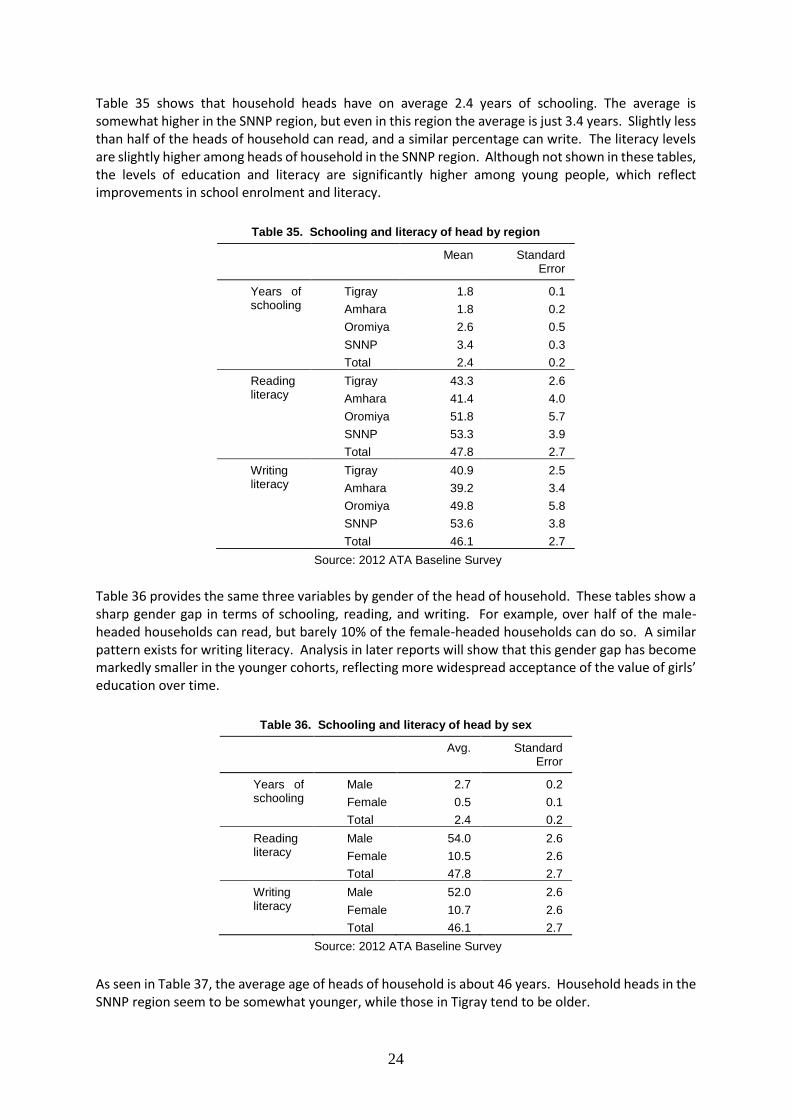
Table 35 shows that household heads have on average 2.4 years of schooling. The average is somewhat higher in the SNNP region, but even in this region the average is just 3.4 years. Slightly less than half of the heads of household can read, and a similar percentage can write. The literacy levels are slightly higher among heads of household in the SNNP region. Although not shown in these tables, the levels of education and literacy are significantly higher among young people, which reflect improvements in school enrolment and literacy.
Table 35. Schooling and literacy of head by region
Mean Standard Error
Years of schooling
Tigray 1.8 0.1
Amhara 1.8 0.2
Oromiya 2.6 0.5
SNNP 3.4 0.3
Total 2.4 0.2
Reading literacy
Tigray 43.3 2.6
Amhara 41.4 4.0
Oromiya 51.8 5.7
SNNP 53.3 3.9
Total 47.8 2.7
Writing literacy
Tigray 40.9 2.5
Amhara 39.2 3.4
Oromiya 49.8 5.8
SNNP 53.6 3.8
Total 46.1 2.7
Source: 2012 ATA Baseline Survey
Table 36 provides the same three variables by gender of the head of household. These tables show a sharp gender gap in terms of schooling, reading, and writing. For example, over half of the male-headed households can read, but barely 10% of the female-headed households can do so. A similar pattern exists for writing literacy. Analysis in later reports will show that this gender gap has become markedly smaller in the younger cohorts, reflecting more widespread acceptance of the value of girls’ education over time.
Table 36. Schooling and literacy of head by sex
Avg. Standard Error
Years of schooling
Male 2.7 0.2
Female 0.5 0.1
Total 2.4 0.2
Reading literacy
Male 54.0 2.6
Female 10.5 2.6
Total 47.8 2.7
Writing literacy
Male 52.0 2.6
Female 10.7 2.6
Total 46.1 2.7
Source: 2012 ATA Baseline Survey
As seen in Table 37, the average age of heads of household is about 46 years. Household heads in the SNNP region seem to be somewhat younger, while those in Tigray tend to be older.

25
Table 37. Age of head by region
Avg. Standard Error
Tigray 49.8 1.5
Amhara 47.1 1.3
Oromiya 45.5 0.8
SNNP 42.8 1.4
Total 45.9 0.6
Source: 2012 ATA Baseline Survey
Table 38 shows that female heads of household tend to be older (50 years old) than male heads of household (45 years old). This reflects the fact that a significant proportion of female-heads are widows, as discussed below.
Table 38. Age of head by sex of head
Avg. Standard Error
Male 45.2 0.7
Female 50.1 1.4
Total 45.9 0.6
Source: 2012 ATA Baseline Survey
Table 39 reveals that almost all male heads (96%) are married, while the majority of female heads (58%) are widowed. Another quarter of female heads are either divorced or separated, whereas just 1% of male heads fall into these categories. This imbalance implies that divorced men are remarrying in greater numbers and/or moving out of the rural areas.
Table 39. Marital status of head by sex of head
Sex
Marital status Male Female Total
Single 1 1 1
Married 96 16 84
Separated 0 6 1
Divorced 1 19 4
Widowed 1 58 10
Total 100 100 100
N= 2,568 432 3,000
Source: 2012 ATA Baseline Survey
Almost all (96%) of the male household heads cite crop production as their main activity. Among female heads, however, 48% say crop production and 42% say unpaid household work consists of their main activity. Female heads are also more likely to list commerce (trading) and other businesses as their main activity.

26
Table 40. Main activity of head by sex of head
Sex
Main activity Male Female Total
Crop production 96 48 89
Livestock 0 0 0
Commerce 0 3 1
Other business 1 3 1
Employee 1 1 1
Student 0 0 0
Unpaid housework 0 42 6
Retired 1 1 1
Disabled or Others 1 1 1
Total 100 100 100
N= 2,568 432 3,000
Source: 2012 ATA Baseline Survey

27
Appendix 1: Methods of the 2012 ATA Baseline Survey
Objectives
The 2012 ATA Baseline Survey was designed to serve two objectives. First, it was to provide up-to-date information on a range of topics related to agricultural production and marketing, as well as rural livelihoods in general. The topics of interest include household composition, housing, assets, land use, crop production, crop marketing, storage, livestock production, non-farm income, credit, and perceptions about markets and government services. This information was intended to assist the ATA in designing interventions to help raise agricultural productivity and improve marketing efficiency.
The second objective was to serve as a baseline for the interventions to be carried out by the ATA and their partners. The baseline would serve as a pre-project benchmark to compare outcomes that the ATA interventions are designed to influence. Without a baseline survey, an evaluation would have to rely on differences in outcomes between beneficiaries and non-beneficiaries. But, it would be difficult to attribute any differences between the two groups to the project, since the differences may have existed before the program was launched.
Questionnaires
The ATA Baseline Survey is composed of three questionnaires: a household questionnaire, a kebele questionnaire, and a cooperative questionnaire. The household questionnaire is the largest of the three, encompassing 23 pages of questions and tables. It was administered to 3,000 farm households in the main four regions of Ethiopia: Tigray, Amhara, Oromiya, and the Southern Nations, Nationalities, and People’s (SNNP) region. The questionnaire is divided into 13 modules on the following topics:
A. Household member characteristics B. Housing and assets C. Land ownership and use D. Crop production E. Crop inputs F. Crop sales G. Crop storage H. Livestock income I. Non-farm income J. Changes in sources of income over time K. Credit L. Food and non-food consumption M. Attitudes and perceptions
The community questionnaire consists of four pages and was administered to kebele leaders in each of the 200 kebeles visited for the household survey. The community questionnaire covered the following topics:
A. Infrastructure and market access B. Transportation services for agricultural productions C. Inputs and output markets D. Cooperatives E. Credit F. Post-harvest facilities G. Access to information H. Other

28
Finally, the ATA Baseline Survey included a short two-page questionnaire for cooperatives that were based in the kebeles visited by the survey team. The questionnaire was designed to complement a parallel phone survey of cooperatives and a larger cooperative survey to be carried out by the project later. This questionnaire included questions about the size and age of the cooperative, services offered by the cooperative, and storage capacity.
Sampling
The sample design reflects a compromise between the goal of providing general information on the agricultural sector in Ethiopia and the goal of serving as a baseline for ATA interventions, which would be concentrated in 83 woredas. These are known as the AGP woredas because they are the targets of the Agricultural Growth and Productivity (AGP) project. To meet the first objective, some households were selected from the four main regions of Ethiopia: Tigray, Amhara, Oromiya, and SNNP. To meet the second objective, households in the AGP woredas were over-sampled.
More specifically, the households were selected using a three-stage stratified random sample. In the first stage, 100 woredas were selected. In order to over-sample AGP areas, the woredas were stratified into AGP and non-AGP categories and two-thirds of the 100 woredas were selected from the AGP area and one-third from non-AGP areas. As a result, the sample covers more than 80% of the 83 AGP woredas but just 7% of the non-AGP woredas.
In the second stage, two kebele were randomly selected from each of the 100 woredas. In the third stage, 15 agricultural households were selected randomly from each of the 200 kebele, using household lists maintained by kebele officials. As a result, the sample includes 3,000 households, about two-thirds of which are in the AGP woredas.
Table A1. Characteristics of the sample
AGP Non-AGP Total
Total number of woreda 83 467 550
Selected woreda 67 33 100
Number of selected kebele (2 per woreda) 134 66 200
Number of selected households (15 per kebele) 2,100 990 3,000
The community survey was administered to kebele leaders in each of the 200 kebeles included in the household sample. The cooperative survey was administered to cooperative leaders whenever there was a cooperative in the kebele that was included in the sample. Because only about half the kebeles have a cooperative based there, the sample in the cooperative survey was 102.
Implementation
The ATA Baseline Survey was carried out by seven teams, each consisting of a supervisor, 4-5 enumerators, and a driver. The work of the seven teams was coordinated and supervised by a survey manager. The supervisors and enumerators were provided with a seven-day training course in how to administer the interview and fill in the questionnaire. The training also included three days of field-testing. The data collection was carried out using Mirus Schoolmate tablets equipped with data entry program prepared using CSPro software. A tablet was provided to each supervisor and enumerator for the duration of the survey. The teams were given three days of training on how to use and maintain the tablets, as well as protocols to ensure data integrity and security. The training took place in July 2012, and the data collection was carried out from the end of July into September 2012.

29
When the data collection phase was completed, the CSPro files were converted to Stata for cleaning and analysis. Because the CSPro data entry program was written to include range checks for every variable and skip patterns, the data quality was higher than usual for surveys of this type.