controlling.com agile reporting in the digital … · controlling.com agile reporting in the...
TRANSCRIPT

C O N T R O L L I N G . C O M
A G I L E R E P O R T I N G
I N T H E D I G I T A L
E C O N O M Y
I C V C O N T R O L L I N G B A R C A M P
D R . J Ö R G E N G E L B E R G S
2 4 T H J U N E 2 0 1 7
M U N I C H

Zalando at a glance
Reporting requirements
Effective reporting landscape
Efficient processes and systems
Continuous improvements
Q&A
2

3
Z A L A N D O A T A
G L A N C E
F R O M F L I P F L O P S T O M - D A X

4 as at Dec 2016
Z AL AN D O AT A G L AN C E
~3.6billion EURO
net sales 2016
>50%return rate acrossall categories
~165million
visitspermonth
~20millionactive customers
~200,000product choices
~12,000employees in Europe
15countries
>1,500brands

5
W E L O V E
F A S H I O N

6
W E O F F E R A S U C C E S S F U L AN D C U R AT E D AS S O R T M E N T
HIGHLY
EXPERIENCED category management
CURATED
SHOPPINGwith Zalon
>350designers & stylists
~200,000 articles from
>1,500international brands
private labels17
LOCALIZATIONof the assortment

7
W E D R E S S C O D E
8
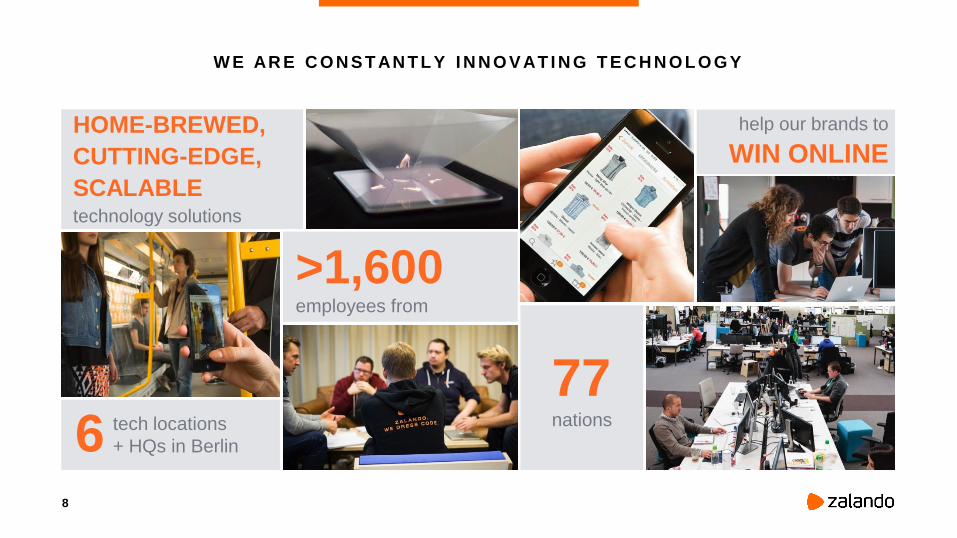
W E AR E C O N S T AN T L Y I N N O V AT I N G T E C H N O L O G Y
HOME-BREWED,
CUTTING-EDGE,
SCALABLE technology solutions
6 tech locations
+ HQs in Berlin
help our brands to
WIN ONLINE
>1,600employees from
77nations

9
W E L I V E
O P E R A T I O N A L
E X C E L L E N C E

10
W E O P E R AT E F AS H I O N
customer
care in
12languages
>20 payment methods
adapted to each market
15markets
~6,300employees
and
6fulfillment
centers
INNOVATIVEcontent creation

11
R E P O R T I N G
R E Q U I R E M E N T S

12
I N C R E AS I N G R E P O R T I N G R E Q U I R E M E N T S I N E N V I R O N M E N T O F S T R O N G
G R O W T H
DATA STORAGE
(BACKEND)
REPORTING ENGINE
(FRONTEND)
MULTIDIMENSIONAL
FINANCIAL
REPORTING
OPERATIONAL
REPORTING
SUPPORT PLANNING/
BUDGETING
SAP BW ON HANA JEDOXSAP BO /
MICROSTRATEGYPALO / JEDOX
• LESS DATA
STORAGE
• MANAGEMENT OF
DIFFERENT
VERSIONS
• RECONSTRUC-
TION OF
HISTORICAL DATA
• RESTATEMENTS
• AUTOMATED
REPORTS
• FAST UPDATES
• SIMULTANEOUS
WORK
• MOBILE ACCESS
• SUSTAINABILITY
• FLEXIBILITY
• MULTIDIMENSIONAL ANALYSIS OF PROFIT
CONTRIBUTION
• EXTENDED P&L ANALYSIS FROM DIFFERENT PERSPECTIVES
(E.G. CATEGORIES)
• AVAILABILITY OF
DIFFERENT DATA
LAYERS (PLAN VS.
ACTUALS)
• MIN. 3
DIMENSIONS

O L D R E P O R T I N G S E T - U P N O T B U I L D F O R AG I L E R E Q U I R E M E N T S
• No plan data
• No charts
• No filtering
• Outdated KPI definitions
• Fragmented
• One channel only
13

N E W R E P O R T I N G S E T - U P W I T H S E V E R AL AD V AN T AG E S
• One page only
• Remote and mobile access
• Actuals and plan
• Chart visuals
• Dynamic filtering
• Harmonized definitions and formats
for all units
• All sales channels included
14

16
E F F E C T I V E
R E P O R T I N G
L A N D S C A P E

C L E A N S I N G
R E P O R T I N G
S O L I D K P I
F O U N D AT I O N S
C U S T O M E R
C E N T R I C I T Y
17
O U R H A T - T R I C K F O R E F F E C T I V E R E P O R T I N G
• Build reporting
inventory
• Target info needs
• Standardize
• Four major
dimensions to be
considered within KPI
selection process
• Regularly ask report
users for feedback
18
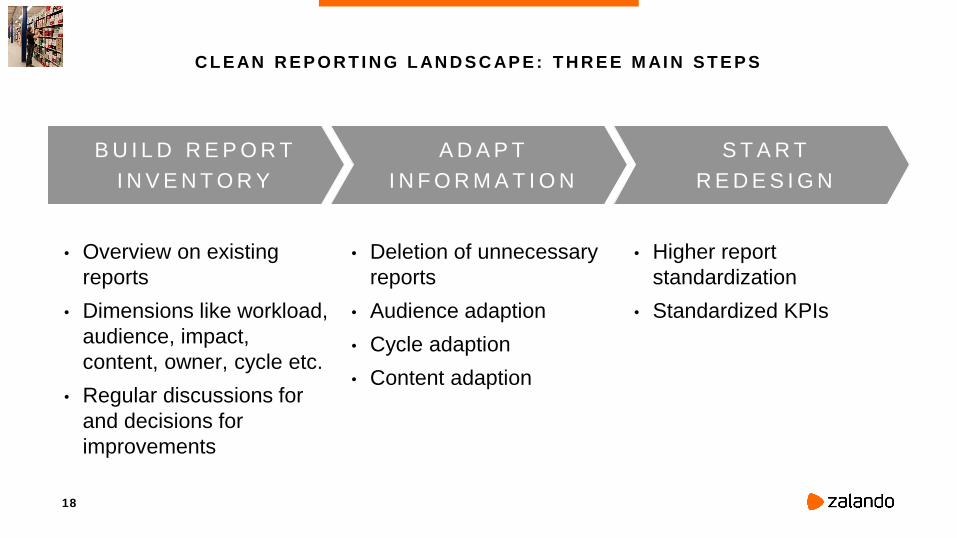
C L E AN R E P O R T I N G L AN D S C AP E : T H R E E M AI N S T E P S
B U I L D R E P O R T
I N V E N T O R Y
A D A P T
I N F O R M A T I O N
S T A R T
R E D E S I G N
• Overview on existing
reports
• Dimensions like workload,
audience, impact,
content, owner, cycle etc.
• Regular discussions for
and decisions for
improvements
• Deletion of unnecessary
reports
• Audience adaption
• Cycle adaption
• Content adaption
• Higher report
standardization
• Standardized KPIs

19
K P I F O U N D A T I O N S : F O U R P I E C E S O F A V A L U E - A D D I N G K P I
19
R E S P O N S I B I L I T Y
A C T I O N A B I L I T Y S T R A T E G Y O R I E N T A T I O N
M E A S U R A B I L I T Y

N E V E R S T O P AS K I N G U S E R S F O R F E E D B AC K :
B AS I S O F I M P R O V E M E N T S AN D P I P E L I N E M AN AG E M E N T
85%
2%
13%
Yes OthersNo
22
"Would you like to have additional
training or documentation on the
Management report?"
ILLUSTRATION

-51%
Reduce # of
pages
Lower
frequency
S E N T P A G E S P E R M O N T H
Lower
frequency
Merge
reports
Delete
reports
-32%
Unsub-
scribe
# R E P O R T S T O R E C I P I E N T S P E R M O N T H
-52%
Reduce # of
pages
Unsub-
scribe
Lower
frequency
Delete
reports
S E N T D A T A V O L U M E P E R M O N T H
-16%
Improve creation
process
M A N - H O U R S P E R M O N T H
M E A S U R E I M P L E M E N T A T I O N L E A D T O D E S I R E D S U C C E S S
23

24
E F F I C I E N T
P R O C E S S E S A N D
S Y S T E M S

W O R K F L O W SD ATA
C O N S I S T E N C YA U T O M AT I O N
25
T H R E E C O R N E R S T O N E S F O R E F F I C I E N T R E P O R T I N G
• Dashboard
• Simultaneous review
(> 50 users)
• Formatting options
• Single source of truth
• Fast and easy access
• Self-service
• Lean admin

1. Write comment
(Editor)
2. Review comment
(Reviewer)
3. Final comment
(Reporting Team)
Reject Function
• Reporting package is a set of 60 individual reports with approx. 180 comments
• Always up-to-date – no versions circulated via Mail/Excel
• Self-organizing, flexible workflow
• Comment boxes with various editors and reviewers, status by comment (live)
• Push notification for writer and reviewer if rejected
W O R K F L O W S : E N A B L I N G T H E S O- W H A T I N R E P O R T I N G
26

27
I N S E AR C H O F T H E H O L Y G R AI L :
S Y S T E M S S U P P O R T I N G " S I N G L E S O U R C E O F T R U T H "
27
• Consistency
• Speed
• Flexibility
• Quality
• Transparency
• Mobile
• Less admin

28
F AS T C L O S E : S T E P C H AN G E AC H I E V E D
Book-to-report substantially improved
• Market requirements
• Speed
• Quality
• Changes easy to roll-out
Examples of Controlling contribution
• Efficient allocation processes
• Review of forecast procedures
28
M O N TH
E N D
M O N TH
E N D
F I N AL
C L O S E &
R E P O R I N G
F I N AL
C L O S E &
R E P O R I N G
PRESENT ~ 5 DAYS
PAST - (20 DAYS)
V AR I O U S
S YS TE M S ,
M AN U AL
AN D I TE R ATI V E
P R O C E S S E S
E F F I C I E N T
S YS TE M S ,
S TR U C TU R E S
AN D
P R O C E S S E S

29
C O N T I N U O U S
I M P R O V E M E N T S

K E E P P I L O T I N GT O O L T Ü V K P I W I K I
# N E V E R S T O P I M P R O V I N G
• Regular check of
existing tools –
comparable to
technical inspection
for cars
• KPI handbook –
financial & non-
financial
• Company-wide
standardized
• Continue to try out
new developments
• Think “minimum
viable product”
30

A U T O T Ü V T O O L T Ü V
• Structure of checklist builds on
analogy to cars
• As development continues, tools
become difficult to comprehend
• KPI definitions change
• Processes are not well documented
• Errors are not highlighted by the tool
Why is a (regular) servicing
of tools recommended?
T O O L T Ü V : R E G U L A R S E R V I C I N G J U S T L I K E C A R S
31

• Single source for KPI definitions
• Continuous updating rather than
constantly outdated
• Linking KPIs to reports and vice
versa
• Social: learn, share, comment, add,
…
K P I W I K I : K N O W L E D G E S H A R I N G P L A T F O R M
34

P I L O T S AN D P R O T O T Y P E S T O
G E N E R AT E L E AR N I N G S AN D AD V AN C E C O N T I N U O U S L Y
• Allow for local variation with
intention to adopt learnings centrally
• Think “minimum viable product”
• Find the right testing grounds
• There is no such thing as a perfect
solution
• Make change a constant
37

38
Q & A
This presentation and its contents are strictly confidential. It may not, in
whole or in part, be reproduced, redistributed, published or passed on to
any other person by the recipient.
The information in this presentation has not been independently verified. No
representation or warranty, express or implied, is made as to the accuracy
or completeness of the presentation and the information contained herein
and no reliance should be placed on such information. No responsibility is
accepted for any liability for any loss howsoever arising, directly or
indirectly, from this presentation or its contents.
D I S C L AI M E R
39