afghanistan - united nations office on drugs … opium survey 2004 3 executive summary opium poppy...
TRANSCRIPT
Opium Survey 2004
AFGHANISTAN
November 2004
Government of AfghanistanCounter Narcotics Directorate
Abbreviations
ICMP UNODC Illicit Crop Monitoring Programme UNODC United Nations Office on Drugs and Crime GPS Global Positioning System CND Afghanistan’s Counter Narcotics Directorate
Acknowledgements
The following individuals contributed to the implementation of the 2004 opium survey in Afghanistan, and to the preparation of the present report:
Afghan Transition Government, Counter Narcotics Directorate (CND)
. Mirwais Yasini
. Mohammed Nabi Hussaini
United Nations Office on Drugs and Crime
. Nazir Ahmad Ahmad Shah
. Mohammed Ibrahim Azhar
. Hakan Demirbüken
. Denis Destrebecq
. Fazal Mohammad Fazli
. Jamie Gairns
. Mohammad Alam Ghalib
. Mohammad Latif Ehsan
. Adbul Jalil Hussain Khel
. Ayako Kagawa
. Thibault le Pichon
. Thomas Pietschmann
. Shirish Ravan
. Barbara Remberg
. Patrick Seramy
. Johny Thomas
. Mohammad Aziz Yousufzai
. Ziauddin Zaki
. Mohammad Nadir Zirak
The implementation of the survey would not have been possible without the dedicated work of the field surveyors, who often faced difficult security conditions.
UNODC also wishes to acknowledge with thanks the contribution of John Taylor, Cranfield University, to the design of the 2004 sampling methodology for area assessment based on remote sensing data.
The implementation of UNODC Illicit Crop Monitoring Programme and the opium survey in Afghanistan in 2004 was made possible thanks to financial contributions from the Governments of the United Kingdom, Italy and Finland.
This report, and other ICMP survey reports can be downloaded from : www.unodc.org/unodc/en/crop_monitoring.html
AFGHANISTAN
OPIUM SURVEY 2004
November 2004

Preface
Afghan annals will record 2004 as contradictory. On the one hand, the political progress towards democracy culminated in the near plebiscite election of President Karzai – the country’s first-ever leader chosen by the people – whose courage and determination I salute. On the other hand, opium cultivation increased by two-thirds, reaching an unprecedented 131,000 hectares. Bad weather and disease lowered the opium yield per hectare resulting in output of 4,200 tons, an increase of only 17%, thus preventing a bumper harvest. Opium cultivation also spread to all 32 provinces -- making narcotics the main engine of economic growth and the strongest bond among previously quarrelsome populations. Valued at $2.8 billion, the opium economy is now equivalent to about 60% of Afghanistan’s 2003 GDP ($4.6 billion, if only licit activity is measured).
With the Afghan nation struggling to ensure a democratic election and coalition forces working to establish a secure situation on the ground, the narcotic question was not given the priority it should have. Yet the building blocks to tackle opium cultivation and production have been developed and important positive signs are emerging.
In the countryside, because of excess supply, opium prices are two-thirds (67%) lower than last year: the incentive for farmers to plant the next opium crop should now be lower. At the borders, stable heroin prices are the likely result of law enforcement, which has made it more difficult for traffickers to refine and smuggle drugs across the country.
The drug problem in Afghanistan has been allowed to become ever more serious. If it persists, the political and military successes of the last three years will be lost.
More specifically, (i) since in Afghanistan opium is still more profitable than legitimate crops, more robust forms of persuasion to farmers must come into play. Similarly, (ii) since disrupting the trafficking chains from the farm-gate to the borders of Afghanistan seems to have an effect, the driving force of the market must be inhibited even more drastically. And (iii) since world demand for opium and its derivatives has remained strong (87% of it is supplied by Afghanistan, resulting in thousands of deaths). while shifting east from the traditional west European markets, more determined preventive measures are badly needed.
Afghanistan’s 10-year counter-narcotic strategy – based on improved living conditions for farmers, determined law enforcement against traffickers, and strong demand reduction in consuming countries – remains valid.
The new Afghan government is now democratically empowered, and accountable, to stipulate binding agreements, benchmarked to measure progress, with the international community.
Among the measurable Afghan goals to be attained in the course of the next 12 months, are:
A centrally-conducted eradication cum persuasion campaign, to cover a convincing proportion of the 2004 opium poppy cultivation;

Prosecution of serious cases of trafficking and drug dealing, with immediate confiscation of illicit proceeds;
Tangible action against recognizable corrupted officials, who are both cause and consequence of the spreading opium economy;
A significantly reinforced counter-narcotic structure, acting as the sole focal point in all illicit drug matters.
The foreign flags in Afghanistan are not only a symbol of a coalition fighting insurgency: above all, they are the tangible evidence of international commitment to stability, peace and development. With growing amounts of narco-money available to fund terrorism in Afghanistan and along well-known trails across neighbouring countries, the international community must commit to commensurate initiatives to support the Afghan government’s counter-narcotic drive, with:
Convincing measures to alleviate under-development in the country-side, especially supporting livelihood alternatives to opium cultivation;
Further law enforcement measures, including military operations against labs, traffickers’ convoys and illegal activity;
Support to anti-corruption measures, especially in the army, the police, the provincial administrations and the judiciary;
Enhanced judicial assistance, from investigation to administration of justice, prosecution and detention.
Dismantling the opium economy in Afghanistan with the instruments of democracy, the rule of law and development will be a complex process. The recent electoral accomplishments, in a climate of peace, are a fundamental premise. Counter-narcotics must now take the centre place in policy, front-loading the measures envisaged in the 10-year strategy.
Antonio Maria Costa Executive Director
United Nations Office on Drugs and Crime


Afghanistan Opium Survey 2004
1
FACT SHEET - AFGHANISTAN OPIUM SURVEY 2004
2004Variation
on 2003 2003
Net opium poppy cultivation 131,000 ha + 64% 80,000 ha
in percent of actual agricultural land 2.9% 1.6%
number of provinces affected1 32 (all) 28
Average opium yield 32 kg/ha 45 kg/ha
Production of opium 4,200 mt +17% 3,600 mt
in percent of world illicit opium production 87%2 76%
Number of households involved in opium cultivation
356,000 + 35% 264,000
Number of persons involved in opium cultivation 2.3 million 1.7 million
in percent of total population (23 million) 10% 7%
Average farm-gate price of fresh opium at harvest time
US$ 92/kg - 67% US$ 283
Average farm-gate price of dry opium at harvest time
US$ 142/kg - 69% US$ 425
Total export value of opium to neighbouring countries
US$ 2.8 billion + 22% US$ 2.3 billion
in percent of 2003 GDP (US$ 4.6 billion) ~60% 50%
gross trafficking profits of Afghan traffickers US$ 2.2 billion +69% US$ 1.3 billion
total farm-gate value of opium production: US$ 0.6 billion - 41% US$ 1.02 billion
Household average yearly gross income from opium of opium growing families
US$ 1,700 - 56% US$ 3,900
Per capita gross income from opium of opium growing families
US$ 260 - 56% US$ 600
Afghanistan’s GDP per capita n.a. n.a. US$ 207
Indicative gross income from opium per ha US$ 4,600 - 64% US$ 12,700
Gross income from wheat per ha US$ 390 - 17% US$ 470
1
In 2004, the Afghan Government reorganized the country’s administrative division into 34 provinces. However, the 2004 opium survey was designed, and its results are presented, according to the previous administrative division into 32 provinces.2
Preliminary estimate

Afghanistan Opium Survey 2004
3
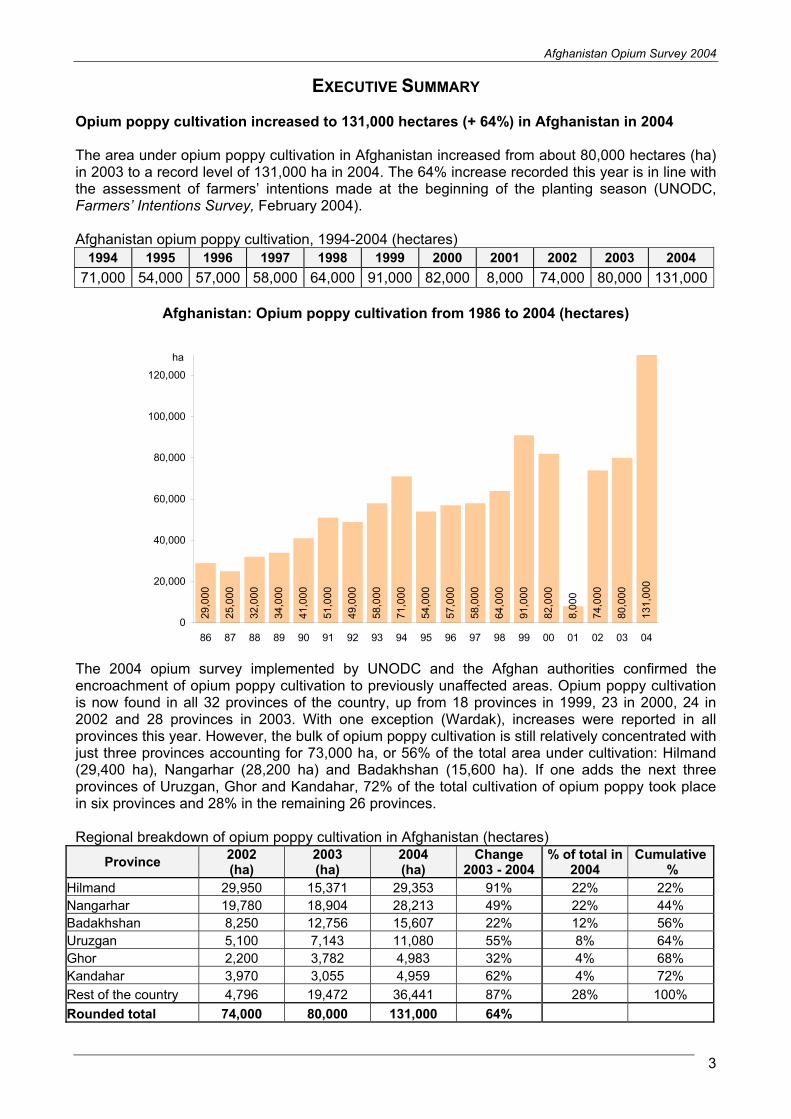
EXECUTIVE SUMMARY
Opium poppy cultivation increased to 131,000 hectares (+ 64%) in Afghanistan in 2004
The area under opium poppy cultivation in Afghanistan increased from about 80,000 hectares (ha) in 2003 to a record level of 131,000 ha in 2004. The 64% increase recorded this year is in line with the assessment of farmers’ intentions made at the beginning of the planting season (UNODC, Farmers’ Intentions Survey, February 2004).
Afghanistan opium poppy cultivation, 1994-2004 (hectares)
1994 1995 1996 1997 1998 1999 2000 2001 2002 2003 2004
71,000 54,000 57,000 58,000 64,000 91,000 82,000 8,000 74,000 80,000 131,000
Afghanistan: Opium poppy cultivation from 1986 to 2004 (hectares)
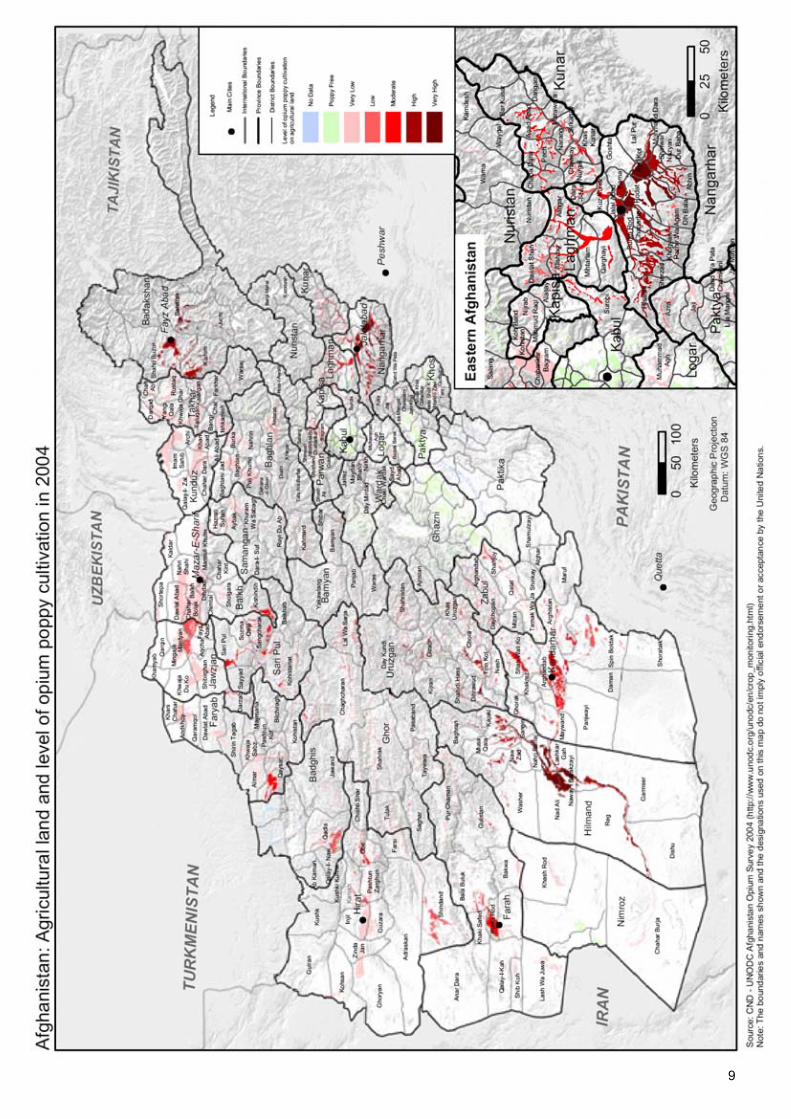
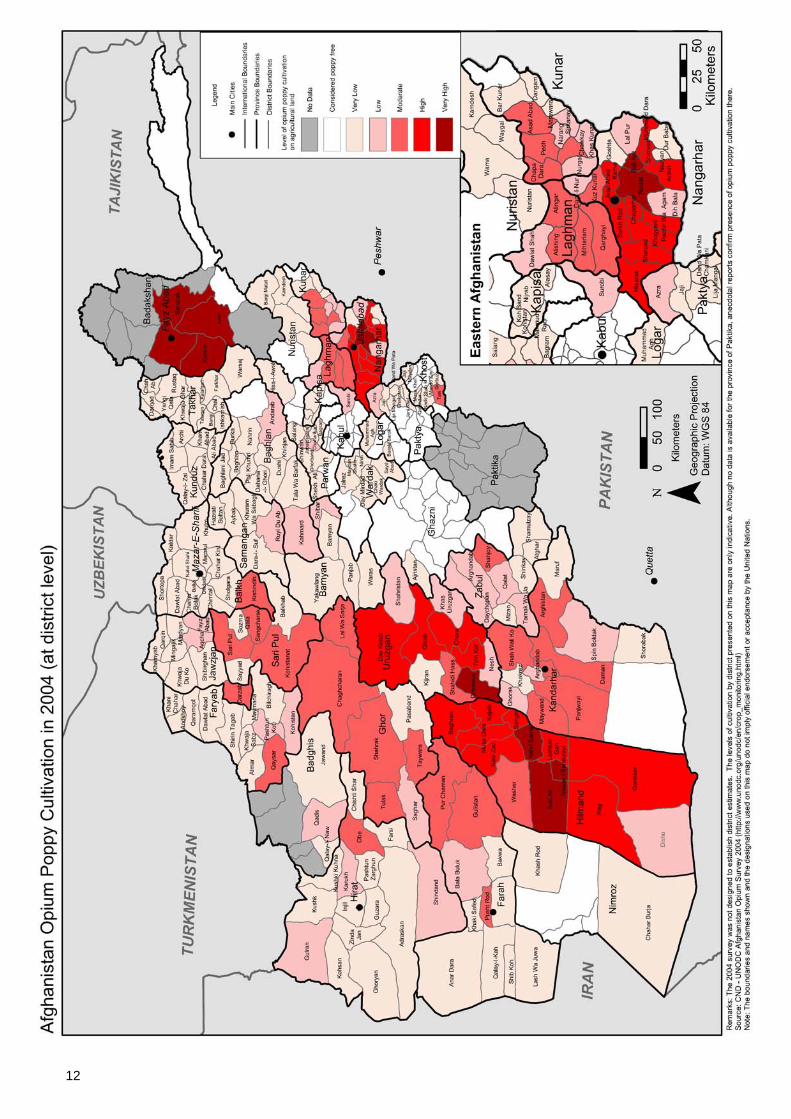
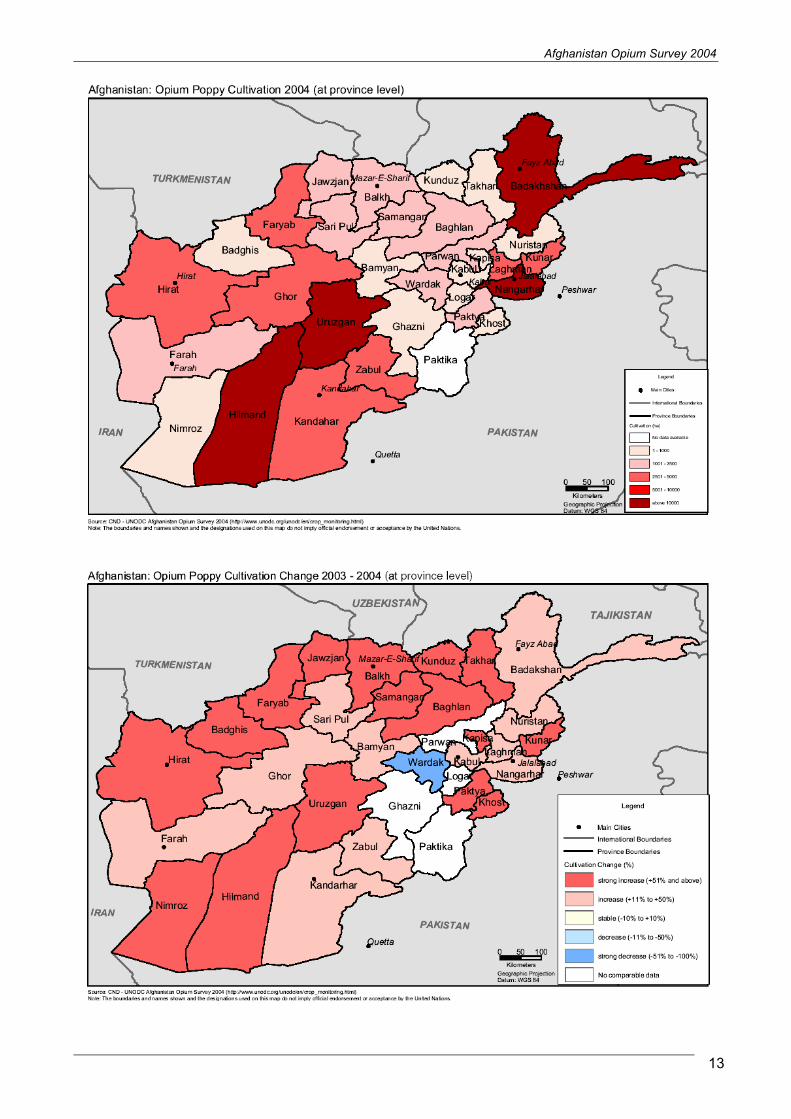
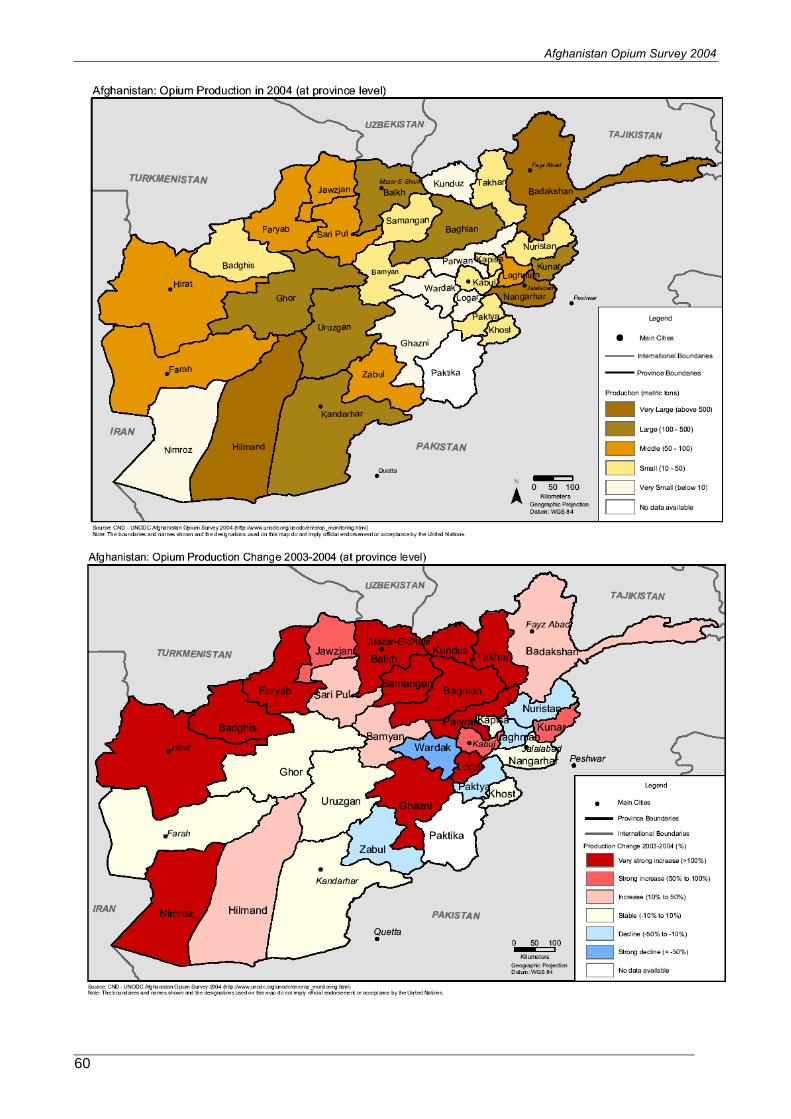
The 2004 opium survey implemented by UNODC and the Afghan authorities confirmed the encroachment of opium poppy cultivation to previously unaffected areas. Opium poppy cultivation is now found in all 32 provinces of the country, up from 18 provinces in 1999, 23 in 2000, 24 in 2002 and 28 provinces in 2003. With one exception (Wardak), increases were reported in all provinces this year. However, the bulk of opium poppy cultivation is still relatively concentrated with just three provinces accounting for 73,000 ha, or 56% of the total area under cultivation: Hilmand (29,400 ha), Nangarhar (28,200 ha) and Badakhshan (15,600 ha). If one adds the next three provinces of Uruzgan, Ghor and Kandahar, 72% of the total cultivation of opium poppy took place in six provinces and 28% in the remaining 26 provinces.
Regional breakdown of opium poppy cultivation in Afghanistan (hectares)
Province 2002(ha)
2003(ha)
2004(ha)
Change 2003 - 2004
% of total in 2004
Cumulative %
Hilmand 29,950 15,371 29,353 91% 22% 22%
Nangarhar 19,780 18,904 28,213 49% 22% 44%
Badakhshan 8,250 12,756 15,607 22% 12% 56%
Uruzgan 5,100 7,143 11,080 55% 8% 64%
Ghor 2,200 3,782 4,983 32% 4% 68%
Kandahar 3,970 3,055 4,959 62% 4% 72%
Rest of the country 4,796 19,472 36,441 87% 28% 100%
Rounded total 74,000 80,000 131,000 64%
1
29
,00
0
25
,00
0
32
,00
0
34
,00
0
41
,00
0
51
,00
0
49
,00
0
58
,00
0
71
,00
0
54
,00
0
57
,00
0
58
,00
0
64
,00
0
91
,00
0
74
,00
0
80
,00
0
13
1,0
00
82
,00
0
8,0
00
0
20,000
40,000
60,000
80,000
100,000
120,000
86 87 88 89 90 91 92 93 94 95 96 97 98 99 00 01 02 03 04
ha

Afghanistan Opium Survey 2004
4
Ninety-two percent of opium poppy cultivation took place on fertile irrigated land. The expansion of opium poppy cultivation came at the expense of cereal cultivation, notably of wheat, which declined significantly in 2004. Opium poppy cultivation continues, nevertheless, to cover a relatively modest share of the national agricultural land (3% in 2004, up from 1.6% in 2003). By comparison, wheat covered 39% of all agricultural land in 2004. Opium poppy’s share can, however, reach much higher levels in some of the provinces such as 29% in Nangarhar, 28% in Badakhshan and 24% in Kunar.
Potential opium production estimated at 4,200 metric tons (+ 17%)
Potential opium production was estimated at around 4,200 metric tons (mt), representing an increase of about 17% compared to 2003. Unlike for the area under cultivation, this year did not set a record for production which remained lower than the 1999 peak of 4,600 mt.
Afghanistan potential opium production, 1994-2003 (in metric tons)
1994 1995 1996 1997 1998 1999 2000 2001 2002 2003 2004
3,400 2,300 2,200 2,800 2,700 4,600 3,300 185 3,400 3,600 4,200
The discrepancy between cultivation and production trends is explained by the relatively low opium yield per hectare in 2004 as compared with previous years. This phenomenon is attributed to unfavourable weather conditions (insufficient rain and cold temperatures) and higher incidence of other plant stresses affecting opium gum production, such as disease and parasites. Particularly strong declines in yields were reported from eastern, central and southern Afghanistan. In north-eastern Afghanistan, however, yields appeared to have remained stable. Estimating the opium production is always difficult and figures reported only represent a potential maximum. Even though the survey introduced another - and it is hoped better - method for estimating the yield this year, opium production estimates are still much less robust than cultivation estimates and should continue to be interpreted with caution.
Afghanistan’s production increase was partly offset by declines in Myanmar and Laos, resulting in a modest increase at the global level. Afghanistan’s market share therefore increased further and is forecast to represent about 87% of the world’s illicit production of opium in 2004, up from 76% in 2003.
Afghanistan: Opium production from 1980 to 2004 (metric tons)
200
225
275
488
160
450
350
875
1,1
20
1,2
00
1,6
00
2,0
00
2,0
00
2,3
00
3,4
00
2,3
00
2,2
00
2,8
00
2,7
00
4,6
00
3,3
00
200
3,4
00
3,6
00
4,2
00
0
1,000
2,000
3,000
4,000
5,000
80 81 82 83 84 85 86 87 88 89 90 91 92 93 94 95 96 97 98 99 00 01 02 03 04
metr
ic t
ons
'Soviet' period 'Warlord' period 'Taliban' period 'Transitional
Govt'
Afghanistan Opium Survey 2004
5
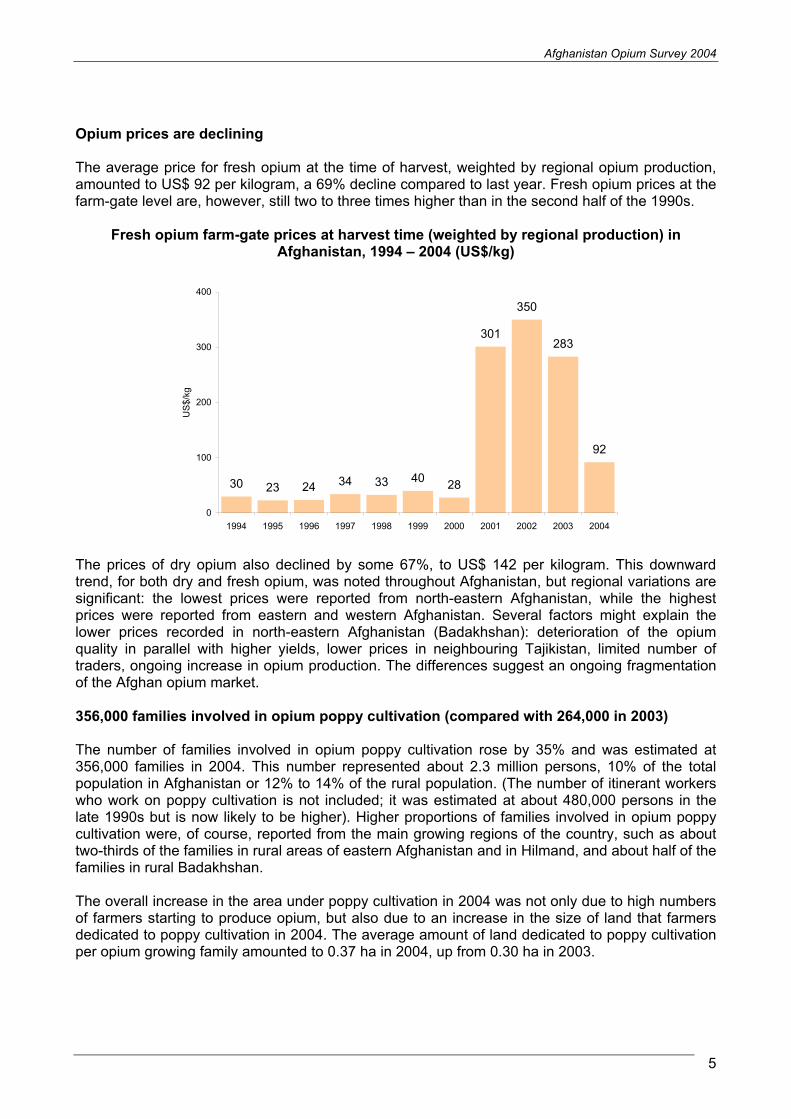
Opium prices are declining
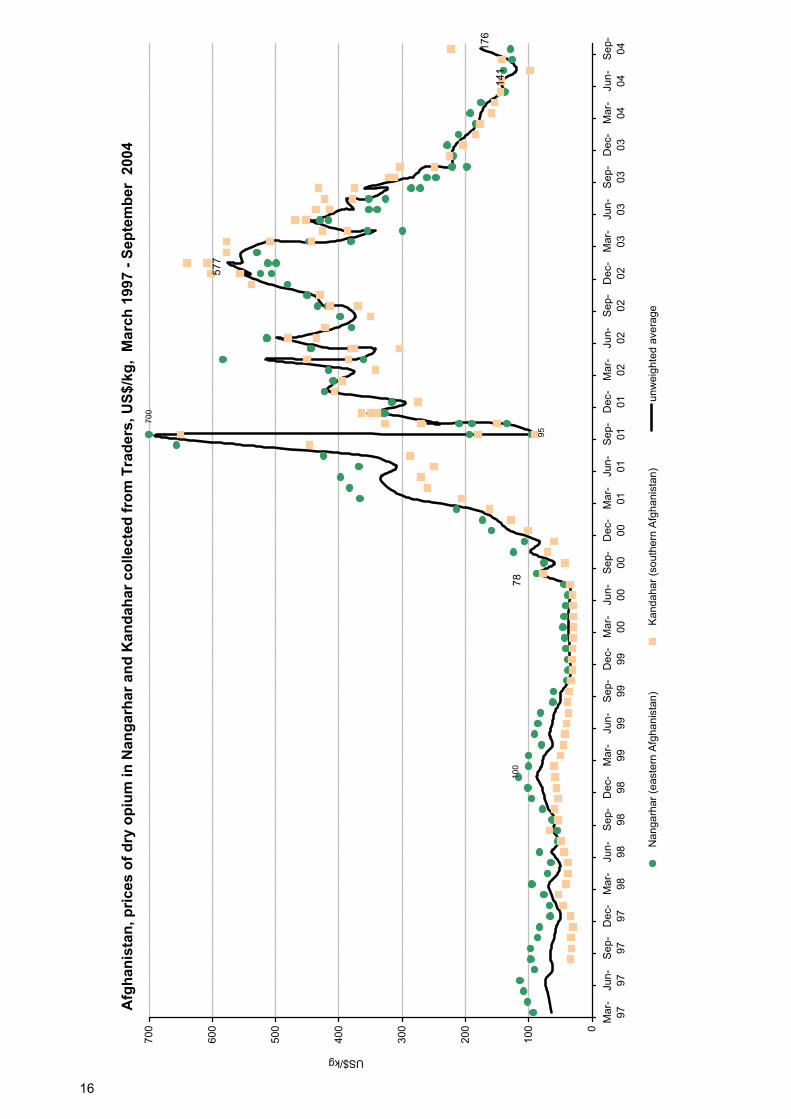
The average price for fresh opium at the time of harvest, weighted by regional opium production, amounted to US$ 92 per kilogram, a 69% decline compared to last year. Fresh opium prices at the farm-gate level are, however, still two to three times higher than in the second half of the 1990s.
Fresh opium farm-gate prices at harvest time (weighted by regional production) in Afghanistan, 1994 – 2004 (US$/kg)
The prices of dry opium also declined by some 67%, to US$ 142 per kilogram. This downward trend, for both dry and fresh opium, was noted throughout Afghanistan, but regional variations are significant: the lowest prices were reported from north-eastern Afghanistan, while the highest prices were reported from eastern and western Afghanistan. Several factors might explain the lower prices recorded in north-eastern Afghanistan (Badakhshan): deterioration of the opium quality in parallel with higher yields, lower prices in neighbouring Tajikistan, limited number of traders, ongoing increase in opium production. The differences suggest an ongoing fragmentation of the Afghan opium market.
356,000 families involved in opium poppy cultivation (compared with 264,000 in 2003)
The number of families involved in opium poppy cultivation rose by 35% and was estimated at 356,000 families in 2004. This number represented about 2.3 million persons, 10% of the total population in Afghanistan or 12% to 14% of the rural population. (The number of itinerant workers who work on poppy cultivation is not included; it was estimated at about 480,000 persons in the late 1990s but is now likely to be higher). Higher proportions of families involved in opium poppy cultivation were, of course, reported from the main growing regions of the country, such as about two-thirds of the families in rural areas of eastern Afghanistan and in Hilmand, and about half of the families in rural Badakhshan.
The overall increase in the area under poppy cultivation in 2004 was not only due to high numbers of farmers starting to produce opium, but also due to an increase in the size of land that farmers dedicated to poppy cultivation in 2004. The average amount of land dedicated to poppy cultivation per opium growing family amounted to 0.37 ha in 2004, up from 0.30 ha in 2003.
30 23 24 34 33 4028
301
350
283
92
0
100
200
300
400
1994 1995 1996 1997 1998 1999 2000 2001 2002 2003 2004
US
$/k
g

Afghanistan Opium Survey 2004
6
Estimated farmers’ per capita gross income from opium down 64%, but still 12 times higher than gross income from wheat
The yearly gross income of opium growing families was estimated at around US$1,700 in 2004. The gross income from poppy cultivation per hectare amounted to US$4,600, a decline by 64% from a year earlier, but still almost 12 times higher than the gross income a farmer could expect from one hectare of wheat (US$390). Net income could not be estimated, but costs for opium poppy cultivation are thought to be relatively high, including labour, fertilizer, seed, fuel, depreciation of agricultural equipment, as well as taxes to local commanders and various bribes.
Total farm-gate value of opium decreased 41% to US$ 600 million
Based on opium production estimates and reported opium prices the farm-gate value of the opium harvest can be estimated at around US$ 600 million. This farm-gate value is equivalent to 13% of GDP (down from 22% in 2003) or three times the size of the Government’s total domestic revenues (US$ 208 million in 2003/04). Due to the falling opium prices, the overall farm-gate value of opium production was some 41% lower than in 2003 and 50% lower than in 2002. Incentives for farmers to plant opium poppy next season should thus be lower than this year. Nonetheless, the income from opium production was still three times higher than in 1999 and six times higher than in 2000, and opium remains more profitable than licit crops.
While the value of opiates exports to neighbouring countries increased slightly to around US$2.8 billion
The value of the 2004 opium production, exported by Afghan traffickers to neighbouring countries in the form of opium, morphine and heroin, was estimated at US$2.8 billion, slightly more than in 2002 (US$2.5 billion) and 2003 (US$2.3 billion). While opium income for farmers declined heavily in 2004 as a result of falling farm-gate prices, corresponding price falls were not observed in the border regions with neighbouring countries - possibly a result of more effective law enforcement efforts within Afghanistan (dismantling clandestine heroin laboratories) and in neighbouring countries, making it more difficult for traffickers to smuggle drugs across borders. Reflecting a rising risk premium, it is estimated that gross trafficking profits of Afghan traffickers could increase from around US$1.3 billion in 2003 to about US$2.2 billion in 2004. Traffickers would thus take advantage of stable prices in neighbouring countries and larger quantities of opium available from farmers at lower prices. The value of opiates exports to neighbouring countries in 2004 would be equivalent to around 60% of the 2003 licit GDP of Afghanistan.
Such a large source of illegal income poses a considerable threat to national security and jeopardizes efforts to stabilize and develop the country. The preceding estimates, however, must be taken with considerable caution and should be considered as indicative at best. Information and data on what is happening along the trafficking chain is patchy and not readily available.
Eradication
The opium survey neither monitored the activities, nor assessed the results of the eradication campaign launched by the Afghan authorities during the opium growing season. However, as in previous years, the survey’s methodology was designed to capture what was left for harvest in the fields. Results presented in this report should therefore be interpreted as post-eradication and reflect the net amount of opium poppy harvested this year in Afghanistan. Government figures on the extent of eradication in 2004 were not available at the time of writing.
Methodology
The survey’s methodology was based on a sampling approach which combined the analysis of satellite images and extensive field visits. More than 110 high-resolution IKONOS satellite images were used, covering 10 provinces and a total of 130,000 ha of agricultural land, i.e. 16% of the total

Afghanistan Opium Survey 2004
7
agricultural land in these areas. To assist with the interpretation of the satellite images, copious ground data including crop types, GPS coordinates and photographs were collected from 178 areas, each of 250 x 250 meter.
In addition to the sample high resolution coverage, the whole of Nangarhar province – the largest opium producing province in 2003 and 2004 - was covered twice with 10 meter resolution SPOT5 multi-spectral images. The objective was to determine whether the loss in spatial resolution could be compensated by the lower cost of the 10 meter resolution images that enabled a full coverage of the province. In addition, the census survey with SPOT5 images enabled to obtain results at the district level. The overall results of the two surveys (SPOT5 and IKONOS) proved to be very similar.
At the same time, a sample of 2,469 villages were surveyed (out of a total of 30,706 villages) by 60 surveyors to collect opium yield and socio-economic data. Over 5,000 capsules from 138 fields were measured and 6,598 farmers were interviewed. In the area not covered by satellite images, the surveyors also collected data on the extent of opium poppy cultivation. Opium poppy cultivation estimated through the village survey in 21 provinces accounted for 19% of the total area under opium poppy cultivation.
The survey was completed on schedule despite widespread security problems for the surveyors. Such problems ranged from respondents refusing to answer questions, to regional instability and even physical violence and theft.

9

Afghanistan Opium Survey 2004
10

Afghanistan Opium Survey 2004
11
12
Afghanistan Opium Survey 2004
13

14

Afghanistan Opium Survey 2004
15
70
0
10
0
95
57
7
78
14
1
17
6
0
10
0
20
0
30
0
40
0
50
0
60
0
70
0
Ma
r-
97
Ju
n-
97
Se
p-
97
De
c-
97
Ma
r-
98
Ju
n-
98
Se
p-
98
De
c-
98
Ma
r-
99
Ju
n-
99
Se
p-
99
De
c-
99
Ma
r-
00
Ju
n-
00
Se
p-
00
De
c-
00
Ma
r-
01
Ju
n-
01
Se
p-
01
De
c-
01
Ma
r-
02
Ju
n-
02
Se
p-
02
De
c-
02
Ma
r-
03
Ju
n-
03
Se
p-
03
De
c-
03
Ma
r-
04
Ju
n-
04
Se
p-
04
US$/kg
Na
ng
arh
ar
(ea
ste
rn A
fgh
an
ista
n)
Ka
nd
ah
ar
(so
uth
ern
Afg
ha
nis
tan
)u
nw
eig
hte
d a
ve
rag
e
Afg
ha
nis
tan
, p
ric
es
of
dry
op
ium
in
Na
ng
arh
ar
an
d K
an
da
ha
r c
oll
ec
ted
fro
m T
rad
ers
, U
S$
/kg
, M
arc
h 1
99
7 -
Se
pte
mb
er
20
04
16
Afghanistan Opium Survey 2004
17
TABLE OF CONTENT
1 INTRODUCTION ..................................................................................................................... 19
2 FINDINGS................................................................................................................................ 21
2.1 OPIUM POPPY CULTIVATION ESTIMATES ............................................................................. 212.2 POTENTIAL OPIUM PRODUCTION......................................................................................... 572.3 OPIUM FARMERS................................................................................................................ 622.4 OPIUM PRICES ................................................................................................................... 652.5 POTENTIAL VALUE AND INCOME TO FARMERS..................................................................... 712.6 POTENTIAL VALUE AND INCOME TO THE AFGHAN ECONOMY ................................................ 752.7 ERADICATION ..................................................................................................................... 772.8 FIELD SECURITY................................................................................................................. 78
3 METHODOLOGY .................................................................................................................... 80
3.1 OPIUM POPPY CULTIVATION ESTIMATION ............................................................................ 803.2 OPIUM YIELD AND PRODUCTION ESTIMATES........................................................................ 983.3 OPIUM PRICE ESTIMATION ................................................................................................ 1013.4 OPIUM GROWING FAMILIES............................................................................................... 1013.5 VALUE OF OPIUM PRODUCTION AT FARMGATE LEVEL......................................................... 1023.6 VALUE OF AFGHAN OPIUM IN NEIGHBOURING COUNTRIES IN BORDER REGIONS. ................ 102
4 ANNEX .................................................................................................................................. 111


Afghanistan Opium Survey 2004
19
1 INTRODUCTION
During the 1990s, Afghanistan firmly established itself as the largest source of illicit opium and its derivative, heroin, in the world. By the end of the 1990s, Afghanistan provided about 70 % of global illicit opium production, well ahead of Myanmar (about 22 %) and Lao PDR (about 3%). Primarily supplying countries in South West Asia, Central Asia, East and West Europe, as well as in South Asia, the Arabian peninsula and Africa, illicit opiates of Afghan origin were consumed by an estimated 9 to 10 million abusers, which is two-thirds of all opiate abusers in the world. More than 10,000 of them die every year from opiates produced in Afghanistan. It can be estimated that, all along the trafficking chain, more than half a million people have been involved in the trade of illicit Afghan opiates in recent years.
In 2001, following the ban imposed by the former Taliban regime, an abrupt decline of illicit opium poppy cultivation interrupted the two-decade increase, but, stimulated by a subsequent 10-fold increase in opium prices, cultivation resumed at a high level in 2002 and started to spread outside of the traditional areas. Although a new ban was issued in January 2002, the situation prevailing in Afghanistan has so far hindered the efforts of the new Afghan government to curb opium poppy cultivation in the country.
The Afghanistan opium survey is implemented annually by the United Nations Office on Drugs and Crime and, since 2003, the Afghan Government. It collects and analyses information on the location and extent of opium poppy cultivation, on the potential production of opium, as well as other socioeconomic dimensions of the problem. The results provide a detailed picture of the outcome of the current year’s opium season and, with previous years’ data, enable the identification of mid- and long-term trends in the evolution of the illicit drug problem in that country. This information is essential for planning, implementing and monitoring the impact of the measures required for tackling a problem which, in a country that has become by far the largest source of illicit opium and heroin trafficked in the world, has clearly taken international dimensions.
The opium survey is implemented in the technical framework of UNODC’s Illicit Crop Monitoring Programme (ICMP). The objective of ICMP is to assist the international community in monitoring the extent and evolution of illicit crops in the context of the elimination objective adopted at the General Assembly Special Session on Drugs in June 1998. In the framework of ICMP, monitoring activities are presently supported by UNODC in the other five main countries affected by illicit opium poppy and coca bush cultivation (Myanmar and Lao PDR in Asia, and Colombia, Peru and Bolivia in Latin America) as well as, for the first time in 2003, in Morocco, where one of the main areas of illicit cannabis cultivation is located.
The 2004 opium survey in Afghanistan was implemented under the project AD/AFG/F98 “Monitoring of opium production in Afghanistan” and the project AD/GLO/C93 “Illicit Crop Monitoring Programme Support”, with financial contributions from the Governments of the United Kingdom, Finland, and Italy.

20

Afghanistan Opium Survey 2004
21
2 FINDINGS
2.1 OPIUM POPPY CULTIVATION
The estimated total area under opium poppy cultivation in Afghanistan increased significantly from 80,000 hectares in 2003 to 131,000 hectares in 2004 (range: 109,000 ha - 152,000 ha). The increase in 2004 (+64%) was substantially stronger than the increase in 2003 (+8%). The results for 2004 constituted a record for opium poppy cultivation in the country, and confirmed Afghanistan as the country with the world’s largest area under illicit opium poppy cultivation. The increase in Afghanistan more than offset the decline in Southeast Asia, resulting in an overall increase of global illicit opium poppy cultivation in 2004.
Figure 1. Opium poppy cultivation in Afghanistan from 1986 to 2004
1
29,0
00
25,0
00
32,0
00
34,0
00
41,0
00
51,0
00
49,0
00
58,0
00
71,0
00
54,0
00
57,0
00
58,0
00
64,0
00
91,0
00
74,0
00
80,0
00
131,0
00
82,0
00
8,0
00
0
20,000
40,000
60,000
80,000
100,000
120,000
86 87 88 89 90 91 92 93 94 95 96 97 98 99 00 01 02 03 04
ha
Sources: UNODC opium surveys for 1994-2004 and UNODC, Global Illicit Drug Trends 2001 for other years.
Figure 2. Global opium poppy cultivation, in thousands hectares, 1990-2004*
* For 2004, estimates for the “rest of the world” are still tentative
263
282
260
277 272
250 258
252 238
216 222
142
180 169
196
0
50
100
150
200
250
300
1990 1991 1992 1993 1994 1995 1996 1997 1998 1999 2000 2001 2002 2003 2004
,000
hec
tare
s
Afghanistan Myanmar Lao PDR Rest of the World

Afghanistan Opium Survey 2004
22
The 2004 annual survey confirmed the assessment of the UNODC Farmers’s intention survey conducted in October 2003, pointing out that area under opium poppy could increase significantly in Afghanistan in 2004.
The main reasons for the increase in 2004, as highlighted in UNODC’s Farmers’ Intention Survey, were related to the desire to reduce poverty (31%), the very high opium prices in 2003 (30%), the possibility to get access to credit (‘salaam’ arrangements) (18%) and the possibility to buy luxury items from the proceeds of the opium sale (7%). The main reasons for farmers not to plant opium poppy in 2004 were that its cultivation was against Islam (24%), that it was illegal (23%), fear of eradication (17%) and of fines and imprisonment (16%). The motivational factors, however, turned out to be stronger than the existing disincentives. The Farmers’ Intention Survey also revealed that the increase in poppy cultivation in 2004 was disproportionately strong among farmers who had larger land-holdings (more than 5 ha) as well as among farmers who, so-far, only cultivated limited amounts of opium poppy (less than 1 ha).3
Increases in poppy cultivation took place in 2004 in all regions and in almost all provinces. Only in Wardak province (Central Afghanistan), the area under poppy cultivation declined substantially (-63%). The decline in Wardak province was forecast by UNODC’s Farmers’ Intention Survey and re-confirmed by UNODC’s Rapid Assessment Study of March 2004.
Table 1: Regional distribution of opium poppy cultivation in 2003 and 2004
Region2003(ha)
2004(ha)
Change 2003-2004
in % of 2003 total
in % of 2004 total
Southern (Hilmand, Uruzgan, Kandahar, Zabul, Ghazni, Paktika)
28,110 48,431 72% 35% 37%
Eastern (Nangarhar, Kunar, Laghman, Nuristan, Kapisa)
23,810 36,621 54% 30% 28%
North-Eastern (Badakhshan, Takhar) 13,136 16,369 25% 16% 12%
Northern (Bamyan, Jawzjan, Sari Pul, Baghlan, Faryab, Balkh, Samangan, Badghis, Kunduz)
5,717 14,627 156% 7% 11%
Western (Ghor, Hirat, Farh, Nimroz) 5,642 9,917 76% 7% 7%
Central (Parwan, Paktya, Wardak, Khost, Kabul, Logar)
4,068 4,671 15% 5% 4%
Rounded total 80,000 131,000 64% 100% 100%
A map presenting the regional grouping used for the opium survey 2004, is presented in the annex.
3
UNODC, Government of Afghanistan (Counter Narcotics Directorate), Afghanistan Farmers’ Intentions Survey 2003/2004, February 2004.
Afghanistan Opium Survey 2004
23
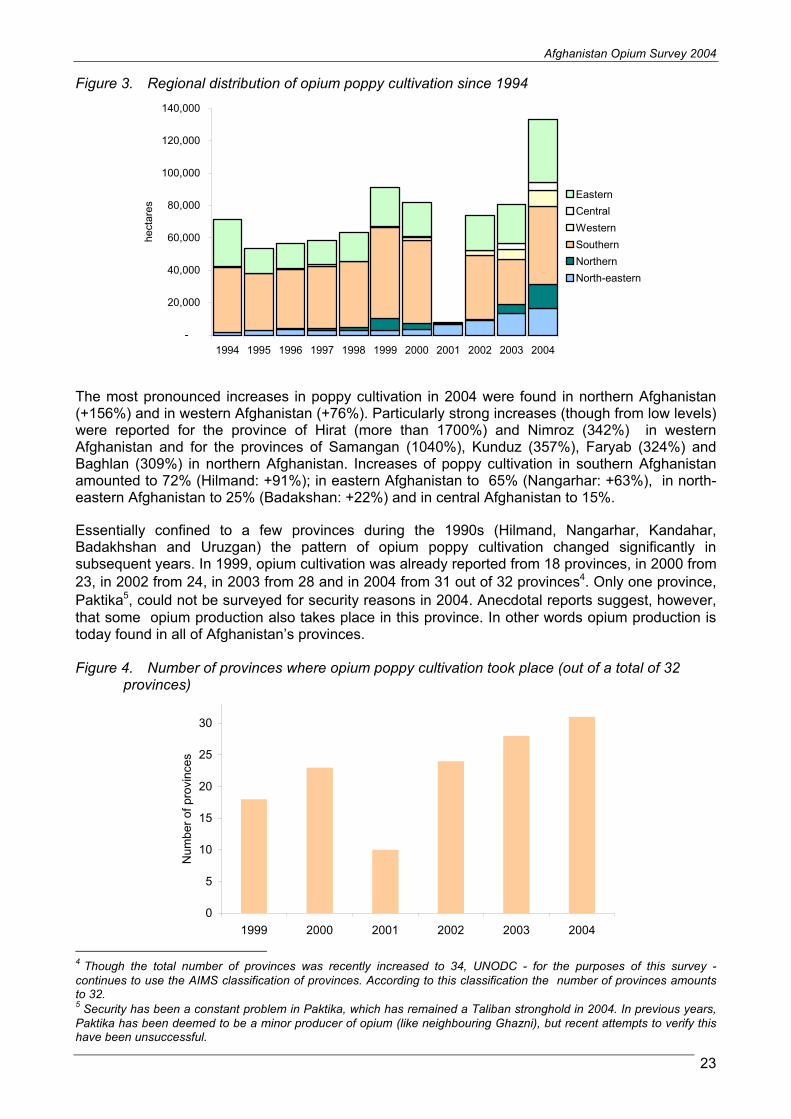
Figure 3. Regional distribution of opium poppy cultivation since 1994
-
20,000
40,000
60,000
80,000
100,000
120,000
140,000
1994 1995 1996 1997 1998 1999 2000 2001 2002 2003 2004
hecta
res
Eastern
Central
Western
Southern
Northern
North-eastern
The most pronounced increases in poppy cultivation in 2004 were found in northern Afghanistan (+156%) and in western Afghanistan (+76%). Particularly strong increases (though from low levels) were reported for the province of Hirat (more than 1700%) and Nimroz (342%) in western Afghanistan and for the provinces of Samangan (1040%), Kunduz (357%), Faryab (324%) and Baghlan (309%) in northern Afghanistan. Increases of poppy cultivation in southern Afghanistan amounted to 72% (Hilmand: +91%); in eastern Afghanistan to 65% (Nangarhar: +63%), in north-eastern Afghanistan to 25% (Badakshan: +22%) and in central Afghanistan to 15%.
Essentially confined to a few provinces during the 1990s (Hilmand, Nangarhar, Kandahar, Badakhshan and Uruzgan) the pattern of opium poppy cultivation changed significantly in subsequent years. In 1999, opium cultivation was already reported from 18 provinces, in 2000 from 23, in 2002 from 24, in 2003 from 28 and in 2004 from 31 out of 32 provinces4. Only one province,
Paktika5, could not be surveyed for security reasons in 2004. Anecdotal reports suggest, however, that some opium production also takes place in this province. In other words opium production is today found in all of Afghanistan’s provinces.
Figure 4. Number of provinces where opium poppy cultivation took place (out of a total of 32 provinces)
4 Though the total number of provinces was recently increased to 34, UNODC - for the purposes of this survey -
continues to use the AIMS classification of provinces. According to this classification the number of provinces amounts to 32.5 Security has been a constant problem in Paktika, which has remained a Taliban stronghold in 2004. In previous years,
Paktika has been deemed to be a minor producer of opium (like neighbouring Ghazni), but recent attempts to verify this have been unsuccessful.
0
5
10
15
20
25
30
1999 2000 2001 2002 2003 2004
Num
ber
of
pro
vin
ces
Afghanistan Opium Survey 2004
24
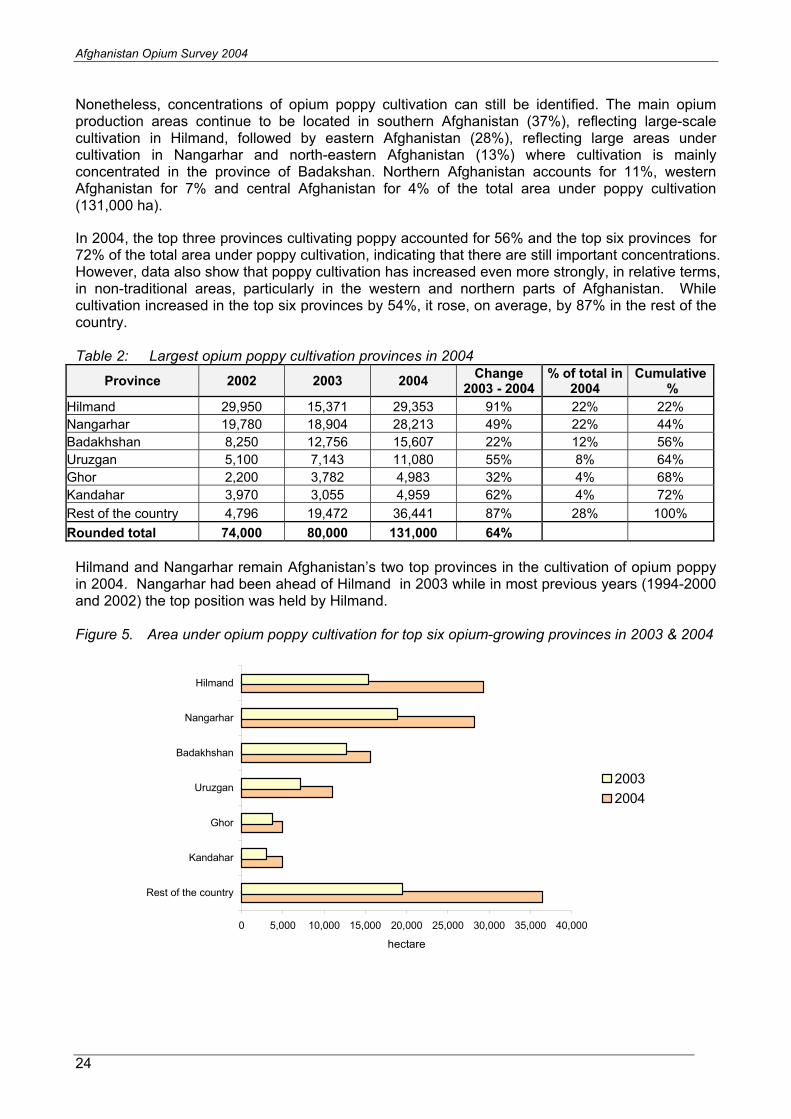
Nonetheless, concentrations of opium poppy cultivation can still be identified. The main opium production areas continue to be located in southern Afghanistan (37%), reflecting large-scale cultivation in Hilmand, followed by eastern Afghanistan (28%), reflecting large areas under cultivation in Nangarhar and north-eastern Afghanistan (13%) where cultivation is mainly concentrated in the province of Badakshan. Northern Afghanistan accounts for 11%, western Afghanistan for 7% and central Afghanistan for 4% of the total area under poppy cultivation (131,000 ha).
In 2004, the top three provinces cultivating poppy accounted for 56% and the top six provinces for 72% of the total area under poppy cultivation, indicating that there are still important concentrations. However, data also show that poppy cultivation has increased even more strongly, in relative terms, in non-traditional areas, particularly in the western and northern parts of Afghanistan. While cultivation increased in the top six provinces by 54%, it rose, on average, by 87% in the rest of the country.
Table 2: Largest opium poppy cultivation provinces in 2004
Province 2002 2003 2004Change
2003 - 2004% of total in
2004Cumulative
%
Hilmand 29,950 15,371 29,353 91% 22% 22%
Nangarhar 19,780 18,904 28,213 49% 22% 44%
Badakhshan 8,250 12,756 15,607 22% 12% 56%
Uruzgan 5,100 7,143 11,080 55% 8% 64%
Ghor 2,200 3,782 4,983 32% 4% 68%
Kandahar 3,970 3,055 4,959 62% 4% 72%
Rest of the country 4,796 19,472 36,441 87% 28% 100%
Rounded total 74,000 80,000 131,000 64%
Hilmand and Nangarhar remain Afghanistan’s two top provinces in the cultivation of opium poppy in 2004. Nangarhar had been ahead of Hilmand in 2003 while in most previous years (1994-2000 and 2002) the top position was held by Hilmand.
Figure 5. Area under opium poppy cultivation for top six opium-growing provinces in 2003 & 2004
0 5,000 10,000 15,000 20,000 25,000 30,000 35,000 40,000
Rest of the country
Kandahar
Ghor
Uruzgan
Badakhshan
Nangarhar
Hilmand
hectare
2003
2004
Afghanistan Opium Survey 2004
25
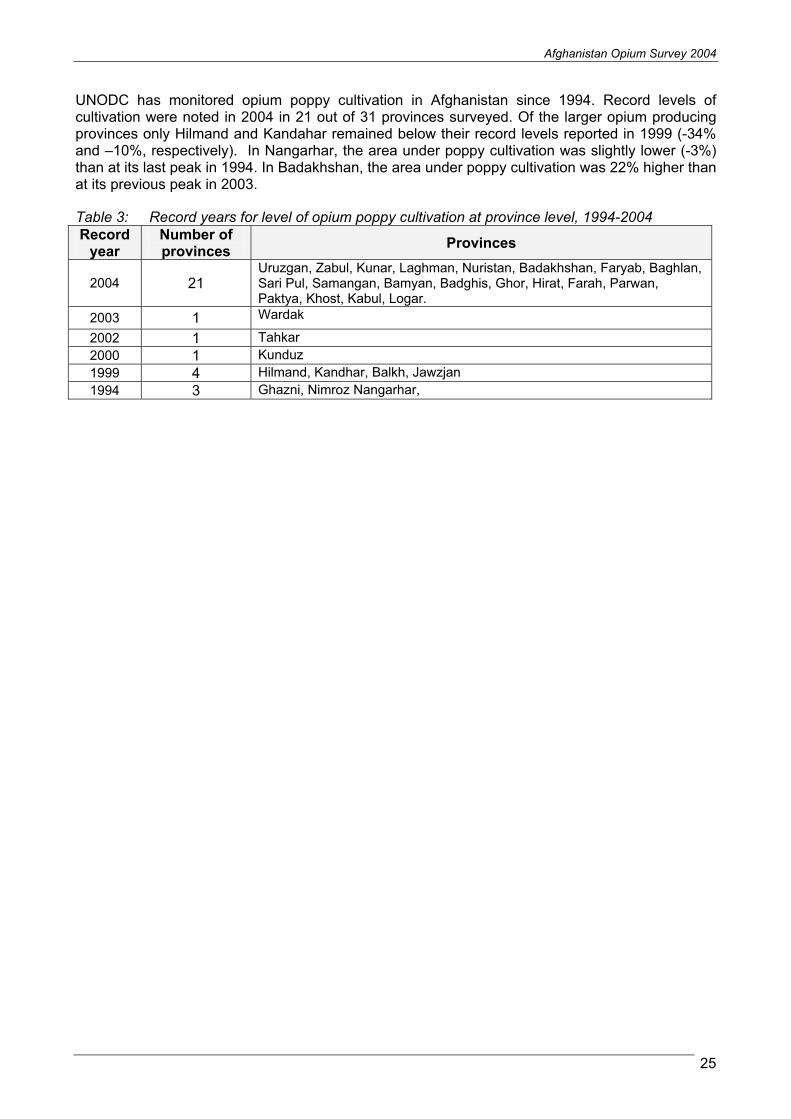
UNODC has monitored opium poppy cultivation in Afghanistan since 1994. Record levels of cultivation were noted in 2004 in 21 out of 31 provinces surveyed. Of the larger opium producing provinces only Hilmand and Kandahar remained below their record levels reported in 1999 (-34% and –10%, respectively). In Nangarhar, the area under poppy cultivation was slightly lower (-3%) than at its last peak in 1994. In Badakhshan, the area under poppy cultivation was 22% higher than at its previous peak in 2003.
Table 3: Record years for level of opium poppy cultivation at province level, 1994-2004 Record
year Number of provinces
Provinces
2004 21Uruzgan, Zabul, Kunar, Laghman, Nuristan, Badakhshan, Faryab, Baghlan, Sari Pul, Samangan, Bamyan, Badghis, Ghor, Hirat, Farah, Parwan, Paktya, Khost, Kabul, Logar.
2003 1 Wardak
2002 1 Tahkar
2000 1 Kunduz
1999 4 Hilmand, Kandhar, Balkh, Jawzjan
1994 3 Ghazni, Nimroz Nangarhar,
Afghanistan Opium Survey 2004
26

Afghanistan Opium Survey 2004
27

28

Afghanistan Opium Survey 2004
29
30
Afghanistan Opium Survey 2004
31
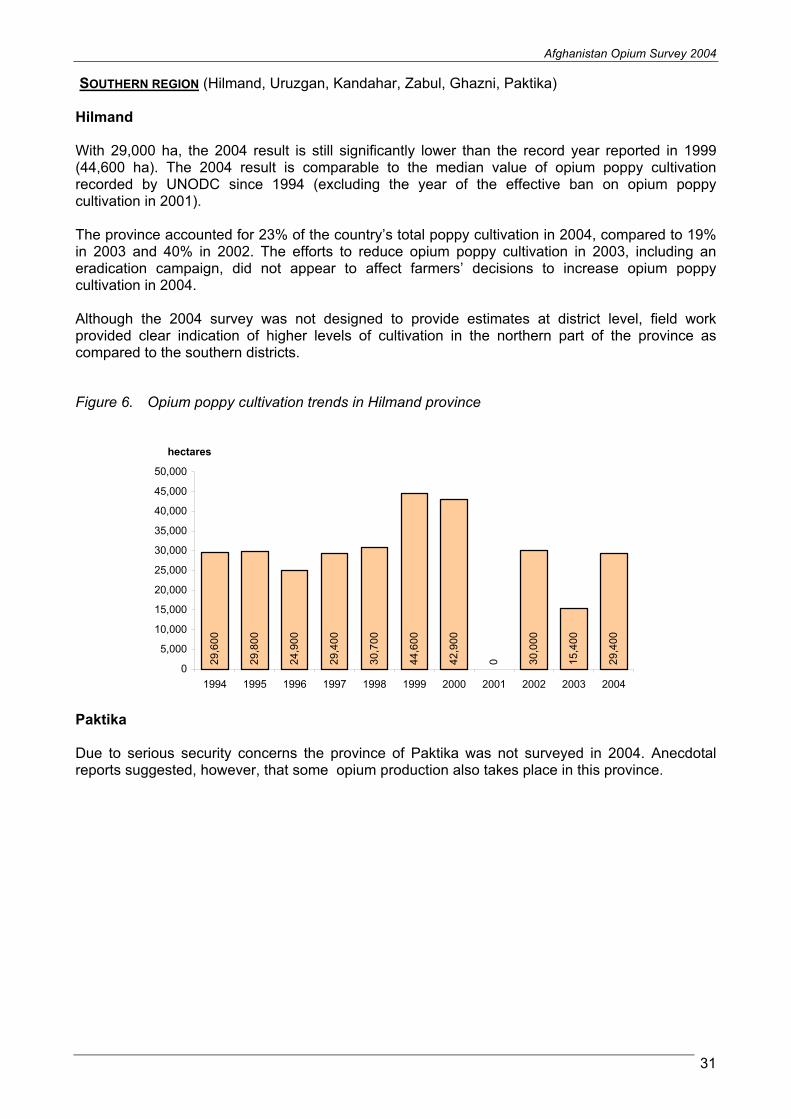
SOUTHERN REGION (Hilmand, Uruzgan, Kandahar, Zabul, Ghazni, Paktika)
Hilmand
With 29,000 ha, the 2004 result is still significantly lower than the record year reported in 1999 (44,600 ha). The 2004 result is comparable to the median value of opium poppy cultivation recorded by UNODC since 1994 (excluding the year of the effective ban on opium poppy cultivation in 2001).
The province accounted for 23% of the country’s total poppy cultivation in 2004, compared to 19% in 2003 and 40% in 2002. The efforts to reduce opium poppy cultivation in 2003, including an eradication campaign, did not appear to affect farmers’ decisions to increase opium poppy cultivation in 2004.
Although the 2004 survey was not designed to provide estimates at district level, field work provided clear indication of higher levels of cultivation in the northern part of the province as compared to the southern districts.
Figure 6. Opium poppy cultivation trends in Hilmand province
Paktika
Due to serious security concerns the province of Paktika was not surveyed in 2004. Anecdotal reports suggested, however, that some opium production also takes place in this province.
29
,60
0
29
,80
0
24
,90
0
29
,40
0
30
,70
0
44
,60
0
42
,90
0
0 30
,00
0
15
,40
0
29
,40
0
0
5,000
10,000
15,000
20,000
25,000
30,000
35,000
40,000
45,000
50,000
1994 1995 1996 1997 1998 1999 2000 2001 2002 2003 2004
hectares

32

33

Afghanistan Opium Survey 2004
34
EASTERN REGION (Nangarhar, Kunar, Laghman, Nuristan , Kapisa)
Nangarhar
Although not a record year (29,100 ha in 1994), 2004 showed a significant increase in cultivation in Nangarhar with 28,200 ha, compared with 18,900 ha in 2003.
Picture 1: Opium poppy cultivation in Bati Kot district, Nangarhar province (March 2004)
Figure 7. Opium poppy cultivation trends in Nangarhar province
In Nangarhar, the census survey from SPOT5 images gave comparable results to those obtained from the sample IKONOS survey, (30,500 ha and 28,200 ha, respectively) but, in addition, provided for a district breakdown of the estimates.
29
,10
0
15
,70
0
15
,60
0
14
,50
0
17
,80
0
23
,00
0
19
,70
0
20
0
19
,80
0
18
,90
0
28
,20
0
0
5,000
10,000
15,000
20,000
25,000
30,000
35,000
1994 1995 1996 1997 1998 1999 2000 2001 2002 2003 2004
hectares

Afghanistan Opium Survey 2004
35
Table 4: Opium poppy cultivation by district in Nangarhar province
District 2002 2003 2004*
% of provincial
cultivation in 2004
Cumulative%
Rodat 2,760 3,313 5,015 16% 16% Khogyani 2,640 2,986 3,254 11% 27% Bati Kot 2,390 1,994 2,574 8% 36% Kama 1,120 558 2,410 8% 43% Sherzad 1,470 1,641 2,110 7% 50% Chaparhar 990 1,169 1,729 6% 56% Shinwar 2,060 1,616 1,595 5% 61% Muhmand Dara 720 19 1,392 5% 66% Achin 940 2,131 1,350 4% 70% Kuz Kunar 500 102 1,175 4% 74% Jalal Abad 90 4 1,163 4% 78% Dih Bala 650 927 1,044 3% 81% Pachir Wa Agam 420 1,142 874 3% 84% Lal Pur 250 1 749 2% 87% Hisarak 620 1,016 631 2% 89% Dara-I-Nur 380 24 503 2% 90% Goshta 150 13 358 1% 92% Nazyan 150 98 240 1% 92% Dur Baba 40 31 159 1% 93% Surkh Rod 1,440 118 2,128 7% 100%
Rounded total 19,800 18,900 30,500
* based on the census survey from SPOT5 images
The census survey also enabled the mapping of the distribution of opium poppy fields in the province (see map on next page).
Half of the cultivation took place in just five districts (Rodat, Khogyani, Bati Kot, Kams and Sherzad). Between 2003 and 2004, opium poppy cultivation mainly increased in the northern part of the province, with an increase of 275% in the 9 northern districts compared to an increase of 24% in the 12 southern districts. The northern districts accounted for 35% of the cultivation in 2004, compared to just 15% in 2003.
Table 5: North/South distribution of opium poppy cultivation in Nangarhar province, 2003 - 2004
Districts 2003(ha)
% of 2003total
2004(ha)
% of 2004total
12 Southern districts (Rodat, Khogyani, Achin, Sherzad, Shinwar, Chaparhar, Pachir Wa Agam, Hisarak, Dih Bala, Surkh Rod, Dur Baba)
16,100 85% 19,900 65%
9 Northern districts (Bati Kot, Kama, Kuz Kunar, Nazyan, Dara-I-Nur, Muhmand Dara, Goshta, Lal Pur, Jalalabad)
2,800 15% 10,600 35%
Rounded Total 18,900 30,500

36
Afghanistan Opium Survey 2004
37
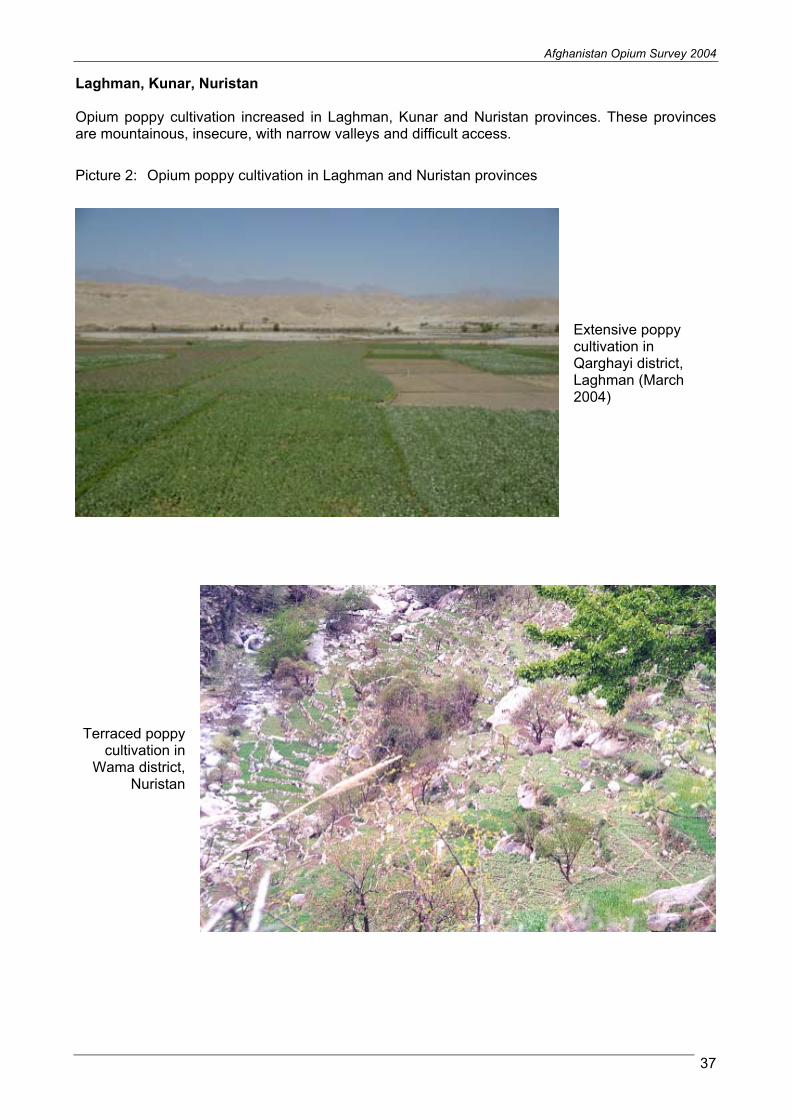
Laghman, Kunar, Nuristan
Opium poppy cultivation increased in Laghman, Kunar and Nuristan provinces. These provinces are mountainous, insecure, with narrow valleys and difficult access.
Picture 2: Opium poppy cultivation in Laghman and Nuristan provinces
Extensive poppy cultivation in Qarghayi district, Laghman (March 2004)
Terraced poppy cultivation in
Wama district, Nuristan
Afghanistan Opium Survey 2004
38
NORTH-EASTERN REGION (Badakhshan, Takhar)
The North-eastern zone has continued to show significant increases in cultivation levels in 2004. In Badakhshan, the districts of Wakhan, Shignan, and Derwaz were not included in the 2004 survey, as it was assumed these areas have, at most, marginal levels of opium poppy cultivation.
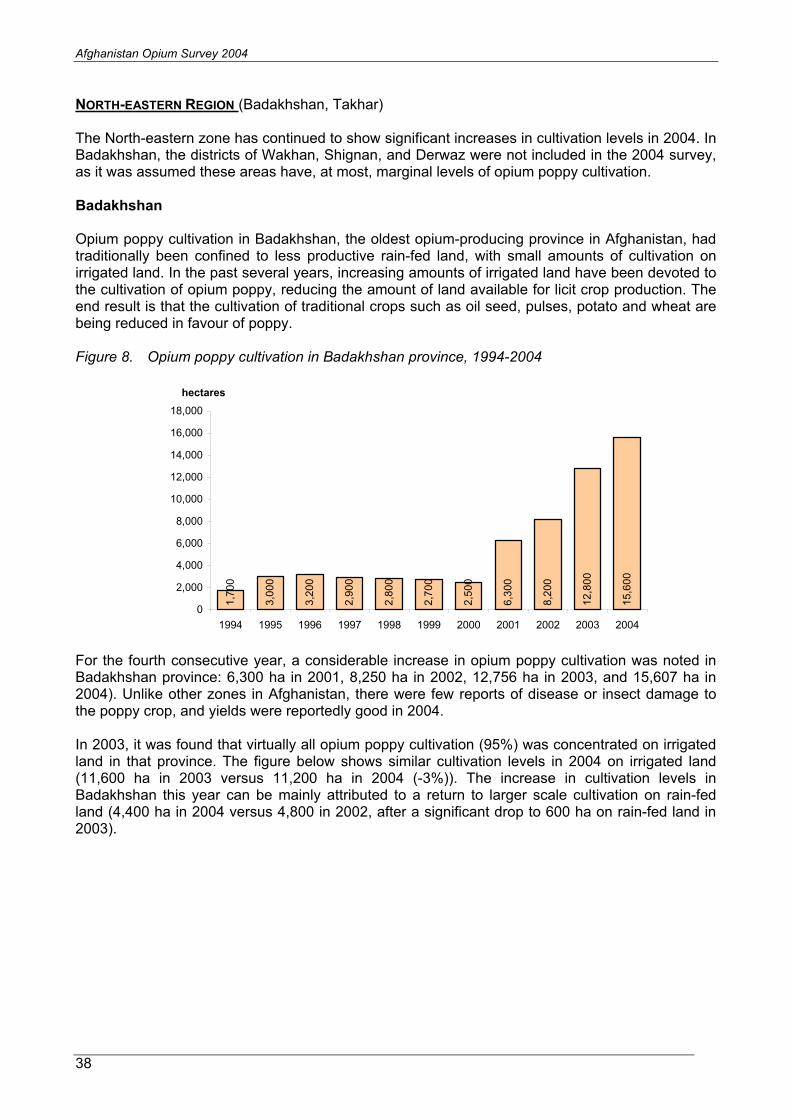
Badakhshan
Opium poppy cultivation in Badakhshan, the oldest opium-producing province in Afghanistan, had traditionally been confined to less productive rain-fed land, with small amounts of cultivation on irrigated land. In the past several years, increasing amounts of irrigated land have been devoted to the cultivation of opium poppy, reducing the amount of land available for licit crop production. The end result is that the cultivation of traditional crops such as oil seed, pulses, potato and wheat are being reduced in favour of poppy.
Figure 8. Opium poppy cultivation in Badakhshan province, 1994-2004
For the fourth consecutive year, a considerable increase in opium poppy cultivation was noted in Badakhshan province: 6,300 ha in 2001, 8,250 ha in 2002, 12,756 ha in 2003, and 15,607 ha in 2004). Unlike other zones in Afghanistan, there were few reports of disease or insect damage to the poppy crop, and yields were reportedly good in 2004.
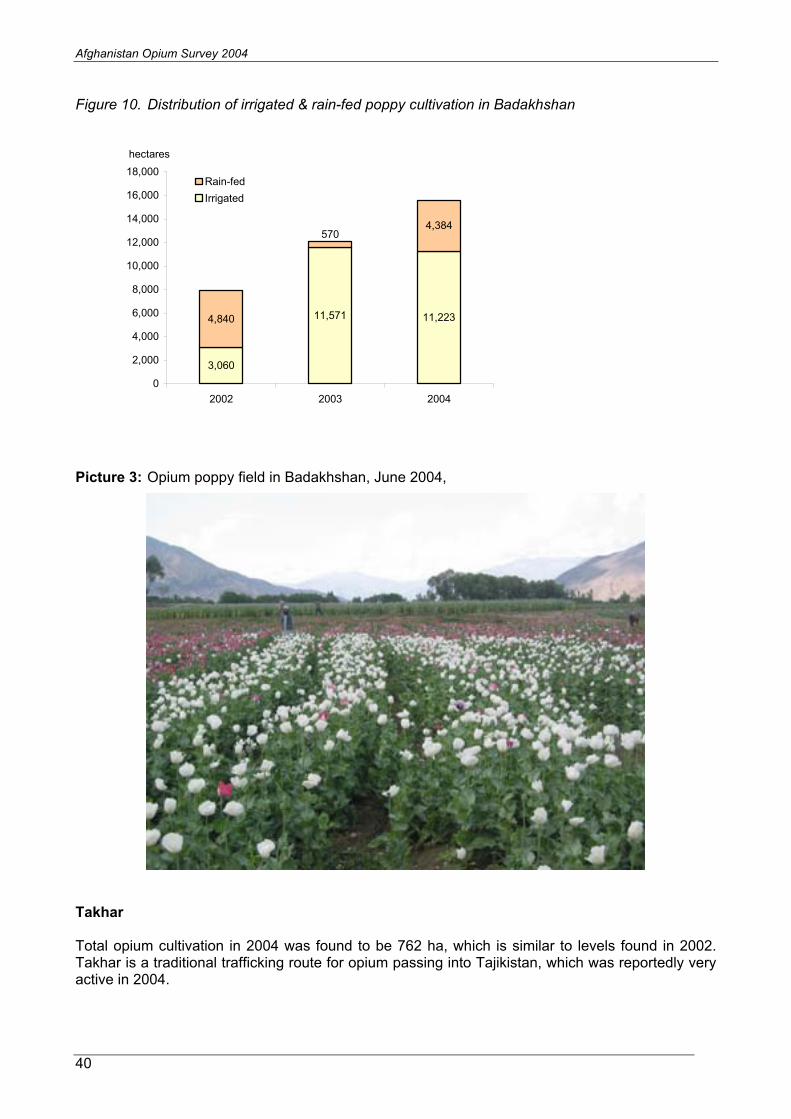
In 2003, it was found that virtually all opium poppy cultivation (95%) was concentrated on irrigated land in that province. The figure below shows similar cultivation levels in 2004 on irrigated land (11,600 ha in 2003 versus 11,200 ha in 2004 (-3%)). The increase in cultivation levels in Badakhshan this year can be mainly attributed to a return to larger scale cultivation on rain-fed land (4,400 ha in 2004 versus 4,800 in 2002, after a significant drop to 600 ha on rain-fed land in 2003).
1,7
00
3,0
00
3,2
00
2,9
00
2,8
00
2,7
00
2,5
00
6,3
00
8,2
00
12
,80
0
15
,60
0
0
2,000
4,000
6,000
8,000
10,000
12,000
14,000
16,000
18,000
1994 1995 1996 1997 1998 1999 2000 2001 2002 2003 2004
hectares
39
Afghanistan Opium Survey 2004
40
Figure 10. Distribution of irrigated & rain-fed poppy cultivation in Badakhshan
1
3,060
11,571 11,2234,840
4,384570
0
2,000
4,000
6,000
8,000
10,000
12,000
14,000
16,000
18,000
2002 2003 2004
hectares
Rain-fed
Irrigated
Picture 3: Opium poppy field in Badakhshan, June 2004,
Takhar
Total opium cultivation in 2004 was found to be 762 ha, which is similar to levels found in 2002. Takhar is a traditional trafficking route for opium passing into Tajikistan, which was reportedly very active in 2004.

41

Afghanistan Opium Survey 2004
42
NORTHERN REGION (Faryab, Balkh, Sari Pul, Baghlan, Jawzjan, Badghis, Samangan, Bamyan, Kunduz)
In 2004, opium poppy cultivation doubled in the region compared to the 1999 peak of 7,700 ha, and almost tripled compared to the 2003 estimate of 5,700 ha.
Table 6: Opium poppy cultivation in the northern survey zone, 1994 - 2004
0 0 1,1
00
1,0
00
2,0
00
7,7
00
4,2
00
700
700
5,7
00
14
,60
0
0
2,000
4,000
6,000
8,000
10,000
12,000
14,000
16,000
1994 1995 1996 1997 1998 1999 2000 2001 2002 2003 2004
hecta
re
Balkh
In Balkh in 2004 opium poppy cultivation increased to 2,400 ha, up from 1,100 ha in 2003 and 220 ha in 2002. In 2004, Balkh province experienced several weeks of tensions between the two local commanders fighting for influence.
Picture 4: Opium poppy field at early growth stage in Balk province (Mazar-E-Sharif)
Faryab
Faryab contributed to the large increase in the region from 2003 to 2004, with opium poppy cultivation rising from 800 ha to 3,200 ha.
Samangan
Compared to 2003, opium poppy cultivation showed a twelve-fold increase in this province, rising from 100 ha to 1,200 ha.
Afghanistan Opium Survey 2004
43
CENTRAL REGION (Parwan, Paktya, Wardak, Khost, Kabul, Logar)
2.1.1.1 Wardak
The decrease in Wardak (1,017 ha in 2004 compared to 2,735 ha in 2003) seems to be a result of claims in 2003 that due to lower than expected yields and limited poppy-growing experience, farmers would significantly decrease their cultivation levels in the coming season. The 63% reduction in cultivation in 2004 confirms this, and is in line with the findings of the UNODC’s October 2003 Farmer’s Intention Survey and the findings of UNODC’s Rapid Assessmentconducted earlier this year.
Parwan
For the first time, Parwan was surveyed in 2004 and poppy cultivation was estimated at 1,310 ha.
Kabul
The province has shown an increase in cultivation from 2002 (58 ha) to 2004 (282 ha). In 2004 the increase (16%) came from the Surobi district, situated along the Kabul-Jalalabad road, a vital transport and trade route linking Kabul to Pakistan.
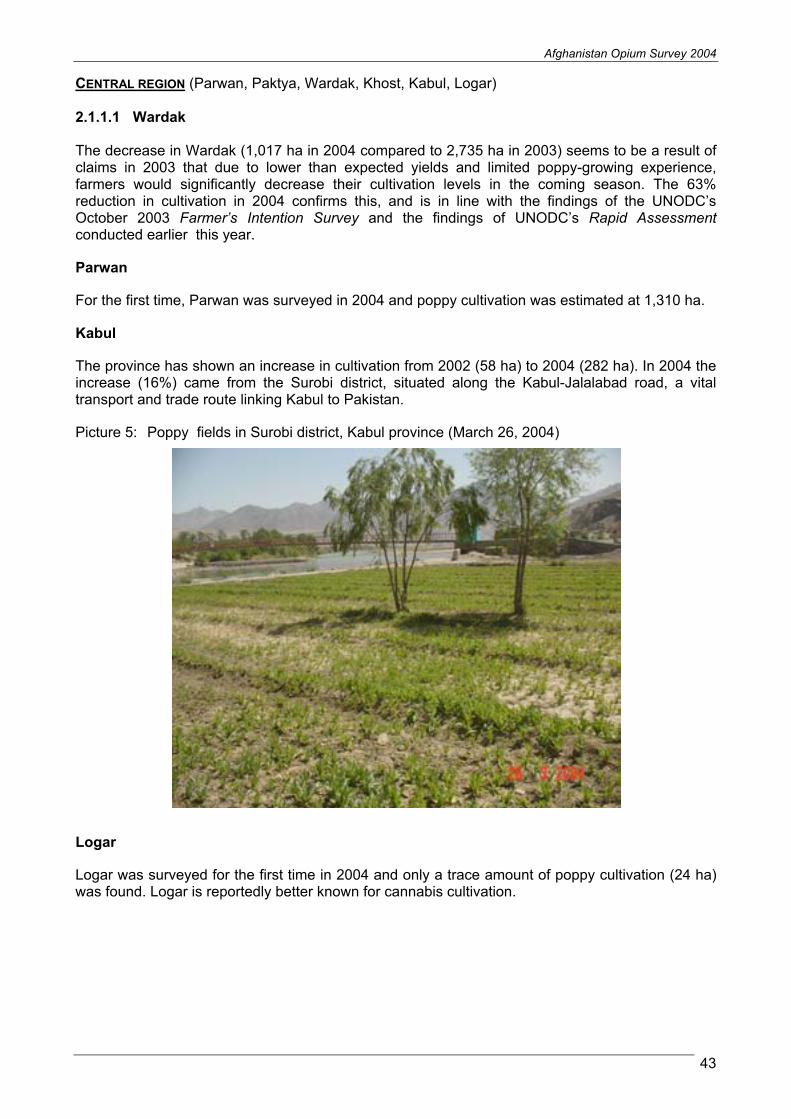
Picture 5: Poppy fields in Surobi district, Kabul province (March 26, 2004)
Logar
Logar was surveyed for the first time in 2004 and only a trace amount of poppy cultivation (24 ha) was found. Logar is reportedly better known for cannabis cultivation.

44

45

Afghanistan Opium Survey 2004
46
WESTERN REGION (Ghor, Hirat, Farah, Nimroz)
Hirat
Cultivation data was collected in seventeen districts in 2004, compared with only one district in 2003. The level of cultivation was estimated at 2,500 ha in 2004. Though surveyed extensively for the first time in 2004, many farmers in the new districts surveyed reported that they had been growing poppy in previous years as well.
There were reports of a major opium market in Shindand district, along the southern border with Farah. Opium markets can be considered as waypoints along trafficking routes, linking local opium traders to heroin processing labs either inside or outside of the country.
Picture 6: Opium poppy field in Hirat province (April 2004)
Ghor
Cultivation in Ghor was estimated at 5,000 ha in 2004 (+33% compared to 2003), which reflects a continuation of the upward trend shown from 2002 to 2003.

Afghanistan Opium Survey 2004
47
2.1.2 OPIUM POPPY AND AGRICULTURAL LAND
Despite the strong increases in its cultivation, opium poppy is still far from being the main crop grown in Afghanistan. According to statistics from the United Nations Food and Agriculture Organization (FAO), the land potentially available for crop cultivation amounts to 8.05 million hectares in Afghanistan (out of a total land area of 65 million ha)6. The land dedicated to opium poppy thus accounted for 1.6% of potentially arable land in 2004, up from 1% in 2003. The land actually under cultivation is currently estimated at around 4.55 million ha according to the Afghan Ministry of Agriculture7. Based on these data, the area under poppy cultivation rose from 1.8% in 2003 to 2.9% of total land used for agriculture in 2004.
Figure 11. Importance of opium poppy cultivation in Afghanistan in terms of land use
1.0%
1.8%
1.6%
2.9%
0.0%
0.5%
1.0%
1.5%
2.0%
2.5%
3.0%
Opium poppy in % of
potentially arable land
Opium poppy in % of
actual agricultural land
2003 2004
In the sampled areas covered with high-resolution satellite images, reflecting the main opium producing provinces, the opium poppy share of agricultural land reached much higher levels. Overall, 15% of the agricultural land was dedicated to opium poppy cultivation. The share of opium poppy in agricultural land was particular high in the provinces of Nangarhar (29%), Badakhshan (28%) and Kunar (24%).
Table 7: Percentage of opium poppy cultivation in the sample of high-resolution satellite images
Province Percentage of opium poppy
cultivation in the sample Irrigated agricultural land
in the sample (ha)
Nangarhar 29% 21,277
Badakhshan 28% 11,456
Kunar 24% 3,157
Hilmand 16% 35,790
Laghman 12% 3,620
Uruzgan 11% 11,081
Ghor 8% 2,738
Zabul 6% 2,484
Kandahar 3% 25,855
Wardak 1% 6,697
Total 15% 71,680
6 http://faostat.fao.org/faostat/collections?version=ext&hasbulk=0&subset=agriculture
7http://www.agriculture.gov.af/agriculture.htm
Afghanistan Opium Survey 2004
48
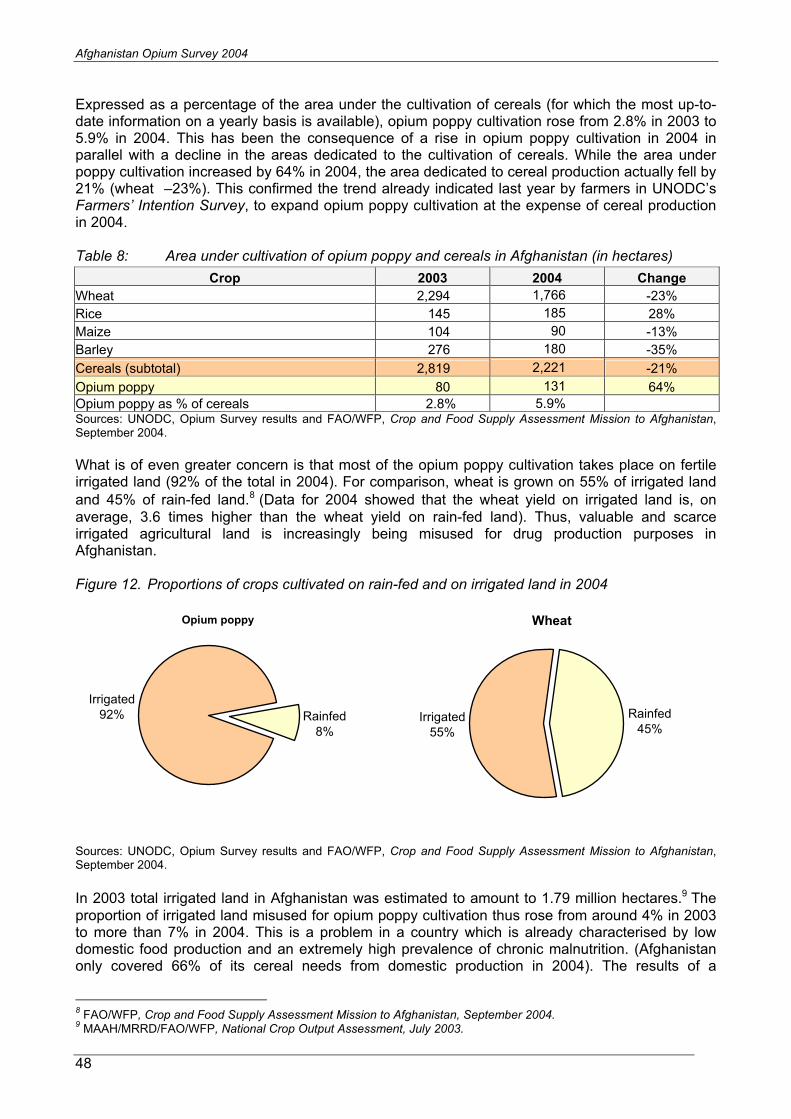
Expressed as a percentage of the area under the cultivation of cereals (for which the most up-to-date information on a yearly basis is available), opium poppy cultivation rose from 2.8% in 2003 to 5.9% in 2004. This has been the consequence of a rise in opium poppy cultivation in 2004 in parallel with a decline in the areas dedicated to the cultivation of cereals. While the area under poppy cultivation increased by 64% in 2004, the area dedicated to cereal production actually fell by 21% (wheat –23%). This confirmed the trend already indicated last year by farmers in UNODC’s Farmers’ Intention Survey, to expand opium poppy cultivation at the expense of cereal production in 2004.
Table 8: Area under cultivation of opium poppy and cereals in Afghanistan (in hectares)
Sources: UNODC, Opium Survey results and FAO/WFP, Crop and Food Supply Assessment Mission to Afghanistan,September 2004.
What is of even greater concern is that most of the opium poppy cultivation takes place on fertile irrigated land (92% of the total in 2004). For comparison, wheat is grown on 55% of irrigated land and 45% of rain-fed land.8 (Data for 2004 showed that the wheat yield on irrigated land is, on average, 3.6 times higher than the wheat yield on rain-fed land). Thus, valuable and scarce irrigated agricultural land is increasingly being misused for drug production purposes in Afghanistan.
Figure 12. Proportions of crops cultivated on rain-fed and on irrigated land in 2004
Sources: UNODC, Opium Survey results and FAO/WFP, Crop and Food Supply Assessment Mission to Afghanistan,September 2004.
In 2003 total irrigated land in Afghanistan was estimated to amount to 1.79 million hectares.9 The proportion of irrigated land misused for opium poppy cultivation thus rose from around 4% in 2003 to more than 7% in 2004. This is a problem in a country which is already characterised by low domestic food production and an extremely high prevalence of chronic malnutrition. (Afghanistan only covered 66% of its cereal needs from domestic production in 2004). The results of a
8
FAO/WFP, Crop and Food Supply Assessment Mission to Afghanistan, September 2004. 9
MAAH/MRRD/FAO/WFP, National Crop Output Assessment, July 2003.
Crop 2003 2004 Change
Wheat 2,294 1,766 -23%
Rice 145 185 28%
Maize 104 90 -13%
Barley 276 180 -35%
Cereals (subtotal) 2,819 2,221 -21%
Opium poppy 80 131 64%
Opium poppy as % of cereals 2.8% 5.9%
Wheat
Irrigated55%
Rainfed45%
Opium poppy
Irrigated92% Rainfed
8%
Afghanistan Opium Survey 2004
49
nationwide vulnerability assessment of rural populations (July - October 2003) indicated that 3.8 million people in rural areas were unable to meet their minimum daily food requirements in 2003.10
Given a very poor harvest of cereals in 2004, 6.4 million people or some 35% of the rural population were found to face increasing food insecurity in 2004, consuming less than 2100 kcal/capita/day. A consequence is that increasing wheat imports and increasing assistance by the international community for marginal groups are required (to compensate them for rising wheat prices, prompted – inter alia - by farmers’ decisions to opt for poppy instead of wheat cultivation). In other words, while the cultivation of opium poppy improves the income for farmers involved in this activity, it may contribute to a deteriorating situation for others.
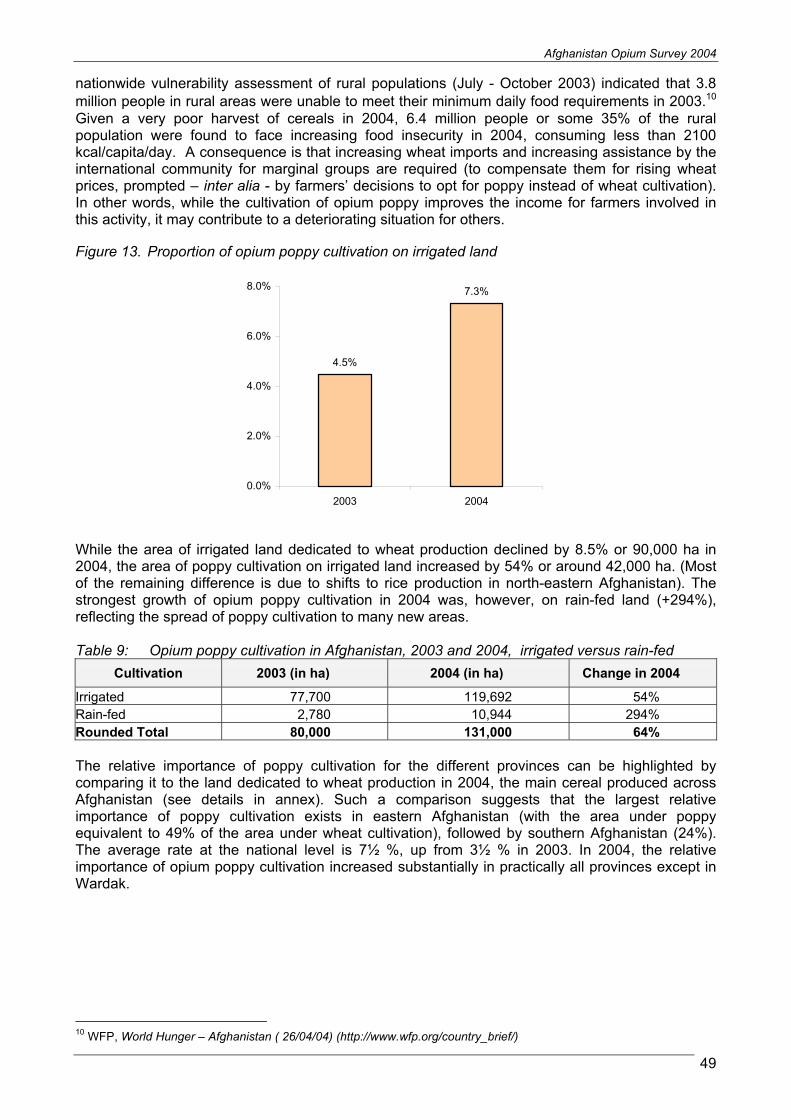
Figure 13. Proportion of opium poppy cultivation on irrigated land
While the area of irrigated land dedicated to wheat production declined by 8.5% or 90,000 ha in 2004, the area of poppy cultivation on irrigated land increased by 54% or around 42,000 ha. (Most of the remaining difference is due to shifts to rice production in north-eastern Afghanistan). The strongest growth of opium poppy cultivation in 2004 was, however, on rain-fed land (+294%), reflecting the spread of poppy cultivation to many new areas.
Table 9: Opium poppy cultivation in Afghanistan, 2003 and 2004, irrigated versus rain-fed
Cultivation 2003 (in ha) 2004 (in ha) Change in 2004
Irrigated 77,700 119,692 54%
Rain-fed 2,780 10,944 294%
Rounded Total 80,000 131,000 64%
The relative importance of poppy cultivation for the different provinces can be highlighted by comparing it to the land dedicated to wheat production in 2004, the main cereal produced across Afghanistan (see details in annex). Such a comparison suggests that the largest relative importance of poppy cultivation exists in eastern Afghanistan (with the area under poppy equivalent to 49% of the area under wheat cultivation), followed by southern Afghanistan (24%). The average rate at the national level is 7½ %, up from 3½ % in 2003. In 2004, the relative importance of opium poppy cultivation increased substantially in practically all provinces except in Wardak.
10
WFP, World Hunger – Afghanistan ( 26/04/04) (http://www.wfp.org/country_brief/)
4.5%
7.3%
0.0%
2.0%
4.0%
6.0%
8.0%
2003 2004
Afghanistan Opium Survey 2004
50
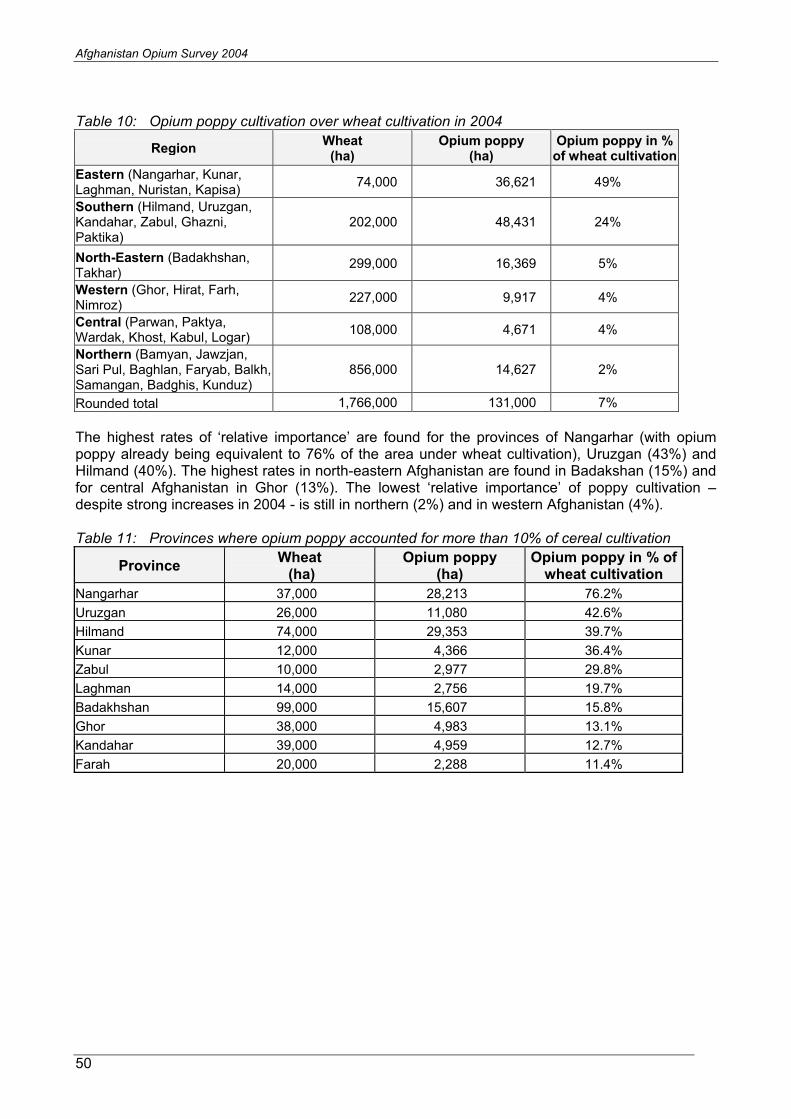
Table 10: Opium poppy cultivation over wheat cultivation in 2004
RegionWheat
(ha) Opium poppy
(ha) Opium poppy in %
of wheat cultivation
Eastern (Nangarhar, Kunar, Laghman, Nuristan, Kapisa)
74,000 36,621 49%
Southern (Hilmand, Uruzgan, Kandahar, Zabul, Ghazni, Paktika)
202,000 48,431 24%
North-Eastern (Badakhshan, Takhar)
299,000 16,369 5%
Western (Ghor, Hirat, Farh, Nimroz)
227,000 9,917 4%
Central (Parwan, Paktya, Wardak, Khost, Kabul, Logar)
108,000 4,671 4%
Northern (Bamyan, Jawzjan, Sari Pul, Baghlan, Faryab, Balkh, Samangan, Badghis, Kunduz)
856,000 14,627 2%
Rounded total 1,766,000 131,000 7%
The highest rates of ‘relative importance’ are found for the provinces of Nangarhar (with opium poppy already being equivalent to 76% of the area under wheat cultivation), Uruzgan (43%) and Hilmand (40%). The highest rates in north-eastern Afghanistan are found in Badakshan (15%) and for central Afghanistan in Ghor (13%). The lowest ‘relative importance’ of poppy cultivation – despite strong increases in 2004 - is still in northern (2%) and in western Afghanistan (4%).
Table 11: Provinces where opium poppy accounted for more than 10% of cereal cultivation
ProvinceWheat (ha)
Opium poppy (ha)
Opium poppy in % of wheat cultivation
Nangarhar 37,000 28,213 76.2%
Uruzgan 26,000 11,080 42.6%
Hilmand 74,000 29,353 39.7%
Kunar 12,000 4,366 36.4%
Zabul 10,000 2,977 29.8%
Laghman 14,000 2,756 19.7%
Badakhshan 99,000 15,607 15.8%
Ghor 38,000 4,983 13.1%
Kandahar 39,000 4,959 12.7%
Farah 20,000 2,288 11.4%
Afghanistan Opium Survey 2004
51
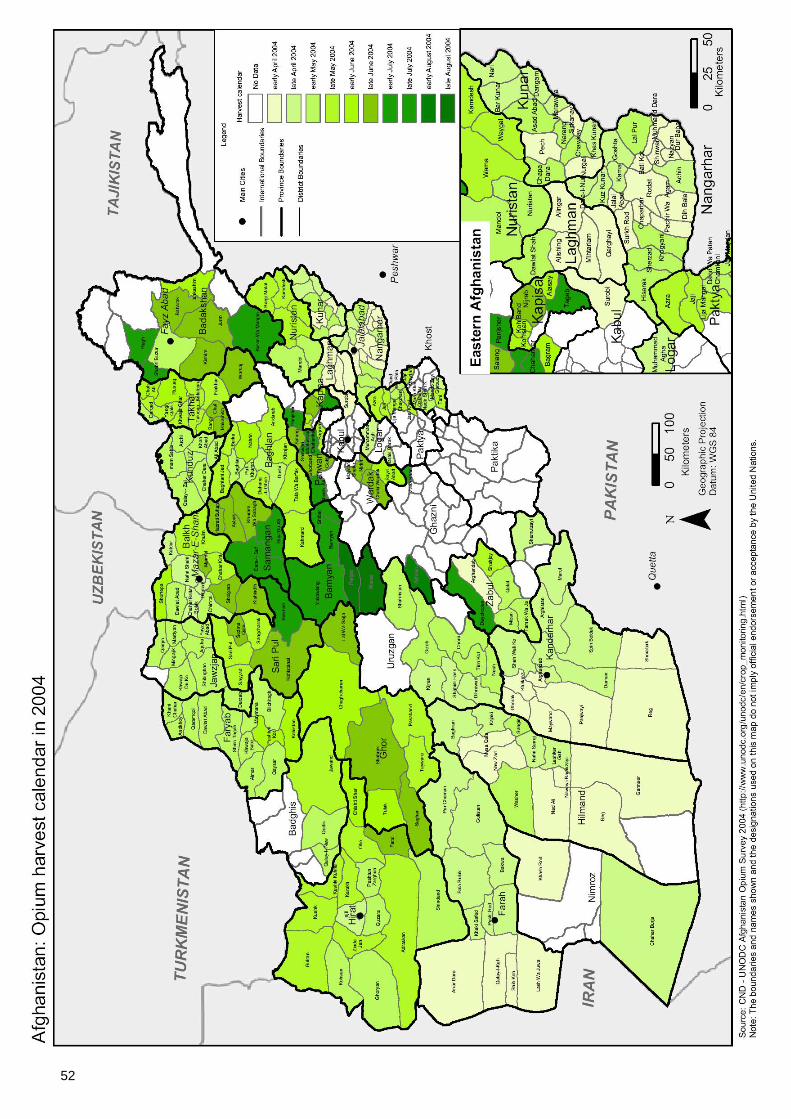
2.1.3 OPIUM POPPY CALENDAR
In 2004, opium poppy was harvested one to two weeks earlier compared to last year. In the eastern and south-western regions, the main harvest was around early April in 2004, compared to mid-April in 2003. The early harvest was attributed to the weather conditions, and in some cases to farmers’ decisions to harvest as early as possible to avoid eradication.
The harvest month mapped by districts showed that opium harvest follows a sequence conditioned by the latitude and the altitude of the specific location. It starts in the eastern region, quickly followed by the south-western region. About one month later, opium is harvested in the northern and eventually in the higher altitude area of the central and northern-eastern regions.
52
Afghanistan Opium Survey 2004
53
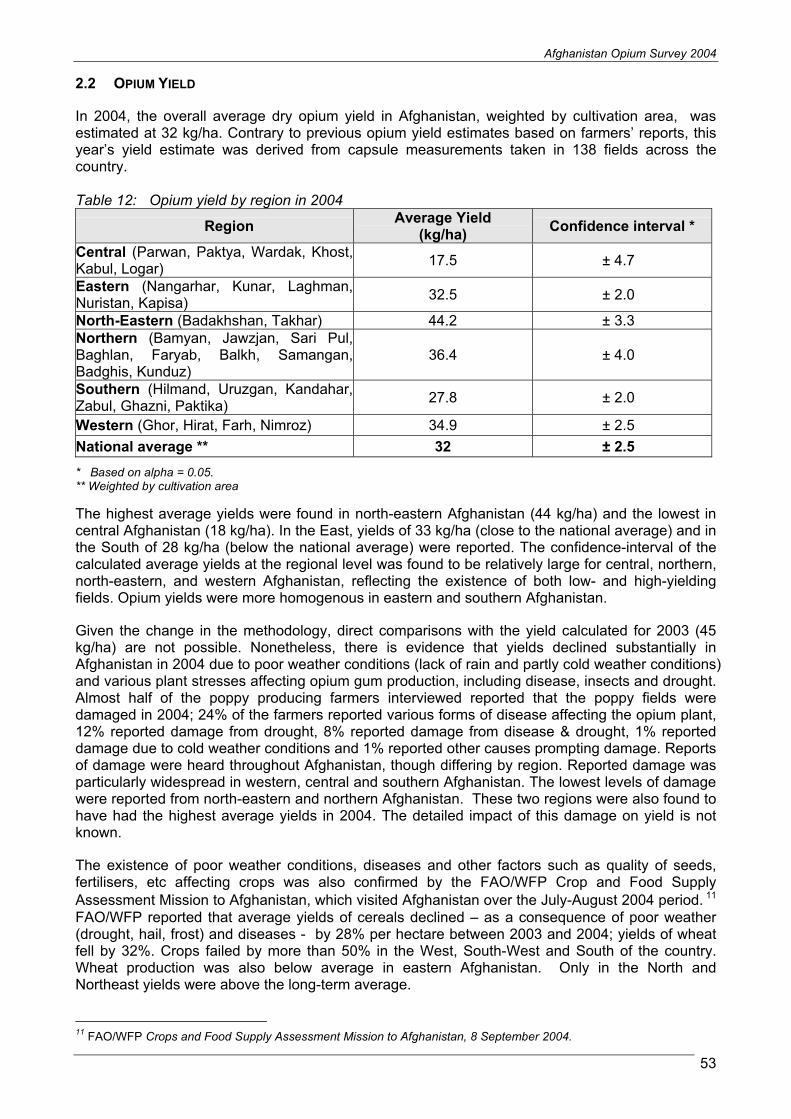
2.2 OPIUM YIELD
In 2004, the overall average dry opium yield in Afghanistan, weighted by cultivation area, was estimated at 32 kg/ha. Contrary to previous opium yield estimates based on farmers’ reports, this year’s yield estimate was derived from capsule measurements taken in 138 fields across the country.
Table 12: Opium yield by region in 2004
RegionAverage Yield
(kg/ha)Confidence interval *
Central (Parwan, Paktya, Wardak, Khost,Kabul, Logar)
17.5 ± 4.7
Eastern (Nangarhar, Kunar, Laghman,Nuristan, Kapisa)
32.5 ± 2.0
North-Eastern (Badakhshan, Takhar) 44.2 ± 3.3 Northern (Bamyan, Jawzjan, Sari Pul,Baghlan, Faryab, Balkh, Samangan,Badghis, Kunduz)
36.4 ± 4.0
Southern (Hilmand, Uruzgan, Kandahar,Zabul, Ghazni, Paktika)
27.8 ± 2.0
Western (Ghor, Hirat, Farh, Nimroz) 34.9 ± 2.5
National average ** 32 ± 2.5
* Based on alpha = 0.05. ** Weighted by cultivation area
The highest average yields were found in north-eastern Afghanistan (44 kg/ha) and the lowest in central Afghanistan (18 kg/ha). In the East, yields of 33 kg/ha (close to the national average) and in the South of 28 kg/ha (below the national average) were reported. The confidence-interval of the calculated average yields at the regional level was found to be relatively large for central, northern, north-eastern, and western Afghanistan, reflecting the existence of both low- and high-yielding fields. Opium yields were more homogenous in eastern and southern Afghanistan.
Given the change in the methodology, direct comparisons with the yield calculated for 2003 (45 kg/ha) are not possible. Nonetheless, there is evidence that yields declined substantially in Afghanistan in 2004 due to poor weather conditions (lack of rain and partly cold weather conditions) and various plant stresses affecting opium gum production, including disease, insects and drought. Almost half of the poppy producing farmers interviewed reported that the poppy fields were damaged in 2004; 24% of the farmers reported various forms of disease affecting the opium plant, 12% reported damage from drought, 8% reported damage from disease & drought, 1% reported damage due to cold weather conditions and 1% reported other causes prompting damage. Reports of damage were heard throughout Afghanistan, though differing by region. Reported damage was particularly widespread in western, central and southern Afghanistan. The lowest levels of damage were reported from north-eastern and northern Afghanistan. These two regions were also found to have had the highest average yields in 2004. The detailed impact of this damage on yield is not known.
The existence of poor weather conditions, diseases and other factors such as quality of seeds, fertilisers, etc affecting crops was also confirmed by the FAO/WFP Crop and Food Supply Assessment Mission to Afghanistan, which visited Afghanistan over the July-August 2004 period. 11
FAO/WFP reported that average yields of cereals declined – as a consequence of poor weather (drought, hail, frost) and diseases - by 28% per hectare between 2003 and 2004; yields of wheat fell by 32%. Crops failed by more than 50% in the West, South-West and South of the country. Wheat production was also below average in eastern Afghanistan. Only in the North and Northeast yields were above the long-term average.
11
FAO/WFP Crops and Food Supply Assessment Mission to Afghanistan, 8 September 2004.

Afghanistan Opium Survey 2004
54
Table 13: Villages where damage to opium fields was reported Damage reported to opium fields related to
Region Villagessurveyed
Disease DroughtDrought
&disease
Coldweather
&disease
OtherTotal
DamageReported
Central (Parwan, Paktya, Wardak, Khost, Kabul, Logar)
102 41% 4% 6% 4% - 55%
Eastern (Nangarhar, Kunar, Laghman, Nuristan, Kapisa)
183 31% 11% 1% 1% 1% 45%
North-Eastern (Badakhshan, Takhar)
148 22% - - 3% - 26%
Northern (Bamyan, Jawzjan, Sari Pul, Baghlan, Faryab, Balkh, Samangan, Badghis, Kunduz)
420 4% 20% 4% 2% - 30%
Southern (Hilmand, Uruzgan, Kandahar, Zabul, Ghazni, Paktika)
258 29% 14% 10% - 1% 54%
Western (Ghor, Hirat, Farh, Nimroz)
237 43% 6% 23% - 1% 74%
TOTAL 1,348 24% 12% 8% 1% 1% 46%
The following table summarizes the various sources of damage to poppy plants recorded by UNODC’s survey team and provides a general review of the type of effect on the poppy plant:
Table 14: Plant damage as reported by farmers and surveyors Reported source of
damageNotes
Insects
Including cotton bollworms (see FIG), green aphids, root worms, nematodes; each species is related to specific forms and varying degrees of damage
Vermin Rats burrow into the soil, damaging roots and disrupting irrigation
Nutrient deficiency The improper use of fertilizer for example can damage the root system
Root rot Resulting from poor soil drainage, usually a combination of excessive rain and/or high water retention in, for example, clayey soils
Drought Among other symptoms, a lack of water results in stunted plants
Variable climatic conditions Including events such as rain or hail during the poppy harvest, excessive dust (very common in Afghanistan, especially in the North and South-western zones), strong winds, etc
Another source of stress on poppy plants in 2004 was poor or non-existent crop rotation. Many farmers were not concerned with sustainable agricultural practices, as they appeared to focus their efforts on maximising profit from opium poppy cultivation. Notably in areas where poppy was being grown on the same parcel of land in consecutive years, particularly in very densely cultivated areas, it is likely that the soil nutrients have become leached from the soil which contributed to lowering the yields.
Against the background of announced eradication, there were also reports that some farmers harvested their fields at a rather early stage, thus contributing to a reduction of potential total yields.

Afghanistan Opium Survey 2004
55
Farmers also complained about the quality of fertilizers, claiming that their poor quality may have contributed to the poor yield. These claims were confirmed by FAO and WFP, reporting lack of quality control of imported fertilizers, resulting in an upsurge of diluted and infiltrated fertilisers with a reduced nutrient content.12 Moreover, many new poppy farmers lack experience and know-how which can lead to a low yield.
As a result, ‘expected yields’ by farmers declined in 2004 by more than 40% as compared to 2003; actually measured yields of fresh opium (collected as part of the method development exercise) were some 30% lower in 2004 than a year earlier. Particularly strong declines in yields were reported from eastern, central and southern Afghanistan. In north-eastern Afghanistan, in contrast, yields appear to have remained at levels similar to those reported a year earlier, reflecting overall rather good weather conditions.
12
FAO/WFP, Crop and Food Supply Assessment Mission to Afghanistan, 8 September 2004.

Afghanistan Opium Survey 2004
56
Figure 14. Jurm district, Badakhshan (August 2004)
Poppy (lancing stage)
Yields reported in Badakhshan were the highest in the country.
The photo shows healthy plants with no apparent signs of stress.
Figure 15. Dand district, Kandahar (May 2004)
Poppy (lancing stage)
Yields reported in Kandahar were lower than in other parts of the country. The field shown is typical of the region, with leaves and stalks starting to desiccate as the capsule develops.
Figure 16. Obe district, Hirat (May 2004)
Poppy plant root affected by insect larvae
Farmers frequently reported crop damage caused by “disease,” but in fact it seems to be a general description for various types of damage observed.
Afghanistan Opium Survey 2004
57
2.3 POTENTIAL OPIUM PRODUCTION
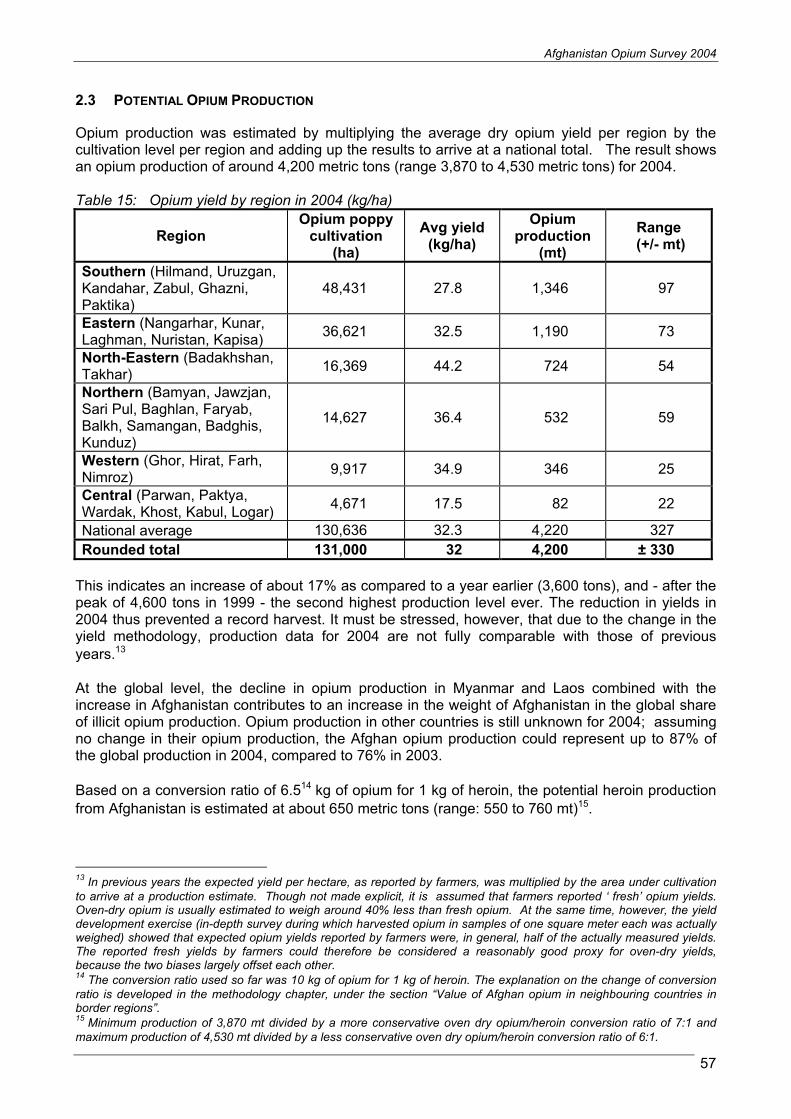
Opium production was estimated by multiplying the average dry opium yield per region by the cultivation level per region and adding up the results to arrive at a national total. The result shows an opium production of around 4,200 metric tons (range 3,870 to 4,530 metric tons) for 2004.
Table 15: Opium yield by region in 2004 (kg/ha)
RegionOpium poppy
cultivation(ha)
Avg yield (kg/ha)
Opiumproduction
(mt)
Range (+/- mt)
Southern (Hilmand, Uruzgan, Kandahar, Zabul, Ghazni, Paktika)
48,431 27.8 1,346 97
Eastern (Nangarhar, Kunar, Laghman, Nuristan, Kapisa)
36,621 32.5 1,190 73
North-Eastern (Badakhshan, Takhar)
16,369 44.2 724 54
Northern (Bamyan, Jawzjan, Sari Pul, Baghlan, Faryab, Balkh, Samangan, Badghis, Kunduz)
14,627 36.4 532 59
Western (Ghor, Hirat, Farh, Nimroz)
9,917 34.9 346 25
Central (Parwan, Paktya, Wardak, Khost, Kabul, Logar)
4,671 17.5 82 22
National average 130,636 32.3 4,220 327
Rounded total 131,000 32 4,200 ± 330
This indicates an increase of about 17% as compared to a year earlier (3,600 tons), and - after the peak of 4,600 tons in 1999 - the second highest production level ever. The reduction in yields in 2004 thus prevented a record harvest. It must be stressed, however, that due to the change in the yield methodology, production data for 2004 are not fully comparable with those of previous years.13
At the global level, the decline in opium production in Myanmar and Laos combined with the increase in Afghanistan contributes to an increase in the weight of Afghanistan in the global share of illicit opium production. Opium production in other countries is still unknown for 2004; assuming no change in their opium production, the Afghan opium production could represent up to 87% of the global production in 2004, compared to 76% in 2003.
Based on a conversion ratio of 6.514 kg of opium for 1 kg of heroin, the potential heroin production
from Afghanistan is estimated at about 650 metric tons (range: 550 to 760 mt)15.
13
In previous years the expected yield per hectare, as reported by farmers, was multiplied by the area under cultivation to arrive at a production estimate. Though not made explicit, it is assumed that farmers reported ‘ fresh’ opium yields. Oven-dry opium is usually estimated to weigh around 40% less than fresh opium. At the same time, however, the yield development exercise (in-depth survey during which harvested opium in samples of one square meter each was actually weighed) showed that expected opium yields reported by farmers were, in general, half of the actually measured yields. The reported fresh yields by farmers could therefore be considered a reasonably good proxy for oven-dry yields, because the two biases largely offset each other. 14
The conversion ratio used so far was 10 kg of opium for 1 kg of heroin. The explanation on the change of conversion ratio is developed in the methodology chapter, under the section “Value of Afghan opium in neighbouring countries in border regions”. 15
Minimum production of 3,870 mt divided by a more conservative oven dry opium/heroin conversion ratio of 7:1 and maximum production of 4,530 mt divided by a less conservative oven dry opium/heroin conversion ratio of 6:1.

Afghanistan Opium Survey 2004
58
Figure 17. Opium production in Afghanistan from 1980 to 2004
200
225
275
488
160
450
350
875
1,1
20
1,2
00
1,6
00
2,0
00
2,0
00
2,3
00
3,4
00
2,3
00
2,2
00
2,8
00
2,7
00
4,6
00
3,3
00
200
3,4
00
3,6
00
4,2
00
0
1,000
2,000
3,000
4,000
5,000
1980 1981 1982 1983 1984 1985 1986 1987 1988 1989 1990 1991 1992 1993 1994 1995 1996 1997 1998 1999 2000 2001 2002 2003 2004
metr
ic tons
'Soviet' period'Warlord' period 'Taliban' period 'Transitional Govt
Sources: UNODC, The Opium Economy in Afghanistan, an International Problem; and UNODC Opium Surveys, 1994-2004.
Figure 18. Global opium production 1990-2004*
3760
4,270 4,140
4,610
5,620
4,450 4,360
4,820
4,350
4,690 4,490
4,770
1,600
5,760
4,850
0
1,000
2,000
3,000
4,000
5,000
6,000
1990 1991 1992 1993 1994 1995 1996 1997 1998 1999 2000 2001 2002 2003 2004
me
tric
to
ns
Afghanistan Myanmar Lao PDR Rest of the World
* For 2004, estimates for the “rest of the world” are still tentative
The largest increases in opium production at the regional level within Afghanistan were observed in northern (132%), north-eastern (39%) and western Afghanistan (37%). The combination of strong increases in areas under poppy cultivation and relatively good yields were responsible for the strong increases in northern and north-eastern Afghanistan. Opium production increased moderately in southern (10%) and eastern Afghanistan (6%) and declined – due to poor yields – in central Afghanistan (-57%). (As indicated before, given changes in the yield assessment methodology, comparisons with previous years’ results must be interpreted with caution.)

Afghanistan Opium Survey 2004
59
Table 16: Opium production in Afghanistan – regional breakdown - 2003 and 2004
Region2003(mt)
2004(mt)
One year change
2003 in % 2004 in %
Southern (Hilmand, Uruzgan, Kandahar, Zabul, Ghazni, Paktika)
1,223 1,346 10% 34% 32%
Eastern (Nangarhar, Kunar, Laghman, Nuristan, Kapisa)
1,205 1,190 6% 33% 28%
North-Eastern (Badakhshan, Takhar)
520 724 39% 14% 17%
Northern (Bamyan, Jawzjan, Sari Pul, Baghlan, Faryab, Balkh, Samangan, Badghis, Kunduz)
230 532 132% 6% 13%
Western (Ghor, Hirat, Farh, Nimroz) 252 346 37% 7% 8%
Central (Parwan, Paktya, Wardak, Khost, Kabul, Logar)
190 82 -57% 5% 2%
Rounded total 3,600 4,200 17% 100% 100%
Figure 19. Opium harvesting & trading
Opium poppy capsule being lanced using neshtar16
. Opium trading in local shop in Badakhshan.
The single largest opium producing province in 2004 was, for the second year in a row, Nangarhar (23% of total), followed by Hilmand (20%), Badakshan (18) and Uruzgan (8%). The ranking of the top 4 opium producing provinces was thus the same as in 2003. The combination of high yields in Badakshan and low yields in Hilmand meant, however, that opium production in Badakshan came relatively close to that of Hilmand though farmers in Hilmand cultivated almost twice as much land with opium poppy than farmers in Badakshan. The top-3 provinces accounted for 61% of total opium production; the top-6 provinces for 77% and the top 10-provinces for 90% of total opium production in Afghanistan in 2004.
16
A neshtar is the tool commonly used to lance poppy capsules.
Afghanistan Opium Survey 2004
60
Afghanistan Opium Survey 2004
61
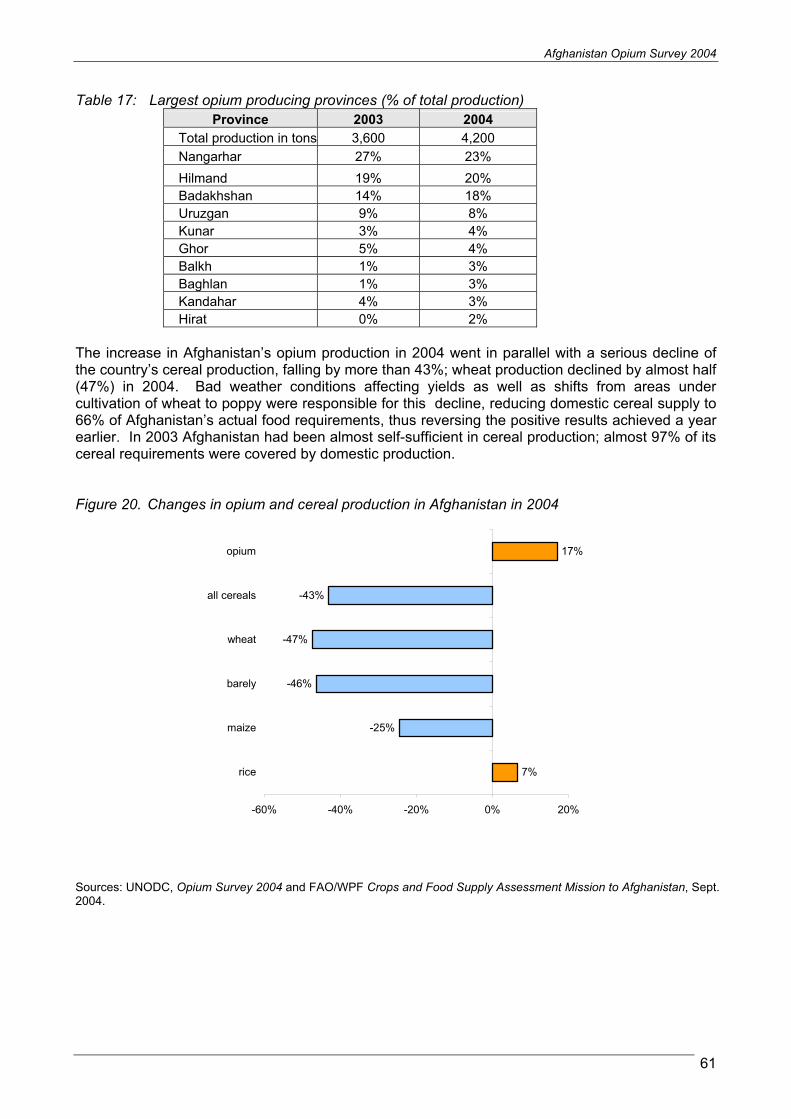
Table 17: Largest opium producing provinces (% of total production)
Province 2003 2004
Total production in tons 3,600 4,200
Nangarhar 27% 23%
Hilmand 19% 20%
Badakhshan 14% 18%
Uruzgan 9% 8%
Kunar 3% 4%
Ghor 5% 4%
Balkh 1% 3%
Baghlan 1% 3%
Kandahar 4% 3%
Hirat 0% 2%
The increase in Afghanistan’s opium production in 2004 went in parallel with a serious decline of the country’s cereal production, falling by more than 43%; wheat production declined by almost half (47%) in 2004. Bad weather conditions affecting yields as well as shifts from areas under cultivation of wheat to poppy were responsible for this decline, reducing domestic cereal supply to 66% of Afghanistan’s actual food requirements, thus reversing the positive results achieved a year earlier. In 2003 Afghanistan had been almost self-sufficient in cereal production; almost 97% of its cereal requirements were covered by domestic production.
Figure 20. Changes in opium and cereal production in Afghanistan in 2004
Sources: UNODC, Opium Survey 2004 and FAO/WPF Crops and Food Supply Assessment Mission to Afghanistan, Sept. 2004.
7%
-25%
-46%
-47%
-43%
17%
-60% -40% -20% 0% 20%
rice
maize
barely
wheat
all cereals
opium
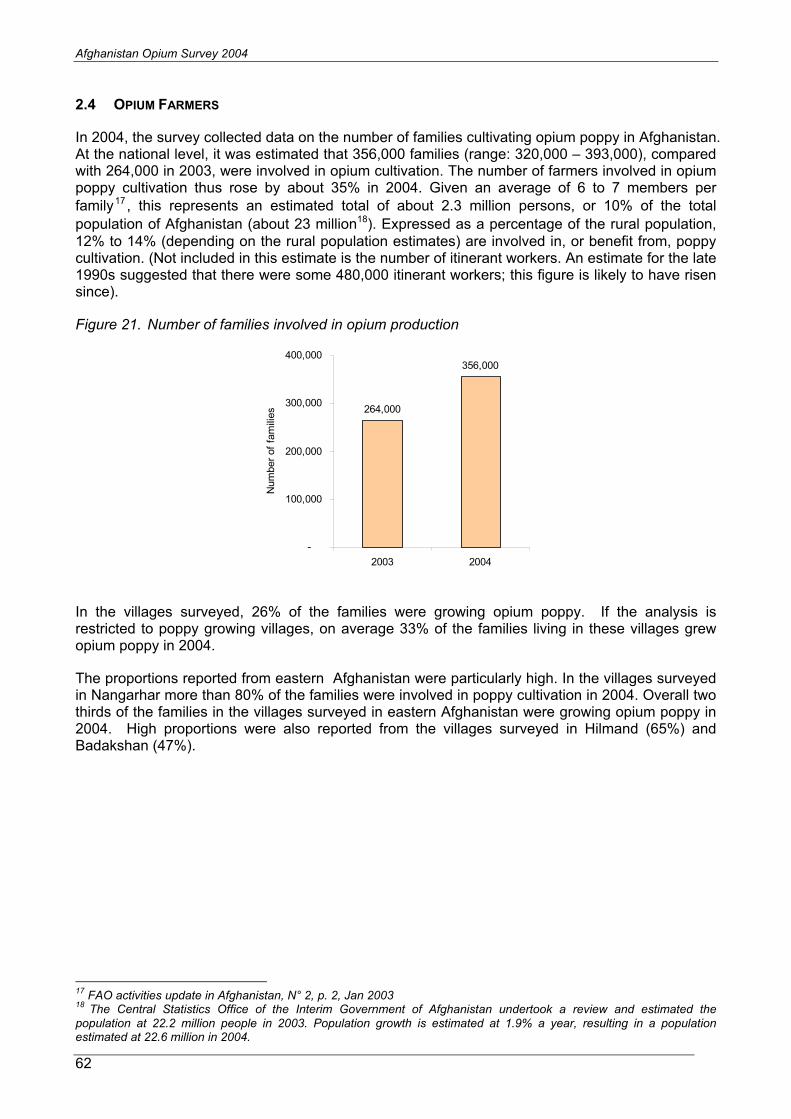
Afghanistan Opium Survey 2004
62
2.4 OPIUM FARMERS
In 2004, the survey collected data on the number of families cultivating opium poppy in Afghanistan. At the national level, it was estimated that 356,000 families (range: 320,000 – 393,000), compared with 264,000 in 2003, were involved in opium cultivation. The number of farmers involved in opium poppy cultivation thus rose by about 35% in 2004. Given an average of 6 to 7 members per family17, this represents an estimated total of about 2.3 million persons, or 10% of the total
population of Afghanistan (about 23 million18). Expressed as a percentage of the rural population, 12% to 14% (depending on the rural population estimates) are involved in, or benefit from, poppy cultivation. (Not included in this estimate is the number of itinerant workers. An estimate for the late 1990s suggested that there were some 480,000 itinerant workers; this figure is likely to have risen since).
Figure 21. Number of families involved in opium production
264,000
356,000
-
100,000
200,000
300,000
400,000
2003 2004
Num
ber
of
fam
ilies
In the villages surveyed, 26% of the families were growing opium poppy. If the analysis is restricted to poppy growing villages, on average 33% of the families living in these villages grew opium poppy in 2004.
The proportions reported from eastern Afghanistan were particularly high. In the villages surveyed in Nangarhar more than 80% of the families were involved in poppy cultivation in 2004. Overall two thirds of the families in the villages surveyed in eastern Afghanistan were growing opium poppy in 2004. High proportions were also reported from the villages surveyed in Hilmand (65%) and Badakshan (47%).
17
FAO activities update in Afghanistan, N° 2, p. 2, Jan 2003 18
The Central Statistics Office of the Interim Government of Afghanistan undertook a review and estimated the population at 22.2 million people in 2003. Population growth is estimated at 1.9% a year, resulting in a population estimated at 22.6 million in 2004.
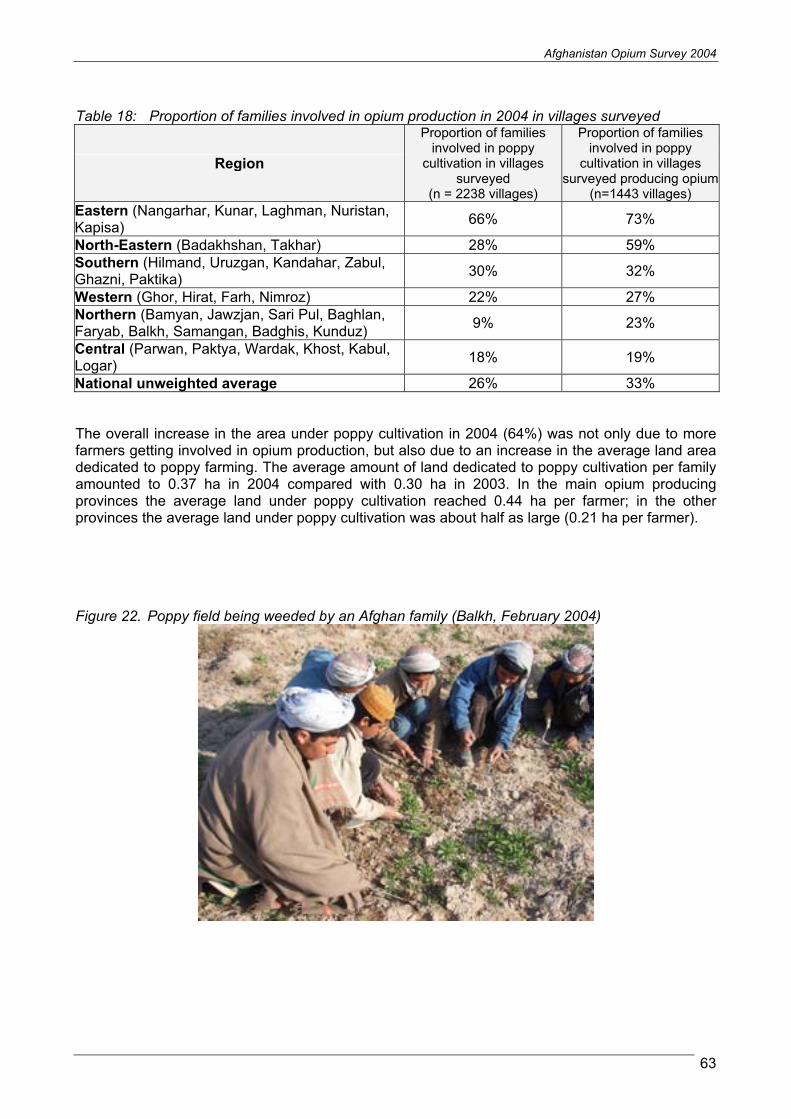
Afghanistan Opium Survey 2004
63
Table 18: Proportion of families involved in opium production in 2004 in villages surveyed
Region
Proportion of families involved in poppy
cultivation in villages surveyed
(n = 2238 villages)
Proportion of families involved in poppy
cultivation in villages surveyed producing opium
(n=1443 villages)
Eastern (Nangarhar, Kunar, Laghman, Nuristan, Kapisa)
66% 73%
North-Eastern (Badakhshan, Takhar) 28% 59% Southern (Hilmand, Uruzgan, Kandahar, Zabul, Ghazni, Paktika)
30% 32%
Western (Ghor, Hirat, Farh, Nimroz) 22% 27% Northern (Bamyan, Jawzjan, Sari Pul, Baghlan, Faryab, Balkh, Samangan, Badghis, Kunduz)
9% 23%
Central (Parwan, Paktya, Wardak, Khost, Kabul, Logar)
18% 19%
National unweighted average 26% 33%
The overall increase in the area under poppy cultivation in 2004 (64%) was not only due to more farmers getting involved in opium production, but also due to an increase in the average land area dedicated to poppy farming. The average amount of land dedicated to poppy cultivation per family amounted to 0.37 ha in 2004 compared with 0.30 ha in 2003. In the main opium producing provinces the average land under poppy cultivation reached 0.44 ha per farmer; in the other provinces the average land under poppy cultivation was about half as large (0.21 ha per farmer).
Figure 22. Poppy field being weeded by an Afghan family (Balkh, February 2004)
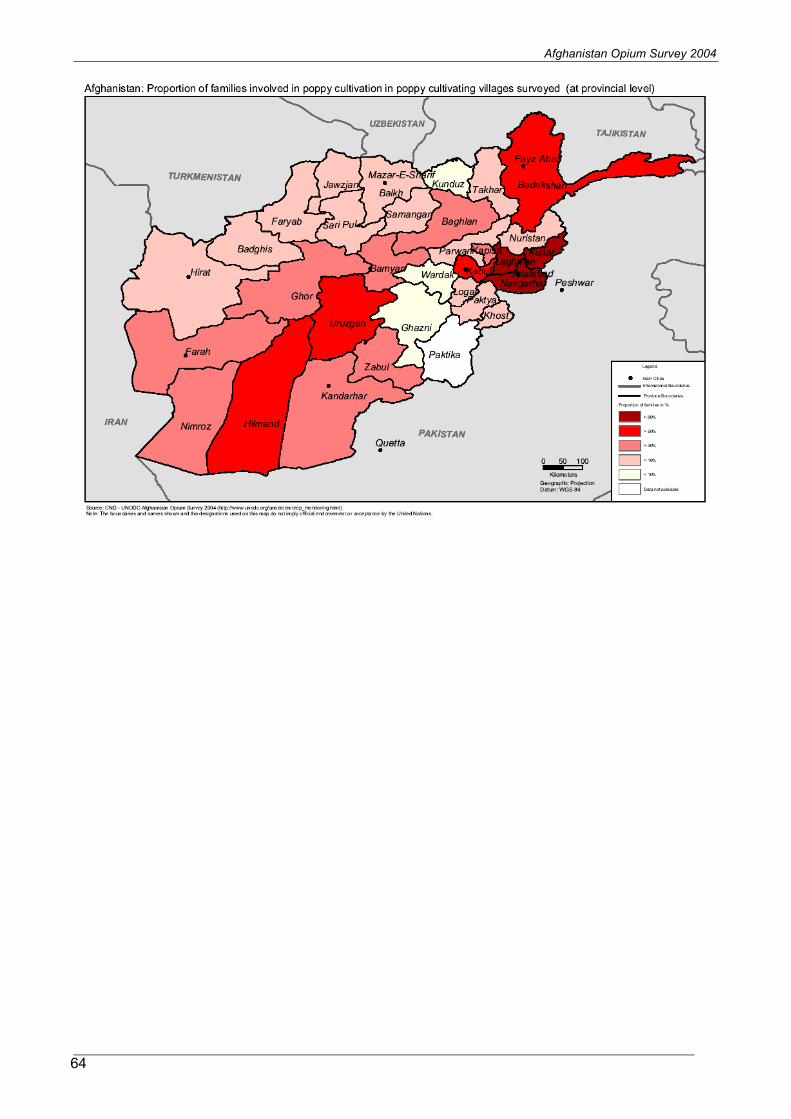
Afghanistan Opium Survey 2004
64
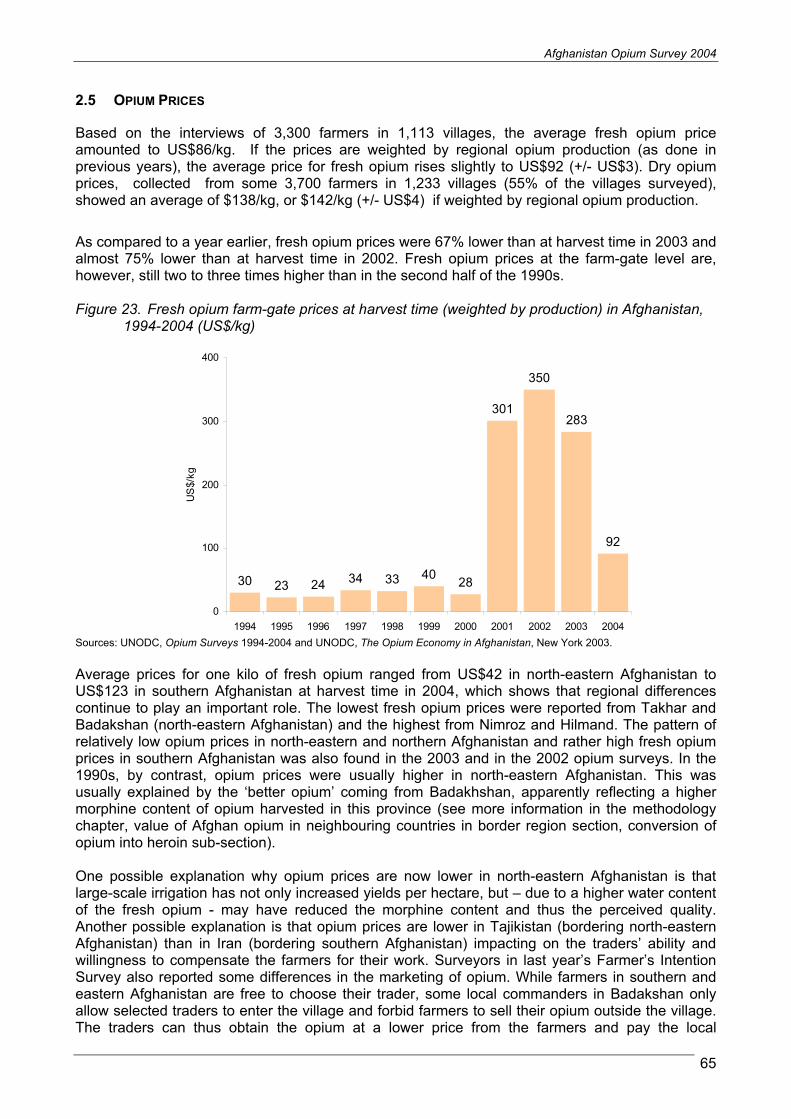
Afghanistan Opium Survey 2004
65
2.5 OPIUM PRICES
Based on the interviews of 3,300 farmers in 1,113 villages, the average fresh opium price amounted to US$86/kg. If the prices are weighted by regional opium production (as done in previous years), the average price for fresh opium rises slightly to US$92 (+/- US$3). Dry opium prices, collected from some 3,700 farmers in 1,233 villages (55% of the villages surveyed), showed an average of $138/kg, or $142/kg (+/- US$4) if weighted by regional opium production.
As compared to a year earlier, fresh opium prices were 67% lower than at harvest time in 2003 and almost 75% lower than at harvest time in 2002. Fresh opium prices at the farm-gate level are, however, still two to three times higher than in the second half of the 1990s.
Figure 23. Fresh opium farm-gate prices at harvest time (weighted by production) in Afghanistan, 1994-2004 (US$/kg)
30 23 2434 33 40
28
301
350
283
92
0
100
200
300
400
1994 1995 1996 1997 1998 1999 2000 2001 2002 2003 2004
US
$/k
g
Sources: UNODC, Opium Surveys 1994-2004 and UNODC, The Opium Economy in Afghanistan, New York 2003.
Average prices for one kilo of fresh opium ranged from US$42 in north-eastern Afghanistan to US$123 in southern Afghanistan at harvest time in 2004, which shows that regional differences continue to play an important role. The lowest fresh opium prices were reported from Takhar and Badakshan (north-eastern Afghanistan) and the highest from Nimroz and Hilmand. The pattern of relatively low opium prices in north-eastern and northern Afghanistan and rather high fresh opium prices in southern Afghanistan was also found in the 2003 and in the 2002 opium surveys. In the 1990s, by contrast, opium prices were usually higher in north-eastern Afghanistan. This was usually explained by the ‘better opium’ coming from Badakhshan, apparently reflecting a higher morphine content of opium harvested in this province (see more information in the methodology chapter, value of Afghan opium in neighbouring countries in border region section, conversion of opium into heroin sub-section).
One possible explanation why opium prices are now lower in north-eastern Afghanistan is that large-scale irrigation has not only increased yields per hectare, but – due to a higher water content of the fresh opium - may have reduced the morphine content and thus the perceived quality. Another possible explanation is that opium prices are lower in Tajikistan (bordering north-eastern Afghanistan) than in Iran (bordering southern Afghanistan) impacting on the traders’ ability and willingness to compensate the farmers for their work. Surveyors in last year’s Farmer’s Intention Survey also reported some differences in the marketing of opium. While farmers in southern and eastern Afghanistan are free to choose their trader, some local commanders in Badakshan only allow selected traders to enter the village and forbid farmers to sell their opium outside the village. The traders can thus obtain the opium at a lower price from the farmers and pay the local

Afghanistan Opium Survey 2004
66
commanders, in return, some money for this privilege. In most other parts of Afghanistan, the farmers pay some money to the local commanders, usually around 10% of their income (going up to 40% in some districts; in some cases, the payment is also affected in kind, i.e. in opium). Finally, growth in opium production over the last few years was much more pronounced in north-eastern and northern Afghanistan than in the rest of the country, thus contributing to strongly falling prices in north-eastern and northern Afghanistan.
Dry opium prices ranged from, on average, US$65 in north-eastern Afghanistan to, on average, US$192 per kg in eastern Afghanistan. Farmers reported the lowest prices for dry opium from Takhar (US$52), Badakshan (US$80), Jawzan (87), Balkh (88) and Samangan (US$88), i.e. from provinces located in north-eastern and northern Afghanistan. The highest prices were reported from Kabul (US$285), Ghazni (US$236), Nangarhar (US$224) and Nuristan (US$212), i.e. provinces located mainly in central and eastern Afghanistan. In southern Afghanistan dry opium prices fluctuated around US$150 per kilogram, slightly above the national average.
Table 19: Opium prices in Afghanistan in US$ per kilogram at harvest time in 2004 – regional breakdown
Region
Averagedate
of price collection
(month/day)
Average offresh
opiumpricesin US$
ConfidenceInterval
( = 0.05) in US$
Average of dry
opiumpricesin US$
Confidenceinterval
( = 0.05) in US$
North-Eastern (Badakhshan, Takhar)
27-Jun 42 +/- 2.3 65 +/- 3.8
Northern (Bamyan, Jawzjan, Sari Pul, Baghlan, Faryab, Balkh, Samangan, Badghis, Kunduz)
26-May 66 +/- 1.4 109 +/- 3.3
Central (Parwan, Paktya, Wardak, Khost, Kabul, Logar)
26-May 97 +/- 3.8 133 +/- 9.8
Southern (Hilmand, Uruzgan, Kandahar, Zabul, Ghazni, Paktika)
13-May 123 +/- 2.8 150 +/- 2.9
Western (Ghor, Hirat, Farh, Nimroz)
16-May 106 +/- 2.8 158 +/- 4.4
Eastern (Nangarhar, Kunar, Laghman, Nuristan, Kapisa)
26-Apr 94 +/- 2.9 192 +/- 5.7
Unweighted average 21-May 86 +/- .8 138 +/- 2.7 National average price weighted by production
92 +/- 2.5 142 +/- 3.8
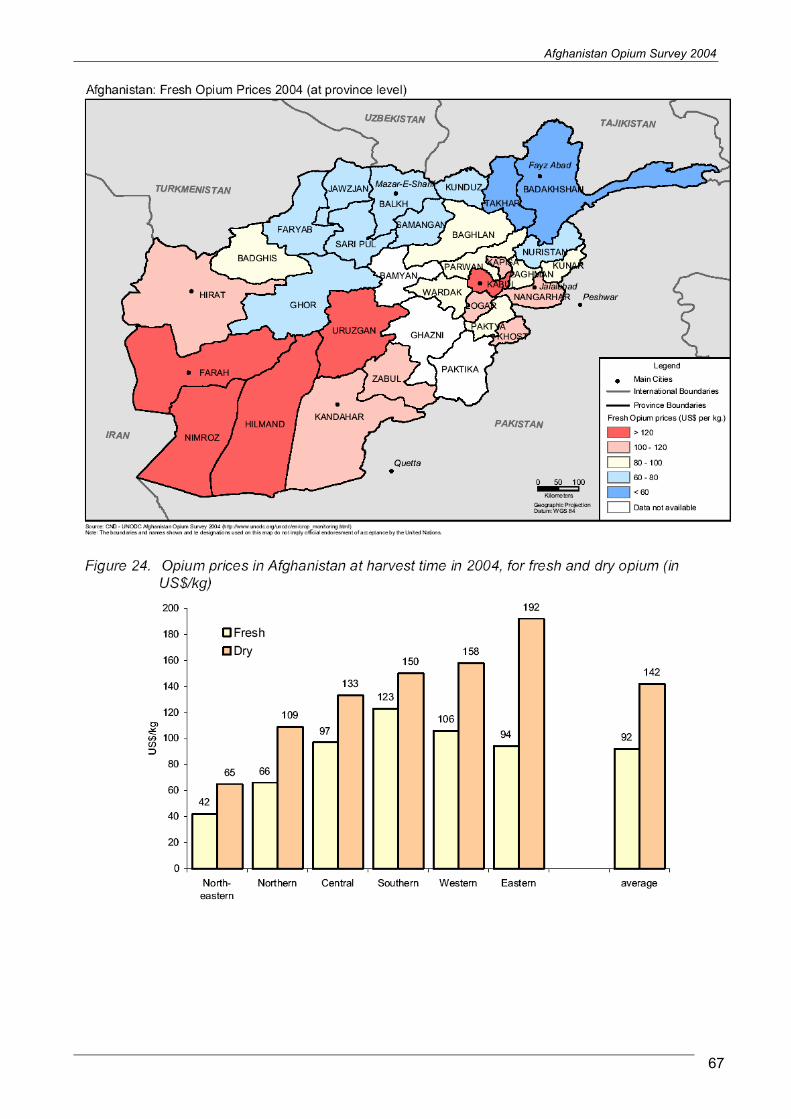
Afghanistan Opium Survey 2004
67
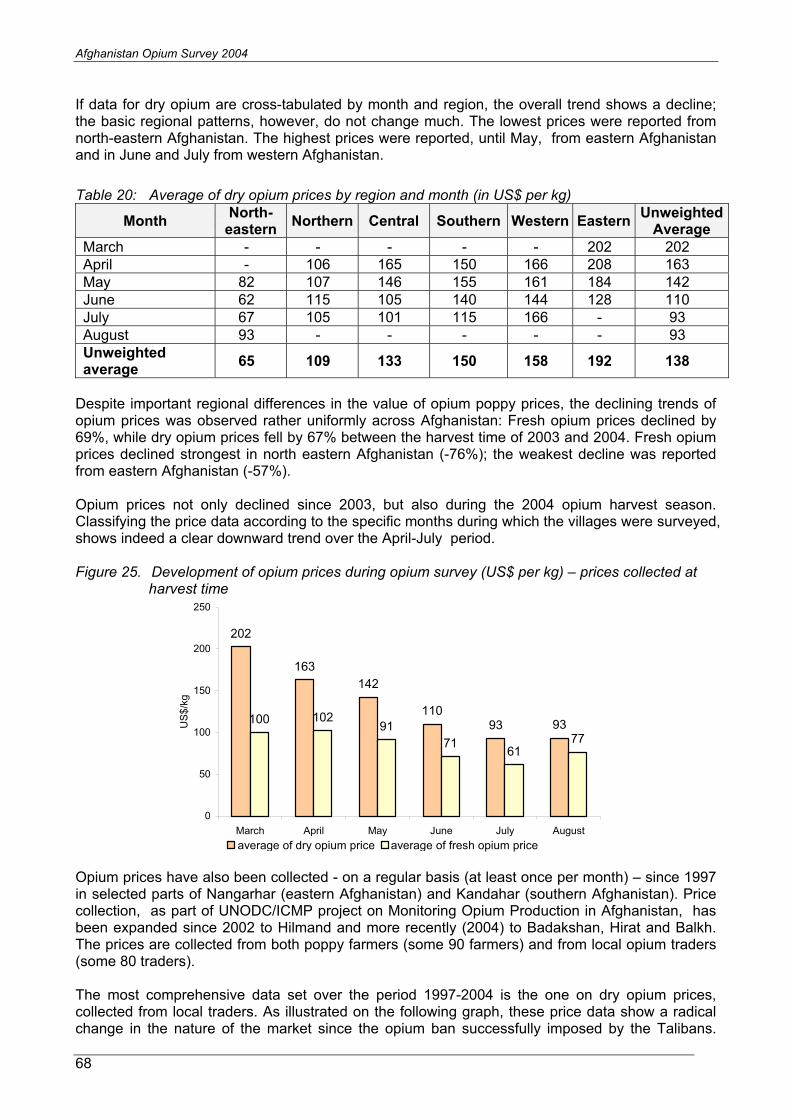
Afghanistan Opium Survey 2004
68
If data for dry opium are cross-tabulated by month and region, the overall trend shows a decline; the basic regional patterns, however, do not change much. The lowest prices were reported from north-eastern Afghanistan. The highest prices were reported, until May, from eastern Afghanistan and in June and July from western Afghanistan.
Table 20: Average of dry opium prices by region and month (in US$ per kg)
MonthNorth-
easternNorthern Central Southern Western Eastern
Unweighted Average
March - - - - - 202 202 April - 106 165 150 166 208 163 May 82 107 146 155 161 184 142 June 62 115 105 140 144 128 110 July 67 105 101 115 166 - 93 August 93 - - - - - 93 Unweighted average
65 109 133 150 158 192 138
Despite important regional differences in the value of opium poppy prices, the declining trends of opium prices was observed rather uniformly across Afghanistan: Fresh opium prices declined by 69%, while dry opium prices fell by 67% between the harvest time of 2003 and 2004. Fresh opium prices declined strongest in north eastern Afghanistan (-76%); the weakest decline was reported from eastern Afghanistan (-57%).
Opium prices not only declined since 2003, but also during the 2004 opium harvest season. Classifying the price data according to the specific months during which the villages were surveyed, shows indeed a clear downward trend over the April-July period.
Figure 25. Development of opium prices during opium survey (US$ per kg) – prices collected at harvest time
202
163
142
11093 93100 102
91
7161
77
0
50
100
150
200
250
March April May June July August
US
$/k
g
average of dry opium price average of fresh opium price
Opium prices have also been collected - on a regular basis (at least once per month) – since 1997 in selected parts of Nangarhar (eastern Afghanistan) and Kandahar (southern Afghanistan). Price collection, as part of UNODC/ICMP project on Monitoring Opium Production in Afghanistan, has been expanded since 2002 to Hilmand and more recently (2004) to Badakshan, Hirat and Balkh. The prices are collected from both poppy farmers (some 90 farmers) and from local opium traders (some 80 traders).
The most comprehensive data set over the period 1997-2004 is the one on dry opium prices, collected from local traders. As illustrated on the following graph, these price data show a radical change in the nature of the market since the opium ban successfully imposed by the Talibans.

70
0
10
0
95
57
7
78
14
1
17
6
0
10
0
20
0
30
0
40
0
50
0
60
0
70
0
Ma
r-
97
Ju
n-
97
Se
p-
97
De
c-
97
Ma
r-
98
Ju
n-
98
Se
p-
98
De
c-
98
Ma
r-
99
Ju
n-
99
Se
p-
99
De
c-
99
Ma
r-
00
Ju
n-
00
Se
p-
00
De
c-
00
Ma
r-
01
Ju
n-
01
Se
p-
01
De
c-
01
Ma
r-
02
Ju
n-
02
Se
p-
02
De
c-
02
Ma
r-
03
Ju
n-
03
Se
p-
03
De
c-
03
Ma
r-
04
Ju
n-
04
Se
p-
04
US$/kg
Na
ng
arh
ar
(ea
ste
rn A
fgh
an
ista
n)
Ka
nd
ah
ar
(so
uth
ern
Afg
ha
nis
tan
)u
nw
eig
hte
d a
ve
rag
e
Afg
ha
nis
tan
, p
ric
es
of
dry
op
ium
in
Na
ng
arh
ar
an
d K
an
da
ha
r c
oll
ec
ted
fro
m T
rad
ers
, U
S$
/kg
, M
arc
h 1
99
7 -
Se
pte
mb
er
20
04
69

Afghanistan Opium Survey 2004
70
Although there is no clear and documented model to account for the behaviour of that market since then, there are convincing indications that it has become quite speculative in nature. For instance, prices increased more than ten-fold in 2000/01, but dropped suddenly in the week after September 11, probably reflecting large-scale shifts of opium stocks to neighbouring countries; prices increased again substantially between October 2001 and January 2003, possibly because empty stocks in Afghanistan were re-filled and both farmers and traders feared eradication efforts. Given good opium harvests in 2002, 2003 and 2004 (the second largest in Afghanistan’s history), it is plausible that what would have essentially been a speculative bubble burst and opium prices fell by some 80% between January 2003 and July 2004. At the time of writing, prices were increasing again (August and September). Announcements of plans for large scale eradication next year may have been one of the factors contributing to that renewed increase. As of September 2004, opium prices were still some 70% lower than in January 2003 but still substantially higher than in the late 1990s.
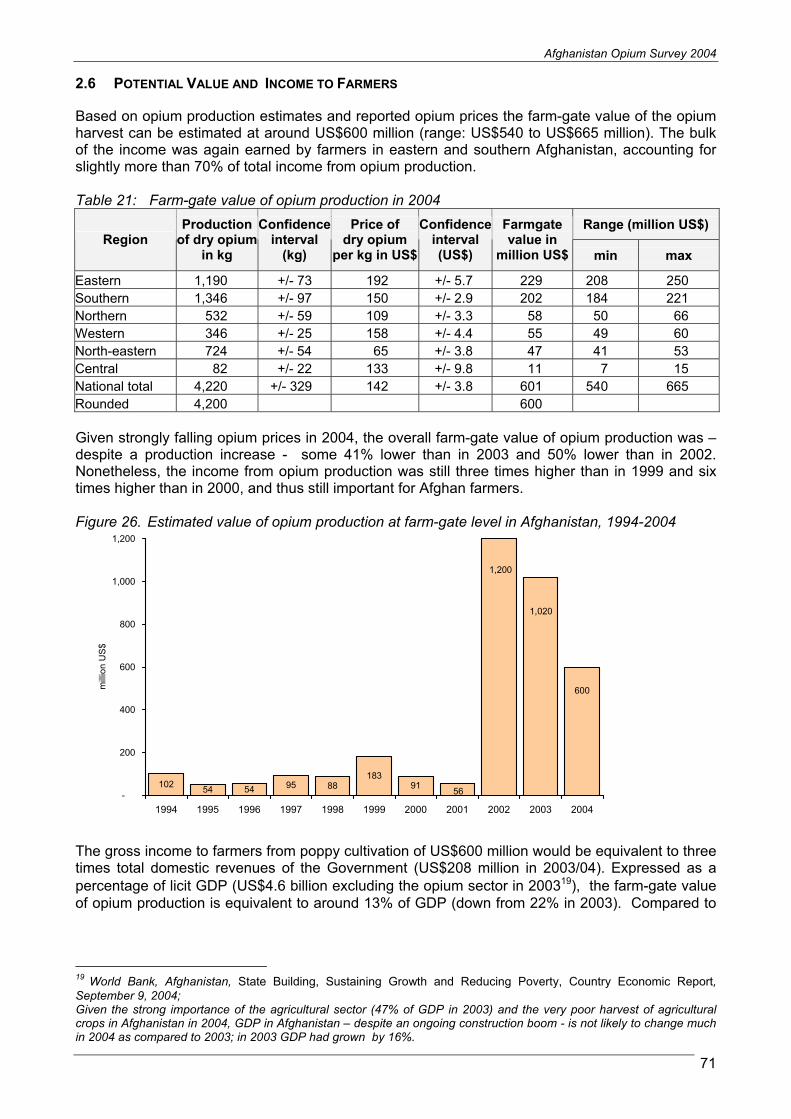
Afghanistan Opium Survey 2004
71
2.6 POTENTIAL VALUE AND INCOME TO FARMERS
Based on opium production estimates and reported opium prices the farm-gate value of the opium harvest can be estimated at around US$600 million (range: US$540 to US$665 million). The bulk of the income was again earned by farmers in eastern and southern Afghanistan, accounting for slightly more than 70% of total income from opium production.
Table 21: Farm-gate value of opium production in 2004
Range (million US$) Region
Productionof dry opium
in kg
Confidenceinterval
(kg)
Price of dry opium
per kg in US$
Confidence interval (US$)
Farmgatevalue in
million US$ min max
Eastern 1,190 +/- 73 192 +/- 5.7 229 208 250
Southern 1,346 +/- 97 150 +/- 2.9 202 184 221
Northern 532 +/- 59 109 +/- 3.3 58 50 66
Western 346 +/- 25 158 +/- 4.4 55 49 60
North-eastern 724 +/- 54 65 +/- 3.8 47 41 53
Central 82 +/- 22 133 +/- 9.8 11 7 15
National total 4,220 +/- 329 142 +/- 3.8 601 540 665
Rounded 4,200 600
Given strongly falling opium prices in 2004, the overall farm-gate value of opium production was – despite a production increase - some 41% lower than in 2003 and 50% lower than in 2002. Nonetheless, the income from opium production was still three times higher than in 1999 and six times higher than in 2000, and thus still important for Afghan farmers.
Figure 26. Estimated value of opium production at farm-gate level in Afghanistan, 1994-2004
The gross income to farmers from poppy cultivation of US$600 million would be equivalent to three times total domestic revenues of the Government (US$208 million in 2003/04). Expressed as a percentage of licit GDP (US$4.6 billion excluding the opium sector in 200319), the farm-gate value of opium production is equivalent to around 13% of GDP (down from 22% in 2003). Compared to
19
World Bank, Afghanistan, State Building, Sustaining Growth and Reducing Poverty, Country Economic Report,September 9, 2004; Given the strong importance of the agricultural sector (47% of GDP in 2003) and the very poor harvest of agricultural crops in Afghanistan in 2004, GDP in Afghanistan – despite an ongoing construction boom - is not likely to change much in 2004 as compared to 2003; in 2003 GDP had grown by 16%.
10254 54 95 88
18391
600
1,020
56
1,200
-
200
400
600
800
1,000
1,200
1994 1995 1996 1997 1998 1999 2000 2001 2002 2003 2004
mill
ion
US
$

Afghanistan Opium Survey 2004
72
agriculture20, the farm-gate value of opium production is equivalent to at least 27%21 of the value added of the licit agricultural sector (down from 46% in 2003).
Average gross family income per poppy farmer was US$1,700 in 2004, down from US$3,900 a year earlier; average gross per capita income of all family members of poppy farmers declined from around US$600 in 2003 to US$260 in 2004. Thus, per capita gross income from growing poppy declined by 56% in 2004, reflecting the overall reduction of gross income from growing poppy and the rise in the number of poppy farmers. Nonetheless, opium related gross income was with US$260 per head of poppy growing families about 25% above per capita GDP (US$207 in 2003) and about 60% above per capita expenditure of households in rural Afghanistan (US$165 in 2003).22
Table 22: Average family and per capita income of poppy growing families from opium production in 2003 and 2004
2003 2004Gross income in million US$ $1,020 $600 Estimated No. of poppy farmers 264,000 356,000 Average income per poppy farmer $3,864 $1,685 rounded $3,900 $1,700 No. of farmers and members of their families 1,716,000 2,314,000 Per capita income of poppy growing families $594 $259 rounded $600 $260
It must be taken into account that a number of costs (labour, fertilizer, seed, fuel, depreciation for tractors and other agricultural equipment as well as taxes to local commanders and various bribes) would have to be deducted to arrive a net income - and these costs can be important (some 45% of gross income in 2003).23 On the other hand, income from opium accounts only for a proportion of total poppy farmers’ income. UNODC’s Farmers’ Intention Survey found that opium income accounted, on average, for about 62% of total poppy farmers’ income in 2003; the rest was accounted for by income from cereals (14%), labour (11%), livestock (9%), other agricultural products (2%) and other sources (2%). Thus total net income of poppy farmers, including income from other sources, can be estimated to be rather close to (some 10% less than) gross income from opium production.
An issue of particular importance for Afghanistan are agricultural loans, often taken out by farmers to cover the costs of production, including: fertilizer, food for his family, contributions to the local Mullah24, tax for the Mehrab25, ashre26, etc. These loans are common and help support a farmer’s
20
The contribution of the agricultural sector to GDP, excluding opium, was 47% or $2.2 bn in 2003. (World Bank, op.cit., p. 127.)21
Given the strong decline in cereal production and other agricultural crops in 2004, the contribution of the agricultural sector to GDP is likely to fall below the 47% recorded in 2003. 22
World Bank, op.cit., p. 129.23
In the Farmer’s Intention Survey it was found that a poppy farmer in 2003 could reckon with a gross income of $12,700 per hectare if he sold opium at harvest time. The actual gross income of farmers, selling later (and thus at lower prices) and/or at lower prices due to salaam arrangements, was more than 30% less ($8,700 per ha). The overall self-reported net-income of a poppy farmer, cultivating on average 0.45 ha in the sample, amounted to $2,128; the net income for 1 ha under poppy cultivation would thus have been equivalent to $4730, or 54% of gross income. In other words, about half (46%) of gross income was apparently spent by farmers on labour costs, fertilizer, seed, payments to commanders, etc. Payments to local commanders were usually equivalent to around 10%, though going up to 40% of the value of the opium sold in some districts. (UNODC/Govt. of Afghanistan (Counter Narcotics Directorate), FarmersIntention Survey 2003/2004, February 2004.) 24
Local Mullahs (religious leaders) receive support in terms of food and some money to help with the maintenance of the local mosque.
25 A Mehrab is mainly responsible to distributing water rights for field irrigation, and is extremely important in Afghan rural society.
26 Ashre is a traditional agricultural tax paid to local administrators, and is equivalent to approximately 10% of a farmer’s production. Throughout Afghanistan there were reports that local militias pressured farmers to grow opium poppy and pay a similar tax equivalent to 1/10 of the farmer’s production.

Afghanistan Opium Survey 2004
73
family until profits from selling his produce can be realized. The 2003/04 Farmers Intention Survey revealed that 45% of the interviewed farmers intended to take out a loan in 2004. The average amount of such a loan amounted to $700 per farmer in poppy growing regions in 2003. These loans frequently take the form of ‘salaam’ arrangements, i.e. advance sale of agricultural crops, notably of opium, prior to harvest. The ‘salaam price’ which farmers receive, usually amounts to 50%-60% of current opium market prices, as was indicated by interviewers in UNODC’s 2003/04 Farmers’ Intention Survey. This would be equivalent to interest rates of 66%-100% for a period of six to seven months, assuming stable opium prices. Given the strong decline in opium prices in 2004, the potential interest income for traders disappeared while farmers obtained through the salaam arrangements (which they entered into in late 2003), almost the same price for their opium as if they had sold it at market rates in 2004. In other words, while in previous years the existence of salaam arrangements reduced the ‘actual’ farmers’ income from opium, no such reduction was observed for this year’s harvest.
Gross income of poppy cultivation per hectare amounted to US$4,600 (yield of 32.2 kg of dry opium per ha * price of US$142 of dry opium per kg), a decline by 64% from a year earlier. Nonetheless, opium income was still four times higher than in the 1990s or in 2000.
Figure 27. Gross income of poppy cultivation in US$ per hectare
Despite the decline in the income from opium and wheat price increases (around 20% between spring of 2003 and spring of 2004, and ongoing increases in subsequent months27), average gross income from opium production ($4,600 per hectare) was still 12 times higher than gross income from wheat production (around US$390 per hectare of irrigated land; yield of 1,930 kg/ha * price of US$0.2 per kg of wheat).28 If the comparison is based on all land (irrigated and rain-fed), average expected income from a hectare under wheat cultivation has been US$260 in 2004 (yield of 1300 kg/ha * price of US$0.2 per kg); poppy cultivation would have provided an 18 times larger gross income per hectare. 29
27
Retail market prices rose by some 13% in Jalalabad (Nangarhar) between February 2004 and July 2004 or some 28% between June 2003 and July 2004, by around 28% in Kandahar and 36% in Kabul between July 2003 and July 2004, and by around 50% in Mazaar (northern Afghanistan) and Faizabad (north-eastern Afghanistan) between February 2004 and July 2004. (FAO/WFP, Crop and Food Supply Assessment Mission to Afghanistan, 8 September 2004). 28
The comparison with wheat on irrigated land may be appropriate as the bulk (92%) of opium poppy, nowadays, takes place on irrigated land. 29
Even based on (most probably under-estimated) farmers’ perceptions of anticipated fresh opium yields and reported fresh opium prices, the expected gross income from a hectare under cultivation of opium poppy would still have amounted to some $2,300 per hectare, 9 times the income from a hectare under wheat production or 6 times the income from an irrigated hectare under wheat production.
1000 1,100
7,400
16,200
12,700
4,600
0
2000
4000
6000
8000
10000
12000
14000
16000
18000
1995 2000 2001 2002 2003 2004
US
$
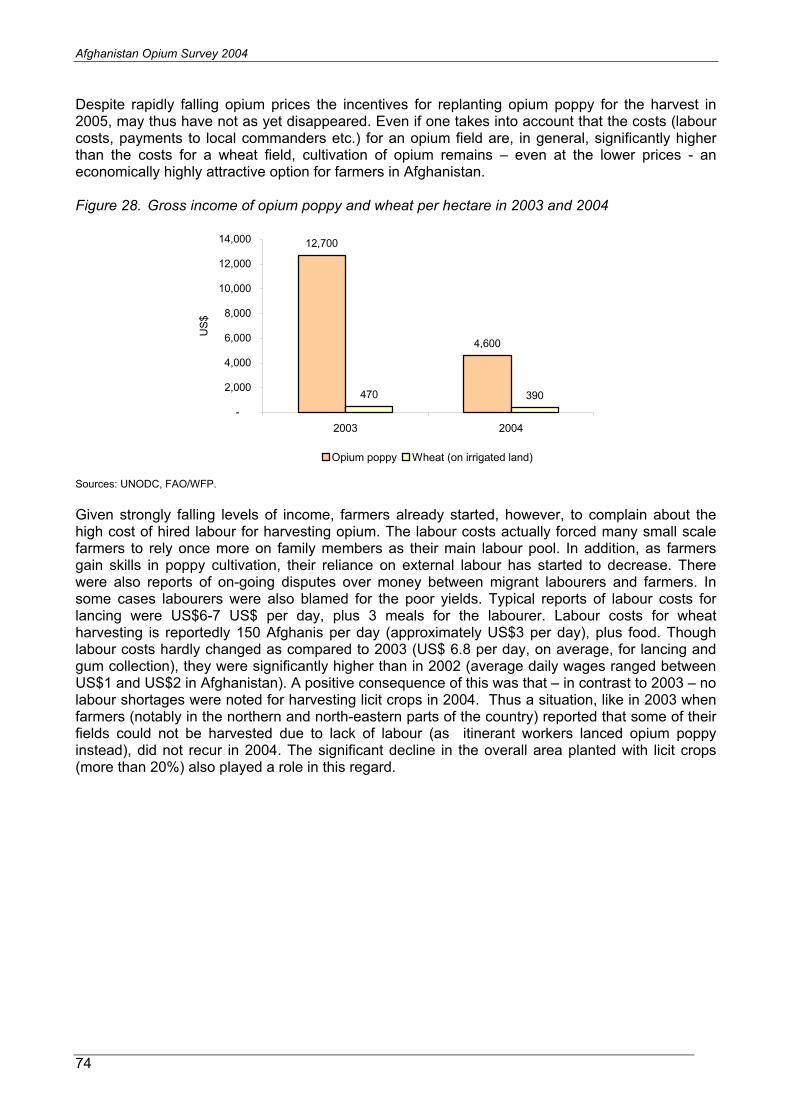
Afghanistan Opium Survey 2004
74
Despite rapidly falling opium prices the incentives for replanting opium poppy for the harvest in 2005, may thus have not as yet disappeared. Even if one takes into account that the costs (labour costs, payments to local commanders etc.) for an opium field are, in general, significantly higher than the costs for a wheat field, cultivation of opium remains – even at the lower prices - an economically highly attractive option for farmers in Afghanistan.
Figure 28. Gross income of opium poppy and wheat per hectare in 2003 and 2004
Sources: UNODC, FAO/WFP.
Given strongly falling levels of income, farmers already started, however, to complain about the high cost of hired labour for harvesting opium. The labour costs actually forced many small scale farmers to rely once more on family members as their main labour pool. In addition, as farmers gain skills in poppy cultivation, their reliance on external labour has started to decrease. There were also reports of on-going disputes over money between migrant labourers and farmers. In some cases labourers were also blamed for the poor yields. Typical reports of labour costs for lancing were US$6-7 US$ per day, plus 3 meals for the labourer. Labour costs for wheat harvesting is reportedly 150 Afghanis per day (approximately US$3 per day), plus food. Though labour costs hardly changed as compared to 2003 (US$ 6.8 per day, on average, for lancing and gum collection), they were significantly higher than in 2002 (average daily wages ranged between US$1 and US$2 in Afghanistan). A positive consequence of this was that – in contrast to 2003 – no labour shortages were noted for harvesting licit crops in 2004. Thus a situation, like in 2003 when farmers (notably in the northern and north-eastern parts of the country) reported that some of their fields could not be harvested due to lack of labour (as itinerant workers lanced opium poppy instead), did not recur in 2004. The significant decline in the overall area planted with licit crops (more than 20%) also played a role in this regard.
12,700
4,600
470 390
-
2,000
4,000
6,000
8,000
10,000
12,000
14,000
2003 2004
US
$
Opium poppy Wheat (on irrigated land)

Afghanistan Opium Survey 2004
75
2.7 POTENTIAL VALUE AND INCOME TO THE AFGHAN ECONOMY
The calculation of overall income from opium production is an important but difficult exercise. The potential national income from opium production is based on the value of opiates exports (opium, morphine and heroin) at prices in the border areas of neighbouring countries. This approach is based on the observation that Afghan traffickers are heavily involved in shipping opiates across the borders, but that from there onwards traffickers from neighbouring countries usually take over the drug shipments. The methodology for calculating the overall gross income estimates from opium production for the Afghan economy was, for the first time, developed in UNODC’s report on TheOpium Economy in Afghanistan – An International Problem (New York 2003). The same methodology was also used in the present report. Estimates of the overall size of Afghanistan’s opium industry are thus now available for the years 2000, 2002, 2003 and 2004. A number of variables (production, extent and degree of involvement of Afghan traffickers in shipping opiates abroad, proportion of the transformation of opium into heroin & morphine in Afghanistan, conversion rate of opium into heroin, prices in main export markets etc.) have been taken into account to arrive at an estimate and the corresponding ranges30. (Detailed explanations of the calculations are found in the methodology section of this report.) It should be noted that the results reflect the prices at the time of the study (April/May 2004). The results are thus preliminary in nature; the overall value of the gross income from opium production could still change if prices in neighbouring countries were to change in subsequent months.
Keeping these caveats in mind, the potential value of Afghanistan’s 2004 opium harvest was calculated to have reached about US$2.8 billion (range: US$2.4 bn – US$3.2 bn), compared with US$2.5bn in 2002 and US$2.3 bn in 2003.
Figure 29. Potential income from opium production, 2000-2004 (gross income for farmers and Afghan traffickers)
Sources: UNODC, The Opium Economy in Afghanistan, UNODC, Afghanistan Opium Survey 2003 and 2004.
The potential value added31 (gross income of farmers and traffickers) of the Afghan opium sector was some 20% higher in 2004 than in 2003. Expressed as a percentage of licit GDP (US$4.6 bn in 2003)32, the overall potential value-added of the opium sector for Afghanistan in 2004 is estimated
30
The number of variables used, taking ranges of each of these variables into consideration, results in an overall rather large confidence interval in the final result ($US2.4 bn to US$ 3.2 bn) 31
Given the fact that the material expenditures (seeds, fertilizers, chemicals, depreciation of laboratory equipment) for the opium and heroin production account for just a negligible amount as compared to the overall export value of Afghan opiates, the value-added of the Afghan opiates industry can be equalled to the gross income of Afghan farmers and traffickers. 32
World Bank, Afghanistan State Building, Sustaining Growth, and Reducing Poverty – A country Economic Report, September 9, 2004. Given the strong decline of agricultural output in 2004 and the overall importance of the agricultural sector for the Afghan economy (47% of GDP in 2003), GDP for the year 2004 – despite a construction boom in Kabul
2.5
2.3
2.8
0.9
-
0.5
1.0
1.5
2.0
2.5
3.0
2000 2002 2003 2004
billio
n U
S$

Afghanistan Opium Survey 2004
76
to have been equivalent to some 60% of licit GDP or some 38% of overall GDP including the opium sector. The overall income thus exceeds by far the gross income from opium generated by Afghan farmers (US$0.6 bn or some 13% of licit GDP).
The results suggest that the main beneficiaries from opium production in Afghanistan were the traffickers. While overall opium income for farmers in Afghanistan declined in 2004 as a result of strongly falling opium prices (some 67%), such declines were not observed for heroin or morphine in the border regions with neighbouring countries, at least not until April/May 2004, the latest period for which comprehensive data is available at the time of writing. (For Iran, data is available until July 2004; but this data also fails to show any decline in heroin or morphine prices). As a consequence, potential income of traffickers could have increased. This is the case even if one takes into account that traffickers lost strongly in 2004 on their accumulated opium stocks (due to falling opium prices in Afghanistan) and did not benefit from ‘salaam’ arrangements with farmers this year33. However, traffickers are likely to gain substantial amounts from current trafficking activities - as long as current opiate prices do not fall in neighbouring countries. Potential current gross income of traffickers, including income from clandestine laboratories operators, is then likely to rise from around US$1.3 bn in 2003 to some US$2.2 bn in 2004 (range: US$1.5 bn to US$2.7 bn)34 as traffickers benefit from the lower opium prices they pay to farmers and from the higher volumes of opiates ready to be smuggled to markets abroad. Traffickers are thus likely to increase their share in the Afghan opium economy from around 56% in 2003 to some 79% in 2004.
The calculations, as mentioned above, are based on opium, morphine and heroin prices in April/May 2004. If opiate prices in neighbouring countries were to decline, the export value of Afghanistan’s opium production would fall proportionately and the income of traffickers would fall even more strongly. There have already been some declines in opium prices in Pakistan (Peshawar, Quetta) in the border regions with Afghanistan (-20% as compared to a year earlier) and in Iran (Sistan Baluchistan: -20% in April/May as compared to a year earlier). But heroin and morphine prices remained largely unchanged as compared to a year earlier, which is one of the main reasons for the strong increase of potential gross income of Afghan traffickers.
The annual Opium Survey is designed to collect data on cultivation, production and prices, but it does not provide information on trafficking activities. Thus, only some tentative explanations for this phenomenon can be offered at this point in time.
One possible explanation could be a time-lag between opium production and the time of heroin exports. The 2004 opium production may take a few months until it arrives in neighbouring countries in the form of morphine and heroin. As long as it does not physically arrive there, the markets fail to react and heroin prices remain high. In the case of the opium poppy ban in 2001, for instance, it took about six months until the heroin markets in neighbouring countries started to react. The hypothesis thus assumes that the information exchange between what is happening in Afghanistan (opium production) and the markets in neighbouring countries is very slow and traders find it different to anticipate events. Whether this is true can only be verified towards the end of the year. If this explanation is correct, actual traffickers income could be lower than the potential income calculated on the basis of prices in April/May 2004; lower heroin prices, however, are likely to increase heroin consumption.
Another hypothesis to explain this phenomenon may be linked to the destruction of heroin producing facilities in Afghanistan. In 2003, Afghan authorities reported the destruction of 120
and some other cities – is likely to have remained largely stable compared with 2003. The calculated GDP for the year 2003 should thus be a reasonably good proxy for GDP in 2004 which is still unknown at the time of writing this report. 33
The prices traffickers paid to farmers in advance for the 2004 harvest turned out to be hardly any lower than the opium prices at harvest time, resulting in a loss of all anticipated interest income on lent funds (usually 66%-100% of the amount lent over a period of six to seven months). (UNODC, Afghanistan Farmers Intention Survey 2003/2004, February 2004, p. 41.) 34
Traffickers gross income: export value in border areas of neighbouring countries of $2.8 bn ($2.4 – $3.2 bn) less farmers’ gross income of $0.6 bn ($0.5-$0.7bn).

Afghanistan Opium Survey 2004
77
‘fixed laboratories’ and of 30 ‘movable’ laboratories, notably in Hilmand, Nangarhar (mainly in Shinwar district bordering Pakistan) and Badakshan.35 Additional raids, dismantling some major laboratories, also took place in 2004. It can be assumed that these raids reduced the heroin manufacturing capacity within Afghanistan, or at least prevented it from rising as fast as in previous years, thus limiting monthly heroin output. Without any significant growth in Afghan heroin production, there would have been no reason for heroin prices to decline in neighbouring countries.
A few additional factors could have played a role in this scenario. There are indications that demand abroad is increasingly geared towards heroin, rather than towards the more bulky opium. (Seizures in neighbouring countries were increasingly of heroin and morphine instead of opium in recent years). This could be an indication that large volumes of opium are more difficult to sell abroad and that traffickers would try, instead, to have the opium transformed into morphine or heroin, even taking temporary increases of stocks into account. Under such conditions, the willingness of traders to purchase increasing amounts of opium from farmers - at high prices – is fading. This could be also seen against the background that traders apparently again built up stocks over 2002 and 2003 (after their previous stocks were largely exhausted as a consequence of the poppy ban in 2001), speculating on the implementation of the new poppy ban, announced by the new authorities in Kabul. With prices falling, such stocks did not prove to be a good investment. Traders would thus be reluctant to buy new opium unless the price of the new opium was significantly lower than a year earlier, contributing to the general fall of opium prices within Afghanistan.
Thus limitations of heroin manufacturing capacity within Afghanistan in combination with already existing stocks and an involuntary increase in stocks could be part of an alternative explanation for strongly falling opium prices within Afghanistan and stable morphine & heroin prices abroad.
Time will tell whether these hypotheses are valid. Both potential outcomes (‘time lag’ and thus lower income for traffickers but strong increases in heroin consumption or ‘maintenance of high opiate prices in neighbouring countries due to the destruction of heroin laboratories’ leading to high income for traffickers but no significant increase in heroin consumption) are, however, not particularly positive for the international community at large.
2.8 ERADICATION
The opium survey neither monitored the activities, nor assessed the results of the eradication campaign launched by the Afghan authorities during the opium growing season. However, as in previous years, the survey’s methodology was designed to capture what was left for harvest in the fields. Results presented in this report should therefore be interpreted as post-eradication and reflect the net amount of opium poppy harvested this year in Afghanistan. Government figures on the extent of eradication in 2004 were not available at the time of writing.
35
Govt. of Afghanistan, reply to UNODC’s Annual Reports Questionnaire.
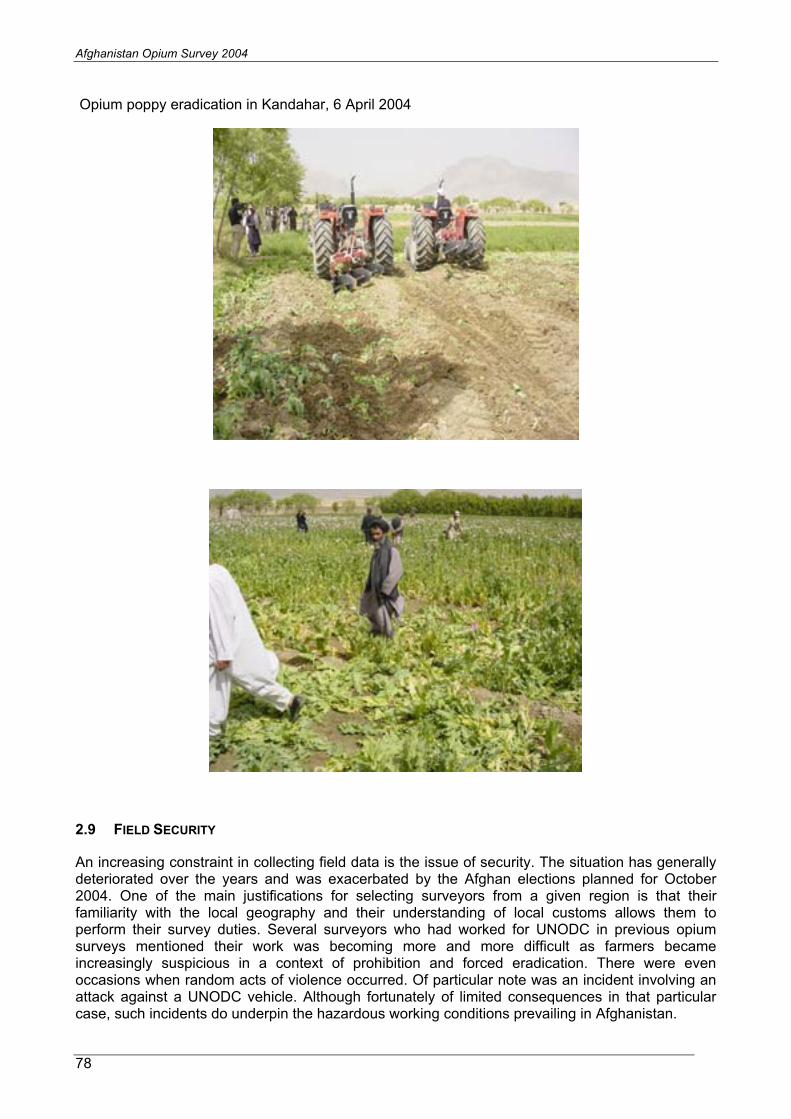
Afghanistan Opium Survey 2004
78
Opium poppy eradication in Kandahar, 6 April 2004
2.9 FIELD SECURITY
An increasing constraint in collecting field data is the issue of security. The situation has generally deteriorated over the years and was exacerbated by the Afghan elections planned for October 2004. One of the main justifications for selecting surveyors from a given region is that their familiarity with the local geography and their understanding of local customs allows them to perform their survey duties. Several surveyors who had worked for UNODC in previous opium surveys mentioned their work was becoming more and more difficult as farmers became increasingly suspicious in a context of prohibition and forced eradication. There were even occasions when random acts of violence occurred. Of particular note was an incident involving an attack against a UNODC vehicle. Although fortunately of limited consequences in that particular case, such incidents do underpin the hazardous working conditions prevailing in Afghanistan.
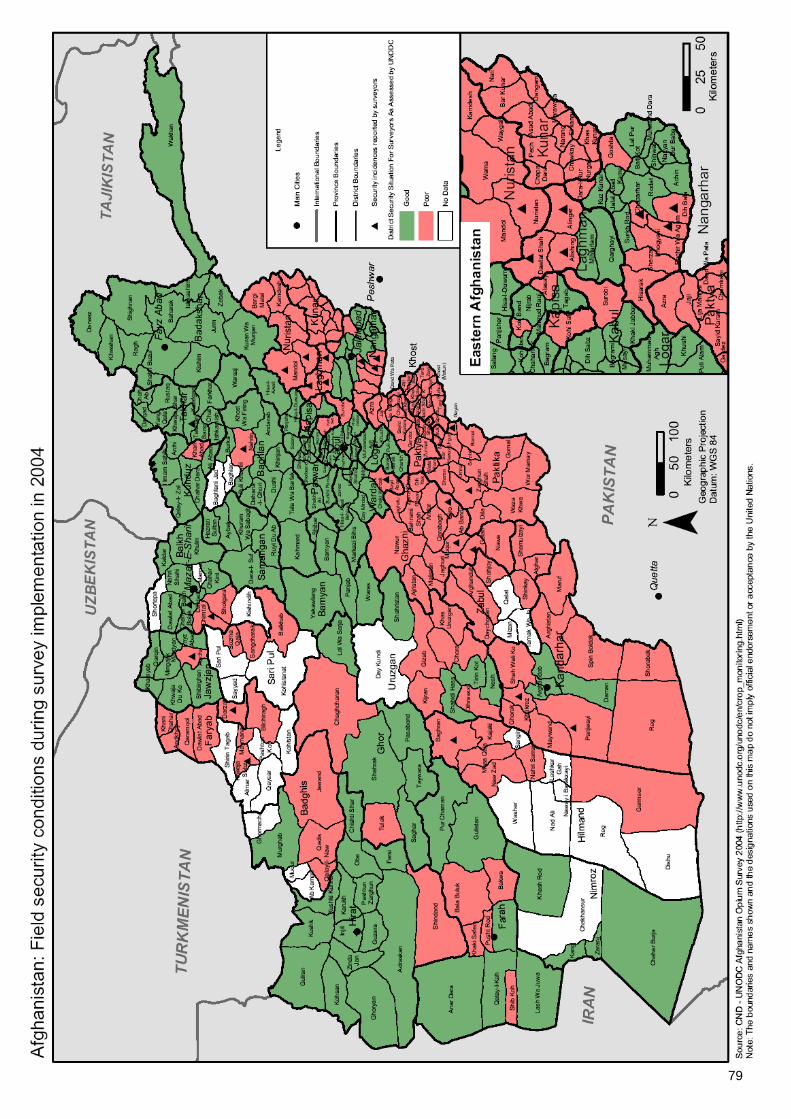
79
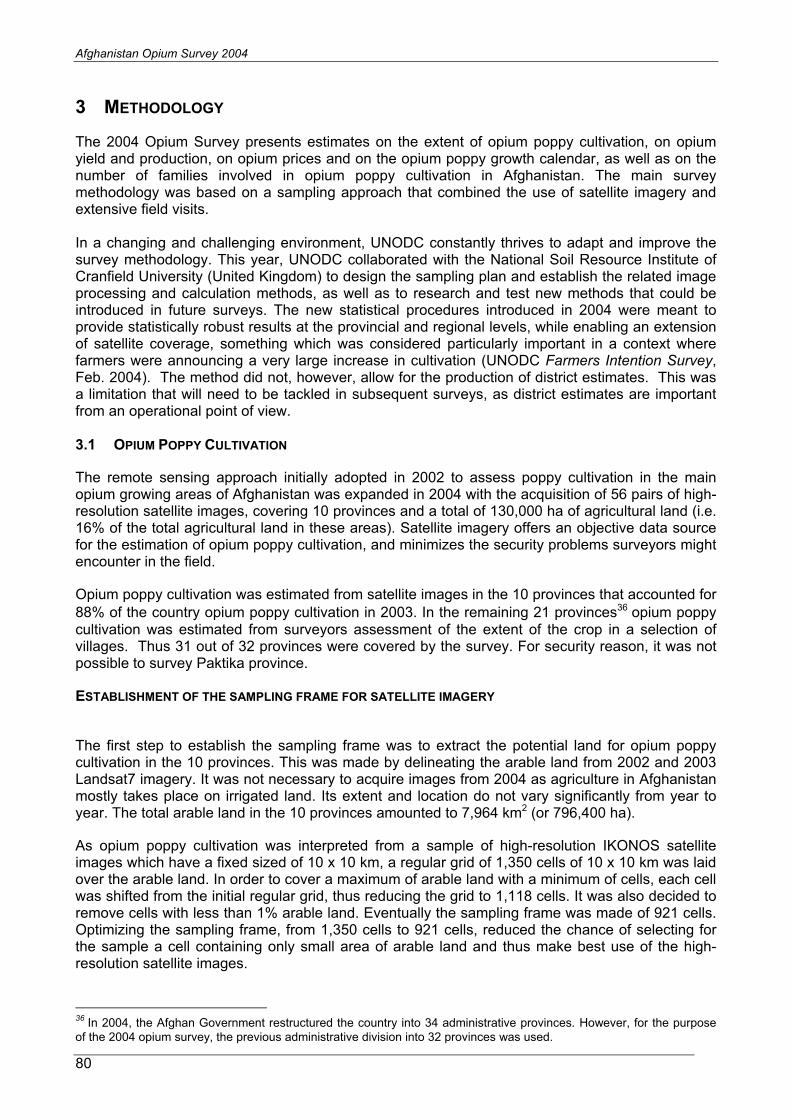
Afghanistan Opium Survey 2004
80
3 METHODOLOGY
The 2004 Opium Survey presents estimates on the extent of opium poppy cultivation, on opium yield and production, on opium prices and on the opium poppy growth calendar, as well as on the number of families involved in opium poppy cultivation in Afghanistan. The main survey methodology was based on a sampling approach that combined the use of satellite imagery and extensive field visits.
In a changing and challenging environment, UNODC constantly thrives to adapt and improve the survey methodology. This year, UNODC collaborated with the National Soil Resource Institute of Cranfield University (United Kingdom) to design the sampling plan and establish the related image processing and calculation methods, as well as to research and test new methods that could be introduced in future surveys. The new statistical procedures introduced in 2004 were meant to provide statistically robust results at the provincial and regional levels, while enabling an extension of satellite coverage, something which was considered particularly important in a context where farmers were announcing a very large increase in cultivation (UNODC Farmers Intention Survey,Feb. 2004). The method did not, however, allow for the production of district estimates. This was a limitation that will need to be tackled in subsequent surveys, as district estimates are important from an operational point of view.
3.1 OPIUM POPPY CULTIVATION
The remote sensing approach initially adopted in 2002 to assess poppy cultivation in the main opium growing areas of Afghanistan was expanded in 2004 with the acquisition of 56 pairs of high-resolution satellite images, covering 10 provinces and a total of 130,000 ha of agricultural land (i.e. 16% of the total agricultural land in these areas). Satellite imagery offers an objective data source for the estimation of opium poppy cultivation, and minimizes the security problems surveyors might encounter in the field.
Opium poppy cultivation was estimated from satellite images in the 10 provinces that accounted for 88% of the country opium poppy cultivation in 2003. In the remaining 21 provinces36 opium poppy cultivation was estimated from surveyors assessment of the extent of the crop in a selection of villages. Thus 31 out of 32 provinces were covered by the survey. For security reason, it was not possible to survey Paktika province.
ESTABLISHMENT OF THE SAMPLING FRAME FOR SATELLITE IMAGERY
The first step to establish the sampling frame was to extract the potential land for opium poppy cultivation in the 10 provinces. This was made by delineating the arable land from 2002 and 2003 Landsat7 imagery. It was not necessary to acquire images from 2004 as agriculture in Afghanistan mostly takes place on irrigated land. Its extent and location do not vary significantly from year to year. The total arable land in the 10 provinces amounted to 7,964 km2 (or 796,400 ha).
As opium poppy cultivation was interpreted from a sample of high-resolution IKONOS satellite images which have a fixed sized of 10 x 10 km, a regular grid of 1,350 cells of 10 x 10 km was laid over the arable land. In order to cover a maximum of arable land with a minimum of cells, each cell was shifted from the initial regular grid, thus reducing the grid to 1,118 cells. It was also decided to remove cells with less than 1% arable land. Eventually the sampling frame was made of 921 cells. Optimizing the sampling frame, from 1,350 cells to 921 cells, reduced the chance of selecting for the sample a cell containing only small area of arable land and thus make best use of the high-resolution satellite images.
36
In 2004, the Afghan Government restructured the country into 34 administrative provinces. However, for the purpose of the 2004 opium survey, the previous administrative division into 32 provinces was used.
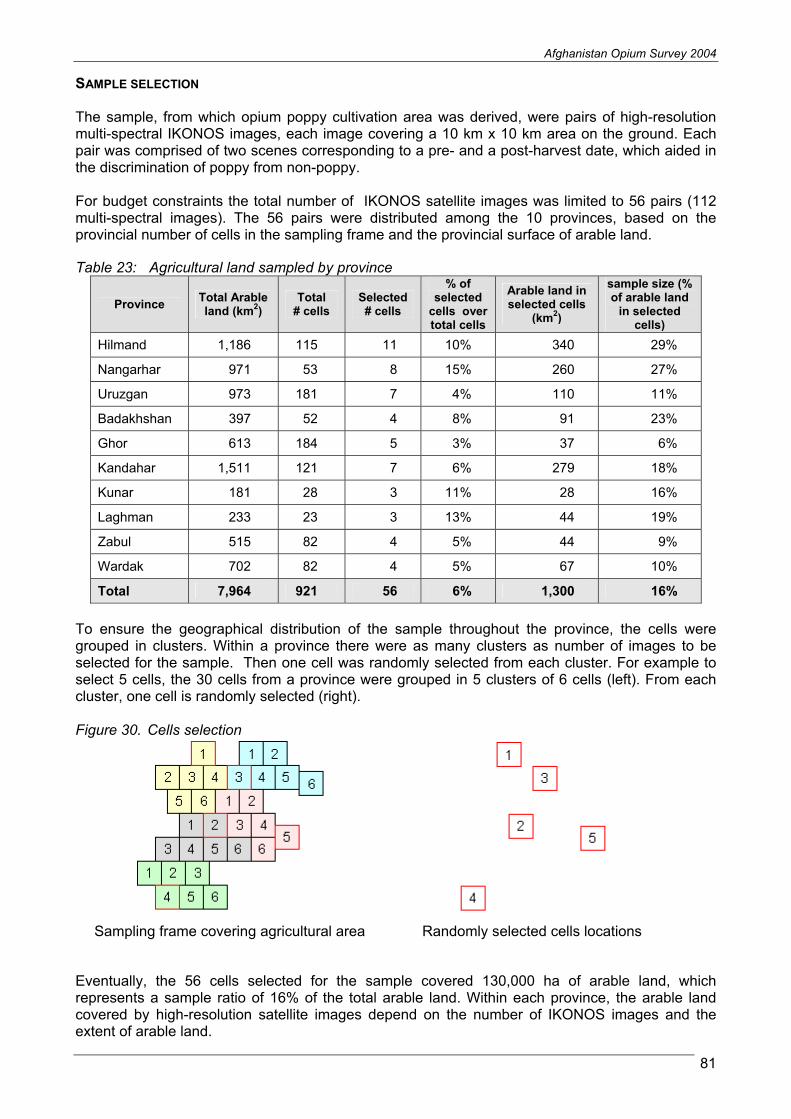
Afghanistan Opium Survey 2004
81
SAMPLE SELECTION
The sample, from which opium poppy cultivation area was derived, were pairs of high-resolution multi-spectral IKONOS images, each image covering a 10 km x 10 km area on the ground. Each pair was comprised of two scenes corresponding to a pre- and a post-harvest date, which aided in the discrimination of poppy from non-poppy.
For budget constraints the total number of IKONOS satellite images was limited to 56 pairs (112 multi-spectral images). The 56 pairs were distributed among the 10 provinces, based on the provincial number of cells in the sampling frame and the provincial surface of arable land.
Table 23: Agricultural land sampled by province
Province Total Arable land (km
2)
Total # cells
Selected # cells
% of selected
cells over total cells
Arable land in selected cells
(km2)
sample size (% of arable land
in selected cells)
Hilmand 1,186 115 11 10% 340 29%
Nangarhar 971 53 8 15% 260 27%
Uruzgan 973 181 7 4% 110 11%
Badakhshan 397 52 4 8% 91 23%
Ghor 613 184 5 3% 37 6%
Kandahar 1,511 121 7 6% 279 18%
Kunar 181 28 3 11% 28 16%
Laghman 233 23 3 13% 44 19%
Zabul 515 82 4 5% 44 9%
Wardak 702 82 4 5% 67 10%
Total 7,964 921 56 6% 1,300 16%
To ensure the geographical distribution of the sample throughout the province, the cells were grouped in clusters. Within a province there were as many clusters as number of images to be selected for the sample. Then one cell was randomly selected from each cluster. For example to select 5 cells, the 30 cells from a province were grouped in 5 clusters of 6 cells (left). From each cluster, one cell is randomly selected (right).
Figure 30. Cells selection
Sampling frame covering agricultural area Randomly selected cells locations
Eventually, the 56 cells selected for the sample covered 130,000 ha of arable land, which represents a sample ratio of 16% of the total arable land. Within each province, the arable land covered by high-resolution satellite images depend on the number of IKONOS images and the extent of arable land.

82
Afghanistan Opium Survey 2004
83
IMAGE PROCESSING STEPS
The image processing steps can be summarized as follows:
Identification of training areas of the various land cover types, in particular poppy and cereals, to be classified from the imagery.
Supervised classification of the land use features.
Logical classification comparing pre- and post-harvest poppy classifications.
Masking out non-agricultural areas.
Applying 3x3 pixel filtering to the classified images to reduce the noise-effect.
Assessing the accuracy of the classification process using segment data
Calculating poppy cultivation in each cell.

Afghanistan Opium Survey 2004
84
Figure 31. Image classification methodology for estimating opium poppy cultivation area

Afghanistan Opium Survey 2004
85
INTERPRETATION OF OPIUM POPPY CULTIVATION FROM SATELLITE IMAGES
To reduce the risk of confusion between opium poppy and cereals fields, two images were acquired over the same ground area: a first image during the main opium growing period, and a second image after the main opium harvest. Figure 32 shows an image pair acquired on two different dates. Phenological features of wheat and poppy plants can be differentiated in these images, and the photos presented in the figure on the next page show the parallel growth cycles for both crops. During the first acquisition there can be some confusion between poppy and wheat, but by the time of the second acquisition the growth and harvest parameters have diverged enough to make feature class separation possible.
The first and second dates images were classified separately using the maximum likelihood algorithm. Opium poppy fields are eventually interpreted as the result of a logical classification technique between the classification of the first date and second date images.
Figure 32. Pre- and post-harvest satellite imagery
Nad-e-Ali, Hilmand (25 April 2004 ) Nad-e-Ali, Hilmand (20 May 2004)
Figure 33. Classification results from pre- and post-harvest imagery

Afghanistan Opium Survey 2004
86
LOGICAL CLASSIFICATION
Once each image has been classified, the classes of the first date image were crossed with the classes of the second date image, pixel by pixel, and their combination resulted in a thematic image revealing opium poppy fields. The look-up table (see Table 24) shows an example of the combination between feature characteristics between the pre- and post-harvest images. This key formed the basis of the logical classification. Segment data help to resolve conflicts in the classification decision logic. The look-up tables are region-specific to adapt to local environmental conditions, image acquisition dates and the poppy calendar.
Table 24: Example of logical classification look-up table (Hilmand Province, Nad-e-Ali district)
Class ( post-harvest)
Green Red Yellow White
Dark brown Poppy Other Cereal Cereal
Red Poppy Other Cereal Cereal
Green Fallow Other Other Fallow
Cla
ss (
pre
-h
arv
est)
White Fallow Other Other Fallow
Prior to extracting the final cultivation area from the classification, the thematic image was simplified using a low-pass mode filter. A mode filter (3x3 window size) is commonly used to remove outliers from a classification, while maintaining the integrity of the classification.
Figure 34. Final classification results
Once the logical classification has been completed, then the area statistics for that cell were input to a province level cultivation estimate.

Afghanistan Opium Survey 2004
87
Figure 35: Poppy and Wheat crop cycles ( Helmand Province , Nad-e-Ali District )
April 16, 2004, Poppy, flowering stage April 16, 2004, Wheat, heading stage
April 27, 2004, Poppy, lancing stage April 27, Wheat, near to maturity stage
May 25, 2004, Poppy, lancing completed May 25, 2004, Wheat, senescing
June 1, 2004, Poppy field ploughed, ready for other (non-poppy) crop
June 1, 2004, Reaped wheat ready to be stacked, and then threshed

Afghanistan Opium Survey 2004
88
AREA ESTIMATION FROM SATELLITE IMAGERY
Ratio estimate formulae were used to estimate poppy cultivation at the province level, using Equation 1:
Equation 1: Estimation of poppy cultivation within each cell
Xxp /
where,p = Average percent poppy cultivation in province x = Total poppy area in each cell X = Total agricultural area in cell
To estimate the total poppy in the province, Equation 2 was used:
Equation 2: Estimation of total poppy cultivation
ANpX̂
where,
X̂ = Total poppy area in province
AN = Total agricultural area (sampling frame) in province
The results for the provinces with more than 5 cells selected, were refined by the bootstrap method with 100,000 iterations. Bootstrapping is recommended when the sample observations have different sizes, which was the case with the total agricultural land differing in each selected cell. Bootstrapping consists of sampling with replacement from the original sample thousands of iterations of the initial sample, made in this case of the total poppy areas of the selected cell of a province. After each iteration, a mean value is estimated and scored. At the end, a distribution of means can be observed, producing a mean estimate and a confidence interval for the mean. Although bootstrapping was statistically more appropriate to estimate opium poppy cultivation from the high-resolution sample, the results did not vary significantly from the direct use of the simple random sampling formulae.
Table 25: Comparison of results from direct extrapolation and bootstrapping
Province Selected # cells
Mean estimate from ratio estimate (ha)
Mean estimate from bootstrapping (ha)
Hilmand 11 29,358 29,353
Nangarhar 8 28,227 28,213
Uruzgan 7 11,219 11,080
Ghor 5 5,024 4,983
Kandahar 7 4,585 4,959
Total 56 78,413 78,588
The smaller sample size did not enable to bootstrap the results of the provinces with less than five cells. For the five provinces concerned, the direct use of the simple random sampling formulae was applied.
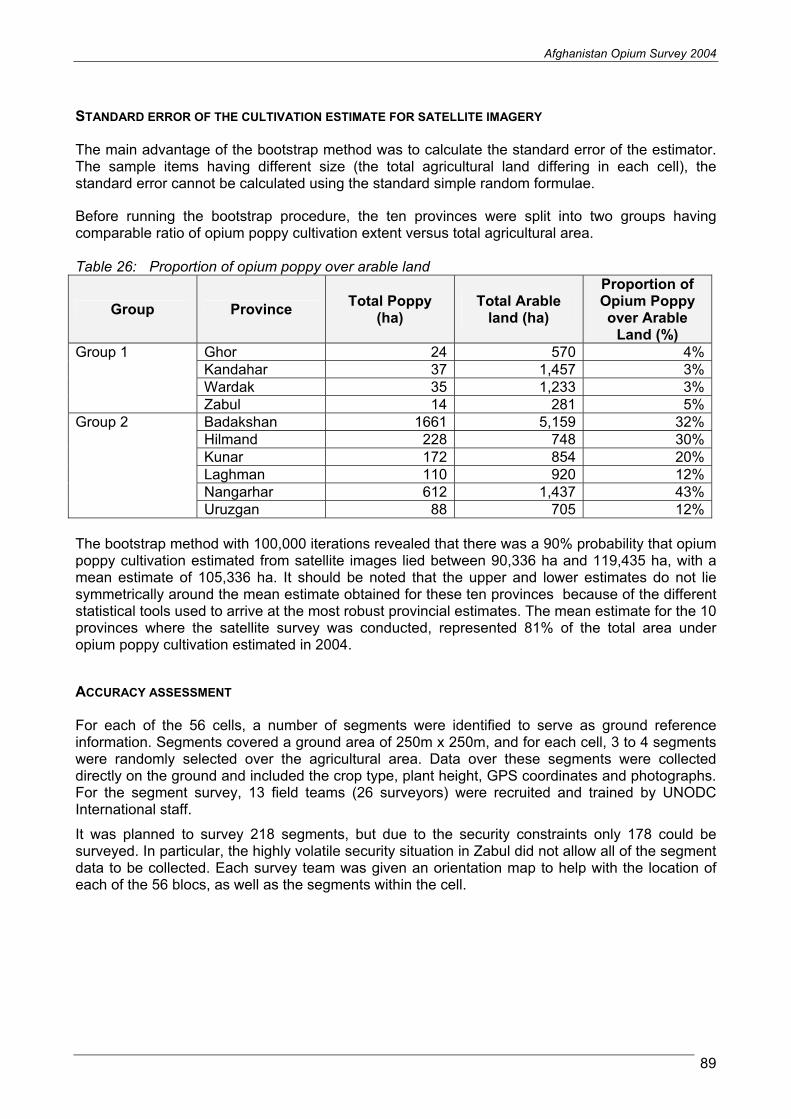
Afghanistan Opium Survey 2004
89
STANDARD ERROR OF THE CULTIVATION ESTIMATE FOR SATELLITE IMAGERY
The main advantage of the bootstrap method was to calculate the standard error of the estimator. The sample items having different size (the total agricultural land differing in each cell), the standard error cannot be calculated using the standard simple random formulae.
Before running the bootstrap procedure, the ten provinces were split into two groups having comparable ratio of opium poppy cultivation extent versus total agricultural area.
Table 26: Proportion of opium poppy over arable land
Group ProvinceTotal Poppy
(ha)Total Arable
land (ha)
Proportion of Opium Poppy over Arable
Land (%) Ghor 24 570 4%Kandahar 37 1,457 3%Wardak 35 1,233 3%
Group 1
Zabul 14 281 5%Badakshan 1661 5,159 32%Hilmand 228 748 30%Kunar 172 854 20%Laghman 110 920 12%Nangarhar 612 1,437 43%
Group 2
Uruzgan 88 705 12%
The bootstrap method with 100,000 iterations revealed that there was a 90% probability that opium poppy cultivation estimated from satellite images lied between 90,336 ha and 119,435 ha, with a mean estimate of 105,336 ha. It should be noted that the upper and lower estimates do not lie symmetrically around the mean estimate obtained for these ten provinces because of the different statistical tools used to arrive at the most robust provincial estimates. The mean estimate for the 10 provinces where the satellite survey was conducted, represented 81% of the total area under opium poppy cultivation estimated in 2004.
ACCURACY ASSESSMENT
For each of the 56 cells, a number of segments were identified to serve as ground reference information. Segments covered a ground area of 250m x 250m, and for each cell, 3 to 4 segments were randomly selected over the agricultural area. Data over these segments were collected directly on the ground and included the crop type, plant height, GPS coordinates and photographs. For the segment survey, 13 field teams (26 surveyors) were recruited and trained by UNODC International staff.
It was planned to survey 218 segments, but due to the security constraints only 178 could be surveyed. In particular, the highly volatile security situation in Zabul did not allow all of the segment data to be collected. Each survey team was given an orientation map to help with the location of each of the 56 blocs, as well as the segments within the cell.

Afghanistan Opium Survey 2004
90
Table 27: Total number of segments surveyed
Number of segments Province
Total Surveyed
Badakhshan 16 16
Ghor 15 8
Hilmand 43 38
Kandahar 24 26
Kunar 12 11
Laghman 12 9
Nangarhar 36 32
Uruzgan 28 26
Wardak 16 8
Zabul 16 4
Total 218 178
Ground reference data were used to interpret the images and to assess the accuracy of the image classifications.
The following confusion matrix indicates horizontally the producers’ accuracy, e.g. 88% of the pixels classified by the computer as poppy were found to be actually opium poppy, and vertically the user’s accuracy, i.e. 91% of what was identified by surveyors on the ground as opium poppy fields, had been correctly classified as opium poppy by the computer. The overall accuracy of the classification for all classes was 86%.
Table 28: Confusion matrix
Classification
Poppy Other Cereals Total Producer’s Accuracy
Poppy 78,821 6,950 4,270 90,041 88%
Other 4,626 83,849 5,907 94,383 89%
Cereals 2,722 11,192 51,957 65,872 79%
Total 86,169 101,991 62,135 250,296 Gro
un
dR
efe
ren
ce
D
ata
User’s Accuracy 91% 82% 84%
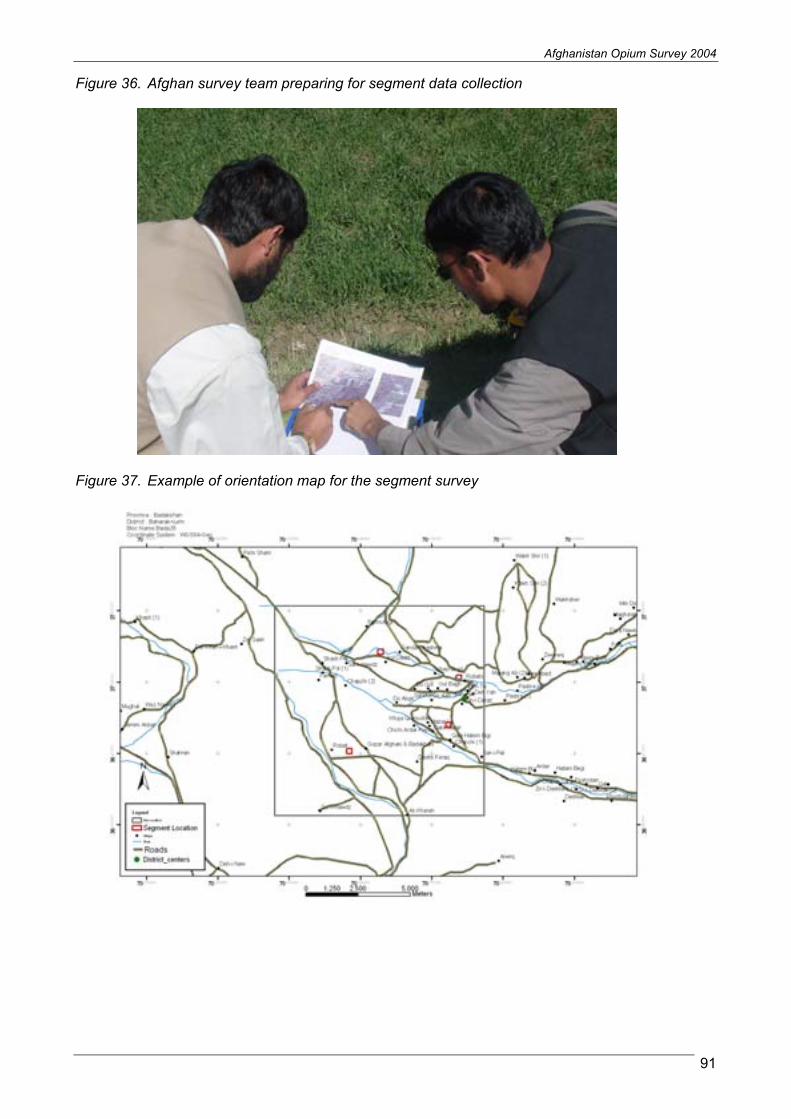
Afghanistan Opium Survey 2004
91
Figure 36. Afghan survey team preparing for segment data collection
Figure 37. Example of orientation map for the segment survey
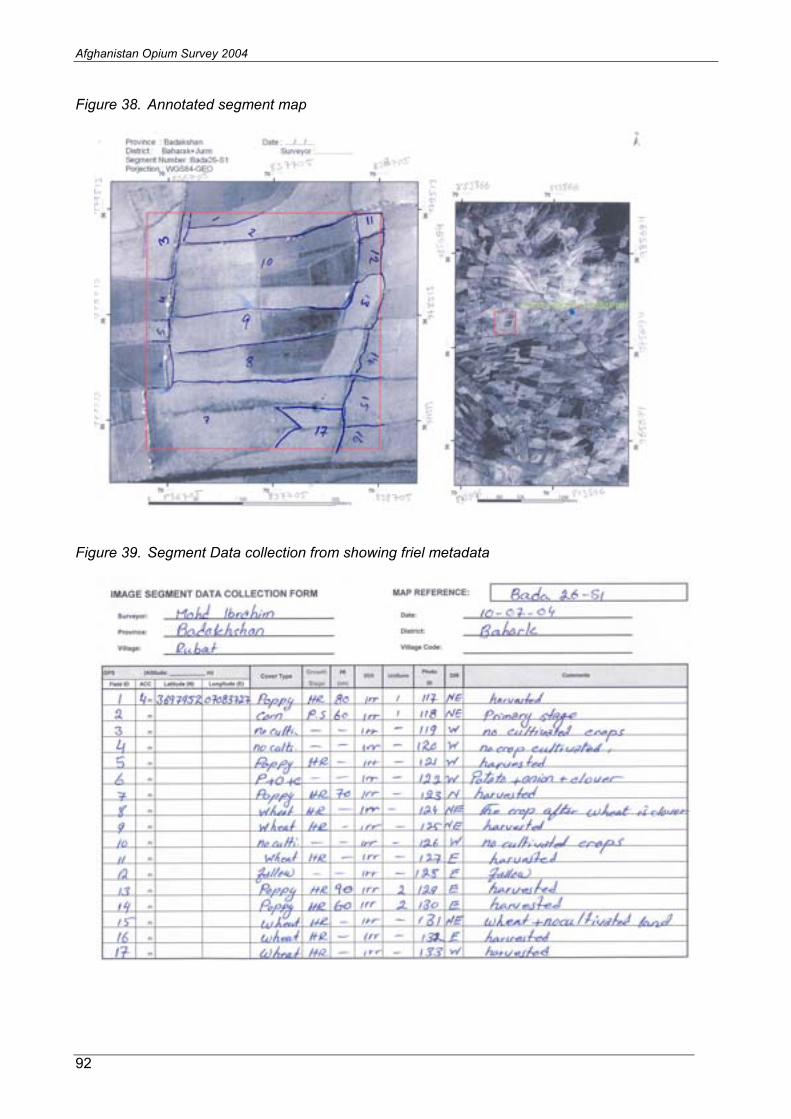
Afghanistan Opium Survey 2004
92
Figure 38. Annotated segment map
Figure 39. Segment Data collection from showing friel metadata
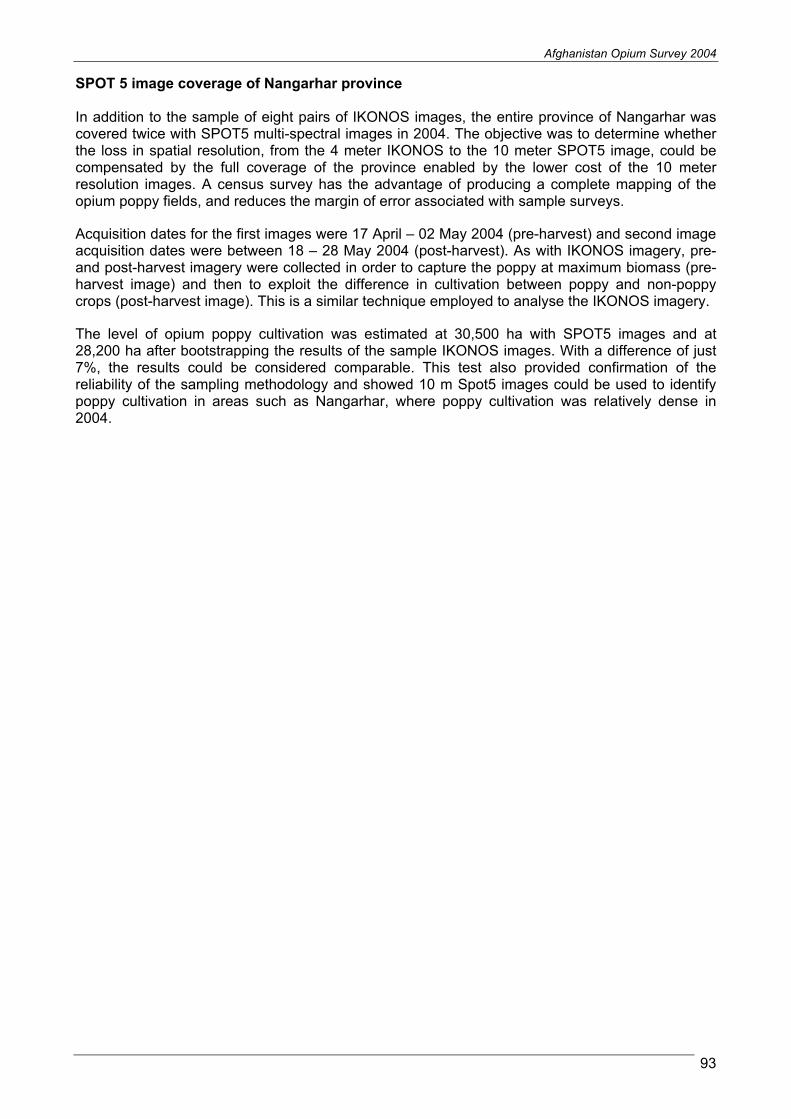
Afghanistan Opium Survey 2004
93
SPOT 5 image coverage of Nangarhar province
In addition to the sample of eight pairs of IKONOS images, the entire province of Nangarhar was covered twice with SPOT5 multi-spectral images in 2004. The objective was to determine whether the loss in spatial resolution, from the 4 meter IKONOS to the 10 meter SPOT5 image, could be compensated by the full coverage of the province enabled by the lower cost of the 10 meter resolution images. A census survey has the advantage of producing a complete mapping of the opium poppy fields, and reduces the margin of error associated with sample surveys.
Acquisition dates for the first images were 17 April – 02 May 2004 (pre-harvest) and second image acquisition dates were between 18 – 28 May 2004 (post-harvest). As with IKONOS imagery, pre- and post-harvest imagery were collected in order to capture the poppy at maximum biomass (pre-harvest image) and then to exploit the difference in cultivation between poppy and non-poppy crops (post-harvest image). This is a similar technique employed to analyse the IKONOS imagery.
The level of opium poppy cultivation was estimated at 30,500 ha with SPOT5 images and at 28,200 ha after bootstrapping the results of the sample IKONOS images. With a difference of just 7%, the results could be considered comparable. This test also provided confirmation of the reliability of the sampling methodology and showed 10 m Spot5 images could be used to identify poppy cultivation in areas such as Nangarhar, where poppy cultivation was relatively dense in 2004.

94
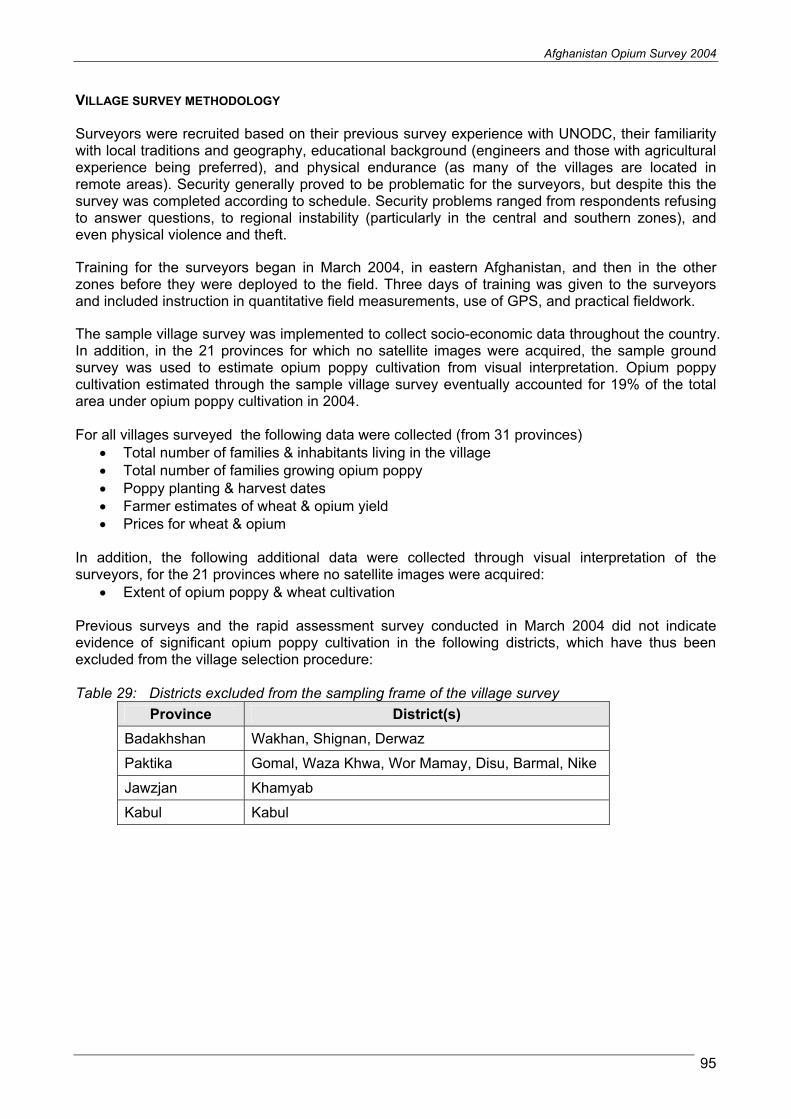
Afghanistan Opium Survey 2004
95
VILLAGE SURVEY METHODOLOGY
Surveyors were recruited based on their previous survey experience with UNODC, their familiarity with local traditions and geography, educational background (engineers and those with agricultural experience being preferred), and physical endurance (as many of the villages are located in remote areas). Security generally proved to be problematic for the surveyors, but despite this the survey was completed according to schedule. Security problems ranged from respondents refusing to answer questions, to regional instability (particularly in the central and southern zones), and even physical violence and theft.
Training for the surveyors began in March 2004, in eastern Afghanistan, and then in the other zones before they were deployed to the field. Three days of training was given to the surveyors and included instruction in quantitative field measurements, use of GPS, and practical fieldwork.
The sample village survey was implemented to collect socio-economic data throughout the country. In addition, in the 21 provinces for which no satellite images were acquired, the sample ground survey was used to estimate opium poppy cultivation from visual interpretation. Opium poppy cultivation estimated through the sample village survey eventually accounted for 19% of the total area under opium poppy cultivation in 2004.
For all villages surveyed the following data were collected (from 31 provinces) Total number of families & inhabitants living in the village Total number of families growing opium poppy Poppy planting & harvest dates Farmer estimates of wheat & opium yield Prices for wheat & opium
In addition, the following additional data were collected through visual interpretation of the surveyors, for the 21 provinces where no satellite images were acquired:
Extent of opium poppy & wheat cultivation
Previous surveys and the rapid assessment survey conducted in March 2004 did not indicate evidence of significant opium poppy cultivation in the following districts, which have thus been excluded from the village selection procedure:
Table 29: Districts excluded from the sampling frame of the village survey
Province District(s)
Badakhshan Wakhan, Shignan, Derwaz
Paktika Gomal, Waza Khwa, Wor Mamay, Disu, Barmal, Nike
Jawzjan Khamyab
Kabul Kabul
Afghanistan Opium Survey 2004
96
ESTABLISHMENT OF THE SAMPLING FRAME FOR THE VILLAGE SURVEY
In 2004, the sampling frame for the village survey data was the complete list of all villages in Afghanistan. The village database used to establish the sampling frame was obtained from UNDP’s Afghanistan Information Management System (AIMS) which consists of 30,706 villages.
SAMPLING RATIO
In the 10 provinces where opium poppy cultivation was estimated from satellite images, the overall village sampling ratio was 6%, and the villages were selected through simple random sampling. In the 22 other provinces, the villages were first stratified based on their location on the 1993 FAO land cover map, and then randomly selected within each strata:
strata 1: villages located over irrigated land (or within the proximity of irrigated land, with a maximum buffer of 1 km) – 10% sampling rate
strata 2: villages located over rain-fed area (or within the proximity of rain-fed area, with a maximum buffer of 1 km) – 10% sampling rate
strata 3: villages located further than 1 km of any irrigated or rain-fed area – 5% sampling rate.
At the country level, a total of 2,496 villages have been selected and 6,598 farmers interviewed for the village survey, employing 60 surveyors. Due to security constraints 58 of the assigned villages could not be visited. In particular, it should be noted that no village could be surveyed in Paktika province, and therefore it was not possible to estimate opium poppy cultivation for this province.
AREA ESTIMATION FORMULA FROM VILLAGE SURVEY
Stratified random sampling formulae have been used to calculate opium poppy cultivation from the village survey for the 21 provinces where no satellite images were acquired.
sx Provincial average of the surveyor visual interpretation of opium poppy cultivation per village in strata s
sN Total number of villages per province of strata s
s
s
s xNX * = Total opium poppy cultivation area
As the agricultural land varies from one village to another, the results were refined by bootstrapping the provincial samples (with 100,000 iterations). The bootstrap method also provided for the standard error of the estimates. It showed that there was a 90% probability that opium poppy cultivation estimated from the village survey lied between 18,800 ha and 32,300 ha, with a mean estimate of 25,300 ha. It should be noted that the upper and lower estimates do not lie symmetrically around the mean estimate because of the bootstrap method used. The mean estimate for the 21 provinces, covered by the village survey, represented 19% of the total area under opium poppy cultivation in 2004.
Overall, the area estimation from satellite and village survey ranged between 109,000 ha and 152,000 ha, with a mean estimate of 131,000 ha.

97

Afghanistan Opium Survey 2004
98
3.2 OPIUM YIELD AND PRODUCTION
In the past, calculation of opium yield in Afghanistan relied on farmers’ interviews, mostly done prior to the harvest. The data thus reflected primarily the farmers ‘expected’ opium yield rather than the actual opium yield which was still unknown at the time of the survey. Data were also subject to the farmers own bias.
Since 2000, UNODC has been developing an alternative objective yield assessment approach, based on measured volume of opium capsules and density37. The relationship between capsule volume per square metre and the yield of dry opium was originally developed from data collected in Pakistan and Thailand. It takes the form of a non-rectangular hyperbola:
Non-rectangular hyperbola formula for predicting opium yield
Y = [(VC + 1495) – ((VC + 1495)2 – 395.259 VC)0.5] / 1.795 where,Y = Dry opium gum yield (kilograms / hectare) VC = Mature capsule volume (cm3/m2)
To validate this relationship, UNODC set up trial opium poppy fields from which the opium production was weighted throughout the harvest, and the capsules measured. This is a time- consuming exercise requiring the presence of the surveyors in the field throughout the harvest and the collaboration from the farmers. For these reasons, it was only possible to conduct such an exercise in a limited number of fields in 2000, 2001, 200338 and 2004.
Figure 40. Plot volume and yield of dry opium from test fields.
37
UNODC Guidelines for yield assessment of opium gum and coca leaf from brief field visits, UN New York, 2001, ST/NAR/3338
In 2003, surveyors did not follow properly the survey instructions and the results were therefore discarded.
0
10
20
30
40
50
60
70
80
0 500 1000 1500 2000Plot volume (cm3/m2)
kg/h
a
Afghanistan, 2000 Afghanistan, 2001
Afghanistan, 2004* Non-rectangular Hyperbola
Afghanistan Opium Survey 2004
99
Table 30: Number of fields surveyed in Afghanistan to confirm the validity of the relationship between capsule volume and opium yield
Year Number of fields 2000 8 2001 6 2003 11 2004 12
The results of these exercises showed that there is a relationship between capsule volume (per m2)and the dry opium yield (kg/ha) though further method development may be still necessary to take additional factors into account to improve the results. However, the average value of the actually measured yields and of the yields calculated on the basis of the ‘capsule volume per square metre’ formula, presented above, turned out to show very similar results on the test fields. The exercise also revealed that farmers tended to strongly under-estimate opium yields. Predicted fresh opium yield by farmers in test fields turned out to be only half as high as the amount of the fresh opium subsequently collected and weighed from the same test fields. It was therefore decided to use the more objective method of capsule measurement to assess the average opium yield in 2004.
Once the correlation between capsules volume and opium yield has been validated in at least a small number of fields, it has been possible to input the capsule measurements (diameter, height, density) collected during brief field visits (about half an hour per field) from a larger sample of opium fields.
In the fields, the surveyors draw an imaginary transect along which they select three one-meter square plots. From each plot, they then count the number of flower buds, flowers, immature capsules, mature capsules that are expected to yield opium, and measured with a calliper the diameter and the height of 10 to 15 opium yielding capsules. These data enable to calculate a capsule volume per square meter, that is then input into the non-rectangular formula. Each plot thus provides one observation of yield. The simple average of the observations provides for the regional yield estimate.
In 2004, capsule measurements were collected from 149 fields randomly selected throughout the country. A total of 5,098 capsules were measured from 446 plots. (Usually three plots per field were selected, though in one case only two plots could be selected). As the non-rectangular formula had not been tested for capsule volume per square meter above 1,800 cm3/m2, 53 plots above this limit were discarded. An additional three plots were discarded after it appeared that the surveyor misunderstood the instructions and three plots had to be discarded as one surveyor was not able to make all of the required measurements in one field. Eventually, data from a total of 387 plots from 138 fields were used to establish the average regional opium yields.
To calculate production, average regional yield estimates were multiplied by the regional area estimates. Lower and upper production estimates were obtained by multiplying the average regional areas under opium poppy cultivation with the lower and upper opium yield estimates.

100

Afghanistan Opium Survey 2004
101
3.3 OPIUM PRICE
Between April and August 2004, the surveyors of the village survey obtained data on the price of fresh and dry opium. The survey took place in 2138 villages. In the 2004 village survey some 3,300 farmers in 1,113 villages were interviewed to provide data on fresh opium prices and about 3,700 farmers from 1,233 villages (55% of the villages surveyed) were interviewed to provide information on dry opium prices. The average regional values for price of dry opium were used to estimate the total value of opium produced in Afghanistan in 2004.
Since November 2002 UNODC has established, in addition, a regular opium price monitoring system, collecting prices from fresh and dry opium from farmers and traders on monthly basis in Nangarhar, Hilmand and Kandahar, and since May 2004 in Hirat, Balkh and Badakhshan provinces. About 90 farmers and 80 local traders are interviewed each month to provide this information. The data collected through this system also confirmed the downward trend observed this year.
3.4 OPIUM GROWING FAMILIES
To estimate the number of families involved in opium poppy cultivation in Afghanistan, data were collected during the village survey on the number of families growing opium poppy in the sampled villages.
Stratified simple random sampling formulae were used to derive the number of opium growing families in Afghanistan as follow:
sx average number of opium poppy growing farmers per village in the sample in strata s
sN Total number of villages in the sampling frame in strata s
ss xNX * = Total number of families growing opium
As the sampled villages did not have a similar population size, the results were refined with a bootstrap of 100,000 iterations, providing an estimate for the mean and for the standard error.
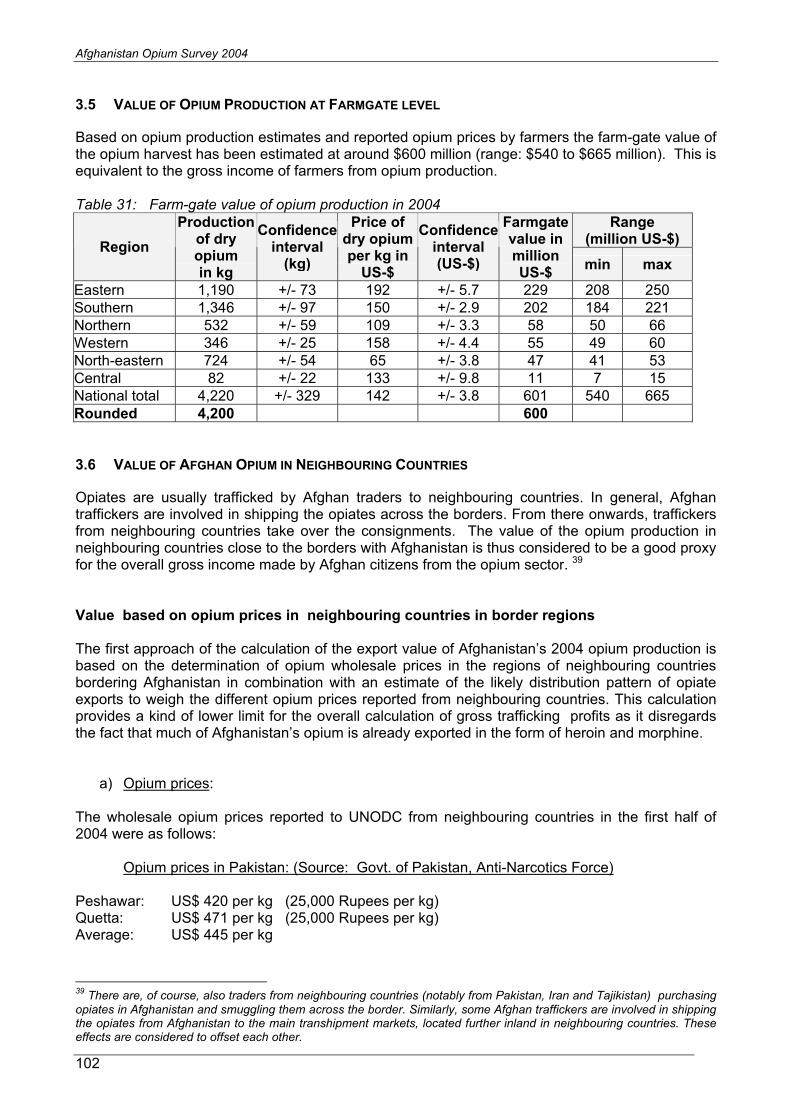
Afghanistan Opium Survey 2004
102
3.5 VALUE OF OPIUM PRODUCTION AT FARMGATE LEVEL
Based on opium production estimates and reported opium prices by farmers the farm-gate value of the opium harvest has been estimated at around $600 million (range: $540 to $665 million). This is equivalent to the gross income of farmers from opium production.
Table 31: Farm-gate value of opium production in 2004 Range
(million US-$) Region
Productionof dry opiumin kg
Confidenceinterval
(kg)
Price of dry opium per kg in
US-$
Confidenceinterval(US-$)
Farmgatevalue in millionUS-$
min max
Eastern 1,190 +/- 73 192 +/- 5.7 229 208 250 Southern 1,346 +/- 97 150 +/- 2.9 202 184 221 Northern 532 +/- 59 109 +/- 3.3 58 50 66 Western 346 +/- 25 158 +/- 4.4 55 49 60 North-eastern 724 +/- 54 65 +/- 3.8 47 41 53 Central 82 +/- 22 133 +/- 9.8 11 7 15 National total 4,220 +/- 329 142 +/- 3.8 601 540 665 Rounded 4,200 600
3.6 VALUE OF AFGHAN OPIUM IN NEIGHBOURING COUNTRIES
Opiates are usually trafficked by Afghan traders to neighbouring countries. In general, Afghan traffickers are involved in shipping the opiates across the borders. From there onwards, traffickers from neighbouring countries take over the consignments. The value of the opium production in neighbouring countries close to the borders with Afghanistan is thus considered to be a good proxy for the overall gross income made by Afghan citizens from the opium sector. 39
Value based on opium prices in neighbouring countries in border regions
The first approach of the calculation of the export value of Afghanistan’s 2004 opium production is based on the determination of opium wholesale prices in the regions of neighbouring countries bordering Afghanistan in combination with an estimate of the likely distribution pattern of opiate exports to weigh the different opium prices reported from neighbouring countries. This calculation provides a kind of lower limit for the overall calculation of gross trafficking profits as it disregards the fact that much of Afghanistan’s opium is already exported in the form of heroin and morphine.
a) Opium prices:
The wholesale opium prices reported to UNODC from neighbouring countries in the first half of 2004 were as follows:
Opium prices in Pakistan: (Source: Govt. of Pakistan, Anti-Narcotics Force)
Peshawar: US$ 420 per kg (25,000 Rupees per kg) Quetta: US$ 471 per kg (25,000 Rupees per kg) Average: US$ 445 per kg
39
There are, of course, also traders from neighbouring countries (notably from Pakistan, Iran and Tajikistan) purchasing opiates in Afghanistan and smuggling them across the border. Similarly, some Afghan traffickers are involved in shipping the opiates from Afghanistan to the main transhipment markets, located further inland in neighbouring countries. These effects are considered to offset each other.
Afghanistan Opium Survey 2004
103
For comparison, prices were reported to have been higher in Baluchistan in the border regions with Iran (Turbat: US$588 (35,000 Rupees per kg); Dalbadin: US$622 per kg (37,000 Rupees per kg)) and even higher in Karachi: US$650 (38,700 Rupees per kg), Pakistan’s largest harbour town.
Opium prices in Iran (Source: UNODC Field Office):
Sistan Baluchistan (bordering Afghanistan/Pakistan):US$740-US$750 per kg (April/May 2004);
average US$745 per kg
For comparison, opium prices increase to $2050-$2100 per kg in Tehran (April/May 2004).
Opium prices in Tajikistan (Source: UNODC Field Office):
Mountain Badakhshan Autonomous Province:US$500 - US$700 per kg (1 June, 2004);
average: US$600 per kg
For comparison, opium prices were higher in Dushanbe and neighbouring provinces: US$600 - US$700 and even higher - further north - in Sogd province (Zeravshan): US$1,400 – US$1,600.
Prices for Tajikistan in the border region with Afghanistan are used as a proxy for overall prices in Central Asia in border regions with Afghanistan. This approach seems to be appropriate as the bulk of opiates leaving Afghanistan towards Central Asia passes through Tajikistan.
b) Distribution pattern of opiate shipments out of Afghanistan
In order to arrive at an estimate of the likely distribution pattern the following approach was used:
- distribution of opium production in Afghanistan according to regions
The approach assumes that the regional production pattern is similar to the export patterns, i.e. opium production in north-eastern and northern Afghanistan is going to Tajikistan (and other central Asian countries); production in eastern and central Afghanistan as well as half of production from southern Afghanistan is being shipped across the border to Pakistan and production in western Afghanistan and half of production in southern Afghanistan is being shipped to Iran.
There is empirical evidence insofar as opium prices continue to differ strongly in Afghanistan, suggesting that the opium market is still highly fragmented. Shipping opium from one part of the country to another is possible, but it results in high costs as traffickers have usually to pay at each check-point. It is thus simply more cost effective to smuggle the opiates across the nearest border.
Based on this approach 30% of the opiates produced in 2004 are likely to leave the country via Central Asia, 46% are smuggled abroad via Pakistan and 24% via Iran. (Most of the opiates smuggled to Pakistan are then smuggled onwards to Iran as well).
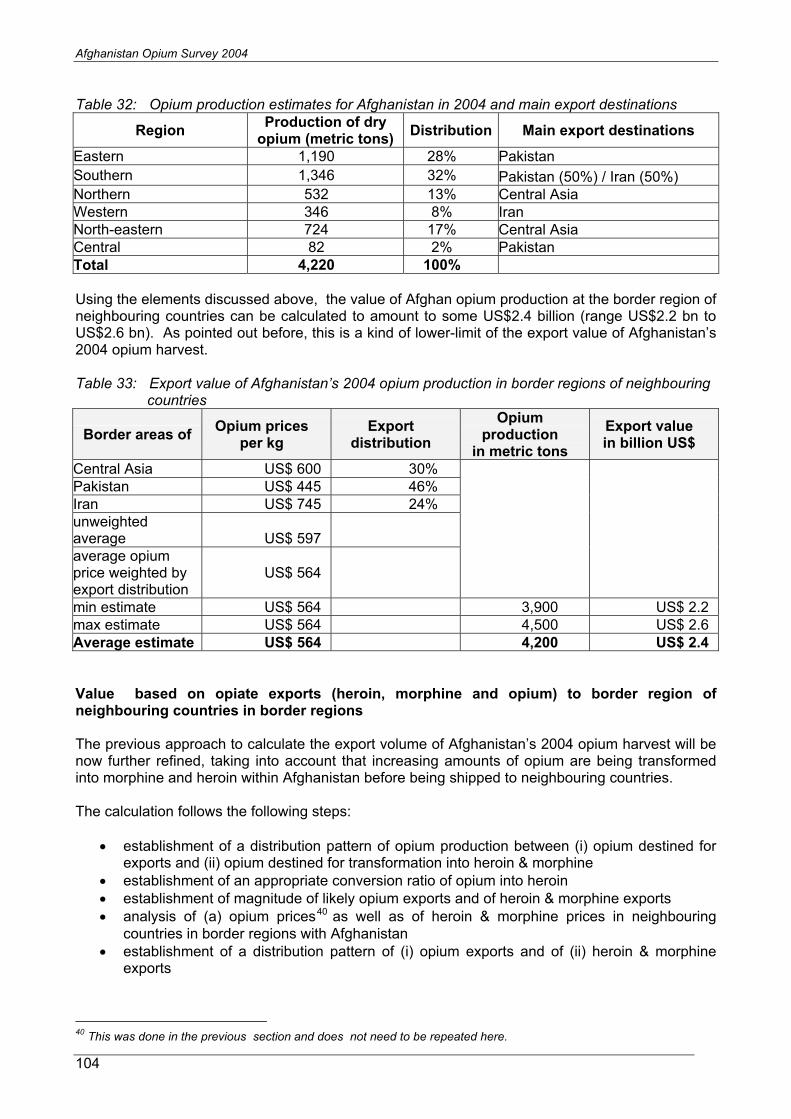
Afghanistan Opium Survey 2004
104
Table 32: Opium production estimates for Afghanistan in 2004 and main export destinations
RegionProduction of dry
opium (metric tons) Distribution Main export destinations
Eastern 1,190 28% Pakistan
Southern 1,346 32% Pakistan (50%) / Iran (50%) Northern 532 13% Central Asia Western 346 8% IranNorth-eastern 724 17% Central Asia Central 82 2% PakistanTotal 4,220 100%
Using the elements discussed above, the value of Afghan opium production at the border region of neighbouring countries can be calculated to amount to some US$2.4 billion (range US$2.2 bn to US$2.6 bn). As pointed out before, this is a kind of lower-limit of the export value of Afghanistan’s 2004 opium harvest.
Table 33: Export value of Afghanistan’s 2004 opium production in border regions of neighbouring countries
Border areas of Opium prices
per kg Export
distribution
Opiumproduction
in metric tons
Export value in billion US$
Central Asia US$ 600 30% Pakistan US$ 445 46% Iran US$ 745 24% unweightedaverage US$ 597 average opium price weighted by export distribution
US$ 564
min estimate US$ 564 3,900 US$ 2.2 max estimate US$ 564 4,500 US$ 2.6 Average estimate US$ 564 4,200 US$ 2.4
Value based on opiate exports (heroin, morphine and opium) to border region of neighbouring countries in border regions
The previous approach to calculate the export volume of Afghanistan’s 2004 opium harvest will be now further refined, taking into account that increasing amounts of opium are being transformed into morphine and heroin within Afghanistan before being shipped to neighbouring countries.
The calculation follows the following steps:
establishment of a distribution pattern of opium production between (i) opium destined for exports and (ii) opium destined for transformation into heroin & morphine establishment of an appropriate conversion ratio of opium into heroin establishment of magnitude of likely opium exports and of heroin & morphine exports analysis of (a) opium prices40 as well as of heroin & morphine prices in neighbouring countries in border regions with Afghanistan establishment of a distribution pattern of (i) opium exports and of (ii) heroin & morphine exports
40
This was done in the previous section and does not need to be repeated here.

Afghanistan Opium Survey 2004
105
using prices in neighbouring countries and the distribution pattern to calculate an average opium export weighted opium price and an average heroin & morphine export weighted heroin & morphine price in neighbouring countries multiplying opium export volumes with export prices of opium to arrive at the value of opium exports and (ii) multiplying heroin & morphine export volumes with heroin and morphine export prices to arrive at the value of heroin and morphine exports
a) Proportion of opium used for transformation into heroin
There is clear evidence of heroin production in Afghanistan. Afghan authorities dismantled 120 ‘fixed laboratories’ and 30 ‘movable laboratories’ in 2003, mainly in Hilmand, Nangarhar (notably in Shanwar district) and in Badakshan.41 Additional raids also took place in 2004. Laboratories are often located rather close to the border areas. The precursor chemicals found in these laboratories were mainly imported from Pakistan, Thailand, Hongkong and India and were in some cases imported into Afghanistan via Dubai.
Analyzing reported seizures from Afghanistan and neighbouring countries (Pakistan, Iran and the countries of Central Asia) 77% of the seizures (expressed in opium equivalents) were already in the form of heroin and morphine in 2003, and only 23% in the form of opium. As law enforcement agencies in neighbouring countries claim that no heroin production takes place on their territories (UNODC has no information that would contradict these claims) the following calculation assumes that 77% of the opium produced in Afghanistan is transformed into morphine & heroin in Afghanistan.
Table 34: Seizures of opiates in countries neighbouring Afghanistan and Afghanistan (2003)
Opium seized in kg
in %
Heroin & morphine
seizedin kg
in %
Central Asia 2,760 3% 6,748 12% Pakistan 5,786 5% 34,141 60% Iran (Islamic Republic of) 97,575 92% 16,390 29% Sub-total 106,121 100% 57,280 100% Afghanistan 8,412 900 Total 114,533 58,180
Total in opium equivalents* 114,533 378,170 Distribution opium / heroin 23% 77% * ratio: 6.5 kg of opium to produce 1 kg of heroin Source: UNODC, Annual Reports Questionnaire Data.
b) Conversion of opium into heroin
The next question relates to the amounts of opium needed to produce 1 kg of heroin. Traditionally a 10:1 rule of thumb ratio was used (10 kg of opium for 1 kg of heroin) for opium producing countries, including Afghanistan.
Analysing the price structure in Afghanistan and neighbouring countries confirms, however, that such a transformation ratio may not be appropriate. Wholesale prices reported by the Afghan authorities to UNODC for 2003 showed for opium a price of $458 per kg and for white heroin a price of $2731 per kg. Heroin prices were thus only 6 times higher per kg than opium prices. The Afghan authorities reported purity of white heroin to range from 80% to 95%42. Using the lower range of the purity, the purity adjusted price of heroin (for a purity of 100%) would have been
41
Transitional Islamic State of Afghanistan, Annual Reports Questionnaire Data. 42
Afghanistan, reply to UNODC’s Annual Reports Questionnaire for the year 2003.
Afghanistan Opium Survey 2004
106
$3,414, or 7.5 times the price of opium. If traffickers had bought opium and transformed it into heroin at a 10:1 ratio, they would have suffered a loss. They could have made a profit by selling the heroin abroad; however, they would have still made a larger profit by simply selling the opium abroad. The heroin to opium price ratio was 7.7 in Pakistan in the regions bordering Afghanistan, and even lower in Iran. In Tajikistan, traffickers would have also failed to make a profit if they had to use 10 kg of dry opium to produce 1 kg of heroin. It would be extremely unlikely to see traffickers purchasing chemical precursors and equipment, if these activities only reduced their overall profits.
Against this background, it seems to be necessary to revisit the question of the appropriate opium to heroin conversion ratio. A conversion ratio of 10:1 applies well to licit opium production at the global level. The International Narcotics Control Board (INCB) reported that 709.7 tons of opium resulted in a global morphine production of 75.1 tons in 2002, equivalent to a yield of 10.6 kg of morphine for 100 kg of opium. Preliminary data for 2003 show a yield of 10.1 kg of morphine for 100 kg of opium. (The conversion rate of heroin to morphine is 1:1).
A US study, based on samples collected from the world’s main opium production regions of South-East Asia, South-West Asia and the Americas, showed that the morphine content of opium ranged from 3% to 19%. The (unweighted) average morphine content was found to amount to 11.4%. This would confirm the 10:1 rule of thumb conversion ratio. The bulk of the samples for this study originated in north-western Thailand (1,100 out of 1,414).43 A more recent study, conducted by UNODC in South-East Asia (Myanmar and Laos), showed that the morphine content of opium was in the majority of cases between 10% and 14% (11.5%, on average, based on opium from 29 samples analyzed by UNODC in 2001), suggesting that the 10:1 transformation ratio is a reasonable approximation for the opium to heroin conversion rate in this part of the world.
The situation differs, however, for Afghanistan. Dating back to the late 1950s, the analysis of an opium sample showed already a morphine content of almost 17%. Authorities in the Kyrgyz Republic reported that the morphine content of opium trafficked through their country (in general, originating in Afghanistan) ranged from 14% to 22%, with a typical morphine content of 18% (ARQ, 2001).44 Over the 2000-2003 period, UNODC collected opium samples across Afghanistan, dried them and analyzed the morphine content of these samples. Overall 39 opium samples from 29 test fields across Afghanistan were collected. The morphine content of dry opium in these samples ranged from 8% to 24%. The highest morphine yields over the 2000-2003 period were found in Badakshan (on average slightly more than 16% 45 over the 2000-2003 period). The average morphine content of fields in Nangarhar was above 15%. The average morphine content in Hilmand was above 12%. The average morphine content from the 39 samples in Afghanistan was 15% (confidence interval: 13.7%-16.3%).46 This suggests that in Afghanistan, on average, only 6½
kg of dry opium are needed to produce 1 kg of heroin.47
43
US. Drug Enforcement Administration, Special Testing & Research Laboratory, McLean, Virginia, USA, quoted in United Nations International Drug Control Programme, Recommended Methods for Testing Opium, Morphine and Heroin, Manual for use by national Drug Testing laboratories, New York 1998, p. 4 44
UNODC, Limited Opium Yield Assessment Surveys, Technical report: Observations and findings, December 2003. 45
There was, however, a clear downward trend in the morphine content of opium in Badakshan; while the average morphine content was 18% in 2000 and 17% in 2001 it fell to 11% in 2003. This went hand in hand with a marked increase in the use of irrigated land for poppy cultivation (instead of rain-fed land), a strong increase in yields per hectareand a strong decline of opium prices, far below the national average. 46
UNODC, Limited Opium Yield Assessment Surveys, Technical report: Observations and findings, December 2003. 47
This refers to heroin at 100% purity. In practice, laboratory efficiencies of typically 60%-70% would, of course, require the input of more opium to produce pure heroin. Heroin produced in Afghanistan, however, is not 100% pure; purity levels usually range from 40%-85%, typically slightly above 60%. This, results again in a 6:1 or 7:1 conversion ratio of dry opium to heroin. (UNODC, The Opium Economy in Afghanistan, An International Problem, New York 2003, p. 133).

Afghanistan Opium Survey 2004
107
Table 35: Average morphine content of opium in Afghanistan (2000-2003)*
ProvinceAverage
morphine content Badakhshan 16.2% Nangarhar 15.3% Hilmand 12.4% Others (Kandahar, Balkh) 11.2% Unweighted average 15.0% Confidence interval ( =0.05) 13.7%–16.3% * Information based on the analysis of 39 opium samples from 28 fields. Source: UNODC, Limited Opium Yield Assessment Surveys, Technical report: Observations and findings, December 2003.
Such a figure is in line with ‘recipes’ for heroin manufacture in Afghanistan (and in previous years from Pakistan), suggesting that the typical inputs for 1 kg of heroin are 6 to 7 kg of opium, in addition to a number of chemicals.48
These findings do not mean that the 10:1 ratio, used so-far for Afghan opium, was wrong. Yield estimates in Afghanistan – until recently - were based on farmers’ estimates. The questions asked were, however, not explicit enough to be sure whether ‘fresh’ or ‘ dry’ opium yields were reported. It can be assumed that a majority of farmers provided information on the amount of ‘fresh’ opium collected as many farmers sell their opium production immediately after harvest. Previous research suggested that the weight difference between fresh opium and (what is sold as) ‘dry’ opium amounted to some 30% on average. Thus a 10:1 wet opium to heroin conversion ratio (applied in previous years to opium production estimates for Afghanistan) is actually identical with a 7:1 conversion ratio of ‘dry’ opium to heroin (see next table). Once the calculation is based on ‘oven dry’ opium, a 10:1 conversion ratio of ‘wet’ opium to heroin would be identical to a 6:1 conversion ratio of ‘oven dry’ opium to heroin. As the yield formula used this year provides for an estimate of ‘oven dry’ opium, a 6:1 conversion ratio could be considered to be more adequate than the ‘traditional’ 10:1 transformation ratio.
Table 36: Conversion ratio of dry opium to heroin and ratio of fresh opium to heroin
* The actual moisture content is closer to 40%; however, what is sold as ‘dry’ opium has usually a moisture content of around 10%.
Given ‘recipes’ for the heroin production using a 6:1 ratio and others, showing a 7:1 conversion ratio, a slightly more conservative approach will be taken. The mid-point of these estimates - 6½ kg of opium for 1 kg of heroin - will be used for subsequent calculations.49 For establishing the lower and the upper ranges of likely export volumes of Afghan heroin the 7:1 and the 6:1 ratios will be used, respectively.
48
UNODC, the Opium Economy in Afghanistan – An International Problem, New York 2003, p. 135. 49
This takes also account of the fact that a large number of laboratories were destroyed in 2003 and 2004. Laboratory efficiency of the remaining laboratories and of the new laboratories, set up by in-experienced persons, is thus possibly lower than in the past.
Weight WeightFresh opium 100% Fresh opium 100% - moisture* -30% - moisture -40% ‘dry’ opium* 70% ‘oven dry’ opium 60% Ratio: ‘dry’ opium* : heroin 7 : 1 Ratio: ‘Oven dry’ opium : heroin 6 : 1 Heroin 10% Heroin 10% Ratio fresh opium : heroin 10 : 1 Ratio fresh opium : heroin 10 :1

Afghanistan Opium Survey 2004
108
c) Opium and heroin & morphine exports in 2004
Given an opium production estimate of 4,200 (+/- 300) tons for 2004, the opium to heroin conversion rates (6:5 to 1; range: 7:1 to 6:1) and the opium/heroin & morphine distribution pattern (23%/77% in opium equivalents) established above, some 500 tons (range: 420-580 tons) of heroin and morphine and some 970 tons of opium (range: 900-1040) are likely to be exported from Afghanistan in 2004.
Table 37: Estimated opium and heroin & morphine exports of Afghanistan in 2004 Opium
production(metric tons)
Opium exports (metric tons)
Heroin & morphine exports
(metric tons) Mid estimate
Opium production 4,200 Distribution 23% 77% Opium used for purposes 966 3234 Conversion rate dry opium toheroin 6.5 : 1 ratio End products – exports 966 498
Minimum estimate
Min. opium production 3,900 distribution 23% 77% Opium used for purposes 897 3003 Conversion rate 7 : 1 ratio End products – exports 897 429
Maximum estimate
Max. opium production 4,500 Distribution 23% 77% Opium used 1,035 3,465 Conversion rate 6 : 1 ratio End products - exports 1,035 578
d) Heroin prices in neighbouring countries
The heroin prices in neighbouring countries in the first half of 2004 have been as follows:
Heroin prices in Pakistan: (Source: Govt. of Pakistan, Anti-Narcotics Force)
Peshawar: US$ 4,370 per kg (260,000 Rupees per kg) Quetta: US$ 2,521 per kg (150,000 Rupees per kg) Average: US$ 3,445 per kg
For comparison, heroin prices in Karachi, Pakistan’s largest harbour town amounted to US$4,891 (291,000 Rupees per kg). All of these are the prices for grade A (best quality) heroin, usually used for re-export.
Heroin prices in Iran (Source: UNODC Field Office):
Sistan Baluchistan (bordering Afghanistan/Pakistan): US$2,300 per kg (May 2004); these price data, however, seem to refer to low quality (diluted) heroin, used for the local market. Morphine prices in this province were reported at US$3,900 per kg in May 2004. As heroin is made out of morphine, prices of heroin, unless diluted, are higher, or at least as high as morphine prices.

Afghanistan Opium Survey 2004
109
Against this background, the morphine price (US$3,900) will be used as a proxy for the price of high-quality heroin in this province.
Prices then increase for morphine to US$5000, for medium quality heroin (30% purity or less) to US$6,500 per kg and for good quality heroin (purity of 50% or more ) to US$8,500 per kg in Tehran (April/May 2004).
Heroin prices in Tajikistan (Source: UNODC Field Office):
Mountain Badakhshan Autonomous Province:US$5,000 - US$6000 per kg (1 June, 2004) for ‘high purity’ heroin’;
average: US$5,500 per kg
For comparison, high purity heroin prices then rise in Dushanbe and neighbouring provinces to US$7,000- US$10,000 and to even higher levels of US$12,000– US$15,000 further north in Sogd province (Zeravshan).
Prices for Tajikistan in the border region with Afghanistan are used as a proxy for overall prices in Central Asia in border regions with Afghanistan. This approach seems to be appropriate as the bulk of heroin leaving Afghanistan towards Central Asia passes through Tajikistan.
e) Distribution pattern of opiate shipments out of Afghanistan
In order to weigh the prices according to likely export destinations of Afghan opiates, the following distribution patterns have been established:
- distribution of heroin and morphine exports according to regional opium production in Afghanistan
- distribution of opium exports according to seizures made in neighbouring countries
The rationale for the first approach for heroin & morphine exports is that the opium market continues to be highly segmented in Afghanistan. Strong regional price differences point in this direction. (It is also rather expensive for traffickers to move drug-transport across Afghanistan as at each check-point they have to pay money, which usually goes to the local commanders). The approach taken assumes that the regional distribution of opium production is similar to the subsequent export patterns, i.e. opium production in north-eastern and northern Afghanistan is primarily going to Tajikistan (and other central Asian countries); production in eastern and central Afghanistan as well as half of production from southern Afghanistan is primarily being shipped across the border to Pakistan and production in western Afghanistan and half of production in southern Afghanistan is primarily being shipped to Iran. The existence of laboratories in northern (Badakshan), eastern (Nangarhar) and southern Afghanistan (Hilmand) clearly indicates that heroin production takes place in all of these regions.
Another approach, based on the distribution of opium seizures in neighbouring countries, has been applied for opium exports. Based on this distribution 92% of the opium is destined for Iran, 5% for Pakistan and 3% for Central Asia. This approach was chosen because there are strong indications that only small amounts of opium are exported to countries of Central Asia. Expressed in opium equivalents, heroin seizures were equivalent to 94% of all opiate seizures in Central Asia in 2003; in contrast, in Iran heroin and morphine seizures were only 52% of all opiate seizures; the rest (48%) was accounted for by opium seizures. There are strong indications that indeed most of the Afghan opium exports are destined for Iran, either directly from Afghanistan or via Pakistan. Opium seizures in Iran are made primarily in the provinces of Sistan Baluchistan (bordering Pakistan and Afghanistan) and in the province of Khorassan (bordering Afghanistan). As traffickers from the same ethnic tribe (Baluch), located in southern Afghanistan, Pakistan and Iran are often involved in these trafficking activities, it can be assumed that significant amounts of the opium are
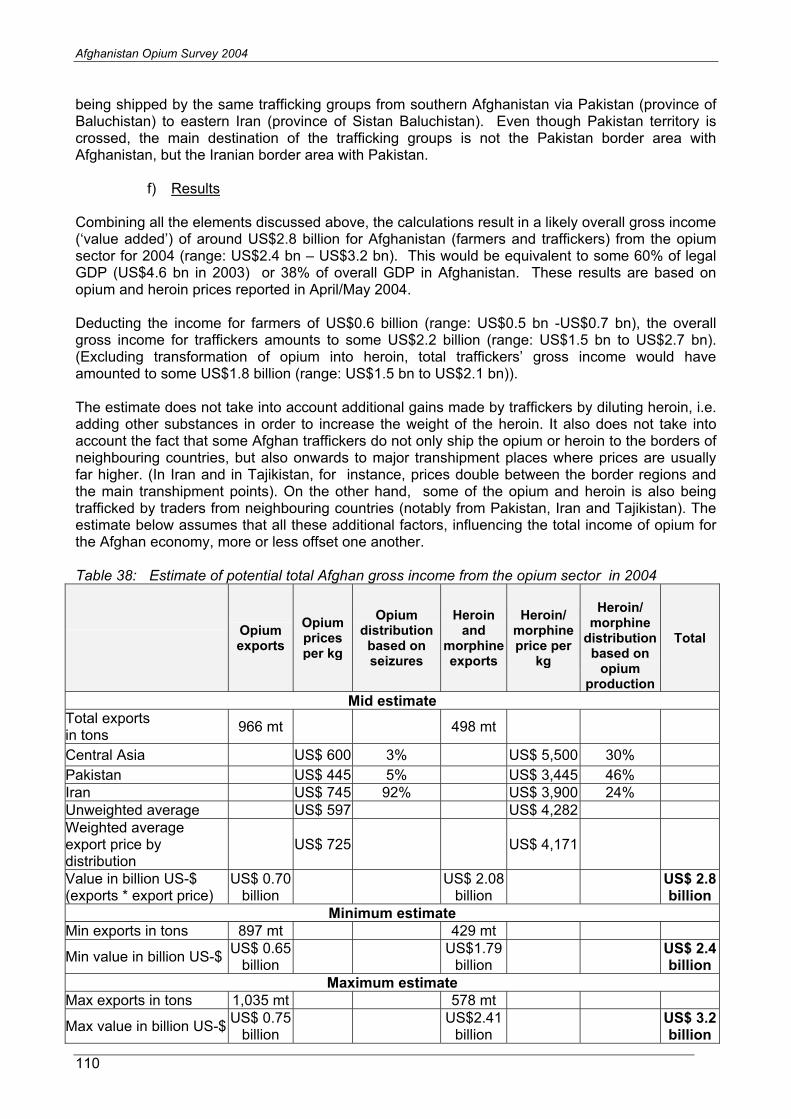
Afghanistan Opium Survey 2004
110
being shipped by the same trafficking groups from southern Afghanistan via Pakistan (province of Baluchistan) to eastern Iran (province of Sistan Baluchistan). Even though Pakistan territory is crossed, the main destination of the trafficking groups is not the Pakistan border area with Afghanistan, but the Iranian border area with Pakistan.
f) Results
Combining all the elements discussed above, the calculations result in a likely overall gross income (‘value added’) of around US$2.8 billion for Afghanistan (farmers and traffickers) from the opium sector for 2004 (range: US$2.4 bn – US$3.2 bn). This would be equivalent to some 60% of legal GDP (US$4.6 bn in 2003) or 38% of overall GDP in Afghanistan. These results are based on opium and heroin prices reported in April/May 2004.
Deducting the income for farmers of US$0.6 billion (range: US$0.5 bn -US$0.7 bn), the overall gross income for traffickers amounts to some US$2.2 billion (range: US$1.5 bn to US$2.7 bn). (Excluding transformation of opium into heroin, total traffickers’ gross income would have amounted to some US$1.8 billion (range: US$1.5 bn to US$2.1 bn)).
The estimate does not take into account additional gains made by traffickers by diluting heroin, i.e. adding other substances in order to increase the weight of the heroin. It also does not take into account the fact that some Afghan traffickers do not only ship the opium or heroin to the borders of neighbouring countries, but also onwards to major transhipment places where prices are usually far higher. (In Iran and in Tajikistan, for instance, prices double between the border regions and the main transhipment points). On the other hand, some of the opium and heroin is also being trafficked by traders from neighbouring countries (notably from Pakistan, Iran and Tajikistan). The estimate below assumes that all these additional factors, influencing the total income of opium for the Afghan economy, more or less offset one another.
Table 38: Estimate of potential total Afghan gross income from the opium sector in 2004
Opiumexports
Opiumpricesper kg
Opiumdistributionbased on seizures
Heroinand
morphineexports
Heroin/morphineprice per
kg
Heroin/morphine
distributionbased on
opiumproduction
Total
Mid estimate Total exportsin tons
966 mt 498 mt
Central Asia US$ 600 3% US$ 5,500 30%
Pakistan US$ 445 5% US$ 3,445 46% Iran US$ 745 92% US$ 3,900 24% Unweighted average US$ 597 US$ 4,282 Weighted average export price by distribution
US$ 725 US$ 4,171
Value in billion US-$ (exports * export price)
US$ 0.70 billion
US$ 2.08 billion
US$ 2.8 billion
Minimum estimate Min exports in tons 897 mt 429 mt
Min value in billion US-$ US$ 0.65
billionUS$1.79
billionUS$ 2.4 billion
Maximum estimate Max exports in tons 1,035 mt 578 mt
Max value in billion US-$ US$ 0.75
billionUS$2.41
billionUS$ 3.2 billion

Afghanistan Opium Survey 2004
111
Annex 1 (Page 1 of 4)
Afghanistan opium poppy cultivation estimates (ha), 2004
Previous UNODC survey estimates1994 1995 1996 1997 1998 1999 2000 2001 2002 2003 2004
Badakhshan Baharak 111 64 116 9 202 23 86 345 180Fayz Abad 77 2,344 1,592 1,634 1,282 906 1,073 868 2,370 3,109Ishkashim 0 0 3 0 0 0 0 0Jurm 433 555 1,326 1,051 1,198 1,249 773 2,897 2,690 4,502Khwahan 0Kishim 1,093 3 177 62 62 385 507 2,191 2,840 4,530Kuran Wa MunjanRagh 0 0 8 31 2 8 0 0Shahri Buzurg 0 0 0 0 71 113 19 41 170 615Zebak 0 4 8 115 0 0 0
1,714 2,966 3,230 2,902 2,817 2,684 2,458 6,342 8,250 12,756 15,607
Badghis Ghormach 20 0 4 101Murghab 21 0 22 69
41 0 26 170 614
Baghlan Andarab 81 31 301Baghlan 152 0 120 16Dahana-I- Ghori 328 929 967 27 0 0 37Khinjan 9Khost Wa Firing 21Nahrin 1 63Puli Khumri 38 20 0 1 37Tala Wa Barfak 113
328 929 1,005 199 82 152 597 2,444Balkh Balkh 13 29 29 82 1 22 332
Chahar Bolak 165 530 2,600 53 0 0 68Chimtal 1,065 532 485 1,428 2,451 0 153 617Dawlat Abad 3 -Dihdadi 22 0 8 35Nahri Shahi 33 0 14 30Sholgara 28 0 19 28
1,065 710 1,044 4,057 2,669 4 217 1,108 2,495Bamyan Bamyan 20
Panjab 250Shibar 36Waras 191Yakawlang 112
610 803Farah Bakwa 1 13 129 31 129 259 0
Bala Buluk 8 19 169 36 186 183 0 513Farah 18 18 10 44 73 0Gulistan 581 252 94 428 849 0 1,187Pusht Rod
9 631 568 171 787 1,364 0 500 1,700 2,288Faryab Almar
Bilchiragh 6 0 26 232Maymana 1 0 0Pashtun Kot 11 0 1 281Qaysar 16 0 - 150Shirin Tagab 3 0 - 103
36 0 28 766 3,249Ghazni Ajristan 313
313 62Ghor Chaghcharan 700 1,189
Lal Wa SarjaPasaband 700 805Saghar 300 256Shahrak 640Taywara 500 808Tulak 84
2,200 3,782 4,983
Province District
Ghor Total
Bamyan Total
Farah Total
Faryab Total
Ghazni Total
Badakhshan Total
Badghis Total
Baghlan Total
Balkh Total

Afghanistan Opium Survey 2004
112
Annex 1 (Page 2 of 4)
Afghanistan opium poppy cultivation estimates (ha), 2004
Previous UNODC survey estimates1994 1995 1996 1997 1998 1999 2000 2001 2002 2003 2004
Province District
Hilmand Baghran 2,519 1,267 2,754 2,910 2,794 2,653 0 1,800 2,309Dishu 0 - 0Garmser 786 725 942 1,993 1,205 2,643 2,765 0 2,020 462Kajaki 979 4,087 2,814 3,904 3,959 5,746 4,625 0 2,640 1,392Lashkar Gah 2,256 885 1,054 1,325 1,869 2,528 3,145 0 1,140 605Musa Qala 1,154 5,137 3,924 4,360 5,574 7,013 5,686 0 3,690 2,455Nad Ali 12,529 5,983 4,035 5,102 5,156 8,667 8,323 0 5,880 870Nahri Sarraj 590 4,716 4,309 4,807 2,426 4,041 4,378 0 1,850 1,575Naw Zad 2,345 2,799 3,596 1,585 3,605 4,424 5,085 0 2,650 3,096Naway i Barakzayi 6,074 1,254 505 722 1,150 2,581 3,246 0 2,730 1,240Reg 222 0 1,940Sangin 2,866 973 1,909 1,971 1,734 2,646 1,711 0 2,810 777Washer 676 555 877 1,084 1,469 1,014 0 800 590
29,579 29,754 24,910 29,400 30,672 44,552 42,853 0 29,950 15,371 29,353Hirat Farsi 134
Obe 0Pashtun Zarghun 38 0 0 38 0 0Shindand 146 0 0Zinda Jan 0 0
38 0 0 184 0 50 134 2,531Jawzjan Aqcha 532 208 0 47 171
Fayz Abad 43 105 0 24 280Khamyab 6 30 51Mardyan 43 111 0 4 228Mingajik 1,789 141 0 7 64Qarqin 186 10 0 24 58Shibirghan 19 0 1 36
2,593 600 0 137 888 1,673Kabul Surobi 132 340 29 58 237
132 340 29 58 237 282Kandahar Arghandab 211 87 331 561 399 750 459 0 330 139
Arghistan 38 13 0 80 14Daman 110 50 0 190 357Ghorak 347 803 692 1,503 1,126 1,109 574 0 380 166Kandahar 320 53 234 21 73 227 156 0 640 293Khakrez 362 274 627 286 518 632 320 0 560 312Maruf 30 16 1 0 3 5 17 0 - 63Maywand 256 333 618 1,278 2,497 2,022 995 0 1,090 353Panjwayi 250 357 266 255 134 132 184 0 150 482Shah Wali Ko 678 97 94 127 162 236 238 0 260 489Spin Boldak 1,170 107 194 91 317 261 26 0 290 277Shorabak 111
3,624 2,127 3,057 4,122 5,229 5,522 3,034 0 3,970 3,055 4,959Kapisa Tagab 5 104 0 207 326
5 104 0 207 326 522Khost Jaji Maydan
Spera 0 - 118Tani 6 - 257
6 0 375 838Kunar Asad Abad 73 239 1 140 396
Bar Kunar 47 72 31 40 163Chawkay 13 11 0 0 8 9 50 8 140 83Dangam 4 49Khas Kunar 75 82 10 0 12 50 173 0 70 0Marawara 345Narang 15 1 0 13 27 84 10 100 173Nari 1 - 60Nurgal 27 19 5 0 8 28 98 9 70 353Pech 11 263 310Sirkanay 25 2 0 34 54 71 8 100 141
115 152 18 0 75 288 786 82 972 2,025 4,366Kunar Total
Kabul Total
Kandahar Total
Kapisa Total
Khost Total
Hilmand Total
Hirat Total
Jawzjan Total
CND UNODC Af h i t O i S 2004

Afghanistan Opium Survey 2004
113
Annex 1 (Page 3 of 4)
Afghanistan opium poppy cultivation estimates (ha), 2004 Previous UNODC survey estimates
1994 1995 1996 1997 1998 1999 2000 2001 2002 2003 2004Province District
Kunduz Ali Abad 5 51 0 3 5Chahar Dara 8 30 0 6 15Imam Sahib 3 0 -Khan Abad 2 36 0 - 11Kunduz 9 51 0 3 9Qalay-I- Zal 11 321 0 5 8
38 489 0 16 49 224Laghman Alingar 2 71 131 3 146 354
Alishing 3 26 88 0 104 148Dawlat Shah 12 - 571Mihtarlam 14 72 190 0 240 366Qarghayi 58 128 298 0 460 468
77 297 707 15 950 1,907 2,75624
Nangarhar Achin 5,354 2,187 2,315 1,640 1,693 2,209 1,317 1 940 2,131Bati Kot 3,797 529 392 1,013 2,034 603 535 0 2,390 1,994Chaparhar 1,089 1,377 1,750 1,234 1,365 977 832 2 990 1,169Dara-I-Nur 1,302 392 199 73 199 734 421 0 380 24Dih Bala 307 646 354 569 511 468 439 11 650 927Dur Baba 29 78 38 39 56 50 33 0 40 31Goshta 1,249 467 116 77 122 240 238 99 150 13Hisarak 202 453 253 370 436 741 541 2 620 1,016Jalal Abad 458 31 51 123 397 979 1,021 0 90 4Kama 0 18 0 0 198 389 589 0 1,120 558Khogyani 4,347 2,577 2,628 3,385 3,808 5,338 4,913 3 2,640 2,986Kuz Kunar 293 233 115 15 105 236 399 0 500 102Lal Pur 302 267 79 66 137 270 248 95 250 1Muhmand Dara 1,630 0 156 83 125 290 255 0 720 19Nazyan 343 138 251 111 252 184 177 0 150 98Pachir Wa Agam 768 571 681 400 488 731 630 3 420 1,142Rodat 1,026 2,038 1,959 1,583 2,147 3,649 2,302 0 2,760 3,313Sherzad 1,954 2,351 1,646 1,689 1,302 1,741 1,719 2 1,470 1,641Shinwar 3,884 1,265 2,075 1,478 1,374 1,559 1,300 0 2,060 1,616Surkh Rod 747 106 587 619 1,072 1,602 1,840 0 1,440 118
29,081 15,724 15,645 14,567 17,821 22,990 19,747 218 19,780 18,904 28,213Nimroz Chahar Burjak 0 0
Kang 10 2 1 107 5 2 0 0 0Khash Rod 672 117 135 535 6 201 219 0 26
682 119 136 642 11 203 219 0 300 26 115Nuristan Bargi Matal 0
Kamdesh 210Nuristan 438
648 764Paktika
0 0 0 0 0 0 0Paktya Azra 4 29 46 1 38 419
Chamkani 0 - 76Jaji 0 - 185Lija Mangal 0 -Sayid Karam 0 - 41
4 29 46 1 38 721 1,2001,310
Samangan Aybak 14
Dara-I- Suf 614 34Hazrati Sultan 29Khuram Wa Sarbagh 54 0 24
54 614 100 101 1,151Sari Pul Sangcharak 453
Sari Pul 595Sozma Qala 146 0 57 380
146 0 57 1,428 1,974Sari Pul Total
Nimroz Total
Nuristan Total
Paktya Total
Samangan Total
Kunduz Total
Laghman Total
Nangarhar Total
Parwan Total
Logar Total
Paktya Total
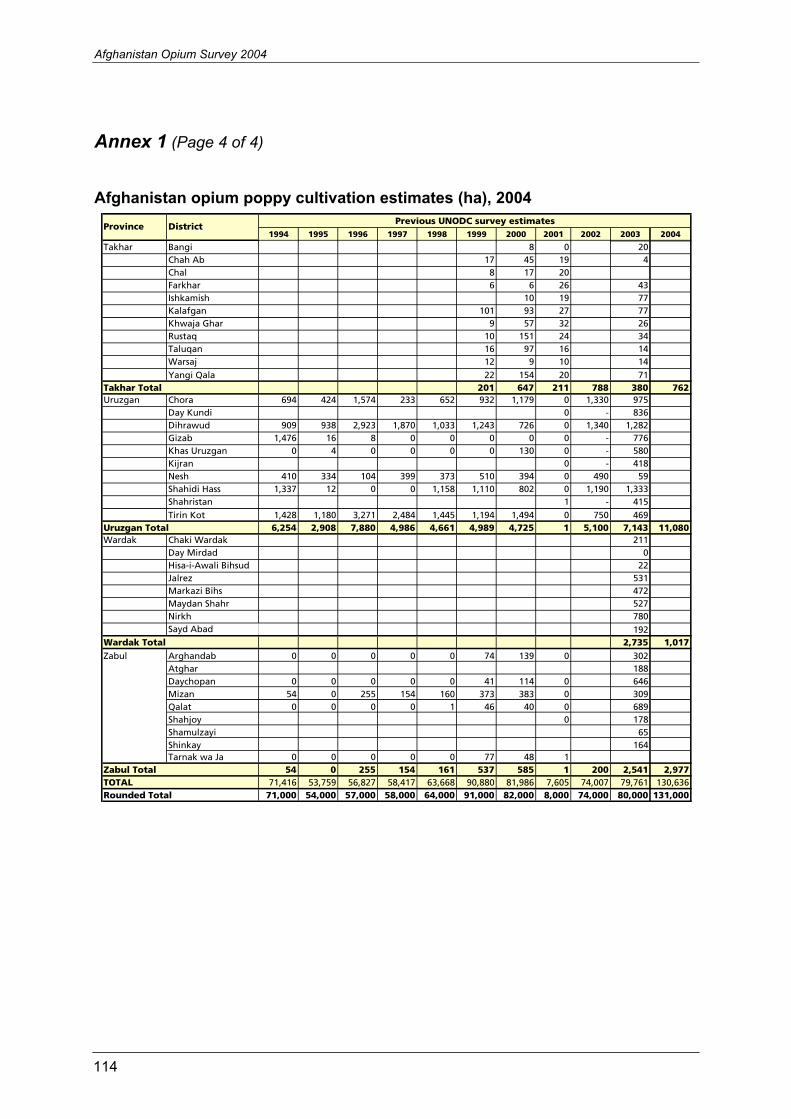
Afghanistan Opium Survey 2004
114
Annex 1 (Page 4 of 4)
Afghanistan opium poppy cultivation estimates (ha), 2004
Previous UNODC survey estimates1994 1995 1996 1997 1998 1999 2000 2001 2002 2003 2004
Province District
Takhar Bangi 8 0 20Chah Ab 17 45 19 4Chal 8 17 20Farkhar 6 6 26 43Ishkamish 10 19 77Kalafgan 101 93 27 77Khwaja Ghar 9 57 32 26Rustaq 10 151 24 34Taluqan 16 97 16 14Warsaj 12 9 10 14Yangi Qala 22 154 20 71
201 647 211 788 380 762Uruzgan Chora 694 424 1,574 233 652 932 1,179 0 1,330 975
Day Kundi 0 - 836Dihrawud 909 938 2,923 1,870 1,033 1,243 726 0 1,340 1,282Gizab 1,476 16 8 0 0 0 0 0 - 776Khas Uruzgan 0 4 0 0 0 0 130 0 - 580Kijran 0 - 418Nesh 410 334 104 399 373 510 394 0 490 59Shahidi Hass 1,337 12 0 0 1,158 1,110 802 0 1,190 1,333Shahristan 1 - 415Tirin Kot 1,428 1,180 3,271 2,484 1,445 1,194 1,494 0 750 469
6,254 2,908 7,880 4,986 4,661 4,989 4,725 1 5,100 7,143 11,080Wardak Chaki Wardak 211
Day Mirdad 0Hisa-i-Awali Bihsud 22Jalrez 531Markazi Bihs 472Maydan Shahr 527Nirkh 780Sayd Abad 192
2,735 1,017Zabul Arghandab 0 0 0 0 0 74 139 0 302
Atghar 188Daychopan 0 0 0 0 0 41 114 0 646Mizan 54 0 255 154 160 373 383 0 309Qalat 0 0 0 0 1 46 40 0 689Shahjoy 0 178Shamulzayi 65Shinkay 164Tarnak wa Ja 0 0 0 0 0 77 48 1
54 0 255 154 161 537 585 1 200 2,541 2,97771,416 53,759 56,827 58,417 63,668 90,880 81,986 7,605 74,007 79,761 130,636
Rounded Total 71,000 54,000 57,000 58,000 64,000 91,000 82,000 8,000 74,000 80,000 131,000
Zabul TotalTOTAL
Takhar Total
Uruzgan Total
Wardak Total

Afghanistan Opium Survey 2004
115
Annex 2
Provincial records of opium poppy cultivation, changes 2003-2004
Region Province 2003 2004 change 03-04Year of maximum
cultivation
Maximum level of opium poppy
cultivation
Hilmand 15,371 29,353 91% 1999 44,552
Uruzgan 7,143 11,080 55% 2004 11,219
Kandahar 3,055 4,959 62% 1999 5,522
Zabul 2,541 2,977 17% 2004 2,977
Ghazni NS 62 N/A 1994 313
Paktika NS NS N/A
Total 28,110 48,431 72%
Nangarhar 18,904 28,213 49% 2004 30,840
Kunar 2,025 4,366 116% 2004 4,366
Laghman 1,907 2,756 45% 2004 2,756
Nuristan 648 764 18% 2004 764
Kapisa 326 522 60% 2004 522
Total 23,810 36,621 54%
Badakhshan 12,756 15,607 22% 2004 15,607
Takhar 380 762 101% 2002 788
Total 13,136 16,369 25%
Faryab 766 3,249 324% 2004 3,249
Balkh 1,108 2,495 125% 1999 4,057
Baghlan 597 2,444 309% 2004 2,444
Sari Pul 1,428 1,974 38% 2004 1,974
Jawzjan 888 1,673 88% 1999 2,593
Samangan 101 1,151 1040% 2004 1,151
Bamyan 610 803 32% 2004 803
Badghis 170 614 261% 2004 614
Kunduz 49 224 357% 2000 489
Total 5,717 14,627 156%
Ghor 3,782 4,983 33% 2004 5,024
Hirat 134 2,531 1789% 2004 2,531
Farah 1,700 2,288 35% 2004 2,288
Nimroz 26 115 342% 1994 682
Total 5,642 9,917 76%
Central Wardak NS 1,310 N/A 2004 1,310
Paktya 721 1,200 63% 2004 1,200
Parwan 2,735 1,017 -63% 2003 2,735
Khost 375 838 123% 2004 838
Kabul 237 282 19% 2004 282
Logar NS 24 N/A 2004 24
Total 4,068 4,671 15%
80,000 131,000 63%
Northern
Western
Rounded Total
NS = not surveyed; N/A not applicable
Southern
Eastern
North-eastern
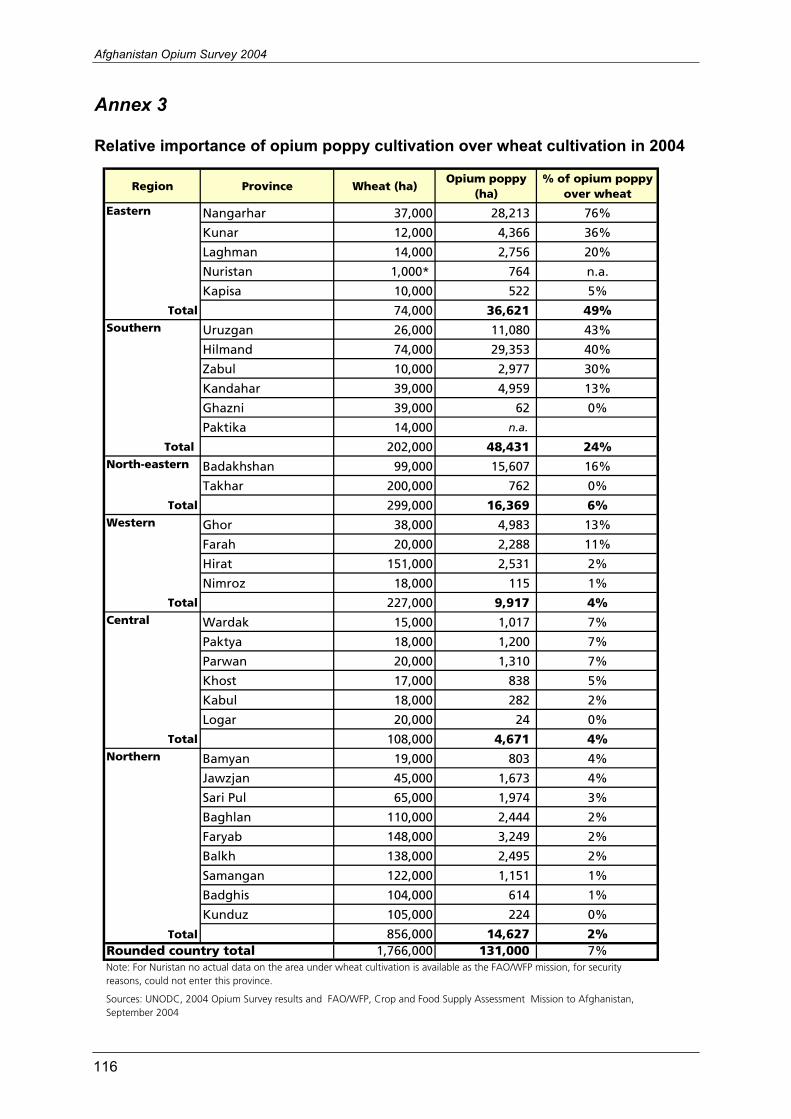
Afghanistan Opium Survey 2004
116
Annex 3
Relative importance of opium poppy cultivation over wheat cultivation in 2004
Region Province Wheat (ha)Opium poppy
(ha)% of opium poppy
over wheat
Nangarhar 37,000 28,213 76%
Kunar 12,000 4,366 36%
Laghman 14,000 2,756 20%
Nuristan 1,000* 764 n.a.
Kapisa 10,000 522 5%
Total 74,000 36,621 49%
Uruzgan 26,000 11,080 43%
Hilmand 74,000 29,353 40%
Zabul 10,000 2,977 30%
Kandahar 39,000 4,959 13%
Ghazni 39,000 62 0%
Paktika 14,000 n.a.
Total 202,000 48,431 24%
Badakhshan 99,000 15,607 16%
Takhar 200,000 762 0%
Total 299,000 16,369 6%
Ghor 38,000 4,983 13%
Farah 20,000 2,288 11%
Hirat 151,000 2,531 2%
Nimroz 18,000 115 1%
Total 227,000 9,917 4%
Wardak 15,000 1,017 7%
Paktya 18,000 1,200 7%
Parwan 20,000 1,310 7%
Khost 17,000 838 5%
Kabul 18,000 282 2%
Logar 20,000 24 0%
Total 108,000 4,671 4%
Bamyan 19,000 803 4%
Jawzjan 45,000 1,673 4%
Sari Pul 65,000 1,974 3%
Baghlan 110,000 2,444 2%
Faryab 148,000 3,249 2%
Balkh 138,000 2,495 2%
Samangan 122,000 1,151 1%
Badghis 104,000 614 1%
Kunduz 105,000 224 0%
Total 856,000 14,627 2%Rounded country total 1,766,000 131,000 7%
Central
Northern
Note: For Nuristan no actual data on the area under wheat cultivation is available as the FAO/WFP mission, for security reasons, could not enter this province.
Sources: UNODC, 2004 Opium Survey results and FAO/WFP, Crop and Food Supply Assessment Mission to Afghanistan, September 2004
Eastern
Southern
North-eastern
Western

Afghanistan Opium Survey 2004
117
Annex 4
Opium prices in Afghanistan in US$ per kilogram in 2004 – provincial breakdown
Region ProvinceAverage dateof price collection
(month/day)
Average of fresh opium prices
Average ofdry opium prices
North-eastern BADAKHSHAN 07-Jan 48 80
TAKHAR Jun-23 37 52
Average Jun-27 42 65
Northern BADGHIS May-13 96 159
BAGHLAN May-31 55 146
BALKH May-19 63 88
BAMYAN 06-Feb n.a. 115
FARYAB May-14 64 95
JAWZJAN May-26 60 87
KUNDUZ 06-Jan 76 106
SAMANGAN 06-Sep 65 88
SARI PUL May-23 71 104
Average May-26 66 109
Central KABUL Apr-25 130 285
KHOST Jun-29 103 94
LOGAR Apr-26 105 n.a.
PAKTYA May-19 82 145
PARWAN 05-Oct 99 141
WARDAK Jun-27 88 104
Average May-26 97 133
Southern GHAZNI May-23 n.a. 236
HILMAND 05-Jul 132 159
KANDAHAR 05-May 118 136
PAKTIKA 05-Dec n.a. n.a.
URUZGAN May-18 128 151
ZABUL Apr-19 113 141
Average May-13 123 150
Western FARAH 05-Aug 121 178
GHOR May-26 79 128
HIRAT May-21 112 161
NIMROZ 04-Nov 139 208
Average May-16 106 158
Eastern KAPISA Apr-22 106 138
KUNAR 05-Nov 80 161
LAGHMAN Apr-20 84 185
NANGARHAR Apr-20 110 224
NURISTAN Apr-21 79 212
Average Apr-26 94 192
May-21 86 138Country Average
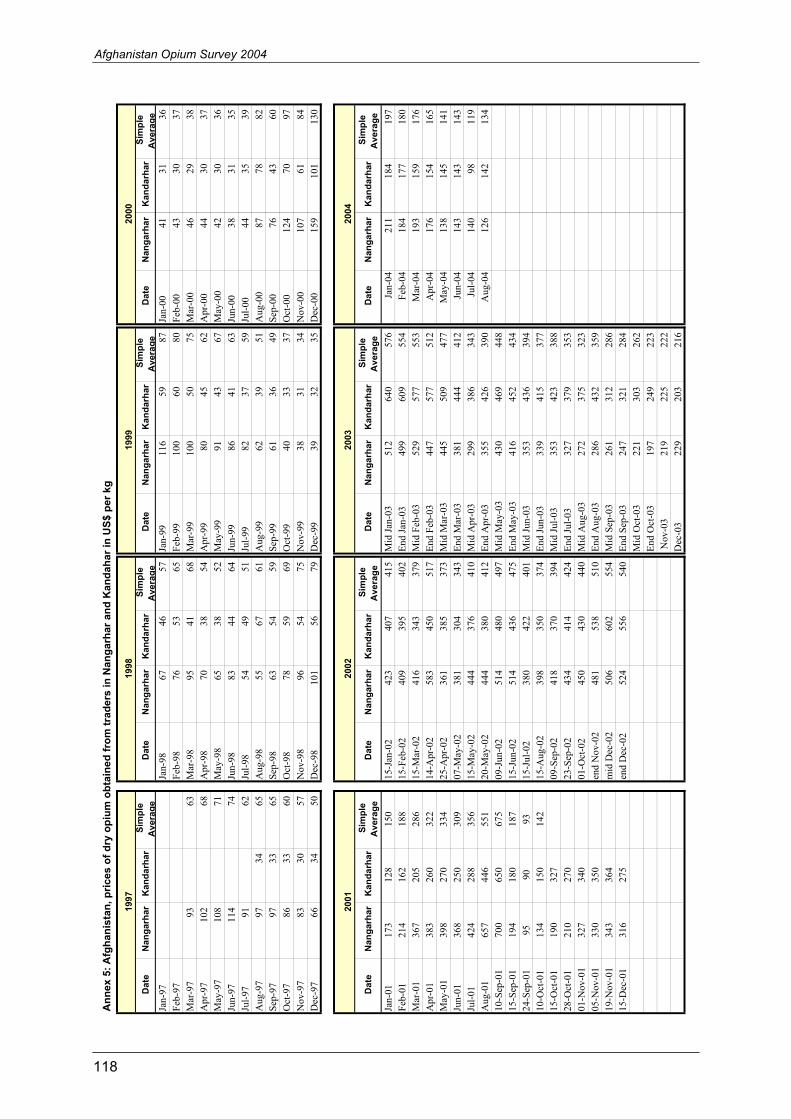
Afghanistan Opium Survey 2004
118
An
nex 5
: A
fgh
an
ista
n, p
rices o
f d
ry o
piu
m o
bta
ined
fro
m t
rad
ers
in
Nan
garh
ar
an
d K
an
dah
ar
in U
S$ p
er
kg
Date
N
an
garh
ar
Kan
darh
ar
Sim
ple
Avera
ge
Date
N
an
garh
ar
Kan
darh
ar
Sim
ple
Avera
ge
Date
N
an
garh
ar
Kan
darh
ar
Sim
ple
Avera
ge
Date
N
an
garh
ar
Kan
darh
ar
Sim
ple
Avera
ge
Jan-9
7Ja
n-9
867
46
57
Jan-9
9116
59
87
Jan-0
041
31
36
Feb
-97
Feb
-98
76
53
65
Feb
-99
100
60
80
Feb
-00
43
30
37
Mar
-97
93
63
Mar
-98
95
41
68
Mar
-99
100
50
75
Mar
-00
46
29
38
Apr-
97
102
68
Apr-
98
70
38
54
Apr-
99
80
45
62
Apr-
00
44
30
37
May
-97
108
71
May
-98
65
38
52
May
-99
91
43
67
May
-00
42
30
36
Jun-9
7114
74
Jun-9
883
44
64
Jun-9
986
41
63
Jun-0
038
31
35
Jul-
97
91
62
Jul-
98
54
49
51
Jul-
99
82
37
59
Jul-
00
44
35
39
Aug-9
797
34
65
Aug-9
855
67
61
Aug-9
962
39
51
Aug-0
087
78
82
Sep
-97
97
33
65
Sep
-98
63
54
59
Sep
-99
61
36
49
Sep
-00
76
43
60
Oct
-97
86
33
60
Oct
-98
78
59
69
Oct
-99
40
33
37
Oct
-00
124
70
97
Nov-9
783
30
57
Nov-9
896
54
75
Nov-9
938
31
34
Nov-0
0107
61
84
Dec
-97
66
34
50
Dec
-98
101
56
79
Dec
-99
39
32
35
Dec
-00
159
101
130
Date
N
an
garh
ar
Kan
darh
ar
Sim
ple
Avera
ge
Date
N
an
garh
ar
Kan
darh
ar
Sim
ple
Avera
ge
Date
N
an
garh
ar
Kan
darh
ar
Sim
ple
Avera
ge
Date
N
an
garh
ar
Kan
darh
ar
Sim
ple
Avera
ge
Jan-0
1173
128
150
15-J
an-0
2423
407
415
Mid
Jan
-03
512
640
576
Jan-0
4211
184
197
Feb
-01
214
162
188
15-F
eb-0
2409
395
402
End J
an-0
3499
609
554
Feb
-04
184
177
180
Mar
-01
367
205
286
15-M
ar-0
2416
343
379
Mid
Feb
-03
529
577
553
Mar
-04
193
159
176
Apr-
01
383
260
322
14-A
pr-
02
583
450
517
End F
eb-0
3447
577
512
Apr-
04
176
154
165
May
-01
398
270
334
25-A
pr-
02
361
385
373
Mid
Mar
-03
445
509
477
May
-04
138
145
141
Jun-0
1368
250
309
07-M
ay-0
2381
304
343
End M
ar-0
3381
444
412
Jun-0
4143
143
143
Jul-
01
424
288
356
15-M
ay-0
2444
376
410
Mid
Apr-
03
299
386
343
Jul-
04
140
98
119
Aug-0
1657
446
551
20-M
ay-0
2444
380
412
End A
pr-
03
355
426
390
Aug-0
4126
142
134
10-S
ep-0
1700
650
675
09-J
un-0
2514
480
497
Mid
May
-03
430
469
448
15-S
ep-0
1194
180
187
15-J
un-0
2514
436
475
End M
ay-0
3416
452
434
24-S
ep-0
195
90
93
15-J
ul-
02
380
422
401
Mid
Jun-0
3353
436
394
10-O
ct-0
1134
150
142
15-A
ug-0
2398
350
374
End J
un-0
3339
415
377
15-O
ct-0
1190
327
09-S
ep-0
2418
370
394
Mid
Jul-
03
353
423
388
28-O
ct-0
1210
270
23-S
ep-0
2434
414
424
End J
ul-
03
327
379
353
01-N
ov-0
1327
340
01-O
ct-0
2450
430
440
Mid
Aug-0
3272
375
323
05-N
ov-0
1330
350
end N
ov-0
2481
538
510
End A
ug-0
3286
432
359
19-N
ov-0
1343
364
mid
Dec
-02
506
602
554
Mid
Sep
-03
261
312
286
15-D
ec-0
1316
275
end D
ec-0
2524
556
540
End S
ep-0
3247
321
284
Mid
Oct
-03
221
303
262
End O
ct-0
3197
249
223
Nov-0
3219
225
222
Dec
-03
229
203
216
1997
1998
1999
2000
2001
2002
2003
2004
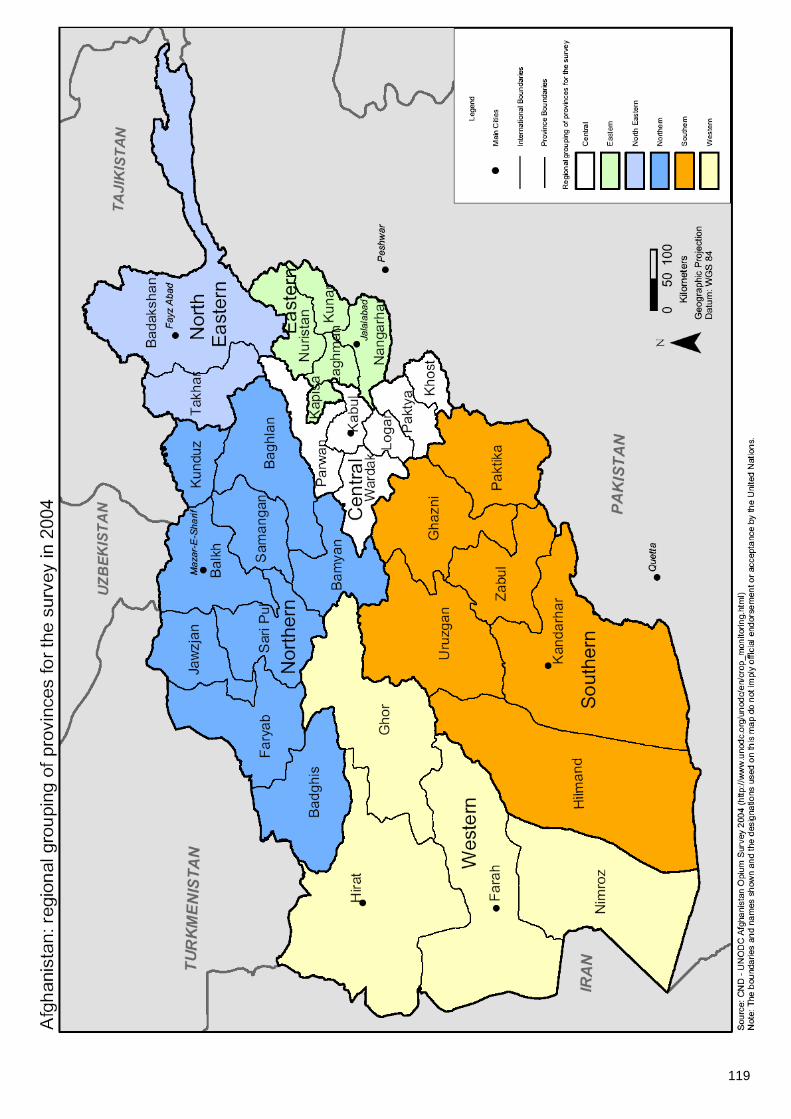
119