afghanistan opium survey 2005
TRANSCRIPT

Opium Survey 2005
Afghanistan
Nove
mbe
r 200
5
Government of AfghanistanMinistry of Counter Narcotics
Afghanistan Opium Survey 2005
i
ABBREVIATIONS
ANP Afghan National Police
CPEF Central Poppy Eradication Force
GPS Global Positioning System
ICMP UNODC Illicit Crop Monitoring Programme
MCN Ministry of Counter Narcotics
MoI Ministry of Interior
RAS UNODC Research and Analysis Section
UNODC United Nations Office on Drugs and Crime
ACKNOWLEDGEMENTS
The following institutions and individuals contributed to the implementation of the 2005 opium survey in Afghanistan, and to the preparation of the present report:
Afghan Government
Ministry of Counter Narcotics
United Nations Office on Drugs and Crime (Kabul)
Doris Buddenberg (Representative), Alexandre Schmidt (Deputy Representative), Hakan Demirbüken (Regional Illicit Crop Monitoring Expert for South West Asia and Survey Project Manager, RAS/ICMP), Nazir Ahmad Ahmad Shah (National Project Coordinator), Ziauddin Zaki (Database Management), Fazal Mohammad Fazli (Provincial Coordinator Kandahar), Mohammad Alam Ghalib (Provincial Coordinator Nangarhar), Altaf Hussain Joya (Provincial Coordinator Hirat), Mohammed Alem Yaqubi (Provincial Coordinator Badakhshan), Lutfi Rahman Lutfi (Provincial Coordinator Balkh), Mohammed Ishaq Anderabi (Survey Coordinator Badakhshan), Abdul Basir Basiret (Survey Coordinator Nangarhar), Abdul Latif Ehsan (Survey Coordinator Hirat), Abdul Jalil Hussain Khel (Survey Coordinator Balkh), Abdul Qadir Palwal (Survey Coordinator Kandahar) and Bert Tatham (Remote Sensing Consultant).
United Nations Office on Drugs and Crime (Vienna)
Coen Bussink (GIS/Remote Sensing Expert, RAS/ICMP), Ayako Kagawa (Cartographer, RAS), Anja Korenblik (Manager, RAS/ICMP), Suzanne Kunnen (Desktop Publishing, RAS), Thibault le Pichon (Chief, RAS), Thomas Pietschmann (Research Officer, RAS), Shirish Ravan (Remote Sensing Expert, RAS/ICMP), Barbara Remberg (Scientific Affairs Officer, LSS), Patrick Seramy (Database Management, RAS/ICMP) and Javier Teran, (Statistician, RAS/ICMP).
The implementation of the survey would not have been possible without the dedicated work of the field surveyors, who often faced difficult security conditions.
UNODC is grateful to Professor John Taylor and his colleagues for their contribution to the design of the survey methodology and other aspects related to the use of remote sensing in the 2005 Annual Opium Survey, as part of the collaboration agreement with Cranfield University’s Centre for Geographical Information Management (UK).
The implementation of UNODC Illicit Crop Monitoring Programme and the opium survey in Afghanistan in 2005 was made possible thanks to financial contributions from the Governments of the United Kingdom, Finland and Italy.
This report, and other ICMP survey reports can be downloaded from:
www.unodc.org/unodc/en/crop_monitoring.html

Afghanistan Opium Survey 2005
i
CONTENTS
ABBREVIATIONS...................................................................................................................................................I
ACKNOWLEDGEMENTS .....................................................................................................................................I
PREFACE ..............................................................................................................................................................III
FACT SHEET - AFGHANISTAN OPIUM SURVEY 2005 ................................................................................ 1
EXECUTIVE SUMMARY ..................................................................................................................................... 3
1 INTRODUCTION .............................................................................................................................................. 21
2 FINDINGS........................................................................................................................................................... 23
2.1 OPIUM POPPY CULTIVATION.......................................................................................................................... 23
2.2 OPIUM POPPY AND AGRICULTURAL LAND ................................................................................................ 44
2.3 CANNABIS CULTIVATION................................................................................................................................ 46
2.4 OPIUM YIELD...................................................................................................................................................... 47
2.5 ERADICATION..................................................................................................................................................... 53
2.6 POTENTIAL OPIUM PRODUCTION.................................................................................................................. 54
2.7 OPIUM FARMERS ............................................................................................................................................... 56
2.8 REASONS FOR REDUCING OR INCREASING OPIUM POPPY CULTIVATION......................................... 60
2.9 LOANS .................................................................................................................................................................. 63
2.10 EXTERNAL ASSISTANCE................................................................................................................................ 67
2.11 ETHNIC DISTRIBUTION .................................................................................................................................. 69
2.12 OPIUM PRICES .................................................................................................................................................. 71
2.13 POTENTIAL VALUE AND INCOME TO FARMERS ..................................................................................... 76
2.14 OPIUM AND HEROIN TRAFFICKING ............................................................................................................ 81
2.15 POTENTIAL VALUE AND INCOME TO THE AFGHAN ECONOMY......................................................... 83
2.16 ADDICTION........................................................................................................................................................ 85
3 METHODOLOGY ............................................................................................................................................. 89
3.1 OPIUM POPPY CULTIVATION.......................................................................................................................... 89
3.2 MAPPING OF AGRICULTURAL LAND AND OPIUM POPPY USING SPOT IMAGES ............................. 102
3.3 VILLAGE SURVEY METHODOLOGY............................................................................................................ 113
3.4 OPIUM YIELD AND PRODUCTION................................................................................................................ 116
3.5 OPIUM PRICE..................................................................................................................................................... 118
3.6 OPIUM GROWING FAMILIES ......................................................................................................................... 118
3.7 VALUE OF OPIUM PRODUCTION AT FARMGATE LEVEL ....................................................................... 118
3.8 VALUE OF AFGHAN OPIATES IN NEIGHBOURING COUNTRIES ........................................................... 120
4 ANNEXES ......................................................................................................................................................... 130
ANNEX 1: OPIUM CULTIVATION IN AFGHANISTAN PER PROVINCE, 2002-2005 (HECTARES) ............. 131
ANNEX 2: INDICATIVE DISTRICT LEVEL ESTIMATIONS OF OPIUM POPPY CULTIVATION,1994-2005 (HECTARES) ............................................................................................................................................................ 132


Afghanistan Opium Survey 2005
iii
PREFACE
The pace of democratic change in Afghanistan has been remarkable by any measure. The country’s successful realization of democracy’s milestones: the historic election of its President, the entry into force of its first ever Constitution and, most recently, fully democratic parliamentary elections – are all testimony to the conviction and courage of the country’s citizens and its leaders.
This year, progress on the illicit opium market is catching up with political change. For the first time since 2001, Afghanistan has succeeded in achieving a decrease in opium poppy cultivation with the area devoted to drug crops declining an impressive 21% to 104,000ha.
The decline in cultivation is important and encouraging. In concrete terms almost 50,000 heads of households made a decision not to plant their fields with opium poppy. One field out of five which was planted with an illicit opium crop in 2004, was planted with a licit crop in 2005. This is real progress, and we need to build on it quickly.
This year’s Survey spotlights elements that either contribute to or counter Afghanistan’s opium economy, i.e., the kinds of decisions that farmers tend to make, and their reasons for making these choices; the efficacy of anti-cultivation laws and eradication programmes—it is this kind of detailed knowledge that we need to construct sound counter-drug and development strategies in Afghanistan.
Afghanistan’s first comprehensive eradication programme was initiated during the 2004-2005 growing season. In October 2004, the Government of Afghanistan ordered provincial governors to eradicate opium fields; the central government also undertook separate eradication campaigns, run by a special-purpose Central Poppy Eradication Force (CPEF) and the Afghan National Police (ANP). In total, about 5,100 hectares may have been eradicated, roughly 5% of the 2005 opium cultivation. Almost three-fourths of the eradication (72%) took place in Nangarhar and Hilmand provinces, where, in 2004, poppy cultivation was ranked highest in the nation.
Unfortunately, although many Afghan growers cooperated with the Administration in 2005, nature did not. Favourable weather conditions and low rates of plant disease resulted in a much higher yield (kg per ha) than in the previous year. As a result, the total potential opium production decreased only some 2½%, to 4,100 tons. In 2005, Afghanistan’s share of opium production remains roughly 87% of the world total. Even so, reason for optimism remains. For example, in terms of value, net income from opium exports remained US$2.7 bn, but as a percentage of Afghanistan’s GDP, this figure has declined by 10 percent since last year. The licit sectors of the economy are expanding, slowly bringing a greater number of alternative opportunities for farmers currently engaged in illicit cultivation. These new opportunities, whether triggered by economic expansion or concentrated development assistance, remain critical to Afghanistan’s economic, social, and cultural recovery.
It may seem that in a country where reality is so stark, opportunities for the poor so limited, and consequences so dire, that there is not a great deal we can do to stop people from engaging in such a lucrative, albeit illegal, activity. That, however, is not what this year’s survey results reveal. This year, it was Afghanistan’s farmers who bravely complied with the government’s anti-cultivation messages or eradication policy. The lack of significant change in production, described above, must be attributed to yield, which is itself determined by forces beyond our control. What we can influence, however, is the decision by a farmer not to cultivate opium, and we do this through the rule of law, effective law enforcement, and through sustainable economic development. This is what we learned in 2005:
The law is a deterrent. Eradication of opium fields has been, and remains necessary: the law of the land, sanctioned by international conventions, must be respected. This year’s Survey found the civil and religious fatwa launched against drugs, the opium eradication programme, and the efficacy of law enforcement, were strong enough to create a deterrent to opium cultivation among farmers.
Viable, sustainable income generation programmes need to be in place to support both eradication and the decision not to cultivate. Again, we have learned a valuable lesson in 2005. To a considerable extent, in 2005, eradication was accompanied, and at times preceded, by alternative livelihood programmes and material support. Noteworthy is the fact that the 3 provinces where declines in cultivation were most striking (Nangarhar –96%, Badakshan –53%,) or where cultivation remained stable (Hilmand –10%), are the same 3 provinces that received the largest contributions for

Afghanistan Opium Survey 2005
iv
alternative development (Nangarhar $70.1 million, Badakshan US $47.3 million and Hilmand US $55.7 million).
When farmers engage in illicit activities they put themselves beyond the protection of the State, leave themselves open to corrupt and exploitative individuals, and absent themselves from Afghanistan’s bright potential. History demonstrates that, anywhere in the world, farmers who are given the option to choose between legality and illegality choose legality, even when the money earned is less. When the choice is between hunger and illegality, again, history tells us that farmers choose illicit pursuits, even when they may face serious retribution.
I call upon the Government and people of Afghanistan and the international community to respond quickly, and to build on the progress made this year: these achievements are fragile and could be easily reversed in the course of a season. Crop decline has been uneven, as some provinces actually increased cultivation in 2005 (Kandarhar, +162%, Nimroz, 1370%, Balkh, 334% and Farah, 348%). Whether this year’s decline will continue, or even accelerate over the years, will depend on the ability to stay the policy course, and to continue building an environment where the rule of law thrives, human security is strong, and opportunities for livelihood are ever present. To do this, we need to sustain our commitment to Afghanistan.
The key to counter-narcotics success will be the development of countryside replete with infrastructure, with irrigation facilities, market outlets and protection under law. For the period ahead, the Government has identified six key areas of intervention in rural areas: products and markets; infrastructure; rural micro-finance; post-war reconstruction; honest local administration; and the elaboration of a social safety net. This needs to be supported wholeheartedly and across the board.
The international community must have the wisdom to fight drugs and poverty simultaneously, to eliminate both the causes and the effects of these twin afflictions. This will be vital to sustaining 2005’s gains. If there is one concrete measure that the Government and its development assistance partners can take now to ensure Afghanistan’s future, it is this: food security and income generation programmes must remain in place, to support both the farmers’ decisions not to plant opium, and enforcement measures designed to eradicate drug crops.
Most importantly, the burden of drug control should not rest only on the shoulders of the poor; measures must also be taken to target illicit wealth belonging to corrupt officials. To this end, the international community must be prepared to fight drugs, corruption and terrorism simultaneously and with equal determination.
It will take time and commitment to deal with the Afghanistan opium problem. Measurable initiatives can and should be pursued in the course of the next 12-24 months to sustain the declining reliance of farming communities on opium. These initiatives should include:
The removal of corrupt governors;
The removal of all government administration officials found to be involved in or benefiting from the drug industry;
A commitment by all newly elected members of the Afghan Parliament to abstain from direct or indirect involvement in the drug industry;
The disarmament and reintegration of militias, and a zero-tolerance policy towards their commanders’ (warlords) involvement in drug refining (labs) and trafficking;
The facilitation of mutual legal assistance and extradition of major drug traffickers, including making Afghan domestic legislation compatible with the need to provide evidence for, and serve international arrest warrants;
A commitment by farming communities to refrain from drug cultivation as a condition for the receipt of future development assistance.

Afghanistan Opium Survey 2005
v
Dismantling the opium economy in Afghanistan with the instruments of democracy, the rule of law and rural development continues to be a very complex process. UNODC is, and will remain a loyal partner, committed to helping Afghanistan and other Member States realize every aspect of this historic task. We owe this not only to the Afghans, who are struggling to free themselves from the scourge of drug production, but also to the more than 100,000 people who die annually, directly or indirectly, as a result of their addiction to Afghan opium.
Antonio Maria Costa Executive Director
UNODC


Afghanistan Opium Survey 2005
1
FACT SHEET - AFGHANISTAN OPIUM SURVEY 2005
2004 Variation
on 2004 2005
Net opium poppy cultivation 131,000 ha - 21% 104,000 ha
in percent of actual agricultural land 2.9% 2.3%
number of provinces affected1 32 (all) 25
Average opium yield 32 kg/ha 22% 39 kg/ha
Production of opium 4200 mt -2.4% 4,100 mt
in percent of world illicit opium production 87% 87%2
Number of households involved in opium cultivation
356,000 - 13% 309,000
Number of persons involved in opium cultivation
2.3 million 2.0 million
in percent of total population (23 million) 10% 8.7%
Average farm-gate price of fresh opium at harvest time
US$ 92 + 11% US$ 102/kg
Average farm-gate price of dry opium at harvest time
US$ 142 - 3% US$ 138/kg
Afghanistan GDP3 US $ 4.7 billion +10.4% US $ 5.2 billion
Total export value of opium to neighbouring countries
US$ 2.8 billion - 3.6% US$ 2.7 billion
in percent of GDP 61% 52%
gross trafficking profits of Afghan traffickers US$ 2.2 billion - 2.7% US$ 2.14 billion
total farm-gate value of opium production: US$ 600 million - 6.6% US$ 560 million
Household average yearly gross income from opium of opium growing families
US$ 1,700 + 6% US$ 1,800
Per capita gross income from opium of opium growing families
US$ 260 US$ 280
Afghanistan’s GDP per capita US$ 206 US$ 226
Indicative gross income from opium per ha US$ 4,600 +17% US$ 5,400
Indicative gross income from wheat per ha US$ 390 +41% US$ 550
1 In 2005, the Afghan Government reorganized the country’s administrative division into 34 provinces. However, the 2005 opium survey was designed, and its results are presented, according to the previous administrative division into 32 provinces.
2 Preliminary estimate
3 Source: Afghan Government, Central Statistics Office: GDP figures for the year 1382 (2003/2004): Afs 223,629 millions and for the year 1383 (2004/2005): Afs : 254,487 millions.


Afghanistan Opium Survey 2005
3
EXECUTIVE SUMMARY
Opium poppy cultivation decreased by 21% to 104,000 hectares in Afghanistan in 2005
The area under opium poppy cultivation in Afghanistan decreased by 21% from about 131,000 hectares (ha) in 2004 to a level of 104,000 ha in 2005.
Afghanistan opium poppy cultivation, 1994-2005 (hectares)
1994 1995 1996 1997 1998 1999 2000 2001 2002 2003 2004 2005
71,000 54,000 57,000 58,000 64,000 91,000 82,000 8,000 74,000 80,000 131,000 104,000
Afghanistan: Opium poppy cultivation from 1986 to 2005 (hectares)
29
,00
0
25
,00
0
32
,00
0
34
,00
0
41
,00
0
51
,00
0
49
,00
0
58
,00
0
71
,00
0
54
,00
0
57
,00
0
58
,00
0
64
,00
0
91
,00
0
82
,00
0
8,0
00
74
,00
0
80
,00
0
13
1,0
00
10
4,0
00
0
20,000
40,000
60,000
80,000
100,000
120,000
140,000
86 87 88 89 90 91 92 93 94 95 96 97 98 99 00 01 02 03 04 05
he
cta
res
As a result of the decline in opium cultivation in Afghanistan in 2005, global opium poppy cultivation will fall by some 16% in 2005. The share of Afghanistan would remain almost stable at 67%.
Global opium poppy cultivation 1990-2005* (hectares)
0
50,000
100,000
150,000
200,000
250,000
300,000
19
90
19
91
19
92
19
93
19
94
19
95
19
96
19
97
19
98
19
99
20
00
20
01
20
02
20
03
20
04
20
05
he
cta
res
Afghanistan Myanmar Lao PDR Rest of the World
* For 2005, estimates for the “rest of the world” and Myanmar are still tentative

Afghanistan Opium Survey 2005
4
Opium poppy cultivation decreased in 19 provinces in 2005. The largest declines -in absolute terms- were found in Nangarhar (27,120 ha), Badakshan (8,237 ha) and in Uruzgan (6,475 ha). A very sharp decrease of 96% was observed in Nangarhar, the number two opium poppy producing province in 2004 (28,213 ha). Badakshan and Uruzgan, with the third and fourth largest areas under opium poppy cultivation in 2004, dropped to the fifth and sixth place in 2005. Opium cultivation in Central Afghanistan (Parwan, Paktya, Wardak, Khost, Kabul and Logar) almost disappeared in 2005: declining from 4,600 ha in 2004 to 106 hectares in 2005. Hilmand remained the province with the largest area under cultivation, although it declined by 10%.
Increases of more than 10% were seen in 10 provinces. Major increases –in absolute terms- were found in Balkh (8,342 ha), Kandahar (8,030 ha) and Farah (7,952 ha). Poppy cultivation in Kandahar increased 162% to 12,989 ha making it the province with the second largest area under cultivation. Surprisingly, Balkh, with a 334% increase, became the number three opium poppy producing province followed by Farah at 10,240 hectares. Neither province was an important producer last year or in previous years. In 2005, opium poppy cultivation moved from traditional growing areas (Hilmand, Laghman, Nangarhar, Uruzgan) to new provinces (Badghis, Balkh, Farah, Samangan).
The main opium poppy cultivation provinces in 2005 were (in order of magnitude): Hilmand, Kandahar, Balkh, Farah and Badakshan. Together, these 5 provinces represented 65% of the total area under opium poppy cultivation in 2005.
Main opium poppy cultivation provinces in Afghanistan in 2005 (hectares)
35% of farmers reported they decreased cultivation due to fear of eradication
As part of the survey 2,073 farmers in 1,243 villages across Afghanistan were asked why they were increasing or decreasing opium poppy cultivation. A total of 1,922 farmers (93%) reported reasons for the decline or the non-cultivation of opium poppy while only 151 farmers (7%) reported reasons for an increase of opium poppy cultivation in 2005. The main reasons quoted by farmers for not cultivating or reducing opium poppy cultivation in 2005 were:
Fear of eradication (35%)
Fear of imprisonment (20%)
Forbidden by Islam (16%)
Poppy ban (15%)
Lower prices and less demand (10%)
The same question was asked as part of the UNODC’s Farmers Intention Survey 2003/04, though at an earlier stage of the crop cycle, before the farmers had actually planted the opium poppy. At that time, in October 2003, the number of farmers reporting that they would reduce opium poppy cultivation was significantly lower and the main reasons for reducing opium poppy cultivation were: ‘forbidden by Islam’ and ‘poppy ban’. In 2004/05, ‘fear of eradication’ gained strongly in importance as a deterrent to cultivating opium poppy.
The main reasons quoted by farmers for having increased opium poppy cultivation in 2005 were:
Higher opium prices and higher demand for opium (40%)
Personal consumption requirements (21%)
High cost of wedding (16%)
Province 2003 2004 2005Change 2004-
2005% Total in 2005
Cumulative
%Hilmand 15,371 29,353 26,500 -10% 25% 25%Kandahar 3,055 4,959 12,989 162% 12% 38%Balkh 1,108 2,495 10,837 334% 10% 48%Farah 1,700 2,288 10,240 348% 10% 58%Badakhshan 12,756 15,607 7,370 -53% 7% 65%
Rest of the Country 46,010 76,298 36,064 -53% 35% 100%
Rounded Total 80,000 131,000 104,000 -21%

Afghanistan Opium Survey 2005
5
As in the UNODC’s Farmers Intention Survey 2003/04 findings, the high price of opium was one of the main reasons for increasing opium poppy cultivation. The need to engage in opium production to satisfy personal consumption requirements, which was not mentioned in 2003/04, showed a surprisingly high affirmative response. However, the sample of farmers admitting to increasing opium poppy cultivation in 2005 was small, so these results must be treated with some caution.
Potential opium production estimated at 4,100 metric tons (- 2.4%)
Potential opium production was estimated at around 4,100 metric tons (mt), representing a decrease of about 2.4% compared to 2004. The apparent discrepancy between the decrease in opium production and the decrease in cultivation was due to improved weather conditions. The opium yield in 2005 was estimated at 39 kg/ha, an increase of 22% compared to the 2004 yield (32 kg/ha).
Afghanistan potential opium production, 1994-2005 (metric tons)
1994 1995 1996 1997 1998 1999 2000 2001 2002 2003 2004 2005
3,400 2,300 2,200 2,800 2,700 4,600 3,300 185 3,400 3,600 4,200 4,100
Afghanistan: Opium production from 1980 to 2005 (metric tons)
200
225
275
488
160
450
350
875
1,1
20
1,2
00
1,6
00
2,0
00
2,0
00
2,3
00
3,4
00
2,3
00
2,2
00
2,8
00
2,7
00
4,6
00
3,3
00
200
3,4
00
3,6
00
4,2
00
4,1
00
0
1,000
2,000
3,000
4,000
5,000
80 81 82 83 84 85 86 87 88 89 90 91 92 93 94 95 96 97 98 99 00 01 02 03 04 05
me
tric
to
ns
Global opium poppy cultivation is estimated to have fallen by some 16% in 2005 and opium production by some 3% as a result of the decline in opium cultivation and production in Afghanistan. The proportion of Afghanistan in global opium production is likely to remain close to 87%.
Global opium production 1990-2005* (metric tons)
0
1,000
2,000
3,000
4,000
5,000
6,000
19
90
19
91
19
92
19
93
19
94
19
95
19
96
19
97
19
98
19
99
20
00
20
01
20
02
20
03
20
04
20
05
me
tric
to
ns
Afghanistan Myanmar Lao PDR Rest of the World
* For 2005, estimates for the “rest of the world” and Myanmar are still tentative

Afghanistan Opium Survey 2005
6
Opium prices remain high
The average price for fresh opium at the time of harvest, weighted by regional opium production, amounted to US$ 102 per kilogram, an 11% increase compared to last year. Fresh opium prices at the farm-gate level remain three to four times higher than in the second half of the 1990s. They are, however, significantly lower than over the 2001-2003 period when they had risen to around US$300.
Fresh opium farm-gate prices at harvest time (weighted by regional production) in Afghanistan, 1994 – 2005 (US$/kg)
30
23
24 34
33 40
28
30
1
35
0
28
3
92 10
2
0
50
100
150
200
250
300
350
400
94 95 96 97 98 99 00 01 02 03 04 05
US
$/k
g
The prices of dry opium remained relatively stable, decreasing 3% from US$ 142 in 2004 to US$ 138 per kilogram in 2005. The fragmentation of the Afghan opium market continues to give rise to important regional price differences. The lowest prices were found in Northern Afghanistan (US$112), reflecting the following factors: lower prices in neighbouring Tajikistan; a limited number of traders; and, an increase in opium production. Prices were highest in Central Afghanistan (US$235) where production basically ceased in 2005. Prices were above average in Eastern Afghanistan, possibly due to law enforcement activities, and in Western Afghanistan (US$164), reflecting high opium prices in neighbouring Iran.
309,000 families are involved in opium poppy cultivation (compared with 356,000 in 2004)
The number of families involved in opium poppy cultivation decreased by 13% to 309,000 in 2005 (356,000 in 2004). This number represents about 2 million persons, 8.7% of the total population in Afghanistan (down from 10% in 2004) and 11.2% of the rural population in 2005. (The number of itinerant workers who work on poppy cultivation is not included).
Total number of opium poppy growing farmers
The farmers who ceased cultivation in 2005 had received an average 13% of their total income from opium in 2004. In contrast, farmers who continued growing in 2005 had obtained 28% of their total income from opium in 2004.
RegionTotal Poppy
Farmers
Average opium
poppy cultivation
area per farmer (ha)Central Negligible
East 22,169 0.17
North-Easter 37,241 0.25
Northern 101,266 0.27
Southern 89,468 0.33
Western 58,869 0.32Rounded total 309,000 0.25

Afghanistan Opium Survey 2005
7
Estimated farmers’ per capita gross income from opium rose 6%, but poppy to wheat income ratio in 2005
(10:1) smaller than in 2004 (12:1)
The yearly gross income per opium growing family increased by 6% to US$1,800 in 2005. The increase was entirely due to higher yields, which rose by 22% in 2005. The gross income from poppy cultivation per hectare increased to US$5,400. This is almost 10 times higher than the gross income a farmer could expect from one hectare of wheat (US$550 per hectare on irrigated land). This poppy to wheat income ratio (10:1) is now smaller than in 2004 (12:1) or 2003 (27:1). The net income from opium could not be estimated, but costs for opium poppy cultivation are thought to be relatively high. Inputs to cultivation including labour, fertilizer, seed, fuel, depreciation of agricultural equipment, as well as taxes paid to local commanders and various bribes keep these costs high.
Gross income of poppy cultivation in US$ per hectare
1,000 1,100
7,400
16,200
12,700
4,6005,400
-
2,000
4,000
6,000
8,000
10,000
12,000
14,000
16,000
18,000
1995 2000 2001 2002 2003 2004 2005
US
$/h
a
Gross income of opium poppy and wheat in US$ per hectare
12,700
4,600
5,400
470 390 550
-
2,000
4,000
6,000
8,000
10,000
12,000
14,000
2003 2004 2005
US
$/h
a
Opium poppy
Wheat

Afghanistan Opium Survey 2005
8
Total farm-gate value of opium decreased 5% to US$ 560 million
Based on opium production and reported opium prices, the farm-gate value of the opium harvest amounted to US$ 560 million in 2005. Slightly lower production (-2.4%) and lower prices (-3%) reduced the overall farm-gate value of opium production. It was 6.6% lower than in 2004 and 45% lower than in 2003. The farm-gate value was equivalent to 11% of GDP (2004/05), down from 13% a year earlier.
Estimated value of opium production at farm-gate level, 1994-2005
102 54 54 95 88183
91
560
1,200
56
1,020
600
-
200
400
600
800
1,000
1,200
1994 1995 1996 1997 1998 1999 2000 2001 2002 2003 2004 2005
mill
ion
US
$
Value of opiate exports to neighbouring countries
The value of 2005 opium production, exported by Afghan traffickers to neighbouring countries in the form of opium, morphine and heroin, was estimated at US$2.7 billion, slightly less than in 2004 (US$2.8 billion). Gross profits of Afghan traffickers would thus decrease from around US$2.2 billion in 2004 to US$2.14 billion in 2005. The value of opiates exports to neighbouring countries in 2005 is equivalent to around 52% of the 2004/05 GDP of Afghanistan
4, down from 61% a year earlier.
Value of opiate exports to neighbouring countries, in billion US$, 2000-2005
0.9
2.52.3
2.8 2.7
0.0
0.5
1.0
1.5
2.0
2.5
3.0
2000 2002 2003 2004 2005
US
$ b
illio
n
4 The GDP figure for the year 1383 (2004/2005): Afs : 254,487 millions does not include the value of opium production.

Afghanistan Opium Survey 2005
9
Size of the licit economy and the opiate industry in Afghanistan in 2005
Opiate
traffickers:
2.14 billion
Opium
farmers:
US$ 0.56
billion
The licit
economy:
US$ 5.2
billion
Eradication
The annual opium survey neither monitors the activities, nor assesses the results, of eradication campaigns launched by the Afghan authorities during the opium growing season. As in previous years, the 2005 survey relied on a methodology designed to estimate the actual harvest (cultivation net of eradication). However this year, at the request of the Afghan authorities, UNODC implemented jointly with the Ministry of Counter Narcotics (MCN) a separate eradication verification survey (Support to the Verification Process of Opium Poppy Eradication). In this survey, UNODC verified the eradication of some 4,000 hectares of opium poppy by provincial governors. The majority of the governor-led eradication activities took place in the provinces of Nangarhar (46%) and Hilmand (26%), the two main opium producing provinces in 2004. In addition, the central Government undertook eradication, run by a special-purpose Central Poppy Eradication Force (CPEF) and by the Afghan National Police (ANP). These campaigns reported the eradication of 200 ha by CPEF and of 900 ha by ANP, however this was not verified by UNODC. Thus, total eradication amounted to some 5,100 ha, equivalent to roughly 5% of opium poppy cultivation in 2005.
The overall area of opium poppy eradicated in 2005, as reported by Afghan governors, was substantially higher than the eradicated area verified by UNODC. Irrespective of these discrepancies, the findings of this report show that the threat of large-scale eradication has played a significant role in farmers’ decisions not to plant opium poppy in 2005.
Cannabis cultivation estimated at 30,000 hectares
The village survey findings indicate that total cannabis cultivation could be around 30,000 ha in Afghanistan. To get a better idea of the extent of cannabis cultivation in Afghanistan, a separate survey would need to be implemented between June-September, which is the cultivation period of cannabis (farmers usually plant cannabis after the wheat or poppy harvest).
Opium Addiction
Survey findings indicate that 0.5% of the rural population is addicted to opium. This result is in line with the Rapid Assessment Survey, March 2005.
Methodology
The survey’s methodology was based on a sampling approach which combined the analysis of satellite images and extensive field visits. More than 190 high-resolution IKONOS satellite images were used, covering 15 provinces -- a total of 214,000 ha of agricultural land, representing 16% of the total agricultural land in these areas. To assist

Afghanistan Opium Survey 2005
10
with the interpretation of the satellite images, a large amount of ground data, including crop types, GPS coordinates and photographs were collected from 260 different locations (segment analysis).
In addition to the sample of high resolution imagery, the whole of Hilmand, Kandahar, Farah, Uruzgan and Balkh provinces were covered with 10 meter resolution SPOT5 multi-spectral images. The objective was to determine the poppy areas by mid-resolution satellite imagery and at the same time to update the agricultural areas in these provinces, which served as the sampling frame. In addition, the census survey with SPOT5 images enabled the analysis of results at the district level.
At the same time, a sample of 1,900 villages was surveyed (out of a total of 30,706 villages) by 310 surveyors to collect socio-economic data. Over 6,000 capsules from 160 fields were measured and 5,700 farmers were interviewed. In the areas not covered by satellite images, the surveyors also collected data on the extent of opium poppy cultivation. Opium poppy cultivation estimated through the village survey in 17 provinces accounted for only 16% of the total area under opium poppy cultivation.
The survey was completed as planned despite widespread security problems. Instability in several regions impeded travel for the surveyors. Insecurity affected both the safety of the surveyors
5, as well as the farmers.
Some non-compliance of the survey was due to farmers fear for their personal safety.
5No surveyors were injured during the 2005 Opium Survey.


Afg
han
ista
n, p
rices o
f d
ry o
piu
m in
Nan
garh
ar
an
d K
an
dah
ar
co
llecte
d f
rom
tra
ders
, U
S$/k
g, M
arc
h 1
997 -
Au
gu
st
2005
208
424
116
700
640
31
115
173
254
119
0
100
200
300
400
500
600
700
Jan-97
Mar-97
May-97
Jul-97
Sep-97
Nov-97
Jan-98
Mar-98
May-98
Jul-98
Sep-98
Nov-98
Jan-99
Mar-99
May-99
Jul-99
Sep-99
Nov-99
Jan-00
Mar-00
May-00
Jul-00
Sep-00
Nov-00
Jan-01
Mar-01
May-01
Jul-01
Sep-01
Nov-01
Jan-02
Mar-02
May-02
Jul-02
Sep-02
Nov-02
Jan-03
Mar-03
May-03
Jul-03
Sep-03
Nov-03
Jan-04
Mar-04
May-04
Jul-04
Sep-04
Nov-04
Jan-05
Mar-05
May-05
Jul-05
Sep-05
US$/kg
Na
ng
arh
ar
(ea
ste
rn A
fgh
an
ista
n)
Ka
nd
ah
ar
(so
uth
ern
Afg
ha
nis
tan
)u
nw
eig
hte
d a
ve
rag
e

Afghanistan Opium Survey 2005
21
1 INTRODUCTION
During the 1990s, Afghanistan established itself as the largest source of illicit opium and its derivative, heroin, in the world. By the end of the 1990s, Afghanistan provided about 70 % of global illicit opium, well ahead of Myanmar (about 22 %) and Lao PDR (about 3%). Since then the importance of Afghanistan as a supplier of illicit opiates has increased further, accounting for 86% of global illicit opium supply in 2004. The markets for these opiates are located primarily in South West Asia, Central Asia, East and West Europe, South Asia, the Arabian Peninsula and Africa. Illicit opiates of Afghan origin are consumed by an estimated 10-11 million abusers (or two thirds of all opiate consumers)—with more than 10,000 of them dying every year. It can be estimated that, all along the trafficking chain, more than half a million people are involved in the trade of illicit Afghan opiates in recent years.
In 2001, following the ban imposed by the former Taliban regime, an abrupt decline of illicit opium poppy cultivation interrupted over two decades of overall increases in production. However, stimulated by a subsequent 10-fold increase in opium prices, cultivation resumed at a high level in 2002 and began to spread outside of the traditional areas. Although a new ban was issued in January 2002, the situation prevailing in Afghanistan hindered the efforts of the new Afghan government to curb opium poppy cultivation. In 2004, the area under cultivation increased by two-thirds, reaching a record level of 131,000 hectares. After his inauguration in December 2004, President Karzai renewed his commitment to reducing illicit cultivation and summoned local tribal government and religious leaders to a loya jirga on narcotics entitled the National Conference on Counter Narcotics. Shortly thereafter, the National Council of Ulema, a group of Afghanistan’s most respected Muslim scholars, issued a fatwa, or religious declaration, against the drug production, trade and consumption. During this period, the Government launched a public awareness campaign and an eradication programme.
The Afghanistan opium survey is implemented annually by the United Nations Office on Drugs and Crime and, since 2003, in collaboration with the Afghan Government. It collects and analyses information on the location and extent of opium poppy cultivation, the potential production of opium, and the socioeconomic dimensions of the problem. The results provide a detailed picture of the outcome of the current year’s opium season and, with previous years’ data, enable the identification of mid- and long-term trends in the evolution of the illicit drug problem. This information is essential for planning, implementing and monitoring the impact of measures required for tackling a problem which has serious implications for both the country and the international community.
The opium survey is implemented in the technical framework of UNODC’s Illicit Crop Monitoring Programme (ICMP). The objective of ICMP is to assist the international community in monitoring the extent and evolution of illicit crops in the context of the elimination objective adopted at the General Assembly Special Session on Drugs in June 1998. In the framework of ICMP, monitoring activities are presently supported by UNODC in the other five main countries affected by illicit opium poppy and coca bush cultivation (Myanmar and Lao PDR in Asia, and Colombia, Peru and Bolivia in Latin America), as well as in Morocco, where one of the main areas of illicit cannabis cultivation is located.
The 2005 opium survey in Afghanistan was implemented under the project AD/AFG/F98 “Monitoring of opium production in Afghanistan” and the project AD/GLO/C93 “Illicit Crop Monitoring Programme Support”, with financial contributions from the Governments of the United Kingdom, Finland and Italy.


Afghanistan Opium Survey 2005
23
2 FINDINGS
2.1 Opium Poppy Cultivation
The estimated area under opium poppy cultivation in Afghanistan decreased by 21% to 104,000 hectares in 2005 (confidence interval: 95,000-113,000). In 2005, opium poppy cultivation was reported in 24 provinces. This represents the first contraction in many years and reverses the trend of previous years when opium poppy cultivation expanded into new provinces each year (24 provinces in 2002, 28 in 2003 and 31 in 2004). While the main opium production areas continue to be located in southern Afghanistan, cultivation in some northern provinces increased considerably.
As a result of the decline in opium cultivation in Afghanistan in 2005, global opium poppy cultivation is estimated to fall by some 16%. The share of Afghanistan would remain almost stable at 67%.
Figure 1: Opium poppy cultivation in Afghanistan from 1986 to 2005
Sources: UNODC opium surveys for 1994-2005 and UNODC, Global Illicit Drug Trends 2001 for other years.
Figure 2: Global opium poppy cultivation in hectares, 1990-2005*
0
50,000
100,000
150,000
200,000
250,000
300,000
19
90
19
91
19
92
19
93
19
94
19
95
19
96
19
97
19
98
19
99
20
00
20
01
20
02
20
03
20
04
20
05
he
cta
res
Afghanistan Myanmar Lao PDR Rest of the World
* For 2005, estimates for the “rest of the world” and Myanmar are still tentative
29,0
00
25,0
00
32,0
00
34,0
00
41,0
00
51,0
00
49,0
00
58,0
00
71,0
00
54,0
00
57,0
00
58,0
00
64,0
00
91,0
00
82,0
00
8,0
00
74,0
00
80,0
00
130,0
00
104,0
00
0
20,000
40,000
60,000
80,000
100,000
120,000
140,000
86 87 88 89 90 91 92 93 94 95 96 97 98 99 00 01 02 03 04 05
hecta
res

Afghanistan Opium Survey 2005
24
The regional distribution of opium poppy cultivation in Afghanistan shifted in 2005. While a major decrease of 89% was found in the eastern region, significant increases took place in the northern and western regions: 93% and 67% respectively. Opium poppy cultivation in the southern region remained almost stable (-5%).
A map presenting the regional grouping used for the opium survey 2005, is presented on page 22.
Table 1: Regional distribution of opium poppy cultivation in 2004 and 2005
Region 2004 (ha) 2005 (ha)Change 2004-
2005
share of total
in 2004 (%)
share of total
in 2005 (%)South 48,431 46,147 -5% 37% 44%North 14,627 28,282 93% 11% 27%
W est 9,917 16,543 67% 8% 16%
North-East 16,369 8,734 -47% 12% 8%East 36,621 4,095 -89% 28% 4%
Central 4,671 106 -98% 21% 0%
Rounded Total 131,000 104,000 -21% 100% 100%
Figure 3: Regional distribution of opium poppy cultivation since 1994
0
20,000
40,000
60,000
80,000
100,000
120,000
140,000
1994 1995 1996 1997 1998 1999 2000 2001 2002 2003 2004 2005
he
cta
res
Central
Western
Northern
Southern
North-eastern
Eastern
Opium poppy cultivation decreased in 19 provinces in 2005. The largest declines -in absolute terms- were found in Nangarhar (27,120 ha), Badakshan (8,237 ha) and in Uruzgan (6,475 ha). A very sharp decrease of 96% was observed in Nangarhar, which had the second largest area under cultivation in 2004 (28,213 ha). Badakshan and Uruzgan, with the third and fourth largest areas under opium poppy cultivation in 2004, dropped to the fifth and sixth place in 2005. Opium cultivation in Central Afghanistan (Parwan, Paktya, Wardak, Khost, Kabul and Logar) almost disappeared in 2005: from 4600 ha in 2004 to 106 hectares in 2005. Hilmand remained the province with the largest area under cultivation, although cultivation decreased an encouraging 10%.
Increases of more than 10% were seen in 10 provinces. Major increases –in absolute terms- were found in Balkh (8,342 ha), Kandahar (8,030 ha) and Farah (7,952 ha). Poppy cultivation in Kandahar increased 162% to 12,989 ha. Kandarhar now has the second largest area under opium poppy cultivation. Worryingly, cultivation in Balkh increased 334%. The province became the number three opium poppy producing province, followed by Farah at 10,240 ha. Neither province was an important opium poppy growing region in 2004 or in previous years. In general, in 2005, opium poppy cultivation moved from traditional growing areas (Hilmand, Laghman, Nangarhar, Uruzgan) to new provinces (Badghis, Balkh, Farah, Samangan).
Five provinces accounted for 65% of the total opium poppy cultivation in 2005. Hilmand continues to have the largest area under cultivation. Nangarhar, which was the second largest poppy cultivating province in 2004, is amongst the provinces with the lowest cultivation levels in 2005.

Afghanistan Opium Survey 2005
25
Table 2: Change of area under opium poppy cultivation in main cultivation provinces, 2003-2005 (hectares)
Province 2003 2004 2005Change 2004-
2005
% of total in
2005
Cumulative
%Hilmand 15,371 29,353 26,500 -10% 25% 25%
Kandahar 3,055 4,959 12,989 162% 12% 38%
Balkh 1,108 2,495 10,837 334% 10% 48%
Farah 1,700 2,288 10,240 348% 10% 58%
Badakhshan 12,756 15,607 7,370 -53% 7% 65%
Nangarhar 18,904 28,213 1,093 -96% 1% 66%
Rest of the Country 46,010 76,298 36,064 -53% 35% 100%
Figure 4: Afghanistan opium poppy cultivation change 2004-2005 per province (hectares)
0
24
62
282
838
1,200
1,310
1,017
522
803
2,756
224
4,366
28,213
762
764
115
1,673
2,531
2,977
2,444
3,249
4,983
614
1,974
1,151
11,080
15,607
2,288
2,495
4,959
29,353
0
0
0
0
0
0
0
106
115
126
274
275
1,059
1,093
1,364
1,554
1,690
1,748
1,924
2,053
2,563
2,665
2,689
2,967
3,227
3,874
4,605
7,370
10,240
10,837
12,989
26,500
0 5,000 10,000 15,000 20,000 25,000 30,000
Paktika
Logar
Ghazni
Kabul
Khost
Paktya
Parwan
Wardak
Kapisa
Bamyan
Laghman
Kunduz
Kunar
Nangarhar
Takhar
Nuristan
Nimroz
Jawzjan
Hirat
Zabul
Baghlan
Faryab
Ghor
Badghis
Sari Pul
Samangan
Uruzgan
Badakhshan
Farah
Balkh
Kandahar
Hilmand
hectares
2004 2005

Afghanistan Opium Survey 2005
26
In 2005, record cultivation levels were reported for nine provinces. With the exception of Kandahar, these were all provinces with low cultivation levels in previous years, supporting the thesis that opium poppy cultivation remains a highly dynamic phenomenon in Afghanistan.
Table 3: Record years for level of opium poppy cultivation at province level, 1994-2005
Record year
Number of provinces
Provinces
2005 9Baghdish, Baghlan, Balkh, Kandahar, Nimroz, Nuristan, Samangan, Saripul, Takhar
2004 15 Uruzgan, Zabul, Kunar, Laghman, Badakhshan, Faryab, Bamyan, Ghor, Hirat, Farah, Parwan, Paktya, Khost, Kabul, Logar.
2003 1 Wardak
2002 0
2000 1 Kunduz
1999 2 Hilmand, Jawzjan
1994 2 Ghazni, Nangarhar,

Afghanistan Opium Survey 2005
27
SOUTHERN REGION (Hilmand, Uruzgan, Kandahar, Zabul, Ghazni, Paktika)
Province 1994 1995 1996 1997 1998 1999 2000 2001 2002 2003 2004 2005Hilmand 29,579 29,754 24,910 29,400 30,672 44,552 42,853 - 29,950 15,371 29,353 26,500
Kandahar 3,624 2,127 3,057 4,122 5,229 5,522 3,034 - 3,970 3,055 4,959 12,989Uruzgan 6,254 2,908 7,880 4,986 4,661 4,989 4,725 1 5,100 7,143 11,080 4,605
Zabul 54 - 255 154 161 537 585 1 200 2,541 2,977 2,053
Gazni 313 - - - - - - - - - 62 -
Paktika - - - - - - - - - - - -
Hilmand
From 2004 to 2005, opium poppy cultivation in Hilmand declined by 10% to 26,500 ha. Although this is the fourth lowest level of cultivation since 1994, the province still has the largest area under cultivation in Afghanistan. Hilmand accounted for 25% of the country’s total poppy cultivation in 2005, compared to 23% in 2004, 19% in 2003 and 40% in 2002.
While the 2005 survey was not designed to provide estimates at district level, field work provided clear indications of higher levels of cultivation in the northern and southern parts of the province, as compared to the central districts.
Figure 5: Opium poppy cultivation in Hilmand province
29
,60
0
29
,80
0
24
,90
0
29
,40
0
30
,70
0 44
,60
0
42
,90
0
0
30
,00
0
15
,40
0 29
,40
0
26
,50
0
0
5,000
10,000
15,000
20,000
25,000
30,000
35,000
40,000
45,000
50,000
1994 1995 1996 1997 1998 1999 2000 2001 2002 2003 2004 2005
he
cta
res
Kandahar
In 2005, opium poppy cultivation amounted to 12,989 ha in Kandahar, which is a 162% increase as compared to 2004. This is the highest level of opium poppy cultivation in Kandahar on record.
Figure 6: Opium poppy cultivation trends in Kandahar province
3,6
24
2,1
27
3,0
57
4,1
22
5,2
29
5,5
52
3,0
34
0
3,9
70
3,0
55
4,9
59
12,9
89
0
2,000
4,000
6,000
8,000
10,000
12,000
14,000
1994 1995 1996 1997 1998 1999 2000 2001 2002 2003 2004 2005
hecta
res


Afghanistan Opium Survey 2005
29
EASTERN REGION (Nangarhar, Kunar, Laghman, Nuristan , Kapisa)
Province 1994 1995 1996 1997 1998 1999 2000 2001 2002 2003 2004 2005Nangarhar 29,081 15,724 15,645 14,567 17,821 22,990 19,747 218 19,780 18,904 28,213 1,093Kunar 115 152 18 - 75 288 786 82 972 2,025 4,366 1,059
Laghman - - - - 77 297 707 15 950 1,907 2,756 274
Nuristan - - - - - - - - - 648 764 1,554Kapisa - - - - - 5 104 - 207 326 522 115
Nangarhar
Poppy cultivation in Nangarhar decreased sharply from 28,213 ha in 2004, to 1,093 ha in 2005 (-96%). Nangarhar was almost poppy free in 2005, except in parts of Achin and Shinwar districts and in some mountainous regions.
The survey findings reveal that only 0.7% of 2004’s opium poppy fields were cultivated again with opium poppy in 2005. In addition, as part of the project ‘Support to the Verification Process of Opium Poppy Eradication,’ UNODC verified the eradication of 1,860 ha of opium poppy in Nangarhar province. When villagers were asked why they reduced or stopped opium cultivation, most reported that they feared eradication (42%) or imprisonment (31%). Others (24%), referred to the opium poppy ban directly. Before the 2004-5 growing season, the Nangarhar Governor had informed the district authorities that they would be held responsible for the level of opium poppy cultivation in their area and, at the start of the planting season, district administrators and security chiefs had called tribal elders and the shura members from each village to the district centre and informed them that they should not cultivate poppy.
March 2004, opium poppy March 2005, wheat
Change of cultivation in Bati Kot district, Nangarhar province in 2004 and 2005
Figure 7: Opium poppy cultivation in Nangarhar province
29
,10
0
15
,70
0
15
,60
0
14
,50
0
17
,80
0
23
,00
0
19
,70
0
20
0
19
,80
0
18
,90
0 28
,23
8
1,0
93
0
5,000
10,000
15,000
20,000
25,000
30,000
35,000
1994 1995 1996 1997 1998 1999 2000 2001 2002 2003 2004 2005
he
cta
res


Afghanistan Opium Survey 2005
31
Laghman, Kunar, Nuristan
Opium poppy cultivation decreased significantly in Laghman (90%) and Kunar (76%) but increased sharply in Nuristan province in 2005 (103%). The area under opium poppy cultivation amounted to 274 ha in Laghman, 1,059 ha in Kunar and 1,554 ha in Nuristan. With the exception of a few remote and mountainous areas, Laghman province was almost opium poppy free in 2005. In Nuristan, by contrast, the level of opium poppy cultivation was higher than ever before.
March 2004, opium poppy March 2005, wheat
Agricultural fields in Qarghyi District (Laghman) in 2004 and 2005 (same location)
Figure 8: Opium poppy cultivation in Lagman, Kunar and Nuristan provinces
0
500
1000
1500
2000
2500
3000
3500
4000
4500
5000
1994 1995 1996 1997 1998 1999 2000 2001 2002 2003 2004 2005
he
cta
res laghman
Kunar
Nuristan

Afghanistan Opium Survey 2005
32
NORTH-EASTERN REGION (Badakhshan, Takhar)
Province 1994 1995 1996 1997 1998 1999 2000 2001 2002 2003 2004 2005Badakhshan 1,714 2,966 3,230 2,902 2,817 2,684 2,458 6,342 8,250 12,756 15,607 7,370
Takhar - - - - - 201 647 211 788 380 762 1,364
Badakhshan
Poppy cultivation in Badakshan declined 53% to 7,370 ha in 2005, a reversal of four years of significant and steady increases. The survey showed that opium poppy cultivation moved from the main irrigated valleys to rain fed areas and side-valleys. Unlike in other regions in Afghanistan, there were some reports of disease and insect damage to the poppy crop.
Figure 9: Opium poppy cultivation in Badakhshan province, 1994-2005
1,7
00
3,0
00
3,2
00
2,9
00
2,8
00
2,7
00
2,5
00
6,3
00 8
,20
0
12
,80
0 15
,60
0
7,3
70
0
2,000
4,000
6,000
8,000
10,000
12,000
14,000
16,000
18,000
1994 1995 1996 1997 1998 1999 2000 2001 2002 2003 2004 2005
he
cta
res
Given a decline of opium poppy cultivation on irrigated land, the contribution of rain fed cultivation to total opium poppy cultivation increased from 28% in 2004 to 46% in Badakhshan in 2005. Favourable weather conditions assisted in the increase of opium poppy cultivation in rain fed areas. Farmers reported that they reduced opium cultivation, mainly in irrigated areas, because of the Government ban on opium cultivation and fear of eradication.
Figure 10: Distribution of irrigated & rain-fed poppy cultivation in Badakhshan
3,060
11,571 11,223
3,963
4,840
4,384
3,407
570
0
2,000
4,000
6,000
8,000
10,000
12,000
14,000
16,000
18,000
2002 2003 2004 2005
he
cta
res
Rain-fed
Irrigated


Afghanistan Opium Survey 2005
34
Rainfed opium poppy field in Badakhshan, June 2005
Takhar
In 2005, total opium poppy cultivation in Takhar reached 1,364 ha, a 70% increase from 2004. Most of the opium poppy cultivation in 2005 took place in rain fed and remote areas of Takhar.


Afghanistan Opium Survey 2005
36
NORTHERN REGION (Faryab, Balkh, Sari Pul, Baghlan, Jawzjan, Badghis, Samangan, Bamyan, Kunduz)
Table 4: Opium poppy cultivation in Northern Provinces (hectares), 1994-2005
Province 1994 1995 1996 1997 1998 1999 2000 2001 2002 2003 2004 2005
Balkh - - 1,065 710 1,044 4,057 2,669 4 217 1,108 2,495 10,837Bagdish - - - - - - 41 - 26 170 614 2,967Faryab - - - - - - 36 - 28 766 3,249 2,665
Baghlan - - - 328 929 1,005 199 82 152 597 2,444 2,563Jawzan - - - - - 2,593 600 - 137 888 1,673 1,748Saripul - - - - - - 146 - 57 1,428 1,974 3,227
Samangan - - - - - - 54 614 100 101 1,151 3,874Kunduz - - - - - 38 489 - 16 49 224 275 Bamyan - - - - - - - - - 610 803 126
Total - - 1,065 1,038 1,973 7,693 4,234 700 733 5,717 14,627 28,282
The percentage of opium poppy cultivation in the northern region of the total area under opium poppy cultivation in Afghanistan continued to increase from 11% in 2004 to 27% in 2005. The total amount of cultivation rose from 14,627 ha in 2004 to 28,282 ha in 2005 (+93%).
Figure 11: Opium poppy cultivation in the Northern Region, 1994-2005
0 0 1,1
00
1,0
00
2,0
00 7
,70
0
4,2
00
70
0
70
0 5,7
00
14
,60
0
28
,28
2
0
5,000
10,000
15,000
20,000
25,000
30,000
1994 1995 1996 1997 1998 1999 2000 2001 2002 2003 2004 2005
he
cta
res

Afghanistan Opium Survey 2005
37
Balkh
In Balkh, opium poppy cultivation increased significantly to 10,837 ha in 2005, up from 2,500 ha in 2004, 1,100 ha in 2003 and 220 ha in 2002. Between 2004 and 2005, opium poppy cultivation rose 334%.
Figure 12: Opium poppy cultivation in Balkh province, 1994-2005
0 0
1,0
65
71
0
1,0
44
4,0
57
2,6
69
4 21
7 1,1
08 2
,49
5
10
,83
7
0
2000
4000
6000
8000
10000
12000
1994 1995 1996 1997 1998 1999 2000 2001 2002 2003 2004 2005
he
cta
res
Healthy opium poppy field at flowering stage in Mazar-E-Sharif, Balkh province (June 2005)
Baghdish
Opium poppy cultivation in Baghdish began in 2000 and has increased significantly since then. Cultivation rose from 614 ha in 2004 to 2,967 ha in 2005 (+383%).
Faryab
Opium poppy cultivation was reported for the first time in Faryab in 2000. Between 2004 and 2005, opium poppy cultivation fell from 3,249 ha to 2,665 ha (-18%).

Afghanistan Opium Survey 2005
38
Samangan
In Samangan province, opium poppy cultivation also started in the year 2000. After a very significant increase (+1051%) in 2004 to 1,151 ha, cultivation continued to rise and reached 3,874 ha in 2005 (+237%). Good weather conditions helped farmers, who grow opium poppy predominantly in areas far from the main roads.
Saripul
Similar to other provinces in the northern region, opium poppy cultivation started in 2000 in Saripul. The area under opium poppy has increased significantly from 57 ha in 2002, to 1,428 ha in 2003, to 1,974 ha in 2004 and to 3,227 ha in 2005.
Opium poppy harvesting in Ghormarch district, Badgish (May 2005)
Opium poppy in Saripul Province (May 2005)

Afghanistan Opium Survey 2005
39
Opium poppy in Shorjar district, Jawzjan Province (April 2005)
Opium poppy in Hazreti Sultan district, Samangan Province (May 2005)

Afghanistan Opium Survey 2005
40
CENTRAL REGION (Parwan, Paktya, Wardak, Khost, Kabul, Logar)
Province 1994 1995 1996 1997 1998 1999 2000 2001 2002 2003 2004 2005Wardak 2,735 1,017 106Khost - - - - - - - 6 - 375 838 -
Parwan - - - - - - - - - - 1,310 -Paktya - - - - 4 29 46 1 38 721 1,200 -
Kabul - - - - - 132 340 29 58 237 282 -Logar - - - - - - - - - - 24 -
The total amount of opium poppy cultivation in Central Afghanistan was almost negligible in 2005. While in 2004, a total of 4,671 ha was estimated, cultivation fell significantly to 106 ha in 2005. Historically, farmers in the central region do not grow opium poppy. In 2005, farmers reported that they reduced or stopped opium poppy cultivation due to fear of eradication and because the opium ban makes it illegal.


Afghanistan Opium Survey 2005
43
WESTERN REGION (Ghor, Hirat, Farah, Nimroz)
Province 1994 1995 1996 1997 1998 1999 2000 2001 2002 2003 2004 2005Farah - 9 631 568 171 787 1,364 - 500 1,700 2,288 10,240Ghor 2,200 3,782 4,983 2,689
Hirat - - - 38 - - 184 - 50 134 2,531 1,924
Nimroz 682 119 136 642 11 203 219 - 300 26 115 1,690
In the western region, cultivation decreased in Hirat and Ghor provinces, but increased significantly in Nimroz and Farah provinces in 2005. The total amount of poppy cultivation reached 16,543 ha (16% of total opium poppy cultivation in Afghanistan), with an increase of 67% over 2004.
Farah
Opium poppy cultivation in Farah has increased significantly since 2003. Total opium poppy cultivation amounted to 10,240 ha in 2005, an increase of 348% compared to 2004. Farah now has the fourth largest area under opium poppy cultivation in Afghanistan.
Figure 13: Opium poppy cultivation in Farah province, 1994-2005
0 9
63
1
56
8
17
1 78
7 1,3
64
0
50
0
1,7
00
2,2
88
10
,24
0
0
2,000
4,000
6,000
8,000
10,000
12,000
1994 1995 1996 1997 1998 1999 2000 2001 2002 2003 2004 2005
he
cta
res
Nimroz
Nimroz always had low levels of opium poppy cultivation. In 2005, cultivation increased to 1,690 ha from 115 ha in 2004. Nimroz lies along an important opium and heroin trafficking route leading to Iran.
Hirat and Ghor
Opium poppy cultivation decreased 24% in Hirat to 1,924 ha in 2005. Similarly, cultivation in Ghor fell from 4,983 ha in 2004 to 2,689 ha in 2005. Although reasons for decreasing or stopping cultivation were in line with the overall findings of the survey (most farmers reported that they feared eradication or imprisonment), last year’s poor opium yields may also have played a role in that region.

Afghanistan Opium Survey 2005
44
2.2 Opium poppy and Agricultural land
Of a total land area of 65 million ha, the land potentially available for crop cultivation in Afghanistan amounts to 8.05 million hectares (FAO)
6. The Afghan Ministry of Agriculture currently estimates the land under actual
cultivation at around 4.55 million ha7. Based on these data, the area under opium poppy cultivation covered 2.3%
of the total land used for agriculture in 2005, down from 2.9% in 2004.
In 2005, cereal cultivation increased by 35%. The area under opium poppy cultivation is equivalent to 3.5% of the land under cereal cultivation, as compared to 5.9% in 2004. FAO
8 reports that farmers in Afghanistan are looking
forward to a bumper cereal harvest in 2005, due to: (1) above normal precipitation; (2) improved Integrated Pest Management; and (3) use of agricultural inputs, irrigation and improved crop husbandry practices. The production of cereal in 2005 will be roughly 5.24 million tonnes, which covers about 90% of Afghanistan’s needs.
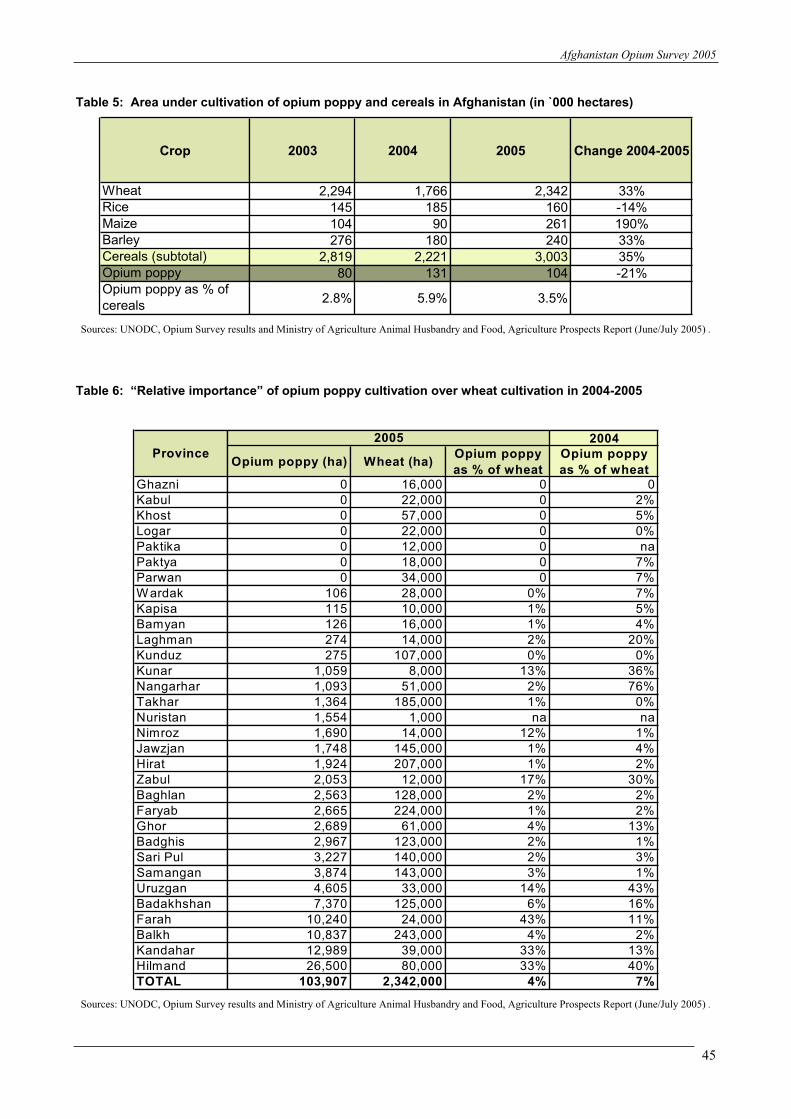
Cultivation of wheat increased by 33% to 2,342,000 ha in 2005 -- especially encouraging following the almost 50% decline in 2004. The relative importance of poppy for the different provinces can be highlighted by comparing it to the land dedicated to wheat production in 2005. This shows that the largest “relative importance” of opium poppy cultivation is in Farah, Kandahar, and Hilmand, with the area under poppy equivalent to 30-40% of the area under wheat cultivation. The lowest “relative importance” of poppy cultivation is in the west (Badghis 2.4%, Hirat 0.9%) and the north (Badakshan 5.9%, Balkh 2%). As compared to 2004, major decreases of the “relative importance” of opium poppy took place in the east (Nangarhar, Kunar, Laghman)
Figure 14: Opium poppy in actual land cultivated in Afghanistan, 2003-2005
Op
ium
po
pp
y in
% o
f a
gri
cu
ltu
ral
lan
d
1.8%
2.9%
2.3%
0.0%
0.5%
1.0%
1.5%
2.0%
2.5%
3.0%
3.5%
2003 2004 2005
6 http://faostat.fao.org/faostat/collections?version=ext&hasbulk=0&subset=agriculture
7 http://www.agriculture.gov.af/agriculture.htm
8 FAO/ministry of Agriculture, Animal Husbandry and Food, Agriculture Prospects Report, June/July 2005
Afghanistan Opium Survey 2005
45
Table 5: Area under cultivation of opium poppy and cereals in Afghanistan (in `000 hectares)
Crop 2003 2004 2005 Change 2004-2005
Wheat 2,294 1,766 2,342 33%Rice 145 185 160 -14%Maize 104 90 261 190%Barley 276 180 240 33%Cereals (subtotal) 2,819 2,221 3,003 35%Opium poppy 80 131 104 -21%Opium poppy as % of cereals
2.8% 5.9% 3.5%
Sources: UNODC, Opium Survey results and Ministry of Agriculture Animal Husbandry and Food, Agriculture Prospects Report (June/July 2005) .
Table 6: “Relative importance” of opium poppy cultivation over wheat cultivation in 2004-2005
2004
Opium poppy (ha) Wheat (ha)Opium poppy
as % of wheat
Opium poppy
as % of wheatGhazni 0 16,000 0 0
Kabul 0 22,000 0 2%Khost 0 57,000 0 5%
Logar 0 22,000 0 0%
Paktika 0 12,000 0 na
Paktya 0 18,000 0 7%
Parwan 0 34,000 0 7%
Wardak 106 28,000 0% 7%
Kapisa 115 10,000 1% 5%Bamyan 126 16,000 1% 4%
Laghman 274 14,000 2% 20%
Kunduz 275 107,000 0% 0%
Kunar 1,059 8,000 13% 36%
Nangarhar 1,093 51,000 2% 76%
Takhar 1,364 185,000 1% 0%
Nuristan 1,554 1,000 na naNimroz 1,690 14,000 12% 1%
Jawzjan 1,748 145,000 1% 4%
Hirat 1,924 207,000 1% 2%
Zabul 2,053 12,000 17% 30%
Baghlan 2,563 128,000 2% 2%
Faryab 2,665 224,000 1% 2%
Ghor 2,689 61,000 4% 13%Badghis 2,967 123,000 2% 1%
Sari Pul 3,227 140,000 2% 3%
Samangan 3,874 143,000 3% 1%
Uruzgan 4,605 33,000 14% 43%
Badakhshan 7,370 125,000 6% 16%
Farah 10,240 24,000 43% 11%
Balkh 10,837 243,000 4% 2%Kandahar 12,989 39,000 33% 13%
Hilmand 26,500 80,000 33% 40%
TOTAL 103,907 2,342,000 4% 7%
2005
Province
Sources: UNODC, Opium Survey results and Ministry of Agriculture Animal Husbandry and Food, Agriculture Prospects Report (June/July 2005) .
Afghanistan Opium Survey 2005
46
2.3 Cannabis cultivation
The survey results provide a tentative estimate of about 30,000 ha of cannabis in Afghanistan. This information was derived from farmers’ interviews (two farmers per village, randomly selected, with the results per farmer at the provincial level extrapolated to the rural population per province). The information gathered during the survey refers to cannabis cultivation in the previous year (2004) because cannabis is cultivated after the wheat and poppy harvest. Based on farmers’ interviews, the bulk of the cannabis in 2004 was cultivated in three provinces: Sari Pul (33%) and Balkh (18%) in northern Afghanistan and in Paktya (17%), i.e. in central Afghanistan according to UNODC’s classification. Other important cannabis producing provinces include Kunduz (10%), Zabul (4%), Uruzgan (3%), Samangan (3%), Nangarhar (3%), Hirat (3%) and Ghazni (3%). Lower levels of cannabis production have been reported by farmers from Kandahar (1.8%), Hilmand (0.9%), Faryab (0.6%), Bamyan (0.2%) and Farah (0.1%). In addition, reports of the Afghan Government indicate that Paktika is an important cannabis producing province, however the survey could not confirm this due to unreliable reporting in this province.
The survey was not designed to verify the extent of cannabis cultivation by surveyors in the field or by satellite photos. Results must thus be treated with caution. Moreover, surveyors reported that many farmers were reluctant to discuss the issue of cannabis cultivation, which is likely to have resulted in some under-estimates. Keeping these caveats in mind, data collected are, nonetheless, sufficient to establish that cannabis cultivation is widespread in Afghanistan (though less than opium poppy), and that it takes place in a variety of locations across the country.
At the time of the survey, farmers indicated that about 40% less cannabis was under cultivation than in 2004. However, these results could be misleading as cannabis is usually planted after wheat or poppy. So, overall results for 2005 could still change substantially once farmers start planting cannabis after the wheat or opium harvest. To estimate the actual trend of cannabis cultivation, it would have been necessary to implement a separate survey during the cannabis cultivation period (July-September).
Based on headmen interviews, even more provinces could be established to have cannabis production (22 out of 32 provinces) than based on farmers’ interviews. In 12% of all villages surveyed, headmen reported cannabis cultivation. This is a significant proportion, though less than the corresponding one for poppy planting villages (42%). The analysis reveals that 9% of the villages are both cannabis and opium producing villages; just 3% are ‘cannabis only’ producing villages. The distribution pattern based on information gathered from the headmen were somehow different from the results of the farmers’ interviews - and the overall results based on headmen interviews turned out to be lower. However, there seems to have been a considerable under-reporting of the area under cannabis cultivation by the headmen. In many villages the two farmers selected per village provided higher cannabis cultivation figures than the headmen for the village as a whole - and there are usually more than two farmers in a village. Thus, the detailed headmen estimates must be interpreted with an even greater degree of caution.
9
9 The headmen interviews suggested that the largest cannabis cultivation took place in Sari Pul (35%), followed by Kandahar (15%), Balkh (10%), Paktya (10%) and Nangarhar (9%). Smaller amounts were reported from Hilmand (4%), Faryab (3%), Zabul (2%), Samangan (2%), Kunduz (2%) and Uruzgan (2%). In addition, cultivation was also reported from Hirat (1.4%), Gazni (1.2%), Jawzan (0.7%), Badghis (0.6%), Baghlan (0.6%), Bamyan (0.6%), Khost (0.6%), Logar (0.1%) and Farah (0.1%) as well as, at lower levels, from Badakshan and Takhar.
Afghanistan Opium Survey 2005
47
2.4 Opium Yield
In 2005, the average dry opium yield in Afghanistan, weighted by cultivation area, was estimated at 39.3 kg/ha (confidence interval: 35.4-43.2). As in previous years, the yield estimate was derived from capsule measurements in the field (160 fields across the country in 2005). There was not much variation in opium yield across Afghanistan this year, unlike in 2004 when drought and disease played an important role. In 2005, the highest average yields were found in Eastern Afghanistan (44 kg/ha) and the lowest in central Afghanistan (36.1 kg/ha). In southern Afghanistan, where the main opium poppy growing areas are found, yield increased by 36% compared to 2004.The results of the yield survey were confirmed by the village survey (2,200 villages visited), which found similar yield figures based on farmer reports.
Table 7: Opium yield by region in 2004 and 2005
Central (Parwan, Paktya, Wardak, Khost, Kabul,
Logar)17.5 36.1
Eastern (Nangarhar, Kunar, Laghman, Nuristan,
Kapisa)32.5 44.0
North-Eastern (Badakhshan, Takhar) 44.2 41.8
Northern (Bamyan, Jawzjan, Sari Pul, Baghlan,
Faryab, Balkh, Samangan, Badghis, Kunduz)36.4 38.8
Southern (Hilmand, Uruzgan, Kandahar, Zabul,
Ghazni, Paktika)27.8 37.9
Western (Ghor, Hirat, Farh, Nimroz) 34.9 41.4
National average * 32.0 39.3
Region2005 Average
Yield (kg/ha)
2004 Average
Yield (kg/ha)
*Weighted by cultivation area
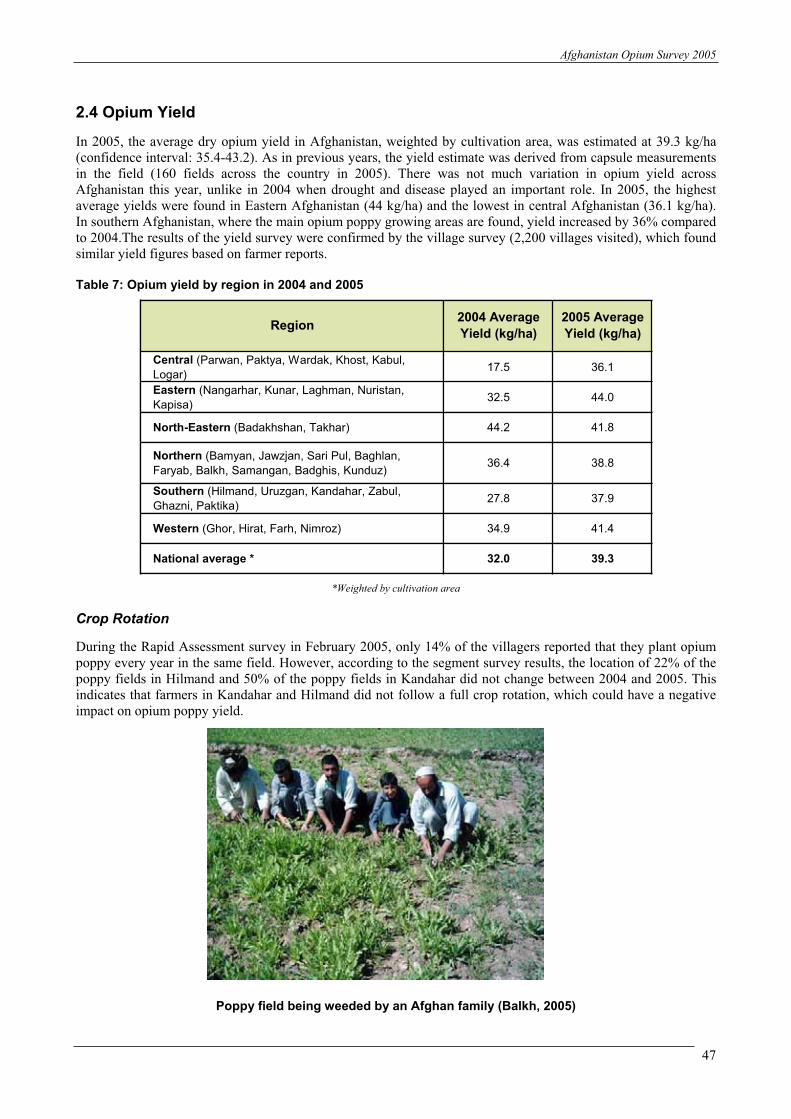
Crop Rotation
During the Rapid Assessment survey in February 2005, only 14% of the villagers reported that they plant opium poppy every year in the same field. However, according to the segment survey results, the location of 22% of the poppy fields in Hilmand and 50% of the poppy fields in Kandahar did not change between 2004 and 2005. This indicates that farmers in Kandahar and Hilmand did not follow a full crop rotation, which could have a negative impact on opium poppy yield.
Poppy field being weeded by an Afghan family (Balkh, 2005)


Afghanistan Opium Survey 2005
49
Lancing
Yield surveys results indicate that, on average, farmers lanced poppy capsules five times this year. The lowest number of lancings was 2 times in Bagdish and 3 times in Takhar and Zabul. The highest number of lancings was 11 times in Badakhshan. While farmers in Badakhshan visited the field 4-6 times to harvest, the high number of lancings is due to lancing more than one time per capsule per visit.
Table 8: Average opium poppy capsule lancing times
Lancing of opium poppy capsules with a neshtar10
, Baghlan, 2005
Latex oozing out of cut opium poppy capsule, Zabul, 2003
10 A neshtar is the tool commonly used to lance poppy capsules.
ProvinceAverage Number
of Lancings
BADAKHSHAN 11
BADGHIS 2
BAGHLAN 7
BALKH 7
BAMYAN 4
FARAH 4
FARYAB 7
HILMAND 4
HIRAT 4
JAWZJAN 6
KABUL 6
KANDAHAR 5
KAPISA 6
KHOST 6
KUNAR 6
LAGHMAN 5
NANGARHAR 6
NURISTAN 8
SAMANGAN 6
SARI PUL 6
TAKHAR 3
URUZGAN 4
ZABUL 3
Overall 5

Afghanistan Opium Survey 2005
50
In 2004, it was reported that disease and pests were the main reasons for lower yields. Therefore, UNODC included a disease monitoring component in the 2005 Opium Survey. Five crop disease/agricultural experts visited around 150 villages during the poppy growing season and collected samples of infested plants, interviewed farmers and looked at the impact of disease on opium yield. However, except for North Eastern Afghanistan, there were no reports of significant poppy disease or pest infestation. As compared to 2004, the yield increased in all regions except for North Eastern Afghanistan (Badakshan, Takhar), where lower yields were reportedly due to disease and increased rain fed cultivation (which usually gives lower yields than irrigated cultivation). The disease and insect infestations reported in Badakhshan included: Mosaic, Sun pest, Cut Worm and Aphid disease.
The following diseases and insects are common in Afghanistan (though they were not significant this year):
Blight: A variety of fungal and bacterial diseases, which causes yellowing and brown spots on poppy leaves.
Mosaic: A viral disease which causes discoloration and deformed leaf growth, stunted plant growth and deformed capsules.
Fusarium Wilt: A soil-borne fungal disease that suddenly appears on poppy plants, causing wilting and yellowing of leaves and stems.
Powdery Mildew: A fungal disease that looks like dust and can be seen on the shoots of poppy plants.
Leaf and Stem Spots: Brown and black spots that appear on upper side of leaves and on stems due to infection by a fungal parasite
Aphids: Insects that excrete a sticky, sweet liquid onto plant leaves. The liquid attracts ants that cause distortion and yellowing of the leaves. Aphids are a major pest of the opium poppy.
Cut Worms: Worms that attack the root system of the poppy plant. Cut worm infestation can destroy an entire poppy crop and can also affect other crops.
Sun Pest: An insect pest that damages the poppy capsules through sucking the sap in the outer layers of the capsule. It may also transmit some viral diseases. Sun pest infestation generally kills the host plant
White Grub: An insect larvae that feeds on the roots of poppy, causing the plant to completely dry out.
Capsule Caterpillar: The caterpillar enters the capsule and feeds on the contents. These larvae exist in most capsules that have holes in them.
Root Knot Nematodes: These organisms can be seen on poppy roots, damaging them by causing root deformation (knots).
Aside from disease and pests, climactic factors can cause physiological disorders in opium poppies. Fluctuations in temperature can cause distortion of poppy capsules.

Afghanistan Opium Survey 2005
51
Figure 15: Common Disease and Insects on Opium Poppy in Afghanistan
Sun Pest Disease Aphids
Root Worms Blight
Fungal Disease Mosaic
Fusarium Wilt

Afghanistan Opium Survey 2005
52
Poppy varieties
During the yield survey, information was collected in 160 villages on the variety of opium poppy planted by the farmers. Different varieties can vary in many aspects such as: appropriate soils, maturation date, resistance to disease, need for inputs like water, fertilizer, labour requirements, etc.
Most farmers (42%) preferred the “Watani Soorgulai” variety. The second variety (18%) cultivated by farmers is “Watani Spingulai”, closely followed by Bahrami Soorgulai (15%).
Table 9: Poppy varieties in Afghanistan,2005
Poppy VarietyFarmers'
Choice
Watani Soorgulai 42%
Watani Spingulai 18%
Bahrami Soorgulai 15%
Bahrami Baragai 7%
Manani 4%
Qodosi 4%
Others 10%
The flower of Watani Soorgulai is generally pink, red or red and white. It is reported to mature later than the Watani Spingulai variety and it typically has small capsules making it harder to lance and thus requiring more labour. Farmers reported that Watani Soorgulai produces good quality opium with low moisture content, but that the quantity of the yield is low in comparison to other varieties.
Watani Soorgulai
The Watani Spingulai has a white flower and was found to be grown on both sandy and clay loam soils. The capsules of Spingulai are more elongated than other varieties. Spingulai is an early maturing variety of opium poppy that is relatively resistant to both disease and poor weather. Also it was reported that Spingulai is a low input crop, requiring less fertilizer, irrigation and labour than other varieties.
Watani Spingulai

Afghanistan Opium Survey 2005
53
2.5 Eradication
The opium survey as such neither monitors the activities, nor assesses the results of the eradication campaign launched by the Afghan authorities during the opium growing season. As in previous years, the survey’s methodology was designed to capture what was left for harvest in the fields. However, at the request of the Afghan Government, UNODC implemented a separate project: Support to the Verification Process of Opium
Poppy Eradication, together with the Ministry of Counter Narcotics (MCN) and the Ministry of Interior (MoI). This project supported the verification of Governor-led eradication in Afghanistan, which took place between February –July 2005. UNODC announced the results of the eradication in August 2005.
UNODC verified the eradication of some 4,000 hectares of opium poppy by the provincial governors. The majority of governor led eradication activities took place in the provinces of Nangarhar (46%) and Hilmand (26%), the two main opium producing provinces in 2004. In addition, the central government undertook separate eradication, run by a special-purpose Central Poppy Eradication Force (CPEF) and by the Afghan National Police (ANP). These campaigns reported the eradication of 200 ha by CPEF and of 900 ha by ANP. Total eradication amounted to some 5,100 ha, equivalent to roughly 5% of the 2005 opium poppy cultivation.
Table 10: Eradication in Afghanistan,2005
Province Name
Governor led eradication (ha) -
verified by UNODC
CPEF (ha)-not verified by UNODC
ANP (ha)- not verified by
UNODCTotal (ha)
NANGARHAR 1,860 0 0 1,860
HILMAND 1,031 15 0 1,046
BALKH 181 127 532 840
LAGHMAN 360 0 0 360
HIRAT 156 0 0 156
BADAKHSHAN 0 7 137 144
KUNAR 126 0 0 126
URUZGAN 126 0 0 126
SARI PUL 0 0 112 112
TAKHAR 88 12 0 100
FARAH 42 0 44 86
BAGHLAN 0 0 63 63
KANDAHAR 0 48 0 48
KAPISA 21 0 0 20
SAMANGAN 16 0 0 16
BADGHIS 0 0 0 0
BAMYAN 0 0 0 0
DAYKUNDI 0 0 0 0
FARYAB 0 0 0 0
GHAZNI 0 0 0 0
GHOR 0 0 0 0
JAWZJAN 0 0 0 0
KABUL 0 0 0 0
KHOST 0 0 0 0
KUNDUZ 0 0 0 0
LOGAR 0 0 0 0
NIMROZ 0 0 0 0
NURISTAN 0 0 0 0
PAKTIKA 0 0 0 0
PAKTYA 0 0 0 0
PARWAN 0 0 0 0
WARDAK 0 0 0 0
ZABUL 0 0 0 0Total 4,007 209 888 5,103
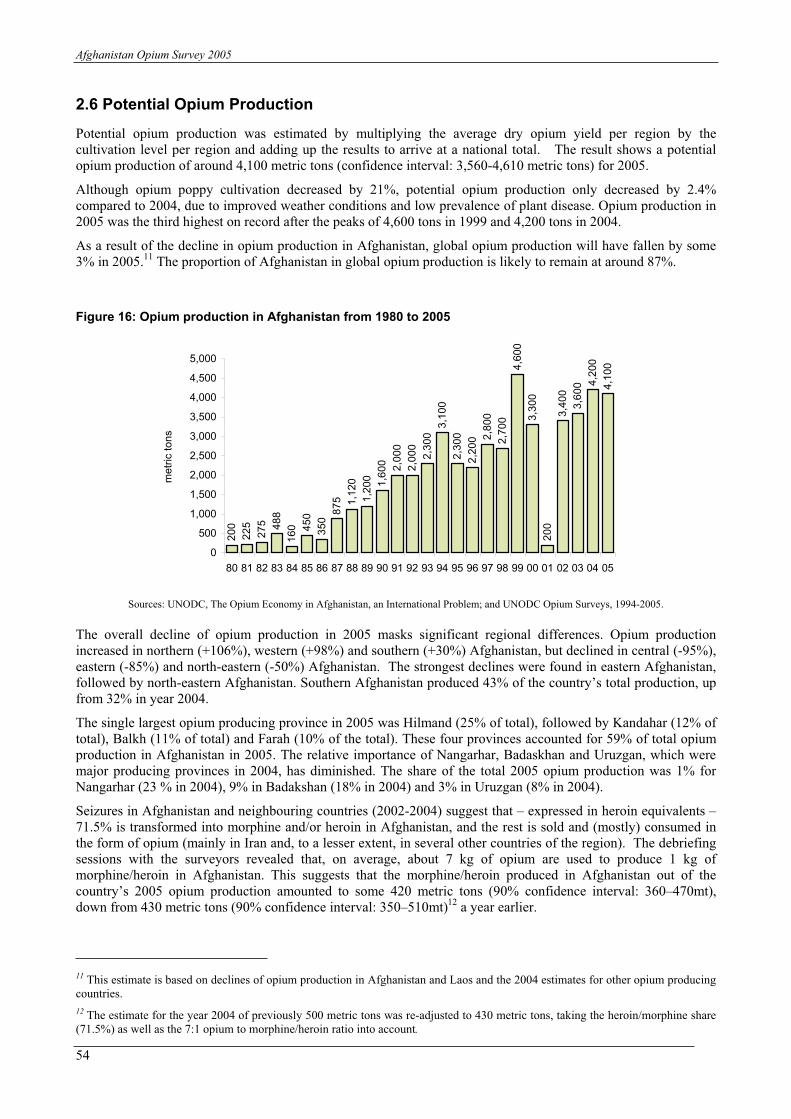
Afghanistan Opium Survey 2005
54
2.6 Potential Opium Production
Potential opium production was estimated by multiplying the average dry opium yield per region by the cultivation level per region and adding up the results to arrive at a national total. The result shows a potential opium production of around 4,100 metric tons (confidence interval: 3,560-4,610 metric tons) for 2005.
Although opium poppy cultivation decreased by 21%, potential opium production only decreased by 2.4% compared to 2004, due to improved weather conditions and low prevalence of plant disease. Opium production in 2005 was the third highest on record after the peaks of 4,600 tons in 1999 and 4,200 tons in 2004.
As a result of the decline in opium production in Afghanistan, global opium production will have fallen by some 3% in 2005.
11 The proportion of Afghanistan in global opium production is likely to remain at around 87%.
Figure 16: Opium production in Afghanistan from 1980 to 2005
20
0
22
5
27
5 48
8
16
0 45
0
35
0
87
5 1,1
20
1,2
00
1,6
00 2,0
00
2,3
00
3,1
00
2,3
00
2,2
00 2
,80
0
2,7
00
4,6
00
3,3
00
20
0
3,4
00
3,6
00 4
,20
0
4,1
00
2,0
00
0
500
1,000
1,500
2,000
2,500
3,000
3,500
4,000
4,500
5,000
80 81 82 83 84 85 86 87 88 89 90 91 92 93 94 95 96 97 98 99 00 01 02 03 04 05
me
tric
to
ns
Sources: UNODC, The Opium Economy in Afghanistan, an International Problem; and UNODC Opium Surveys, 1994-2005.
The overall decline of opium production in 2005 masks significant regional differences. Opium production increased in northern (+106%), western (+98%) and southern (+30%) Afghanistan, but declined in central (-95%), eastern (-85%) and north-eastern (-50%) Afghanistan. The strongest declines were found in eastern Afghanistan, followed by north-eastern Afghanistan. Southern Afghanistan produced 43% of the country’s total production, up from 32% in year 2004.
The single largest opium producing province in 2005 was Hilmand (25% of total), followed by Kandahar (12% of total), Balkh (11% of total) and Farah (10% of the total). These four provinces accounted for 59% of total opium production in Afghanistan in 2005. The relative importance of Nangarhar, Badaskhan and Uruzgan, which were major producing provinces in 2004, has diminished. The share of the total 2005 opium production was 1% for Nangarhar (23 % in 2004), 9% in Badakshan (18% in 2004) and 3% in Uruzgan (8% in 2004).
Seizures in Afghanistan and neighbouring countries (2002-2004) suggest that – expressed in heroin equivalents – 71.5% is transformed into morphine and/or heroin in Afghanistan, and the rest is sold and (mostly) consumed in the form of opium (mainly in Iran and, to a lesser extent, in several other countries of the region). The debriefing sessions with the surveyors revealed that, on average, about 7 kg of opium are used to produce 1 kg of morphine/heroin in Afghanistan. This suggests that the morphine/heroin produced in Afghanistan out of the country’s 2005 opium production amounted to some 420 metric tons (90% confidence interval: 360–470mt), down from 430 metric tons (90% confidence interval: 350–510mt)
12 a year earlier.
11 This estimate is based on declines of opium production in Afghanistan and Laos and the 2004 estimates for other opium producingcountries.
12 The estimate for the year 2004 of previously 500 metric tons was re-adjusted to 430 metric tons, taking the heroin/morphine share(71.5%) as well as the 7:1 opium to morphine/heroin ratio into account.
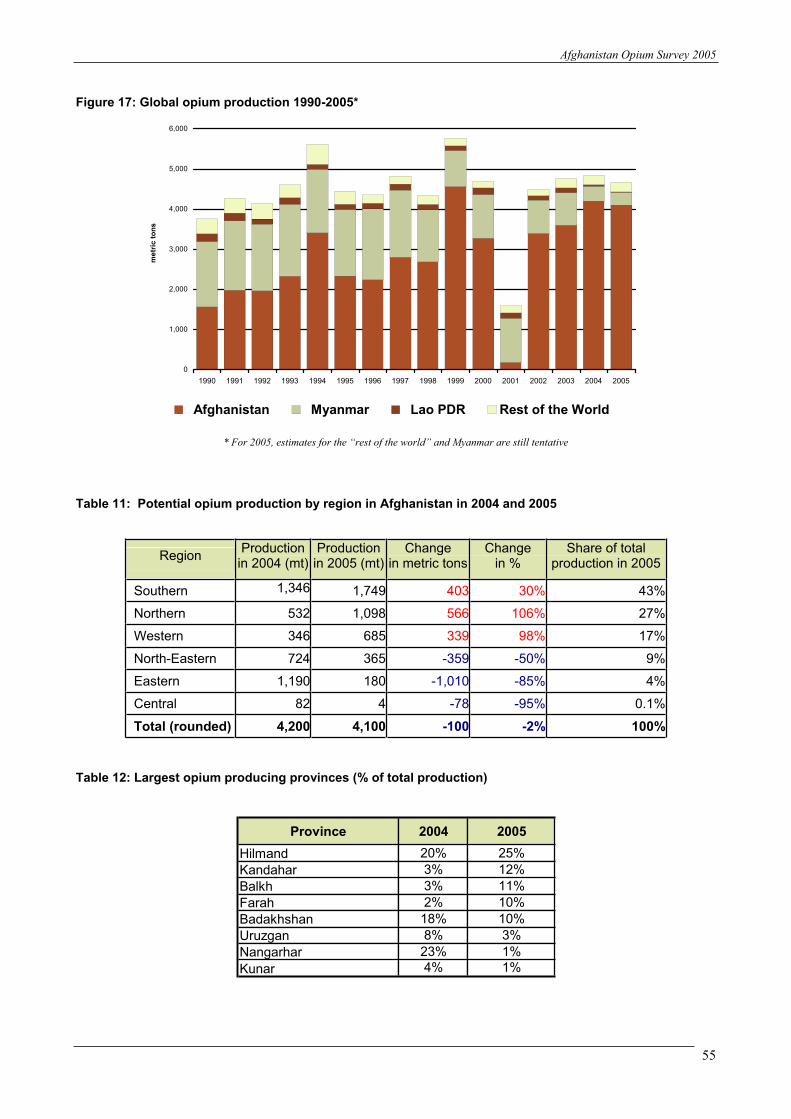
Afghanistan Opium Survey 2005
55
Figure 17: Global opium production 1990-2005*
0
1,000
2,000
3,000
4,000
5,000
6,000
1990 1991 1992 1993 1994 1995 1996 1997 1998 1999 2000 2001 2002 2003 2004 2005
metr
ic t
on
s
Afghanistan Myanmar Lao PDR Rest of the World
* For 2005, estimates for the “rest of the world” and Myanmar are still tentative
Table 11: Potential opium production by region in Afghanistan in 2004 and 2005
Region Production in 2004 (mt)
Production in 2005 (mt)
Change in metric tons
Change in %
Share of total production in 2005
Southern 1,346 1,749 403 30% 43%
Northern 532 1,098 566 106% 27%
Western 346 685 339 98% 17%
North-Eastern 724 365 -359 -50% 9%
Eastern 1,190 180 -1,010 -85% 4%
Central 82 4 -78 -95% 0.1%
Total (rounded) 4,200 4,100 -100 -2% 100%
Table 12: Largest opium producing provinces (% of total production)
Province 2004 2005
Hilmand 20% 25%
Kandahar 3% 12%
Balkh 3% 11%
Farah 2% 10%
Badakhshan 18% 10%
Uruzgan 8% 3%
Nangarhar 23% 1%
Kunar 4% 1%

Afghanistan Opium Survey 2005
56
2.7 Opium Farmers
In 2005, the survey collected data on the number of families cultivating opium poppy in Afghanistan. At the national level, it was estimated that 309,000 families (confidence interval : 278,000-340,000) were involved in opium cultivation, compared with 356,000 families in 2004. This is a decrease of 13%. Given an average of 6-7 members per family
13, 309,000 families represent an estimated total of about 2 million persons, or 8.7% of
Afghanistan’s 23 million total population14
. This means that 11% of the rural population are involved in poppy cultivation, down from 13% in 2004.
Figure 18: Number of families involved in opium production in Afghanistan, 2003-2005
Nu
mb
er
of
Fa
mili
es
264,000
356,000
309,000
0
50,000
100,000
150,000
200,000
250,000
300,000
350,000
400,000
2003 2004 2005
Table 13: Proportion of families involved in opium production in 2005
Region
2005
Cultivation
(ha)
Total number of
poppy farming
households
Percent of total
Average size of
poppy field per
poppy growing
household (ha)
Central Negligible Negligible Negligible
Eastern 4,095 22,169 7% 0.18
North-Eastern 8,734 37,241 12% 0.23
Northern 28,282 101,266 33% 0.28
Southern 46,147 89,468 29% 0.52
Western 16,543 58,869 19% 0.28
Total 104,000 309,238 100% 0.34
The average land area dedicated to poppy cultivation per family amounted to 0.34 ha in 2005 compared with 0.37 ha in 2004. In the main opium producing provinces the average area under poppy cultivation reached 0.52 ha per household; while in the other provinces the average area under poppy cultivation was about half as large (0.18-0.28 ha per household).
The distribution of opium poppy cultivation remains very skewed. Almost half of all Afghan farmers (48%) have not used more than 0.2 ha for the cultivation of opium poppy this year and almost three quarters (73%) of Afghan
13 FAO activities update in Afghanistan, N° 2, p. 2, Jan 2003
14 The Central Statistics Office of the Interim Government of Afghanistan undertook a review and estimated the population at 22.2million people in 2003. Population growth is estimated at 1.9% a year, resulting in a population estimated at 22.6 million in 2004.
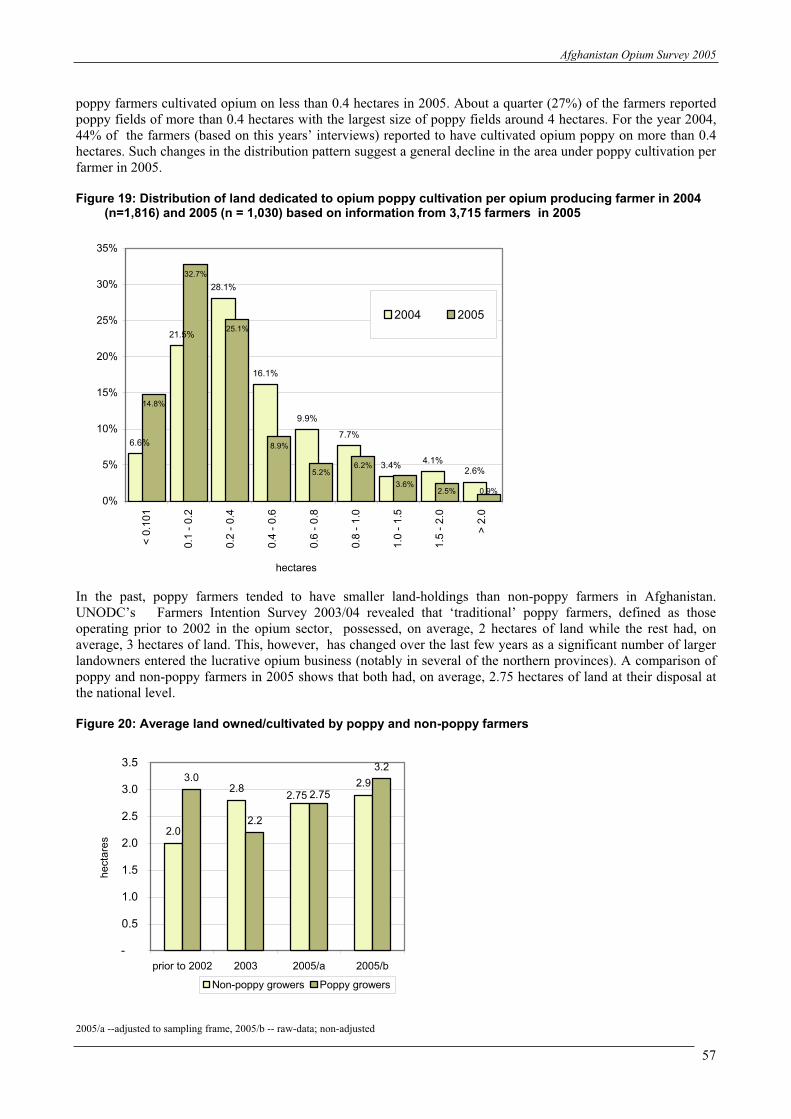
Afghanistan Opium Survey 2005
57
poppy farmers cultivated opium on less than 0.4 hectares in 2005. About a quarter (27%) of the farmers reported poppy fields of more than 0.4 hectares with the largest size of poppy fields around 4 hectares. For the year 2004, 44% of the farmers (based on this years’ interviews) reported to have cultivated opium poppy on more than 0.4 hectares. Such changes in the distribution pattern suggest a general decline in the area under poppy cultivation per farmer in 2005.
Figure 19: Distribution of land dedicated to opium poppy cultivation per opium producing farmer in 2004 (n=1,816) and 2005 (n = 1,030) based on information from 3,715 farmers in 2005
In the past, poppy farmers tended to have smaller land-holdings than non-poppy farmers in Afghanistan. UNODC’s Farmers Intention Survey 2003/04 revealed that ‘traditional’ poppy farmers, defined as those operating prior to 2002 in the opium sector, possessed, on average, 2 hectares of land while the rest had, on average, 3 hectares of land. This, however, has changed over the last few years as a significant number of larger landowners entered the lucrative opium business (notably in several of the northern provinces). A comparison of poppy and non-poppy farmers in 2005 shows that both had, on average, 2.75 hectares of land at their disposal at the national level.
Figure 20: Average land owned/cultivated by poppy and non-poppy farmers
2.0
2.82.9
3.0
2.2
3.2
2.75 2.75
-
0.5
1.0
1.5
2.0
2.5
3.0
3.5
prior to 2002 2003 2005/a 2005/b
he
cta
res
Non-poppy growers Poppy growers
2005/a --adjusted to sampling frame, 2005/b -- raw-data; non-adjusted
6.6%
21.5%
28.1%
16.1%
9.9%
7.7%
3.4%4.1%
2.6%
14.8%
32.7%
25.1%
8.9%
5.2%6.2%
3.6%2.5% 0.9%
0%
5%
10%
15%
20%
25%
30%
35%
< 0
.101
0.1
- 0
.2
0.2
- 0
.4
0.4
- 0
.6
0.6
- 0
.8
0.8
- 1
.0
1.0
- 1
.5
1.5
- 2
.0
> 2
.0
hectares
2004 2005

Afghanistan Opium Survey 2005
58
If the raw data of the sample are used (without any adjustments to the sampling frame), data suggest that poppy farmers possessed, on average, already more land than non-poppy farmers in 2005. This is also reflected in the distribution pattern of landholdings, even though the most striking characteristic remains the highly skewed distribution of landholdings in Afghanistan. Most poppy farmers (57%) and most non-poppy farmers (63%) do not have more than 2 hectares of land at their disposal and about a third has to live on less than 1 hectare of land. However, one finds proportionally more poppy farmers ( 30%) than non-poppy farmers (24%) with more than 3 ha. Among those having landholdings of more than 10 ha, the difference is even more pronounced: 5% of poppy farmers versus 3% of non-poppy farmers possess land of more than 10 ha.
Data collected also confirm that the overall size of landholdings in Afghanistan is rather small. In the USA, for instance, the average size of a farm was 179 hectares in 2003
15, and for a highly populated West European country,
such as Germany, data show an average size of a farm of 40 hectares (2003)16
. Only 8% of German farms have less than 2 ha versus close to 60% in Afghanistan, and 60% of German farms operate on more than 10 ha versus 4% in Afghanistan.
Figure 21: Distribution of land owned by opium poppy farmers (n = 1,030) and non-poppy farmers (2,685) in 2005, based on information from 3,715 farmers
10.7%
21.8%
30.4%
13.4%
8.0%
3.2%3.8%
1.5%2.1%
0.6%1.4%
3.2%
8.9%
19.3%
28.4%
13.2%
9.6%
5.3%4.4%
1.5%2.2%
0.9% 1.1%
5.1%
0%
5%
10%
15%
20%
25%
30%
35%
< 0
.5
0.5
- 1
1 -
2
2 -
3
3 -
4
4 -
5
5 -
6
6 -
7
7 -
8
8 -
9
9 -
10
>1
0
hectares
non-poppy farmers
poppy farmers
Another interesting finding of the survey was that the decline in the number of poppy farmers in 2005 concerned primarily those who had not been so deeply involved in opium production in 2004. Farmers who stopped growing opium had, on average, received 13% of their total income from opium in 2004. In contrast, farmers who continued growing opium poppy in 2005 had obtained, on average, 28% of their total income from opium in 2004.
15 US Census Bureau, USA Statistics in Brief--Agriculture and Business (http://www.census.gov/statab/www/agbus.html )
16 Statistisches Bundesamt Deutschland, Land und Forstwirtschaft, Betriebsgrößenstruktur landwirtschaftlicher Betriebe( http://www.destatis.de/basis/d/forst/forsttab1.php).


Afghanistan Opium Survey 2005
60
2.8 Reasons for reducing or increasing opium poppy cultivation
As part of the survey, 2,073 farmers in 1,243 villages across Afghanistan were asked why they were increasing or decreasing opium poppy cultivation in 2005. A total of 1,922 farmers (93%) provided reasons for a decline or the non-cultivation of opium poppy. Only 151 farmers (7%) provided reasons for an increase of opium poppy cultivation in 2005. The main reasons quoted by farmers for not cultivating or reducing opium poppy cultivation in 2005 were:
Fear of eradication (35%)
Fear of imprisonment (20%)
Forbidden by Islam (16%)
Poppy ban (15%)
Lower prices and less demand (10%)
The same question was asked as part of the UNODC’s Farmers Intention Survey 2003/04, though at an earlier stage of the crop cycle, before the farmers had actually planted the opium poppy. At that time, in October 2003, the number of farmers reporting that they would reduce opium poppy cultivation was significantly lower (4%) and the main reasons for reducing opium poppy cultivation were: ‘forbidden by Islam’ and ‘poppy ban’. In 2004/05, ‘fear of eradication’ gained strongly in importance as a deterrent to cultivating opium poppy.
Figure 22: Reasons for reducing or not cultivating opium poppy in 2005 (N = 1,922 farmers from 1118 villages)
0,0%
0,1%
0,1%
0,1%
0,2%
0,2%
1,6%
2,8%
4,7%
4,9%
15,3%
15,7%
19,7%
34,8%
0% 20% 40%
Shura decision
Fear of chemicals spraying
Availability of Govt. assistance
Lack of water
Lack of experience
Disease and low yield
No more 'salaam'
Higher input costs
Less demand
Lower opium prices
Poppy ban
Forbidden by Islam
Fear of imprisonment
Fear of eradication
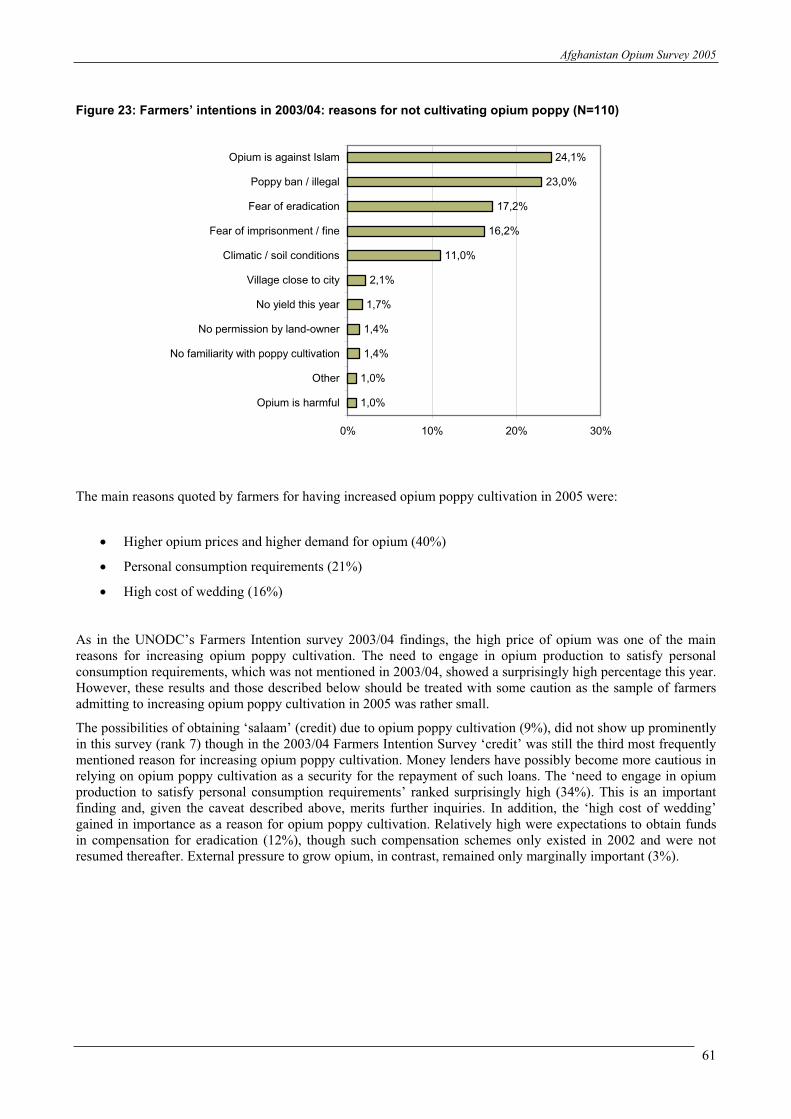
Afghanistan Opium Survey 2005
61
Figure 23: Farmers’ intentions in 2003/04: reasons for not cultivating opium poppy (N=110)
1,0%
1,0%
1,4%
1,4%
1,7%
2,1%
11,0%
16,2%
17,2%
23,0%
24,1%
0% 10% 20% 30%
Opium is harmful
Other
No familiarity with poppy cultivation
No permission by land-owner
No yield this year
Village close to city
Climatic / soil conditions
Fear of imprisonment / fine
Fear of eradication
Poppy ban / illegal
Opium is against Islam
The main reasons quoted by farmers for having increased opium poppy cultivation in 2005 were:
Higher opium prices and higher demand for opium (40%)
Personal consumption requirements (21%)
High cost of wedding (16%)
As in the UNODC’s Farmers Intention survey 2003/04 findings, the high price of opium was one of the main reasons for increasing opium poppy cultivation. The need to engage in opium production to satisfy personal consumption requirements, which was not mentioned in 2003/04, showed a surprisingly high percentage this year. However, these results and those described below should be treated with some caution as the sample of farmers admitting to increasing opium poppy cultivation in 2005 was rather small.
The possibilities of obtaining ‘salaam’ (credit) due to opium poppy cultivation (9%), did not show up prominently in this survey (rank 7) though in the 2003/04 Farmers Intention Survey ‘credit’ was still the third most frequently mentioned reason for increasing opium poppy cultivation. Money lenders have possibly become more cautious in relying on opium poppy cultivation as a security for the repayment of such loans. The ‘need to engage in opium production to satisfy personal consumption requirements’ ranked surprisingly high (34%). This is an important finding and, given the caveat described above, merits further inquiries. In addition, the ‘high cost of wedding’ gained in importance as a reason for opium poppy cultivation. Relatively high were expectations to obtain funds in compensation for eradication (12%), though such compensation schemes only existed in 2002 and were not resumed thereafter. External pressure to grow opium, in contrast, remained only marginally important (3%).
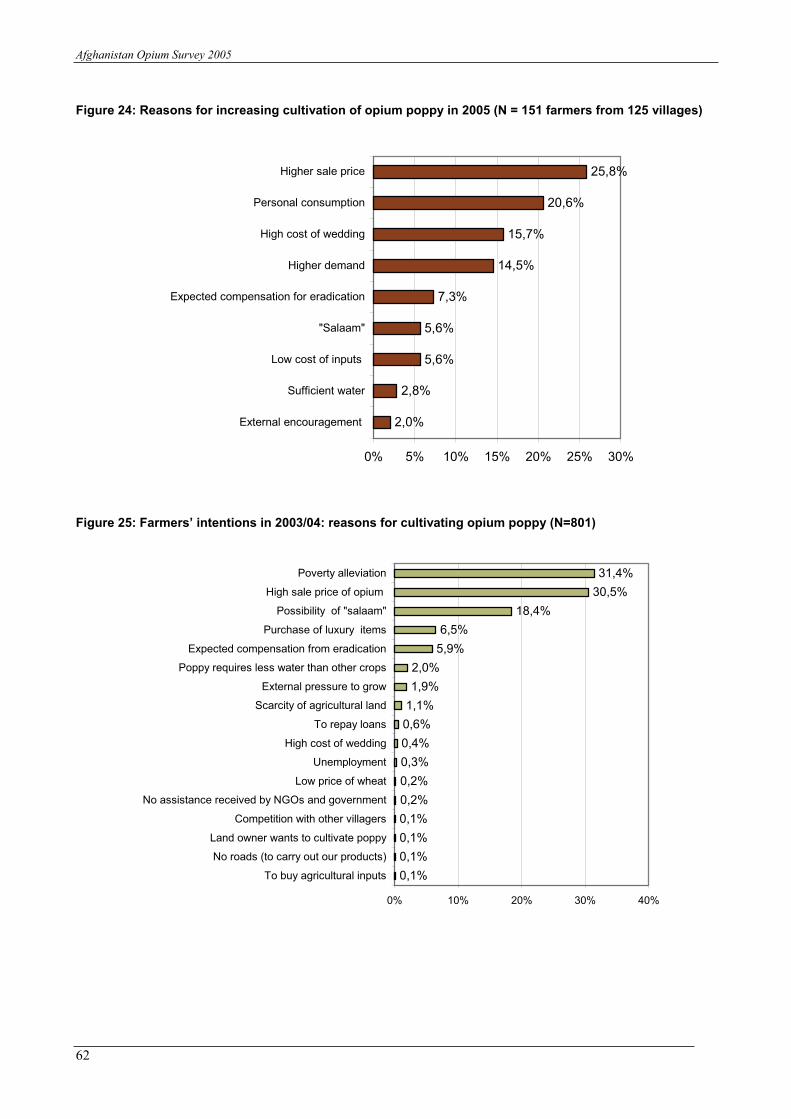
Afghanistan Opium Survey 2005
62
Figure 24: Reasons for increasing cultivation of opium poppy in 2005 (N = 151 farmers from 125 villages)
Figure 25: Farmers’ intentions in 2003/04: reasons for cultivating opium poppy (N=801)
0,1%
0,1%
0,1%
0,1%
0,2%
0,2%
0,3%
0,4%
0,6%
1,1%
1,9%
2,0%
5,9%
6,5%
18,4%
30,5%
31,4%
0% 10% 20% 30% 40%
To buy agricultural inputs
No roads (to carry out our products)
Land owner wants to cultivate poppy
Competition with other villagers
No assistance received by NGOs and government
Low price of wheat
Unemployment
High cost of wedding
To repay loans
Scarcity of agricultural land
External pressure to grow
Poppy requires less water than other crops
Expected compensation from eradication
Purchase of luxury items
Possibility of "salaam"
High sale price of opium
Poverty alleviation
2,0%
2,8%
5,6%
5,6%
7,3%
14,5%
15,7%
20,6%
25,8%
0% 5% 10% 15% 20% 25% 30%
External encouragement
Sufficient water
Low cost of inputs
"Salaam"
Expected compensation for eradication
Higher demand
High cost of wedding
Personal consumption
Higher sale price

Afghanistan Opium Survey 2005
63
2.9 Loans
Outstanding loans
As part of the survey, farmers were also asked whether they had outstanding loans and whether they took out a new loan in 2005. These questions are of relevance as past research indicated that the lack of properly working financial institutions in Afghanistan, in combination with the need of farmers to bridge the gap until the next harvest, was one of the key reasons for farmers to engage in opium poppy cultivation. Notably ‘salaam’ arrangements, i.e. the advance sale of opium prior to harvest, which obliges farmers to plant and harvest opium in order to repay their debts, were identified in the past as a major driving force for poppy cultivation.
Out of 3,772 farmers who provided information 36% reported to have one or several outstanding loans. This is a higher proportion than the results obtained in UNODC’s 2003/04 Farmers’ Intention Survey where 29% of the interviewed farmers reported to have one or several outstanding loans. The average amount of the outstanding loans per farmer from previous period was US$726 in 2005. The average amount of outstanding loans has been equivalent to about three times the per capita GDP in Afghanistan (US$226 in 2004/05). The average amount of outstanding loans has remained largely stable since 2003 ($709 in 2003).
Figure 26: Outstanding loans from previous years among farmers
0%
5%
10%
15%
20%
25%
30%
35%
40%
Pro
po
rtio
n
0
100
200
300
400
500
600
700
800
US
$
Proportion of farmers having
outstanding loans
29% 36%
Amount of outstanding loan
per farmer
709 726
2003 2005
Poppy farmers (including farmers who produced poppy in 2004) have had, on average, slightly higher outstanding loans (+4%) than non-poppy farmers in 2005. In contrast, UNODC’s 2003/04 Farmers Intention Survey revealed that poppy farmers had, on average 60% higher outstanding loans (US$740) than non poppy farmers (US$460). Survey data thus suggest that the average amount of outstanding loans fell slightly for poppy farmers, possibly as a result of good harvests and high opium prices over the last few years, but increased strongly for non-poppy farmers over the 2003-2005 period. This may, at least partially, explain why poppy farmers gave a lower priority to access to loans this year as compared to the 2003 results in UNODC’s Farmers Intention Survey.
The outstanding loans, per farmer, are highest in the two main traditional opium producing regions of the country, eastern Afghanistan (US$861), followed by southern Afghanistan (US$818). Eastern Afghanistan also has the highest proportion of farmers, who have outstanding loans (53%). This is potentially problematic scenario as outstanding loans in combination with the strong decline of opium production in eastern Afghanistan this year, are likely to put severe financial pressure on to farmers to resume opium production next year in order not to default.

Afghanistan Opium Survey 2005
64
Table 14: Regional breakdown of outstanding loans
Region Proportion of farmers having
outstanding loans
Average amount of outstanding loans
per farmer in US$
Eastern 53% 861
Southern 35% 818
Central 36% 814
Northern 29% 796
North-eastern 40% 474
Western 34% 388
TOTAL 36% 726
New Loans
The amount of new loans taken out in 2005 was, on average, US$500 per farmer (poppy and non-poppy farmer), equivalent to about twice the per capita GDP of Afghanistan (US$226 in 2004/05). The amounts ranged from less than US$1 to US$10,000 (median: US$318). As compared to 2003, the average loan size declined significantly (-29%), apparently reflecting a strategy by money lenders to reduce risk.
Table 15: New loans taken out by farmers
0%
5%
10%
15%
20%
25%
30%
35%
40%
45%
50%
Pro
po
rtio
n
0
100
200
300
400
500
600
700
800
US
$
Proportion of farmers having
taken out a loan
47% 33%
New loans 699 499
2003 2005
New loans were taken out by 33% of the interviewed farmers, a smaller proportion than in 2003 (47%). All of this also adds to the explanation why farmers gave access to credit a lower priority this year than in 2005. The promise by farmers to grow opium in the next season, in order to repay their debts, was less trusted by money lenders than in the past.
The highest proportions of farmers taking out new loans were found in north-eastern (53%), eastern (41%) and central Afghanistan (36%), i.e. in those regions which experienced significant declines in opium poppy cultivation in 2005, and where farmers were thus desperate to cover their basic financial needs. In terms of loan size, farmers in northern Afghanistan ranked first (US$711). This could reflect a perception by money lenders that repayment of loans in these provinces, where the opium ban de facto has not been implemented this year, has a higher likelihood than in other parts of the country, so that they can act more generously granting such loans.
The increased risk perception by money lenders may also reflect the fact that the average loan granted to poppy farmers has been just 4% higher than the average loan given to a non-poppy farmer in 2005. Back in 2003, poppy growers obtained, on average, loans that were almost 60% higher (US$724, on average) than non-poppy growers (US$461).

Afghanistan Opium Survey 2005
65
Table 16: Regional breakdown of new loans taken out in 2005
Region
Average amount of new loans taken out per farmer in US$
(n = 1,241)
Proportion of farmers who took out a new loan in 2005
(n = 3,767)
North-eastern 403 53%
Eastern 575 41%
Central 387 36%
Northern 711 28%
Southern 547 26%
Western 238 25%
TOTAL 499 33%
Sources of new loans
55% of the poppy growing farmers reported to have obtained their loans from shopkeepers and traders (who are often involved in the opium business). The next most frequent source were relatives (30%). Other sources included fellow villagers, such as neighbours, headmen and shura chiefs (8%), land-owners (5%), farmer cooperatives (2%) and NGOs (less than 1%). In terms of funds obtained, poppy farmers reported that 53% of their total loans came from shopkeepers & traders and 30% from relatives.
In the case of non-poppy farmers, 36% of the total amounts have been received from relatives and 35% from shopkeepers & traders. Thus, the amounts received from shopkeepers & traders continued to be smaller for non-poppy farmers than for poppy farmers. The third largest source of credit for non-poppy farmers were NGOs (16% of total amount); in this context, the Aga Khan Foundation, Focus NGO, Okandan NGO and Area NGO were frequently mentioned. 3% of the funds were obtained through the Agriculture Development Bank.
Figure 27: Sources of loans obtained by farmers in 2005
0.0%
10.0%
20.0%
30.0%
40.0%
50.0%
60.0%
So
urc
e o
f lo
an
SHOPKEEPERS/TRADERS 54.8% 52.5% 42.8% 35.4%
RELATIVE 30.5% 29.7% 37.5% 36.4%
FELLOW VILLAGERS 7.9% 8.3% 9.2% 7.7%
LAND OWNER 4.5% 8.1% 1.5% 1.7%
CO-OPERATIVE 1.7% 0.8% 0.1% 0.1%
NGOs 0.7% 0.5% 3.7% 15.6%
FINANCIAL INSTITUTIONS 5.0% 2.9%
GOVERNMENT 0.2% 0.4%
No. of mentions Amount in US$ No. of mentions Amount in US$
Poppy farmers Non-Poppy farmers
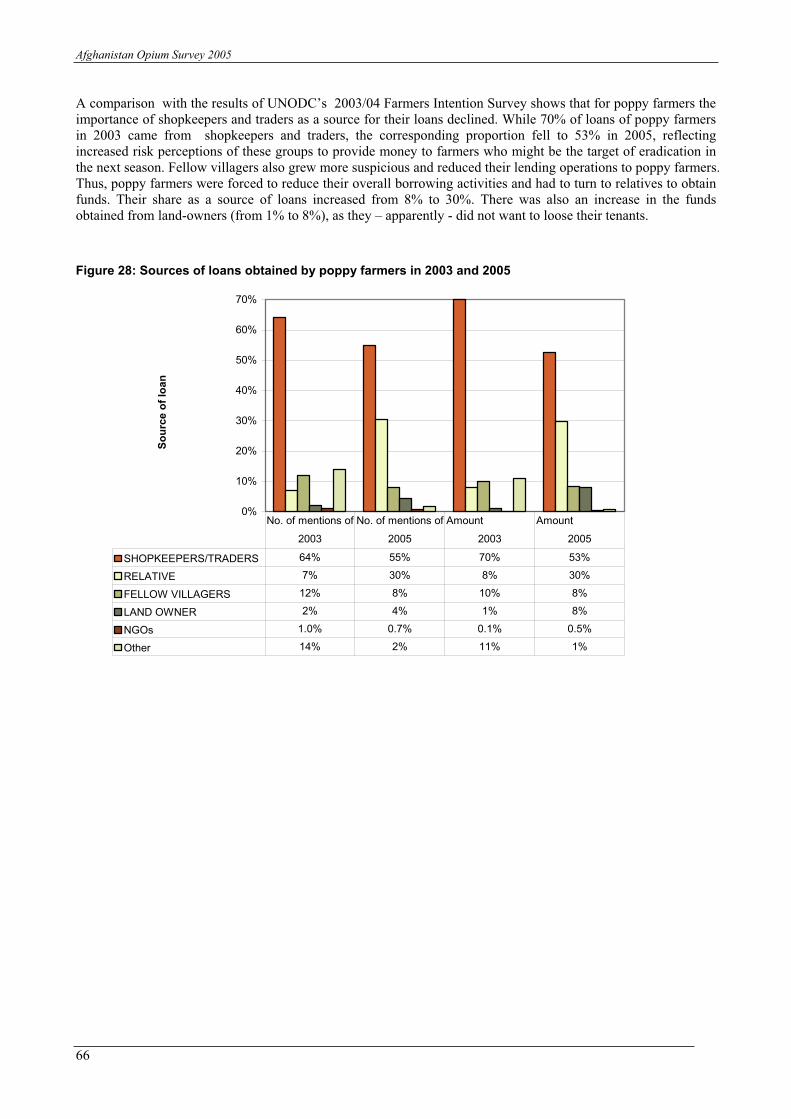
Afghanistan Opium Survey 2005
66
A comparison with the results of UNODC’s 2003/04 Farmers Intention Survey shows that for poppy farmers the importance of shopkeepers and traders as a source for their loans declined. While 70% of loans of poppy farmers in 2003 came from shopkeepers and traders, the corresponding proportion fell to 53% in 2005, reflecting increased risk perceptions of these groups to provide money to farmers who might be the target of eradication in the next season. Fellow villagers also grew more suspicious and reduced their lending operations to poppy farmers. Thus, poppy farmers were forced to reduce their overall borrowing activities and had to turn to relatives to obtain funds. Their share as a source of loans increased from 8% to 30%. There was also an increase in the funds obtained from land-owners (from 1% to 8%), as they – apparently - did not want to loose their tenants.
Figure 28: Sources of loans obtained by poppy farmers in 2003 and 2005
0%
10%
20%
30%
40%
50%
60%
70%
So
urc
e o
f lo
an
SHOPKEEPERS/TRADERS 64% 55% 70% 53%
RELATIVE 7% 30% 8% 30%
FELLOW VILLAGERS 12% 8% 10% 8%
LAND OWNER 2% 4% 1% 8%
NGOs 1.0% 0.7% 0.1% 0.5%
Other 14% 2% 11% 1%
No. of mentions of No. of mentions of Amount Amount
2003 2005 2003 2005

Afghanistan Opium Survey 2005
67
2.10 External assistance
One question to the headman was whether the surveyed village had received external assistance. Out of 1878 villages which provided information on this question, the headmen of 1649 villages (88%) confirmed to have received some form of external assistance over the last few years. Most assistance was in the field of medicine, (81%), followed by education (20%), construction activities (20%), agricultural inputs (14%) and irrigation (4%).
Figure 29: External assistance interventions - mentions by headmen (n = 1878 villages)
0.6%
0.3%
0.4%
0.7%
1.1%
3.3%
4.4%
14.1%
19.9%
20.4%
80.9%
0% 10% 20% 30% 40% 50% 60% 70% 80% 90%
Other
Cash for work
Sewing/weaving machines
Electricity
Drinking water
Food assistance
Irrigation
Agricultural inputs (fertilizers, seeds)
Road / Construction
Education
Medical (incl. vaccinations)
Linking information on the status of a village with regard to opium production in 2005 and assistance received, data suggest that about the same assistance was given to opium poppy and non-opium poppy villages in 2005: 86% (35.1%/40.9%) of the opium producing villages received economic assistance in 2005, versus 89% (52.9%/59.1%) of the non-opium producing villages. Based on the headmen interviews (n = 1087) it appears that about 40% of external assistance interventions went to opium poppy producing villages and 60% to non-opium producing villages in 2005. (In this calculation, all types of external assistance have been assumed to be of equal importance; the actual amounts spent were not considered).
Table 17: External assistance and poppy status of village as reported by headmen (n = 1087 villages)
Assistance received No opium cultivationin 2005
Opium cultivation in 2005
Total
No 6.4% 5.8% 12.2%
Yes 52.7% 35.1% 87.8%
Total 59.1% 40.9% 100.0%
It is difficult to judge whether the assistance had any direct impact on the farmers’ decision to reduce the area under poppy cultivation in 2005. Nonetheless, based on information from 1066 villages which provided information on changes in the area under poppy cultivation (obtained through interviews of two randomly selected farmers per village) and information on assistance received from the headmen, it seems that external assistance was a conducive factor for the stabilization or reduction of opium poppy cultivation in 2005. In 78% of all villages, external assistance received went hand in hand with a reduction in the area under poppy cultivation, while only in

Afghanistan Opium Survey 2005
68
9% of the villages, farmers reported to have increased opium poppy cultivation though the village had obtained external assistance.
Table 18: External assistance and change in poppy cultivation reported by farmers (n = 1066 villages)
Assistance receivedStabilization or decline of poppy
of cultivation in 2005* Increase of poppy cultivation
in 2005* Total
No 11.0% 1.8% 12.8%
Yes 77.9% 9.4% 87.2%
Total 88.8% 11.2% 100.0%
If the change in opium poppy cultivation reported by farmers is calculated, data suggest that in villages that received external assistance, the decline in the area under poppy cultivation amounted to, on average, 0.37 hectares per poppy farmer in 2005 (based on interviews of two randomly selected farmers per village), almost 50% more than the decline in villages that had not received external assistance (0.25 ha). This pattern of a stronger decline of opium poppy cultivation in villages that had received external assistance, was observed in most regions of the country. Even though the overall numbers, based on self-reports, apparently over-state the decline in poppy cultivation (as can be seen by a comparison with data gathered through satellite images), this does not change the basic argument that the decline in the area under poppy cultivation in villages receiving external assistance was apparently larger than in villages that had not obtained such assistance.
Table 19: External assistance as reported by headmen and change in the area under poppy cultivation as reported by poppy farmers in 2005
Change in hectares per poppy farmer in 2005
No external assistance received External assistance received
North-eastern -0.29 -0.56
Southern 0.00 -0.50
Northern -0.24 -0.40
Central -0.35 -0.29
Eastern 0.00 -0.22
Western 0.01 -0.15
All Afghanistan -0.25 -0.37

Afghanistan Opium Survey 2005
69
2.11 Ethnic distribution
As part of the village survey, data was collected from the village headman in 1,842 villages on the ethnic/linguistic distribution among the surveyed population. The findings are in line with existing information and show the predominance of Pashtun population in the southern and eastern parts of the country and of Tajik/Dari/Farsi speaking population in the northern and western parts of Afghanistan, as well as of Hazara population in some provinces in central Afghanistan. Perhaps more interesting, they also confirm the ethnic diversity within many provinces, which facilitates communication and transactions, including trafficking, across the country.
In terms of production, available data for 2005 suggest that more than half of the country’s opium production (56%) originated from Pashtun farmers, followed by Tajik/dari-speaking farmers (21%) and Uzbek farmers (9%). A comparison with data collected in 1994 shows a clear increase of opium production among Tajik, Uzbek, Hazara and other ethnics while the proportion of opium production among the country’s Pashtun population declined (from 88% to 56%). This is due to a combination of factors including the strong decline of opium production in eastern Afghanistan in 2005, and the increase of opium production – as compared to a decade earlier – in the northern and western parts of the country.
While the overall trend is clear, the percentages of the ethnic distribution of opium farmers presented here must be treated with caution. The results were derived by distributing provincial opium production according to the distribution of the population in opium producing villages. This assumes a homogeneous distribution of poppy farmers in villages of mixed ethnic composition – which is not necessarily the case.
Figure 30: Ethnic distribution of population in opium producing villages in 1994 and 2005
UZBEK
0,1%TAJIK
1,4%ETHNICAL
LY MIXED
10,1%
HAZARA
0,0%
PASHTUN
88,4%
HAZARA
5% OTHER
9%
PASHTUN
56%
TAJIK
21%
UZBEK
9%
1994 2005


Afghanistan Opium Survey 2005
71
2.12 Opium Prices
Based on interviews in 1,842 villages, the average fresh opium price was calculated at US$107/kg. If the prices are weighted by regional opium production (as done in previous years), the average price for fresh opium was US$102 (+/- US$17). As compared to a year earlier, fresh opium prices were 16% higher than at harvest time in 2004 and still two to three times higher than in the second half of the 1990s, though significantly lower than over the 2001-2003 period (around US$300).
The prices of dry opium remained basically stable with a simple average of $148/kg, or $138/kg (+/- US$14). If weighted by regional opium production (US$142 in 2004). There continue to be, however, important regional differences. The lowest prices were found in Northern Afghanistan (US$112), reflecting strong increases in production. The highest prices were encountered in Central Afghanistan (US$235), where production basically ceased in 2005. Above average prices were also reported from Eastern Afghanistan, due to law enforcement activities, and from Western Afghanistan (US$164), reflecting high opium prices in neighbouring Iran.
In order to minimize the cost, opium is usually transformed into morphine/heroin rather close to the area of production and the final product (morphine/heroin) is then trafficked to the closest border. A major exception to this “rule” is opium produced in northern Afghanistan. Most of this opium is trafficked from the northern to the southern region. Traffickers from the southern region either visit markets in the north or place orders. Although the cost of transporting opium from the North to Southern Afghanistan is high, the disparity in opium prices between the two regions makes trafficking to the South worthwhile.
Figure 31: Fresh opium farm-gate prices at harvest time (weighted by production) in Afghanistan, 1994-2005 (US$/kg)
30
23
24 3
4
33 40
28
30
1
35
0
28
3
92 1
02
0
50
100
150
200
250
300
350
400
94 95 96 97 98 99 00 01 02 03 04 05
US
$/k
g
Sources: UNODC, Opium Surveys 1994-2005

Afghanistan Opium Survey 2005
72
Table 20: Opium prices in Afghanistan in US$ per kilogram at harvest time in 2005 – regional breakdown
Region
Average
Fresh
Opium Price
(USD) - 2004
Average
Fresh
Opium
Price (USD) -
2005
Change
Average Dry
Opium Price
(USD)-2004
Average Dry
Opium Price
(USD)-2005
Change
North-Eastern (Badakhshan, Takhar) 42 76 81% 65 128 97%
Northern (Bamyan, Jawzjan, Sari Pul, Baghlan, Faryab, Balkh, Samangan, Badghis, Kunduz)
66 90 36% 109 112 3%
Central (Parwan, Paktya, Wardak, Khost, Kabul, Logar)
97 153 58% 133 235 77%
Southern (Hilmand, Uruzgan, Kandahar, Zabul, Ghazni, Paktika)
123 120 -2% 150 141 -6%
Western (Ghor, Hirat, Farh, Nimroz) 106 124 17% 158 164 4%
Eastern (Nangarhar, Kunar, Laghman, Nuristan, Kapisa)
94 151 61% 192 179 -7%
Unweighted average 86 107 24% 138 148 7%
National average price weighted by
production92 102 11% 142 138 -3%
Figure 32: Dry opium farm-gate prices at harvest time, regional breakdown, US$/kg
142133
192
158150
65
109
138
235
179164
141128
112
0
50
100
150
200
250
Afg
hanis
tan
Centr
al
Easte
rn
We
ste
rn
South
ern
Nort
h-
Easte
rn
Nort
hern
2004 2005
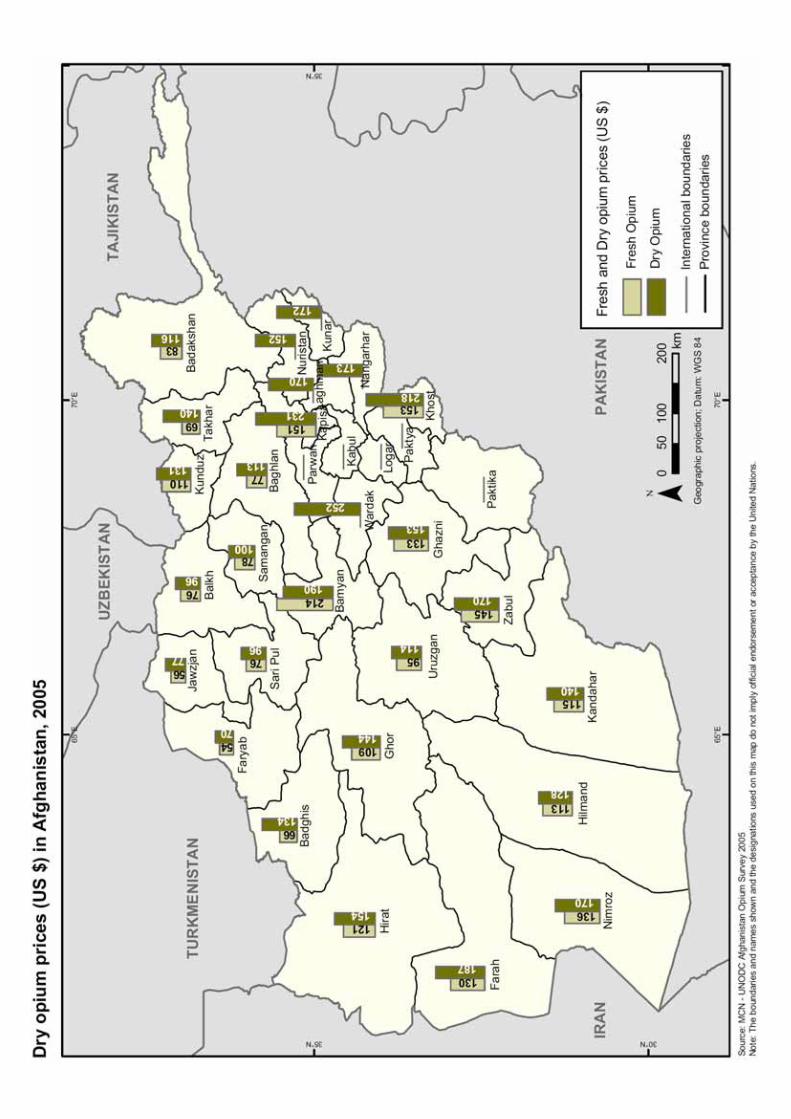

Afghanistan Opium Survey 2005
74
Figure 33: Dry opium prices between May 2004-August 2005 in Afghanistan (US$ per kg)
135124
107
136
180
154
222
170
187
161
147139
123
137
167 171
0
50
100
150
200
250
May-0
4
Jun-0
4
Jul-04
Aug-0
4
Sep-0
4
Oct-
04
Nov-0
4
Dec-0
4
Jan-0
5
Feb-0
5
Mar-
05
Apr-
05
May-0
5
Jun-0
5
Jul-05
Aug-0
5
US
$/k
g
Opium prices have been regularly collected since 1997 in selected parts of Nangarhar (eastern Afghanistan) and Kandahar (southern Afghanistan), as part of UNODC/ICMP project on Monitoring Opium Production in Afghanistan. Beginning a few years ago, prices have also been collected in Badakhshan, Balkh, Hilmand and Hirat, from both poppy farmers and local opium traders.
At the end of August 2005, the average price for one kilo of dry opium in Afghanistan at the farm gate level amounted to US$ 171, a 2% increase over prices recorded a month earlier. Dry opium prices increased 39% between May-August 2005. Dry opium prices collected from traders amounted to US$ 176 with a 5% increase in August 2005. Trader prices for dry opium increased in all regions in Afghanistan.

Afg
han
ista
n, p
rices o
f d
ry o
piu
m in
Nan
garh
ar
an
d K
an
dah
ar
co
llecte
d f
rom
tra
ders
, U
S$/k
g, M
arc
h 1
997 -
Au
gu
st
2005
208
424
116
700
640
31
115
173
254
119
0
100
200
300
400
500
600
700
Jan-97
Mar-97
May-97
Jul-97
Sep-97
Nov-97
Jan-98
Mar-98
May-98
Jul-98
Sep-98
Nov-98
Jan-99
Mar-99
May-99
Jul-99
Sep-99
Nov-99
Jan-00
Mar-00
May-00
Jul-00
Sep-00
Nov-00
Jan-01
Mar-01
May-01
Jul-01
Sep-01
Nov-01
Jan-02
Mar-02
May-02
Jul-02
Sep-02
Nov-02
Jan-03
Mar-03
May-03
Jul-03
Sep-03
Nov-03
Jan-04
Mar-04
May-04
Jul-04
Sep-04
Nov-04
Jan-05
Mar-05
May-05
Jul-05
Sep-05
US$/kg
Na
ng
arh
ar
(ea
ste
rn A
fgh
an
ista
n)
Ka
nd
ah
ar
(so
uth
ern
Afg
ha
nis
tan
)u
nw
eig
hte
d a
ve
rag
e

Afghanistan Opium Survey 2005
76
2.13 Potential value and income to farmers
Based on opium production estimates and reported opium prices the farm-gate value of the opium harvest can be estimated at around US$560 million (90% confidence interval: US$470 to US$655 million). The bulk of the income was earned by farmers in southern and northern Afghanistan, accounting for two thirds of total income from opium production.
Table 21: Farm-gate value of opium production in 2005
Region Production of dry opium
in kg
Price of dry opium per kg in
US$
Farmgate value in
million US$
Southern 1,749 141 246.52
Northern 1,098 112 123.11
Western 685 164 112.29
North-Eastern 365 128 46.60
Eastern 180 179 32.36
Central 4 235 0.90
Total 4,082 138 561.77
Total rounded 4,100 560
90% confidence interval 3,560 – 4,610 +/- 14 470 - 655
Given slightly lower production and slightly lower dry opium prices, the overall farm-gate value of opium production was some 7% lower than in 2004 and some 55% lower than in 2002. Nonetheless, the income from opium production was still three times higher than in 1999 and six times higher than in 2000.
Figure 34: Estimated value of opium production at farm-gate level in Afghanistan, 1994-2005
10254 54 95 88
18391
560
600
1,020
56
1,200
-
200
400
600
800
1,000
1,200
1994 1995 1996 1997 1998 1999 2000 2001 2002 2003 2004 2005
mill
ion U
S$
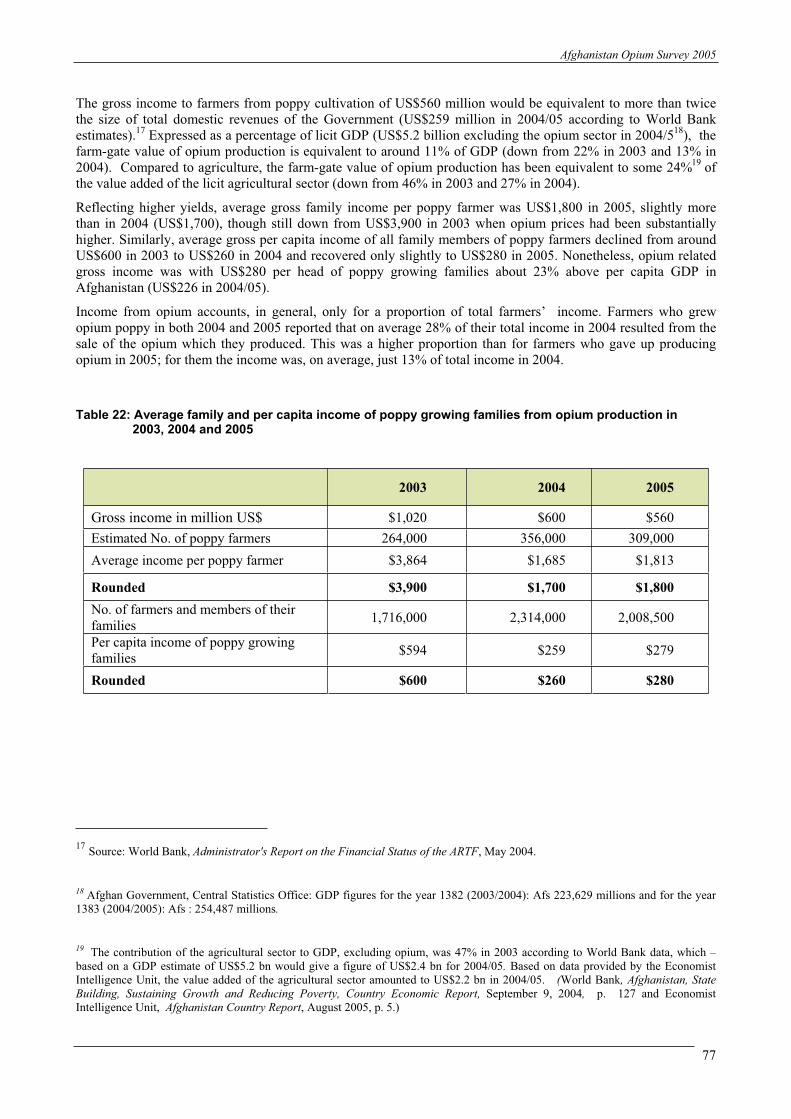
Afghanistan Opium Survey 2005
77
The gross income to farmers from poppy cultivation of US$560 million would be equivalent to more than twice the size of total domestic revenues of the Government (US$259 million in 2004/05 according to World Bank estimates).
17 Expressed as a percentage of licit GDP (US$5.2 billion excluding the opium sector in 2004/5
18), the
farm-gate value of opium production is equivalent to around 11% of GDP (down from 22% in 2003 and 13% in 2004). Compared to agriculture, the farm-gate value of opium production has been equivalent to some 24%
19 of
the value added of the licit agricultural sector (down from 46% in 2003 and 27% in 2004).
Reflecting higher yields, average gross family income per poppy farmer was US$1,800 in 2005, slightly more than in 2004 (US$1,700), though still down from US$3,900 in 2003 when opium prices had been substantially higher. Similarly, average gross per capita income of all family members of poppy farmers declined from around US$600 in 2003 to US$260 in 2004 and recovered only slightly to US$280 in 2005. Nonetheless, opium related gross income was with US$280 per head of poppy growing families about 23% above per capita GDP in Afghanistan (US$226 in 2004/05).
Income from opium accounts, in general, only for a proportion of total farmers’ income. Farmers who grew opium poppy in both 2004 and 2005 reported that on average 28% of their total income in 2004 resulted from the sale of the opium which they produced. This was a higher proportion than for farmers who gave up producing opium in 2005; for them the income was, on average, just 13% of total income in 2004.
Table 22: Average family and per capita income of poppy growing families from opium production in 2003, 2004 and 2005
2003 2004 2005
Gross income in million US$ $1,020 $600 $560
Estimated No. of poppy farmers 264,000 356,000 309,000
Average income per poppy farmer $3,864 $1,685 $1,813
Rounded $3,900 $1,700 $1,800
No. of farmers and members of their families
1,716,000 2,314,000 2,008,500
Per capita income of poppy growing families
$594 $259 $279
Rounded $600 $260 $280
17Source: World Bank, Administrator's Report on the Financial Status of the ARTF, May 2004.
18 Afghan Government, Central Statistics Office: GDP figures for the year 1382 (2003/2004): Afs 223,629 millions and for the year 1383 (2004/2005): Afs : 254,487 millions.
19 The contribution of the agricultural sector to GDP, excluding opium, was 47% in 2003 according to World Bank data, which – based on a GDP estimate of US$5.2 bn would give a figure of US$2.4 bn for 2004/05. Based on data provided by the Economist Intelligence Unit, the value added of the agricultural sector amounted to US$2.2 bn in 2004/05. (World Bank, Afghanistan, State
Building, Sustaining Growth and Reducing Poverty, Country Economic Report, September 9, 2004, p. 127 and Economist Intelligence Unit, Afghanistan Country Report, August 2005, p. 5.)

Afghanistan Opium Survey 2005
78
The difference in accumulated ‘wealth’ between opium poppy growing (‘this year or in previous years’) and non-opium poppy growing farmers (‘never in their life’) becomes more pronounced if the actual possession or non-possession of consumer goods or capital goods is analysed:
In Nangarhar province, for instance, 3% of the interviewed poppy farmers (n=166) had a tractor and 7% had a car while none of the interviewed non-poppy growing farmers had a tractor or a car. Similarly, 7% of the poppy growing farmers had a TV and 2% had a satellite receiver while only a few TVs and no satellite receivers were reported among non-poppy growing farmers.
In Hilmand province, 2% of the poppy growing farmers (n = 149) had a tractor and 15% had a car while no such items were found among non-opium growing farmers.
In Kandahar province 26% of the interviewed poppy growing farmers (n = 174) had a tractor versus 16% among non-opium growing farmers; 3% of the opium poppy growing farmers had a car while none of the non-opium producing farmers had one.
In Balkh province (n = 72) 11% of the opium poppy growing farmers possessed a tractor versus 2% among the non-poppy growing farmers.
In Badakhsan province 5% of the poppy growing farmers (n = 120) had a motorcycle versus none among the non-opium producing farmers.
In Uruzgan province 29% of the interviewed poppy growing farmers (n = 185) had a motorcycle, 4% a car, 3% a tractor while among the interviewed non-poppy growing farmers none had a car, none had a tractor and only 10% had a motorcycle.
At the same time, the analysis for Afghanistan as a whole reveals that opium poppy farmers (n = 2208) are, in general, not wealthier than non-poppy growing farmers (n = 1490), reflecting the fact that opium poppy is grown in several of the more backward or disadvantaged regions of the country: For example, in central Afghanistan, where opium cultivation was never important and almost disappeared in 2005, farmers seem to be wealthier than farmers in traditional poppy growing areas: in Ghazni 11% of the farmers had car, 18% in Paktya and 28% in Khost. This is much higher than the Afghan average for both opium growing and non-opium poppy growing farmers.
Overall findings confirm that opium poppy farmers are not wealthier than non-poppy growing farmers: 5% of the interviewed opium poppy growing farmers had a tractor - the same proportion as for the interviewed non opium poppy growing farmers. For some of the other items, possession of consumer goods among opium poppy farmers at the national level was even slightly less common than among non opium poppy producing farmers:
4% of the interviewed opium poppy growing farmers had a car versus 6% of non opium poppy growing farmers;
9% of opium poppy farmers had a TV versus 10% among non opium poppy farmers;
1% of opium poppy growers had a satellite dish versus 2% among non opium poppy growing farmers.
Only in the case of motorcycles the pattern was different. Opium poppy farmers had clearly higher numbers at their disposal, reflecting the fact that poppy farmers tend to be younger than non-poppy farmers and that a motorcycle is status object for the younger generation: 27% of poppy growing farmers had a motorcycle versus 17% of non opium poppy farmers.
Table 23: Possession of consumer/capital goods among surveyed population in Afghanistan, 2005
% of opium poppy growing farmers (‘ever’) who possess a:
% of non-opium poppy growing farmers (‘never’) who possess a:
motorcycle tractor car motorcycle tractor car
Afghanistan
average
27% 5% 4% 17% 5% 6%
Nangarhar 3% 3% 7% 0% 0% 0%
Hilmand 56% 2% 15% n.a. 0% 0%
Kandahar 58% 25% 3% 30% 16% 0%
Balkh 38% 11% 11% 0% 2% 0%
Badakhshan 5% n.a. 1% 0% 0% 0%
Uruzgan 29% 3% 4% 10% 0% 0%

Afghanistan Opium Survey 2005
79
Gross income of opium poppy cultivation per hectare amounted to US$5,400 (yield of 39 kg of dry opium per ha × price of US$138 of dry opium per kg). The income from a hectare under cultivation was slightly higher than a year earlier (US$4600), reflecting a better yield than in the previous year. Nonetheless, opium income per hectare was still less than over the 2001-2003 period, less than half the income in 2003, though five times more than in the 1990s or in the year 2000. A family cultivated, on average, 0.33 hectares of opium poppy in 2005.
Figure 35: Gross income of poppy cultivation per hectare in US$
1,000 1,100
7,400
16,200
12,700
4,6005,400
-
2,000
4,000
6,000
8,000
10,000
12,000
14,000
16,000
18,000
1995 2000 2001 2002 2003 2004 2005
US
$
The difference between the gross income from a hectare under wheat as compared to a hectare under poppy cultivation remained important (10:1 ratio), but it continued declining. While in 2003 a hectare under poppy cultivation would bring a farmer 27 times more in gross income than a hectare under wheat production, the respective ratio declined to 12 in 2004 and to 10 in 2005. The comparison is based on the gross income from a hectare under poppy cultivation and the expected gross income from a hectare of an irrigated wheat field.
Even though the differences in the net income are much less, opium poppy remains an attractive option for farmers. In order to arrive at the net income figures, a number of cost items (labour, fertilizers, seed, fuel, depreciation for tractors and other agricultural equipment as well as taxes to local commanders and various bribes) would have to be deducted. These costs can be important for opium
20 and are, in general, higher than for the
cultivation of wheat or other agricultural products. Farmers reported, for instance this year that they had to spend $80 per jerib (0.2 ha) on fertilizers, i.e. 66% more than for the cultivation of wheat ($48 per jerib). In the case of labour, previous studies suggested that 350 person-days were needed to cultivate 1 ha of opium poppy as compared to 41 person days for the cultivation of wheat.
21 Salaries paid to itinerant workers assisting with the
harvesting of opium poppy are usually also higher than salaries paid to itinerant workers assisting in the
20 According to information gathered in UNODC’s 2003/04 Farmers Intention Survey, some 45% of gross income in 2003 was spent on various input costs. A poppy farmer in 2003 could reckon with a gross income of $12,700 per hectare if he sold opium at harvest time. The actual gross income of farmers, selling later (and thus at lower prices) and/or at lower prices due to salaam arrangements, was more than 30% less ($8,700 per ha). The overall self-reported net-income of a poppy farmer, cultivating on average 0.45 ha in the sample, amounted to $2,128; the net income for 1 ha under poppy cultivation would thus have been equivalent to $4730, or 54%of gross income. In other words, about half (46%) of gross income was apparently spent by farmers on labour costs, fertilizer, seed, payments to commanders, etc. Payments to local commanders were usually equivalent to around 10%, though going up to 40% of the value of the opium sold in some districts. (UNODC/Govt. of Afghanistan (Counter Narcotics Directorate), Farmers Intention Survey2003/2004, February 2004.)
21 UNODC, The Opium Economy in Afghanistan, New York 2003, p. 100.

Afghanistan Opium Survey 2005
80
harvesting of wheat. The salaries paid to itinerant workers working on poppy farms amounted, on average, to about US$6 per day (plus 2-3 meals per day) this year which was similar to the salaries reported last year though higher than the $2-$3 reported in previous years and significantly more than itinerant workers could expect from working on a wheat field (some US$4). For the typical farmer with 0.33 ha under poppy cultivation, labour demand amounted to some 117 labour days per year. Such labour demand can be managed by a family. There is, however, a concentration of labour demand during harvest time. Farmers reported this year that there is, in general, a demand for 6-7 people per jerib working over a two weeks period on poppy fields to harvest opium (i.e. 10-12 people per 0.33 ha). For farmers with up to 1 jerib under poppy cultivation, the extended family is usually large enough to meet the necessary labour demand; for larger areas, however, itinerant workers are needed to assist. But this appears to have reduced the income of farmers from poppy cultivation by about half (labour costs: 6.5 persons per jerib x US$6 x 14 days = US$546 per jerib or U$2,730 per ha). Nonetheless, the net income from opium poppy remains significantly higher than the net income from wheat production and cultivation of opium remains thus an economically attractive option for farmers in Afghanistan.
Figure 36: Gross income of opium poppy and wheat per hectare in 2003, 2004 and 2005
12.700
4.600
5.400
470 390 550
-
2.000
4.000
6.000
8.000
10.000
12.000
14.000
2003 2004 2005
Opium poppy Wheat
Sources: UNODC, FAO/WFP.

Afghanistan Opium Survey 2005
81
2.14 Opium and heroin trafficking
An overview map of trafficking activities in Afghanistan is provided on page 76. Though the opium survey is not designed to collect intelligence on trafficking, some information on opium and heroin trafficking was provided from experienced surveyors in the debriefing sessions, based on reports from informants. The information displayed in the map, showing main opium markets, morphine/heroin producing centers and transit points, refers to the March-July 2005 period. The map shows, for instance, the main morphine/heroin producing centers to be located in south/south-western Afghanistan (Hilmand, Nimroz and Kandahar). Other major production centers are in Nangarhar and Badakshan. In addition, some production facilities were reported from Baghlan province.
Southern Afghanistan was not only the main opium producing region but also emerged in 2005 as the main location of morphine/heroin production in the country. As a consequence the bulk of opiates (close to 60%) is estimated to have left the country via Iran (up from 40% in 2004).
With the decline of opium production in eastern Afghanistan, trafficking of opiates towards Pakistan fell in 2005. About 20% of all opiates are estimated to have left the country via Pakistan, down from 37% a year earlier. Some increase in control along the Afghan/Pakistan border also appears to have contributed to the decline.
Overall exports of opiates to Central Asia also declined as a result of falling opium production in Badakhshan (19%, down from 24% in 2004). There was a significant increase of opium production in northern Afghanistan (including Balkh province), but high opium prices in southern Afghanistan and Iran, led to a strong rise in the trafficking of opium from the northern provinces to western and southern Afghanistan. Surveyors reported that around 70% of the opium produced in the northern provinces left the provinces southward. Traffickers usually preferred the mountains and difficult accessible roads during the summer time to transport the opium from North to South (through Saripul, Ghor, Day Kundi and Hilmand). This was in contrast to general findings, that traffickers choose the closest border crossing (as they can thus avoid paying ‘transit fees’).


Afghanistan Opium Survey 2005
83
2.15 Potential Value and Income to the Afghan economy
The potential value of Afghanistan’s 2005 opium harvest was calculated to have reached about US$2.7 billion (range: US$2.2bn – US$3.1bn), compared with US$2.8 bn in 2004. Given significantly higher prices in neighbouring countries, the overall income is, however, still three times as high as in 2000.
The potential national income from opium production is based on the value of opiates exports (opium, morphine and heroin) at prices in the border areas of neighbouring countries. This approach is based on the observation that Afghan traffickers are heavily involved in shipping opiates across the borders, but from there onwards traffickers from neighbouring countries usually take over the drug shipments. The methodology for calculating the overall gross income estimates from opium production for the Afghan economy was, for the first time, developed in UNODC’s report on The Opium Economy in Afghanistan – An International Problem (New York 2003) and repeated in last year’s opium survey report. A number of variables (production, extent and degree of involvement of Afghan traffickers in shipping opiates abroad, proportion of the transformation of opium into heroin & morphine in Afghanistan, conversion rate of opium into heroin, prices in main export markets etc.) have been taken into account to arrive at the estimates. Detailed explanations of the calculations are found in the methodology section of this report. It should be noted that the results reflect the prices at the time of the study (March-June 2005). The results are thus preliminary in nature. The overall value of the gross income from opium production could still change if prices in neighbouring countries were to change in subsequent months. A recalculation of last year’s results with updated prices for the year as a whole and additional new information (such as updated seizure patterns) found however no change in the overall results.
The average export price of opium obtained by Afghan traffickers in neighbouring countries in the border regions with Afghanistan amounted to around U$890 per kilogram in 2005 and was thus higher than the average export price calculated in last year’s report (US$725), reflecting higher opium prices in Iran. In contrast, the average export price for Afghan morphine/heroin in the border regions of neighbouring countries with Afghanistan amounted to US$3,860 per kilogram and was thus slightly lower than the average price a year earlier (US$4,170). This was mainly a consequence of lower heroin prices in Central Asia which in turn seems to reflect rising levels of opium and heroin production in northern Afghanistan.
Figure 37: Potential income from opium production, 2000-2005 (gross income for farmers and Afghan traffickers)
0.9
2.5
2.3
2.82.7
0.0
0.5
1.0
1.5
2.0
2.5
3.0
2000 2002 2003 2004 2005
US
$ b
illio
n
Sources: UNODC, The Opium Economy in Afghanistan, UNODC, Afghanistan Opium Survey 2003, 2004 and 2005.

Afghanistan Opium Survey 2005
84
Expressed as a percentage of licit GDP (US$5.2 billion22
in 2004/5), the overall potential value-added of the opium sector for Afghanistan in 2005 is estimated to have been equivalent to some 52% of licit GDP (range 42-60%) or 34% of the overall economy, if the opium sector is included in the economy.
The results show that the main beneficiaries from opium production in Afghanistan have been - once again - the traffickers. About 79% of the total income from Afghanistan’s opium economy was reaped by traffickers (including laboratory owners) and 21% by farmers. Gross profits of Afghan traffickers appear to have decreased marginally, from around US$2.2 billion in 2004 to US$2.14 billion in 2005 (equivalent to 41% of licit GDP). These are still substantial amounts that are in the hands of organized crime in Afghanistan. Given the positive growth of licit GDP, the overall size of the illicit opium industry in Afghanistan, declined, however, from 61% to 52% of licit GDP in 2005.
Figure 38: The licit economy and the opiate industry in Afghanistan in 2005
Opiate
traffickers:
2.14 billion
Opium
farmers:
US$ 0.56
billion
The licit
economy:
US$ 5.2
billion
Figure 39: The Afghan opiate industry compared with the licit economy (as a percentage of licit GDP)
61%
52%
0%
10%
20%
30%
40%
50%
60%
70%
2004 2005
22 Afghan Government, Central Statistics Office: GDP figures for the year 1382 (2003/2004): Afs 223,629 millions and for the year 1383 (2004/2005): Afs : 254,487 millions.
Afghanistan Opium Survey 2005
85
2.16 Addiction
Data on opium and heroin addiction were also collected during the village survey. Results, based on headmen reports of opium addiction (daily use), suggest that opium addiction affects 0.5%
23 of the rural population in
Afghanistan (95% confidence interval: 0.4%-0.6%). Overall addiction to opium thus appears to have increased in recent years. A previous study, done in rural communities in 2000, suggested that opium addiction affected 0.3% of the population.
24 Heroin related addiction levels, in contrast, are still significantly smaller (0.03% of the total
population).
In general, there is a strong correlation between opium poppy cultivation and opium addiction:
Villages producing opium poppy had, on average, opium addiction rates 7 times higher than the opium addiction rates in villages that did not produce opium poppy.
While 27% of the headmen of opium producing villages reported opium addiction in their village, the corresponding share in non-opium producing villages was significantly lower (11%).
The size of the villages, in contrast, hardly affects the level of opium addiction. For heroin, on the other hand, data suggest that heroin addiction is less widespread in small villages (less than 500 people) than in larger ones.
The geographic distribution, shown in the map on opium addiction among surveyed population, revealed rather high levels in some of the northern provinces. In contrast, low levels were reported from villages in central and eastern Afghanistan (significantly lower than a similar survey undertaken in 2000)
25, which could have been the
result of some underreporting among headmen in villages affected by the poppy ban.
UNODC has implemented a separate national survey on addiction in August 2005 and its results are expected by the end of 2005.
23 Expressed as a percentage of the population age 15-64, opium addiction affects about 1% of the population.
24 UNODC, The Opium Economy in Afghanistan, January 2003, p. 74.
25 In this survey, the prevalence of opium addiction in the rural areas of eastern Afghanistan was found to affect 0.3% of the population. (UNDCP, Community Drug Profile #4, An Assessment of Problem Drug Use in Rural Afghanistan: the GAI target
districts, February 2001).


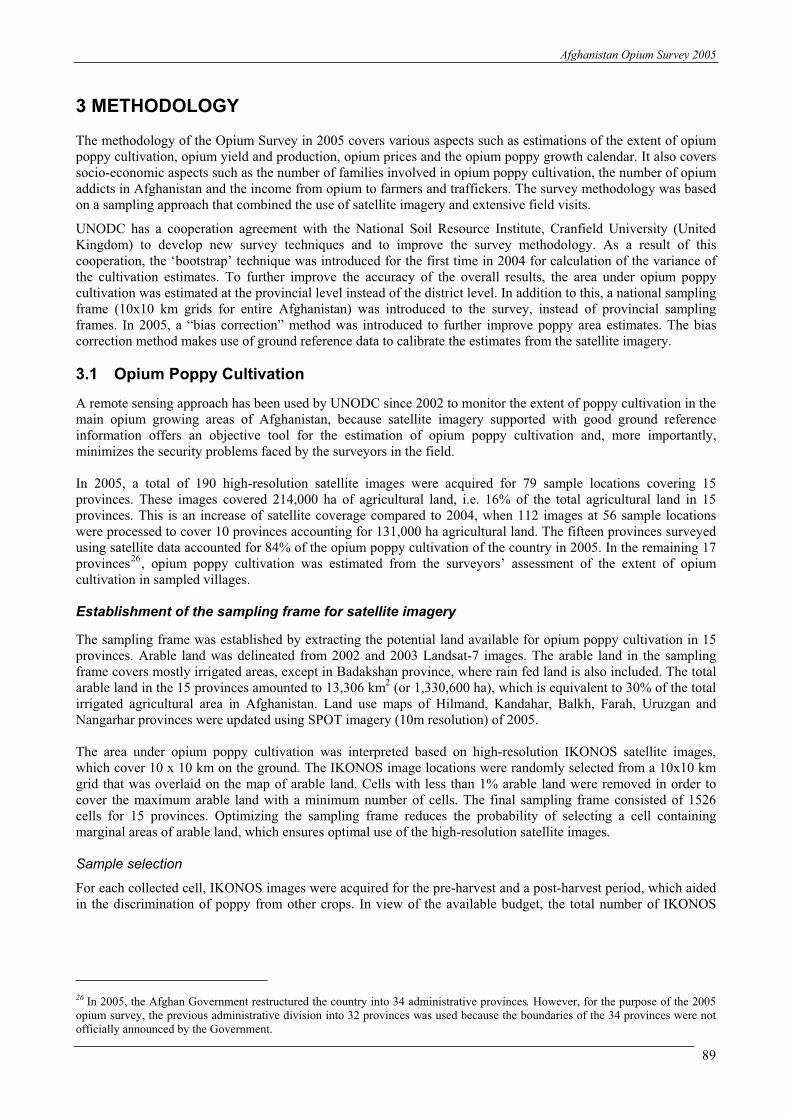
Afghanistan Opium Survey 2005
89
3 METHODOLOGY
The methodology of the Opium Survey in 2005 covers various aspects such as estimations of the extent of opium poppy cultivation, opium yield and production, opium prices and the opium poppy growth calendar. It also covers socio-economic aspects such as the number of families involved in opium poppy cultivation, the number of opium addicts in Afghanistan and the income from opium to farmers and traffickers. The survey methodology was based on a sampling approach that combined the use of satellite imagery and extensive field visits.
UNODC has a cooperation agreement with the National Soil Resource Institute, Cranfield University (United Kingdom) to develop new survey techniques and to improve the survey methodology. As a result of this cooperation, the ‘bootstrap’ technique was introduced for the first time in 2004 for calculation of the variance of the cultivation estimates. To further improve the accuracy of the overall results, the area under opium poppy cultivation was estimated at the provincial level instead of the district level. In addition to this, a national sampling frame (10x10 km grids for entire Afghanistan) was introduced to the survey, instead of provincial sampling frames. In 2005, a “bias correction” method was introduced to further improve poppy area estimates. The bias correction method makes use of ground reference data to calibrate the estimates from the satellite imagery.
3.1 Opium Poppy Cultivation
A remote sensing approach has been used by UNODC since 2002 to monitor the extent of poppy cultivation in the main opium growing areas of Afghanistan, because satellite imagery supported with good ground reference information offers an objective tool for the estimation of opium poppy cultivation and, more importantly, minimizes the security problems faced by the surveyors in the field.
In 2005, a total of 190 high-resolution satellite images were acquired for 79 sample locations covering 15 provinces. These images covered 214,000 ha of agricultural land, i.e. 16% of the total agricultural land in 15 provinces. This is an increase of satellite coverage compared to 2004, when 112 images at 56 sample locations were processed to cover 10 provinces accounting for 131,000 ha agricultural land. The fifteen provinces surveyed using satellite data accounted for 84% of the opium poppy cultivation of the country in 2005. In the remaining 17 provinces
26, opium poppy cultivation was estimated from the surveyors’ assessment of the extent of opium
cultivation in sampled villages.
Establishment of the sampling frame for satellite imagery
The sampling frame was established by extracting the potential land available for opium poppy cultivation in 15 provinces. Arable land was delineated from 2002 and 2003 Landsat-7 images. The arable land in the sampling frame covers mostly irrigated areas, except in Badakshan province, where rain fed land is also included. The total arable land in the 15 provinces amounted to 13,306 km
2 (or 1,330,600 ha), which is equivalent to 30% of the total
irrigated agricultural area in Afghanistan. Land use maps of Hilmand, Kandahar, Balkh, Farah, Uruzgan and Nangarhar provinces were updated using SPOT imagery (10m resolution) of 2005.
The area under opium poppy cultivation was interpreted based on high-resolution IKONOS satellite images, which cover 10 x 10 km on the ground. The IKONOS image locations were randomly selected from a 10x10 km grid that was overlaid on the map of arable land. Cells with less than 1% arable land were removed in order to cover the maximum arable land with a minimum number of cells. The final sampling frame consisted of 1526 cells for 15 provinces. Optimizing the sampling frame reduces the probability of selecting a cell containing marginal areas of arable land, which ensures optimal use of the high-resolution satellite images.
Sample selection
For each collected cell, IKONOS images were acquired for the pre-harvest and a post-harvest period, which aided in the discrimination of poppy from other crops. In view of the available budget, the total number of IKONOS
26 In 2005, the Afghan Government restructured the country into 34 administrative provinces. However, for the purpose of the 2005 opium survey, the previous administrative division into 32 provinces was used because the boundaries of the 34 provinces were notofficially announced by the Government.

Afghanistan Opium Survey 2005
90
images was limited to 79 pairs (190 multi-spectral images27
) well distributed within 15 provinces. The distribution was based on the number of cells in the sampling frame and total arable land in each province.
Table 24: Agricultural land sampled by province
Total Selected
Arable land
in selected
cells
# cells # cells (km2)
Hilmand 2,055 115 11 10% 340 17%
Balkh 1,600 70 6 9% 363 23%
Hirat 1,509 223 6 3% 309 20%
Kandahar 1,226 121 7 6% 250 20%
Farah 990 132 5 4% 171 17%
Nangarhar 971 53 8 15% 149 15%
Badakhshan 964 52 4 8% 227 24%
Baghlan 907 110 4 4% 85 9%
Uruzgan 816 181 7 4% 63 8%
Ghor 617 184 5 3% 31 5%
Zabul 506 82 4 5% 25 5%
Saripul 486 70 4 6% 59 12%
Laghman 233 23 3 13% 34 15%
Kunar 220 28 3 11% 28 13%
Day Kundi* 206 56 2 4% 8 4%
Total 13,306 1500 79 6% 2,142 16%
ProvinceTotal Arable
land (km2)
% of
selected
cells over
total cells
sample
size (% of
arable
land in
selected
cells)
*Day Kundi is part of Uruzgan province
To ensure adequate geographical distribution of the sample throughout the province, the cells were grouped in clusters. The number of clusters was equivalent to the number of images to be selected for the sample in each province. Consequently, one cell was randomly selected from each cluster. For example, to select 5 cells, 30 cells from a province were grouped in 5 clusters containing 6 cells each (Fig. 33 left). From each cluster, one cell was randomly selected (Fig. 33 right).
Figure 40: Cells selection
Sampling frame covering agricultural area Randomly selected cells locations
Finally, 79 pairs were selected for the sample, covering 214,200 ha of arable land and representing a sampling ratio of 16% of the total arable land of the 15 provinces.
27 Some locations of survey were used for the “Support to the Verification Process of Opium Poppy Eradication” project and
therefore these locations were collected 3 times.


Afghanistan Opium Survey 2005
92
Image processing steps
The image processing steps can be summarized as follows:
Geometric rectification of the second dated images to the first dated images (image to image registration) to facilitate the overlaying of both images for logical classification. The Root Mean Square (RMS) error
28
was mostly within one pixel accuracy. In a few cases the accuracy was higher than one pixel due to terrain conditions. In cases of higher RMS errors, images were subdivided into two convenient parts and rectified separately. If images did not match, they were visually interpreted by comparing both images;
Identification of ‘training areas’ of various land cover types, with emphasis on poppy and cereals, to be classified from the imagery;
Supervised classification of the land use features of pre-harvest and post-harvest images;
Logical classification based on pre-harvest and post-harvest classifications;
Masking of non-agricultural areas;
Applying 3x3 pixel filtering to the classified images to reduce the noise;
Assessing the accuracy of the classification process using segment data;
Calculating poppy cultivation in each cell.
28The Root Mean Square (RMS) error is a measure calculated when registering one image to another image, indicating the discrepancy between
known control points in both images. The RMS error provides a guideline for the inaccuracy while performing geometric registration between two
images.

Afghanistan Opium Survey 2005
93
Figure 41: Image classification methodology for estimating opium poppy cultivation area

Afghanistan Opium Survey 2005
94
Interpretation of opium poppy cultivation from satellite images
To reduce confusion between opium poppy and cereal fields, two images were acquired over the same area. The first image was acquired during the main opium-growing period, and the second image after the opium harvest. Figure 35 shows an image pair acquired on two different dates. Wheat appears mostly bright red on the first image (full coverage with vegetation shows up as red, bare soil as gray/green), opium poppy fields show faint red. While during the first acquisition there could be some confusion between poppy and wheat, the second acquisition imagery makes feature class separation possible because poppy has been harvested and the fields appear gray/green. The different phenological stages described above, are shown in figure 38 (field photographs of poppy, wheat and clover on different dates).
The first and second dates images were classified separately using a maximum likelihood algorithm (figure 36). Opium poppy fields are eventually interpreted as the result of a logical classification technique between the classification of first date and second date images.
Figure 42: Pre- and post-harvest satellite imagery
Shortepa, Balkh (21 March 2005 ) Shortepa, Balkh (06 June 2005 )
Figure 43: Classification results from pre- and post-harvest imagery
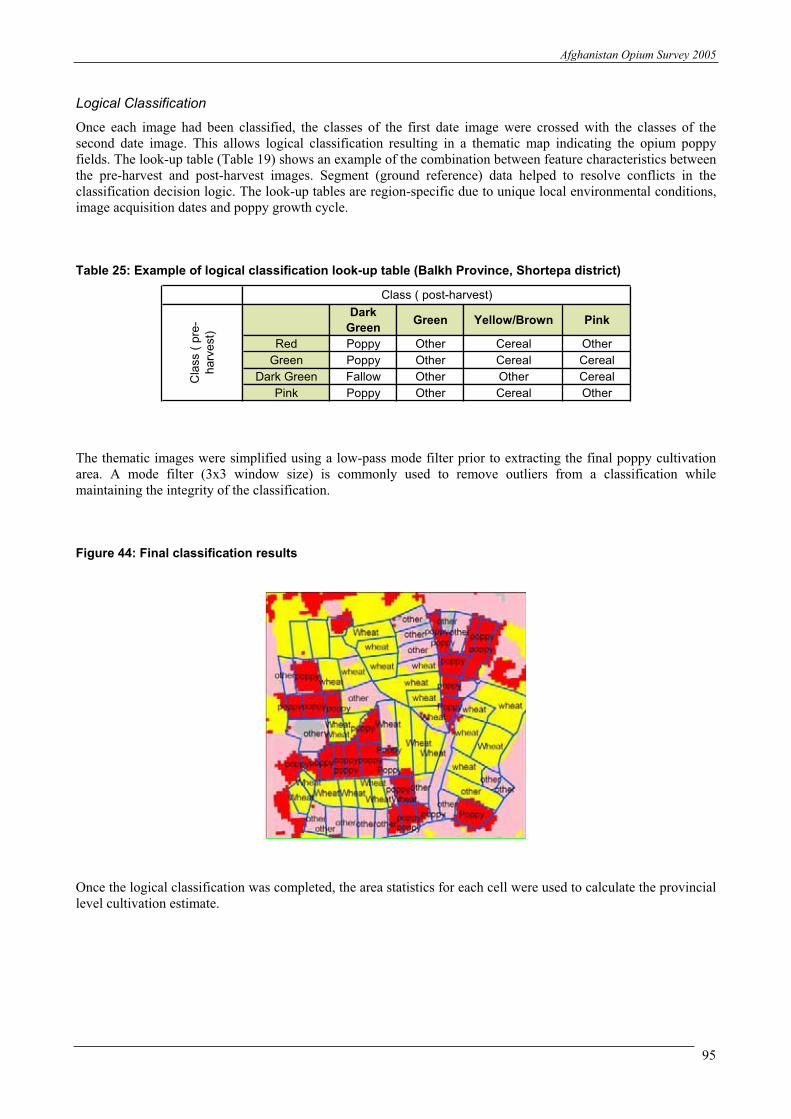
Afghanistan Opium Survey 2005
95
Logical Classification
Once each image had been classified, the classes of the first date image were crossed with the classes of the second date image. This allows logical classification resulting in a thematic map indicating the opium poppy fields. The look-up table (Table 19) shows an example of the combination between feature characteristics between the pre-harvest and post-harvest images. Segment (ground reference) data helped to resolve conflicts in the classification decision logic. The look-up tables are region-specific due to unique local environmental conditions, image acquisition dates and poppy growth cycle.
Table 25: Example of logical classification look-up table (Balkh Province, Shortepa district)
Dark
GreenGreen Yellow/Brown Pink
Red Poppy Other Cereal Other
Green Poppy Other Cereal Cereal
Dark Green Fallow Other Other Cereal
Pink Poppy Other Cereal Other
Class ( post-harvest)
Cla
ss (
pre
-harv
est)
The thematic images were simplified using a low-pass mode filter prior to extracting the final poppy cultivation area. A mode filter (3x3 window size) is commonly used to remove outliers from a classification while maintaining the integrity of the classification.
Figure 44: Final classification results
Once the logical classification was completed, the area statistics for each cell were used to calculate the provincial level cultivation estimate.

Figure 39:Illustrations ofopium poppy and wheatgrowth cycles
February21,Poppy,EmergentStage February21,W heat,EmergentStage February21,Clover,EmergentStage
M arch 13,Poppy,Cabbage Stage M arch 13,W heat,Cabbage Stage M arch 13,Clover,Cabbage Stage
April7,Poppy,Steam Elongation April7,W heat,Steam Elongation April7,Clover,Steam Elongation
April19,Poppy,FloweringStage April19,W heat,FloweringStage April19,Clover,
M ay 5,Poppy,LancingStage M ay 5,W heat,M aturityStage M ay 5,Clover
M ay 21,Poppy,Lancingcompleted M ay 21,W heat,Senescing M ay 21,Clover
June 06,Poppy Fieldploughed June 06,W heatHarvestCompleted June 06,Clover,Harvested
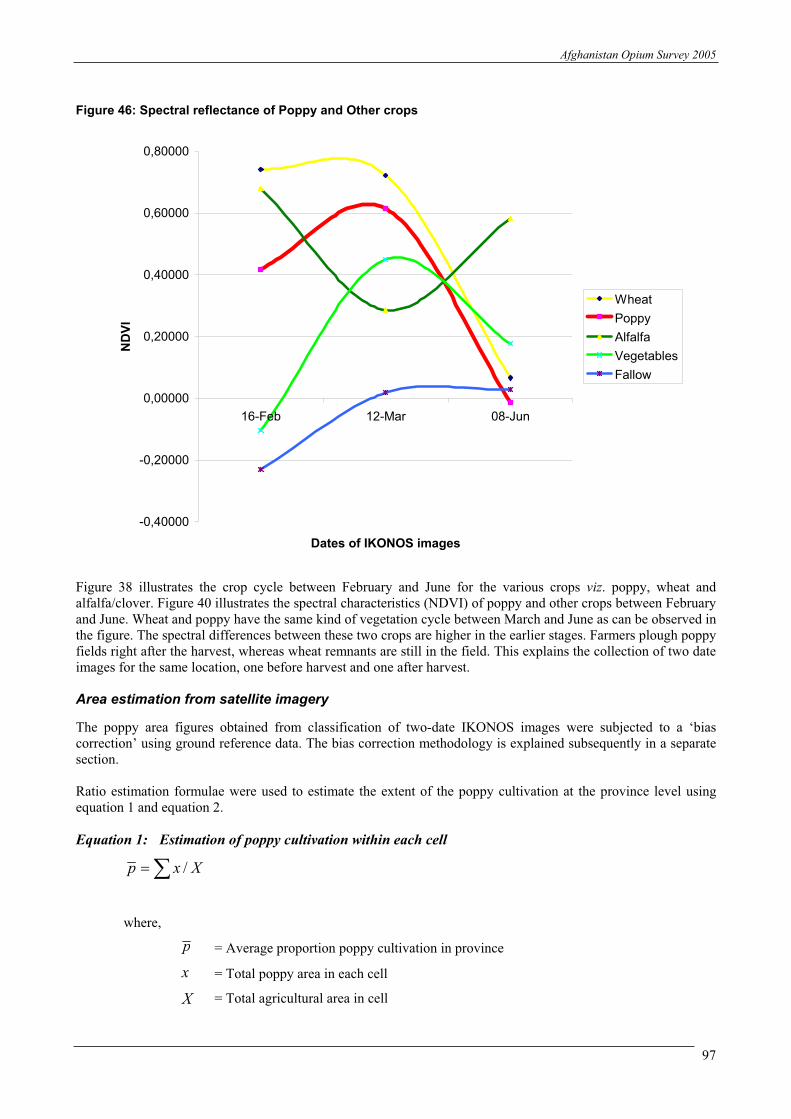
Afghanistan Opium Survey 2005
97
Figure 46: Spectral reflectance of Poppy and Other crops
-0,40000
-0,20000
0,00000
0,20000
0,40000
0,60000
0,80000
16-Feb 12-Mar 08-Jun
Dates of IKONOS images
ND
VI
Wheat
Poppy
Alfalfa
Vegetables
Fallow
Figure 38 illustrates the crop cycle between February and June for the various crops viz. poppy, wheat and alfalfa/clover. Figure 40 illustrates the spectral characteristics (NDVI) of poppy and other crops between February and June. Wheat and poppy have the same kind of vegetation cycle between March and June as can be observed in the figure. The spectral differences between these two crops are higher in the earlier stages. Farmers plough poppy fields right after the harvest, whereas wheat remnants are still in the field. This explains the collection of two date images for the same location, one before harvest and one after harvest.
Area estimation from satellite imagery
The poppy area figures obtained from classification of two-date IKONOS images were subjected to a ‘bias correction’ using ground reference data. The bias correction methodology is explained subsequently in a separate section.
Ratio estimation formulae were used to estimate the extent of the poppy cultivation at the province level using equation 1 and equation 2.
Equation 1: Estimation of poppy cultivation within each cell
Xxp /
where,
p = Average proportion poppy cultivation in province
x = Total poppy area in each cell
X = Total agricultural area in cell

Afghanistan Opium Survey 2005
98
To estimate the total poppy in the province, Equation 2 was used:
Equation 2: Estimation of total poppy cultivation
ANpX̂
where,
X̂ = Total poppy area in province
AN = Total agricultural area (sampling frame) in province
The results for provinces with more than 5 cells selected were refined by the bootstrap method with 10,000 iterations. The main reason for using bootstrapping is to calculate the standard error of the estimator. The sample items having different size (the total agricultural land differing in each cell), it is not appropriate to calculate the standard error using simple random formulae. The bootstrap technique does not have a significant effect on the estimation of the mean. In provinces with less than five cells, the smaller sample size did not allow bootstrapping. For these provinces, the simple random sampling formulae were applied.
Bootstrapping with 10,000 iterations found a 90% probability that the area under opium poppy cultivation (estimated from satellite imagery) was between 81,000 ha and 93,000 ha, with a mean estimate of 87,419 ha. It should be noted that the upper and lower estimates do not lie symmetrically around the mean estimate obtained for these 15 provinces because of the use of the bootstrap method. The mean estimate for the 15 provinces where a satellite survey was conducted, represented 84% of the total area under opium poppy cultivation in 2005.
Accuracy assessment
Ground reference data were used to develop an understanding of the satellite images for image interpretation and for assessing the classification accuracy.
Ground reference data were collected from selected locations covering 250x250m in 79 cells. These locations are henceforth referred to as ‘segments’. Three to four segments were randomly selected over the agricultural area in each of the 79 cells. The surveyors visited these segments to collect detailed information in each parcel. This work was carried out by 13 teams comprising of a total of 34 surveyors, trained by UNODC. Most of the surveyors trained and assigned to the segment survey already had experience in conducting such a survey due to their participation in the 2004 segment survey. The information collected during the segment survey included crop type, plant height, GPS coordinates and photographs.
Due to the security constraints only 230 of the planned 296 segments could be surveyed. For this reason, no segments could be surveyed in Zabul province. Each survey team was equipped with an orientation map to assist locating segments in 79 cells, as well as a detailed segment map showing individual land parcel and a manual with instruction for ground data collection, prepared jointly by UNODC and Cranfield University, UK.
Table 26: Total number of segments surveyed
Total Surveyed
Badakhshan 16 16
Ghor 15 8
Hilmand 43 38
Kandahar 28 26
Kunar 12 11
Laghman 12 9
Nangarhar 36 32
Uruzgan 28 26
Hirat 16 8
Zabul 16 0
Baghlan 16 13
Saripul 16 12
Farah 20 16
Balkh 16 13
Day kundi 6 2
Total 296 230
ProvinceNumber of segments

Afghanistan Opium Survey 2005
99
The following confusion matrix indicates the producer’s accuracy (horizontal) and the user’s accuracy (vertical). The producer’s accuracy indicates that 80% of the pixels classified as poppy by the computer were found to be actually opium poppy (on the ground), whereas the user’s accuracy indicates 84% of the area identified as poppy on the ground were correctly classified as opium poppy using satellite images. The overall accuracy of the classification for all classes was 80%.
Table 27: Confusion matrix for all blocs
poppy wheat other TotalProducer`s Accuracy
poppy 880,978 112,483 104,313 1,097,775 80%
wheat 91,276 1,777,182 747,322 2,615,780 68%
other 79,325 301,881 2,922,882 3,304,087 88%
Total 1,051,579 2,191,546 3,774,517 7,017,641
User`s Accuracy
84% 81% 77% 80%
Gro
un
d
Refe
ren
ce D
ata
Classification of satellite images
BIAS CORRECTION
The confusion matrix of each final classification was used to remove the bias in the area estimation using satellite imagery (i.e. the satellite results are adjusted to the results obtained through ground truthing). The bias correction improves the area estimations by calculating the probability of each ground class with respect to the corresponding spectral class.
Example: Bias correction for Shortepa Imagery, Balkh province
Table 28: Confusion Matrix :
Poppy Wheat Other TotalProducer`s
Accuracy
Poppy 28,385 1,446 8,054 37,886 75%
Wheat 1,568 72,918 25,847 100,335 73%
Other 2,243 5,880 89,348 97,475 92%
Total 32,197 80,244 123,249 235,696
User`s Accuracy 88% 91% 72% 81%
Gro
un
d
Re
fere
nc
e D
ata
Classification (based on satellite imagery)
Table 29: Probability Matrix :
Poppy Wheat Other
Poppy 0.882 0.018 0.065
Wheat 0.049 0.909 0.210
Other 0.070 0.073 0.725
Total 1 1 1
Total area classified as poppy = 244 ha
Total area classified as wheat = 943 ha
Total area classified as other = 998 ha
Bias corrected area for poppy = 0.882*244+0.018*943+0.065*998 = 298 ha
Bias corrected area for wheat = 0.049*244+0.909*943+0.210*998 = 1078 ha

Afghanistan Opium Survey 2005
100
Table 30: Comparison of results
Classified
area (ha)
Bias
corrected
area (ha)
Difference
Poppy 244 297 22%
Wheat 943 1,078 14%
Other 998 810 -19%
Total 2,185 2,185 0%
The total area classified as poppy within the imagery increased 22% after the bias correction in this particular imagery. This procedure was done for all the images where ground reference data was available. The bias corrected estimate for the area under opium poppy cultivation in the 15 provinces covered by satellite imagery is thus 87,419 ha.
Table 31: Comparison of results from bias corrected and non-bias corrected estimations
Province
Non-Bias
Corrected
(ha)
Bias
Corrected
(ha)
Difference
(%)
Hilmand 23,934 26,500 11%
Kandahar 10,740 12,989 21%
Uruzgan 2,657 2,790 5%
Farah 8,738 10,240 17%
Balkh 9,094 10,837 19%
Badakshan 7,593 7,370 -3%
Ghor 2,704 2,689 -1%
Hirat 1,968 1,924 -2%
Baghlan 2,453 2,563 4%
Others 10,332 9,517 -8%
Total 80,213 87,419 9%
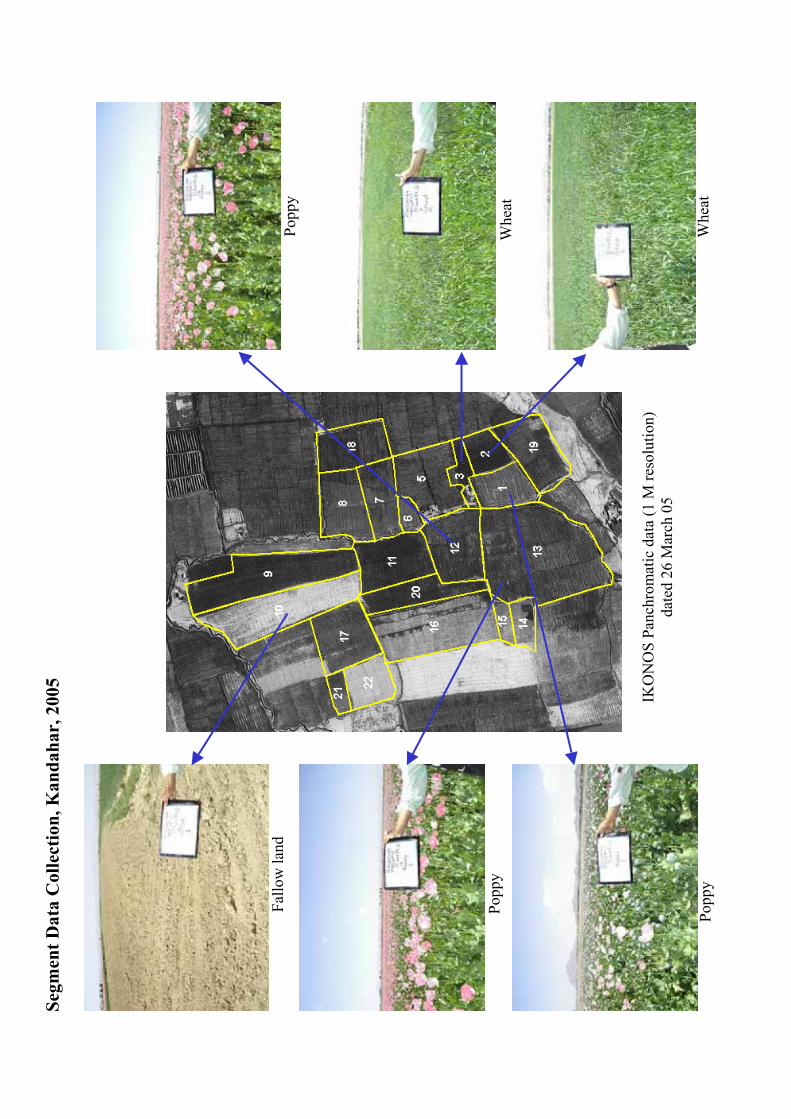
Poppy
Poppy
Fal
low
lan
d
Poppy
Whea
t
Whea
t
Seg
men
t D
ata
Co
llec
tio
n,
Ka
nd
ah
ar,
20
05
IKO
NO
S P
anch
rom
atic
dat
a (1
M r
esolu
tion)
dat
ed 2
6 M
arch
05

Afghanistan Opium Survey 2005
102
3.2 Mapping of agricultural land and opium poppy using SPOT images
In addition to the IKONOS images, 6 provinces (Hilmand, Fahar, Kandahar, Uruzgan, Nangarhar and Balkh) were covered with SPOT5 multi-spectral images. The objectives were two-fold, first to assess the usefulness of SPOT data for estimating total poppy area and second to update the mapping of agricultural areas.
Estimation of poppy by using SPOT data was attempted to determine if the loss in spatial resolution, from the 4 meter IKONOS to the 10 meter SPOT5 image, could be compensated by the full coverage of the province by the low-cost SPOT images. SPOT data was also used to prepare land use maps of 6 provinces to get updated information on agricultural areas in 2005. This was essential since the poppy area estimation methodology adopted by UNODC uses total agricultural area as one of the inputs for estimating total poppy area at the province level. The use of SPOT5 images fulfilled the second objective, but turned out to be less satisfactory with respect to the first objective.
Due to the poor (cloudy and rainy) weather conditions, SPOT images could not be collected for the ideal time period. This posed some difficulties in distinguishing poppy from other crops. The best period to discriminate poppy from other crops is when the poppy is either in cabbage or lancing stage. Only 15 out of 70 SPOT images were collected in February when poppy is in cabbage stage. Another 15 images collected in early March were still found useful for poppy identification. The rest of the images was acquired during the flowering stage of poppy, which was not ideal for discriminating poppy from other crops. Poppy could only be identified in 3 provinces viz.Hilmand, Kandahar and Farah, where the images were suitable for discriminating opium poppy from other crops.
Future work will involve applying regression estimators using SPOT image classifications and ground reference data in collaboration with Cranfield University (UK) to assess possible usage of SPOT for the next survey cycle.
This year’s experience of using SPOT5 data shows that it was not an appropriate solution for identifying poppy fields. Low revisiting capability of the SPOT satellite (10-15 days) does not take into account the variations in the poppy growth cycle within and between the provinces. This can be understood from the fact that there is a 15-20 days difference in harvest time between lower and upper Hilmand. Further, single date images do not provide enough confidence to depict poppy fields.
The poppy estimation attempt using SPOT helped nonetheless to gain some experience in the context of ongoing efforts towards improving the survey methods and producing reliable district level estimates.
SPOT images collected in 2005 were best used for updating the agricultural areas in the six provinces. This is the first attempt where land use mapping has been carried out in Afghanistan using 10m resolution images. The most recent land use/ land cover mapping was done by FAO in 1993 using Landsat TM (30m resolution) images. UNODC updated the 1993 FAO maps for Hilmand, Nangarhar, Kandahar and Badakshan provinces using Landsat TM images of the year 2002-03. It was noticed that there was a significant loss of agricultural areas during 1993 and 2002 due to serious droughts in Afghanistan. However, it was also observed that some of the unused agricultural areas have been converted to arable land over the last two years.
A total of 70 SPOT images were classified using standard classification methods (maximum likelihood). Results were improved using visual interpretation.

!
!
!!
!
!
!
!
!
Hira
t
Fa
rah
Hilm
an
d
Gho
r
Nim
roz
Ka
nda
har
Ba
daksh
an
Uru
zga
nG
ha
zni
Ba
lkh
Za
bul
Fa
rya
b
Ba
dgh
is
Pa
ktik
a
Ba
ghla
n
Sa
riP
ul
Ba
mya
n
Ta
kha
rJa
wzj
an
Pa
rwa
n
Wa
rdak
Sa
man
gan
Ku
ndu
z
Nuri
sta
n
Ku
nar
Ka
bul
Nan
garh
ar
Kh
ost
Pa
kty
a
Lo
ga
r
La
gh
man
Ka
pis
a
Quetta
Peshwar
Jalalabad
FayzAbad
Mazar-E-Sharif
65
°E
65
°E
70
°E
70
°E30°N
30°N
35°N
35°N
SPO
T5
refe
ren
cefr
ames
inA
fgh
anis
tan
,200
5
Sourc
e:M
CN
-U
NO
DC
Afg
han
ista
nO
piu
mS
urv
ey
2005
No
te:T
he
bo
undarie
sand
nam
es
show
nand
the
desig
nations
use
don
this
map
do
notim
ply
offic
iale
ndors
em
entor
acce
pta
nce
by
the
United
Nations.
TU
RK
ME
NIS
TA
N
IRA
NP
AK
IST
AN
TA
JIK
IST
AN
UZ
BE
KIS
TA
N
Geog
rap
hic
pro
jectio
n;D
atu
m:W
GS
84
¯0
200
100
km50
SP
OT
5re
fere
nce
fra
mes
Pro
vin
ce
boundaries
Inte
rnatio
nalb
oundaries
!M
ain
citie
s
SP
OT
5exte
nts

Afghanistan Opium Survey 2005
104
METHODOLOGY
Manual Digitizing and Masking
Prior to classifying the SPOT images, several layers (masks) were created to restrict the classification to the area currently being intensively farmed and to mask the areas that give misleading results due to spectral overlaps, sub-pixel elements and presence of clouds or other aerosols, which obscure the conditions on the ground. These layers were digitized manually over the imagery.
Manual interpretation of the Agricultural Areas
(Manually derived agriculture (green) and urban (orange) masks overlaid on the SPOT 5 imagery)
The masks pertaining to following themes were created to improve the classification accuracy:
Agriculture – All areas showing current intensive agriculture were manually digitized based on SPOT 5 image and displayed at a 1:15,000 scale. These polygons were used to restrict the classification to agricultural land.
Urban – All areas showing buildings were manually digitized on the SPOT 5 image. This included clusters of houses, towns/cities, airports, factories, etc.
Water – Surface water masks were derived from the image classification or from NDVI thresholds. NDVI was useful in the cases where water classes were not separable such as tributaries, small reservoirs and small irrigation channels.
Drought areas – The areas showing soil degradation (saline lands) were delineated. The delineation was done using the image classification. However manual editing was required to improve the delineations. ‘Saline soil’ was retained as one of the classes in the final classification.

Afghanistan Opium Survey 2005
105
Image Classification
The hybrid classification approach was adopted combining supervised classification and visual image interpretation to get the best results. The supervised approach involves selecting training areas in each satellite image corresponding to the land cover class to be classified (as determined during knowledge base development). The statistics generated using training sites for each class were fed into a Maximum Likelihood Classification algorithm. This algorithm computes the probability value of an image pixel belonging to a particular land cover class. The output was filtered to remove noise and the classes were aggregated to a more general classification scheme. The class ‘Potential Poppy’ was part of this classification scheme for 3 provinces namely Hilmand, Kandahar and Farah. Classes derived manually (though visual interpretation) were merged with the supervised classification outputs to derive the final land use map.
Various crops and poppy fields in particular, exhibit a high degree of spectral variability in the SPOT 5 imagery. Different crop growth stages, densities, agro-climactic, and topographic conditions result in a wide range of spectral signatures/profiles. Such spectral profiles could be considered as individual land use classes in a given time for a given region. In light of this variability, large numbers of land cover classes were generated initially and later aggregated to fit the general classification scheme.
In order to identify poppy areas, initial agriculture classes were studied with respect to interpreter’s knowledge about the poppy cultivation. Once a spatial, contextual, topographical, and spectral profile was determined for poppy areas, the agriculture classes matching these parameters were aggregated to a single ‘poppy’ class.
The classification scheme of SPOT images is given in the table below:
Table 32: Class names for classification of the SPOT images
Class Value Class Name Class Value Class Name
1 Barren 9 Dense Crop
2 Water Bodies 10 Very Dense Crop
3 Fallow Field 11 Flooded Field (inundated crops)
4 Very Early Emergent Crop 12 Urban or built-up area
5 Poppy 13 Non-Agriculture Vegetation
6 Early Emergent Crop 14 Salt build-up/Degraded soil
7 Emergent Crop 15 Cloud
8 Established Crop
Characteristics of the land use classes29
:
Barren: Areas with little or no vegetation and no visible agriculture. Rangeland was included in this classification as it does not represent intensive agriculture practices and is outside the scope of this project.
Water Bodies All water bodies, including lakes, rivers, ponds, and streams.
Fallow Field Agriculture fields not currently cultivated, or containing pre-emergent crops at the time of image capture.
Very Early Emergent Crop: This class exists only in February images and denotes agricultural fields with extremely faint vegetation signatures. This class was interpreted to represent early stage poppy at higher elevations.
29Note that not every class was present in every SPOT 5 scene

Afghanistan Opium Survey 2005
106
Poppy: Fields that match the spectral and contextual profile typical for intensive monoculture poppy cultivation.
Early Emergent Crop: Fields containing an uneven coverage of crop vegetation in the first stages of growth.
Emergent Crop: Fields containing an even coverage of crop vegetation in an early growth stage.
Established Crop: Fields containing established crops but not yet matured.
Dense Crop: Fields containing a dense coverage of established crop vegetation.
Very Dense Crop: Fields containing dense coverage of vegetation with a strong signature.
Flooded Field : Fields containing water. Crop vegetation may be partially or completely inundated. Most common in river floodplains and seen in the February imagery.
Urban or built-up area: Areas with a significant component of buildings, roads and other urban structures.
Non-Agriculture Vegetation: Non-agricultural land containing significant vegetation signatures. These areas may include wetlands and scrub vegetation.
Degraded Soils Salt affected soils.
Cloud Areas obscured by cloud or other aerosols at the time of image capture.
Final classification results
*The final product, showing the results of initial classification, aggregation, and merging with digitized masks

Afghanistan Opium Survey 2005
107
Classification Results
It is difficult to compare the FAO 1993 land cover data with the UNODC 2005 figures because both classification schemes are not compatible with each other, as shown in the table below. Since opium poppy is mainly grown in irrigated areas -except in Badakshan- UNODC mainly includes irrigated and active agricultural areas in its maps.
UNODC 2005
Total Irrigated
Area (ha)
Irrigated-
Intensively
cultivated (ha)
Irrigated-
intermittently
cultivated (ha)
Helmand 205,000 119,040 117,515
Kandahar 122,500 51,706 199,324
Farah 99,000 20,656 147,522
Balkh 160,000 101,480 173,760
Nangarhar 96,947 66,786 29,326
Uruzgan -
excluding Day
Kundi
81,659 52,174 51,975
FAO 1993
The UNODC updated land use map of Hilmand province, using 2002 Landsat TM images, found 184,500 ha of irrigated agriculture. Acquisition dates for the Hilmand images were between 5 February – 4 April 2005 (pre-harvest). This year’s results (205,000) show an increase of 11.5% in the agricultural area of Hilmand as compared to 2003.
Images over Kandahar were acquired in April 2005. A total of 122,500 ha of irrigated agriculture land was mapped.
Images for Farah were acquired in April 2005. The map shows a total of 99,000 ha of irrigated agriculture. The effect of soil salinity in this province was very serious.
Balkh province was covered by a total of 7 SPOT images collected in May, 2005. A total of 160,000 ha of irrigated agriculture land was mapped.
Due to poor weather conditions in Uruzgan, images could be collected only in April and May 2005. A total of 81,659 ha of irrigated agriculture land was mapped.
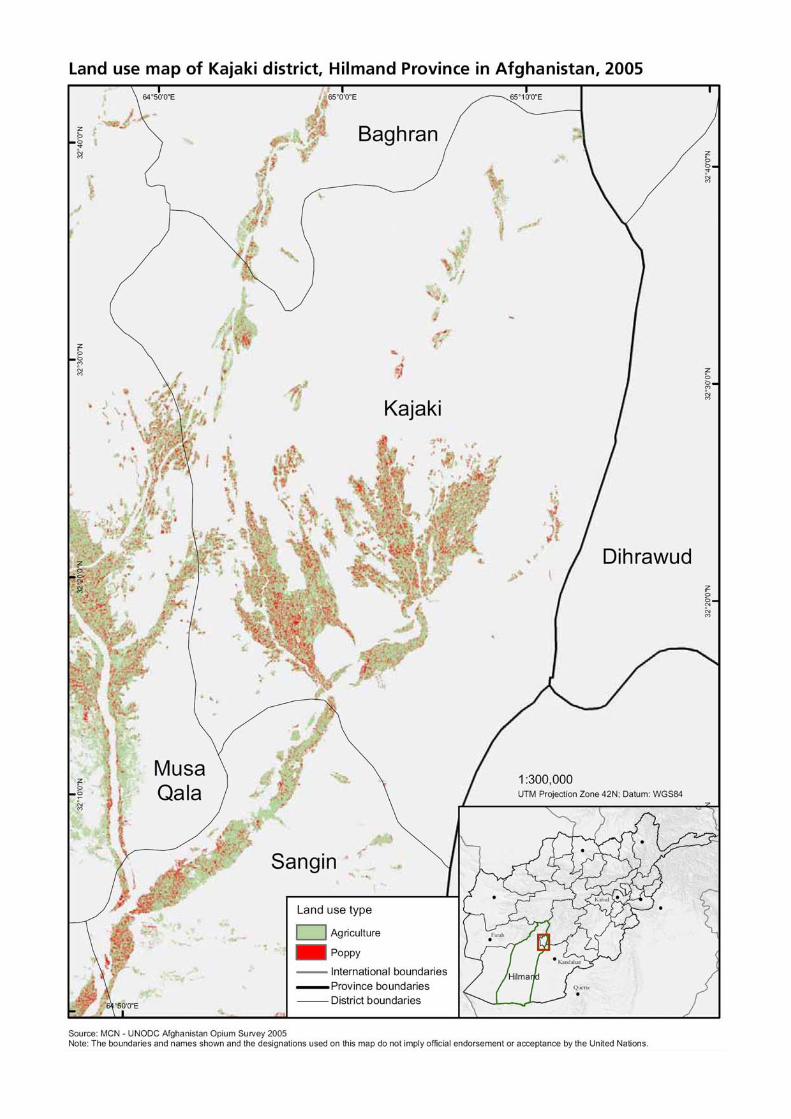


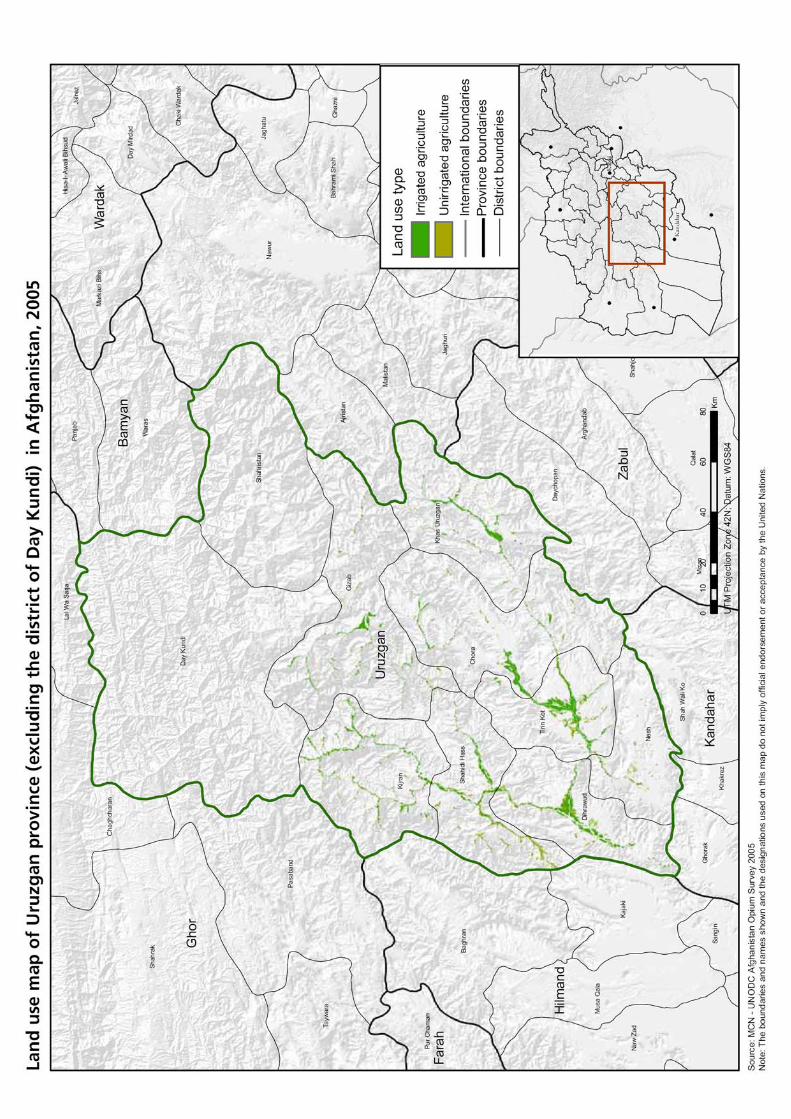

Afghanistan Opium Survey 2005
113
3.3 Village survey methodology
Experienced surveyors were selected from the UNODC surveyor pool, based on their previous performance. Security was generally problematic for the surveyors, but selection of the surveyors from the corresponding region helped to reduce the security risks.
The surveyor training began in March 2005 and was conducted by the national staff of UNODC. The Ministry of Counter Narcotics also participated in most of the training sessions. The training included practical (use of GPS, area calculation, etc) and theoretical aspects (questioning and dialogue with the village headmen and farmers).
The sample village survey was implemented to collect socio-economic and poppy cultivation data throughout the country. In the 17 provinces for which no satellite images were acquired, the sample ground survey was also used to estimate opium poppy cultivation. Opium poppy cultivation estimated through the sample village survey eventually accounted for 16% (19% in 2004) of the total area under opium poppy cultivation in 2005.
For all villages surveyed, the following data were collected (from 32 provinces)
Total number of families & inhabitants living in the village
Total number of families growing opium poppy
Poppy planting & harvest dates
Farmer estimates of wheat & opium yield
Prices for wheat & opium
Number of opium addicts
Economical status of farmers
Reasons for cultivation/non-cultivation of poppy
Extent of opium poppy and wheat cultivation
Surveyor Training in Nangarhar, March 2005.

Afghanistan Opium Survey 2005
114
Establishment of the sampling frame for the village survey
In 2005, the sampling frame for the village survey data was the complete list of all villages in Afghanistan. The village database used to establish the sampling frame was obtained from UNDP’s Afghanistan Information Management System (AIMS), which consisted of 30,706 villages.
Sampling ratio
The overall village sampling ratio was 6%, and the villages were selected through simple random sampling. The villages were first stratified based on their location on a cover map, and then randomly selected within each strata:
strata 1: villages located over irrigated land (or within the proximity of irrigated land, with a maximum buffer of 1 km) – 6% sampling rate
strata 2: villages located over rain-fed area (or within the proximity of rain-fed area, with a maximum buffer of 1 km) – 6% sampling rate
strata 3: villages located further than 1 km of any irrigated or rain-fed area – 6% sampling rate.
At the country level, a total of 1,900 villages were surveyed and 5,700 farmers and headmen interviewed for the village survey, employing 110 surveyors. Due to security constraints 58 of the assigned villages could not be visited.
Area estimation formula from village survey
Stratified random sampling formulae have been used to calculate opium poppy cultivation from the village survey for the 21 provinces where no satellite images were acquired.
sx Provincial average of the surveyor’s estimation of opium poppy cultivation per village in strata’s
sN Total number of villages per province of strata’s
s
s
s xNX * = Total opium poppy cultivation area
As the agricultural land varies from one village to another, these results were also refined by bootstrapping the provincial samples (with 10,000 iterations). The bootstrap method also provided for the standard error of the estimates. There was a 90% probability that the area under opium poppy cultivation was between 13,647 ha and 19,725 ha, with a mean estimate of 16,581 ha (the upper and lower estimates do not lie symmetrically around the mean estimate because of the bootstrap method used). The mean estimate for the 17 provinces, covered by the village survey, represented 16% of the total area under opium poppy cultivation in 2005.
Overall, the area estimation from satellite and village survey ranged between 95,000 ha and 113,000 ha, with a mean estimate of 104,000 ha.


Afghanistan Opium Survey 2005
116
3.4 Opium Yield and Production
In the past, calculation of opium yield in Afghanistan relied on farmers’ interviews, mostly done prior to the harvest. The data thus reflected primarily the farmers ‘expected’ opium yield rather than the actual opium yield which was still unknown at the time of the survey. Data were also subject to the farmers’ own bias.
Since 2000, UNODC has been developing an alternative objective yield assessment approach, based on the measured volume of opium capsules and cultivation density
30. The relationship between capsule volume per
square metre and the yield of dry opium was originally developed from data collected in Pakistan and Thailand. It takes the form of a non-rectangular hyperbola:
Non-rectangular hyperbola formula for predicting opium yield
Y = [(VC + 1495) – ((VC + 1495)2 – 395.259 VC)
0.5] / 1.795
where,
Y = Dry opium gum yield (kilograms / hectare)
VC = Mature capsule volume (cm3/m
2)
Data Collection
In 2005, capsule measurements were collected from 160 fields in 160 villages randomly selected throughout the country. A total of 4121 capsules were measured from 348 plots. In the central and eastern regions, it was difficult to find any poppy fields this year.
For the yield survey, the procedure as described in the UNODC Guidelines for Yield Assessment was followed. An imaginary transect was drawn, along which three one-meter square plots were selected. From each plot, the number of flower buds, flowers, immature capsules and mature capsules that were expected to yield opium were counted, and the diameter and height of 10 to 15 opium yielding capsules were measured with a calliper. With these data the capsule volume per square meter was calculated and input into a non-rectangular formula for the yield calculation. Each plot thus provided one yield observation. The simple average of the observations gave the regional yield estimate.
Yield Survey Training, 2005
30 UNODC Guidelines for yield assessment of opium gum and coca leaf from brief field visits, UN New York, 2001, ST/NAR/33


Afghanistan Opium Survey 2005
118
3.5 Opium Price
Between April and August 2005, data were collected on the price of fresh and dry opium. In the 2005 village survey some 3,300 farmers in 1,113 villages were interviewed to provide data on fresh opium prices and about 3,700 farmers from 1,233 villages were interviewed to provide information on dry opium prices. The average regional values for price of dry opium were used to estimate the total value of opium produced in Afghanistan in 2005.
Since November 2002, UNODC conducts a regular opium price monitoring system, collecting prices of fresh and dry opium from farmers and traders on monthly basis in Nangarhar, Hilmand and Kandahar, and since May 2005 in Hirat, Balkh and Badakhshan provinces. About 90 farmers and 80 local traders are interviewed each month to provide this information.
3.6 Opium Growing Families
To estimate the number of families involved in opium poppy cultivation in Afghanistan, data were collected during the village survey on the number of families growing opium poppy in the sampled villages.
Stratified simple random sampling formulae were used to derive the number of opium growing families in Afghanistan as follow:
sx average number of opium poppy growing farmers per village in the sample in strata s
sN Total number of villages in the sampling frame in strata s
ss xNX * = Total number of families growing opium
As the sampled villages did not have a similar population size, the results were refined with a bootstrap of 10,000 iterations, providing an estimate for the mean and for the standard error. A total of 309,000 poppy (range 278,000 – 340,000) growing households were estimated in Afghanistan.
3.7 Value of Opium Production at Farmgate level
Based on the area under cultivation (A) (104,000 ha), the yield (Y) (39 kg per ha of dry opium) and the opium prices (P) (US$138; weighted by production) the farm-gate value of the opium harvest has been estimated (A x P x Y) at around $560 million. This figure is equivalent to the potential gross income of farmers from opium production. It does not take into account the costs of farmers related to hiring labour, using fertilizers, accepting a lower income as a result of selling the harvest in advance (salaam arrangements), paying taxes to local commanders or bribing officials for not eradicating the opium poppy harvest.
Table 33: Farm-gate value of opium production in 2005
Region Production of dry opiumin kg
Price of dry opium per kg in US$
Farm-gate value in million US$
Southern 1,749 141 246.515
Northern 1,098 112 123.105
Western 685 164 112.286
North-Eastern 365 128 46.603
Eastern 180 179 32.364
Central 4 235 0.897
Total 4,082 138 561.770
Total rounded 4,100 560
90% confidence interval 3,560 – 4,610 +/- 14 470 - 655

Afghanistan Opium Survey 2005
119
In order to estimate the confidence interval of the farm-gate value, the confidence intervals of all parameters (area under cultivation, yield, prices) were calculated separately.
The combination of the ‘uncertainties’ (u) of the different variables, was based on the following formula31
:
u(y(x1,x2…)) =
where y(x1,x2,..) is a function of several parameters x1,x2,.. (here: area, yield, price), and ci is a sensitivity
coefficient evaluated as ci= y/ xi, the partial differential of y with respect to xi. For simple products (y = p x q x r …) and an independence of the variables used (i.e. the yield per ha is not a function of the area under cultivation or the price paid to farmers), the formula could be simplified as follows:
where (u(p)/ ) etc. are the uncertainties in the parameters, expressed as relative standard deviations. In order to arrive at the combined confidence interval of the farm-gate value, the calculated standard deviations are then multiplied with the appropriate z-value.
Given the fact that the confidence intervals for the individual parameters have already been calculated, a further simplification is possible. Instead of using the ‘standard deviation’ as a percentage of the mean of the respective parameters as inputs for the calculation of the formula shown above, before multiplying the final results with the respective z-values, the ‘differences between the mean value and the upper and lower limits of the confidence interval’, expressed as a proportion of the mean value of the parameter, can be used as input for the calculation of the overall confidence interval.
Following these considerations, the calculation was done as follows:
a) Calculation of individual minimum and maximum values:
The results, based on 90% confidence intervals, showed the following results:
Average Minimum Maximum
A Area under cultivation (ha): 104,000 95,326 112,674
Y Yield (kg/ha) 39.3 35.4 43.2
P Dry opium farm-gate price (US$/kg) 138 124 152
b) Calculation of the distance between the minimum (maximum) limit and the mean of the confidence
interval, expressed as a proportion of the mean value of the respective parameter
Minimum Maximum
Avg(X)
Avg(X)-Min(X)
Avg(X)
Avg(X)-Max(X)
A = Area under cultivation (ha): -8.35% +8.35%
Y = Yield (kg/ha) -9.8% +9.8%
P = Dry opium farm-gate price (US$/kg) 10.2% 10.2%
31 EURACHEM/CITAC, Guide CG4, Quantifying Uncertainty in Analytical Measurements’ 2nd Edition, 2000, UK/Switzerland; http://www.measurementuncertainty.org/mu/guide/index.html?content_frame=/mu/guide/stepcalculating.html

Afghanistan Opium Survey 2005
120
c) Calculation of the lower (upper) limit of the overall confidence interval:
PYAX ,,
2)Avg(X)
Avg(X)-Min(X)(
PYAX ,,
2)Avg(X)
Avg(X)-Max(X)(
= (8.35%2
+ 9.8%2+ 10.2%
2) (1/2)
= +/- 16.4%
The 90% confidence interval for the farm-gate value of the 2005 harvest in Afghanistan is thus:
US$561.77 mio x (1-16.4%) - US$561.77 x (1+16.4%) =
= US$469.6 million – US$653.9 million
or rounded: US$470 million – US$655 million
3.8 Value of Afghan Opiates in Neighbouring Countries
Opiates are usually trafficked by Afghan traders to neighbouring countries. In general, Afghan traffickers are involved in shipping the opiates across the borders. From there onwards, traffickers from neighbouring countries take over the consignments. The value of the opium production (partly transformed into morphine/heroin) in neighbouring countries close to the borders with Afghanistan is thus considered to be a good proxy for the overall gross income made by Afghan citizens from the opium sector.
32 The approach taken to calculate such an income
has remained largely unchanged as compared to previous years in order to guarantee direct comparability of the results.
The calculation has followed the following steps:
establishment of an appropriate conversion ratio of opium into heroin;
establishment of a distribution pattern of opium production between (i) opium destined for exports and (ii) opium destined for transformation into heroin & morphine;
establishment of a distribution pattern of (i) opium exports and of (ii) heroin & morphine exports;
analysis of opium prices as well as of heroin & morphine prices in neighbouring countries in border regions with Afghanistan;
using prices in neighbouring countries in the border regions with Afghanistan and the distribution pattern to calculate an average weighted export opium price and an average weighted heroin/morphine price;
multiplying opium export volumes with export prices of opium to arrive at the value of opium exports and (ii) multiplying heroin & morphine export volumes with heroin and morphine export prices to arrive at the value of heroin and morphine exports.
32 There are, of course, also traders from neighbouring countries (notably from Pakistan, Iran and Tajikistan) purchasing opiates in
Afghanistan and smuggling them across the border. Similarly, some Afghan traffickers are involved in shipping the opiates from
Afghanistan to the main transhipment markets, located further inland in neighbouring countries. These effects are considered to
offset each other.

Afghanistan Opium Survey 2005
121
Conversion of opium into heroin
The first question relates to the amounts of opium needed to produce 1 kg of heroin. Traditionally a 10:1 rule of thumb ratio has been used (10 kg of opium for 1 kg of heroin). Previous research showed that such a transformation ratio is correct for many opium producing countries, notably in countries of South-East Asia which until the early 1990s used to dominate global heroin production.
Afghanistan, however, is different. Dating back to the late 1950s, the analysis of an opium sample showed already a morphine content of almost 17%. Authorities in the Kyrgyz Republic reported that the morphine content of opium trafficked through their country (in general, originating in Afghanistan) ranged from 14% to 22%, with a typical morphine content of 18% (ARQ, 2001).
33 Over the 2000-2003 period, UNODC collected opium samples
across Afghanistan, dried them and analyzed the morphine content of these samples. Overall 39 opium samples from 29 test fields across Afghanistan were collected. The morphine content of dry opium in these samples ranged from 8% to 24%. The highest morphine yields over the 2000-2003 period were found in Badakshan (on average slightly more than 16%
34). The average morphine content of fields in Nangarhar was above 15%. The average
morphine content in Hilmand was above 12%. The average morphine content from the 39 samples in Afghanistan was 15% (confidence interval: 13.7%-16.3%).
35 This suggested that in Afghanistan, on average, only 6 to 7 kg of
dry opium were needed to produce 1 kg of heroin.36
Table 34: Average morphine content of opium in Afghanistan (2000-2003)*
Province Average
morphine content
Badakhshan 16.2%
Nangarhar 15.3%
Hilmand 12.4%
Others (Kandahar, Balkh) 11.2%
Unweighted average 15.0%
Confidence interval ( =0.05) 13.7%–16.3%
* Information based on the analysis of 39 opium samples from 28 fields.
Source: UNODC, Limited Opium Yield Assessment Surveys, Technical report: Observations and findings, December 2003.
Such a ratio was also in line with ‘recipes’ for morphine/heroin manufacture, made available to UNODC in recent years, which suggested that the typical inputs needed for the production of 1 kg of morphine / brown heroin were typically between 6 and 7 kg of opium, in addition to a number of chemicals.
37 The question remained, however,
how ‘representative’ had been such ‘recipes’, quoted in the literature.38
33 UNODC, Limited Opium Yield Assessment Surveys, Technical report: Observations and findings, December 2003.
34 There was, however, a clear downward trend in the morphine content of opium in Badakshan; while the average morphine content was 18% in 2000 and 17% in 2001 it fell to 11% in 2003. This went hand in hand with a marked increase in the use of irrigated land for poppy cultivation (instead of rain-fed land), a strong increase in yields per hectare and a strong decline of opium prices, far below the national average.
35 UNODC, Limited Opium Yield Assessment Surveys, Technical report: Observations and findings, December 2003.
36 This refers to heroin at 100% purity. In practice, laboratory efficiencies of typically 60%-70% would, of course, require the input of more opium to produce pure heroin. Heroin produced in Afghanistan, however, is not 100% pure; purity levels usually range from 40%-85%, typically slightly above 60%. This results again in a 6:1 or 7:1 conversion ratio of dry opium to heroin. (UNODC, The
Opium Economy in Afghanistan, An International Problem, New York 2003, p. 133).
37 UNODC, the Opium Economy in Afghanistan – An International Problem, New York 2003, p. 135.
38 This is a difficult question as only few such recipes are available and have been described in detail. One recipe, dating back to 2001/02, suggested that a typical ratio was 7 kg of opium for 1 kg of morphine base in Afghanistan. According to this recipe, 28 kg of opium, 6 kg of calcium carbonate and 3 kg of ammonium chloride are needed to produce 4 kg of morphine base. (In another conversion process, calcium oxide (lime) is used instead of calcium carbonate.) In order to produce white morphine base, needed for

Afghanistan Opium Survey 2005
122
Against this background, surveyors in the 2005 survey were explicitly asked to find out from their contacts and informants the amounts of dry opium typically needed to produce 1 kilogram of morphine / brown heroin. Given the highly sensitive nature of heroin production in Afghanistan, and the ongoing dismantling of such laboratories, no formal questionnaire was developed in order not to raise unnecessary suspicions and endanger the security of the surveyors. A majority of the surveyors were not in a position to gather such information, possibly indicating an ongoing lack of heroin production know-how in several parts of the country, as well as the sensitive nature of such a question. Most of the surveyors operating in the main heroin producing areas, however, succeeded to obtain such information and quoted typical transformation ratios around 7 kg of dry opium for the manufacture
of 1 kg of morphine / brown heroin in the debriefing sessions. Thus previously obtained information from recipes and through the analysis of opium samples could be confirmed. This conversion rate was subsequently also adopted as UNODC’s general transformation ratio for dry opium to morphine/heroin in Afghanistan.
Establishment of a distribution pattern of opium and heroin & morphine exports
Opium production in Afghanistan is primarily destined for export to foreign markets, either in the form of opium or in the form of morphine/heroin. Against the background of large-scale opium production, domestic use and seizures within Afghanistan are of only minor importance. They have not been explicitly taken into account in the subsequent calculations. Recalculating the results based on these additional factors would change the final results only marginally.
39
A far more important question concerns the extent to which opium is transformed into morphine and heroin within Afghanistan. This is an important issue as there is clear evidence of significant morphine and heroin production taking place within Afghanistan:
In 2003 Afghan authorities dismantled 120 ‘fixed laboratories’ and 30 ‘movable laboratories’, mainly in Hilmand, Nangarhar (notably in Shanwar district) and in Badakshan,
40 accounting for more than 40% of all opiate
laboratories dismantled worldwide in that year.41
In 2004, 125 clandestine morphine/heroin laboratories were dismantled in Afghanistan, located in various regions of the country: South (Hilmand, Nimroz, Kandahar: 30 laboratories), East (Nangarhar: 25 laboratories), North-East (Badakshan: 25 laboratories) and North (Jawzjan & Sari Pul: 18 laboratories; Kunduz 12). Most laboratories continued to be located in the border areas, though a number of laboratories have been found in other locations as well. Afghanistan is also faced with significant illegal imports of chemical precursors required to produce morphine and heroin. They are often smuggled into the country via Pakistan as well as other neighbouring countries. The precursor chemicals found in the heroin laboratories in 2004 were reported by the Afghan authorities to have been mainly from China, India, Russia and Hungary while in the morphine producing laboratories precursor chemicals from Germany and Korea were
the production of white heroin HCL, some further processing has to take place. For the production of 2.2 kg of white morphine base, 4 kg of dry (brown) morphine base were found to be required, in addition to 3 ½ litres of methanol, 5 litres of sulphuric acid, 0.5 litres of ammonium hydroxide and 3 cups of charcoal. (DEA, Heroin Laboratories in Afghanistan, April 2002, p. 40).
In a more recent attempt to establish a better understanding of the heroin manufacturing process, the German authorities, in cooperation with the Counter Narcotics Police of Afghanistan, hired two cooks to produce white heroin for the authorities in 2004.Out of 70 kg of raw opium, the two cooks produced 7.8 kg of morphine base (purity 68%) and, out of this, 3.9 kg of white heroinHCL (purity of 74%). Other substances used in the process included 8 kg of acetic anhydride, 20 kg of ammonium-chloride (NH4Cl),20 kg of natrium-carbonate (Na2CO3 x 10 H2O), 1.5 l of concentrated hydrochloride acid, 1 litre of concentrated ammonia solution, 0.15 l of acetone (C3H6O), and 6 kg of charcoal (Bundeskriminalamt, Dokumentation einer authentischen Heroinherstellung in
Afghanistan, 2004, pp. 28-30). The morphine content of the raw opium used (previously seized by the authorities, and defined by the cooks of being of ‘poor quality’) had a morphine content of, on average, 8.5% (range: 6.1% – 11.1%), less than the average morphine content found in UNODC opium samples across the country (average of 15%). Readjusting the production to a hypothetical sample of 15% morphine content it can be assumed that only 40 kg of opium (of 15% morphine content) would have been needed to produce the 7.8 kg of morphine base (equivalent to a 5:1 ratio) or 3.9 kg of white heroin HCL (equivalent to a 10:1ratio). Given the dominance of ‘brown heroin’ instead of ‘white heroin’ in Afghanistan’s heroin production, it can be assumed that the overall transformation ratio of opium to heroin should fall within a 5:1 to 10:1 range, probably closer to the lower limit (i.e. 6:1 or 7:1). However, this would be still the result of just one singular exercise, based on a hypothetical opium sample.
39 Taking these additional factors into account, total opium production available for export would decline from 4100 tons to some 4000 tons; the calculated gross receipts of Afghan traffickers would fall marginally, from US$2.7 to between US$2.5 and US$2.6billion. As such a calculation would, however, be different from the way the results were calculated last year, it was decided to continue with last year’s methodology in order to guarantee direct comparability of results.
40 Islamic Republic of Afghanistan, Annual Reports Questionnaire Data for the year 2003.
41 UNODC, ARQ/DELTA.

Afghanistan Opium Survey 2005
123
reported.42
The analysis of available precursors in Afghanistan by a team of experts of the German Bundeskriminalamt in 2004 found, however, that many of the alleged German precursor chemicals were actually forged products, with wrong labels put on them, in order to indicate a high ‘quality product’ to the clandestine laboratory owners. Some of the labels even had spelling mistakes in German.
Even though the existence of widespread morphine and heroin production within Afghanistan is well established, the question as to the extent of such production is more difficult to answer.
One approach to provide an estimate of the extent of domestic morphine/heroin production is to analyse seizure data in Afghanistan and its neighbours (Pakistan, Iran, countries of Central Asia). As long as there is no substance specific targeting of drug shipments by law enforcement, seizures of opiates – expressed in heroin equivalents – should provide a reasonable estimate of the extent opiates are transformed into intermediary products (morphine) or end products (heroin) within the region.
One problem here is that aggregated seizure data for 2005 are not, as yet available. Thus a different approach has to be taken: it was decided to calculate average annual seizures of opium and of heroin & morphine over the last three years (2002-2004). The results are then used as a proxy for the – so-far - unknown proportion for the year 2005.
The analysis revealed that – expressed in heroin equivalents - 71.5% of seizures in the countries neighbouring Afghanistan were in the form of either morphine or heroin over the 2002-2004 period and only 28.5% were in the form of opium. As law enforcement agencies in countries neighbouring Afghanistan claim that no heroin production takes place on their territories (and UNODC has no information that would contradict these claims) the following calculation assumes that 71.5% of the opium produced in Afghanistan is transformed into morphine & heroin within Afghanistan.
Figure 47: Proportion* of heroin & morphine seizures in all opiate seizures in Afghanistan and countries neighbouring Afghanistan
* Note: a 7:1 conversion ratio was used to convert opium into morphine/heroin
Source: UNODC, Annual Reports Questionnaire Data.
42 Islamic Republic of Afghanistan (Ministry of Counter Narcotics), Annual Reports Questionnaire Data for the year 2004.
41% 42%
53% 56%52%
58%
67%
78%
64%
0%
20%
40%
60%
80%
100%
1995 1996 1997 1998 1999 2000 2001 2003 2004
morphine & heroin Linear (morphine & heroin)

Afghanistan Opium Survey 2005
124
Table 35: Estimated opium and heroin & morphine exports of Afghanistan in 2005
Opium production (metric tons)
Opium exports (metric tons)
Heroin & morphine exports(metric tons)
Opium production 4,100
Distribution 28.5% 71.5%
Opium used for purposes 1,168 2,932
Conversion rate dry opium to heroin 7 : 1 ratio
End products – exports 1,168 419
End products (rounded) 1,200 420
Distribution pattern of opiate shipments out of Afghanistan
Giving differences in opium and heroin prices in neighbouring countries, the next important question relates to the quantities
Distribution of opium exports
As discussed above, the calculations suggest that some 1,200 tons (28.5% of 4,100 tons = 1,168 tons) are exported in the form of opium. Based on a three-year average of seizures in neighbouring countries the following patterns emerges:
Table 36: Distribution of opium exports
Seizures (average 2002-2004)
Opium exported
Iran 93.7% 1,094
Pakistan 3.4% 40
Central Asia 2.9% 34
Total 100% 1,168
Given the strong enforcement efforts by the Iranian authorities, there could be a potential bias towards seizures made in Iran, and thus a potential over-reporting of opium exports to Iran. On the other hand, Iran is also the only country in the region where widespread ‘opium addiction’ is reported. (In the other countries of the region, use of other opiates is more widespread). At the same time, none of the neighbouring countries has significant levels of morphine/heroin production, suggesting that the bulk of the opium exports of Afghanistan are indeed for opium consumption, and not for any further processing in morphine or heroin. Thus, there is a strong likelihood that the bulk of the exported opium is indeed destined for the Iranian market. This does not exclude the possibility that some of the 1,095 tons of opium leave Afghanistan via Pakistan for final destinations in Iran. In such cases, the involvement of Afghan traffickers (often Baluch traffickers) does not necessarily stop across the border in Pakistan but may well continue until the borders of Iran are crossed. In other words, the total gross income for Afghan traffickers does not change much whether Iran is targeted directly, or indirectly via Pakistan.
Distribution of morphine & heroin exports
Applying the same approach to morphine & heroin exports is likely to lead to a significant under-reporting of opiate shipments via Central Asia and to an over-reporting of exports via Pakistan. (There was a significant decline of opium production in areas close to Pakistan in 2005, which would not be adequately reflected in seizures data of the 2002-2004 period).

Afghanistan Opium Survey 2005
125
Table 37: Distribution of heroin and morphine exports
Distributionbased on seizures
(average 2002-2004)
Distributionbased on production
in Afghanistan (see below)
Iran 35.7% 49.0%
Pakistan 50.0% 25.9%
Central Asia 14.3% 25.1%
Total 100% 100%
Against this background, a different approach was taken. The bulk of production in Afghanistan is – in general - exported to the closest external border in order to avoid expensive payments to local commanders who have check-points across the country. There are indications that
most of the opium produced and transformed into morphine/heroin in central and eastern Afghanistan leaves the country via Pakistan,
most of the opium produced and transformed into morphine/heroin in north-eastern Afghanistan leaves the country via Tajikistan,
most of the opium produced and transformed into morphine/heroin in western Afghanistan leaves the country via Iran,
about half of the opium produced and transformed into morphine/heroin in southern Afghanistan leaves the country via Pakistan, and the rest via Iran.
The situation is more complicated for the rapidly expanding opium production in northern Afghanistan. The debriefing of the surveyors revealed that large parts of the opium produced in northern Afghanistan (around 70%) were – in 2005 - routed towards major opium markets in Hilmand province or Western Afghanistan, where prices are high, for export to Iran, and only a smaller proportion (some 30%) was destined for export to Central Asia. However, many of these exports from northern Afghanistan are already included in the overall opium exports of Afghanistan going to Iran. Such exports have to be deducted. For the remaining opium produced in northern Afghanistan and transformed into heroin & morphine, calculations suggest that around 60% went to Central Asia and 40% to Iran.
Table 38: Opium production in Afghanistan – regional breakdown in 2005 (in metric tons)
Metric tons in %
South 1,749 43%
North 1,098 27%
West 685 17%
North-East
365 9%
East 180 4%
Central 4 0%
Total 4,081 100%
Table 39: Distribution of heroin and morphine based on production estimates
Distribution Assumptions Distribution of morphine/heroin
exports based on production estimates
Iran 49.0% 50% South, 100% West, 40% North 206
Pakistan 25.9% East, Central, 50% south 109
Central Asia 25.1% North-East, 60% North 105
Total 100.0% 420

Afghanistan Opium Survey 2005
126
Prices of opiates in neighbouring countries
The next parameters investigated were the opium and morphine/heroin prices in countries neighbouring countries, notably in the border regions with Afghanistan. Such prices were collected by the UNODC field offices, located in Pakistan, Iran and in Central Asia. Prices in border areas of Tajikistan were used as a proxy for prices in border areas of Central Asian countries.
Opium prices (per kilogram)
Iran (Feb. 2005):
Sistan Baluchistan (region bordering Afghanistan):
average: US$930;
Tehran
= US$3400; (retail: US$4,400)
Pakistan (March 2005):
best quality opium: Rs15,000-20,000 in Peshawar (close to Afghanistan);
best quality opium: Rs 20,000 in Quetta (close to Afghanistan)
average: US$314
best quality opium: Rs 20,000–34,000 in Karachi
Tajikistan (March/July 2005)
Gorno Badakhshan Autonomous Province (Pamir)
US$ 200-350 (March 2005); 100-250 (July 2003)
Khatlon province (Pyanj-Moskovskiy-Shuroobod areas)
US$ 400-750 (March 2005); 400-700 (July 2003)
average: US$363 (July 2003)
Dushanbe: US$400-US$1000 (March 2005)
Sogd province (northern exit points bordering Kyrgyzstan and Uzbekistan): US$400-US$1000
Heroin/morphine prices (per kilogram)
Iran (Feb. 2005):
Sistan Baluchistan (region bordering Afghanistan):
average: US$3,800 (morphine); (poor quality heroin: US$2,300)
Tehran
Morphine: US$4,700;
Heroin: from US$4,400 (max. 30% purity) to US$7,700 (50%+ purity)

Afghanistan Opium Survey 2005
127
Pakistan (March 2005):
best quality heroin: Rs 181,000-225,000 in Peshawar (close to Afghanistan)
best quality heroin: Rs 130,000-290,000 in Quetta (close to Afghanistan)
average: US$3,459
best quality heroin: Rs 280,000–290,000 in Karachi
Tajikistan (March/July 2005)
Gorno Badakhshan Autonomous Province (Pamir) – bordering Afghanistan
best quality heroin: US$4000-US$ 5000 (March 2005); US$2500-US$3500 (July 2003)
Khatlon province (Pyanj-Moskovskiy-Shuroobod areas) – bordering Afghanistan
Best quality heroin: US$500-US$6500 (March 2005); US$5000-US$6500 (July 2003)
average: US$,4375 (July 2003)
Dushanbe: US$6000-US$7500 (March 2005)
Sogd province (northern exit points bordering Kyrgyzstan and Uzbekistan): US$6,000-US$8,000
Results
Combining all the elements discussed above, the calculations result in a likely overall gross income (= in his case ‘value added’) of around US$2.7 billion for Afghanistan (farmers and traffickers) from the opium sector for 2005. This would be equivalent to about 52% of legal GDP (US$5.2 bn in 2004/05) or 34% of overall GDP in Afghanistan.
Table 40: Estimate of potential total Afghan gross income from the opium sector in 2005
Opium exports
Opium prices per
kg
Opium distribution
based on seizures
Heroin and morphine exports
Heroin/morphine
price per kg
Heroin/morphine distribution
based on opium production
Total
Total exports in tons 1,169 mt 420 mt
Iran US$930 93.7% US$3,800
Pakistan US$314 3.4% US$3,459
Central Asia US$363 2.9% US$4,375
Average export price weighted by distribution
US$ 893 100.0% US$ 3,856
Value in billion US$ (exports × export price)
US$ 1.04 billion
US$ 1.62 billion
US$ 2.7 billion
The calculations suggest an average export price of opium of US$893 per kilogram and of morphine/heroin of US$3,856 per kilogram The average opium price was thus slightly higher than a year earlier (US$725 in 2004) while the average morphine/heroin price was slightly lower (US$4,171 in 2004), possibly reflecting the built-up of stocks in the region in 2003/04.
Deducting the farmers’ income of US$0.56 billion, the overall gross income for traffickers amounts to some US$2.14 billion. The estimate does not take into account additional gains made by traffickers by diluting heroin,

Afghanistan Opium Survey 2005
128
i.e. adding other substances in order to increase the weight of the heroin. It also does not take into account the fact that some Afghan traffickers do not only ship the opium or heroin to the borders of neighbouring countries, but also onwards to major transhipment places where prices are usually far higher. On the other hand, not all of the opiates are smuggled by Afghan traffickers across the borders. Some of the opium and heroin is also being trafficked by traders from neighbouring countries, notably from Pakistan, Iran and Tajikistan, to markets outside Afghanistan. The estimate above assumes that all these additional factors, which could influence total income, more or less offset each other.
Confidence interval
The best available mid-point estimate has been given above. Nonetheless, it must be clear that there could be significant variations, if actual values of the key parameters used were to fall towards the lower of the higher end of the respective ranges. In the following sub-chapter, the 90% confidence interval of the various indicators will be calculated and discussed.
Production (90% confidence interval)
The calculation of the range of opium production was already discussed in the methodology sub-chapter on the value of opium production. Based on the confidence interval of production estimates, Afghan opium exports could range from 1000 to 1300 tons, and morphine/heroin exports from some 360 to 470 tons.
.
Opium production:
range: 3,560 – 4,610 metric tons (mean: 4,100 tons)
Opium exports (28.5% of production)
range: 1,015-1,314 metric tons; +/- 13% of mean (1,169 tons)
Heroin exports (71.5% of production; 7:1 ratio)
range: 364-471 metric tons; +/- 13% of mean (419 tons)
The calculation of a 90% confidence interval of prices has been slightly more difficult.
In the case of Iran, no price ranges of opium or morphine prices in Sistan Baluchistan were reported. However, time series data of drug price fluctuations exist. Based on these price fluctuations over the last year, a 90% confidence interval of the mean price could be established.
In the case of both Pakistan and Tajikistan minimum and maximum prices were available. It was assumed that the reported range included 99% of all reported prices (and that there were no important outliers). Assuming a normal distribution, this is equivalent to a value of 2.576 x standard error. As the calculations are aiming at a 90% confidence interval, the range could be reduced by dividing it by the z-value for 99% (2.576) and multiplying it with the z-value for a 90% (1.645) confidence interval (assuming a normal distribution).
Prices (90% confidence interval)
Opium prices in Iran (Sistan Baluchistan): US$890-U$970; +/- 4% of mean (US$930)
Opium prices in Pakistan (Quetta/Peshawar): US$301-US$327; +/- 4% of mean (US314)
Opium prices in Tajikistan (border region): US$259-US$467; +/- 29% of mean (US$363)
Heroin prices in Iran (Sistan Baluchistan): US$3,613-US$3,987; +/- 5% of mean (US$3800)

Afghanistan Opium Survey 2005
129
Heroin prices in Pakistan (Quetta/Peshawar): US$2,913-US$4,005; +/- 16% of mean (US$3459)
Heroin prices in Tajkistan (border region): US$3,497-US$5,253; +/- 20% of mean (US$4375)
Based on these ranges the following confidence intervals (90%) could be calculated:
a) Keeping production levels constant and multiplying them with minimum and maximum prices results in a range of US$2.4 to US$2.9 billion;
b) Keeping prices constant and calculating the confidence intervals based on minimum and maximum production levels, results in a range of US$2.3 to US$3 billion;
c) Calculating the average minimum export prices (US$852 for opium and 3,403 for morphine & heroin), the average maximum export prices (US$934 for opium and 4,309 for morphine & heroin), and applying the formula discussed in the methodology sub-chapter on the value of opium production, results in an overall 90% confidence interval of US$2.2 to US$3.1 billion.
= Avg(j1) x Avg(j2)
x (1-
2
1
2)Avg(j)
Avg(j)-Min(j)(
j) (minimum)
Avg(j1) x Avg(j2)
x (1+
2
1
2)Avg(j)
Avg(j)-Max(j)(
j) (maximum)
where j=1 for prices and j=2 for production
= for opium: US$1.043 bn * (1- (4.583%2 + 13.17%
2 )
(1/2)) = US$0.897 bn (min)
US$1.043 bn * (1+ (4.583%2 + 12.40%
2 )
(1/2)) = US$1.19 bn (max)
= for heroin/morphine: US$1.619 bn * (1- (11.756%2 + 13.33%
2 )
(1/2)) = US$1.33 bn (min)
US$1.619 bn * (1+(11.756%2 + 11.90%
2 )
(1/2)) = US$1.89 bn (max)
= for opiates: US$2.2 bn (minimum)
US$3.1 bn (maximum)

Afghanistan Opium Survey 2005
130
4 ANNEXES
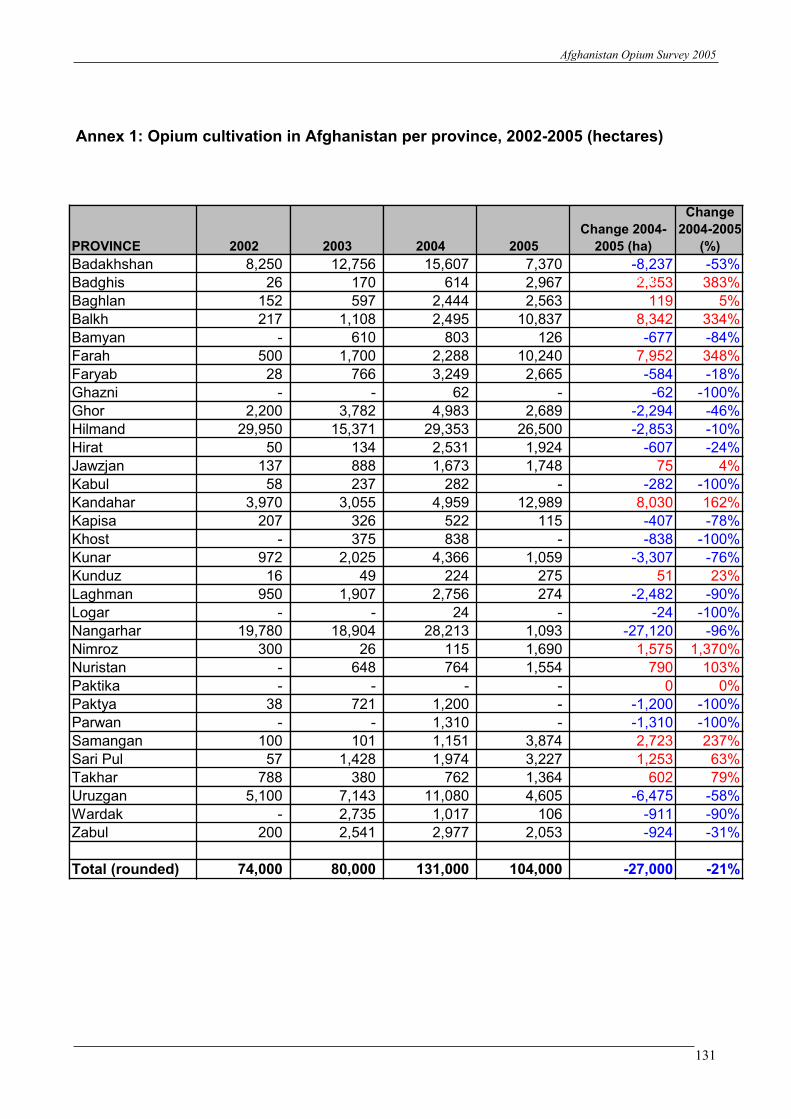
Afghanistan Opium Survey 2005
131
Annex 1: Opium cultivation in Afghanistan per province, 2002-2005 (hectares)
PROVINCE 2002 2003 2004 2005
Change 2004-
2005 (ha)
Change
2004-2005
(%)
Badakhshan 8,250 12,756 15,607 7,370 -8,237 -53%
Badghis 26 170 614 2,967 2,353 383%
Baghlan 152 597 2,444 2,563 119 5%
Balkh 217 1,108 2,495 10,837 8,342 334%
Bamyan - 610 803 126 -677 -84%
Farah 500 1,700 2,288 10,240 7,952 348%
Faryab 28 766 3,249 2,665 -584 -18%
Ghazni - - 62 - -62 -100%
Ghor 2,200 3,782 4,983 2,689 -2,294 -46%
Hilmand 29,950 15,371 29,353 26,500 -2,853 -10%
Hirat 50 134 2,531 1,924 -607 -24%
Jawzjan 137 888 1,673 1,748 75 4%
Kabul 58 237 282 - -282 -100%
Kandahar 3,970 3,055 4,959 12,989 8,030 162%
Kapisa 207 326 522 115 -407 -78%
Khost - 375 838 - -838 -100%
Kunar 972 2,025 4,366 1,059 -3,307 -76%
Kunduz 16 49 224 275 51 23%
Laghman 950 1,907 2,756 274 -2,482 -90%
Logar - - 24 - -24 -100%
Nangarhar 19,780 18,904 28,213 1,093 -27,120 -96%
Nimroz 300 26 115 1,690 1,575 1,370%
Nuristan - 648 764 1,554 790 103%
Paktika - - - - 0 0%
Paktya 38 721 1,200 - -1,200 -100%
Parwan - - 1,310 - -1,310 -100%
Samangan 100 101 1,151 3,874 2,723 237%
Sari Pul 57 1,428 1,974 3,227 1,253 63%
Takhar 788 380 762 1,364 602 79%
Uruzgan 5,100 7,143 11,080 4,605 -6,475 -58%
Wardak - 2,735 1,017 106 -911 -90%
Zabul 200 2,541 2,977 2,053 -924 -31%
Total (rounded) 74,000 80,000 131,000 104,000 -27,000 -21%
87%
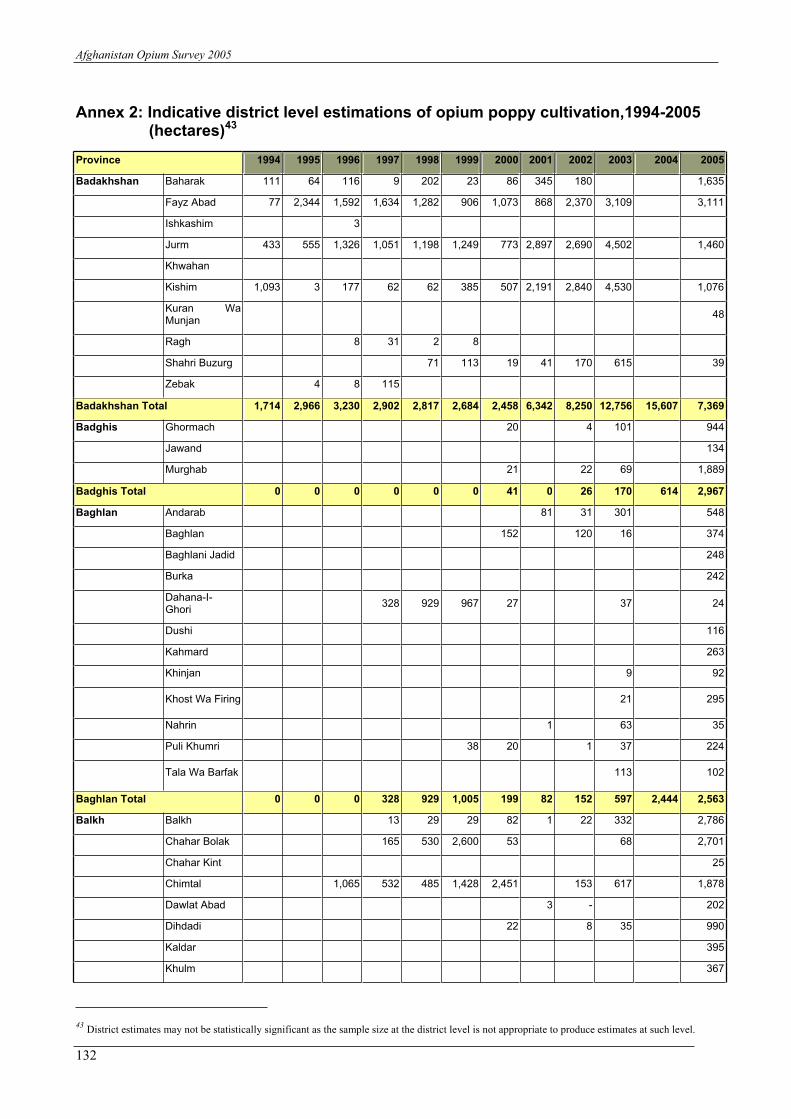
Afghanistan Opium Survey 2005
132
Annex 2: Indicative district level estimations of opium poppy cultivation,1994-2005 (hectares)43
Province 1994 1995 1996 1997 1998 1999 2000 2001 2002 2003 2004 2005
Badakhshan Baharak 111 64 116 9 202 23 86 345 180 1,635
Fayz Abad 77 2,344 1,592 1,634 1,282 906 1,073 868 2,370 3,109 3,111
Ishkashim 3
Jurm 433 555 1,326 1,051 1,198 1,249 773 2,897 2,690 4,502 1,460
Khwahan
Kishim 1,093 3 177 62 62 385 507 2,191 2,840 4,530 1,076
Kuran Wa Munjan
48
Ragh 8 31 2 8
Shahri Buzurg 71 113 19 41 170 615 39
Zebak 4 8 115
Badakhshan Total 1,714 2,966 3,230 2,902 2,817 2,684 2,458 6,342 8,250 12,756 15,607 7,369
Badghis Ghormach 20 4 101 944
Jawand 134
Murghab 21 22 69 1,889
Badghis Total 0 0 0 0 0 0 41 0 26 170 614 2,967
Baghlan Andarab 81 31 301 548
Baghlan 152 120 16 374
Baghlani Jadid 248
Burka 242
Dahana-I- Ghori
328 929 967 27 37 24
Dushi 116
Kahmard 263
Khinjan 9 92
Khost Wa Firing 21 295
Nahrin 1 63 35
Puli Khumri 38 20 1 37 224
Tala Wa Barfak 113 102
Baghlan Total 0 0 0 328 929 1,005 199 82 152 597 2,444 2,563
Balkh Balkh 13 29 29 82 1 22 332 2,786
Chahar Bolak 165 530 2,600 53 68 2,701
Chahar Kint 25
Chimtal 1,065 532 485 1,428 2,451 153 617 1,878
Dawlat Abad 3 - 202
Dihdadi 22 8 35 990
Kaldar 395
Khulm 367
43District estimates may not be statistically significant as the sample size at the district level is not appropriate to produce estimates at such level.

Afghanistan Opium Survey 2005
133
Province 1994 1995 1996 1997 1998 1999 2000 2001 2002 2003 2004 2005
Kishindih 290
Marmul 18
Mazari Shari 119
Nahri Shahi 33 14 30 425
Sholgara 28 19 28 543
Shortepa 98
Balkh Total 0 0 1,065 710 1,044 4,057 2,669 4 217 1,108 2,495 10,837
Bamyan Bamyan 20 19
Panjab 250
Shibar 36 107
Waras 191
Yakawlang 112
Bamyan Total 610 803 126
Farah Anar Dara 1,828
Bakwa 1 13 129 31 129 259 390
Bala Buluk 8 19 169 36 186 183 513 1,665
Farah 18 18 10 44 73 729
Gulistan 581 252 94 428 849 1,187 163
Khaki Safed 432
Lash Wa Juwa 1,568
Pur Chaman 293
Pusht Rod 2,482
Qalay-I-Kah 407
Shib Koh 283
Farah Total 0 9 631 568 171 787 1,364 0 500 1,700 2,288 10,240
Faryab Almar 57
Andkhoy 13
Bilchiragh 6 26 232
Dawlat Abad 133
Khani Chahar 6
Khwaja Sabz 451
Kohistan 50
Maymana 1
Pashtun Kot 11 1 281 97
Qaramqol 138
Qaysar 16 150 579
Shirin Tagab 3 103 1,141
Faryab Total 0 0 0 0 0 0 36 0 28 766 3,249 2,665
Ghazni Ajristan 313 -
Bahrami Shah 9
Ghazni Total 313 0 0 0 0 0 0 0 0 0 62 9
Ghor Chaghcharan 700 1,189 1,149
Lal Wa Sarja 718

Afghanistan Opium Survey 2005
134
Province 1994 1995 1996 1997 1998 1999 2000 2001 2002 2003 2004 2005
Pasaband 700 805 48
Saghar 300 256 120
Shahrak 640 18
Taywara 500 808 240
Tulak 84 396
Ghor Total 2,200 3,782 4,983 2,689
Hilmand Baghran 2,519 1,267 2,754 2,910 2,794 2,653 1,800 2,309 2,507
Dishu - 911
Garmser 786 725 942 1,993 1,205 2,643 2,765 2,020 462 1,912
Kajaki 979 4,087 2,814 3,904 3,959 5,746 4,625 2,640 1,392 1,639
Lashkar Gah 2,256 885 1,054 1,325 1,869 2,528 3,145 1,140 605 1,332
Musa Qala 1,154 5,137 3,924 4,360 5,574 7,013 5,686 3,690 2,455 1,664
Nad Ali 12,529 5,983 4,035 5,102 5,156 8,667 8,323 5,880 870 2,356
Nahri Sarraj 590 4,716 4,309 4,807 2,426 4,041 4,378 1,850 1,575 3,548
Naw Zad 2,345 2,799 3,596 1,585 3,605 4,424 5,085 2,650 3,096 3,737
Naway i Barakzayi
6,074 1,254 505 722 1,150 2,581 3,246 2,730 1,240 2,552
Reg 222 1,940 2,772
Sangin 2,866 973 1,909 1,971 1,734 2,646 1,711 2,810 777 1,184
Washer 676 555 877 1,084 1,469 1,014 800 590 386
Hilmand Total 29,579 29,754 24,910 29,400 30,672 44,552 42,853 0 29,950 15,371 29,353 26,500
Hirat Adraskan 9
Chishti Shar 42
Farsi 134 110
Ghoryan 238
Gulran 33
Guzara 231
Hirat 16
Injil 394
Karukh 124
Kohsan 72
Kushk 64
Kushki Kuhna 15
Obe 144
PashtunZarghun
38 38 249
Shindand 146 54
Zinda Jan 128
Hirat Total 0 0 0 38 0 0 184 0 50 134 2,531 1,924
Jawzjan Aqcha 532 208 47 171 631
Darzab 272
Fayz Abad 43 105 24 280 112
Khamyab 6 30 51 68
Khwaja Du Ko 15

Afghanistan Opium Survey 2005
135
Province 1994 1995 1996 1997 1998 1999 2000 2001 2002 2003 2004 2005
Mardyan 43 111 4 228 21
Mingajik 1,789 141 7 64 77
Qarqin 186 10 24 58 43
Shibirghan 19 1 36 508
Jawzjan Total 0 0 0 0 0 2,593 600 0 137 888 1,673 1,748
Kabul Surobi 132 340 29 58 237
Kabul Total 0 0 0 0 0 132 340 29 58 237 282 0
Kandahar Arghandab 211 87 331 561 399 750 459 330 139 287
Arghistan 38 13 80 14 2,449
Daman 110 50 190 357 775
Ghorak 347 803 692 1,503 1,126 1,109 574 380 166 233
Kandahar 320 53 234 21 73 227 156 640 293 0
Khakrez 362 274 627 286 518 632 320 560 312 185
Maruf 30 16 1 3 5 17 - 63 150
Maywand 256 333 618 1,278 2,497 2,022 995 1,090 353 1,281
Panjwayi 250 357 266 255 134 132 184 150 482 4,687
Reg 327
Shah Wali Ko 678 97 94 127 162 236 238 260 489 2,379
Shorabak 111 19
Spin Boldak 1,170 107 194 91 317 261 26 290 277 218
Kandahar Total 3,624 2,127 3,057 4,122 5,229 5,522 3,034 0 3,970 3,055 4,959 12,990
Kapisa Alasay 82
Koh Band 33
Tagab 5 104 0 207 326
Kapisa Total 0 0 0 0 0 0 0 0 0 0 522 115
Khost Jaji Maydan
Spera 118
Tani 6 257 2
Khost Total 0 0 0 0 0 0 0 6 0 375 838 2
Kunar Asad Abad 73 239 1 140 396 270
Bar Kunar 47 72 31 40 163 14
Chapa Dara 147
Chawkay 13 11 8 9 50 8 140 83 284
Dangam 4 49 22
Khas Kunar 75 82 10 12 50 173 70 41
Marawara 345 22
Narang 15 1 13 27 84 10 100 173 55
Nari 1 - 60 19
Nurgal 27 19 5 8 28 98 9 70 353 58
Pech 11 263 310 76
Sirkanay 25 2 34 54 71 8 100 141 50
Kunar Total 115 152 18 0 75 288 786 82 972 2,025 4,366 1,059
Kunduz Ali Abad 5 51 3 5

Afghanistan Opium Survey 2005
136
Province 1994 1995 1996 1997 1998 1999 2000 2001 2002 2003 2004 2005
Chahar Dara 8 30 6 15
Imam Sahib 3
Khan Abad 2 36 11
Kunduz 9 51 3 9
Qalay-I- Zal 11 321 5 8 275
Kunduz Total 0 0 0 0 0 38 489 0 16 49 224 275
Laghman Alingar 2 71 131 3 146 354 107
Alishing 3 26 88 0 104 148 69
Dawlat Shah 12 - 571 44
Mihtarlam 14 72 190 240 366 25
Qarghayi 58 128 298 0 460 468 30
Laghman Total 0 0 0 0 77 297 707 15 950 1,907 2,756 274
Logar Total 0 0 0 0 0 0 0 0 0 0 0 0
Nangarhar Achin 5,354 2,187 2,315 1,640 1,693 2,209 1,317 1 940 2,131 198
Bati Kot 3,797 529 392 1,013 2,034 603 535 2,390 1,994 166
Chaparhar 1,089 1,377 1,750 1,234 1,365 977 832 2 990 1,169 20
Dara-I-Nur 1,302 392 199 73 199 734 421 380 24 2
Dih Bala 307 646 354 569 511 468 439 11 650 927 17
Dur Baba 29 78 38 39 56 50 33 40 31 5
Goshta 1,249 467 116 77 122 240 238 99 150 13 10
Hisarak 202 453 253 370 436 741 541 2 620 1,016 64
Jalal Abad 458 31 51 123 397 979 1,021 90 4 77
Kama 18 198 389 589 1,120 558 82
Khogyani 4,347 2,577 2,628 3,385 3,808 5,338 4,913 3 2,640 2,986 117
Kuz Kunar 293 233 115 15 105 236 399 500 102 37
Lal Pur 302 267 79 66 137 270 248 95 250 1 17
Muhmand Dara 1,630 156 83 125 290 255 720 19 54
Nazyan 343 138 251 111 252 184 177 150 98 8
Pachir Wa Agam
768 571 681 400 488 731 630 3 420 1,142 35
Rodat 1,026 2,038 1,959 1,583 2,147 3,649 2,302 2,760 3,313 50
Sherzad 1,954 2,351 1,646 1,689 1,302 1,741 1,719 2 1,470 1,641 57
Shinwar 3,884 1,265 2,075 1,478 1,374 1,559 1,300 2,060 1,616 79
Surkh Rod 747 106 587 619 1,072 1,602 1,840 0 1,440 118 0
Nangarhar Total 29,081 15,724 15,645 14,567 17,821 22,990 19,747 218 19,780 18,904 28,213 1,093
Nimroz Chahar Burjak 526
Kang 10 2 1 107 5 2
Khash Rod 672 117 135 535 6 201 219 26 1164
Nimroz Total 682 119 136 642 11 203 219 0 300 26 115 1,690
Nuristan Bargi Matal 535
Kamdesh 210 269
Mandol 731
Nuristan 438 19

Afghanistan Opium Survey 2005
137
Province 1994 1995 1996 1997 1998 1999 2000 2001 2002 2003 2004 2005
Nuristan Total 648 764 1,554
Paktika
Paktika Total 0 0 0 0 0 0 0 0 0 0 0 0
Paktya Azra 4 29 46 1 38 419
Chamkani 0 - 76
Jaji 0 - 185
Lija Mangal 0 -
Sayid Karam 0 - 41
Paktya Total 0 0 0 0 4 29 46 1 38 721 1,200 0
Parwan
Parwan Total 0 0 0 0 0 0 0 0 0 0 1,310 0
Samangan Aybak 14 0
Dara-I- Suf 614 34 1,454
Hazrati Sultan 29 280
Khuram Wa Sarbagh
54 0 24 307
Ruyi Du Ab 1,833
Samangan Total 0 0 0 0 0 0 54 614 100 101 1,151 3,874
Sari Pul Balkhab 453 95
Kohistanat 1,424
Sangcharak 453 441
Sari Pul 595 959
Sayyad 52
Sozma Qala 0 0 0 0 0 0 146 0 57 380 256
Sari Pul Total 146 0 57 1,881 1,974 3,227
Takhar Bangi 8 0 20
Chah Ab 17 45 19 4
Chal 8 17 20
Farkhar 6 6 26 43 43
Ishkamish 10 19 77
Kalafgan 101 93 27 77
Khwaja Ghar 9 57 32 26
Rustaq 10 151 24 34 1,321
Taluqan 16 97 16 14
Warsaj 12 9 10 14
Yangi Qala 22 154 20 71
Takhar Total 0 0 0 0 0 201 647 211 788 380 762 1,364
Uruzgan Chora 694 424 1,574 233 652 932 1,179 0 1,330 975 259
Day Kundi 0 - 836 1,353

Afghanistan Opium Survey 2005
138
Province 1994 1995 1996 1997 1998 1999 2000 2001 2002 2003 2004 2005
Dihrawud 909 938 2,923 1,870 1,033 1,243 726 0 1,340 1,282 209
Gizab 1,476 16 8 0 0 0 0 0 - 776 268
Khas Uruzgan 0 4 0 0 0 0 130 0 - 580 338
Kijran 0 - 418 735
Nesh 410 334 104 399 373 510 394 0 490 59 352
Shahidi Hass 1,337 12 0 0 1,158 1,110 802 0 1,190 1,333 646
Shahristan 1 - 415 225
Tirin Kot 1,428 1,180 3,271 2,484 1,445 1,194 1,494 0 750 469 221
Uruzgan Total 6,254 2,908 7,880 4,986 4,661 4,989 4,725 1 5,100 7,143 11,080 4,605
Wardak Chaki Wardak 211
Day Mirdad 0 106
Hisa-i-AwaliBihsud
22
Jalrez 531
Markazi Bihs 472
Maydan Shahr 527
Nirkh 780
Sayd Abad 192
Wardak Total 2,735 1,017 106
Zabul Arghandab 0 0 0 0 0 74 139 0 302 205
Atghar 188 86
Daychopan 0 0 0 0 0 41 114 0 646 1,016
Mizan 54 0 255 154 160 373 383 0 309 56
Qalat 0 0 0 0 1 46 40 0 689 188
Shahjoy 0 178 240
Shamulzayi 65 16
Shinkay 164 102
Tarnak wa Ja 0 0 0 0 0 77 48 1 145
Zabul Total 54 0 255 154 161 537 585 1 200 2,541 2,977 2,053
TOTAL 71,416 53,759 56,827 58,417 63,672 90,904 81,928 7,606 73,838 80,609 130,612 103,918
Rounded Total 71,000 54,000 57,000 58,000 64,000 91,000 82,000 8,000 74,000 81,000 131,000 104,000