administrative delegation of budgetary powers and fiscal
TRANSCRIPT
Administrative Delegation of Budgetary Powers and Fiscal Performance*
Benny Geys a and Rune J. Sørensen b
Department of Economics, Norwegian Business School (BI) a Kong Christian Frederiks plass 5, 5006 Bergen, Bergen
b Nydalsveien 37, 0484 Oslo, Norway
Abstract
Does delegation of the budget preparation process to top civil servants improve or worsen fiscal performance? We address this question by analyzing high-quality data on budgetary procedures and fiscal performance over a 25-year period in Norwegian local governments. This long time period allows exploiting substantial variation in budgetary procedures across time and space. The results show that administrative delegation decreases fiscal deficits as a share of current revenues. Compared to procedures relying on political coordination or the traditional ‘bottom-up’ procedure, deficits are approximately 0.3 percentage points lower on average under administrative delegation. Still, this effect is conditional upon the presence of minority governments, and fails to materialize when the mayor enjoys majority support in the local council. Our results thus indicate that administrative delegation in budgetary processes may constitute an important tool to alleviate poor fiscal performance arising due to political coordination failures and weak political decision-making. Key words: Budget process, delegation, fiscal performance, government weakness, local government, Norway. JEL codes : H72, H74, H68, D72.
* Corresponding author: Rune J. Sørensen, Department of Economics, BI Norwegian Business School,
Nydalsveien 37, 0484 Oslo, Norway; [email protected]. The authors gratefully acknowledge insightful and constructive suggestions from the editor, editorial board members and a referee, as well as financial support from the Norwegian Research Council (grant nr. 281191). Benny Geys also gratefully acknowledges financial support from FWO Vlaanderen (grant nr. G.000218N).
1
1. Introduction
The impact of budgetary processes and institutions on fiscal performance – usually defined in
terms of budget deficits and debt levels – is a question of fundamental importance for public
policy. As such, it has received substantial attention in academic research (for reviews, see von
Hagen 2008; Eslava 2011). Most contributions to this long-standing debate focus on budgetary
transparency (Alt & Lassen 2006), the ‘quality’ of fiscal institutions (Fabrizio et al. 2006), soft
budget constraints (Kornai 1986; Fink & Stratmann 2011), or specific budgeting rules (Perotti
& Kontopoulos 2002; Hou & Smith 2010; Vlaicu et al. 2014; Grembi et al. 2016; Asatryan et
al. 2018). Several scholars also point out that awarding finance ministers a central role in
budget preparations can improve fiscal performance (von Hagen & Harden 1995; Alesina &
Perotti 1996; Hallerberg et al. 2007; De Haan et al. 2013; Vlaicu et al. 2014). Yet, few studies
thus far examine the potential impact of administrative delegation in budgetary processes
(Hagen & Vabo 2005; Jimenez 2019). This is the main contribution of our analysis. More
specifically, we ask whether and to what extent delegation of the budget preparation process to
top civil servants improves or worsens fiscal performance.
From a political economics perspective, several arguments suggest that politics can become a
source of poor fiscal performance. For instance, politicians in fear of their position have an
incentive to increase deficits and debt to tie the hands of future governments (Persson &
Svensson 1989). Moreover, different spending ministers might exclusively focus on their own
portfolio and be unwilling or unable to coordinate budgetary decisions. This triggers a common
pool problem leading to higher deficits and debt levels (von Hagen & Harden 1995; Perotti &
Kontopoulos 2002). Finally, diverging partisan preferences about budgetary adjustments may
trigger a war-of-attrition that delays necessary fiscal consolidation (Alesina & Drazen 1991;
Tsebelis 2002). Although not an exhaustive list, in all these cases political mechanisms
undermine fiscal performance and yield potentially substantial deficits.
The question then becomes whether awarding a central role in the budget preparation process
to top civil servants helps address such political predispositions towards fiscal deficits – or
rather makes things worse. To fix ideas, we consider an institutional setting where an appointed
civil servant controls the budget process up to the point where a complete draft budget is
submitted for discussion and approval to an elected political body. This is arguably a minimal
intervention since the bureaucrat does not control the final budget. Nonetheless, as discussed
2
in section 2, this procedure deviates fundamentally from the traditional bottom-up budgeting
process (where committees and agencies submit their spending requests) and from procedures
where elected politicians manage all phases of budget process.
Our null hypothesis is that administrative delegation as defined above will not influence fiscal
performance. One reason is that it does not include formal agenda-setting powers. That is,
elected politicians remain free to amend the budget proposal and public administrators cannot
force through their budget proposal. Moreover, elected politicians may always renege on their
delegation decision and revert to the bottom-up or politically centralized procedures. Therefore,
politicians’ budgetary preferences may override self-imposed institutional constraints, which
would nullify any effects of administrative delegation. Both elements are present in our
empirical setting. This stacks the deck in favor of the null hypothesis, and provides a strong
testing ground for any effects of administrative delegation.
Our first alternative hypothesis is that administrative delegation improves fiscal performance.
This builds on three arguments involving the premise that the administrator seeks to maintain
fiscal discipline, which is particularly likely in settings where she is held directly accountable
for fiscal performance (as in Norway). First, delegation to one public administrator might
weaken the many voices speaking in favor of increased spending (Jimenez 2019). Second, the
public administrator’s budget proposal may “anchor” the subsequent political debate and
introduce stricter control over budgetary decisions. This would be reminiscent of the benefits
of central bank independence, where delegation is used to sustain credible monetary policies
(Fischer 1995; Alesina & Perotti 1996; Farvaque et al. 2014). 1 Finally, administrative
delegation allows the civil servant to control the type and nature of information reaching
elected politicians and the public. She can exploit this informational advantage to achieve better
fiscal outcomes. Overall, these arguments suggest that administrative delegation may improve
fiscal performance.
Our second alternative hypothesis is that administrative delegation deteriorates fiscal
performance. This builds on the classic literature regarding budget-maximizing bureaucrats
1 Political centralization of the budgetary process (e.g. in the hands of a finance minister) might likewise increase
coordination and control. Yet, a crucial difference exists between administrative and political centralization. Keeping public administrator(s) directly accountable for fiscal performance guarantees prioritization of sustainable fiscal outcomes. Politicians’ re-election concerns mean that the same need not hold under political centralization.
3
(Niskanen 1968, 1975; Blais & Dion 1991; Jimenez 2019). Niskanen’s model of bureaucracy
maintains that bureaucrats have an incentive to maximize the size of the bureaucracy. The
reason is that budget size relates positively to bureaucrats’ status, prestige, discretion and
survival. Administrative delegation in budget processes may then weaken opposition to such
self-serving spending demands. This may undermine sound fiscal policies and lead to weaker
fiscal performance.
Whatever the effects of administrative delegation on fiscal performance, it can be expected that
its benefits will be larger when political factors impose greater fiscal inefficiencies. From that
perspective, it has been argued that fiscal performance is particularly undermined in political
settings with sharp ideological divisions and/or ‘weakness’ in political decision-making (the
‘Weak Government Hypothesis’; Roubini & Sachs 1989; Edin & Ohlsson 1991; Ashworth et
al. 2005; Baskaran 2013; Artés & Jurado 2018). Such situations – including coalition and
minority governments – may thus also prompt the largest improvements in fiscal performance
with administrative delegation in budgetary procedures.
In our empirical analysis of these theoretical propositions, we trace the budgetary procedures
and fiscal performance for a large panel of Norwegian local governments over the period 1991-
2016. Municipalities in Norway employ one of three budgetary procedures: i.e. coordination
by the political leadership, delegation to the senior civil servant, and the traditional ‘bottom-
up’ procedure. The use of those procedures displays substantial variation across time and space,
which provides a unique opportunity to assess their effects using a research design exploiting
within-municipality changes. Clearly, however, budget processes adopted at the local level
could be endogenous. For example, introducing administratively centralized budgetary
processes could be triggered by historical fiscal performance, creating a reverse-causality
concern. We will present a number of robustness tests to lessen this and other methodological
concerns, but return to potential caveats underlying our analysis in our results discussion.
Our main findings indicate that administrative delegation in the budget preparation process
improves fiscal performance. The budget surplus as a share of current revenues increases 0.3
percentage points on average after reforms giving the senior local civil servant a central role.
As the Norwegian central government has recommended a long-term fiscal surplus of three
percent, administrative delegation has an effect equivalent to roughly ten percent of this
benchmark. Further examination indicates that this result does not appear to increase/decrease
4
over time. It is, however, conditional on political circumstances. Specifically, the fiscal effect
of administrative delegation is nearly twice as large when the mayor lacks majority support in
the local council, while it is non-existent when (s)he enjoys such majority support. When
looking at the underlying mechanisms, we find that the majority of administrative delegation’s
improvement in fiscal performance is due to keeping spending under control. This is consistent
with previous work highlighting that the expenditure side of the budget causes inferior fiscal
performance under settings with weak political decision-making (Kontopoulos & Perotti 1998,
1999; Ashworth et al. 2005). Overall, these finding indicate that even a limited degree of
administrative control over budgetary processes may help to alleviate poor fiscal performance
arising due to political coordination failures.
2. Institutional setting and data
The Norwegian local system of government consists of 19 counties and just over 400
municipalities in our period of observation. Municipalities play an important economic role
through their responsibility for implementing national welfare policies. In 2016, total local
government revenues and expenditures accounted for about 18 percent of GDP, and about 16
percent of total employment (measured by working hours). Much of this spending is subject to
central government regulatory constraints. Even so, Norwegian municipalities retain
considerable discretion when it comes to the allocation of current operating spending as well
as investments. They also have substantial fiscal autonomy, particularly with respect to
property taxation as well as user charges.
Important for our empirical analysis, fiscal performance is a major concern for Norwegian local
governments. Section 45 of the Local Government Act specifies that municipalities must
propose revenue and spending plans within a complete, realistic and balanced budget. The net
current surplus thereby acts as the key indicator of fiscal performance (henceforth ‘net surplus’).
It is defined as net operating revenue minus net operating expenses, net interest expenses, and
net repayments on debt.2 A negative net surplus implies that the local authority would have to
take resources from its equity, which is illegal. The county governors oversee local authorities’
compliance with these fiscal rules. Failure to comply may trigger the appointment of a special
2 Local governments are allowed to take up loans for financing investments in the welfare sector (e.g., schools,
social institutions) as well as for infrastructure (e.g., water, sewage, waste collection and treatment). Such loans can only be used to finance investment outlays via the capital account. Still, interest and amortization payments for these loans count as operating expenditures, and thus affect the current account and its balance.
5
commission by the central government that takes over managerial responsibilities (including
major fiscal decisions such as debt, financial leasing and long-term contracts). Given its central
importance as the key budgetary target in local governments’ fiscal framework, the net surplus
will be the main dependent variable in our empirical analysis.3
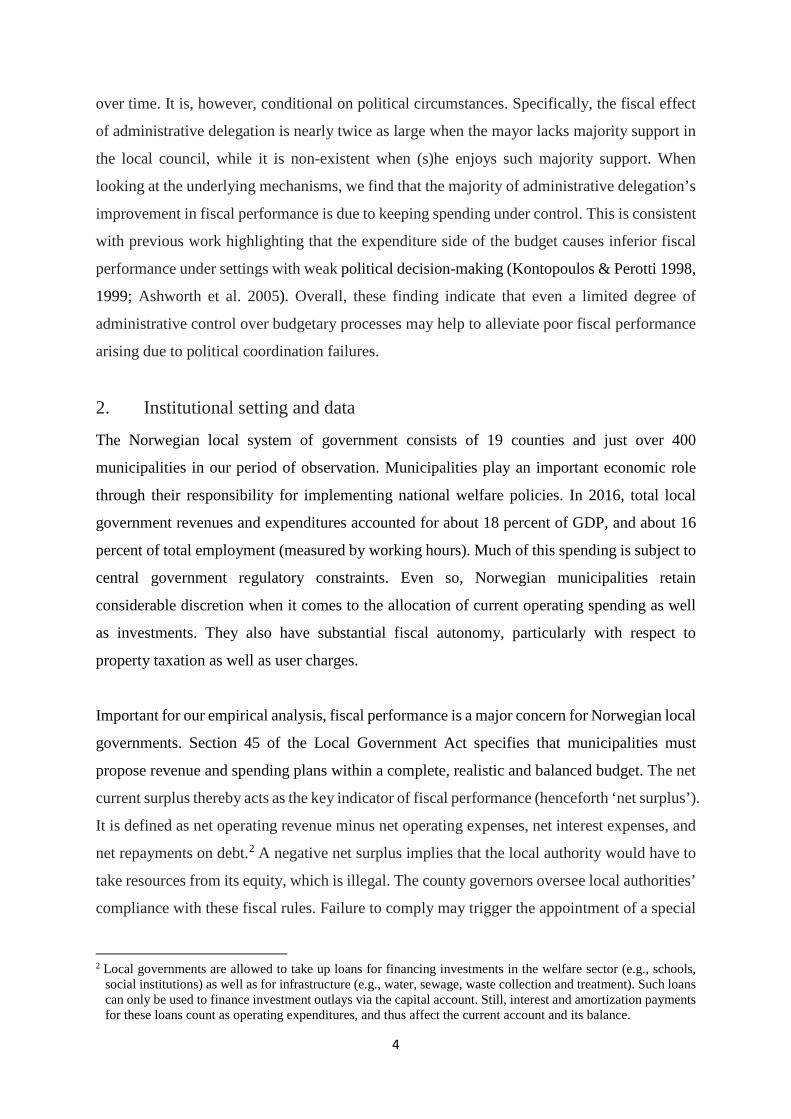
Figure 1. Fiscal performance in Norwegian municipalities, as measured by the net surplus
Note: The graph on the left displays average levels of municipalities’ net surplus for the years 1991-2016. The
diagram on the right shows the frequency distribution of the net surplus using municipality-level data averaged over time (which highlights its cross-sectional variation).
In Figure 1, we display on the left-hand side the average net surplus measured as percentage of
current revenues over the period 1991–2016. The early 1990s saw net surpluses fluctuate
around the recommended three percent threshold. Economic crises induced weaker fiscal
performance in the periods 1998-2003 and 2007-2008, but average fiscal performance
normalized again from 2009 onwards. We also display on the right-hand side of Figure 1 the
overall frequency distribution of the net surplus averaged over time within municipalities. This
3 The Committee for county and municipal government finance (“Teknisk beregningsutvalg for kommunal og
fylkeskommunal økonomi”, administered by the Ministry of Local Government and Modernization) recommended a long-term surplus of three percent up to 2014. Due to changes in the system of VAT compensation, the recommended level was reduced to two percent since 2014 (TBU 2014). Naturally, a very large budget surplus may not reflect good fiscal performance. Still, Figure 1 illustrates that surpluses in excess of seven percent of current revenues are rare occurrences. Excluding observations with fiscal surpluses above seven, six or even five percent does not affect our analysis below.
6
reveals considerable dispersion in fiscal performance across municipalities (the between-unit
standard deviation is 1.91%). Clearly, there are also very substantial disparities in fiscal
performance within municipalities over time. These are in effect even stronger than the cross-
sectional variation (the within-unit standard deviation is 2.96%). These variations across time
and space are key to our empirical analysis.
Budgetary procedures
In Norwegian local governments, the traditional budgetary approach starts at the lower
echelons of the political jurisdiction. It allows the various government agencies and standing
committees to articulate their preferred spending needs for the upcoming budgetary term. These
requests are assessed and processed at higher administrative and political levels, before being
submitted for final approval by an elected assembly. We henceforth refer to this traditional,
decentralized approach as the ‘bottom-up’ procedure. This is also the traditional budgetary
procedure at other levels of government in Norway, as well as in numerous other countries.
Norwegian local governments can also employ two alternative budget preparation procedures.
The first of these assigns responsibility for preparing a coherent budget proposal to a “finance
minister”. The key difference between this ‘centralized’ procedure and the bottom-up approach
lies in the sequence of events. That is, the bottom-up procedure allows the standing committees
to propose allocations for spending programs, and overall spending is decided afterwards. The
‘centralized’ approach instead has key elected politicians fixing the spending framework first,
and program allocations are decided afterwards.
The second alternative procedure relies on administrative (rather than political) coordination.
In practice, this is implemented by granting full budgetary initiative to the top administrative
position in Norwegian municipalities (i.e. the rådman; henceforth Chief Municipal Officer, or
CMO). She presents a draft budget with sectoral spending limits to the local council committees,
who can make additional recommendations. The CMO’s draft budget and the committees’
recommendations then form the basis for the final budget proposal, which is submitted for
approval to the municipal council. While the CMO plays a key role in the early stages of the
budget process, politicians retain leeway to make changes afterwards.
7
Although these three budget preparation models are not formally described in legislation, they
reflect distinct traditions and approaches employed in practice. Annual data on the budgetary
procedures employed by all Norwegian local governments are collected using a survey
questionnaire and are included in a national database (the “Local Government Organizational
Database”). Specifically, local government officials are presented the following description of
the threefold typology of budgetary procedures outlined above:
In the final stage of the budgeting process, the executive board submits a proposal to the
local council. The council subsequently makes the final decisions. The preceding budget
preparations can be organized in three ways:
A: The bottom-up process: The administrative agencies and standing political
committees draft budget proposals, which are subsequently processed by the CMO.
The CMO submits the budget proposal to the executive board.
B: The centralized administrative process: The CMO presents a coherent budget
proposal for processing in the standing committees. The executive board prepares its
budget proposal on the basis of CMO and committee proposals.
C: The centralized political process: The executive board initiates and controls the
budgetary process, collecting information from the standing committees and the CMO.
Using this information, the executive board submits its proposal to the local council.
Following this description, respondents are asked to indicate which procedure best fits that
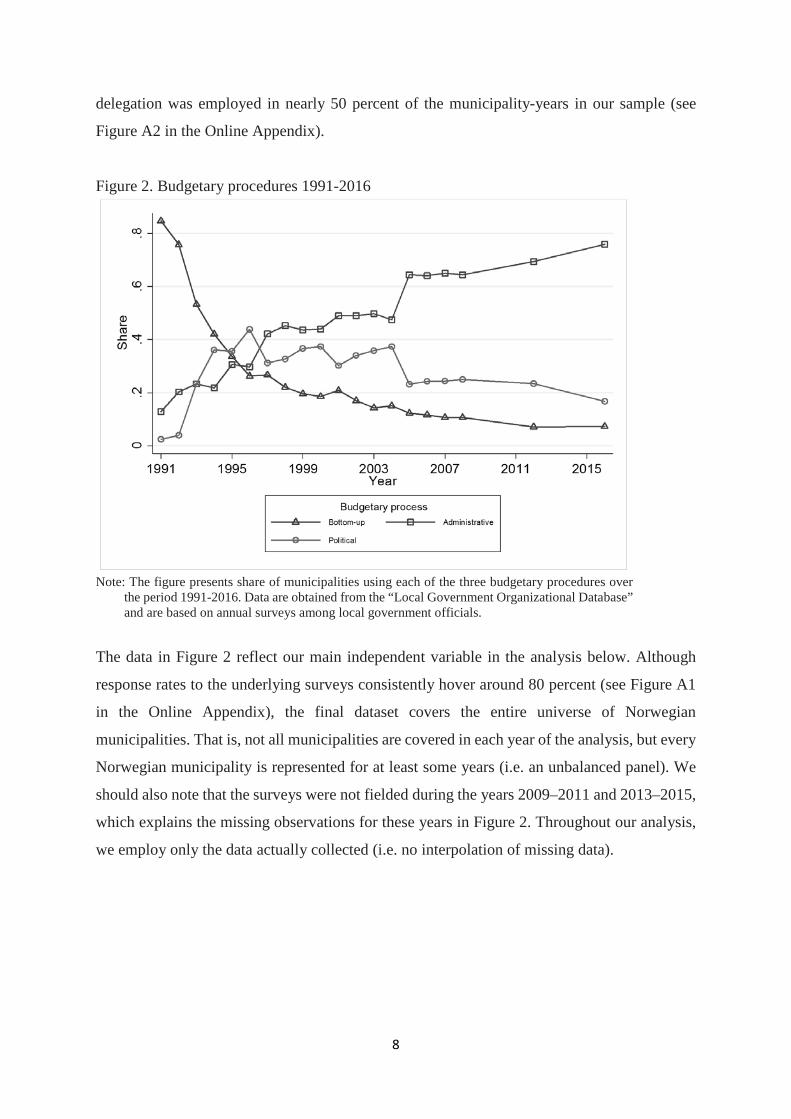
employed by their municipality.4 Figure 2 presents the resulting data in terms of the share of
municipalities using each budgetary procedure. It is clear that the bottom-up procedure (A) was
dominant at the start of the sample period in 1991. More than 80 percent of local governments
relied on this method. In subsequent decades, this procedure was gradually replaced with the
politically centralized approach (C) and the administrative delegation approach (B).
Administrative delegation has currently acquired a dominant position, with nearly 80 percent
of municipalities employing this procedure in 2016. The CMO thus has become a key player
in local government budget preparations across Norway. Over the entire period, administrative
4 Hagen and Vabo (2005) developed the survey question, and were the first to use the resulting data. Reliance on
a single-item question and the self-classification by local officials may be sub-optimal. Nonetheless, the data show considerable consistency over time and are considered a valid and reliable measure as provided by the Norwegian Center for Research Data (NSD; http://www.nsd.uib.no/nsddata/serier/kommunalorganisering.html).
8
delegation was employed in nearly 50 percent of the municipality-years in our sample (see
Figure A2 in the Online Appendix).
Figure 2. Budgetary procedures 1991-2016
Note: The figure presents share of municipalities using each of the three budgetary procedures over
the period 1991-2016. Data are obtained from the “Local Government Organizational Database” and are based on annual surveys among local government officials.
The data in Figure 2 reflect our main independent variable in the analysis below. Although
response rates to the underlying surveys consistently hover around 80 percent (see Figure A1
in the Online Appendix), the final dataset covers the entire universe of Norwegian
municipalities. That is, not all municipalities are covered in each year of the analysis, but every
Norwegian municipality is represented for at least some years (i.e. an unbalanced panel). We
should also note that the surveys were not fielded during the years 2009–2011 and 2013–2015,
which explains the missing observations for these years in Figure 2. Throughout our analysis,
we employ only the data actually collected (i.e. no interpolation of missing data).
9
3. Estimating the causal effect of budgeting procedures 3.1 Model specification and identification
To estimate the causal effect of distinct budgetary procedures on local governments’ fiscal
performance – operationalized by their net current budget surplus – our baseline difference-in-
differences regression model takes the following form:
𝑆𝑆𝑆𝑆𝑆𝑆𝑆𝑆𝑆𝑆𝑆𝑆𝑆𝑆𝑖𝑖𝑖𝑖 = 𝛽𝛽1𝑃𝑃𝑃𝑃𝑆𝑆𝑃𝑃𝑃𝑃𝑃𝑃𝑃𝑃𝑃𝑃𝑆𝑆 𝐶𝐶𝐶𝐶𝑛𝑛𝑃𝑃𝑆𝑆𝑃𝑃𝑆𝑆𝑃𝑃𝑡𝑡𝑃𝑃𝑃𝑃𝑃𝑃𝑃𝑃𝑛𝑛𝑖𝑖𝑖𝑖 + 𝛽𝛽2𝑇𝑇𝑆𝑆𝑃𝑃𝑇𝑇𝑃𝑃𝑃𝑃𝑃𝑃𝑃𝑃𝑛𝑛𝑃𝑃𝑆𝑆 𝐵𝐵𝑃𝑃𝑃𝑃𝑃𝑃𝑃𝑃𝐵𝐵 𝑈𝑈𝑆𝑆𝑖𝑖𝑖𝑖 + 𝐶𝐶𝑃𝑃𝑛𝑛𝑃𝑃𝑆𝑆𝑃𝑃𝑆𝑆𝑆𝑆
+ 𝜃𝜃𝑖𝑖 + 𝜗𝜗𝑖𝑖 + 𝜀𝜀𝑖𝑖𝑖𝑖
Our dependent variable 𝑆𝑆𝑆𝑆𝑆𝑆𝑆𝑆𝑆𝑆𝑆𝑆𝑆𝑆𝑖𝑖𝑖𝑖 equals the net surplus in municipality i in year t (as defined
in the previous section). 𝑃𝑃𝑃𝑃𝑆𝑆𝑃𝑃𝑃𝑃𝑃𝑃𝑃𝑃𝑃𝑃𝑆𝑆 𝐶𝐶𝐶𝐶𝑛𝑛𝑃𝑃𝑆𝑆𝑃𝑃𝑆𝑆𝑃𝑃𝑡𝑡𝑃𝑃𝑃𝑃𝑃𝑃𝑃𝑃𝑛𝑛𝑖𝑖𝑖𝑖 and 𝑇𝑇𝑆𝑆𝑃𝑃𝑇𝑇𝑃𝑃𝑃𝑃𝑃𝑃𝑃𝑃𝑛𝑛𝑃𝑃𝑆𝑆 𝐵𝐵𝑃𝑃𝑃𝑃𝑃𝑃𝑃𝑃𝐵𝐵 𝑈𝑈𝑆𝑆𝑖𝑖𝑖𝑖 are two
indicator variables taking value 1 in years where local government i employs a politically
centralized or bottom-up procedure, respectively, and 0 otherwise. In years where both
indicators are 0, the local government applies the administratively centralized budgetary
procedure. Coefficients β1 and β2 thus reveal the difference in fiscal performance between
administrative delegation and the other two budgetary approaches. The model includes a full
set of municipality fixed effects (𝜃𝜃𝑖𝑖) and year fixed effects (𝜗𝜗𝑖𝑖) to account for (un)observed
sources of heterogeneity that are specific to particular municipalities or years, respectively.
This implies that we focus on within-municipality variation across time to derive our inferences.
We also add a vector of Controls, which includes central government grants per capita,
exogenous tax revenues per capita, levels of hydropower production (which generate local
revenues via fees and commercial property taxes; Andersen et al. 2014; Borge et al. 2015; Geys
& Sørensen 2016), and a set of demographic indicators related to municipalities’ main social
welfare expenditure components (i.e. child care, education, old-age care, and health services).
Such covariates reflect exogenous factors that influence local government revenues and/or
expenditures, thereby affecting (temporal trends in) fiscal performance. Finally, 𝜀𝜀𝑖𝑖𝑖𝑖 is an
idiosyncratic error term.
The key identifying assumption underlying our empirical specification is the ‘common trends’
assumption. It holds that municipalities introducing administrative delegation (the ‘treatment’
of interest) would have seen a similar trend in fiscal performance as all other municipalities if
they had not switched to the delegated procedure. We invoke this assumption conditional on
the set of time-varying controls included in our model. Since the counterfactual is effectively
10
unobserved, the identifying assumption cannot be tested directly. Nonetheless, we perform
several tests that strongly suggest its validity in our setting. First, we estimate specifications
that extend our baseline model with linear, municipality-specific time-trends. These account
for possibly distinct municipality-specific time trends due to rising or declining debts, in- or
outmigration, or changing political preferences in the electorate as well as the elected council.
Second, since most local governments introduced administrative delegation in the 2000s, we
identify three sets of authorities: i) those shifting permanently to the administrative procedure
after 2000, ii) those that shifted for parts of this period, and iii) those that never shifted. The
common trend assumption would imply that all three groups witness similar temporal
developments in net surplus prior to the introduction of administrative delegation (i.e. prior to
the year 2000). Figure A3 in the Online Appendix presents suggestive evidence indicating that
pre-reform trends in the net surplus of all three groups indeed follow parallel paths.
Before turning to the results, one might argue that fiscal performance as well as decisions about
administrative delegation could depend on the unobserved ‘qualities’ of the person holding the
municipality’s top administrative position. A better (worse) CMO – in terms of professional
competence or experience – might obtain better (worse) fiscal performance and be awarded
more (less) budgetary authority. To address this, we extend our empirical model in some
specifications with CMO fixed effects. This effectively relies on variation within CMOs over
time (as well as within municipalities; see above), and provides a very demanding empirical
test of our theoretical propositions. Table A.1 in the Online Appendix provides summary
statistics for all variables included in the model.
3.2 Main findings
Table 1 presents our main results. Column (1) includes municipality and year fixed effects,
time-varying covariates as well as municipality-specific time trends. Column (2) instead adds
municipality and year fixed effects, time-varying covariates and a full set of CMO fixed effects.
Throughout all estimations, we cluster standard errors at the level of the municipality.
All coefficient estimates in Table 1 are negative. This indicates that the bottom-up and
politically centralized budgeting procedures on average yield lower net current budget
surpluses than the administrative delegation procedure. In other words, administrative
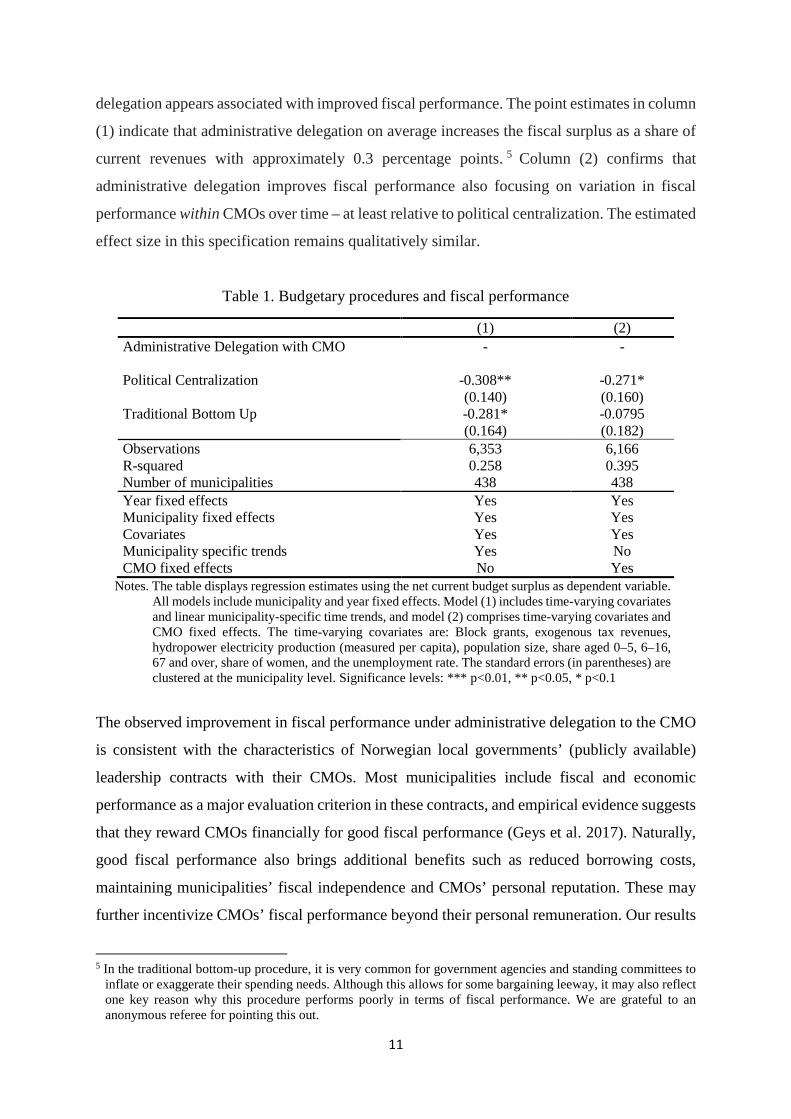
11
delegation appears associated with improved fiscal performance. The point estimates in column
(1) indicate that administrative delegation on average increases the fiscal surplus as a share of
current revenues with approximately 0.3 percentage points. 5 Column (2) confirms that
administrative delegation improves fiscal performance also focusing on variation in fiscal
performance within CMOs over time – at least relative to political centralization. The estimated
effect size in this specification remains qualitatively similar.
Table 1. Budgetary procedures and fiscal performance
(1) (2) Administrative Delegation with CMO
- -
Political Centralization -0.308** -0.271* (0.140) (0.160) Traditional Bottom Up -0.281* -0.0795 (0.164) (0.182) Observations 6,353 6,166 R-squared 0.258 0.395 Number of municipalities 438 438 Year fixed effects Yes Yes Municipality fixed effects Yes Yes Covariates Yes Yes Municipality specific trends Yes No CMO fixed effects No Yes
Notes. The table displays regression estimates using the net current budget surplus as dependent variable. All models include municipality and year fixed effects. Model (1) includes time-varying covariates and linear municipality-specific time trends, and model (2) comprises time-varying covariates and CMO fixed effects. The time-varying covariates are: Block grants, exogenous tax revenues, hydropower electricity production (measured per capita), population size, share aged 0–5, 6–16, 67 and over, share of women, and the unemployment rate. The standard errors (in parentheses) are clustered at the municipality level. Significance levels: *** p<0.01, ** p<0.05, * p<0.1
The observed improvement in fiscal performance under administrative delegation to the CMO
is consistent with the characteristics of Norwegian local governments’ (publicly available)
leadership contracts with their CMOs. Most municipalities include fiscal and economic
performance as a major evaluation criterion in these contracts, and empirical evidence suggests
that they reward CMOs financially for good fiscal performance (Geys et al. 2017). Naturally,
good fiscal performance also brings additional benefits such as reduced borrowing costs,
maintaining municipalities’ fiscal independence and CMOs’ personal reputation. These may
further incentivize CMOs’ fiscal performance beyond their personal remuneration. Our results
5 In the traditional bottom-up procedure, it is very common for government agencies and standing committees to
inflate or exaggerate their spending needs. Although this allows for some bargaining leeway, it may also reflect one key reason why this procedure performs poorly in terms of fiscal performance. We are grateful to an anonymous referee for pointing this out.
12
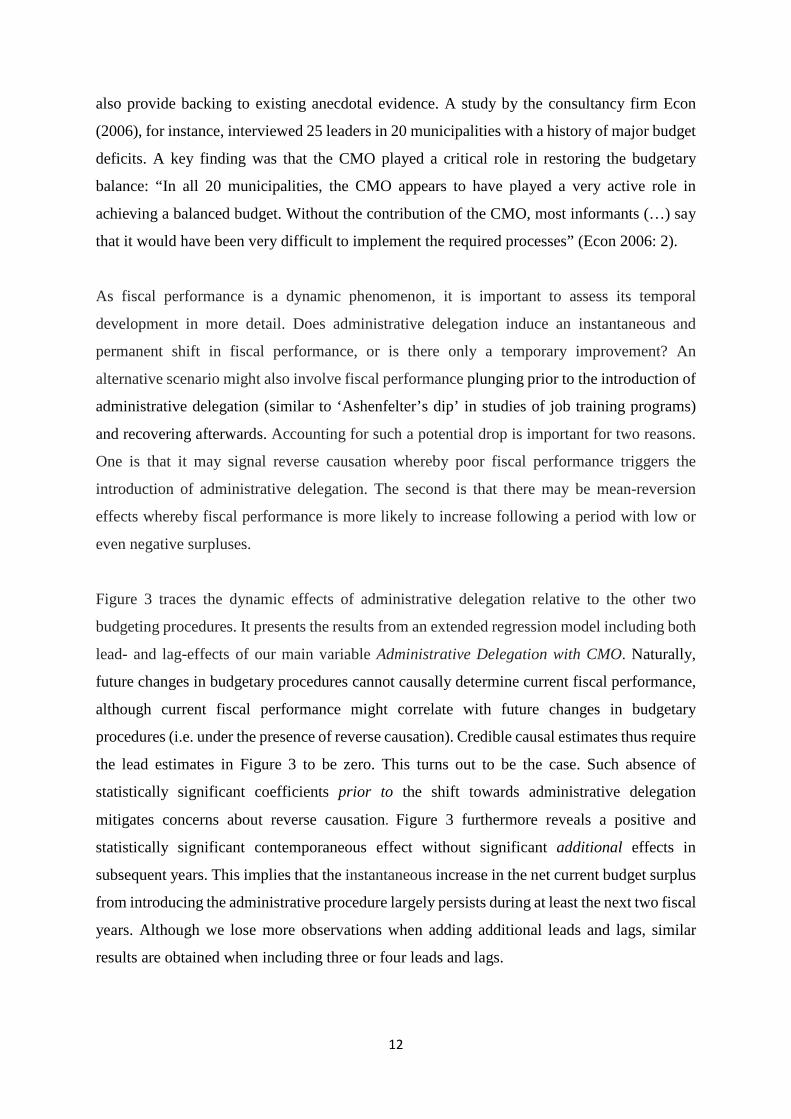
also provide backing to existing anecdotal evidence. A study by the consultancy firm Econ
(2006), for instance, interviewed 25 leaders in 20 municipalities with a history of major budget
deficits. A key finding was that the CMO played a critical role in restoring the budgetary
balance: “In all 20 municipalities, the CMO appears to have played a very active role in
achieving a balanced budget. Without the contribution of the CMO, most informants (…) say
that it would have been very difficult to implement the required processes” (Econ 2006: 2).
As fiscal performance is a dynamic phenomenon, it is important to assess its temporal
development in more detail. Does administrative delegation induce an instantaneous and
permanent shift in fiscal performance, or is there only a temporary improvement? An
alternative scenario might also involve fiscal performance plunging prior to the introduction of
administrative delegation (similar to ‘Ashenfelter’s dip’ in studies of job training programs)
and recovering afterwards. Accounting for such a potential drop is important for two reasons.
One is that it may signal reverse causation whereby poor fiscal performance triggers the
introduction of administrative delegation. The second is that there may be mean-reversion
effects whereby fiscal performance is more likely to increase following a period with low or
even negative surpluses.
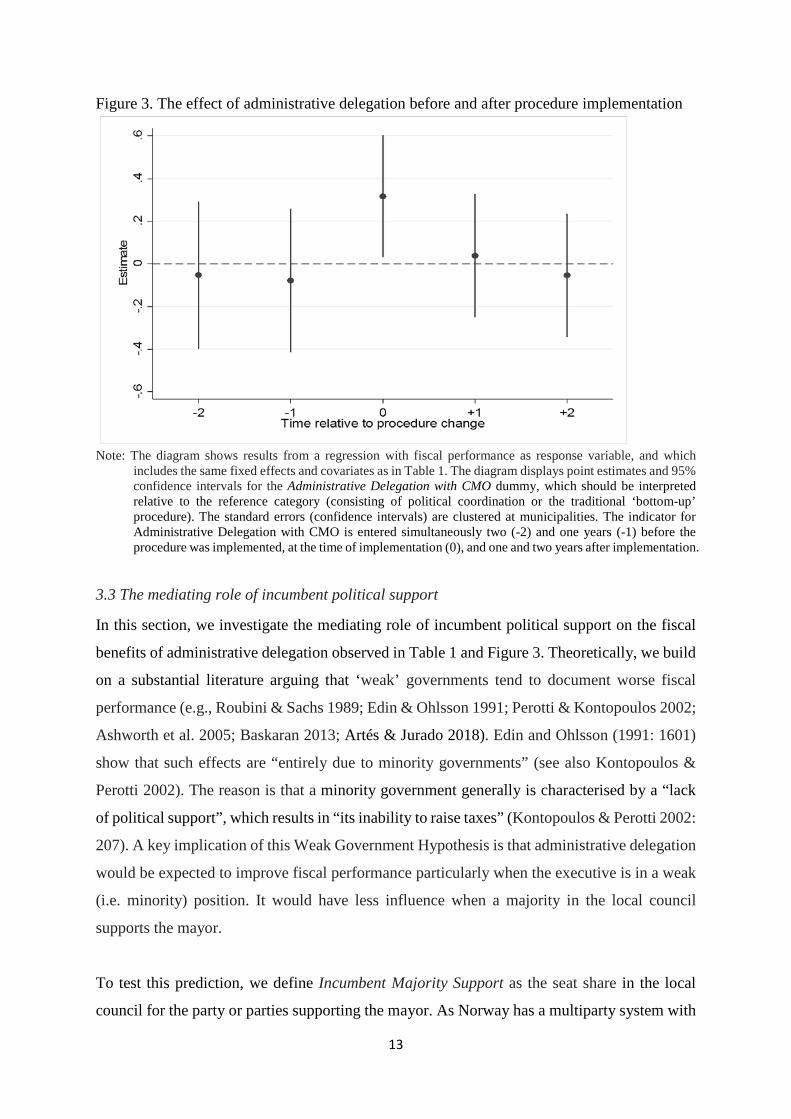
Figure 3 traces the dynamic effects of administrative delegation relative to the other two
budgeting procedures. It presents the results from an extended regression model including both
lead- and lag-effects of our main variable Administrative Delegation with CMO. Naturally,
future changes in budgetary procedures cannot causally determine current fiscal performance,
although current fiscal performance might correlate with future changes in budgetary
procedures (i.e. under the presence of reverse causation). Credible causal estimates thus require
the lead estimates in Figure 3 to be zero. This turns out to be the case. Such absence of
statistically significant coefficients prior to the shift towards administrative delegation
mitigates concerns about reverse causation. Figure 3 furthermore reveals a positive and
statistically significant contemporaneous effect without significant additional effects in
subsequent years. This implies that the instantaneous increase in the net current budget surplus
from introducing the administrative procedure largely persists during at least the next two fiscal
years. Although we lose more observations when adding additional leads and lags, similar
results are obtained when including three or four leads and lags.
13
Figure 3. The effect of administrative delegation before and after procedure implementation
Note: The diagram shows results from a regression with fiscal performance as response variable, and which
includes the same fixed effects and covariates as in Table 1. The diagram displays point estimates and 95% confidence intervals for the Administrative Delegation with CMO dummy, which should be interpreted relative to the reference category (consisting of political coordination or the traditional ‘bottom-up’ procedure). The standard errors (confidence intervals) are clustered at municipalities. The indicator for Administrative Delegation with CMO is entered simultaneously two (-2) and one years (-1) before the procedure was implemented, at the time of implementation (0), and one and two years after implementation.
3.3 The mediating role of incumbent political support
In this section, we investigate the mediating role of incumbent political support on the fiscal
benefits of administrative delegation observed in Table 1 and Figure 3. Theoretically, we build
on a substantial literature arguing that ‘weak’ governments tend to document worse fiscal
performance (e.g., Roubini & Sachs 1989; Edin & Ohlsson 1991; Perotti & Kontopoulos 2002;
Ashworth et al. 2005; Baskaran 2013; Artés & Jurado 2018). Edin and Ohlsson (1991: 1601)
show that such effects are “entirely due to minority governments” (see also Kontopoulos &
Perotti 2002). The reason is that a minority government generally is characterised by a “lack
of political support”, which results in “its inability to raise taxes” (Kontopoulos & Perotti 2002:
207). A key implication of this Weak Government Hypothesis is that administrative delegation
would be expected to improve fiscal performance particularly when the executive is in a weak
(i.e. minority) position. It would have less influence when a majority in the local council
supports the mayor.
To test this prediction, we define Incumbent Majority Support as the seat share in the local
council for the party or parties supporting the mayor. As Norway has a multiparty system with
14
effectively two political blocs – a left-leaning socialist bloc and a right-leaning conservative
camp (Fiva et al. 2018) – we sum the seat shares of all parties in the left-wing (right-wing) bloc
if the mayor comes from a left-wing (right-wing or independent) party. Naturally, higher values
on this variable imply higher incumbent support and a ‘stronger’ local government. We center
Incumbent Majority Support at 0.5 to reflect the natural distinction between majority and
minority governments. This implies the following model specification:
𝑆𝑆𝑖𝑖𝑖𝑖 = 𝛼𝛼1𝐴𝐴𝑇𝑇𝐵𝐵𝑃𝑃𝑛𝑛𝑃𝑃𝑆𝑆𝑃𝑃𝑆𝑆𝑃𝑃𝑃𝑃𝑃𝑃𝐴𝐴𝐶𝐶 𝐷𝐷𝐶𝐶𝑆𝑆𝐶𝐶𝐷𝐷𝑃𝑃𝑃𝑃𝑃𝑃𝑃𝑃𝑛𝑛 𝑤𝑤𝑃𝑃𝑃𝑃ℎ 𝐶𝐶𝐶𝐶𝐶𝐶𝑖𝑖𝑖𝑖 + 𝛼𝛼2𝐴𝐴𝑇𝑇𝐵𝐵𝑃𝑃𝑛𝑛𝑃𝑃𝑆𝑆𝑃𝑃𝑆𝑆𝑃𝑃𝑃𝑃𝑃𝑃𝐴𝐴𝐶𝐶 𝐷𝐷𝐶𝐶𝑆𝑆𝐶𝐶𝐷𝐷𝑃𝑃𝑃𝑃𝑃𝑃𝑃𝑃𝑛𝑛 𝑤𝑤𝑃𝑃𝑃𝑃ℎ 𝐶𝐶𝐶𝐶𝐶𝐶𝑖𝑖𝑖𝑖∙ 𝐼𝐼𝑛𝑛𝑃𝑃𝑆𝑆𝐵𝐵𝐼𝐼𝐶𝐶𝑛𝑛𝑃𝑃 𝐶𝐶𝑃𝑃𝑀𝑀𝑃𝑃𝑆𝑆𝑃𝑃𝑃𝑃𝑀𝑀 𝑆𝑆𝑆𝑆𝑆𝑆𝑆𝑆𝑃𝑃𝑆𝑆𝑃𝑃𝑖𝑖𝑖𝑖 + 𝛼𝛼3𝐼𝐼𝑛𝑛𝑃𝑃𝑆𝑆𝐵𝐵𝐼𝐼𝐶𝐶𝑛𝑛𝑃𝑃 𝐶𝐶𝑃𝑃𝑀𝑀𝑃𝑃𝑆𝑆𝑃𝑃𝑃𝑃𝑀𝑀 𝑆𝑆𝑆𝑆𝑆𝑆𝑆𝑆𝑃𝑃𝑆𝑆𝑃𝑃𝑖𝑖𝑖𝑖 + 𝐶𝐶𝑃𝑃𝑛𝑛𝑃𝑃𝑆𝑆𝑃𝑃𝑆𝑆𝑆𝑆
+ 𝛾𝛾𝑖𝑖 + 𝛿𝛿𝑖𝑖 + 𝜖𝜖𝑖𝑖𝑖𝑖
The estimated coefficient of Administrative Delegation with CMO (𝛼𝛼1) reflects the effect of
administrative delegation on fiscal performance when the mayor barely enjoys a majority. This
is where we expect administrative delegation to be beneficial to fiscal performance (i.e. 𝛼𝛼1 >
0). Coefficient 𝛼𝛼2 indicates how deviation from such a bare majority influences the effect of
administrative delegation on fiscal performance. Given our theoretical argumentation, we
expect a smaller (larger) impact when the mayor is in a majority (minority) position (i.e. 𝛼𝛼2 <
0 ). The results are presented in Table 2. Model (1) includes the direct as well as the
multiplicative effects of the two interaction variables (Brambor et al. 2006).6 In Model (2), we
estimate the same model, but use an indicator variable for incumbent majority support. Finally,
Model (3) defines incumbent majority support based on the average seat share of parties
supporting the mayor across the entire period of observation in a given municipality (we return
to the reason below). As this is constant over time and thus perfectly collinear with our
municipality fixed effects, this variable drops out of the estimation model and only its
interaction with our indicator for administrative delegation remains.
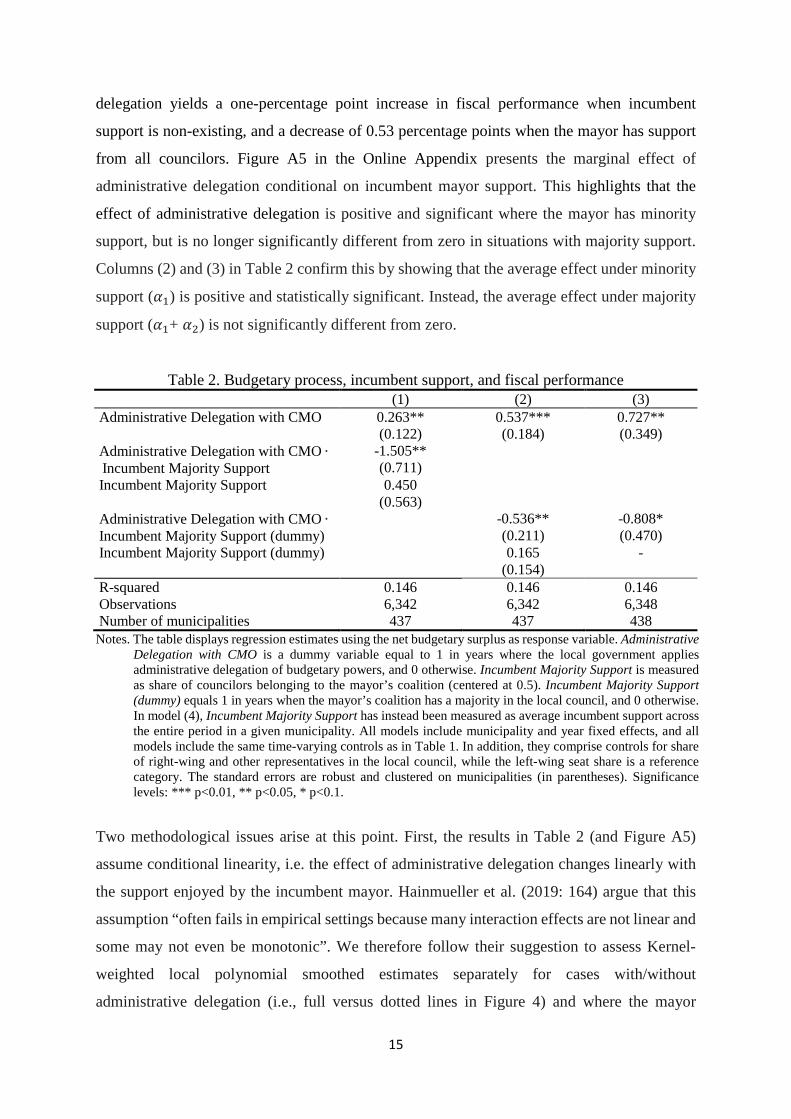
A first observation from the top row of Column (1) in Table 2 is that transition to administrative
delegation increases municipal fiscal performance with about 0.3 percent, conditional on
incumbent support being exactly 50% of council seats. The interaction term in Column (1),
however, is negative and statistically significant. This indicates that shifting to administrative
delegation has a smaller effect when incumbent support is large – and, reversely, a larger effect
when incumbent support is small. In terms of effect size, a shift towards administrative
6 Figure A4 in the Online Appendix displays the distribution of incumbent support for the mayor, conditional on
administrative delegation. The diagram shows that we have a substantial number of municipality-years that allow us to estimate the interaction effect.
15
delegation yields a one-percentage point increase in fiscal performance when incumbent
support is non-existing, and a decrease of 0.53 percentage points when the mayor has support
from all councilors. Figure A5 in the Online Appendix presents the marginal effect of
administrative delegation conditional on incumbent mayor support. This highlights that the
effect of administrative delegation is positive and significant where the mayor has minority
support, but is no longer significantly different from zero in situations with majority support.
Columns (2) and (3) in Table 2 confirm this by showing that the average effect under minority
support (𝛼𝛼1) is positive and statistically significant. Instead, the average effect under majority
support (𝛼𝛼1+ 𝛼𝛼2) is not significantly different from zero.
Table 2. Budgetary process, incumbent support, and fiscal performance (1) (2) (3) Administrative Delegation with CMO 0.263** 0.537*** 0.727** (0.122) (0.184) (0.349) Administrative Delegation with CMO ∙ Incumbent Majority Support
-1.505** (0.711)
Incumbent Majority Support 0.450 (0.563) Administrative Delegation with CMO ∙ Incumbent Majority Support (dummy)
-0.536** (0.211)
-0.808* (0.470)
Incumbent Majority Support (dummy) 0.165 - (0.154) R-squared 0.146 0.146 0.146 Observations 6,342 6,342 6,348 Number of municipalities 437 437 438
Notes. The table displays regression estimates using the net budgetary surplus as response variable. Administrative Delegation with CMO is a dummy variable equal to 1 in years where the local government applies administrative delegation of budgetary powers, and 0 otherwise. Incumbent Majority Support is measured as share of councilors belonging to the mayor’s coalition (centered at 0.5). Incumbent Majority Support (dummy) equals 1 in years when the mayor’s coalition has a majority in the local council, and 0 otherwise. In model (4), Incumbent Majority Support has instead been measured as average incumbent support across the entire period in a given municipality. All models include municipality and year fixed effects, and all models include the same time-varying controls as in Table 1. In addition, they comprise controls for share of right-wing and other representatives in the local council, while the left-wing seat share is a reference category. The standard errors are robust and clustered on municipalities (in parentheses). Significance levels: *** p<0.01, ** p<0.05, * p<0.1.
Two methodological issues arise at this point. First, the results in Table 2 (and Figure A5)
assume conditional linearity, i.e. the effect of administrative delegation changes linearly with
the support enjoyed by the incumbent mayor. Hainmueller et al. (2019: 164) argue that this
assumption “often fails in empirical settings because many interaction effects are not linear and
some may not even be monotonic”. We therefore follow their suggestion to assess Kernel-
weighted local polynomial smoothed estimates separately for cases with/without
administrative delegation (i.e., full versus dotted lines in Figure 4) and where the mayor
16
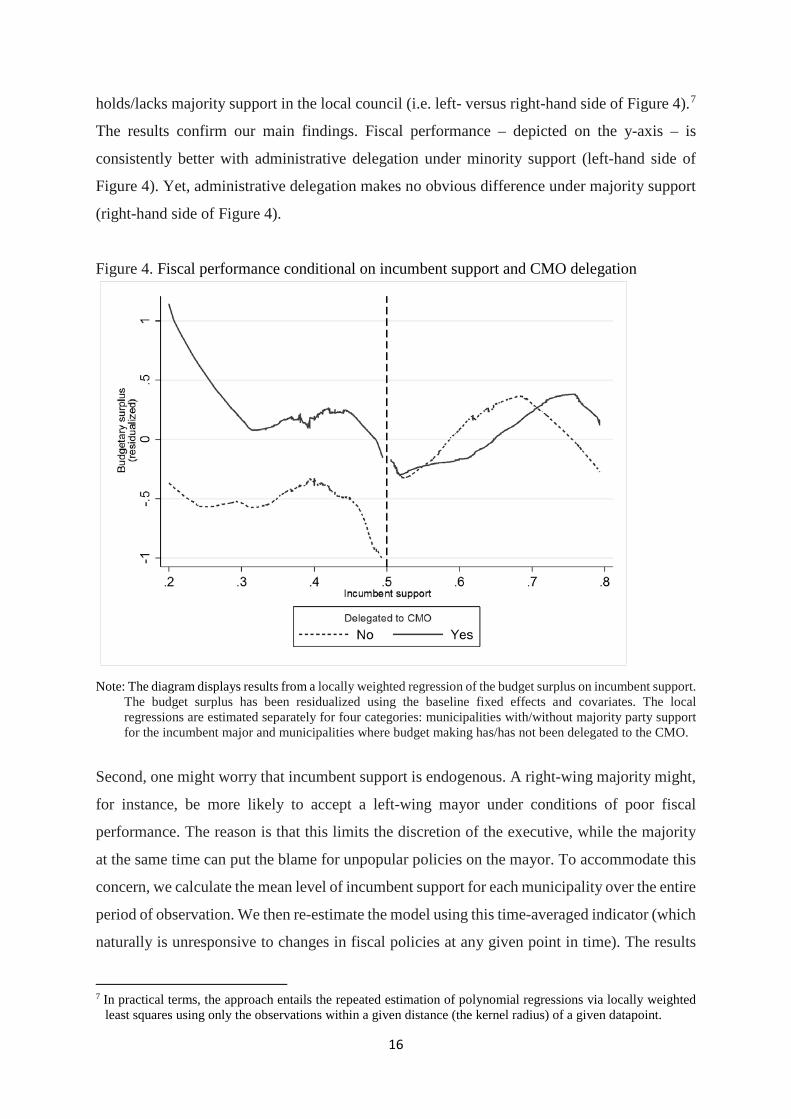
holds/lacks majority support in the local council (i.e. left- versus right-hand side of Figure 4).7
The results confirm our main findings. Fiscal performance – depicted on the y-axis – is
consistently better with administrative delegation under minority support (left-hand side of
Figure 4). Yet, administrative delegation makes no obvious difference under majority support
(right-hand side of Figure 4).
Figure 4. Fiscal performance conditional on incumbent support and CMO delegation
Note: The diagram displays results from a locally weighted regression of the budget surplus on incumbent support.
The budget surplus has been residualized using the baseline fixed effects and covariates. The local regressions are estimated separately for four categories: municipalities with/without majority party support for the incumbent major and municipalities where budget making has/has not been delegated to the CMO.
Second, one might worry that incumbent support is endogenous. A right-wing majority might,
for instance, be more likely to accept a left-wing mayor under conditions of poor fiscal
performance. The reason is that this limits the discretion of the executive, while the majority
at the same time can put the blame for unpopular policies on the mayor. To accommodate this
concern, we calculate the mean level of incumbent support for each municipality over the entire
period of observation. We then re-estimate the model using this time-averaged indicator (which
naturally is unresponsive to changes in fiscal policies at any given point in time). The results
7 In practical terms, the approach entails the repeated estimation of polynomial regressions via locally weighted
least squares using only the observations within a given distance (the kernel radius) of a given datapoint.
17
are given in Column (3) of Table 2, and yield the same pattern as in Column (2). The point
estimates are larger in absolute values, which might indicate some downward bias due to the
endogeneity of incumbent support. This result confirms, however, that local authorities with
frequent minority situations (would) benefit substantially from administrative delegation in
budgetary processes – while those with frequent majority status do not.8
3.4 Mechanisms
Our analysis thus far shows that administrative delegation benefits fiscal performance, at least
when the mayor lacks a strong majority position in the local council. A natural next question
relates to the potential mechanisms underlying this result. Does administrative delegation
induce increased taxation and user charges, intensify efforts to control costs, or some
combination of both? In this section, we extend the analysis by evaluating the revenue as well
as expenditure sides of the budget. The main independent variable remains Administrative
Delegation with CMO, but our dependent variables now become total current revenues per
capita (Columns 1-3 of Table 3) and total expenditures per capita (Columns 4-6 of Table 3).
The estimates in Columns (1) and (4) include the entire sample – as in Table 1. The remainder
of Table 3 again takes into account the role of mayors’ political support. Columns (2) and (5)
comprise municipality-years where the mayors’ party has support from a majority in the local
council (i.e. Incumbent Majority Support > 0.5). Columns (3) and (6) cover municipality-years
where the mayors are in a minority position (i.e. Incumbent Majority Support < 0.5).
The main observation in Table 3 is that the majority of administrative delegation’s
improvement in fiscal performance when the mayor is in a politically weak position is due to
keeping spending under control. This observation confirms anecdotal evidence brought
forward in several consultancy reports (e.g., Econ 2006; Haraldsvik et al. 2018). Those reports
indeed highlight that CMOs implement a stricter cost-control regime (especially to avoid cost
overruns in the final months of a budgetary year) and reduce administrative spending by cutting
the number of administrative layers. Overall, stronger effects on the expenditure side are also
consistent with the fact that ‘weak’ mayors may resort to buying support via higher spending
or use such expenditures to keep coalition partners on board. From this perspective, it is
8 We also checked whether our results in Table 2 persist when adding additional interactions between Incumbent
Majority Support and all our control variables. If any of our controls are correlated with majority status and themselves act as moderators, excluding such interaction terms might bias our findings. Although this implies a much more stringent specification, all results in Table 2 are robust to adding these additional interaction terms.
18
interesting to observe that previous work on the deficit-increasing impact of government
fragmentation links such effects predominantly to higher expenditures rather than lower
revenues (e.g., Kontopoulos & Perotti 1998, 1999).
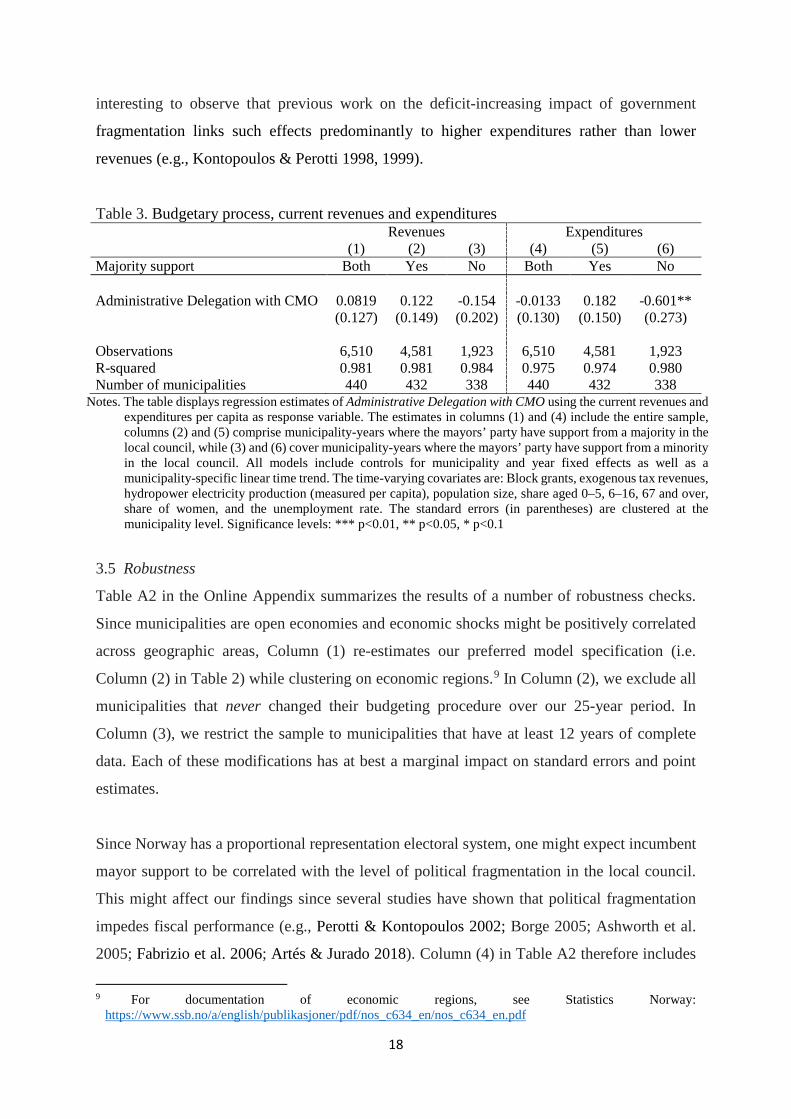
Table 3. Budgetary process, current revenues and expenditures Revenues Expenditures (1) (2) (3) (4) (5) (6) Majority support Both Yes No Both Yes No Administrative Delegation with CMO 0.0819 0.122 -0.154 -0.0133 0.182 -0.601** (0.127) (0.149) (0.202) (0.130) (0.150) (0.273) Observations 6,510 4,581 1,923 6,510 4,581 1,923 R-squared 0.981 0.981 0.984 0.975 0.974 0.980 Number of municipalities 440 432 338 440 432 338
Notes. The table displays regression estimates of Administrative Delegation with CMO using the current revenues and expenditures per capita as response variable. The estimates in columns (1) and (4) include the entire sample, columns (2) and (5) comprise municipality-years where the mayors’ party have support from a majority in the local council, while (3) and (6) cover municipality-years where the mayors’ party have support from a minority in the local council. All models include controls for municipality and year fixed effects as well as a municipality-specific linear time trend. The time-varying covariates are: Block grants, exogenous tax revenues, hydropower electricity production (measured per capita), population size, share aged 0–5, 6–16, 67 and over, share of women, and the unemployment rate. The standard errors (in parentheses) are clustered at the municipality level. Significance levels: *** p<0.01, ** p<0.05, * p<0.1
3.5 Robustness
Table A2 in the Online Appendix summarizes the results of a number of robustness checks.
Since municipalities are open economies and economic shocks might be positively correlated
across geographic areas, Column (1) re-estimates our preferred model specification (i.e.
Column (2) in Table 2) while clustering on economic regions.9 In Column (2), we exclude all
municipalities that never changed their budgeting procedure over our 25-year period. In
Column (3), we restrict the sample to municipalities that have at least 12 years of complete
data. Each of these modifications has at best a marginal impact on standard errors and point
estimates.
Since Norway has a proportional representation electoral system, one might expect incumbent
mayor support to be correlated with the level of political fragmentation in the local council.
This might affect our findings since several studies have shown that political fragmentation
impedes fiscal performance (e.g., Perotti & Kontopoulos 2002; Borge 2005; Ashworth et al.
2005; Fabrizio et al. 2006; Artés & Jurado 2018). Column (4) in Table A2 therefore includes
9 For documentation of economic regions, see Statistics Norway:
https://www.ssb.no/a/english/publikasjoner/pdf/nos_c634_en/nos_c634_en.pdf
19
the Herfindahl index of party concentration within the incumbent coalition as an additional
control variable. This again has no implications for our main findings. The same is also true
when we add an additional control variable for the mayor’s party-political leaning.
Finally, clustering standard errors on municipalities in a model with municipality fixed effects
(as we have done thus far) yields consistent estimates even in the presence of serial correlation
in the idiosyncratic error term. However, if positive serial correlation is sufficiently strong, it
is more efficient to estimate the model in first differences. Yet, this gain in efficiency should
be weighed against the higher sensitivity of the first-difference estimation to measurement errors,
which could bias estimates towards zero. To assess the sensitivity of our findings to the exact
estimation approach, Tables A3 and A4 in the online appendix show that results of a first-
difference estimation are very comparable to the results reported previously.10
3.6 Caveats
There are, of course, a number of potential remaining caveats related to our analysis. First, it
is generally very hard to control for all potential variables affecting fiscal outcomes. Hence,
omitted variable bias always remains a potential concern. Still, any time-varying municipality-
specific omitted variable that affects both the timing of administrative delegation (our treatment)
and the fiscal surplus (our outcome) would imply a violation of the parallel trends assumption.
From this perspective, it is important to reiterate that our results in Table 1 arise even when
including municipality-specific time trends (which alleviates concerns about any violation of
parallel trends). Our analysis of pre-treatment time trends in Figure A3 is also consistent with
the assumption of parallel lines.
Second, as mentioned, trends in fiscal performance might trigger the introduction of specific
budgeting procedures (reverse causation). For example, improvement in fiscal performance
might induce elected politicians to take back control of the budgetary process. A worsening
fiscal situation may instead trigger delegation to independent administrators. Crucially, such
reverse causation would be reflected in positive rather than negative point estimates in Table 1.
As such, reverse causation in our setting works to bias our main estimates towards zero.
10 Wooldridge (2010: chapter 10) has developed a test of serial correlation in panel data based on the residuals in
the first-difference model. With no serial correlation, the relevant test statistic should equal -0.5. With perfect serial correlation, the test statistic equals 0. In the current case, the statistic equals -0.33, which is statistically different from -0.5 [F(1, 422) = 132.82]. It is therefore reassuring to see that the first-difference estimator yields results comparable to those reported thus far.
20
Third, and arguably the most critical issue, it is extremely hard to verify what determined the
choice for a specific budgeting procedure in a given municipality at a given point in time.
Understanding such choices is clearly very important to avoid biased inferences. Interestingly,
previous research suggests that many transitions to administrative delegation in Norway were
initiated by a desire to clarify administrative and political responsibilities. Ideas related to
“New Public Management” from the early 1990s onwards emphasized that elected politicians
should focus on setting policy goals and defining the overall local strategy. Administrators
instead should address policy preparation and day-to-day implementation. Based on such ideas,
local governments gradually transformed their organizational setup by delegating wider
responsibilities to agency heads and CMOs (Vabo 2002: 39-40). It is in this context that local
authorities also delegated extensive control of budgetary preparations to CMOs. Naturally, this
line of argument does not identify why specific municipalities transitioned towards
administrative delegation at a specific point in time. Nevertheless, it does highlight an
underlying trend to do so based on arguments unrelated to the immediate fiscal situation of
local governments.
4 Conclusion In this article, we study whether awarding top civil servants a central role in the (local)
government’s budget preparation process improves or worsens fiscal performance. Our
analysis exploits substantial variation over time and space in budgetary procedures and fiscal
performance in Norwegian local governments. Our main findings highlight that budgetary
delegation in budget procedures improves fiscal performance. This is a strong result given that
the public administrators in our setting mainly set the initial parameters of the budget process
and lack formal authority to impose their preferred budget on elected officials. Our estimates
indicate that there is on average a 0.3 percentage point increase in fiscal performance (measured
by the net budget surplus as a share of current revenues), representing a ten percent
improvement relative to the three-percent benchmark set for the local budget surplus by the
national government. Importantly, the average effect of administrative delegation hides
significant heterogeneity depending on the majority/minority position of the mayor.
Administrative delegation improves fiscal performance only when the mayor is in a minority
position (yielding a net surplus increase of about 0.5 percentage points) whereas it has no
significant effect in majority situations.
21
Naturally, one might wonder to what extent our findings would generalize beyond the
Norwegian setting. From this perspective, it is important to observe that local governments in
most European countries have highly comparable policy responsibilities, frequently operate
under similar financial frameworks, and often witness substantial variation in their level of
government fragmentation/weakness. As such, we believe that our results can be of substantial
importance also for other countries. Furthermore, to the best of our knowledge, budgeting
procedures at the local level in other countries generally follow procedures relying on either
political coordination or the traditional ‘bottom-up’ procedure. Hence, there may in many
countries remain an important unexploited potential approach towards ensuring increased
levels of fiscal discipline.
From a policy perspective, our findings suggest that a system where top administrators have
wide responsibilities for budgetary preparation may improve fiscal discipline. This could be
particularly important in policy areas requiring extensive political coordination, or time periods
where politicians may be less interested in fiscal conservatism (e.g., prior to elections). Hence,
one could imagine that even very limited interventions – such as increased administrative
coordination in budgetary processes for specific policy areas or time periods – may already be
of public interest. The same is true for jurisdictions that repeatedly experience minority
governments. The negative fiscal implications of ‘weak’ governments (Roubini & Sachs 1989;
Edin & Ohlsson 1991; Ashworth et al. 2005; Baskaran 2013; Artés & Jurado 2018) or under
proportional compared to majoritarian electoral systems (Persson & Tabellini 2003) suggest
other settings where administrative delegation may be particularly advantageous.
22
References Alesina, A. & Drazen, A. 1991. Why are fiscal stabilizations delayed? American Economic
Review 81: 1170–1180. Alesina, A., & Perotti, R. 1996. Fiscal discipline and the budget process. American Economic
Review, 86(2), 401-407. Alt, J.E., & Lassen, D.D. 2006. Fiscal transparency, political parties, and debt in OECD
countries. European Economic Review, 50(6), 1403-1439. Andersen, J.J., Fiva, J.H., & Natvik, G.J. 2014. Voting When the Stakes are High. Journal of
Public Economics, 110, 157-166. Artés, J., & Jurado, I. 2018. Government fragmentation and fiscal deficits: a regression
discontinuity approach. Public Choice, 175(3-4), 367-391. Asatryan, Z., Castellon, C., & Stratmann, T. 2018. Balanced budget rules and fiscal outcomes:
Evidence from historical constitutions, Journal of Public Economics, 167, 105-119. Ashworth J., Geys, B., & Heyndels, B. 2005. Government weakness and local public debt
development in Flemish municipalities. International Tax and Public Finance, 12(4), 395-422.
Baskaran, T. 2013. Coalition governments, cabinet size, and the common pool problem: Evidence from the German states. European Journal of Political Economy 32: 356-376.
Blais, A., & Dion, S. 1991. The Budget-Maximizing Bureaucrat: Appraisals and Evidence. University of Pittsburgh Press.
Borge, L.-E. 2005. Strong politicians, small deficits: Evidence from Norwegian local governments. European Journal of Political Economy 21: 325-344.
Borge, L.-E., Parmer, P., & Torvik, R. 2015. Local Natural Resource Curse. Journal of Public Economics 131: 101-114.
Brambor, T., Clark, W.R., and Golder, M. 2006. Understanding Interaction Models: Improving Empirical Analyses. Political Analysis, 14(1): 63-82.
De Haan, J., Jong-A-Pin, R., & Mierau, J.O. 2013. Do budgetary institutions mitigate the common pool problem? New empirical evidence for the EU. Public Choice, 156(3-4), 423-441.
Econ. 2006. Kommuner som har gått ut av ROBEK-lista (Municipalities that have left the ROBEK registry). ECON-rapport, nr. 2006-015.
Edin, P.-A. & Ohlsson, H. 1991. Political determinants of budget deficits: Coalition effects versus minority effects. European Economic Review 35(8): 1597-1603.
Eslava, M. 2011. The political economy of fiscal deficits: A survey. Journal of Economic Surveys, 25: 645-673.
Fabrizio, S., Mody, A., Corsetti, G. & Temple, J.R.W. 2006. Can Budget Institutions Counteract Political Indiscipline? Economic Policy 21(48): 689-739.
Farvaque, E., Stanek, P., & Vigeant, S. 2014. On the performance of monetary policy committees. Kyklos, 67(2): 177-203.
Fink, A. & Stratmann, T. 2011, Institutionalized bailouts and fiscal policy: Consequences of soft budget constraints. Kyklos, 64: 366-395.
Fischer, S. 1995. Central-bank independence revisited. American Economic Review, 85(2), 201-206.
Fiva, J.H., Folke, O., & Sørensen, R.J. 2018. The Power of Parties: Evidence from Close Municipal Elections in Norway. Scandinavian Journal of Economics 120(1): 3-30.
23
Geys, B. and R.J. Sørensen 2016. Revenue scarcity and government outsourcing: Empirical evidence from Norwegian local governments. Public Administration 94(3): 769-788.
Geys, B., Heggedal, T.-R. & Sørensen, R.J. 2017. Are bureaucrats paid like CEOs? Performance compensation and turnover of top civil servants. Journal of Public Economics 152: 47-54.
Grembi, V., Nannicini, T., & Troiano, U. 2016. Do fiscal rules matter? American Economic Journal: Applied Economics, 8(3): 1-30.
Hagen, T. P. & Vabo, S. I. 2005. Political characteristics, institutional procedures and fiscal performance: Panel data analyses of Norwegian local governments, 1991–1998. European Journal of Political Research, 44: 43-64.
Hainmueller, J., Mummolo, J., and Xu, Y. 2019. How Much Should We Trust Estimates from Multiplicative Interaction Models? Simple Tools to Improve Empirical Practice. Political Analysis, 27 (2): 163–192.
Hallerberg, M., Strauch, R. & von Hagen, J. 2007. The design of fiscal rules and forms of governance in European Union countries. European Journal of Political Economy 23(2): 338-359.
Haraldsvik, M., Hopland, A.O., and Nyhus, O.H. 2018. ROBEK – kort vei inn, lang vei ut: Hvorfor forblir noen lenge i registeret og hva gjøres for å komme seg ut? (ROBEK registry – short way in, long way out? Why are some long in the registry and what to do to get out?). SØF-rapport, nr. 03/18.
Hou, Y. & Smith, D.L. 2010. Informal Norms as a Bridge between Formal Rules and Outcomes of Government Financial Operations: Evidence from State Balanced Budget Requirements, Journal of Public Administration Research and Theory 20(3): 655–678.
Jimenez, B.S. 2019. Municipal Government Form and Budget Outcomes: Political Responsiveness, Bureaucratic Insulation, and the Budgetary Solvency of Cities. Journal of Public Administration Research and Theory, forthcoming.
Kontopoulos Y. & Perotti, R. 1998, Fragmented Fiscal Policy, Columbia University, mimeo. Kontopoulos Y. & Perotti, R. 1999, Government Fragmentation and Fiscal Policy Outcomes:
Evidence from OECD Countries, in J.M. Poterba and J. Von Hagen (eds.), Fiscal Institutions and Fiscal Performance (NBER Conference Report), University of Chicago Press, Chicago, 81-102.
Kornai, J. 1986. The soft budget constraint. Kyklos, 39: 3-30. Niskanen, W.A. 1968. The peculiar economics of bureaucracy. American Economic Review
58(2): 293-305. Niskanen, W.A. 1975. Bureaucrats and politicians. Journal of Law and Economics 18(3): 617-
643. Perotti, R. & Kontopoulos, Y. 2002. Fragmented fiscal policy. Journal of Public Economics
86(2): 191-222. Persson, T., & Svensson, L.E. 1989. Why a stubborn conservative would run a deficit: Policy
with time-inconsistent preferences. Quarterly Journal of Economics, 104(2), 325-345. Persson, T., & Tabellini, G. 2003. The Economic Effects of Constitutions: What do the Data
Say? Cambridge: MIT Press. Roubini, N. & Sachs, J. D. 1989. Political and economic determinants of budget deficits in the
industrial democracies. European Economic Review 33(5): 903-933. Teknisk beregningsutvalg for kommunal og fylkeskommunal økonomi (TBU) 2014. Rapport
fra det tekniske beregningsutvalg for kommunal og fylkeskommunal økonomi. Oslo, mai 2014.
24
Tsebelis, G. 2002. Veto players: How political institutions work. Princeton: Princeton University Press.
Vabo, S., 2002. Koordinering og politisk styring. En studie av nye organisasjonsløsninger i norske kommuner. PhD thesis. Department of Political Science, University of Oslo.
Vlaicu, R., Verhoeven, M., Grigoli, F. & Mills, Z. 2014. Multiyear budgets and fiscal performance: Panel data evidence. Journal of Public Economics 111: 79-95.
von Hagen, J. & Harden, I., 1995. Budget processes and commitment to fiscal discipline. European Economic Review 39: 771-779.
Von Hagen J. 2008. Political economy of fiscal institutions. In Weingast, B. & Wittman, D. (eds.), The Oxford Handbook of Political Economy. Oxford, Oxford University pp. 464–478.
Wooldridge, J.M. 2010. Econometric Analysis of Cross Section and Panel Data. Cambridge: MIT Press.