administr ation guide installation and zenoss anal...
TRANSCRIPT
Zenoss AnalyticsInstallation and
Administration GuideRelease 5.0.0
Zenoss, Inc.
www.zenoss.com
2
Zenoss Analytics Installation and Administration Guide
Copyright © 2015 Zenoss, Inc. All rights reserved.
Zenoss and the Zenoss logo are trademarks or registered trademarks of Zenoss, Inc., in the United States and other countries. All other trademarks, logos,and service marks are the property of Zenoss or other third parties. Use of these marks is prohibited without the express written consent of Zenoss, Inc., orthe third-party owner.
TIBCO Jaspersoft is a registered trademark of TIBCO Software, Inc.
Flash is a registered trademark of Adobe Systems Incorporated.
Oracle, the Oracle logo, Java, and MySQL are registered trademarks of the Oracle Corporation and/or its affiliates.
VMware is a registered trademark or trademark of VMware, Inc. in the United States and/or other jurisdictions.
All other companies and products mentioned are trademarks and property of their respective owners.
Part Number: 1100.15.167
Zenoss, Inc.11305 Four Points DriveBldg 1 - Suite 300Austin, Texas 78726
3
Contents
Chapter 1: Introduction...................................................................................4Analytics Architecture.......................................................................................................................................................4
Chapter 2: Installing and Configuring Analytics............................................6Installation Considerations.............................................................................................................................................. 6Required Software and Conditions................................................................................................................................ 6Installing the OpenJDK...................................................................................................................................................8Setting the JAVA_HOME Environment Variable.......................................................................................................8Installing MariaDB............................................................................................................................................................ 9Installing the Analytics Server using an RPM........................................................................................................... 10Installing the Analytics Server in Control Center..................................................................................................... 11Installing the User Defined Function to MariaDB...................................................................................................12Installing the ZenETL ZenPack on the Resource Manager master.......................................................................12Configuring Analytics..................................................................................................................................................... 13Removing an Analytics Installation (RPM)................................................................................................................ 23Removing an Analytics Installation from Control Center.......................................................................................25
Chapter 3: Upgrading to Analytics 5.0.0.......................................................27Prerequisite Tasks............................................................................................................................................................27Exporting the Zenoss Analytics Database................................................................................................................. 27Dropping the Zenoss Analytics Database..................................................................................................................28Saving Existing Data...................................................................................................................................................... 28Removing ZenDS (optional).........................................................................................................................................28Installing the OpenJDK.................................................................................................................................................28Setting the JAVA_HOME Environment Variable.....................................................................................................29Installing MariaDB..........................................................................................................................................................30Upgrading the Analytics Server and Jaspersoft Database........................................................................................31Installing the User Defined Function to MariaDB...................................................................................................32Importing the Reports Database..................................................................................................................................32Installing the ZenETL ZenPack on the Resource Manager master.......................................................................32Adding New Aliases....................................................................................................................................................... 33Starting the Analytics Service....................................................................................................................................... 33
Chapter 4: Working with Analytics............................................................... 34Starting and Stopping the Analytics Server................................................................................................................34Logging in to Analytics..................................................................................................................................................35Creating Batches.............................................................................................................................................................. 37Configuring the Analytics Data Retention Policy..................................................................................................... 40Working with the Analytics Repository...................................................................................................................... 41
Appendix A: Third Party Licenses................................................................58
Appendix B: ERD Diagram for Analytics 5.0.0............................................59
Zenoss Analytics Installation and Administration Guide
4
Introduction 1Zenoss Service Dynamics Analytics ("Analytics") provides enterprise reporting for Resource Manager instances,enabling improved business intelligence and knowledge management. With Analytics, you have access to:
■ Catalog reports that provide insight into your entire infrastructure■ Extensible dashboards that provide operational and executive views■ A robust, ad-hoc reporting feature to facilitate self-management■ A built-in report scheduler■ A wide range of report export formats, including PDF, CSV, Excel, Word, HTML, and JPG.
Analytics reports and features are accessed through an integrated interface. Reports are distributed via email.
Since Jaspersoft provides the back-end technology used to provide the reporting capability, consult the TIBCO™
JasperReports® Server User Guide, Release 6.0 for detailed information about the user interface of Analytics.
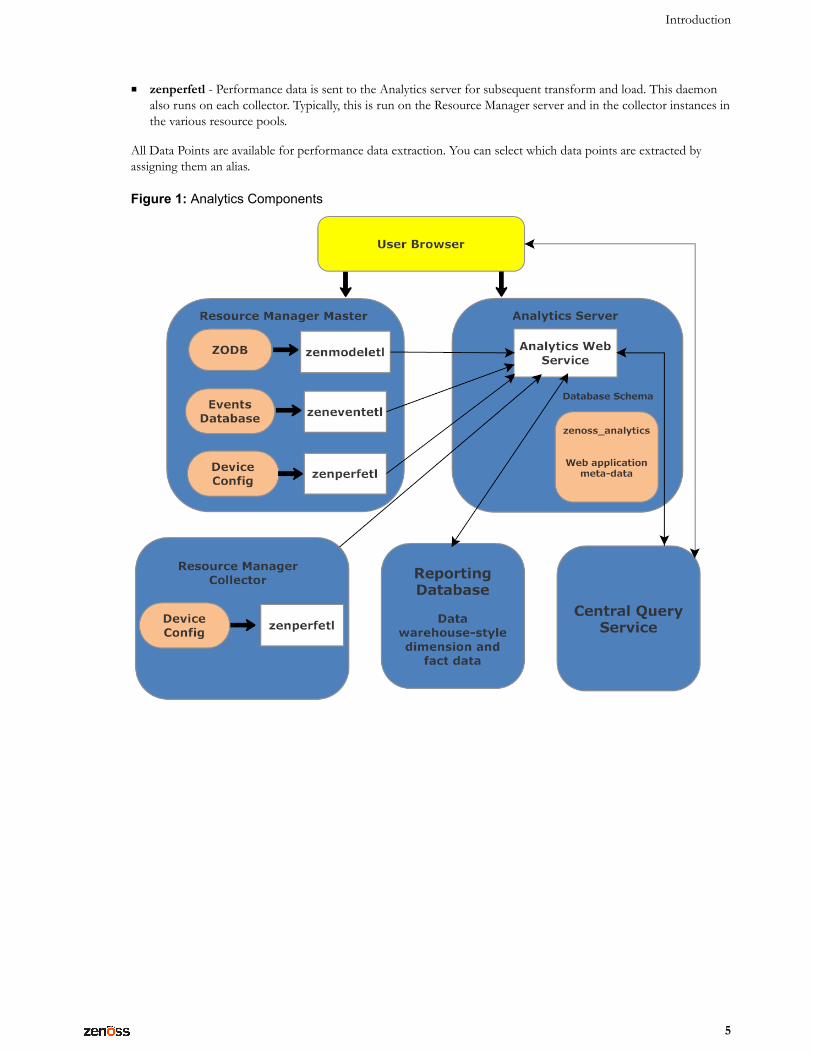
Analytics ArchitectureAnalytics combines extract, transform, and load (ETL) procedures with a data warehouse and reporting tools toprocess report data.
Resource Manager uses three data sources that are key for reporting:
■ Zope object database (ZODB)■ MariaDB event database (EventDB)■ Centralized performance data storage (HBase cluster)
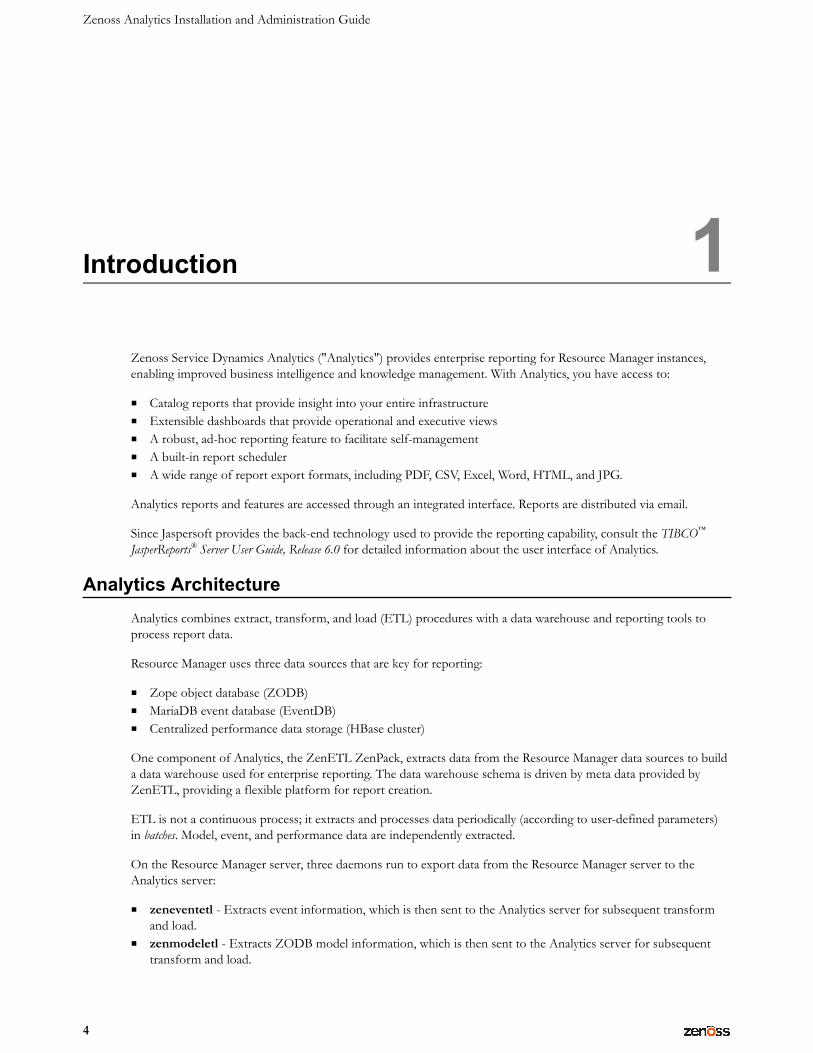
One component of Analytics, the ZenETL ZenPack, extracts data from the Resource Manager data sources to builda data warehouse used for enterprise reporting. The data warehouse schema is driven by meta data provided byZenETL, providing a flexible platform for report creation.
ETL is not a continuous process; it extracts and processes data periodically (according to user-defined parameters)in batches. Model, event, and performance data are independently extracted.
On the Resource Manager server, three daemons run to export data from the Resource Manager server to theAnalytics server:
■ zeneventetl - Extracts event information, which is then sent to the Analytics server for subsequent transformand load.
■ zenmodeletl - Extracts ZODB model information, which is then sent to the Analytics server for subsequenttransform and load.
Introduction
5
■ zenperfetl - Performance data is sent to the Analytics server for subsequent transform and load. This daemonalso runs on each collector. Typically, this is run on the Resource Manager server and in the collector instances inthe various resource pools.
All Data Points are available for performance data extraction. You can select which data points are extracted byassigning them an alias.
Figure 1: Analytics Components
Zenoss Analytics Installation and Administration Guide
6
Installing and Configuring Analytics 2The following sections provide information and procedures to help you install and set up Analytics. If you areupgrading Analytics from version 4.4.0 to version 5.0.0, skip the installation instructions in this chapter and proceedto Upgrading to Analytics 5.0.0 on page 27.
■ Installation Considerations■ Prerequisite Tasks and Conditions■ Installing the OpenJDK■ Installing MariaDB■ Installing the Analytics Server■ Installing the ZenETL ZenPack on Resource Manager■ Configuring Analytics■ Removing an Analytics Installation
Installation ConsiderationsThe Analytics system creates two databases:
■ zenoss_analytics (Analytics database) - Stores report design, execution information, and results of thereports, including PDFs. You can also access previous reports here.
■ reporting - Warehouses all data retrieved from Resource Manager. Also referred to as the "etl database".
The reporting database can become large, and load can be significant. For large-scale installations, Zenossrecommends you install the Analytics database and the Analytics application on one machine, and the reportingdatabase on a separate machine. All of the Analytics servers should be separate from the Resource Managerserver. The Analytics application can be installed and managed in two different ways:
1 RPM installation on a separate server2 Installation in Zenoss Control Center
Note Regardless of the configuration you choose for the Analytics server, Zenoss recommends that thereporting database be on a separate server that is maintained outside of Zenoss Control Center.
Required Software and Conditions■ To run Analytics, you must install the following on the Analytics server:
Installing and Configuring Analytics
7
■ OpenJDK 7, this is different than the Java Runtime Environment (JRE) that was installed as part of theResource Manager installation.
Note Do not use Java SE 7 or SE 8. They are not compatible with this version of Analytics.
■ Analytics requires that UID 1337 be available. You can verify its availability with the command:
getent passwd 1337
■ The Analytics server and any associated Resource Manager instances must be running Network Time Protocol(NTP) so that their clocks remain synchronized. (For more information about NTP, visit http://www.ntp.org/.)
■ Ensure that hostname resolves to the loopback interface locally by editing /etc/hosts to include an entry forthe hostname of the Analytics application server after the listing for 127.0.0.1.
Compatibility and Support
■ Analytics 5.0.0 is compatible with Service Dynamics 4.1.1 + RPS and later versions.■ You must use matched versions (first 3 digits of version number) of Analytics and the ZenETL ZenPack. For
example, you cannot use ZenETL 4.4.0 with Analytics 5.0.0.■ For new installations, you must be using a 64-bit system running RHEL 7/CentOS 7.■ The zenperfetl daemon that runs on remote collectors makes Web services calls to the Analytics server, and
thus must be able to access the server's HTTP address.■ The system is not compatible with Security-Enhanced Linux (SELinux) in enforcing mode. You must disable
SELinux to run Analytics.
To disable SELinux:
1 Determine whether SELinux is installed by running the following command:
test -f /etc/selinux/config && grep '^SELINUX=' /etc/selinux/config
If the preceding commands return a result, SELinux is installed.2 Set the operating mode to disabled, and confirm the setting.
EXT=$(date +"%j-%H%M%S")sudo sed -i.${EXT} -e 's/^SELINUX=.*/SELINUX=disabled/g' \ /etc/selinux/config && \grep '^SELINUX=' /etc/selinux/config
You will need to reboot to complete the configuration change.
For more information about SELinux, browse to http://en.wikipedia.org/wiki/SELinux, or to the SELinux homepage at http://www.nsa.gov/research/selinux/index.shtml.
Recommendations
■ You should install Analytics and its prerequisites on a server separate from the Resource Manager server.■ Analytics is a data warehouse application. Like other database applications, it benefits from fast disc subsystems,
fast processors, and abundant RAM.
Zenoss recommends that you meet these minimum system requirements when running Analytics:
■ 8 core processor■ 8GB RAM
Zenoss Analytics Installation and Administration Guide
8
■ 500GB storage
Open Network Ports
The Analytics system comprises multiple components. Communication needs for each of these components differsdepending on how you have installed your system (on a single box or multiple boxes, or with or without distributedcollectors).
The following table lists Analytics pieces that typically must communicate, and the default network ports that shouldbe open for communication.
From To Default Port Numbers
Analytics Analytics database server 3306
Analytics Resource Manager 8080
Resource Manager Analytics 7070
Analytics Web Users Analytics 7070
zenperfetl (on each remotecollector)
Analytics application server 7070
Installing the OpenJDKAnalytics requires the OpenJDK 7 Development package to be installed. Analytics cannot be installed when just theJRE is installed.
1 Prior to installing the OpenJDK 7 Development package, you should remove all other versions of Java that areon the system:
yum -y remove $(rpm -qa | egrep -i '(jdk|jre|java)')
1 Log in to the Analytics server as root, or as a user with superuser privileges2 Install the OpenJDK 7.
yum -y install java-1.7.0-openjdk-devel
3 Execute the following command and choose the OpenJDK 7 selection:
update-alternative --config java
4 Verify the install succeeded.
java -version
If the command returns output similar to the following, continue to the next procedure.
java version "1.7.0_75"OpenJDK Runtime Environment (rhel-2.5.4.7.el7_1.x86_64 u75-b13)OpenJDK 64-Bit Server VM (build 24.75-b04, mixed mode)
Setting the JAVA_HOME Environment Variable
After installing the OpenJDK, you must set $JAVA_HOME for the root user.
Installing and Configuring Analytics
9
1 Log in to the Analytics server as root, or as a user with superuser privileges2 Locate and note the path to your OpenJDK directory. Typically, this is /usr/lib/jvm/java-1.7.0-
openjdk-VersionNumber.3 Navigate to the /etc/default directory.
echo $JAVA_HOME
4 Open the zenoss_analytics file in an editor.
vi zenoss_analytics
5 Edit the JAVA_HOME line in zenoss_analytics to point to your OpenJDK location.
JAVA_HOME=/usr/lib/jvm/java-1.7.0-openjdk-VersionNumber
6 Test the new path with the following command:
echo $JAVA_HOME
Installing MariaDBBefore installing MariaDB on systems running Red Hat Enterprise Linux (RHEL), install the Perl DatabaseInterface Module (DBI) with the following command as the root user:
yum -y install perl-DBI
Follow these steps to install MariaDB 10 on the Analytics Server. The Zenoss DataStore (ZenDS) is no longer usedin Analytics 5.
1 Create a custom MariaDB YUM repository. The following example shows information for a CentOS 7installation. For more information, see https://downloads.mariadb.org/mariadb/repositoriesa As the root user, navigate to the /etc/yum.repos.d directory.
cd /etc/yum.repos.d
b Create a file called MariaDB.repo and enter the following text into the file.
# MariaDB 10.0 CentOS repository list#http://mariadb.org/mariadb/repositories/[mariadb]name = MariaDBbaseurl = http://yum.mariadb.org/10.0/centos7-amd64gpgkey=https://yum.mariadb.org/RPM-GPG-KEY-MariaDBgpgcheck=1
2 When the MariaDB.repo file is in place, install the MariaDB server:
sudo yum -y install mariadb-server
Note If you haven't already accepted the MariaDB GPG key, you will be prompted to do so.
3 Add the following configuration settings:
echo "[mysqld]" >> /etc/my.cnf
Zenoss Analytics Installation and Administration Guide
10
echo "table_open_cache=16K" >> /etc/my.cnfecho "table_definition_cache=16K" >> /etc/my.cnfecho "tmp_table_size=2G" >> /etc/my.cnfecho "max_heap_table_size=2G" >> /etc/my.cnfecho "join_buffer_size=512K" >> /etc/my.cnfecho "open_files_limit=200000" >> /etc/my.cnfecho "tmpdir=/tmp" >> /etc/my.cnfecho "wait_timeout=86400" >> /etc/my.cnfecho "innodb_adaptive_hash_index=OFF" >> /etc/my.cnfecho "innodb_buffer_pool_size=6G" >> /etc/my.cnfecho "innodb_log_file_size=1892M" >> /etc/my.cnfecho "innodb_log_buffer_size=128M" >> /etc/my.cnf
Note The values for the innodb settings should reflect your system. Set the innodb_buffer_pool_size tobe 80 percent of the total memory on a standalone data warehouse server or 50 percent of memory if theanalytics server and database are on the same server. The innodb_log_file_size should be 25 percent of theinnodb_buffer_pool_size value.
4 Start the MariaDB server:
/etc/init.d/mysql start
5 Set MariaDB to start on boot:
chkconfig mysql on
6 If your Analytics application and the Analytics database are on the same machine, then you are done with theMariaDB install. However, if you used the recommended configuration of a remote database, you need to enableremote access so that the ana_mariadb container can connect to it. Enter the following as the root user:
grant all on *.* to 'root'@'%' with grant option;grant all on *.* to 'reporting'@'%' with grant option;flush privileges;
Installing the Analytics Server using an RPMThe Analytics server can be installed using an .rpm file on a separate server or can be installed in the ControlCenter using an application template.
To install the Analytics server using an .rpm file:
1 As the root user, enter the following command based on the RPM version you are installing:
rpm -ivh zenoss_analytics-5.0.0-Version.rpm
2 Modify the database connection setting in the /etc/zenoss_analytics/zenoss_analytics.conffile to point to the desired database server or servers. For performance reasons, it is recommended to have yourdatabase server(s) on a different server than the Analytics server.
etl.jdbc.hostname=<remote database server>
Note Be sure to modify the admin account information to match the account or accounts you created whensetting up the database.
Installing and Configuring Analytics
11
3 Change to the zenoss user:
su - zenoss
4 Install the database schema with the command:
/opt/zenoss_analytics/bin/upgrade_db.py
5 Change to the root user:
su - root
6 Enable chkconfig for the Analytics service:
chkconfig zenoss_analytics on
7 Start the Analytics service:
service zenoss_analytics start
Installing the Analytics Server in Control CenterThis procedure requires:
■ A fully-installed deployment of Resource Manager 5.0.x, or a more recent release■ Permission to download the Analytics image from Docker Hub■ Permission to download ZenPacks and files from the Zenoss Support site
To install the Analytics server in Control Center:
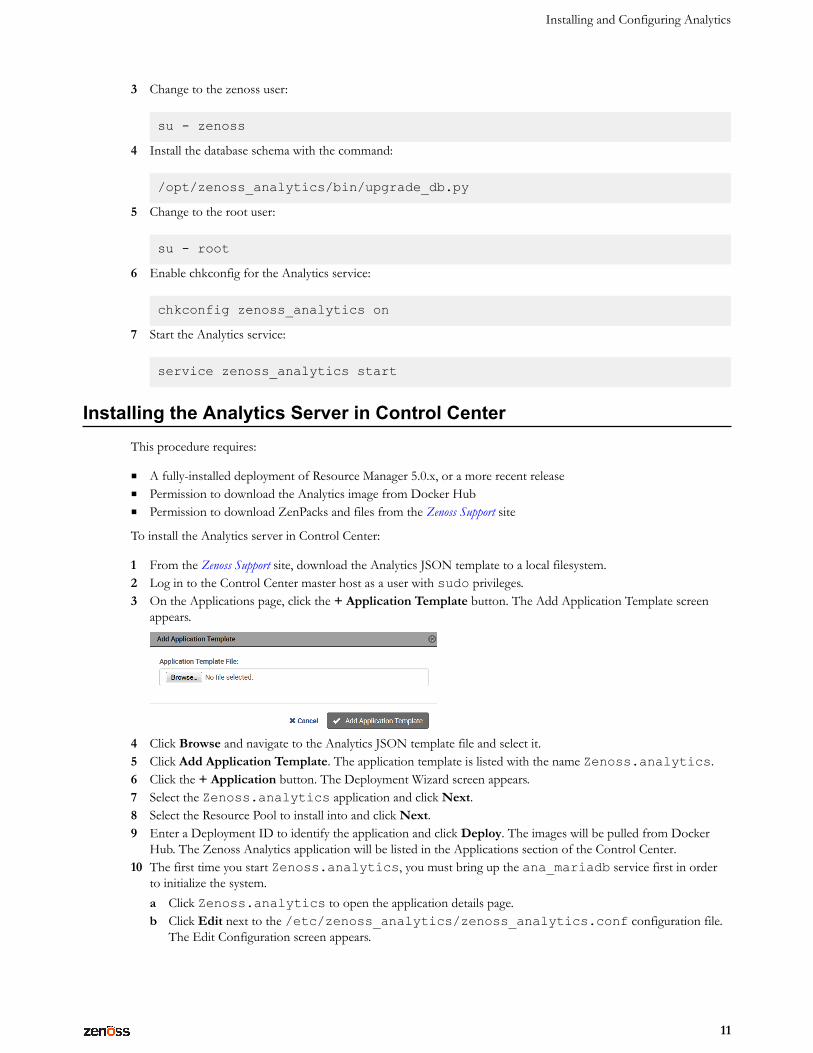
1 From the Zenoss Support site, download the Analytics JSON template to a local filesystem.2 Log in to the Control Center master host as a user with sudo privileges.3 On the Applications page, click the + Application Template button. The Add Application Template screen
appears.
4 Click Browse and navigate to the Analytics JSON template file and select it.5 Click Add Application Template. The application template is listed with the name Zenoss.analytics.6 Click the + Application button. The Deployment Wizard screen appears.7 Select the Zenoss.analytics application and click Next.8 Select the Resource Pool to install into and click Next.9 Enter a Deployment ID to identify the application and click Deploy. The images will be pulled from Docker
Hub. The Zenoss Analytics application will be listed in the Applications section of the Control Center.10 The first time you start Zenoss.analytics, you must bring up the ana_mariadb service first in order
to initialize the system.a Click Zenoss.analytics to open the application details page.b Click Edit next to the /etc/zenoss_analytics/zenoss_analytics.conf configuration file.
The Edit Configuration screen appears.
Zenoss Analytics Installation and Administration Guide
12
c Edit the etl.jdbc.hostname to point to the remote database server or servers. For performancereasons, it is recommended to have your database server(s) on a different server than the Analytics server.Click Save.
d Under the Services section, click ana_mariadb to open the MariaDB database server details page.e Click Edit next to the /etc/zenoss_analytics/zenoss_analytics.conf configuration file.
The Edit Configuration screen appears.f Edit the etl.jdbc.hostname to point to the remote database server or servers. For performance
reasons, it is recommended to have your database server(s) on a different server than the Analytics server.Click Save.
g Under the Services section, click ana_reports to open the Reporting database server details page.h Click Edit next to the /etc/zenoss_analytics/zenoss_analytics.conf configuration file.
The Edit Configuration screen appears.i Edit the etl.jdbc.hostname to point to the remote database server or servers. For performance
reasons, it is recommended to have your database server(s) on a different server than the Analytics server.Click Save.
j Navigate back to the Zenoss.analytics application details page. In the Services section, click Start forthe ana_mariadb service. Wait until the service is running (3-5 minutes) before continuing this procedure.
k Click Start for the Zenoss.analytics application and choose the option to start the service only. DoNOT select the option to start service and all children. Wait 8-10 minutes until the application is runningbefore continuing this procedure.
l In the Services section, click Start for the ana_reports service.For any future restarts of Zenoss.analytics you only have to stop and start the Zenoss.analyticsapplication selecting the option to start the service and all children.
Installing the User Defined Function to MariaDBBefore installing the user defined function, be certain that you have already installed MariaDB on the database serverand Analytics on the application server.
1 As the root user, login to the Analytics application server and locate the following file:
/usr/lib64/mysql/plugin/zenoss_percentile.so
2 Copy zenoss_percentile.so to the same directory on the MariaDB database server (/usr/lib64/mysql/plugin/.
3 Change to the zenoss user on the Analytics application server:
su - zenoss
4 Execute the following script:
/opt/zenoss_analytics/bin/setup_zenoss_extensions install
Installing the ZenETL ZenPack on the Resource Manager masterAfter installing the Analytics server, install the ZenETL ZenPack (ZenPacks.zenoss.ZenETL-Version-py2.7.egg) onthe Resource Manager master. See the corresponding directions below:
To install the ZenETL ZenPack on the Resource Manager master:
1 Log in to the Control Center browser interface.
Installing and Configuring Analytics
13
2 In the Applications table, identify the name of the Resource Manager instance to modify.3 Stop the instance, and verify its subservices are stopped.
a In the Actions column of the Applications table, click Stop.
b In the Stop Services dialog, click Stop Services.c In the Application column of the Applications table, click the name of the stopped instance, and then
scroll down to the Services table.4 Create a snapshot.
a Log in to the Control Center master host as a user with Control Center CLI privileges.b Create a snapshot.
serviced service snapshot Zenoss.resmgr
The serviced command returns the ID of the new snapshot on completion.5 Restart required services.
■ ZooKeeper■ Impact (if Zenoss Service Impact is installed)■ The modelling and event database service or services:
■ Resource Manager 5.0.0: MariaDB■ Resource Manager 5.0.1 or more recent: mariadb-events and mariadb-model
■ memcached■ RabbitMQ■ redis■ zencatalogservice■ zeneventserver■ Zope
Note In the Services table, the Failing icon (a red circle with an exclamation point) in the Status columnrepresents the cumulative result of one or more customized health checks. To view the status of individual healthchecks, move the pointer over the icon, which displays a pop-up.
When the Failing icon is present, a service is unable to support the normal operations of Resource Manager. Forthis maintenance task, the Zope health checks includes failing checks of zproxy_answering, which doesnot affect this procedure.
6 Change directory to the directory in which the ZenPack egg file is located.For example:
cd /tmp/zenpack
7 Install the ZenPack.
serviced service run zope zenpack install ZenPack-File.egg
The daemons a ZenPack provides (if any) are packaged in Docker containers, and installed as child services ofthe current instance of Resource Manager.
8 In the Control Center browser interface, scroll up to the top of the page, and then restart Resource Manager.
Configuring AnalyticsTo configure Analytics, you must:
Zenoss Analytics Installation and Administration Guide
14
■ Configure the connection to the Analytics server■ Configure zeneventserver settings■ (Optionally) Configure Database credentials■ (Optionally) Configure additional Resource Manager data points to send to Analytics■ (Optionally) Configure SSL communication■ Configure email services
Configure the Connection to the Analytics ServerFollow these steps to configure Resource Manager to connect to the Analytics server:
1 From the Resource Manager interface navigation bar, select Reports > Configuration.The Analytics configuration page appears with the currently scheduled report jobs.
2 Click the gear icon in the lower-left corner to display the Configure Analytics Base URLs page.3 In the Internal URLs area, enter the URLs that Resource Manager and Analytics will use to communicate
directly:
■ Analytics - If installed by RPM, enter the fully qualified domain name (including port number) for theAnalytics server. The default port number is 7070. If installed by Control Center, enter the ETL URL, e.g.,https://etl.<your_server>.
■ Resource Manager - Enter the fully qualified domain name (including port number) for the ResourceManager server. (By default, this information is pre-populated.)
Note If your Resource Manager URLs are not displayed, you may need to shift-refresh your browser to dropthe cache. Do not proceed unless the URLs are displayed correctly.
4 In the External URLs area, enter the links that will be displayed to users in each of the applications:
■ Analytics - If installed by RPM, enter the complete URL, including port number, to Analytics. Thedefault port number is 7070. If installed by Control Center, enter the Reports URL, e.g., https://reports.<your_server>.
■ Resource Manager - Enter the complete URL, including port number, to Resource Manager. (By defaultthis information is pre-populated.)
5 In the Query Service area, enter the complete URL of the virtual host and the access credentials to the CentralQuery service of this Resource Manager instance. The access credentials should be as a user with Manager orhigher privileges. It cannot be the admin account.
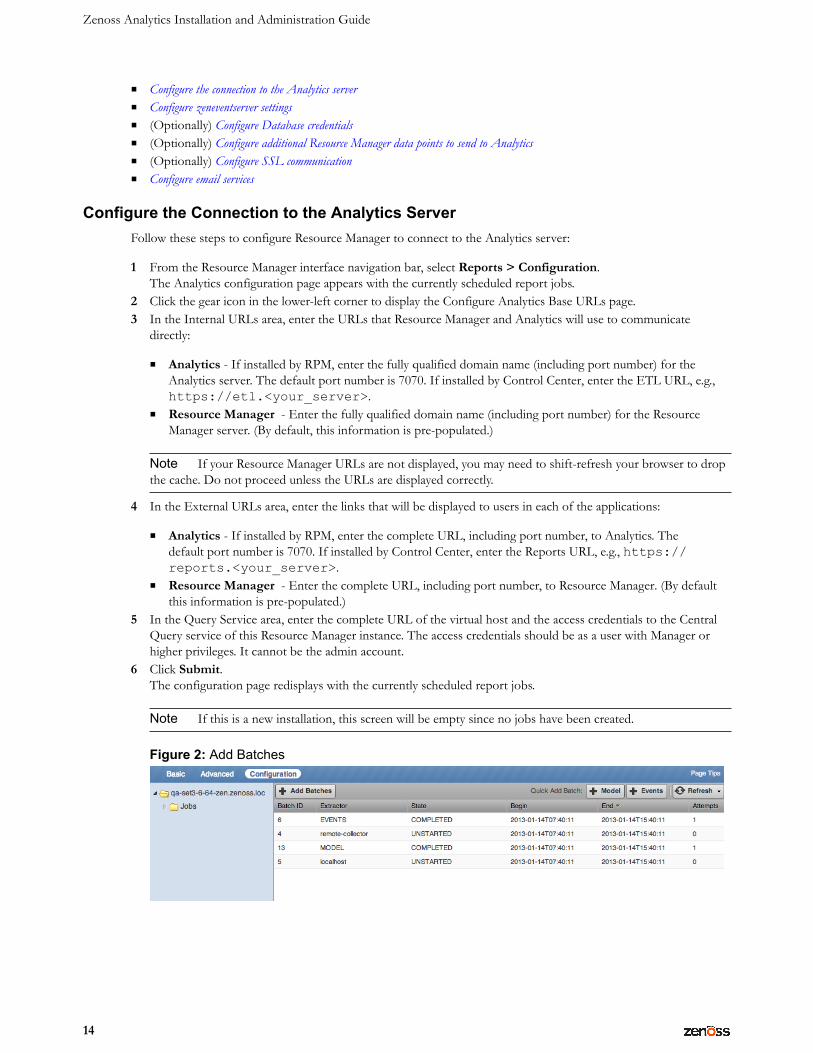
6 Click Submit.The configuration page redisplays with the currently scheduled report jobs.
Note If this is a new installation, this screen will be empty since no jobs have been created.
Figure 2: Add Batches
Installing and Configuring Analytics
15
Configure zeneventserver Settings
Resource Manager (Version 4.1 and higher) is configured to store only one day of event occurrences. If eventextraction falls behind (meaning event batches are older than 24 hours), then event extraction will not properlyextract event times for those batches.
You can increase the number of days of event history that can be extracted, from the Resource Manager interface:
1 Select Advanced, and then select Events from the left panel.The Event Configuration page appears.
2 Increase the value of Event Time Purge Interval (in days), up to 7 days.3 Click Save.
Note If you increase the Event Time Purge Interval value, then you must also increase the number of filedescriptors for your Resource Manager instance (see next set of instructions).
To increase the number of file descriptors, perform the following on the Analytics database server:
1 As the root user, view the current open files:
lsof | wc -l
2 Check the max open files by entering the following command:
cat /proc/sys/fs/file-maxulimit -Hnulimit -Sn
3 Change the max open files temp by entering the following command:
sysctl -w fs.file-max=$(($(cat /proc/sys/fs/file-max) + 25000))
4 Add the following lines to the /etc/security/limits.conf file:
root hard nofile 999999root soft nofile 999999zenoss hard nofile 999999zenoss soft nofile 999999
Configure Database Credentials
When Analytics is installed it configures a JDBC data source for the reporting database. If you have a splitapplication and database install, you need to change the database settings in Analytics. Even if you do not have asplit installation, it is a good idea to test the database connection.
To change database settings in Analytics:
1 Log in to the Resource Manager using your Resource Manager user name and password. You must haveManager or ZenManager privileges to perform this task in Analytics. For more information about Roles andUser Permissions, see the "Managing Users" chapter in Resource Manager Administration.
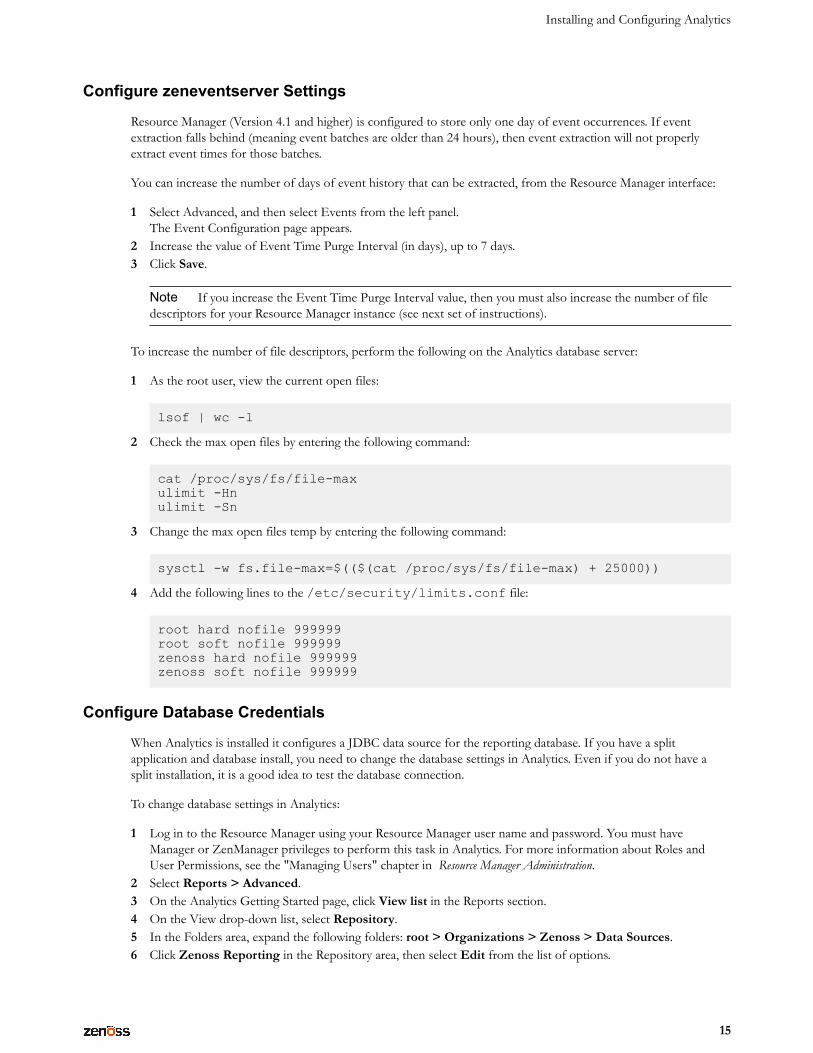
2 Select Reports > Advanced.3 On the Analytics Getting Started page, click View list in the Reports section.4 On the View drop-down list, select Repository.5 In the Folders area, expand the following folders: root > Organizations > Zenoss > Data Sources.6 Click Zenoss Reporting in the Repository area, then select Edit from the list of options.
Zenoss Analytics Installation and Administration Guide
16
The Edit Data Source window is displayed.
Figure 3: Edit Data Source window
7 After editing, click Test connection to verify the changes are valid.8 Click Save.
Export Data Point Data
This section provides information about how Analytics and Resource Manager share performance data, and how tomanually modify data points.
In order for performance data to be exported for use in the Analytics system, you must create aliases to the datapoints on the monitoring templates. For more information about templates, see Zenoss Resource Manager AdministrationGuide.
Resource Manager data points represent raw, collected metrics. For example, view the /Server/Linux monitoringtemplate. The ssCpuIdle data point is collected by the ssCpuIdle data source. ssCpuIdle represents the percentage ofidle time for all CPUs on this box.
Note Periods are not allowed in metric names, since the metric names are used to name the database tables.
Installing and Configuring Analytics
17
Edit the data point, and you can examine its defined aliases. The cpu__pct alias represents the percentage of CPUused by the box. The alias value is calculated by using the data point and a reverse Polish notation (RPN) expression.Aliases are used to normalize raw data point values across data point types. While it may seem like a good idea tocollect lots of data by adding many aliases, you must balance the need for data with the load that it would generateon the system.
Note To avoid issues with percentile and projections, all aliases should attempt to be 31 characters or less. Noperiods are allowed in alias names.
You can provide a formula to be used during extraction of data. This allows you to convert data points withdifferent units to the same units during extraction. For example, if you are monitoring disk space on a Unix system(bytes) and a Windows system (bits), you can use a formula to convert both to kilobytes and have them use the samealias.
There are two ways you can add aliases to a data point, which are in these topics:
■ Running the chkaliases script■ Manually modifying the data points on the Resource Manager
Running the chkaliases script
To add or remove aliases, run the chkaliases.zendmd script contained in the ZenETL ZenPack. This scriptprocesses the aliases.dsv file, which contains alias definitions. Each useful line of the aliases.dsv fileshould contain an alias definition consisting of the following five values that are pipe-delimited:
device class|template|datapoint|alias|rpn
To run the chkaliases.zendmd script: can be run on the command-line as the zenoss user. The followinglists all the possible arguments and options:
1 Log in to the Resource Manager server as the zenoss user:
su - zenoss
2 Navigate to the directory where the script resides by entering the following command (using the actual versionnumber):
cd $ZENHOME/ZenPacks/ZenPacks.zenoss.ZenETL-Version-py2.7.egg/ZenPacks/zenoss/ZenETL/etc
3 Run the script using the following command to see what would be changed:
zendmd --script=../bin/chkaliases.zendmd [add | remove]
The output of the script produces some codes. Codes in the first column indicate the script is adding (+),modifying the RPN (R), or removing (-) an alias. Codes in the second column indicate an inability to find adevice class (c), template (t), datapoint (d), or alias (a). It could also indicate an unwillingness to remove an aliasbecause its defined RPN does not match (r). The (a) and (r) codes only occur during a remove operation.
The initial aliases.dsv file contains alias definitions for the following, expressed as percentages:a Device Level CPU usage (cpu__pct)b Memory utilization (mem__pct)c IP interface component input (in__pct)d IP interface component output (out__pct)
Zenoss Analytics Installation and Administration Guide
18
e File system utilization (fs__pct)
Modify the aliases.dsv file (located in the /etc directory under the ZenETL ZenPack) as needed untilthe changes are satisfactory when you re-run the script.
4 Once the output is satisfactory, re-run the script using the --commit option:
zendmd --script=../bin/chkaliases.zendmd [add | remove] --commit
On the /Server/Windows monitoring template, open the ProcessorTotalProcessorTime data point in theProcessorTotalProcessorTime data source. You will see that an alias "cpu__pct" is defined with no RPN formula. Inthis case, the raw data point already represents the quantity we want ("Percentage of Consumed CPU Time"). Thealias, cpu__pct, allows users to compare two different data sources.
The same principle applies to other data points. Some devices give network bandwidth by using kilobytes; others usemegabits. Aliases provide a method to normalize these data points to a common denominator.
Analytics only extracts "aliases" from Resource Manager. A raw data point is never exported. To export aperformance data point to Analytics, examine the data source/data point responsible for the raw value, and ensurethat it has an alias that maps to an appropriate alias name whose value is properly normalized. Alias names aremapped to the meta_metric table in Analytics. (In previous versions, an alias would map to a fct_[alias] table; thismapping is now deprecated.) All performance data is now logically mapped to raw_v2_% and then to hourly_%and daily_% tables. These tables have a column named metric_key. The table meta_metric provides the lookup for aspecific performance metric.
SELECT *FROM raw_v2_cpu__pctlimit 5;
This query will provide all the performance data for the cpu__pct metric. The underlying data is stored in raw_%, hourly_% and daily_% tables. These tables should not be used directly, however if you decide to query againstthe raw_v2_% table, be aware that these tables are very big and you should be sure to include the device key, thecomponent key, and the fact time stamp in your query whenever possible to fully leverage the available index. If themetric is for a device (no component included), the component key is 0.
With respect to event data points, all events are brought over to Analytics and are stored in the fct_event andfct_event_time tables.
Manually Modifying Data Points on the Resource ManagerTo export data point data from a Resource Manager monitoring template, you can manually modify each data point.
1 From the Resource Manager interface navigation bar, select Advanced > Monitoring Templates > desiredmonitoring template.
2 In the Data Sources area, expand the data source to see the associated data points.3 Double-click the desired data point.
The Edit Data Point dialog appears.
Installing and Configuring Analytics
19
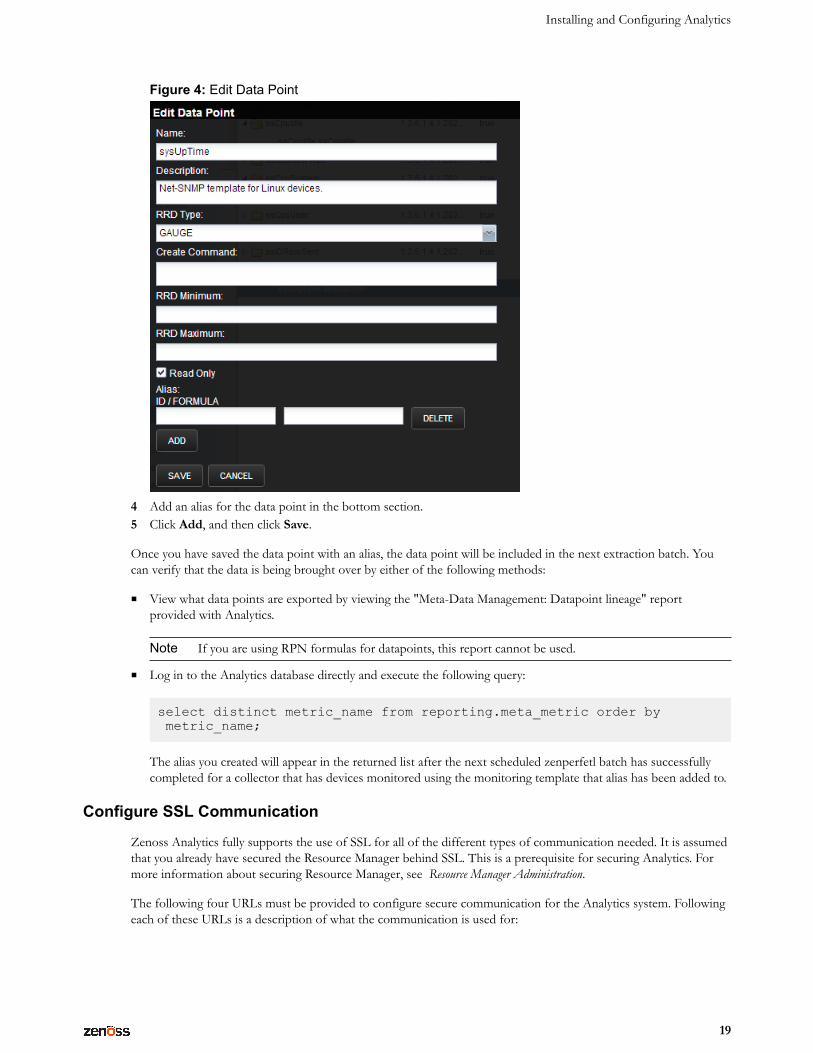
Figure 4: Edit Data Point
4 Add an alias for the data point in the bottom section.5 Click Add, and then click Save.
Once you have saved the data point with an alias, the data point will be included in the next extraction batch. Youcan verify that the data is being brought over by either of the following methods:
■ View what data points are exported by viewing the "Meta-Data Management: Datapoint lineage" reportprovided with Analytics.
Note If you are using RPN formulas for datapoints, this report cannot be used.
■ Log in to the Analytics database directly and execute the following query:
select distinct metric_name from reporting.meta_metric order by metric_name;
The alias you created will appear in the returned list after the next scheduled zenperfetl batch has successfullycompleted for a collector that has devices monitored using the monitoring template that alias has been added to.
Configure SSL Communication
Zenoss Analytics fully supports the use of SSL for all of the different types of communication needed. It is assumedthat you already have secured the Resource Manager behind SSL. This is a prerequisite for securing Analytics. Formore information about securing Resource Manager, see Resource Manager Administration.
The following four URLs must be provided to configure secure communication for the Analytics system. Followingeach of these URLs is a description of what the communication is used for:
Zenoss Analytics Installation and Administration Guide
20
■ Internal Analytics server address
■ Resource Manager to call web service on the Analytics server to pull status of batches and scheduled batches■ Zenmodeletl and zeneventetl daemons on Resource Manager to call web services on the Analytics server to
work with batches and upload data files by HTTP put.■ Zenperfetl daemon on each collector to call web services on the Analytics server to work with batches and
upload data files by HTTP put.■ Internal Resource Manager server address
■ Analytics server to phone home to Resource Manager and authenticate and authorize a user.■ External Analytics server address
■ When the user logs into the Resource Manager web interface, the same login information is sent to theAnalytics server. The user's password is passed in plain text if not using SSL.
■ When the user clicks on Reports > Advanced on the Resource Manager web interface, the user is redirectedto the address specified.
■ External Resource Manager server address
■ The Analytics server uses this to make links in reports that the user can click through to a device on theResource Manager.
Install Apache and SSL on Analytics Server
The following procedure will install Apache and mod_ssl and set it to use a self-signed SSL certificate. You maychoose to purchase a certificate signed by a third-party Certificate Authority or to generate your own certificate.
1 Log in to the Analytics server as the root user, or as a user with superuser privileges.2 Install Apache.
yum install httpd
3 Install Mod SSL for Apache.
yum install mod_ssl
Note If the installation of mod_ssl fails, check to see if there is an earlier version of open_ssl on the systemthat is being used by other packages. If this is the case, perform a yum upgrade to update the rest of thesystem and to bring in the correct version of open_ssl.
4 Add Apache to automatically start at the server start.
chkconfig --levels 235 httpd on
5 Start Apache.
service httpd start
6 Check your configuration by visiting both http://yourserver.com/ and https://yourserver.com/.
Remove "Pragma" Headers
If you are supporting Internet Explorer 8 (IE8), you need to strip out the "Pragma" statements from the header ofthe HTTP files. Perform the following steps:
1 Log in to the Analytics server as the root user, or as a user with superuser privileges.
Installing and Configuring Analytics
21
2 Navigate to the following Apache configuration folder.
cd /etc/httpd/conf
3 Make a backup of the httpd.conf file.
cp httpd.conf original_httpd.conf_original
4 Open httpd.conf in an editor.
vi httpd.conf
5 Add the following line towards the top of the file.
Header unset Pragma
6 Save the file and exit the editor.7 Restart Apache.
service httpd restart
Configure Apache Proxy and Rewrite
Perform the following steps to edit the ssl.conf file to add an internal proxy rule for Apache to proxy anyrequest to the Analytics server and to turn on the Rewrite Engine:
1 Log in to the Analytics server as the root user, or as a user with superuser privileges.2 Navigate to the following Apache configuration folder.
cd /etc/httpd/conf.d
3 Make a backup of the ssl.conf file.
cp ssl.conf original_ssl.conf_original
4 Open ssl.conf in an editor.
vi ssl.conf
5 The last line of the file should be the closing tag </VirtualHost> which is the closing to the<VirtualHost_default_:443> tag. Add the following text just above the closing </VirtualHost> tag:
#Internal proxy rules instructing Apache to proxy any request to the #Analytics server and data warehouse on 7070ProxyPass /reports http://127.0.0.1:7070/reportsProxyPassReverse /reports http://127.0.0.1:7070/reportsProxyPass /etl http://127.0.0.1:7070/etlProxyPassReverse /etl http://127.0.0.1:7070/etl#Turn on the RewriteEngineRewriteEngine On#Redirect any just / over to /reportsRewriteRule ^/+$ https://%{SERVER_NAME}:443/reports/ [R]
6 Save and close the ssl.conf file.
Zenoss Analytics Installation and Administration Guide
22
7 Restart Apache.
service httpd restart
Lock Tomcat to Localhost Only
The following steps should only be performed to lock down the Tomcat used by Analytics at the software level. Analternate solution is to simply close port 7070 altogether via firewall configuration.
1 Log in to the Analytics server as the root user, or as a user with superuser privileges.2 Navigate to the following configuration folder.
cd /opt/zenoss_analytics/conf
3 Make a backup of the server.xml file.
cp server.xml original_server.xml_original
4 Open server.xml in an editor.
vi server.xml
5 Locate the following section in the file.
<Connector port="7070" protocol="HTTP/1.1"connectionTimeout="20000"redirectPort="8443"/>
6 Add in address="127.0.0.1" so that the section looks like the following:
<Connector port="7070" address="127.0.0.1" protocol="HTTP/1.1"connectionTimeout="20000"redirectPort="8443"/>
7 Save and close the file.8 Restart Tomcat to pick up the changes.
service zenoss_analytics stopservice zenoss_analytics start
Modifications to Resource Manager
Perform the following on the Resource Manager server to set the necessary HTTPS URLs:
1 Ensure that you have enabled HTTPS support for your Resource Manager instance. For more information, seethe "Enabling HTTPS Support" section in Resource Manager Administration.
2 Log in to the Resource Manager web interface as a user with Administrator privileges.3 Navigate to Reports > Configuration.
Note If you have previously configured the 5 URLs for Analytics, you will see an error message at the top ofthe screen indicating that the system cannot connect to the Analytics server. This is expected behavior. Click thegear icon in the lower-left corner to open the configuration page again.
4 Modify the following 4 URLs with the values indicated:a Internal Analytics: HTTPS URL, including port (443), of the Analytics server.
Installing and Configuring Analytics
23
b Internal Zenoss: HTTPS URL, including port (443), of the Resource Manager server.c External Analytics: HTTPS URL, including port (443), of the Analytics server.d External Zenoss: HTTPS URL, including port (443), of the Resource Manager server.e Query Service: HTTPS URL, including port (443), of the Central Query service for this Resource Manager
instance.5 Submit the form to save the settings.6 Restart the zenmodeletl, zeneventetl, and zenperfetl daemons on the Resource Manager server so that they
receive the new settings.
Configure Email Services on the Analytics ServerIf you want to send the output of scheduled reports as email attachments, you must configure email services. To dothis:
1 On the Analytics server, edit the /opt/zenoss_analytics/webapps/zenoss-analytics/WEB-INF/js.quartz.properties file.
2 Change the "host" and "from" values in the file.
report.scheduler.mail.sender.host=localhost report.scheduler.mail.sender.username= report.scheduler.mail.sender.password= report.scheduler.mail.sender.from=zenoss@localhost report.scheduler.mail.sender.protocol=smtp report.scheduler.mail.sender.port=25
3 Save the file.4 As the root user, restart Analytics for the changes to take effect:
service zenoss_analytics restart
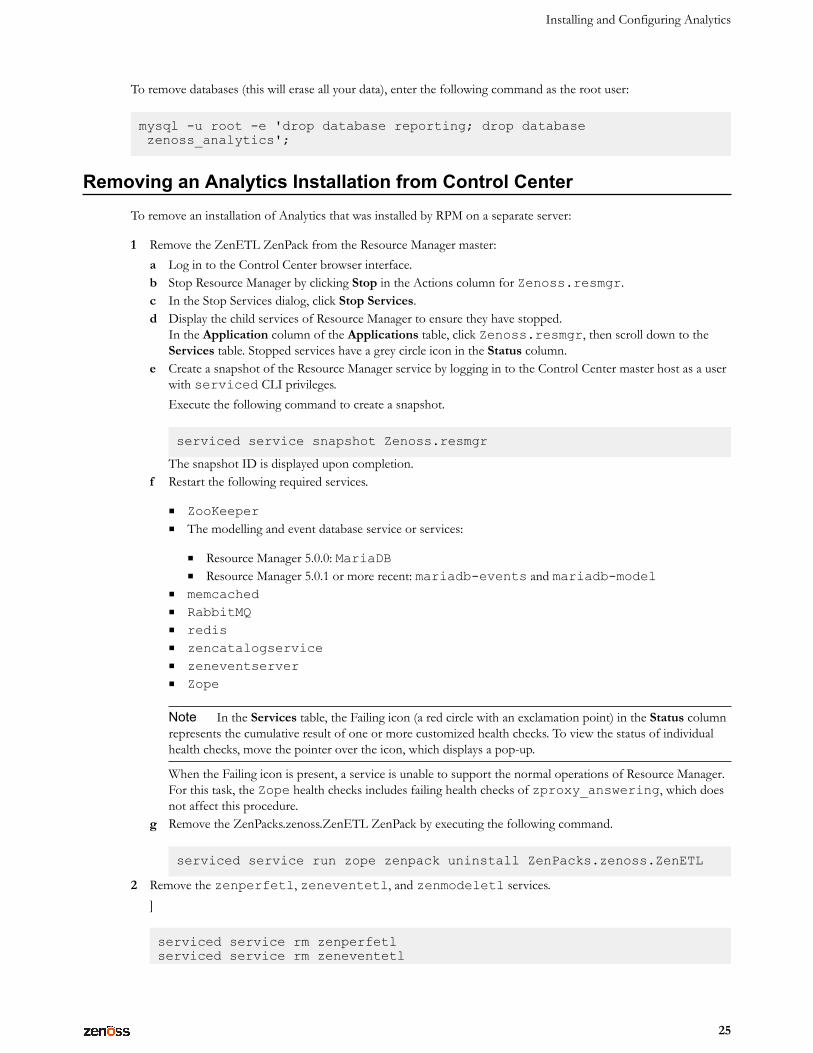
Removing an Analytics Installation (RPM)To remove an installation of Analytics that was installed by RPM on a separate server:
1 Remove the ZenETL ZenPack from the Resource Manager master:a Log in to the Control Center browser interface.b Stop Resource Manager by clicking Stop in the Actions column for Zenoss.resmgr.c In the Stop Services dialog, click Stop Services.d Display the child services of Resource Manager to ensure they have stopped.
In the Application column of the Applications table, click Zenoss.resmgr, then scroll down to theServices table. Stopped services have a grey circle icon in the Status column.
e Create a snapshot of the Resource Manager service by logging in to the Control Center master host as a userwith serviced CLI privileges.Execute the following command to create a snapshot.
serviced service snapshot Zenoss.resmgr
The snapshot ID is displayed upon completion.f Restart the following required services.
■ ZooKeeper■ The modelling and event database service or services:
■ Resource Manager 5.0.0: MariaDB
Zenoss Analytics Installation and Administration Guide
24
■ Resource Manager 5.0.1 or more recent: mariadb-events and mariadb-model■ memcached■ RabbitMQ■ redis■ zencatalogservice■ zeneventserver■ Zope
Note In the Services table, the Failing icon (a red circle with an exclamation point) in the Status columnrepresents the cumulative result of one or more customized health checks. To view the status of individualhealth checks, move the pointer over the icon, which displays a pop-up.
When the Failing icon is present, a service is unable to support the normal operations of Resource Manager.For this task, the Zope health checks includes failing health checks of zproxy_answering, which doesnot affect this procedure.
g Remove the ZenPacks.zenoss.ZenETL ZenPack by executing the following command.
serviced service run zope zenpack uninstall ZenPacks.zenoss.ZenETL
2 Remove the zenperfetl, zeneventetl, and zenmodeletl services.]
serviced service rm zenperfetlserviced service rm zeneventetlserviced service rm zenmodeletl
3 In the Control Center browser interface, restart Resource Manager.4 Log in to the Analytics server and change to the root user:
su - root
5 Stop the Analytics server:
service zenoss_analytics stop
6 Remove the Analytics program files:
rpm -e zenoss_analytics-version-build
This command removes the program files, but does not remove configuration, log files, data files, or databases.
To remove configuration files, enter:
rm -rf /etc/zenoss_analytics
To remove data and log files, enter:
rm -rf /opt/zenoss_analytics
Installing and Configuring Analytics
25
To remove databases (this will erase all your data), enter the following command as the root user:
mysql -u root -e 'drop database reporting; drop database zenoss_analytics';
Removing an Analytics Installation from Control CenterTo remove an installation of Analytics that was installed by RPM on a separate server:
1 Remove the ZenETL ZenPack from the Resource Manager master:a Log in to the Control Center browser interface.b Stop Resource Manager by clicking Stop in the Actions column for Zenoss.resmgr.c In the Stop Services dialog, click Stop Services.d Display the child services of Resource Manager to ensure they have stopped.
In the Application column of the Applications table, click Zenoss.resmgr, then scroll down to theServices table. Stopped services have a grey circle icon in the Status column.
e Create a snapshot of the Resource Manager service by logging in to the Control Center master host as a userwith serviced CLI privileges.Execute the following command to create a snapshot.
serviced service snapshot Zenoss.resmgr
The snapshot ID is displayed upon completion.f Restart the following required services.
■ ZooKeeper■ The modelling and event database service or services:
■ Resource Manager 5.0.0: MariaDB■ Resource Manager 5.0.1 or more recent: mariadb-events and mariadb-model
■ memcached■ RabbitMQ■ redis■ zencatalogservice■ zeneventserver■ Zope
Note In the Services table, the Failing icon (a red circle with an exclamation point) in the Status columnrepresents the cumulative result of one or more customized health checks. To view the status of individualhealth checks, move the pointer over the icon, which displays a pop-up.
When the Failing icon is present, a service is unable to support the normal operations of Resource Manager.For this task, the Zope health checks includes failing health checks of zproxy_answering, which doesnot affect this procedure.
g Remove the ZenPacks.zenoss.ZenETL ZenPack by executing the following command.
serviced service run zope zenpack uninstall ZenPacks.zenoss.ZenETL
2 Remove the zenperfetl, zeneventetl, and zenmodeletl services.]
serviced service rm zenperfetlserviced service rm zeneventetl

Zenoss Analytics Installation and Administration Guide
26
serviced service rm zenmodeletl
3 In the Control Center browser interface, restart Resource Manager.4 In the Control Center browser interface, stop the Analytics application.5 After the Analytics application has stopped, click Delete.
Upgrading to Analytics 5.0.0
27
Upgrading to Analytics 5.0.0 3This chapter provides instructions for upgrading Analytics version 4.4.0 to version 5.0.0. The Resource Manager willnot be upgraded as part of this process. Resource Manager will remain as version 4.x after the upgrade to Analyticsverison 5.0.0.
Prerequisite TasksPrior to upgrading to Analytics 5.0, ensure that hostname resolves to the loopback interface locally by editing/etc/hosts to include an entry for the hostname of the Analytics application server after the listing for127.0.0.1. Then perform the following tasks:
1 Download the following from the https://support.zenoss.com site:a RPM file for Analytics 5.0.0, zenoss_analytics-5.0.0.Version.noarch.rpmb EGG file for ZenETL 5.0.0 ZenPack, ZenPacks.zenoss.ZenETL-Version-py2.7.egg
2 Wait for all batches in the staging state to complete.3 As the zenoss user, stop the zenmodeletl and zeneventetl daemons on each attached Resource Manager server:
zenmodeletl stopzeneventetl stop
4 As the zenoss user, stop the zenperfetl daemons on each attached remote collector and on the ResourceManager server:
zenperfetl stop
Exporting the Zenoss Analytics DatabaseZenoss Analytics uses JasperReports Server to run, display, schedule, and manage reports against the Analytics DataWarehouse. The JasperReports Server stores the report information in its own small database. This database needsto be exported as part of the upgrade process.
To export your existing reports database:
1 On the Analytics server as the root user, navigate to the jasperserver scripts folder:
cd /opt/zenoss_analytics/jasperserver/buildomatic/
2 Run the export script:
Zenoss Analytics Installation and Administration Guide
28
Note The name of the backup file must be backup.zip.
./js-export.sh --everything --output-zip=/path_to_safe_place/backup.zip
3 Stop Analytics:
service zenoss_analytics stop
Dropping the Zenoss Analytics DatabaseOnce you have exported the Zenoss Analytics database, perform the following to drop it:
1 Log in as the zenoss user:
su - zenoss
2 Enter the following commands:
zends -urootdrop database zenoss_analytics;
Saving Existing DataIf you want to save your existing data in the Zenoss Analytics database, you will need to note the location of your /datadir directory so that it can be added in the my.cnf file when you install MariaDB. If you do not want tosave your existing data, skip this procedure.
1 On the Analytics server as the root user or as a user with superuser privileges, navigate to the zends.cnffile in the following folder.
cd /opt/zends/etc/
2 Open the zends.cnf file and note the value of the datadir directory. You will need this value when youchange configuration settings while installing MariaDB.
Removing ZenDS (optional)Zenoss Analytics 5 no longer uses ZenDS. You can remove it at this point in the upgrade if you wish. RemovingZenDS will not delete any data.
To remove ZenDS from the Analytics server:
1 Log in to the Analytics server as root or a user with superuser privileges.2 Execute the following:
rpm -e --nodeps zends
Installing the OpenJDKAnalytics requires the OpenJDK 7 Development package to be installed. Analytics cannot be installed when just theJRE is installed.
Upgrading to Analytics 5.0.0
29
1 Prior to installing the OpenJDK 7 Development package, you should remove all other versions of Java that areon the system:
yum -y remove $(rpm -qa | egrep -i '(jdk|jre|java)')
1 Log in to the Analytics server as root, or as a user with superuser privileges2 Install the OpenJDK 7.
yum -y install java-1.7.0-openjdk-devel
3 Execute the following command and choose the OpenJDK 7 selection:
update-alternative --config java
4 Verify the install succeeded.
java -version
If the command returns output similar to the following, continue to the next procedure.
java version "1.7.0_75"OpenJDK Runtime Environment (rhel-2.5.4.7.el7_1.x86_64 u75-b13)OpenJDK 64-Bit Server VM (build 24.75-b04, mixed mode)
Setting the JAVA_HOME Environment Variable
After installing the OpenJDK, you must set $JAVA_HOME for the root user.
1 Log in to the Analytics server as root, or as a user with superuser privileges2 Locate and note the path to your OpenJDK directory. Typically, this is /usr/lib/jvm/java-1.7.0-
openjdk-VersionNumber.3 Navigate to the /etc/default directory.
echo $JAVA_HOME
4 Open the zenoss_analytics file in an editor.
vi zenoss_analytics
5 Edit the JAVA_HOME line in zenoss_analytics to point to your OpenJDK location.
JAVA_HOME=/usr/lib/jvm/java-1.7.0-openjdk-VersionNumber
6 Test the new path with the following command:
echo $JAVA_HOME
Zenoss Analytics Installation and Administration Guide
30
Installing MariaDBBefore installing MariaDB on systems running Red Hat Enterprise Linux (RHEL), install the Perl DatabaseInterface Module (DBI) with the following command as the root user:
yum -y install perl-DBI
Follow these steps to install MariaDB 10 on the Analytics Server. The Zenoss DataStore (ZenDS) is no longer usedin Analytics 5.
1 Create a custom MariaDB YUM repository. The following example shows information for a CentOS 7installation. For more information, see https://downloads.mariadb.org/mariadb/repositoriesa As the root user, navigate to the /etc/yum.repos.d directory.
cd /etc/yum.repos.d
b Create a file called MariaDB.repo and enter the following text into the file.
# MariaDB 10.0 CentOS repository list#http://mariadb.org/mariadb/repositories/[mariadb]name = MariaDBbaseurl = http://yum.mariadb.org/10.0/centos7-amd64gpgkey=https://yum.mariadb.org/RPM-GPG-KEY-MariaDBgpgcheck=1
2 When the MariaDB.repo file is in place, install the MariaDB server:
sudo yum -y install mariadb-server
Note If you haven't already accepted the MariaDB GPG key, you will be prompted to do so.
3 Add the following configuration settings:
echo "[mysqld]" >> /etc/my.cnfecho "datadir=/opt/zends/data" >> /etc/my.cnfecho "table_open_cache=16K" >> /etc/my.cnfecho "table_definition_cache=16K" >> /etc/my.cnfecho "tmp_table_size=2G" >> /etc/my.cnfecho "max_heap_table_size=2G" >> /etc/my.cnfecho "join_buffer_size=512K" >> /etc/my.cnfecho "open_files_limit=200000" >> /etc/my.cnfecho "wait_timeout=86400" >> /etc/my.cnfecho "tmpdir=/tmp" >> /etc/my.cnfecho "innodb_adaptive_hash_index=OFF" >> /etc/my.cnfecho "innodb_buffer_pool_size=6G" >> /etc/my.cnfecho "innodb_log_file_size=1892M" >> /etc/my.cnfecho "innodb_log_buffer_size=128M" >> /etc/my.cnf
Note If you want to keep your existing data, add the datadir directory for your system. The value listedabove is an example.
Note The values for the innodb settings should reflect your system. Set the innodb_buffer_pool_size tobe 80 percent of the total memory on a standalone data warehouse server or 50 percent of memory if the
Upgrading to Analytics 5.0.0
31
analytics server and database are on the same server. The innodb_log_file_size should be 25 percent of theinnodb_buffer_pool_size value.
4 If you are setting the value of the datadir, you need to change its owner since ZenDS uses the zenoss user,but MariaDB uses mysql. Change the value of /opt/zends/data to your system's datadir path.
chown -R mysql.mysql /opt/zends/data
5 Start the MariaDB server:
/etc/init.d/mysql start
6 Set MariaDB to start on boot:
chkconfig mysql on
7 Run mysql_upgrade to finish the upgrade of MariaDB, since we are upgrading from version 5.x to version10.x:
mkdir /root/tmpdir/usr/bin/mysql_upgrade -u root --tmpdir=/root/tmpdir
If you previously used third-party tools to access ZenDS using the MySQL JDBC driver, we recommend that youchange your JDBC driver to use the "MariaDB Client Library for Java Applications 1.1.8" (client in this case is JDBCdriver not the query app client). This can be downloaded from https://downloads.mariadb.org/client-java/1.1.8/.
Upgrading the Analytics Server and Jaspersoft DatabasePerform the following to upgrade the Analytics Server to version 5.0.0 and upgrade the Jaspersoft database:
1 Log in to the Analytics server as user root, or as a user with superuser privileges.2 Back up any customizations that you made in or below the /opt/zenoss_analytics folder since they
will be overwritten during this upgrade.3 Remove the /opt/zenoss_analytics directory:
rm -rf /opt/zenoss_analytics/
4 Using the Analytics RPM you downloaded, upgrade Analytics with the following command:
yum -y --nogpgcheck localinstall zenoss_analytics-version.noarch.rpm
5 Navigate to the /path_to_safe_place directory where you saved the backup.zip file of yourreporting database export.
6 Change the permission on the backup.zip file so that the zenoss user can execute it.
chmod +x backup.zip
7 Switch to the zenoss user:
su - zenoss
8 Run the following commands:
/opt/zenoss_analytics/bin/upgrade_db.py/opt/zenoss_analytics/bin/fix-theme.sh /path_to_safe_place/backup.zip
Zenoss Analytics Installation and Administration Guide
32
cd /opt/zenoss_analytics/jasperserver/buildomatic./js-import.sh --input-zip=/path_to_safe_place/fixed.backup.zip
9 If you made a backup of your customizations in step 2, check the new configuration files installed during thisupgrade and incorporate any of your customizations that are still compatible with the new version of Jaspersoft.
Installing the User Defined Function to MariaDBBefore installing the user defined function, be certain that you have already installed MariaDB on the database serverand Analytics on the application server.
1 As the root user, login to the Analytics application server and locate the following file:
/usr/lib64/mysql/plugin/zenoss_percentile.so
2 Copy zenoss_percentile.so to the same directory on the MariaDB database server (/usr/lib64/mysql/plugin/.
3 Change to the zenoss user on the Analytics application server:
su - zenoss
4 Execute the following script:
/opt/zenoss_analytics/bin/setup_zenoss_extensions install
Importing the Reports DatabaseIf you have created custom reports for a previous version of Analytics, contact Customer Support or CustomerServices to migrate these reports to version 5.0.0, since there have been data warehouse schema changes.
Installing the ZenETL ZenPack on the Resource Manager masterAfter installing the Analytics server, install the ZenETL ZenPack on the Resource Manager master. You can install itusing the command line or from the Resource Manager interface. See the corresponding directions below:
To install using the command line:
1 As the zenoss user, enter the following command based on the version you are installing:
zenpack --install ZenPacks.zenoss.ZenETL-Version-py2.7.egg
2 Create aliases to the data points on the monitoring templates that you want to bring into Analytics. See the"Running the chkaliases script" instructions contained in Export Data Point Data for information on using thescript found in the ZenETL ZenPack. This step is mandatory and must be completed successfully beforeproceeding.
3 Restart the system:a Enter the following commands:
zenoss stopps -eaf | grep $ZENHOME
b For any process that is reported as running, perform a kill -9 on those processes.
Upgrading to Analytics 5.0.0
33
c Start the system:
zenoss start
When you restart the Resource Manager master, three additional daemons (zeneventetl, zenmodeletl, andzenperfetl) are started. Since the ZenETL ZenPack is like any other ZenPack, you must update the remotecollectors in order for them to receive the changes. See Zenoss Service Dynamics Resource Management Extended Monitoringfor directions on updating remote collectors and hubs after a ZenPack install.
Be sure to install the latest RPS for your Resource Manager instance so that you get all the latest fixes. TheDistributed Collector ZenPack should be at version 2.5.12 or higher otherwise you will be required to use adaemons.txt and a collectordaemons.txt file to stop zenmodeletl and zeneventetl onrunning collectors.
Adding New AliasesIf you haven't already done so, refer to the "Export Data Point Data" section of the Installing and ConfiguringAnalytics chapter to add new aliases to desired data points. You can create aliases using the chkaliases script or bymanually adding them to a data point.
Starting the Analytics ServiceOnce Resource Manager has been restarted after the upgrade, you will need to start the Analytics service:
1 Log in to the Analytics server as root, or as a user with superuser privileges.2 Enable chkconfig for the Analytics service:
chkconfig zenoss_analytics on
3 Start the Analytics service:
service zenoss_analytics start
Zenoss Analytics Installation and Administration Guide
34
Working with Analytics 4Read the following sections for more information about:
■ Starting and stopping the Analytics server■ Logging in to Analytics■ Creating batches■ Working with the Analytics Repository
Starting and Stopping the Analytics ServerUse the following commands if you need to stop, start, or restart the Analytics server (such as when troubleshootingproblems). While the server is stopped, no data is extracted.
If your Analytics server is installed outside of the Control Center, use the following commands:
■ To start Analytics, log in to the Analytics server as the root user and enter the command:
service zenoss_analytics start
■ To stop and then start Analytics, log in to the Analytics server as the root user and enter the command:
service zenoss_analytics restart
■ To stop Analytics, log in to the Analytics server as the root user and enter the command:
service zenoss_analytics stop
If your Analytics server is installed inside the Control Center, use the following command:
■ To start Analytics, log in to the Control Center as a user with sudo privileges and click the Start button next tothe Zenoss.analytics application.
■ To stop and then start Analytics, log in to the Control Center as a user with sudo privileges and click theRestart button next to the Zenoss.analytics application.
■ To stop Analytics, log in to the Control Center as a user with sudo privileges and click the Stop button next tothe Zenoss.analytics application.
Working with Analytics
35
Logging in to AnalyticsTo access Analytics, you can:
■ Log in to the Resource Manager interface, using your Resource Manager user name and password (Single SignOn)
■ Log in directly to Analytics, using your Resource Manager user name and password or as an Analytics superuser
Logging in Through the Resource Manager Interface
Access to Analytics through single sign-on (SSO) on the Resource Manager interface requires Manager,ZenManager, or ReportingUser privileges, assigned through roles. (Manager and ZenManager provide Analyticsadministrative privileges; ReportingUser provides user-level privileges.) You cannot log in to Analytics solely withResource Manager administrator privileges. For more information on assigning roles, see the "Managing Users"chapter in Zenoss Resource Manager Administration Guide.
1 Log in to the Resource Manager interface with your Resource Manager user name and password.2 Select Reports > Advanced.
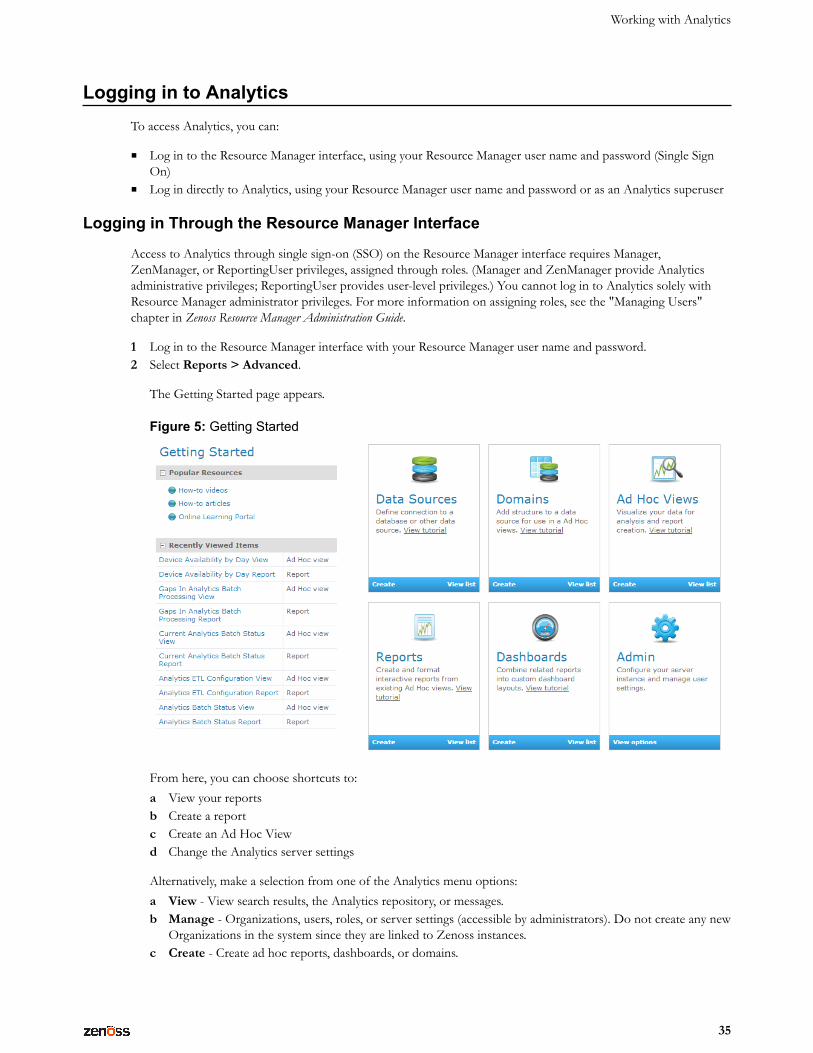
The Getting Started page appears.
Figure 5: Getting Started
From here, you can choose shortcuts to:a View your reportsb Create a reportc Create an Ad Hoc Viewd Change the Analytics server settings
Alternatively, make a selection from one of the Analytics menu options:a View - View search results, the Analytics repository, or messages.b Manage - Organizations, users, roles, or server settings (accessible by administrators). Do not create any new
Organizations in the system since they are linked to Zenoss instances.c Create - Create ad hoc reports, dashboards, or domains.
Zenoss Analytics Installation and Administration Guide
36
Logging in Directly to Analytics
You can log in directly to Analytics by using your Resource Manager user name and password (with appropriateResource Manager privileges), or as an Analytics superuser.
1 If you installed Analytics by RPM, browse to the URL of your Analytics server.(http://<your_server_or_IP_address>:7070 or https://<your_server_or_IP_address>:443 for SSL). If you installed Analytics in the Control Center,browse to the URL of your Analytics server (https://reports.<your_server>).The Analytics login page appears.
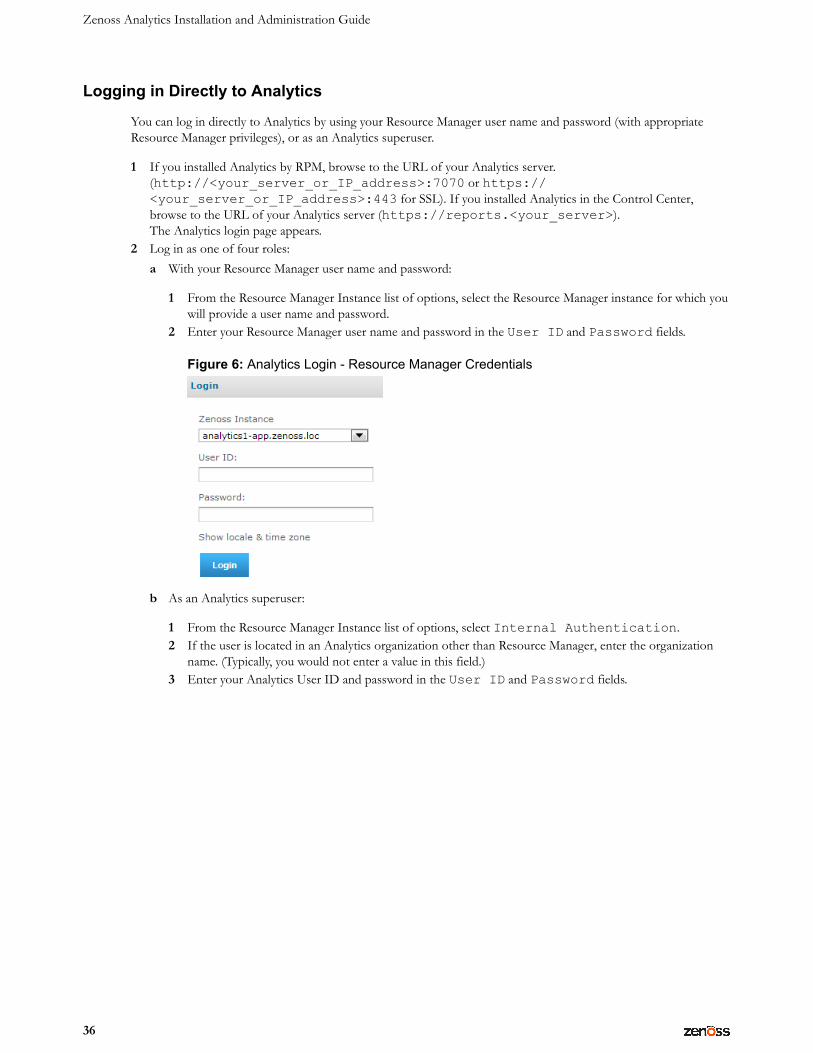
2 Log in as one of four roles:a With your Resource Manager user name and password:
1 From the Resource Manager Instance list of options, select the Resource Manager instance for which youwill provide a user name and password.
2 Enter your Resource Manager user name and password in the User ID and Password fields.
Figure 6: Analytics Login - Resource Manager Credentials
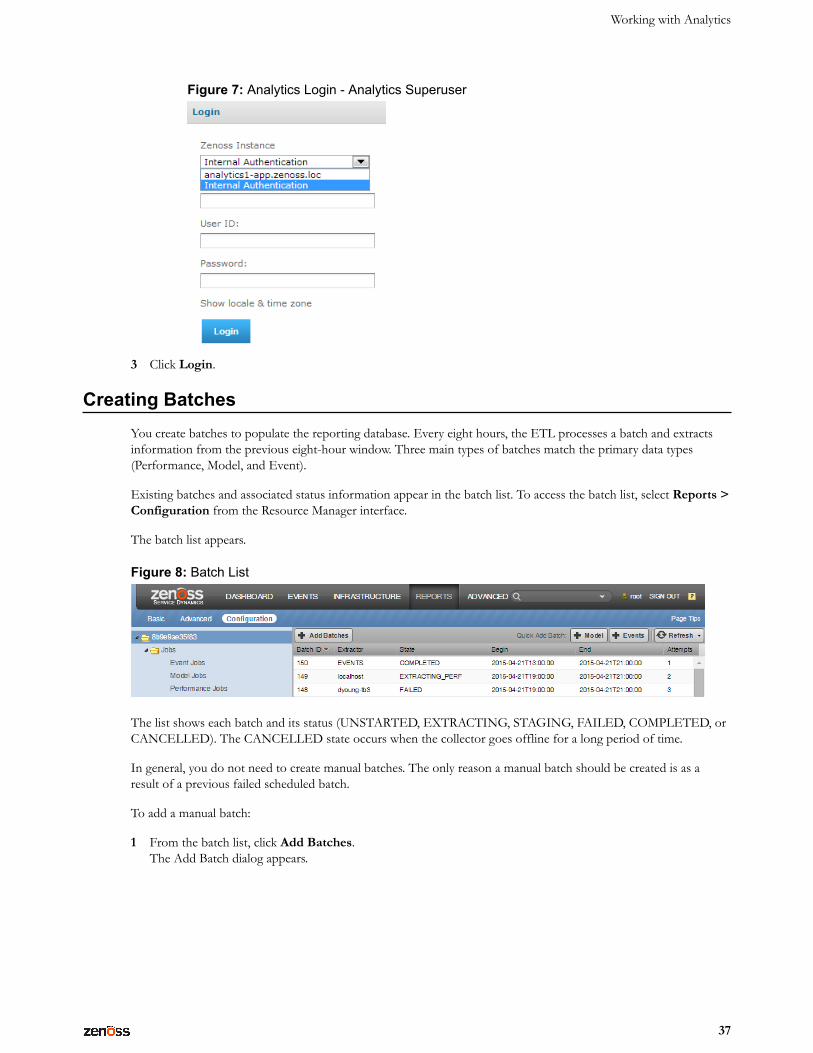
b As an Analytics superuser:
1 From the Resource Manager Instance list of options, select Internal Authentication.2 If the user is located in an Analytics organization other than Resource Manager, enter the organization
name. (Typically, you would not enter a value in this field.)3 Enter your Analytics User ID and password in the User ID and Password fields.
Working with Analytics
37
Figure 7: Analytics Login - Analytics Superuser
3 Click Login.
Creating BatchesYou create batches to populate the reporting database. Every eight hours, the ETL processes a batch and extractsinformation from the previous eight-hour window. Three main types of batches match the primary data types(Performance, Model, and Event).
Existing batches and associated status information appear in the batch list. To access the batch list, select Reports >Configuration from the Resource Manager interface.
The batch list appears.
Figure 8: Batch List
The list shows each batch and its status (UNSTARTED, EXTRACTING, STAGING, FAILED, COMPLETED, orCANCELLED). The CANCELLED state occurs when the collector goes offline for a long period of time.
In general, you do not need to create manual batches. The only reason a manual batch should be created is as aresult of a previous failed scheduled batch.
To add a manual batch:
1 From the batch list, click Add Batches.The Add Batch dialog appears.
Zenoss Analytics Installation and Administration Guide
38
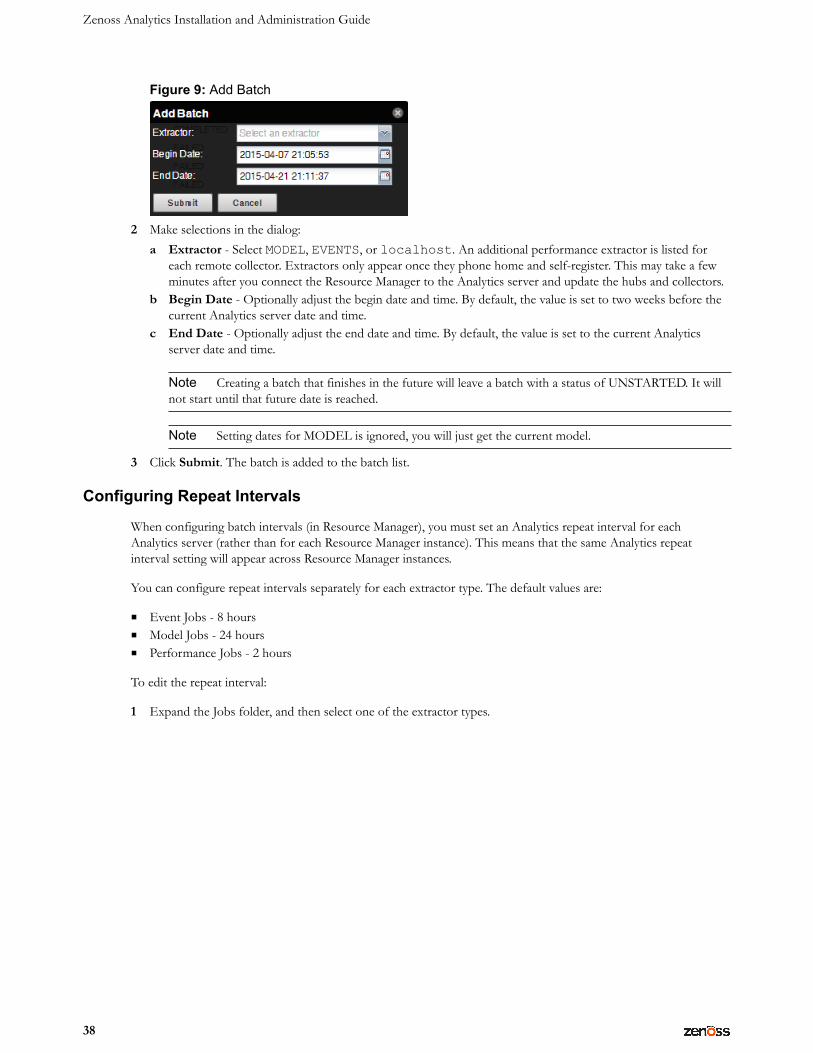
Figure 9: Add Batch
2 Make selections in the dialog:a Extractor - Select MODEL, EVENTS, or localhost. An additional performance extractor is listed for
each remote collector. Extractors only appear once they phone home and self-register. This may take a fewminutes after you connect the Resource Manager to the Analytics server and update the hubs and collectors.
b Begin Date - Optionally adjust the begin date and time. By default, the value is set to two weeks before thecurrent Analytics server date and time.
c End Date - Optionally adjust the end date and time. By default, the value is set to the current Analyticsserver date and time.
Note Creating a batch that finishes in the future will leave a batch with a status of UNSTARTED. It willnot start until that future date is reached.
Note Setting dates for MODEL is ignored, you will just get the current model.
3 Click Submit. The batch is added to the batch list.
Configuring Repeat Intervals
When configuring batch intervals (in Resource Manager), you must set an Analytics repeat interval for eachAnalytics server (rather than for each Resource Manager instance). This means that the same Analytics repeatinterval setting will appear across Resource Manager instances.
You can configure repeat intervals separately for each extractor type. The default values are:
■ Event Jobs - 8 hours■ Model Jobs - 24 hours■ Performance Jobs - 2 hours
To edit the repeat interval:
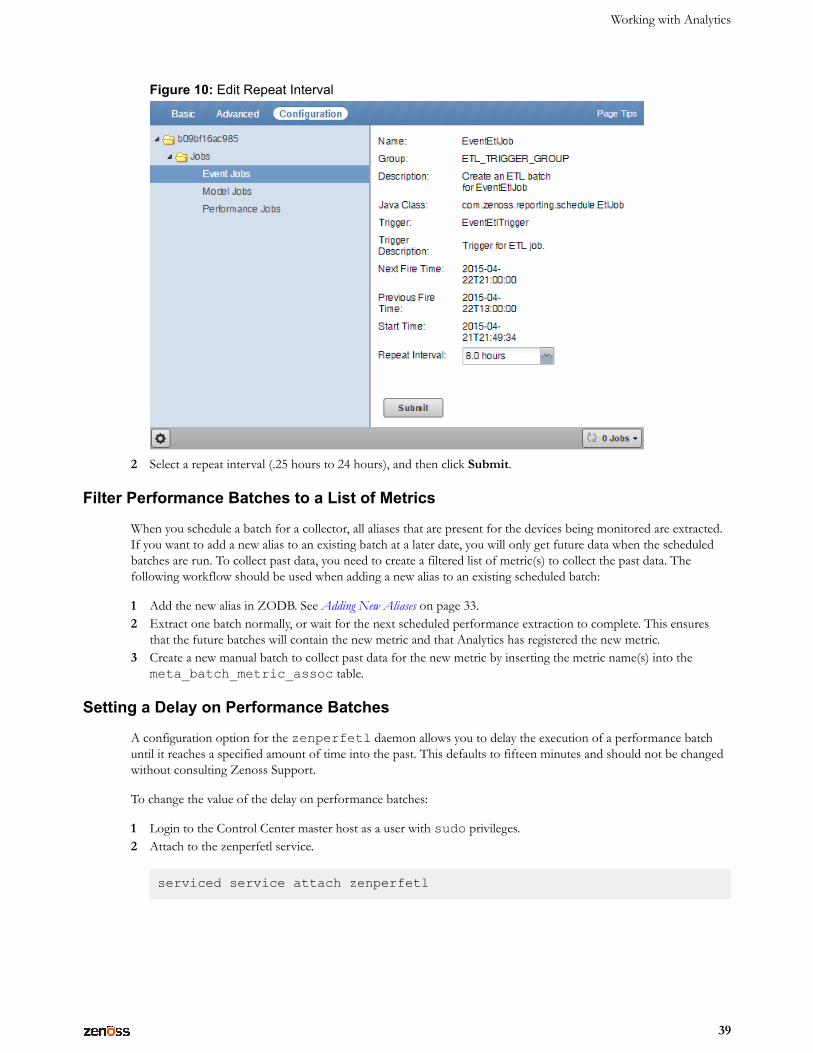
1 Expand the Jobs folder, and then select one of the extractor types.
Working with Analytics
39
Figure 10: Edit Repeat Interval
2 Select a repeat interval (.25 hours to 24 hours), and then click Submit.
Filter Performance Batches to a List of Metrics
When you schedule a batch for a collector, all aliases that are present for the devices being monitored are extracted.If you want to add a new alias to an existing batch at a later date, you will only get future data when the scheduledbatches are run. To collect past data, you need to create a filtered list of metric(s) to collect the past data. Thefollowing workflow should be used when adding a new alias to an existing scheduled batch:
1 Add the new alias in ZODB. See Adding New Aliases on page 33.2 Extract one batch normally, or wait for the next scheduled performance extraction to complete. This ensures
that the future batches will contain the new metric and that Analytics has registered the new metric.3 Create a new manual batch to collect past data for the new metric by inserting the metric name(s) into the
meta_batch_metric_assoc table.
Setting a Delay on Performance Batches
A configuration option for the zenperfetl daemon allows you to delay the execution of a performance batchuntil it reaches a specified amount of time into the past. This defaults to fifteen minutes and should not be changedwithout consulting Zenoss Support.
To change the value of the delay on performance batches:
1 Login to the Control Center master host as a user with sudo privileges.2 Attach to the zenperfetl service.
serviced service attach zenperfetl
Zenoss Analytics Installation and Administration Guide
40
3 Change to the opt/zenoss/etc directory.
cd opt/zenoss/etc
4 Open zenperfetl.conf in an editor and uncomment the line containing the setting forperfbatchdelayinminutes and set it to the value you want (in minutes).
Parallelization of Performance Loads
To increase loading of performance data, a new configuration has been added which loads performance data inparallel. Based on your I/O performance, you may want to increase or decrease the default number of performancethreads that Analytics uses. The default value is 10, which is the equivalent of 5 cores.
To change the value, you must edit the meta_setting table directly:
1 Log in to the Analytics data warehouse database as the root user or a user with administrative permissions.
mysql -u root reporting
2 Enter the following to lower the concurrent_threads to a value of 6. (If you want to increase yourparallelization, you should set this to 12.)
update meta_setting set setting_value = '6' where setting_name = 'concurrent_threads';
Limiting Concurrent Performance Extractions
Since multiple logical collectors can be installed on a single host, there will be multiple zenperfetl daemonsrunning on the same host. Under normal conditions, all these daemons will begin extraction nearly simultaneously,which can saturate disk I/O for a period of time. To manage this behavior, Analytics tracks the hosts whereeach of its performance extractors are running. There is a concurrent_extractions_limit columnin the meta_perf_extractor_limits table. By default, there is no limit. If you have an environmentwhere there are many logical collectors installed on a single host, you may want to change the value ofconcurrent_extractions_limit to limit the number concurrent performance extractions that can takeplace at the same time on the host.
To change the value, you must edit the meta_perf_extractor_limits table directly:
1 Log in to the Analytics data warehouse database as the root user or a user with administrative permissions.
mysql -u root reporting
2 Enter the following to set the concurrent_extractions_limit to a value of 4. The actual value youwill want to use will depend on your disk I/O.
update meta_perf_extractor_limits set setting_value = '4' where setting_name = 'concurrent_extractions_limit';
Configuring the Analytics Data Retention PolicyBased on your business needs, you may want to change the data retention policy for certain types of data. The dataretention policies are configured through direct manipulation of the meta_setting table in the data warehouse("reporting") database.
To see the data retention setting in the meta_setting table, perform the following:
Working with Analytics
41
1 Log in to the Analytics data warehouse database as the root user or a user with administrative permissions.
mysql -u root reporting
2 Enter the following command:
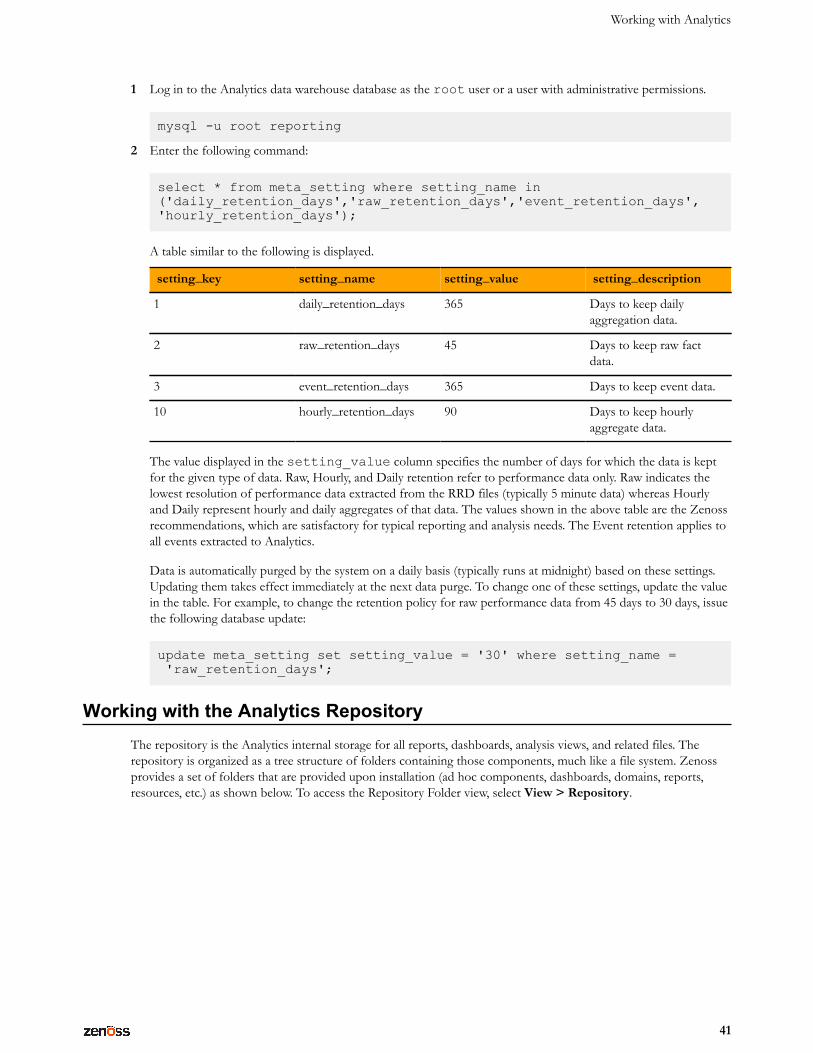
select * from meta_setting where setting_name in('daily_retention_days','raw_retention_days','event_retention_days','hourly_retention_days');
A table similar to the following is displayed.
setting_key setting_name setting_value setting_description
1 daily_retention_days 365 Days to keep dailyaggregation data.
2 raw_retention_days 45 Days to keep raw factdata.
3 event_retention_days 365 Days to keep event data.
10 hourly_retention_days 90 Days to keep hourlyaggregate data.
The value displayed in the setting_value column specifies the number of days for which the data is keptfor the given type of data. Raw, Hourly, and Daily retention refer to performance data only. Raw indicates thelowest resolution of performance data extracted from the RRD files (typically 5 minute data) whereas Hourlyand Daily represent hourly and daily aggregates of that data. The values shown in the above table are the Zenossrecommendations, which are satisfactory for typical reporting and analysis needs. The Event retention applies toall events extracted to Analytics.
Data is automatically purged by the system on a daily basis (typically runs at midnight) based on these settings.Updating them takes effect immediately at the next data purge. To change one of these settings, update the valuein the table. For example, to change the retention policy for raw performance data from 45 days to 30 days, issuethe following database update:
update meta_setting set setting_value = '30' where setting_name = 'raw_retention_days';
Working with the Analytics RepositoryThe repository is the Analytics internal storage for all reports, dashboards, analysis views, and related files. Therepository is organized as a tree structure of folders containing those components, much like a file system. Zenossprovides a set of folders that are provided upon installation (ad hoc components, dashboards, domains, reports,resources, etc.) as shown below. To access the Repository Folder view, select View > Repository.
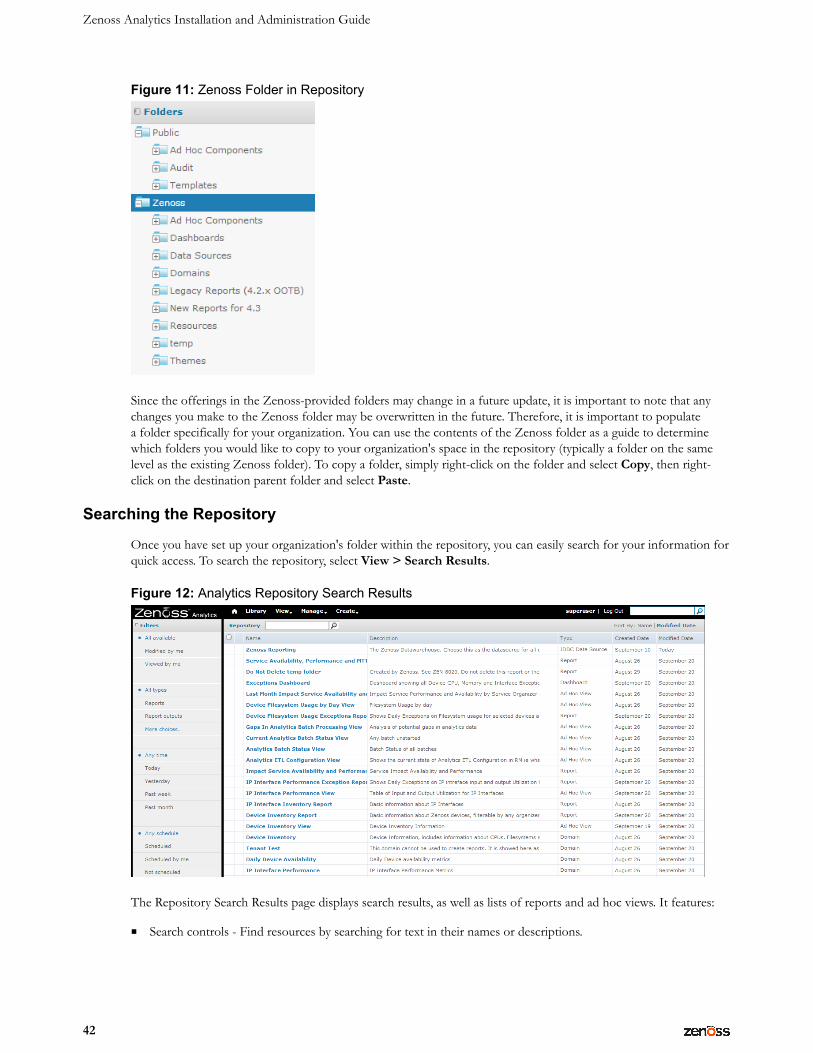
Zenoss Analytics Installation and Administration Guide
42
Figure 11: Zenoss Folder in Repository
Since the offerings in the Zenoss-provided folders may change in a future update, it is important to note that anychanges you make to the Zenoss folder may be overwritten in the future. Therefore, it is important to populatea folder specifically for your organization. You can use the contents of the Zenoss folder as a guide to determinewhich folders you would like to copy to your organization's space in the repository (typically a folder on the samelevel as the existing Zenoss folder). To copy a folder, simply right-click on the folder and select Copy, then right-click on the destination parent folder and select Paste.
Searching the Repository
Once you have set up your organization's folder within the repository, you can easily search for your information forquick access. To search the repository, select View > Search Results.
Figure 12: Analytics Repository Search Results
The Repository Search Results page displays search results, as well as lists of reports and ad hoc views. It features:
■ Search controls - Find resources by searching for text in their names or descriptions.
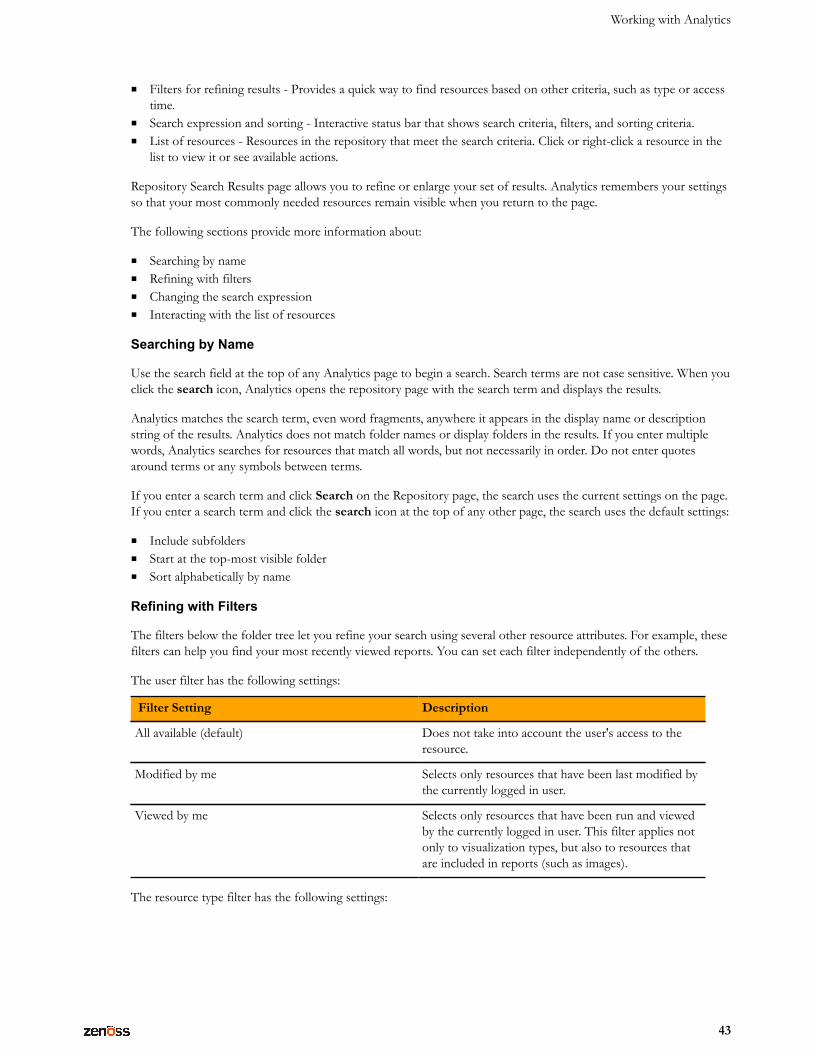
Working with Analytics
43
■ Filters for refining results - Provides a quick way to find resources based on other criteria, such as type or accesstime.
■ Search expression and sorting - Interactive status bar that shows search criteria, filters, and sorting criteria.■ List of resources - Resources in the repository that meet the search criteria. Click or right-click a resource in the
list to view it or see available actions.
Repository Search Results page allows you to refine or enlarge your set of results. Analytics remembers your settingsso that your most commonly needed resources remain visible when you return to the page.
The following sections provide more information about:
■ Searching by name■ Refining with filters■ Changing the search expression■ Interacting with the list of resources
Searching by Name
Use the search field at the top of any Analytics page to begin a search. Search terms are not case sensitive. When youclick the search icon, Analytics opens the repository page with the search term and displays the results.
Analytics matches the search term, even word fragments, anywhere it appears in the display name or descriptionstring of the results. Analytics does not match folder names or display folders in the results. If you enter multiplewords, Analytics searches for resources that match all words, but not necessarily in order. Do not enter quotesaround terms or any symbols between terms.
If you enter a search term and click Search on the Repository page, the search uses the current settings on the page.If you enter a search term and click the search icon at the top of any other page, the search uses the default settings:
■ Include subfolders■ Start at the top-most visible folder■ Sort alphabetically by name
Refining with Filters
The filters below the folder tree let you refine your search using several other resource attributes. For example, thesefilters can help you find your most recently viewed reports. You can set each filter independently of the others.
The user filter has the following settings:
Filter Setting Description
All available (default) Does not take into account the user's access to theresource.
Modified by me Selects only resources that have been last modified bythe currently logged in user.
Viewed by me Selects only resources that have been run and viewedby the currently logged in user. This filter applies notonly to visualization types, but also to resources thatare included in reports (such as images).
The resource type filter has the following settings:
Zenoss Analytics Installation and Administration Guide
44
Filter Setting Description
All types (default) Does not take into account the resource type; as aresult, every type is displayed.
Reports Displays only reports.
Report outputs Displays only the output from reports that werescheduled or run in the background. Report outputcan be any of the supported export types (such asHTML or PDF).
Ad Hoc views Displays only the output from reports that werecreated using an ad hoc view into an availabledata source type (Topics, Domains, or OLAPConnections).
Dashboards Displays only dashboards.
OLAP views Displays only OLAP views.
Domains Displays only domains.
Data sources Displays only data sources.
Deprecated Reports Displays only deprecated reports.
The access time filter has the following settings. All times are relative to your effective time zone:
Filter Setting Description
Any time (default) Does not take into account the last modification timeof a resource.
Today Resources viewed or modified since the previousmidnight.
Yesterday Resources viewed or modified during the previousday ending at midnight.
Past week Resources viewed or modified during the past 7 days,including today.
Past month Resources viewed or modified during the past 30days, including today.
The scheduled report filter has the following settings:
Filter Setting Description
Any schedule (default) Does not take into account the existence of scheduledjobs.
Scheduled Only reports that have scheduled jobs.
Scheduled by me Only reports that have jobs scheduled by thecurrently logged in user.
Not scheduled Only reports that do not have scheduled jobs, and allother resource types.
Working with Analytics
45
Changing the Search Expression
Above the list of resources, the search expression shows you all of the criteria that contribute to the search. Itcontains the following elements, always in this order from left to right:
■ The search term, if any, or the word All■ Any and all filter settings
The search expression provides a quick visual summary of the search criteria for the list of results that appear rightbelow it. The search expression is also interactive, allowing you to easily remove some of the filters. It supports thefollowing actions:
■ If there is more than one filter, clicking any of them removes all those to its right.■ You can click the search term or the word All to remove any folders to the right.
After any of these actions, the search controls displayed on the left are refreshed, and the results are updated.
To the right of the search expression. the sort criteria lets you change the order of the results. Analytics supports thefollowing sorting:
■ Click Name to sort alphabetically from A-Z. This is the default sort order.■ Click Modified Date to sort by the latest modified time and date (most recent at top).
Interacting with the List of Resources
■ Multiple Types Condensed – When there are more than two types of resources listed, the number of resourcesof each type is limited to a certain number, by default 5. When there are more resources of that type, there is alink to see all of that type. You can quickly scroll through the condensed results and find the type of resource youwant. Click See all... to display the results of that type.
■ Single Type Expanded – When there is a single type of resource in the results, either by circumstance, by clickingSee all..., or because a single-type filter is selected, all resources are listed, with a scroll bar if necessary. If the listof results is still too long, enter or refine the search term, or select additional filters.
Note When you click See all... for a type that has a single-type filter, for example Domains, that filteris automatically applied. The filter display and the search expression refresh to reflect this. Use the searchexpression to remove the filter if necessary. When no filter exists for that type, for example input controls,the filter display and search expression are not updated. Use the type filter list of options to change the typesdisplayed.
Once the resource or resources you want are displayed, you can interact with them in several ways:
■ Click the name of a report or dashboard to run and view it.■ Right-click the name of a resource to access other operations on the context menu, for example Open in
Designer... Items appear on the context menu according to your permissions.■ Select the resource name or click anywhere in the row to select it. (Control-click anywhere in the rows to select
multiple resources.) You can drag and drop selected items to move them or press Control while you drag anddrop items to copy them.
Two icons may appear between a report name and its selection box:
■ + indicates that the report has saved options for is input controls. Click + to list the saved options below thereport.
■ The clock icon indicates that the report has been scheduled to run or that it currently is running in thebackground. Click this icon to view the list of jobs scheduled for the report.
Zenoss Analytics Installation and Administration Guide
46
Workflow for Creating Your Own Reports
The following sections describe the process to follow for creating your own domains, then creating ad hoc viewsbased on those domains, and finally creating and scheduling reports to be run from those ad hoc views.
Creating Domains
A domain is a metadata layer that provides a business view of the data accessed through a data source. A domainpresents the data in business terms appropriate to your audience, and can limit the access to data based on thesecurity permissions of the person running the report. A domain can be used to create reports and ad hoc views.Zenoss provides several out-of-the-box domains, but you may want to create your own domains based on businessneeds. This section discusses some of the considerations to make note of as you create a domain. For more detailedinformation about creating domains, see the JasperReports Server User Guide, Release 6.0.
In practice, you should plan domain features before you begin the creation process. You will use thezenoss_reporting data source for your domain creation. Decide on the element of your design: tables andcolumns to choose, joins to perform, filters to define, sets you need, and item properties to expose to users. Finally,determine a security policy for the data retrieved through the domain.
To help you in your creation of domains, we have included an Entity-Relationship Diagram (ERD) in Appendix Athat shows you the relationships between tables in the database. You will also find a sample of some dynamicallycreated dimension tables as well as a flow of performance fact data as it goes through hourly and daily aggregation.
To create a new domain:
1 Log in to Analytics as an administrator or superuser.2 Click Create > Domain. The Add New Domain screen is displayed.3 Fill in the name, resource ID and a description.4 Select a Save Location by browsing to your organization's Domain folder.5 In the Data Source field, browse to the zenoss_reporting data source located at /
organizations/zenoss/Data_Sources/zenoss_reporting6 In the Domain Design section, click the Create with Domain Designer link. The Domain Designer screen is
displayed. On this screen you will configure various aspects of the design. Just click the corresponding tab forthe following:
■ Tables - Select all the tables whose columns you want to use in the domain, either directly or indirectly.■ Derived Tables - Enter queries whose results appear as derived tables in the domain.■ Joins - Define inner and outer joins between all the tables and derived tables.■ Calculated Fields - Enter expressions whose results appear as calculated fields. An example of a calculated
field can be found in the IP Interface Inventory domain found in the Zenoss/Domains folder. Note thatall the _deleted calculated fields are based on whether the time stamp is present or not.
■ Pre-filters - Specify conditions on field values to limit the data accessed through the domain. An exampleof a pre-filter can be found in the Daily Device KPI domain found in the Zenoss/Domains folder. Youcannot use this domain if you have components. Thus, there is a pre-filter defined as component_key =0.
■ Display - Organize the visual aspects of the domain and change the display properties of tables, columns,sets, and items exposed to domain users. The properties are located in the far-right column. The Label is thefriendly text display, while the ID is the system name that shouldn't be changed unless there are similar IDscoming from different input controls. In the Summary Function section, all performance metrics are definedas measures, while everything else in the system (including time) is defined as a field.
7 As you create your domain, click the Check Design button to validate your domain design. If you have issues,click the Export Design button which will create an XML file of your schema that can be shared with ZenossSupport.
8 Click OK once you have finished with the Domain Designer. You will return to the Edit Domain screen.9 If all the information is correct, including your design, click Submit to add the domain to the repository.
Working with Analytics
47
Creating Ad Hoc Views
The Ad Hoc editor supports the creation of views for various types of reports: tables, crosstabs, and charts. Youinteract with the editor to create these views by dragging and dropping elements. You can add and summarize fields,define groups, label and title the report, and format data for each field.
To open the Ad Hoc editor:
1 Log in to Analytics as an administrator or superuser.2 Click Create > Ad Hoc View. The Select Data screen is displayed.3 Select your data source from the list. ick the icon to navigate through the :
Note You can also navigate through the data source by clicking on the View as tree icon. (root >Organization > Zenoss > Ad Hoc Components)
■ Topics - These can be either a JRXML file that is associated with a data source on the server or can becreated from a domain with one or more filters applied to it. Using a topic as your source generates an emptyview, which allows you to begin adding data to your view right away, without choosing, pre-filtering, orchanging display names of the data (all of which are required steps when creating a Domain-based view.
■ Domains - They specify tables in the database, join clauses, calculated fields, display names, and defaultproperties, all of which define items and sets of items for creating Ad Hoc views.
4 Fill out the New Ad Hoc View screen based on the data you selected. For more details on the functionality andtoolbar icons, see the JasperReports Server User Guide.
5 Select a view type:
■ Tables - Used to view values in the database and to summarize the values in columns.■ Charts - Used to compare one or more measures across multiple sets of related fields. Charts summarize
data graphically. Some types of charts include bar chart, line chart, and pie chart, among others.■ Crosstabs - Used to aggregate data across multiple dimensions. Crosstabs are more compact representations
than tables; they show only computed values, rather than individual database values. Columns and rowsspecify the dimensions for grouping; cells contain the summarized measurements.
6 When completed, save your Ad Hoc View. This view is saved in the repository. You can use this view to createreports or you can save the view as a report itself so that you can embed the data content into a dashboard or seethe data in the interactive report viewer.
Note When you create a report from an Ad Hoc view, the report is considered "dependent" on that view. Ifyou later edit the Ad Hoc view, the dependent reports are not updated with the new changes to the view.
Creating and Running Reports
Zenoss Analytics makes it easy to create and run reports. When you run a report, it opens in the interactive ReportViewer. Using this Viewer, you can personalize and refine the displayed report data. If your report has inputcontrols, you can run the report with one set of data and then another. You can then export the output to anotherformat or you can schedule the report to create an output repeatedly and unattended during off hours or at othertimes.Create a Report and Edit the Output
1 Log in to Analytics.2 From the Home page, click Create in the Reports section; or from any page, click Create > Report.3 Select an Ad Hoc view from the Create Report window, then click OK.4 If Input Controls are asked for, provide them in the displayed window. If not, the report output appears.5
Edit the report output by clicking the Options button in the upper-right corner.
Zenoss Analytics Installation and Administration Guide
48
Note By default, a dynamic date range is used to define the date filter. The range is defined by the unit (DAY,WEEK, MONTH) and a numerical unit that can be positive or negative. For example a range of DAY-7 to DAYis equivalent to the last seven days from when the report is run.
6 While you cannot change the fundamental type of output (you cannot change a chart into a crosstab), you canchange various elements of the output based on the type of report. For example, you can resize columns or filterby a column's value. If you are using a chart, you can change the type of chart you want to display. Refer to theJasperReports Server User Guide for even more ways to customize your reports.
7Once you have the report output displaying the way you want, save the report by clicking the Save icon.
Schedule a Report Job to be Run
1 Log in to Analytics.2 On the Home page, click View list in the Reports area; or from any page, click View > Repository.3 Use the search field or browse the list of reports to find the report you want to schedule.4 Right-click the report name and select Schedule from the context menu. The Schedule Jobs page appears.5 Click Create Schedule. The Schedule tab appears. Fill out the information requested and select the recurrence
of the job. The default value is None, which will run the report only once. Select Simple from the drop-downlist to schedule the job to recur at an hourly, daily, or weekly interval or select Calendar to schedule the job torecur on certain days of the week or days of the month.
6 Set the other values on the appropriate tabs for Parameters, Output Options, and Notifications. Click Saveto save the schedule. On the Repository view page, you will see a clock icon to indicate that a report has beenscheduled to run.
Note The permissions of the user who schedules a job determines the data that the report exposes. Be awarethat sensitive data could be exposed if you schedule a job as an administrative user with no data restrictionsbecause the report output will contain all the requested data in the data source. Any user who receives the reportoutput can view all the data regardless of the user's access restrictions.
Entity-Relationship Diagrams for Aggregation-related Tables
This section describes percentiles and aggregates and the way to understand how projections are created.
Percentiles operate against the raw data, i.e., raw_v2_tables, not against an aggregate. Think of thenth_percentile_configuration tables as defining what subset of all the raw data has percentilescalculated, i.e., which rows within a specific raw_v2_table (specific device_key - group filter, specificfct_ts values - business hours filter) and which raw tables are actually read at all (specific metrics).
Projections operate against already calculated daily aggregates or against nth percentile calculations that have alreadybeen performed on daily_ or percentile_ tables. You can think of a projection of nth percentiles as a dependency,since nth-percentile configurations can limit the data produced, the projections on that nth percentile have, at aminimum, the same limits. You can't have projections that specify fewer overall restrictions than the data source itdepends on.
Projections groups, business hours, and metric configuration can be thought of as being used to decide whichexisting aggregate table(s) the values to be projected are read from, i.e., they only configure which table's values areprojected and what additional group filters to apply to select devices.
Some configuration override scenarios:
■ The specified nth-percentile metric configuration overrides the projection metric configuration■ The nth-percentile configuration overrides the projection configuration for business hour selection on a per
metric basis
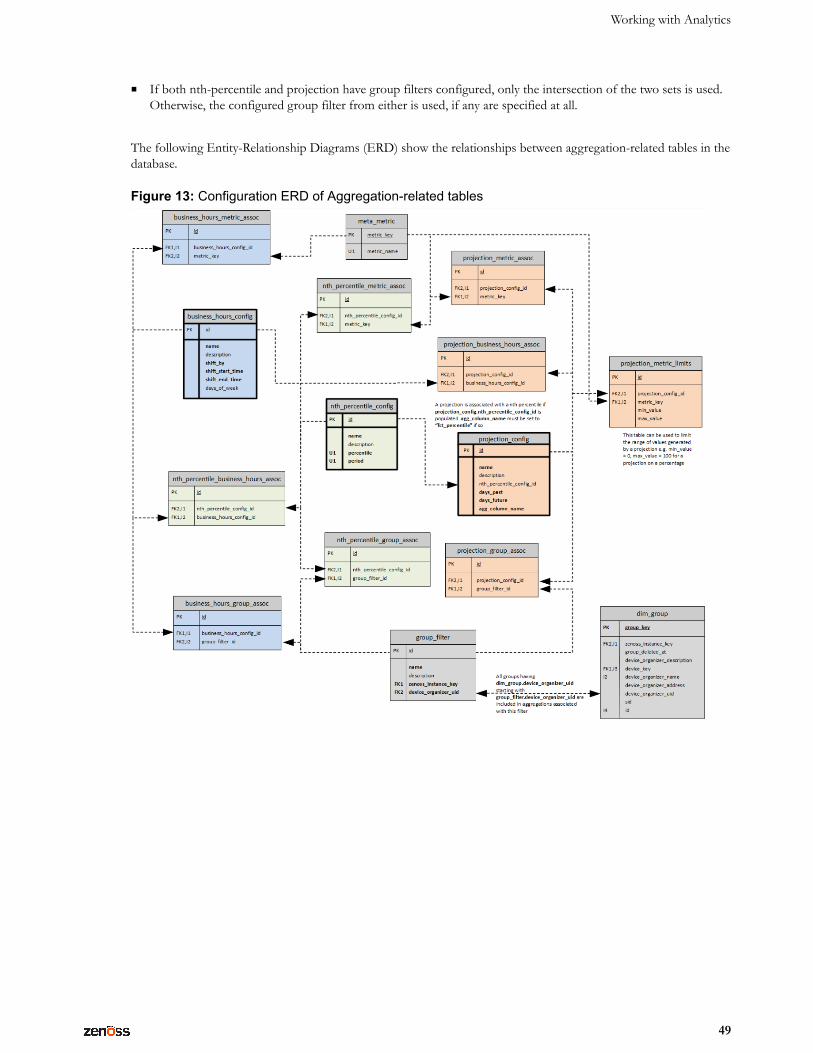
Working with Analytics
49
■ If both nth-percentile and projection have group filters configured, only the intersection of the two sets is used.Otherwise, the configured group filter from either is used, if any are specified at all.
The following Entity-Relationship Diagrams (ERD) show the relationships between aggregation-related tables in thedatabase.
Figure 13: Configuration ERD of Aggregation-related tables
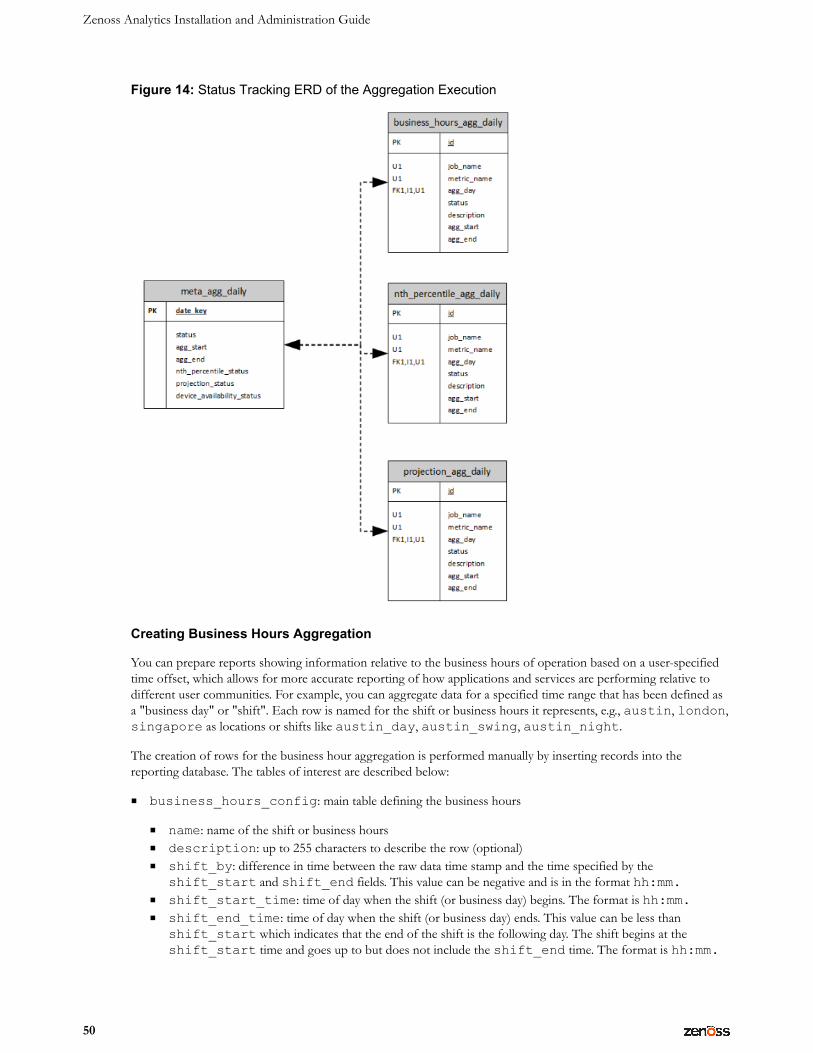
Zenoss Analytics Installation and Administration Guide
50
Figure 14: Status Tracking ERD of the Aggregation Execution
Creating Business Hours Aggregation
You can prepare reports showing information relative to the business hours of operation based on a user-specifiedtime offset, which allows for more accurate reporting of how applications and services are performing relative todifferent user communities. For example, you can aggregate data for a specified time range that has been defined asa "business day" or "shift". Each row is named for the shift or business hours it represents, e.g., austin, london,singapore as locations or shifts like austin_day, austin_swing, austin_night.
The creation of rows for the business hour aggregation is performed manually by inserting records into thereporting database. The tables of interest are described below:
■ business_hours_config: main table defining the business hours
■ name: name of the shift or business hours■ description: up to 255 characters to describe the row (optional)■ shift_by: difference in time between the raw data time stamp and the time specified by the
shift_start and shift_end fields. This value can be negative and is in the format hh:mm.■ shift_start_time: time of day when the shift (or business day) begins. The format is hh:mm.■ shift_end_time: time of day when the shift (or business day) ends. This value can be less than
shift_start which indicates that the end of the shift is the following day. The shift begins at theshift_start time and goes up to but does not include the shift_end time. The format is hh:mm.
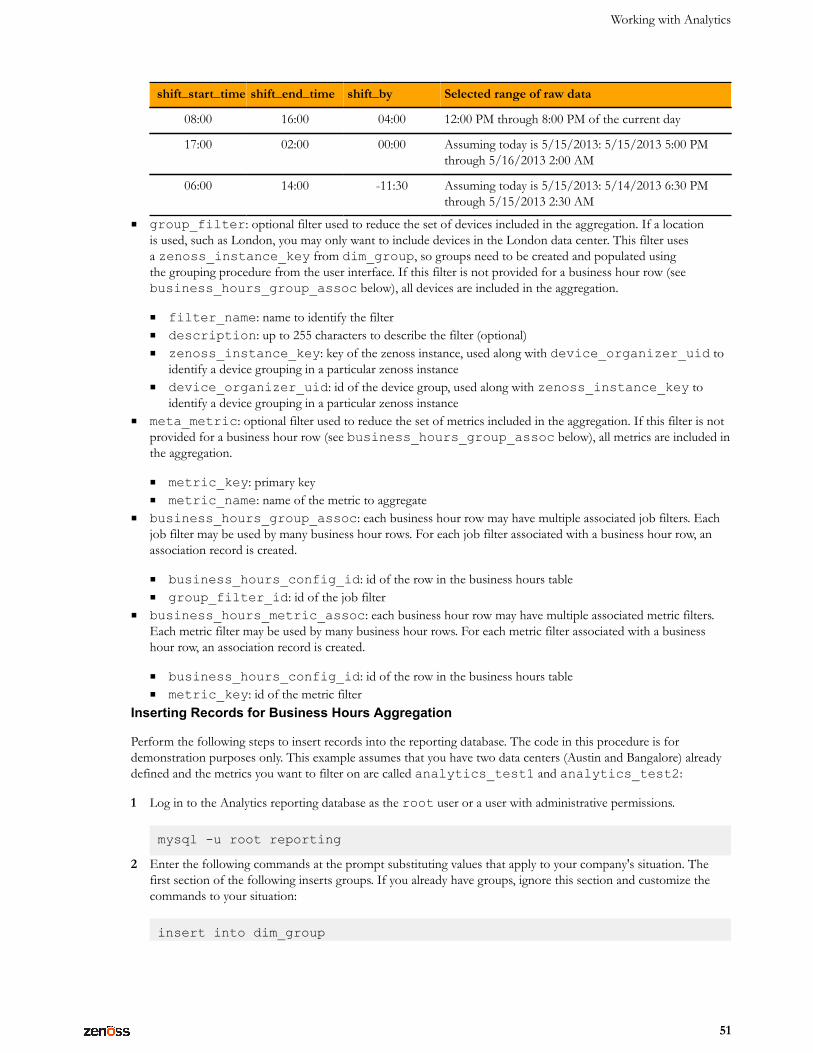
Working with Analytics
51
shift_start_time shift_end_time shift_by Selected range of raw data
08:00 16:00 04:00 12:00 PM through 8:00 PM of the current day
17:00 02:00 00:00 Assuming today is 5/15/2013: 5/15/2013 5:00 PMthrough 5/16/2013 2:00 AM
06:00 14:00 -11:30 Assuming today is 5/15/2013: 5/14/2013 6:30 PMthrough 5/15/2013 2:30 AM
■ group_filter: optional filter used to reduce the set of devices included in the aggregation. If a locationis used, such as London, you may only want to include devices in the London data center. This filter usesa zenoss_instance_key from dim_group, so groups need to be created and populated usingthe grouping procedure from the user interface. If this filter is not provided for a business hour row (seebusiness_hours_group_assoc below), all devices are included in the aggregation.
■ filter_name: name to identify the filter■ description: up to 255 characters to describe the filter (optional)■ zenoss_instance_key: key of the zenoss instance, used along with device_organizer_uid to
identify a device grouping in a particular zenoss instance■ device_organizer_uid: id of the device group, used along with zenoss_instance_key to
identify a device grouping in a particular zenoss instance■ meta_metric: optional filter used to reduce the set of metrics included in the aggregation. If this filter is not
provided for a business hour row (see business_hours_group_assoc below), all metrics are included inthe aggregation.
■ metric_key: primary key■ metric_name: name of the metric to aggregate
■ business_hours_group_assoc: each business hour row may have multiple associated job filters. Eachjob filter may be used by many business hour rows. For each job filter associated with a business hour row, anassociation record is created.
■ business_hours_config_id: id of the row in the business hours table■ group_filter_id: id of the job filter
■ business_hours_metric_assoc: each business hour row may have multiple associated metric filters.Each metric filter may be used by many business hour rows. For each metric filter associated with a businesshour row, an association record is created.
■ business_hours_config_id: id of the row in the business hours table■ metric_key: id of the metric filter
Inserting Records for Business Hours Aggregation
Perform the following steps to insert records into the reporting database. The code in this procedure is fordemonstration purposes only. This example assumes that you have two data centers (Austin and Bangalore) alreadydefined and the metrics you want to filter on are called analytics_test1 and analytics_test2:
1 Log in to the Analytics reporting database as the root user or a user with administrative permissions.
mysql -u root reporting
2 Enter the following commands at the prompt substituting values that apply to your company's situation. Thefirst section of the following inserts groups. If you already have groups, ignore this section and customize thecommands to your situation:
insert into dim_group
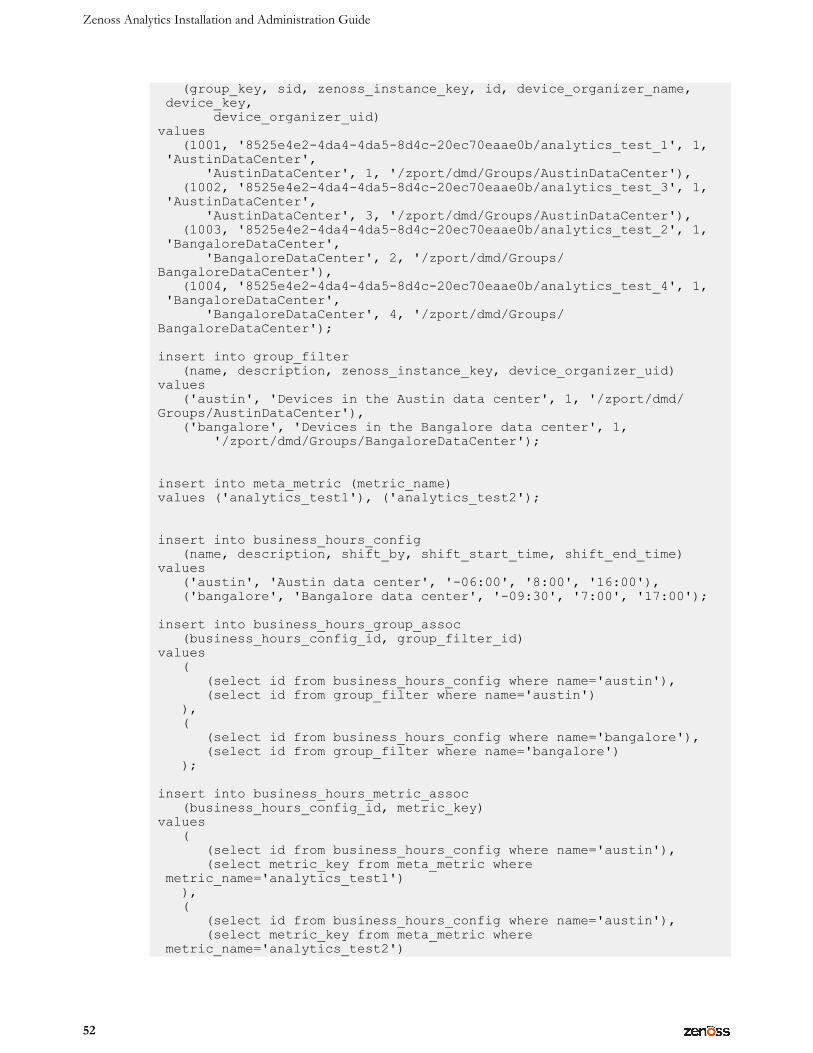
Zenoss Analytics Installation and Administration Guide
52
(group_key, sid, zenoss_instance_key, id, device_organizer_name, device_key, device_organizer_uid)values (1001, '8525e4e2-4da4-4da5-8d4c-20ec70eaae0b/analytics_test_1', 1, 'AustinDataCenter', 'AustinDataCenter', 1, '/zport/dmd/Groups/AustinDataCenter'), (1002, '8525e4e2-4da4-4da5-8d4c-20ec70eaae0b/analytics_test_3', 1, 'AustinDataCenter', 'AustinDataCenter', 3, '/zport/dmd/Groups/AustinDataCenter'), (1003, '8525e4e2-4da4-4da5-8d4c-20ec70eaae0b/analytics_test_2', 1, 'BangaloreDataCenter', 'BangaloreDataCenter', 2, '/zport/dmd/Groups/BangaloreDataCenter'), (1004, '8525e4e2-4da4-4da5-8d4c-20ec70eaae0b/analytics_test_4', 1, 'BangaloreDataCenter', 'BangaloreDataCenter', 4, '/zport/dmd/Groups/BangaloreDataCenter'); insert into group_filter (name, description, zenoss_instance_key, device_organizer_uid)values ('austin', 'Devices in the Austin data center', 1, '/zport/dmd/Groups/AustinDataCenter'), ('bangalore', 'Devices in the Bangalore data center', 1, '/zport/dmd/Groups/BangaloreDataCenter');
insert into meta_metric (metric_name)values ('analytics_test1'), ('analytics_test2');
insert into business_hours_config (name, description, shift_by, shift_start_time, shift_end_time)values ('austin', 'Austin data center', '-06:00', '8:00', '16:00'), ('bangalore', 'Bangalore data center', '-09:30', '7:00', '17:00');
insert into business_hours_group_assoc (business_hours_config_id, group_filter_id)values ( (select id from business_hours_config where name='austin'), (select id from group_filter where name='austin') ), ( (select id from business_hours_config where name='bangalore'), (select id from group_filter where name='bangalore') );
insert into business_hours_metric_assoc (business_hours_config_id, metric_key)values ( (select id from business_hours_config where name='austin'), (select metric_key from meta_metric where metric_name='analytics_test1') ), ( (select id from business_hours_config where name='austin'), (select metric_key from meta_metric where metric_name='analytics_test2')
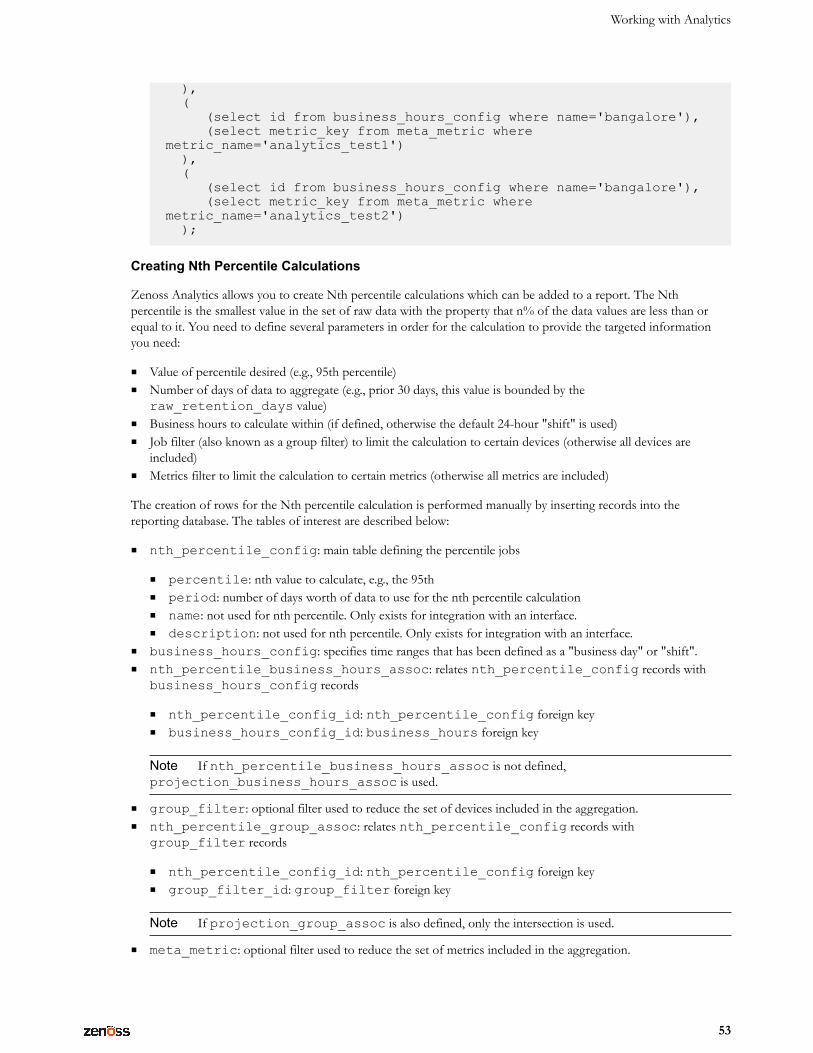
Working with Analytics
53
), ( (select id from business_hours_config where name='bangalore'), (select metric_key from meta_metric where metric_name='analytics_test1') ), ( (select id from business_hours_config where name='bangalore'), (select metric_key from meta_metric where metric_name='analytics_test2') );
Creating Nth Percentile Calculations
Zenoss Analytics allows you to create Nth percentile calculations which can be added to a report. The Nthpercentile is the smallest value in the set of raw data with the property that n% of the data values are less than orequal to it. You need to define several parameters in order for the calculation to provide the targeted informationyou need:
■ Value of percentile desired (e.g., 95th percentile)■ Number of days of data to aggregate (e.g., prior 30 days, this value is bounded by the
raw_retention_days value)■ Business hours to calculate within (if defined, otherwise the default 24-hour "shift" is used)■ Job filter (also known as a group filter) to limit the calculation to certain devices (otherwise all devices are
included)■ Metrics filter to limit the calculation to certain metrics (otherwise all metrics are included)
The creation of rows for the Nth percentile calculation is performed manually by inserting records into thereporting database. The tables of interest are described below:
■ nth_percentile_config: main table defining the percentile jobs
■ percentile: nth value to calculate, e.g., the 95th■ period: number of days worth of data to use for the nth percentile calculation■ name: not used for nth percentile. Only exists for integration with an interface.■ description: not used for nth percentile. Only exists for integration with an interface.
■ business_hours_config: specifies time ranges that has been defined as a "business day" or "shift".■ nth_percentile_business_hours_assoc: relates nth_percentile_config records with
business_hours_config records
■ nth_percentile_config_id: nth_percentile_config foreign key■ business_hours_config_id: business_hours foreign key
Note If nth_percentile_business_hours_assoc is not defined,projection_business_hours_assoc is used.
■ group_filter: optional filter used to reduce the set of devices included in the aggregation.■ nth_percentile_group_assoc: relates nth_percentile_config records with
group_filter records
■ nth_percentile_config_id: nth_percentile_config foreign key■ group_filter_id: group_filter foreign key
Note If projection_group_assoc is also defined, only the intersection is used.
■ meta_metric: optional filter used to reduce the set of metrics included in the aggregation.
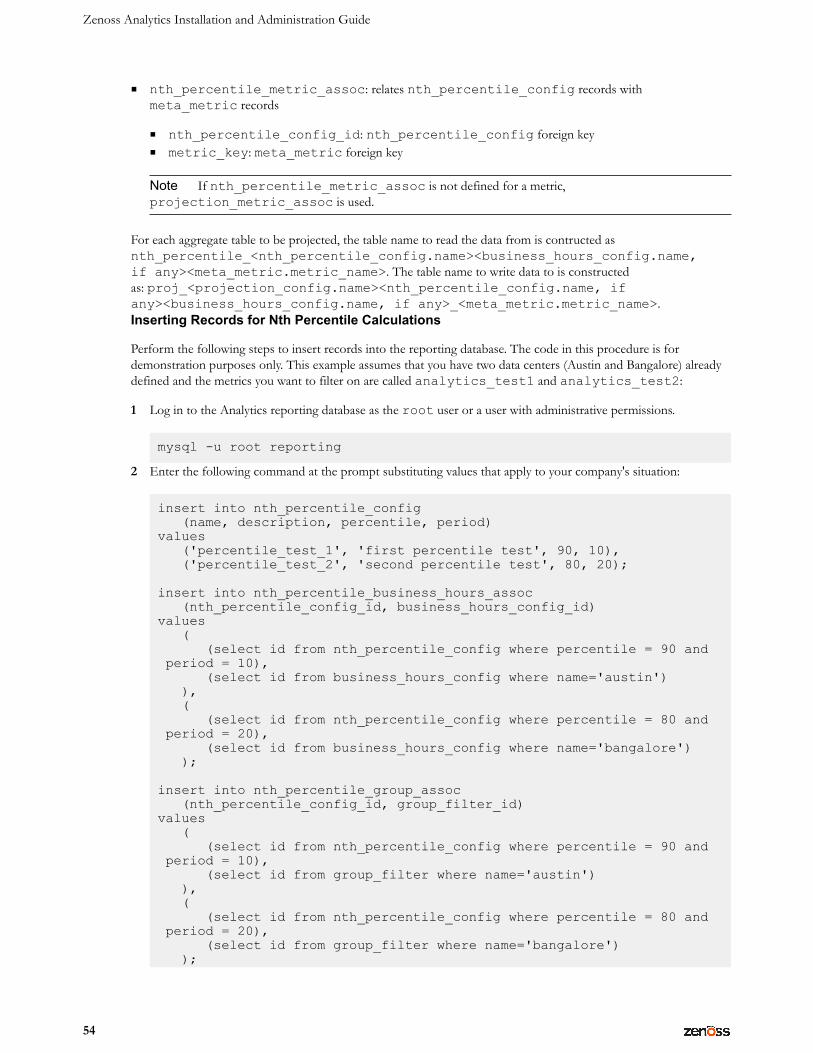
Zenoss Analytics Installation and Administration Guide
54
■ nth_percentile_metric_assoc: relates nth_percentile_config records withmeta_metric records
■ nth_percentile_config_id: nth_percentile_config foreign key■ metric_key: meta_metric foreign key
Note If nth_percentile_metric_assoc is not defined for a metric,projection_metric_assoc is used.
For each aggregate table to be projected, the table name to read the data from is contructed asnth_percentile_<nth_percentile_config.name><business_hours_config.name,if any><meta_metric.metric_name>. The table name to write data to is constructedas: proj_<projection_config.name><nth_percentile_config.name, ifany><business_hours_config.name, if any>_<meta_metric.metric_name>.Inserting Records for Nth Percentile Calculations
Perform the following steps to insert records into the reporting database. The code in this procedure is fordemonstration purposes only. This example assumes that you have two data centers (Austin and Bangalore) alreadydefined and the metrics you want to filter on are called analytics_test1 and analytics_test2:
1 Log in to the Analytics reporting database as the root user or a user with administrative permissions.
mysql -u root reporting
2 Enter the following command at the prompt substituting values that apply to your company's situation:
insert into nth_percentile_config (name, description, percentile, period)values ('percentile_test_1', 'first percentile test', 90, 10), ('percentile_test_2', 'second percentile test', 80, 20);
insert into nth_percentile_business_hours_assoc (nth_percentile_config_id, business_hours_config_id)values ( (select id from nth_percentile_config where percentile = 90 and period = 10), (select id from business_hours_config where name='austin') ), ( (select id from nth_percentile_config where percentile = 80 and period = 20), (select id from business_hours_config where name='bangalore') );
insert into nth_percentile_group_assoc (nth_percentile_config_id, group_filter_id)values ( (select id from nth_percentile_config where percentile = 90 and period = 10), (select id from group_filter where name='austin') ), ( (select id from nth_percentile_config where percentile = 80 and period = 20), (select id from group_filter where name='bangalore') );
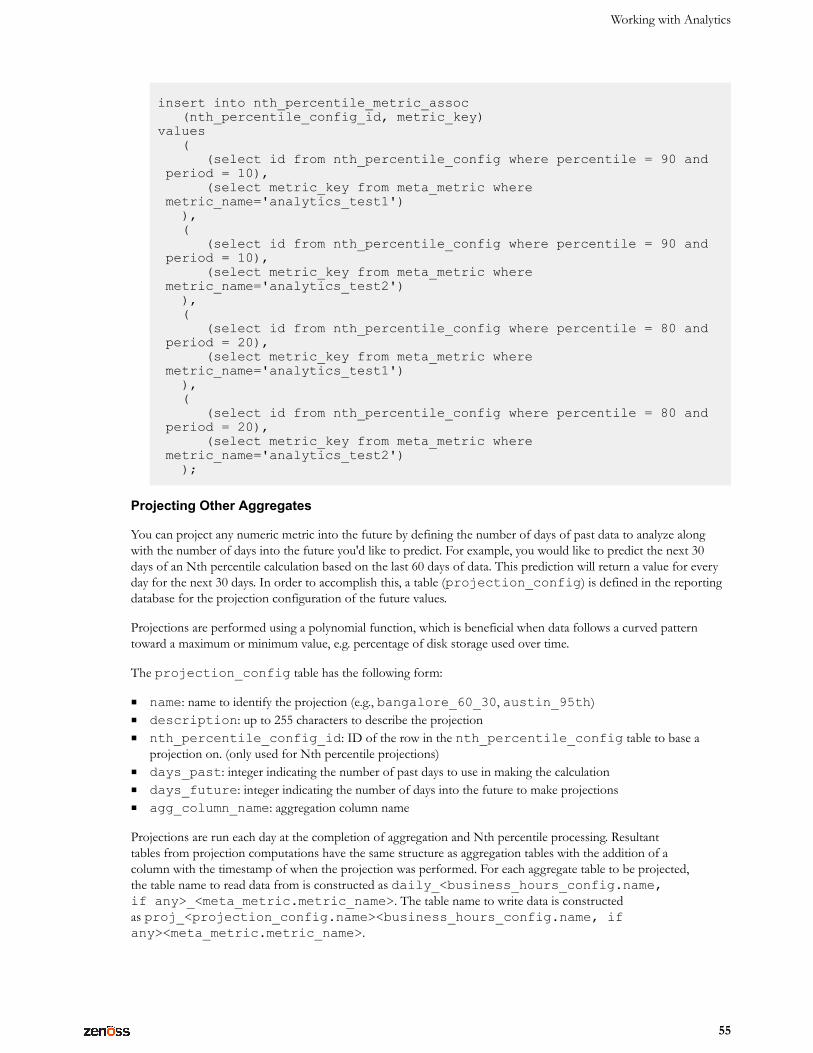
Working with Analytics
55
insert into nth_percentile_metric_assoc (nth_percentile_config_id, metric_key)values ( (select id from nth_percentile_config where percentile = 90 and period = 10), (select metric_key from meta_metric where metric_name='analytics_test1') ), ( (select id from nth_percentile_config where percentile = 90 and period = 10), (select metric_key from meta_metric where metric_name='analytics_test2') ), ( (select id from nth_percentile_config where percentile = 80 and period = 20), (select metric_key from meta_metric where metric_name='analytics_test1') ), ( (select id from nth_percentile_config where percentile = 80 and period = 20), (select metric_key from meta_metric where metric_name='analytics_test2') );
Projecting Other Aggregates
You can project any numeric metric into the future by defining the number of days of past data to analyze alongwith the number of days into the future you'd like to predict. For example, you would like to predict the next 30days of an Nth percentile calculation based on the last 60 days of data. This prediction will return a value for everyday for the next 30 days. In order to accomplish this, a table (projection_config) is defined in the reportingdatabase for the projection configuration of the future values.
Projections are performed using a polynomial function, which is beneficial when data follows a curved patterntoward a maximum or minimum value, e.g. percentage of disk storage used over time.
The projection_config table has the following form:
■ name: name to identify the projection (e.g., bangalore_60_30, austin_95th)■ description: up to 255 characters to describe the projection■ nth_percentile_config_id: ID of the row in the nth_percentile_config table to base a
projection on. (only used for Nth percentile projections)■ days_past: integer indicating the number of past days to use in making the calculation■ days_future: integer indicating the number of days into the future to make projections■ agg_column_name: aggregation column name
Projections are run each day at the completion of aggregation and Nth percentile processing. Resultanttables from projection computations have the same structure as aggregation tables with the addition of acolumn with the timestamp of when the projection was performed. For each aggregate table to be projected,the table name to read data from is constructed as daily_<business_hours_config.name,if any>_<meta_metric.metric_name>. The table name to write data is constructedas proj_<projection_config.name><business_hours_config.name, ifany><meta_metric.metric_name>.
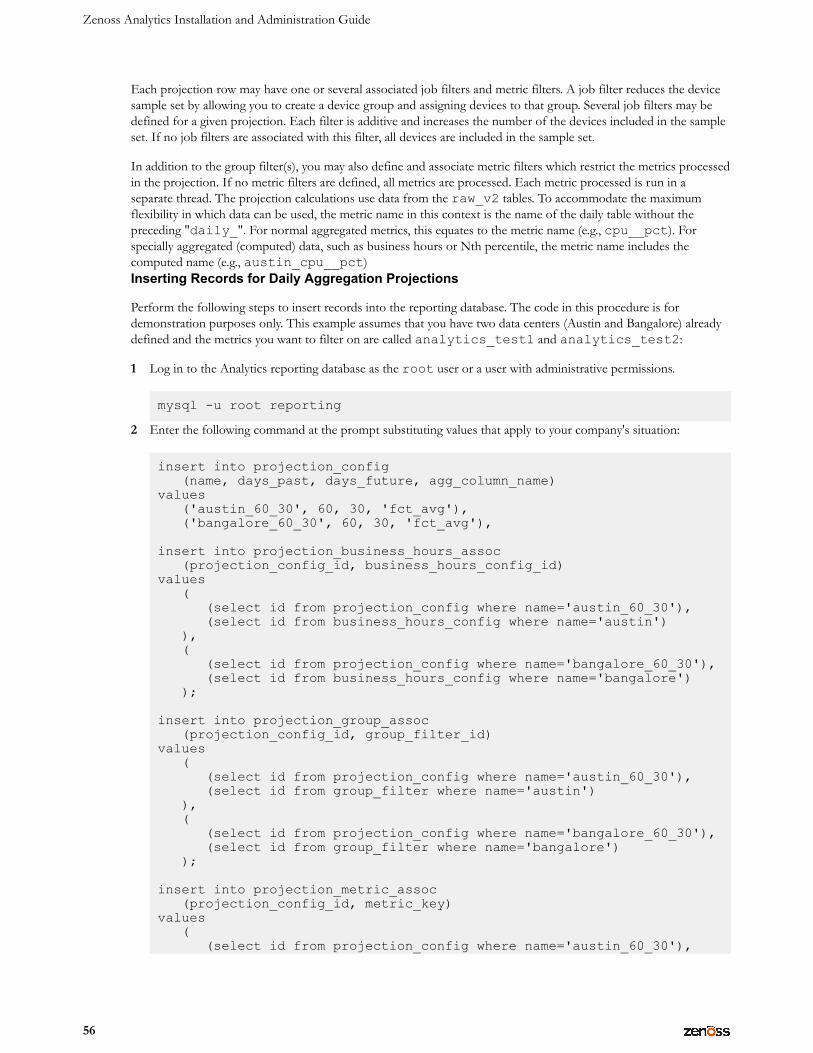
Zenoss Analytics Installation and Administration Guide
56
Each projection row may have one or several associated job filters and metric filters. A job filter reduces the devicesample set by allowing you to create a device group and assigning devices to that group. Several job filters may bedefined for a given projection. Each filter is additive and increases the number of the devices included in the sampleset. If no job filters are associated with this filter, all devices are included in the sample set.
In addition to the group filter(s), you may also define and associate metric filters which restrict the metrics processedin the projection. If no metric filters are defined, all metrics are processed. Each metric processed is run in aseparate thread. The projection calculations use data from the raw_v2 tables. To accommodate the maximumflexibility in which data can be used, the metric name in this context is the name of the daily table without thepreceding "daily_". For normal aggregated metrics, this equates to the metric name (e.g., cpu__pct). Forspecially aggregated (computed) data, such as business hours or Nth percentile, the metric name includes thecomputed name (e.g., austin_cpu__pct)Inserting Records for Daily Aggregation Projections
Perform the following steps to insert records into the reporting database. The code in this procedure is fordemonstration purposes only. This example assumes that you have two data centers (Austin and Bangalore) alreadydefined and the metrics you want to filter on are called analytics_test1 and analytics_test2:
1 Log in to the Analytics reporting database as the root user or a user with administrative permissions.
mysql -u root reporting
2 Enter the following command at the prompt substituting values that apply to your company's situation:
insert into projection_config (name, days_past, days_future, agg_column_name)values ('austin_60_30', 60, 30, 'fct_avg'), ('bangalore_60_30', 60, 30, 'fct_avg'), insert into projection_business_hours_assoc (projection_config_id, business_hours_config_id)values ( (select id from projection_config where name='austin_60_30'), (select id from business_hours_config where name='austin') ), ( (select id from projection_config where name='bangalore_60_30'), (select id from business_hours_config where name='bangalore') ); insert into projection_group_assoc (projection_config_id, group_filter_id)values ( (select id from projection_config where name='austin_60_30'), (select id from group_filter where name='austin') ), ( (select id from projection_config where name='bangalore_60_30'), (select id from group_filter where name='bangalore') ); insert into projection_metric_assoc (projection_config_id, metric_key)values ( (select id from projection_config where name='austin_60_30'),
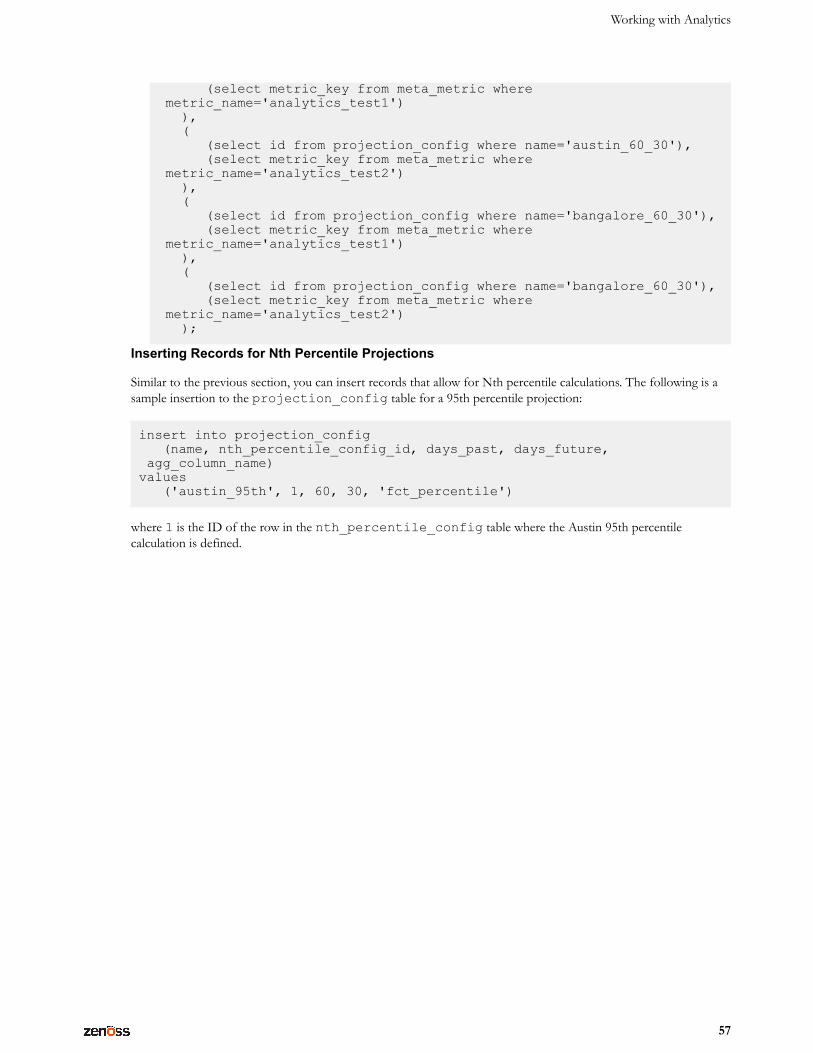
Working with Analytics
57
(select metric_key from meta_metric where metric_name='analytics_test1') ), ( (select id from projection_config where name='austin_60_30'), (select metric_key from meta_metric where metric_name='analytics_test2') ), ( (select id from projection_config where name='bangalore_60_30'), (select metric_key from meta_metric where metric_name='analytics_test1') ), ( (select id from projection_config where name='bangalore_60_30'), (select metric_key from meta_metric where metric_name='analytics_test2') );
Inserting Records for Nth Percentile Projections
Similar to the previous section, you can insert records that allow for Nth percentile calculations. The following is asample insertion to the projection_config table for a 95th percentile projection:
insert into projection_config (name, nth_percentile_config_id, days_past, days_future, agg_column_name)values ('austin_95th', 1, 60, 30, 'fct_percentile')
where 1 is the ID of the row in the nth_percentile_config table where the Austin 95th percentilecalculation is defined.
Zenoss Analytics Installation and Administration Guide
58
Third Party Licenses AZenoss Analytics incorporates third party components whose licenses require us to mention their inclusion. Formore information, see the following sites:
■ Antlr - http://www.antlr.org/■ AspectJ weaver - https://eclipse.org/aspectj/■ Java Specification Request (JSR) 250 - https://jcp.org/en/jsr/detail?id=250■ connector-api-1.5
ERD Diagram for Analytics 5.0.0
59
ERD Diagram for Analytics 5.0.0 BThe following page shows the Entity-Relationship Diagram (ERD) for Analytics 5.0.0. You will find therelationships shown between tables in the database as well as a sample of dynamically created dimension tables.
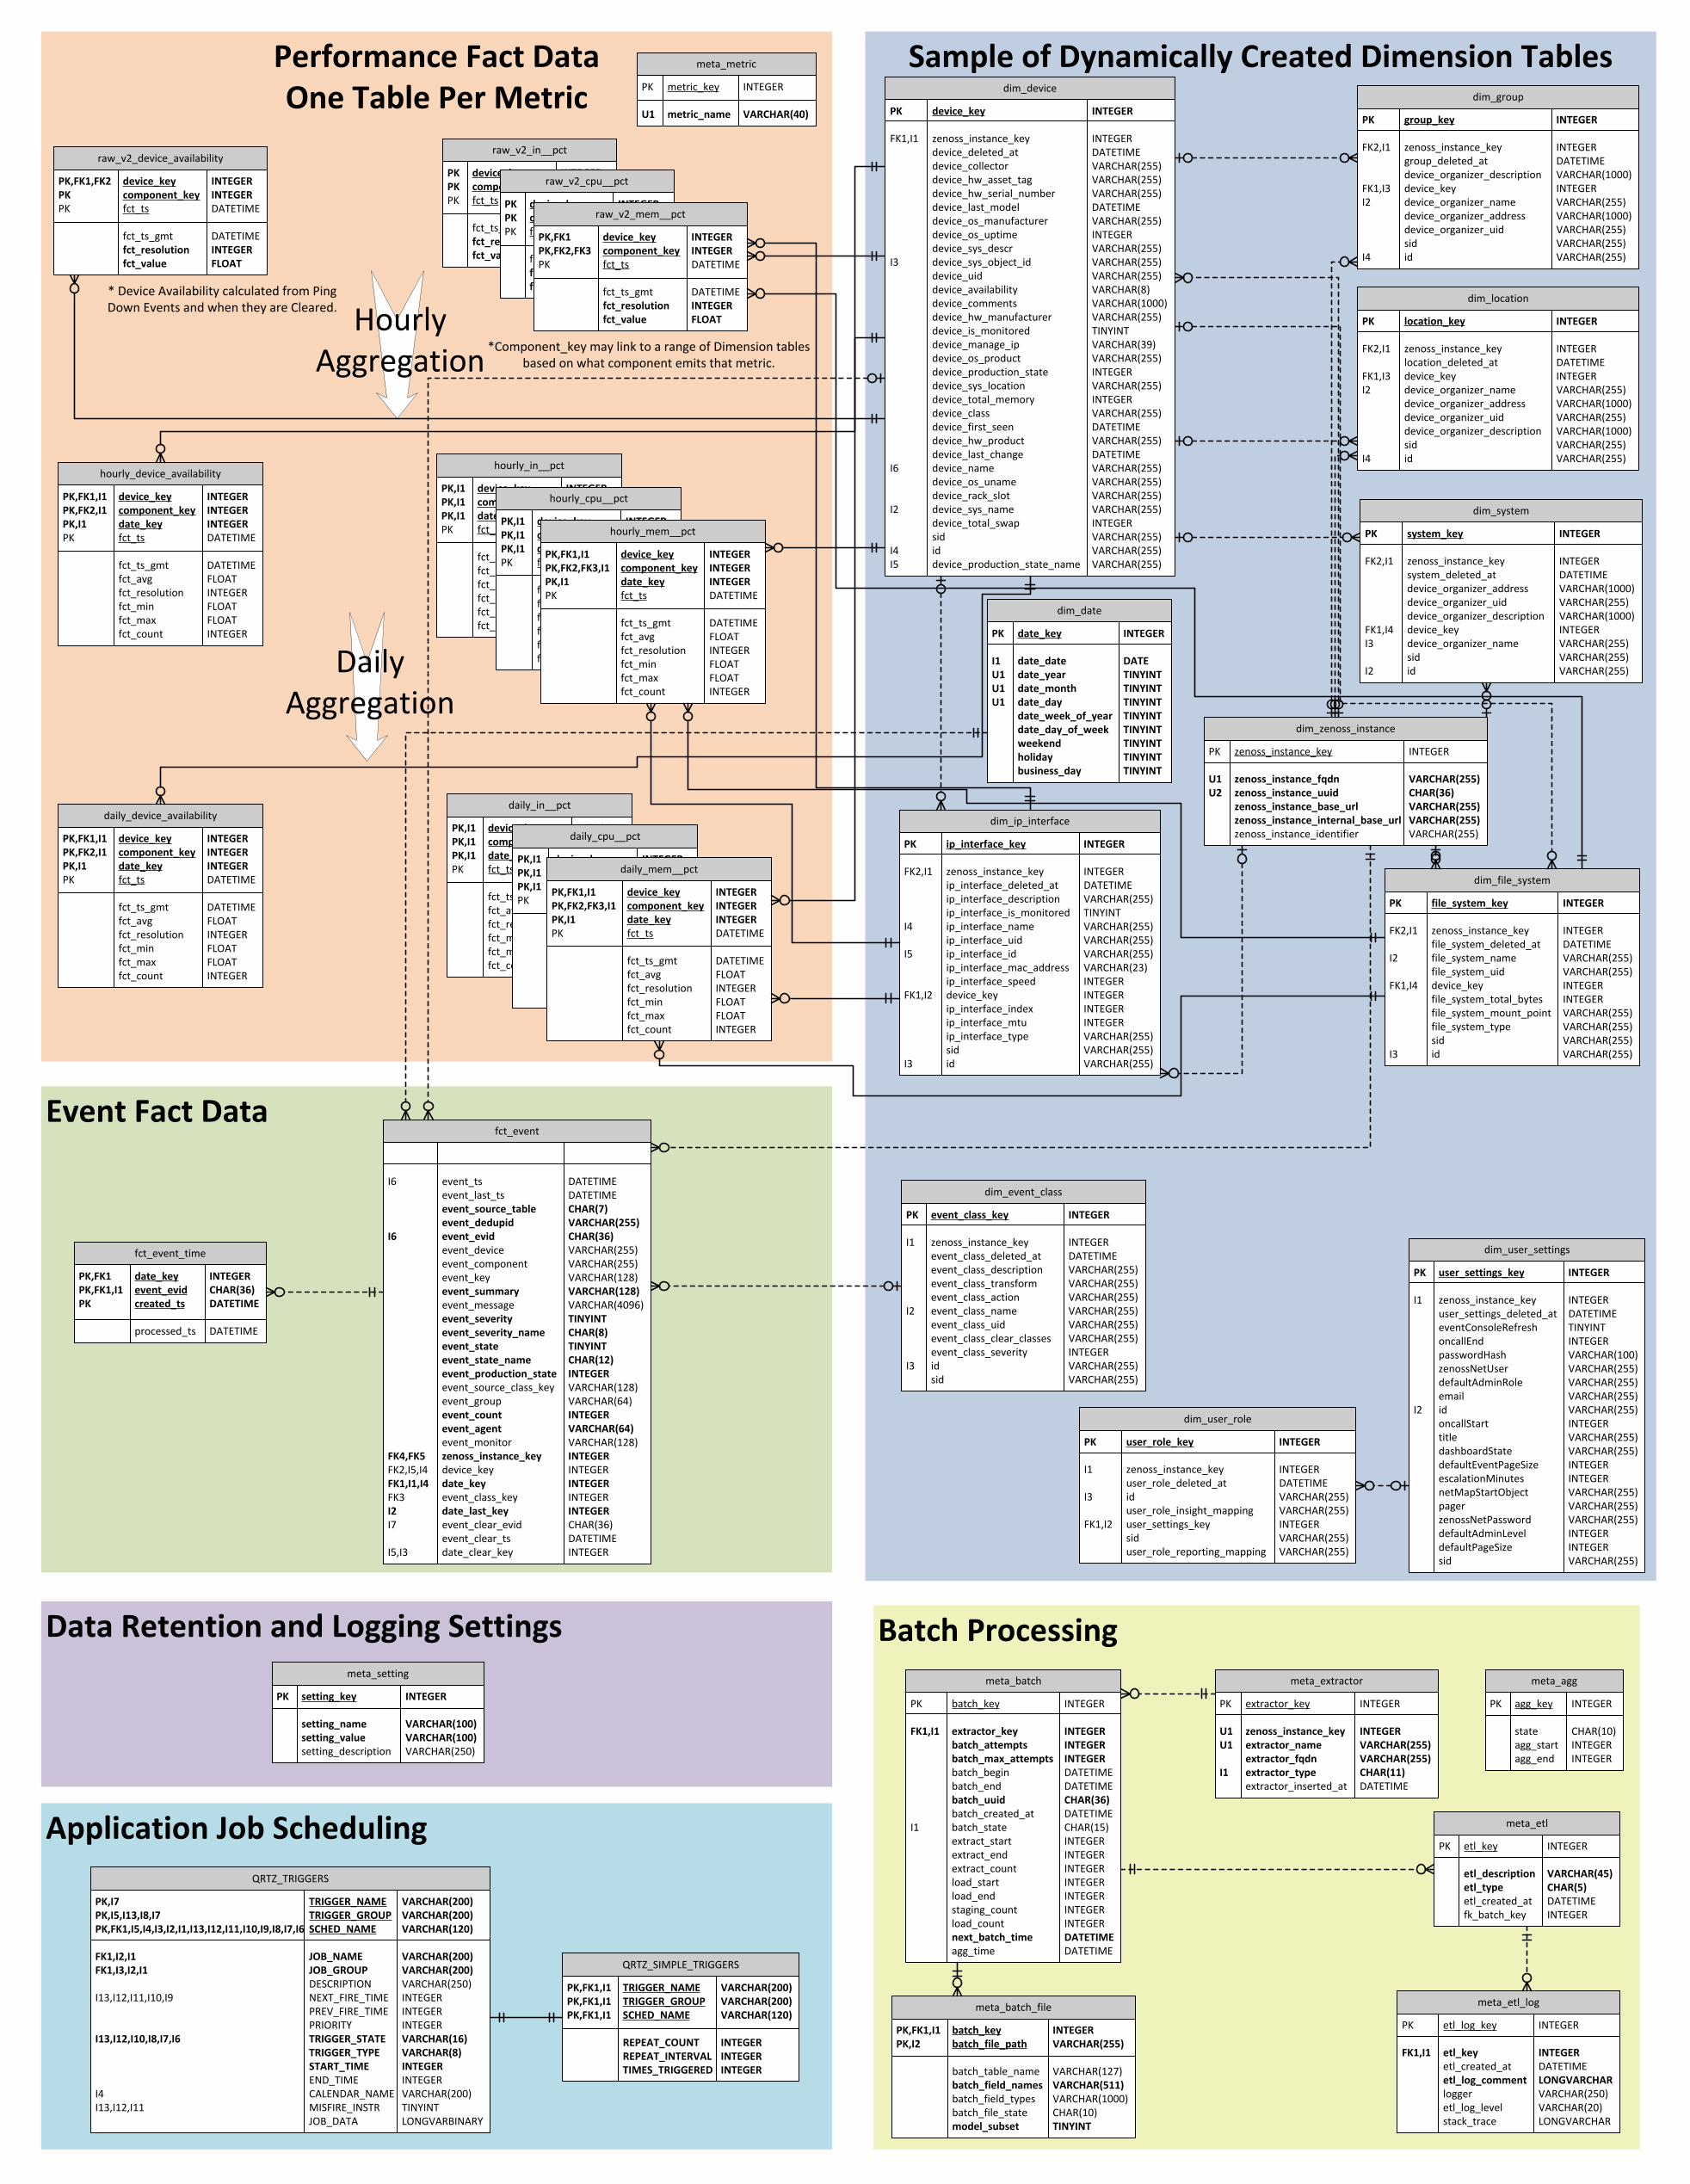
Application Job Scheduling
Data Retention and Logging Settings
Sample of Dynamically Created Dimension Tables
Batch Processing
Event Fact Data
Performance Fact DataOne Table Per Metric
dim_file_system
PK file_system_key INTEGER
FK2,I1 zenoss_instance_key INTEGER file_system_deleted_at DATETIMEI2 file_system_name VARCHAR(255) file_system_uid VARCHAR(255)FK1,I4 device_key INTEGER file_system_total_bytes INTEGER file_system_mount_point VARCHAR(255) file_system_type VARCHAR(255) sid VARCHAR(255)I3 id VARCHAR(255)
dim_location
PK location_key INTEGER
FK2,I1 zenoss_instance_key INTEGER location_deleted_at DATETIMEFK1,I3 device_key INTEGERI2 device_organizer_name VARCHAR(255) device_organizer_address VARCHAR(1000) device_organizer_uid VARCHAR(255) device_organizer_description VARCHAR(1000) sid VARCHAR(255)I4 id VARCHAR(255)
dim_zenoss_instance
PK zenoss_instance_key INTEGER
U1 zenoss_instance_fqdn VARCHAR(255)U2 zenoss_instance_uuid CHAR(36) zenoss_instance_base_url VARCHAR(255) zenoss_instance_internal_base_url VARCHAR(255) zenoss_instance_identifier VARCHAR(255)
dim_date
PK date_key INTEGER
I1 date_date DATEU1 date_year TINYINTU1 date_month TINYINTU1 date_day TINYINT date_week_of_year TINYINT date_day_of_week TINYINT weekend TINYINT holiday TINYINT business_day TINYINT
dim_group
PK group_key INTEGER
FK2,I1 zenoss_instance_key INTEGER group_deleted_at DATETIME device_organizer_description VARCHAR(1000)FK1,I3 device_key INTEGERI2 device_organizer_name VARCHAR(255) device_organizer_address VARCHAR(1000) device_organizer_uid VARCHAR(255) sid VARCHAR(255)I4 id VARCHAR(255)
dim_user_role
PK user_role_key INTEGER
I1 zenoss_instance_key INTEGER user_role_deleted_at DATETIMEI3 id VARCHAR(255) user_role_insight_mapping VARCHAR(255)FK1,I2 user_settings_key INTEGER sid VARCHAR(255) user_role_reporting_mapping VARCHAR(255)
dim_user_settings
PK user_settings_key INTEGER
I1 zenoss_instance_key INTEGER user_settings_deleted_at DATETIME eventConsoleRefresh TINYINT oncallEnd INTEGER passwordHash VARCHAR(100) zenossNetUser VARCHAR(255) defaultAdminRole VARCHAR(255) email VARCHAR(255)I2 id VARCHAR(255) oncallStart INTEGER title VARCHAR(255) dashboardState VARCHAR(255) defaultEventPageSize INTEGER escalationMinutes INTEGER netMapStartObject VARCHAR(255) pager VARCHAR(255) zenossNetPassword VARCHAR(255) defaultAdminLevel INTEGER defaultPageSize INTEGER sid VARCHAR(255)
dim_system
PK system_key INTEGER
FK2,I1 zenoss_instance_key INTEGER system_deleted_at DATETIME device_organizer_address VARCHAR(1000) device_organizer_uid VARCHAR(255) device_organizer_description VARCHAR(1000)FK1,I4 device_key INTEGERI3 device_organizer_name VARCHAR(255) sid VARCHAR(255)I2 id VARCHAR(255)
dim_ip_interface
PK ip_interface_key INTEGER
FK2,I1 zenoss_instance_key INTEGER ip_interface_deleted_at DATETIME ip_interface_description VARCHAR(255) ip_interface_is_monitored TINYINTI4 ip_interface_name VARCHAR(255) ip_interface_uid VARCHAR(255)I5 ip_interface_id VARCHAR(255) ip_interface_mac_address VARCHAR(23) ip_interface_speed INTEGERFK1,I2 device_key INTEGER ip_interface_index INTEGER ip_interface_mtu INTEGER ip_interface_type VARCHAR(255) sid VARCHAR(255)I3 id VARCHAR(255)
dim_event_class
PK event_class_key INTEGER
I1 zenoss_instance_key INTEGER event_class_deleted_at DATETIME event_class_description VARCHAR(255) event_class_transform VARCHAR(255) event_class_action VARCHAR(255)I2 event_class_name VARCHAR(255) event_class_uid VARCHAR(255) event_class_clear_classes VARCHAR(255) event_class_severity INTEGERI3 id VARCHAR(255) sid VARCHAR(255)
dim_device
PK device_key INTEGER
FK1,I1 zenoss_instance_key INTEGER device_deleted_at DATETIME device_collector VARCHAR(255) device_hw_asset_tag VARCHAR(255) device_hw_serial_number VARCHAR(255) device_last_model DATETIME device_os_manufacturer VARCHAR(255) device_os_uptime INTEGER device_sys_descr VARCHAR(255)I3 device_sys_object_id VARCHAR(255) device_uid VARCHAR(255) device_availability VARCHAR(8) device_comments VARCHAR(1000) device_hw_manufacturer VARCHAR(255) device_is_monitored TINYINT device_manage_ip VARCHAR(39) device_os_product VARCHAR(255) device_production_state INTEGER device_sys_location VARCHAR(255) device_total_memory INTEGER device_class VARCHAR(255) device_first_seen DATETIME device_hw_product VARCHAR(255) device_last_change DATETIMEI6 device_name VARCHAR(255) device_os_uname VARCHAR(255) device_rack_slot VARCHAR(255)I2 device_sys_name VARCHAR(255) device_total_swap INTEGER sid VARCHAR(255)I4 id VARCHAR(255)I5 device_production_state_name VARCHAR(255)
fct_event_time
PK,FK1 date_key INTEGERPK,FK1,I1 event_evid CHAR(36)PK created_ts DATETIME
processed_ts DATETIME
fct_event
I6 event_ts DATETIME event_last_ts DATETIME event_source_table CHAR(7) event_dedupid VARCHAR(255)I6 event_evid CHAR(36) event_device VARCHAR(255) event_component VARCHAR(255) event_key VARCHAR(128) event_summary VARCHAR(128) event_message VARCHAR(4096) event_severity TINYINT event_severity_name CHAR(8) event_state TINYINT event_state_name CHAR(12) event_production_state INTEGER event_source_class_key VARCHAR(128) event_group VARCHAR(64) event_count INTEGER event_agent VARCHAR(64) event_monitor VARCHAR(128)FK4,FK5 zenoss_instance_key INTEGERFK2,I5,I4 device_key INTEGERFK1,I1,I4 date_key INTEGERFK3 event_class_key INTEGERI2 date_last_key INTEGERI7 event_clear_evid CHAR(36) event_clear_ts DATETIMEI5,I3 date_clear_key INTEGER
meta_etl
PK etl_key INTEGER
etl_description VARCHAR(45) etl_type CHAR(5) etl_created_at DATETIME fk_batch_key INTEGER
meta_batch
PK batch_key INTEGER
FK1,I1 extractor_key INTEGER batch_attempts INTEGER batch_max_attempts INTEGER batch_begin DATETIME batch_end DATETIME batch_uuid CHAR(36) batch_created_at DATETIMEI1 batch_state CHAR(15) extract_start INTEGER extract_end INTEGER extract_count INTEGER load_start INTEGER load_end INTEGER staging_count INTEGER load_count INTEGER next_batch_time DATETIME agg_time DATETIME
meta_etl_log
PK etl_log_key INTEGER
FK1,I1 etl_key INTEGER etl_created_at DATETIME etl_log_comment LONGVARCHAR logger VARCHAR(250) etl_log_level VARCHAR(20) stack_trace LONGVARCHAR
meta_extractor
PK extractor_key INTEGER
U1 zenoss_instance_key INTEGERU1 extractor_name VARCHAR(255) extractor_fqdn VARCHAR(255)I1 extractor_type CHAR(11) extractor_inserted_at DATETIME
meta_batch_file
PK,FK1,I1 batch_key INTEGERPK,I2 batch_file_path VARCHAR(255)
batch_table_name VARCHAR(127) batch_field_names VARCHAR(511) batch_field_types VARCHAR(1000) batch_file_state CHAR(10) model_subset TINYINT
meta_metric
PK metric_key INTEGER
U1 metric_name VARCHAR(40)
meta_setting
PK setting_key INTEGER
setting_name VARCHAR(100) setting_value VARCHAR(100) setting_description VARCHAR(250)
Hourly Aggregation
QRTZ_TRIGGERS
PK,I7 TRIGGER_NAME VARCHAR(200)PK,I5,I13,I8,I7 TRIGGER_GROUP VARCHAR(200)PK,FK1,I5,I4,I3,I2,I1,I13,I12,I11,I10,I9,I8,I7,I6 SCHED_NAME VARCHAR(120)
FK1,I2,I1 JOB_NAME VARCHAR(200)FK1,I3,I2,I1 JOB_GROUP VARCHAR(200) DESCRIPTION VARCHAR(250)I13,I12,I11,I10,I9 NEXT_FIRE_TIME INTEGER PREV_FIRE_TIME INTEGER PRIORITY INTEGERI13,I12,I10,I8,I7,I6 TRIGGER_STATE VARCHAR(16) TRIGGER_TYPE VARCHAR(8) START_TIME INTEGER END_TIME INTEGERI4 CALENDAR_NAME VARCHAR(200)I13,I12,I11 MISFIRE_INSTR TINYINT JOB_DATA LONGVARBINARY
QRTZ_SIMPLE_TRIGGERS
PK,FK1,I1 TRIGGER_NAME VARCHAR(200)PK,FK1,I1 TRIGGER_GROUP VARCHAR(200)PK,FK1,I1 SCHED_NAME VARCHAR(120)
REPEAT_COUNT INTEGER REPEAT_INTERVAL INTEGER TIMES_TRIGGERED INTEGER
raw_v2_device_availability
PK,FK1,FK2 device_key INTEGERPK component_key INTEGERPK fct_ts DATETIME
fct_ts_gmt DATETIME fct_resolution INTEGER fct_value FLOAT
raw_v2_in__pct
PK device_key INTEGERPK component_key INTEGERPK fct_ts DATETIME
fct_ts_gmt DATETIME fct_resolution INTEGER fct_value FLOAT
raw_v2_cpu__pct
PK device_key INTEGERPK component_key INTEGERPK fct_ts DATETIME
fct_ts_gmt DATETIME fct_resolution INTEGER fct_value FLOAT
raw_v2_mem__pct
PK,FK1 device_key INTEGERPK,FK2,FK3 component_key INTEGERPK fct_ts DATETIME
fct_ts_gmt DATETIME fct_resolution INTEGER fct_value FLOAT
hourly_in__pct
PK,I1 device_key INTEGERPK,I1 component_key INTEGERPK,I1 date_key INTEGERPK fct_ts DATETIME
fct_ts_gmt DATETIME fct_avg FLOAT fct_resolution INTEGER fct_min FLOAT fct_max FLOAT fct_count INTEGER
hourly_device_availability
PK,FK1,I1 device_key INTEGERPK,FK2,I1 component_key INTEGERPK,I1 date_key INTEGERPK fct_ts DATETIME
fct_ts_gmt DATETIME fct_avg FLOAT fct_resolution INTEGER fct_min FLOAT fct_max FLOAT fct_count INTEGER
daily_in__pct
PK,I1 device_key INTEGERPK,I1 component_key INTEGERPK,I1 date_key INTEGERPK fct_ts DATETIME
fct_ts_gmt DATETIME fct_avg FLOAT fct_resolution INTEGER fct_min FLOAT fct_max FLOAT fct_count INTEGER
daily_device_availability
PK,FK1,I1 device_key INTEGERPK,FK2,I1 component_key INTEGERPK,I1 date_key INTEGERPK fct_ts DATETIME
fct_ts_gmt DATETIME fct_avg FLOAT fct_resolution INTEGER fct_min FLOAT fct_max FLOAT fct_count INTEGER
hourly_cpu__pct
PK,I1 device_key INTEGERPK,I1 component_key INTEGERPK,I1 date_key INTEGERPK fct_ts DATETIME
fct_ts_gmt DATETIME fct_avg FLOAT fct_resolution INTEGER fct_min FLOAT fct_max FLOAT fct_count INTEGER
hourly_mem__pct
PK,FK1,I1 device_key INTEGERPK,FK2,FK3,I1 component_key INTEGERPK,I1 date_key INTEGERPK fct_ts DATETIME
fct_ts_gmt DATETIME fct_avg FLOAT fct_resolution INTEGER fct_min FLOAT fct_max FLOAT fct_count INTEGER
daily_cpu__pct
PK,I1 device_key INTEGERPK,I1 component_key INTEGERPK,I1 date_key INTEGERPK fct_ts DATETIME
fct_ts_gmt DATETIME fct_avg FLOAT fct_resolution INTEGER fct_min FLOAT fct_max FLOAT fct_count INTEGER
daily_mem__pct
PK,FK1,I1 device_key INTEGERPK,FK2,FK3,I1 component_key INTEGERPK,I1 date_key INTEGERPK fct_ts DATETIME
fct_ts_gmt DATETIME fct_avg FLOAT fct_resolution INTEGER fct_min FLOAT fct_max FLOAT fct_count INTEGER
* Device Availability calculated from Ping Down Events and when they are Cleared.
Daily Aggregation
meta_agg
PK agg_key INTEGER
state CHAR(10) agg_start INTEGER agg_end INTEGER
*Component_key may link to a range of Dimension tables based on what component emits that metric.