addressing adolescent anaemia we must act now dr. sheila vir
TRANSCRIPT
ADDRESSING ADOLESCENT ANAEMIA
We Must Act Now
Dr. Sheila Vir

Iron Deficiency and Iron Deficiency Anaemia
(Global Scenario)
• Iron Deficiency - 3 out of 4 persons
• Iron Deficiency Anaemia - 1 out of every 3 persons
or IDA (2 billion)
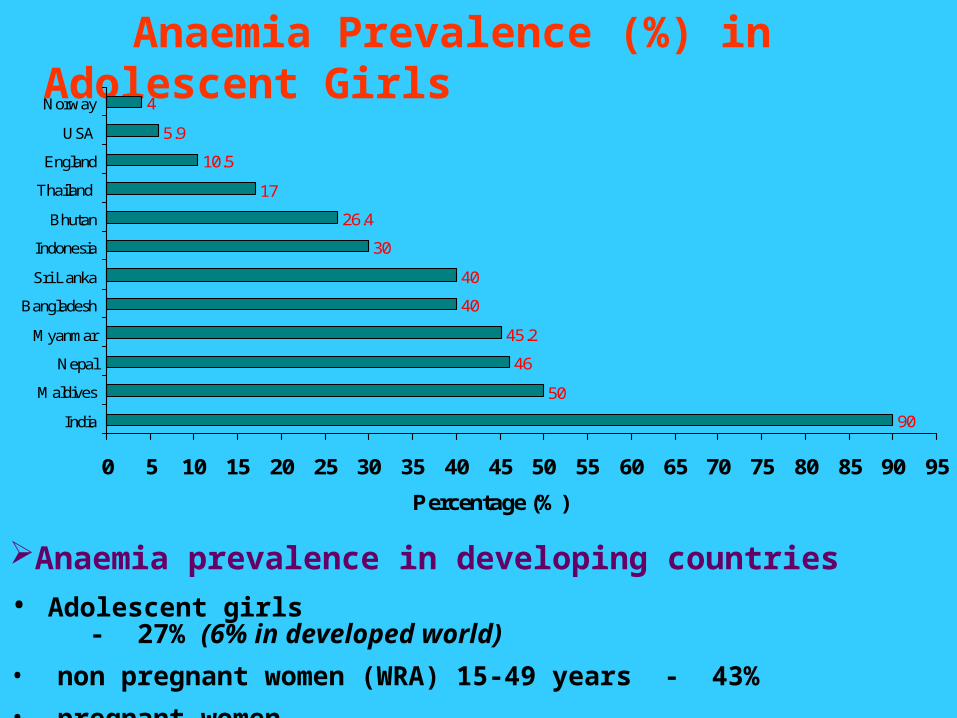
Anaemia Prevalence (%) in Adolescent Girls
90
50
46
45.2
40
40
30
26.4
17
10.5
5.9
4
0 5 10 15 20 25 30 35 40 45 50 55 60 65 70 75 80 85 90 95
India
Maldives
Nepal
Myanmar
Bangladesh
Sri Lanka
Indonesia
Bhutan
Thailand
England
USA
Norway
Percentage (%)
Anaemia prevalence in developing countries
• Adolescent girls - 27% (6% in developed world)
• non pregnant women (WRA) 15-49 years - 43%
• pregnant women - 56%

Causative Factors
• Significant increase in requirements of iron
• Low intake of bioavailable iron

Prevention of IDA
• Dietary diversification
• Fortification of food
• Iron supplements
Prevention of IDA – Both Health and Economic Issue
Iron Folic Acid Supplementation – Benefits
Investment not limited to pregnancy
Positive influence on cognitive development
Enhanced concentration in school and work
Increased physical output
Improved growth (10-14 years)
Improved appetite
Decreased morbidity
Overcome irregularity in menstruation
Investment in pregnancy (Iron supplementation during pregnancy might be too late!)
Overcome large prepregnancy deposits
Reduces chances of LBW and MMR
Reduces chances of neural tube defects (NTD)
Improves iron status of infants
Prevention of Anaemia
Daily or Weekly Dose of IFA ?
Global Efficacy and Effectiveness Trials
Meta Analysis

Weekly Iron Folic Acid Supplementation (WIFS)
is Effective for Prevention of Anaemia
in adolescent girls

53.849
6566.2
48.2
33.9
63.5
47
61.6
44.4
30.926.2
0
10
20
30
40
50
60
70
Baroda Delhi Mumbai
Percen
tag
e (
%)
WEEKLY [Baseline anaemia prevalence (%)] WEEKLY [Final anaemia prevalence (%)]
DAILY [Baseline anaemia prevalence (%)] DAILY [Final anaemia prevalence (%)]
n=438 n=441 n=506 n=617 n=680 n=558
Meta analysis (3 India + 6 others) - CONCLUSION – Weekly supplementation should be considered only in situations where there is strong assurance of supervision and high compliance (Beaton et al, 1999)
India – Impact of Daily and Weekly IFA Administration to adolescent Girls (1996-1998)
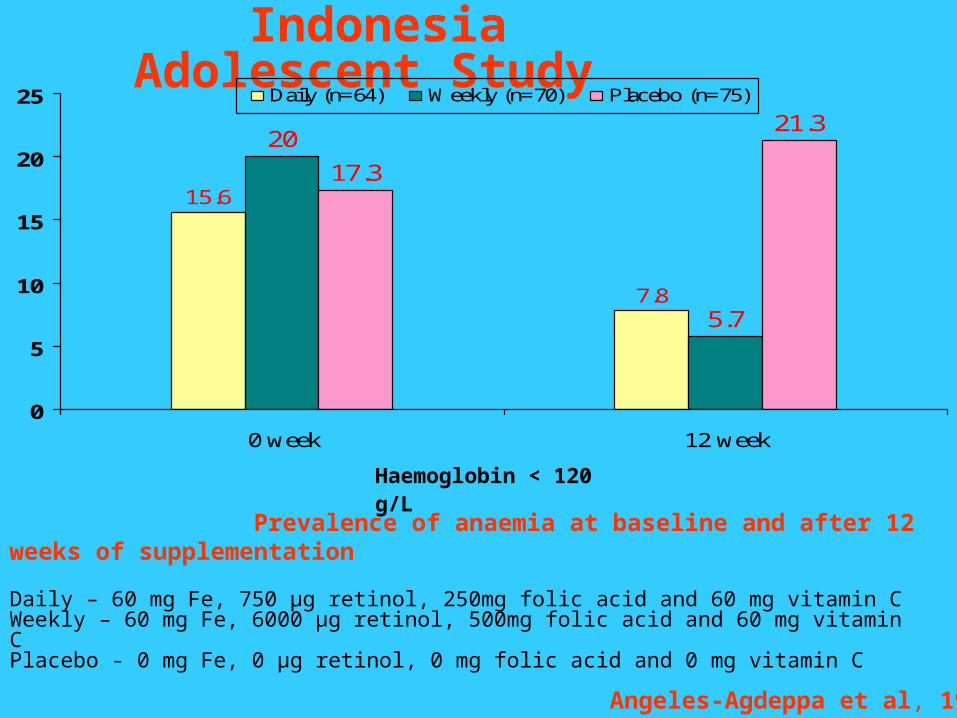
Indonesia Adolescent Study
15.6
7.8
20
5.7
17.3
21.3
0
5
10
15
20
25
0 week 12 week
Daily (n=64) Weekly (n=70) Placebo (n=75)
Haemoglobin < 120 g/L
Daily – 60 mg Fe, 750 µg retinol, 250mg folic acid and 60 mg vitamin CWeekly – 60 mg Fe, 6000 µg retinol, 500mg folic acid and 60 mg vitamin C Placebo - 0 mg Fe, 0 µg retinol, 0 mg folic acid and 0 mg vitamin C
Prevalence of anaemia at baseline and after 12 weeks of supplementation
Angeles-Agdeppa et al, 1997

Sri Lanka Adolescent Study
Prevalence of anaemia and serum ferritin level (in a sub sample) before and after 8 weeks of treatment
2518.5 19.8
9.5 8.6 13.4
66.6
54.159.1
82.792.3
56.3
0
20
40
60
80
100
Weekly Daily Placebo
Before treatment anaemia prevalence (%) After treatment anaemia prevalence (%)Before treatment ferritin level (µg/L) After treatment ferritin level (µg/L)
n=220 n=9 n=222 n=22 n=217 n=11
Intervention• Iron Folic Acid Supplements• 6 monthly Deworming done
Jayatissa and Piyasena, 1999
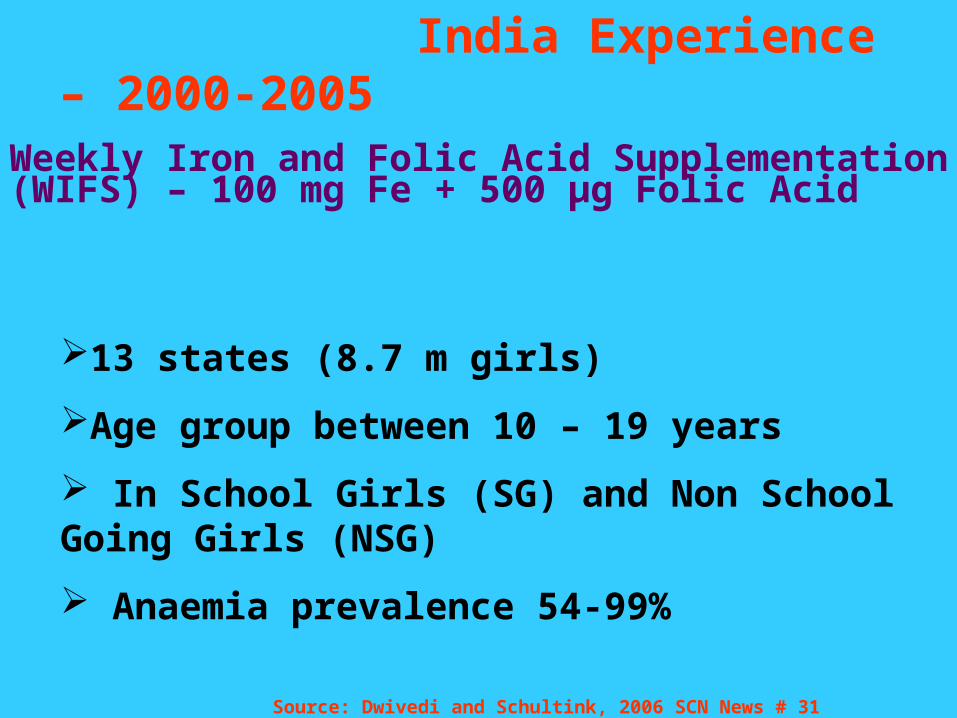
India Experience – 2000-2005
Weekly Iron and Folic Acid Supplementation (WIFS) – 100 mg Fe + 500 µg Folic Acid
13 states (8.7 m girls)
Age group between 10 – 19 years
In School Girls (SG) and Non School Going Girls (NSG)
Anaemia prevalence 54-99%
Source: Dwivedi and Schultink, 2006 SCN News # 31

82.9
74.2
90 87.4
65.2
99.4
87.3
73.3
92.6 95
40.2
53.4
8580
54.749.4
40.2 39.1
58
89
13
0
20
40
60
80
100
120
*AP- S
GG
*Guja
rat-
SGG
(a) J
hark
and
- SG
G
*MP -
NSGG
*Mahr
asht
ra -
SGG&NSG
G
*UP (G
- NSGG
)
*UP (G
- SG
G)
* UP (L
-NSG
)
* UP (L
-SG
G)
(b) W
B - SG
G
Baseline 1 year post 2 years post
Change in Anemia Prevalence by States (Hb<12 g/dl)
* statistically significant difference (Chi square test, p<0.001, CI 95%)(a) Baseline is the ICMR estimation of anemia (Chi Square Test not possible)(b) out of school non participants represent baseline and school going participants represent assessment (Chi Square Test not possible)WIFS – compliance 75-90%

11.1 11.1
10.12
11.1
8.5
10.4 10.5
12.111.7
10.9
11.4 11.25
1211.7
12.6
8
8.5
9
9.5
10
10.5
11
11.5
12
12.5
13 Baseline 1 year post 2 years post
Change in Mean Hb levels (g/dl)
* Statistical t test confirmed significant difference

Benefits Reported (all states)
Benefits % Range
Less fatigue 25.5 – 65
More concentration 24.2 – 85.5
Less breathlessness 0.7 – 83.5
Feel healthy 7.2 – 87.9
Able to work 21 – 24.2
Good appetite 18.2 – 88
Menstrual cycle regular Reported
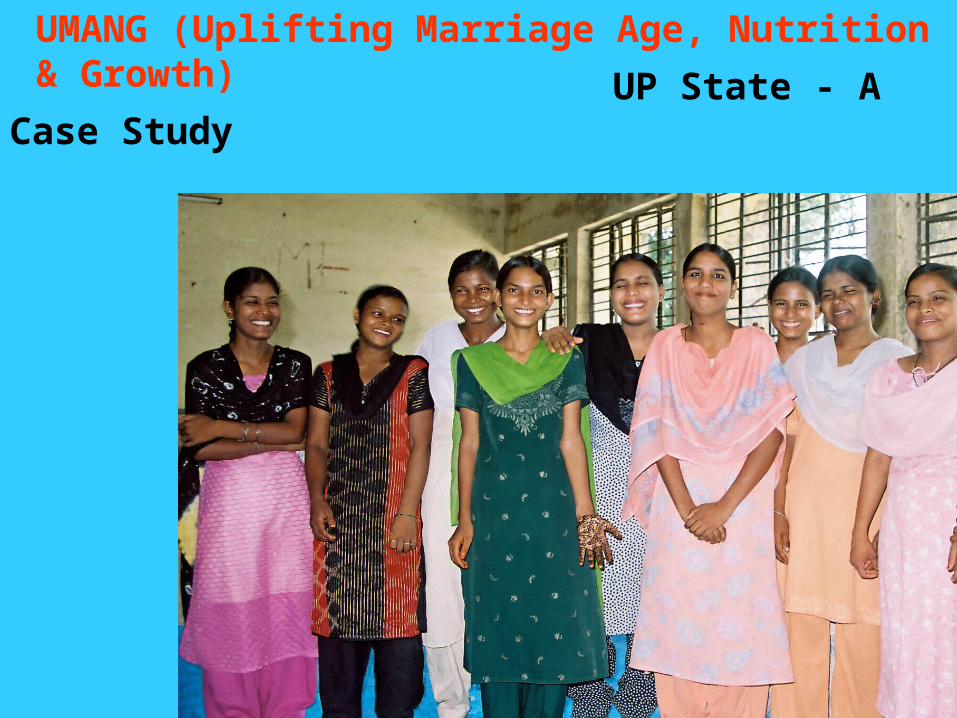
UP State - A Case Study
UMANG (Uplifting Marriage Age, Nutrition & Growth)

Gorakhpur
Lucknow
Coverage Two Districts :
Adolescent Girls 0.5 m
Coverage :
ICDS Centres 3762
Schools 1028

Age No. Interviewed Married %
10 -13 876 97 11%
14-16 630 103 16%
17-19 283 180 64%
Total 1789 380 21%
Age of Marriage (Gorakhpur district)

UMANG Project, LUCKNOW district, UP
• 10 Administrative rural and urban blocks
• Population covered 3,647,834
• Included Non School Going (NSG) girls (11-18 years) and School Going (SG) girls (10-19 years)
• Implemented in 3 phases (2001 – 2006)
• Intervention Package
Weekly IFA tablets (Fe 100 mg, Folic acid 500 µg)
Six monthly deworming tablets (400 mg Albendezole)
Family life education (FLEd), Counseling delay conception > 18 years
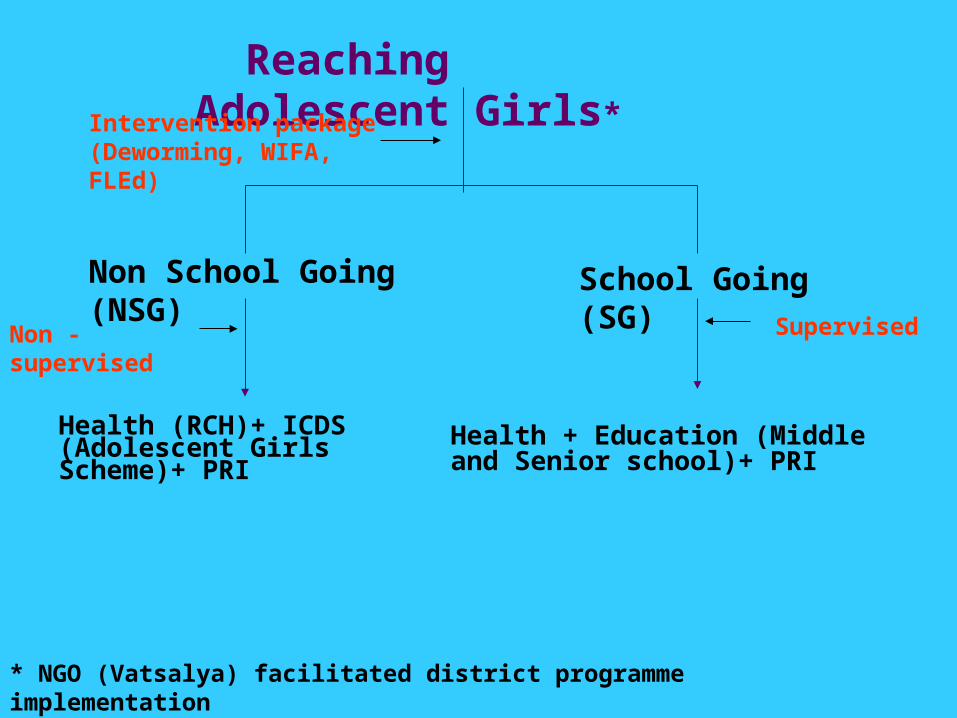
Reaching Adolescent Girls*
Non School Going (NSG) School Going (SG)
Health (RCH)+ ICDS (Adolescent Girls Scheme)+ PRI
Health + Education (Middle and Senior school)+ PRI
* NGO (Vatsalya) facilitated district programme implementation
Non - supervised Supervised
Intervention package (Deworming, WIFA, FLEd)

Coverage of NSG and SG adolescent girls in Lucknow district
Phase (implementation
period)
No. of blocks (total
population)
Age group (years)
No. of ICDS centres
No. of schools Adolescent girls (NSG+SG)
covered
I (Sept 2001 – Dec 2002)
1 Block
(85, 383)
11 – 18 95 - 3800
(only NSG)
II (Jan 2003 – Dec 2004)
2 Blocks
(3, 24, 087)
11 – 18 169 100 22, 695
(NSG = 12695)
(SG = 10, 000)
III (Jan 2005 – Dec 2007)
10 Blocks (rural and
urban in the district)
(3, 647, 834)
10 – 19 1275 351 1, 50, 700
(NSG = 73, 700)
(SG = 77, 000)
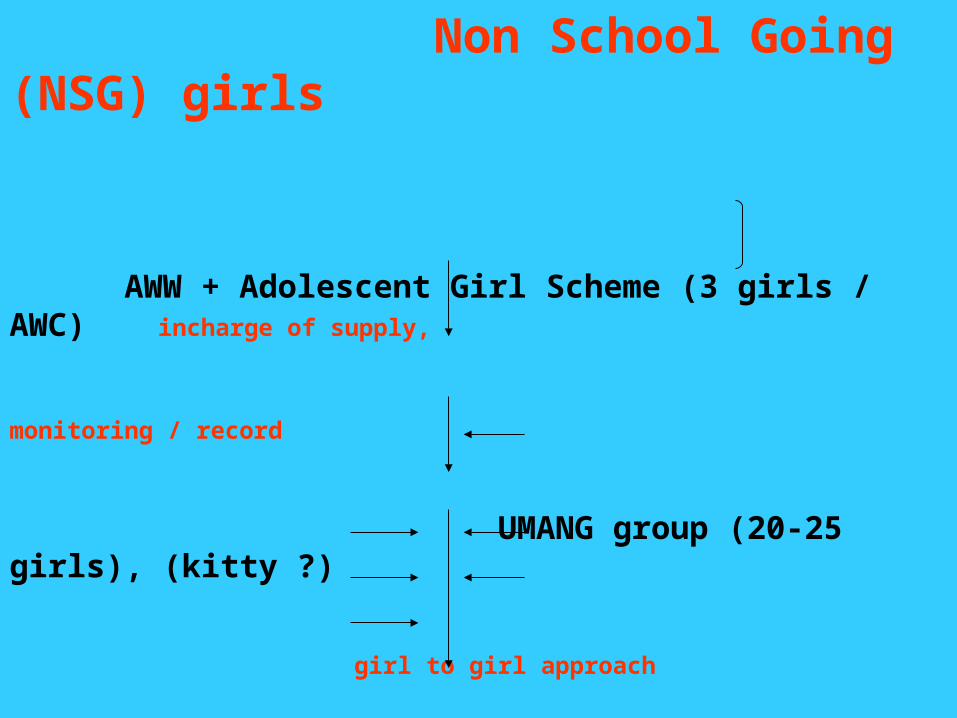
Non School Going (NSG) girls
AWW + Adolescent Girl Scheme (3 girls / AWC) incharge of supply,
monitoring / record
UMANG group (20-25 girls), (kitty ?)
girl to girl approach
additional 20 – 25 girls (1:2)
Deworming IFA
Counseling on benefits Diet + FLEd (Fixed theme) + Q box
Recording in registers (4th Saturday / month)
73,700 NSG

School Going (SG) Girls
Map middle and senior schoolsOrientation to Panchayat + district
and block education officers
2 teachers / school (trainers)
Each Saturday (Anaemia Day)
Deworming IFA Tablet (Supervised)
Individual recoding cards FLEd
77, 000 girls

IFA Supply (6 months)*District Hospital (Kit A + UNICEF supply)
District Education Department
Block Education Department Block PHC ICDS (CDPO Office)
Selected Schools Anganwadi Centres
School Going (SG) girls Non School Going (NSG) girls
* Identical to those provided to pregnant mothers by GOI, Cost = Rs 11.40/100 tablets (blister packs)

Monitoring Form

Phase I – Knowledge of NSG adolescent girls – baseline and following 6 months of Family Life Education intervention
11 – 14 years 15 – 18 years
Baseline (%)
Post* (%)
Baseline (%)
Post * (%)
1. Awareness related to anaemia
• Yes 44.0 94.7 64.1 98.9
2. Measures for prevention
• By taking IFA tablets
• Both diet and IFA tablets
• Medicines and tonic
• Improved diet
• Any other
• DNK
4.2
1.5
26.0
12.5
0.8
56.6
38.0
35.3
6.5
16.8
0.5
7.3
10.3
3.6
27.9
21.8
1.2
39.1
37.3
22.8
4.6
31.4
0.3
4.4
* Following 6 months intervention

10
11
12
13
11 12 13 14 15 16 17 18 overall
Age
Mea
n H
aem
og
lob
in (
gm
%)
Pre (N=437) 6 months (N=413)12 months (N=216) Cut off point
Phase I – Impact on haemoglobin levels following 6 and 12 months of weekly IFA consumption by non school going (NSG) adolescent girls

10.4
11.3
12
9.5
10
10.5
11
11.5
12
12.5
Baseline 1st 6 months Next 6 months
Hb
(g
/dl)
1 year
Total Hb rise 2g/dl after 1 year of supervised consumption
n = 600 girls
Impact of WIFS on Hb Levels (NSG)

73.2
0.1
19.4
53.7
26.8
46.3
0 1.4
44.9
53.7
05
1015202530354045505560657075
Anaemic (Hb%<12g/dL) Severe (Hb%<7g/dL) Moderate (Hb%7-10g/dL) Mild (Hb%10-11.9g/dL) Non Anaemic(Hb%12g/dl)
Type of anaemia
Perce
ntage
(%)
baseline follow 6 months of IFA supplementation
School Going Girls – Status of anaemia at baseline (596 girls) and following 6 months of weekly IFA supplementation (573 girls)
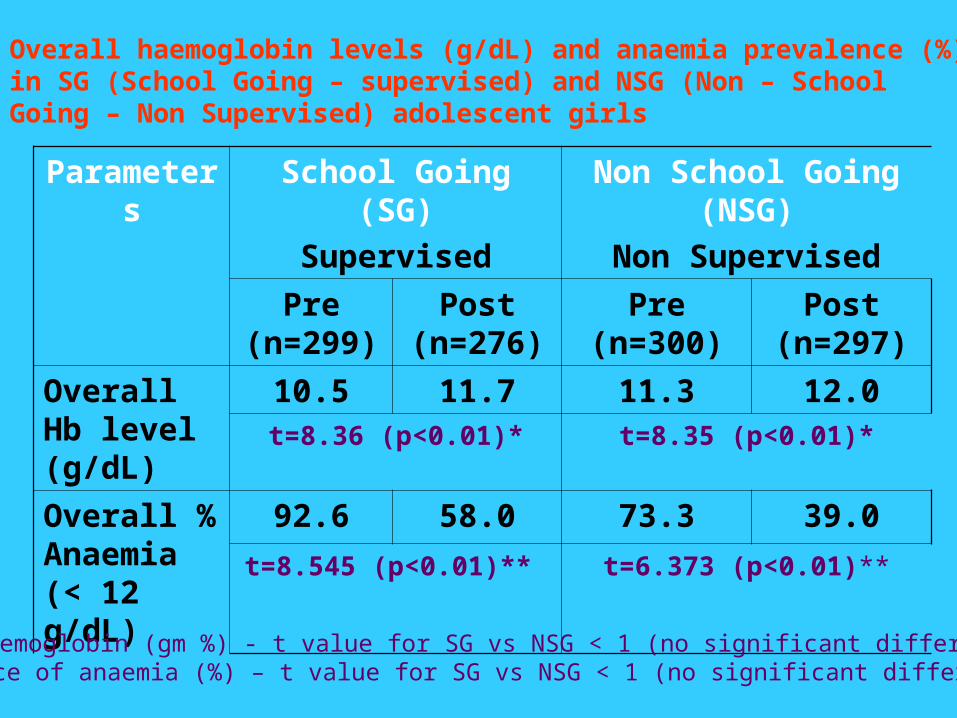
Parameters School Going (SG)
Supervised
Non School Going (NSG)
Non Supervised
Pre (n=299)
Post (n=276)
Pre (n=300) Post (n=297)
Overall Hb level (g/dL)
10.5 11.7 11.3 12.0t=8.36 (p<0.01)* t=8.35 (p<0.01)*
Overall % Anaemia (< 12 g/dL)
92.6 58.0 73.3 39.0
t=8.545 (p<0.01)** t=6.373 (p<0.01)**
Overall haemoglobin levels (g/dL) and anaemia prevalence (%) in SG (School Going – supervised) and NSG (Non – School Going – Non Supervised) adolescent girls
* Mean haemoglobin (gm %) - t value for SG vs NSG < 1 (no significant difference)**Prevalence of anaemia (%) – t value for SG vs NSG < 1 (no significant difference)
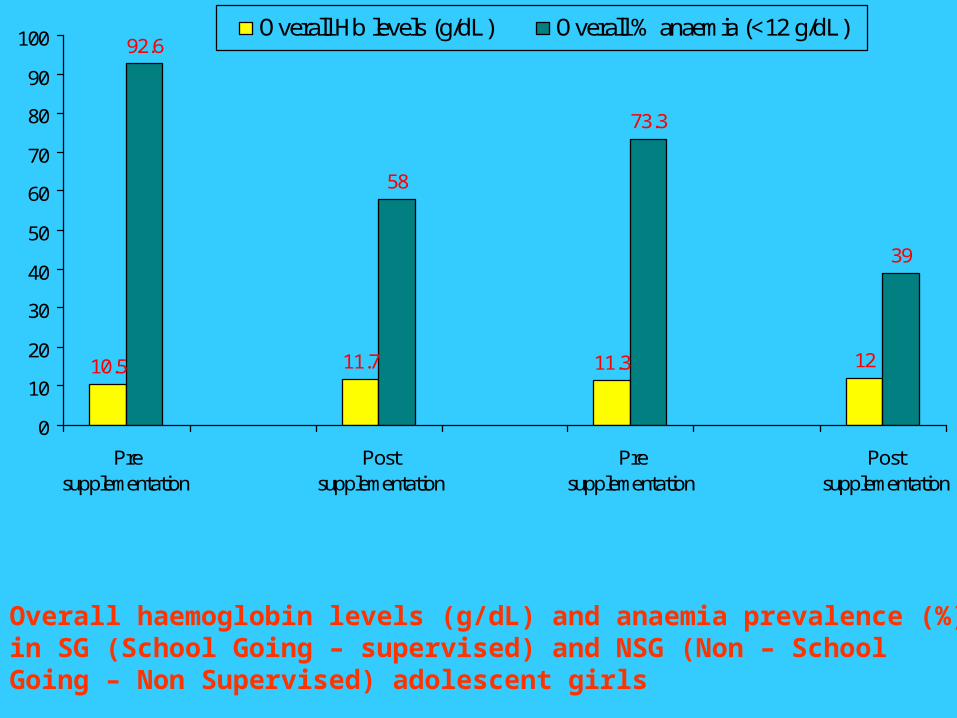
10.5 11.7 11.3 12
92.6
58
73.3
39
0
10
20
30
40
50
60
70
80
90
100
Presupplementation
Postsupplementation
Presupplementation
Postsupplementation
Overall Hb levels (g/dL) Overall % anaemia (<12 g/dL)
SCHOOL GOING (Supervised)
NON SCHOOL GOING (Non Supervised)
Overall haemoglobin levels (g/dL) and anaemia prevalence (%) in SG (School Going – supervised) and NSG (Non – School Going – Non Supervised) adolescent girls

73.3
39
25.4
0 0 1.6
7.9
1.1
6.5
65.4
37.9
17.3
26.7
61
74.6
0
10
20
30
40
50
60
70
80
2003 2004 2006
Per
cent
age
(%)
Total % anaemic Severely anaemic Moderately anaemic Mildly anaemic Non Anaemic
Change in anaemia status of combined NSG and SG adolescent girls in two selected blocks followed between 2003-2006
(N=1173) (N=870) (N=301)
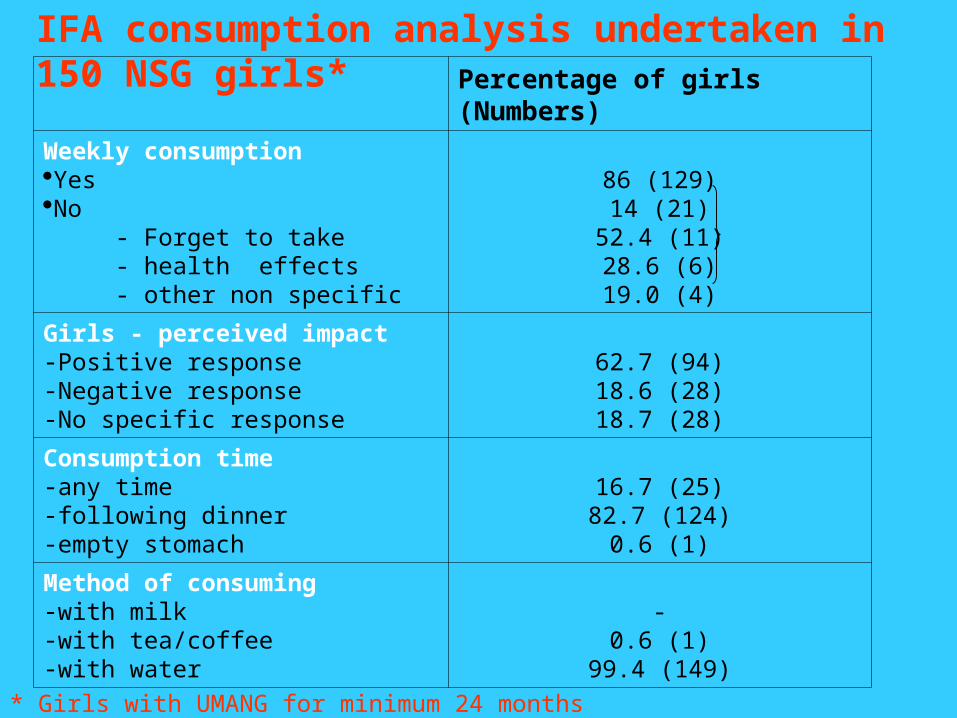
Percentage of girls (Numbers)
Weekly consumptionYesNo - Forget to take - health effects - other non specific
86 (129)14 (21)
52.4 (11)28.6 (6)19.0 (4)
Girls - perceived impact-Positive response-Negative response-No specific response
62.7 (94)18.6 (28)18.7 (28)
Consumption time-any time-following dinner-empty stomach
16.7 (25)82.7 (124)
0.6 (1)
Method of consuming-with milk-with tea/coffee-with water
-0.6 (1)
99.4 (149)
IFA consumption analysis undertaken in 150 NSG girls*
* Girls with UMANG for minimum 24 months

Cost incurred in the programme per beneficiary
Year No. of Beneficiaries
Cost (Rs) / head
Cost ( US$) / head
2003 3800 119.62 2.96
2004 22,695 58.60 1.45
2006 1,50,700 14.60 0.36

2.96
1.45
0.42 0.36
0
0.5
1
1.5
2
2.5
3
3.5
2003 2004 2005 2006
Co
st
($ /
gir
l) UMANG Project - Cost ($)/Adol. girl

Success Factors• High priority (State / District / PRI)
• Integrated with ongoing programme
•Supply regular and streamlined
• Package presentation of IFA (blister packs)
• Distribution of IFA (fixed day approach)
• Family Life Education (Theme – fixed month)
• Multisectoral Training (Training Manual)
• IEC and Social Mobilisation (emphasis on benefits – increase compliance)
• Monitoring (NGO involved)

Preventing Adolescent Anaemia
• Access to dietary iron – long term strategy
•WIFS – short term strategy
effective preventive strategy for iron deficiency and iron deficiency anaemia
benefits in future outweigh the cost incurred
manageable in community settings (schools, factories, community organisation, mass media)
integrate with ongoing development programme (Education, ICDS, RCH)

From District Project to UP State Programme
Weekly Iron and Folic Acid Supplementation (WIFS) intervention integrated with ongoing state efforts for reaching Adolescent girls
Health Sector (SG) - RCH II (UP) with Education sector
(Every Saturday / week)
ICDS (NSG) - Mission Poshan
(4th Saturday of Month)

Prevention of Iron Deficiency and Impact on MDGs
MDG Goals Impact of IDA Prevention
MDG # 1 Eradicate Extreme Poverty and Hunger
• increases body’s capacity to do work (for every 10% increase in HB – 15% increase in physical work)• Reduces low birth weight• undernutrition in under 5 year
MDG # 2 Achieve Universal Primary Education
• Reduces frequency and severity of infections / morbidity and mortality• school attendance, retention, learning capacity and school achievement
MDG # 3 Promote Gender Equality and Empower Women
• Anaemia in girls – often more severe than in boys. Adversely influences school attendance and achievement. • gender disparity
MDG # 4 Reduce Child Mortality • Reduces serious consequences on child health, including LBW, still birth• child mortality
MDG # 5 Improve Maternal Health • Reduction of maternal anaemia • MMR (20% of these maternal deaths directly attributed to anaemia)

Moving Ahead
•1991 – National Nutritional Anaemia Prophylaxis Programme (NNAPP) revised to National Anaemia Control Programme (NACP)
• 1998 – National Anaemia Consultation Report
“Demonstrate large scale district level projects to study the effectiveness of WIFA supplementation to adolescent girls.”
• 2007 – Review of Policy – IFA (23rd April 2007)
“ Adolescents, 11 – 18 years will be supplemented at the same doses and duration as adults. The adolescent girls will be given priority.”
• 2008 – We all must act now
Redefine specific cost effective dosage and strategy (WIFS and Nutrition Education) for addressing anaemia prevention in adolescent girls

Thank You