additional tier 1 securities investor presentation · additional tier 1 securities investor...
TRANSCRIPT

KBC Group Additional Tier 1 Securities Investor Presentation March 2014
More information: www.kbc.com On your mobile m.kbc.com
KBC Group – Investor Relations Office – E-mail: [email protected]

2
Important Information for Investors (1/3)
The information in this document has been prepared by KBC Group NV (KBC Group) solely for use at a presentation to be held in connection, inter alia, with a potential offering (the Offering) of Additional Tier 1 Securities (the Securities) by KBC Group.
This presentation is provided for information purposes only. This presentation does not constitute an offer or invitation to sell, or any solicitation of any offer to subscribe for or purchase any securities, and nothing contained herein shall form the basis of any contract or commitment whatsoever. Investors and prospective investors in the Securities of KBC Group are required to make their own independent investigation and appraisal of the business and financial condition of KBC Group and the nature of the Securities. Any decision to purchase Securities in the context of the Offering, if any, should be made solely on the basis of information contained in the prospectus prepared in relation to such Offering. No reliance may be placed for any purpose whatsoever on the information contained in this presentation, or any other material discussed verbally, or on its completeness, accuracy or fairness. This presentation does not constitute a recommendation regarding the Securities of KBC Group.
Any offer of Securities to the public that may be deemed to be made pursuant to this document in any EEA Member State that has implemented Directive 2003/71/EC (together with any applicable implementing measures in any Member State, the Prospectus Directive) is only addressed to qualified investors in that Member State within the meaning of the Prospectus Directive.
A prospectus prepared pursuant to the Belgian Prospectus Law of 16 June 2006, as amended, and the Prospective Directive is intended to be published, which, if published, can be obtained in accordance with the applicable rules. A decision to purchase or sell KBC’s securities should be made only on the basis of a prospectus prepared for that purpose and on the information contained or incorporated by reference therein.
In the event the Offering proceeds, investment in the Securities will involve certain risks. A summary of the material risks relating to the Offering will be set out in the section headed "Risk Factors" in the prospectus. There may be additional material risks that are currently not considered to be material or of which KBC Group and its advisors or representatives are unaware.
KBC Group believes that this presentation is reliable, although some information is summarised and therefore incomplete. Financial data is generally unaudited. KBC Group cannot be held liable for any loss or damage resulting from the use of the information.
Forward-looking statements: • This presentation contains non-IFRS information and “forward-looking statements” relating to KBC Group including with respect to the strategy, earnings and capital trends
of KBC Group, that are subject to known and unknown risks and uncertainties, many of which are outside of KBC Group’s control and are difficult to predict, that may cause actual results to differ materially from any future results expressed or implied from the forward-looking statements. Important factors that could cause actual results to differ materially from such expectations include, without limitation: the significant credit default risk exposure of KBC Group; exposure of KBC Group to various risks including (but not limited to) counterparty credit risk in derivative transactions, foreign exchange risk and market risk; a downgrade in the credit rating of KBC Group, changes or uncertainties in the laws or regulations applicable to the financial services and insurance industry in which KBC Group is active; the strong focus of KBC Group on its home markets. In this presentation, the words “anticipates,” “believes,” “estimates,” “seeks,” “expects,” “plans,” “intends” and similar expressions, as they relate to KBC Group, are intended to identify forward-looking statements. All written and oral forward-looking statements attributable to KBC Group or persons acting on its behalf are expressly qualified in their entirety by the cautionary statements above. KBC Group does not intend, or undertake any obligation, to update these forward-looking statements.

3
Important Information for Investors (2/3)
This document and its contents are confidential and are being provided to you solely for your information and may not be retransmitted, further distributed to any other person or published, in whole or in part, by any medium or in any form for any purpose. The opinions presented herein are based on general information gathered at the time of writing and are subject to change without notice. KBC Group relies on information obtained from sources believed to be reliable but does not guarantee its accuracy or completeness.
This document is only being distributed to and is only directed at (i) persons who are outside the United Kingdom or (ii) to investment professionals falling within Article 19(5) of the Financial Services and Markets Act 2000 (Financial Promotion) Order 2005 (the Order) or (iii) high net worth entities, and other persons to whom it may lawfully be communicated, falling within Article 49(2)(a) to (d) of the Order (all such persons together being referred to as relevant persons). Any investment activity to which this communication may relate is only available to, and any invitation, offer, or agreement to engage in such investment activity will be engaged in only with, relevant persons. Any person who is not a relevant person should not act or rely on this document or any of its contents.
Neither this presentation nor any copy of it may be taken or transmitted into, or distributed, directly or indirectly in, the United States of America (or to U.S. persons), its territories or possessions, Canada, Australia or Japan. This presentation is not a public offer of securities for sale in the United States. The Securities proposed in the Offering have not been and will not be registered under the U.S. Securities Act of 1933 (the "Securities Act"), or the laws of any state or other jurisdiction of the United States, and may not be offered or sold within the United States or to U.S. persons, absent registration or an exemption from, or in a transaction not subject to, the registration requirements of the Securities Act and applicable state laws. The Issuer does not intend to register any portion of the Offering in the United States or conduct a public offering of securities in the United States. KBC Group does not intend to register any portion of the proposed Offering under the applicable securities laws of the United States, Canada, Australia or Japan. Any failure to comply with these restrictions may constitute a violation of U.S., Canadian, Australian or Japanese securities laws, as applicable. The distribution of this document in other jurisdictions may also be restricted by law, and persons into whose possession this document comes should inform themselves about, and observe, any such restrictions.
The Securities have not been offered or sold and will not be offered or sold in Hong Kong, by means of this presentation, the prospectus or any other document, other than (a) to “professional investors” as defined in the Securities and Futures Ordinance (Cap. 571) of Hong Kong and any rules made under that Ordinance; or (b) in other circumstances which do not result in any document being a prospectus as defined in the Companies Ordinance (Cap. 32) of Hong Kong or which do not constitute an offer to the public within the meaning of that Ordinance. Furthermore, no advertisement, invitation or document relating to the Securities, which is directed at, or the contents of which are likely to be accessed or read by, the public of Hong Kong (except if permitted to do so under the securities laws of Hong Kong) has been issued or will be issued, whether in Hong Kong or elsewhere, other than with respect to Securities which are or are intended to be disposed of only to persons outside Hong Kong or only to "professional investors" as defined in the Securities and Futures Ordinance and any rules made under that Ordinance.
The Securities have not been and will not be registered under the Financial Investment Services and Capital Markets Act and its subordinate decrees and regulations (collectively, the “FSCMA”). Accordingly, no Securities have been offered, sold or delivered or will be offered, sold or delivered, directly or indirectly, in Korea or to, or for the account or benefit of, any Korean resident (as such term is defined in the Foreign Exchange Transaction Law and its subordinate decrees and regulations (collectively, the “FETL”)), except as otherwise permitted under applicable Korean laws and regulations, including the FSCMA and FETL

4
Important Information for Investors (3/3)
Neither this presentation nor the prospectus has been registered as a prospectus with the Monetary Authority of Singapore, and the Securities will be offered pursuant to exemptions under the Securities and Futures Act, Chapter 289 of Singapore (the “SFA”). Accordingly, the Securities have not been offered or sold or caused to be made the subject of an invitation for subscription or purchase and will not be offered or sold or caused to be made the subject of an invitation for subscription or purchase, and none of this presentation, the prospectus or any other document or material relating to the offer or sale, or invitation for subscription or purchase of the Securities has been circulated or distributed, nor will it be circulated or distributed, whether directly or indirectly, to persons in Singapore other than (i) to an institutional investor under Section 274 of the SFA, (ii) to a relevant person pursuant to Section 275(1), or any person pursuant to Section 275(1A), and in accordance with the conditions specified in Section 275, of the SFA, or (iii) otherwise pursuant to, and in accordance with the conditions of, any other applicable provision of the SFA.
Where Securities are subscribed or purchased under Section 275 of the SFA by a relevant person which is:
(a) a corporation (which is not an accredited investor (as defined in Section 4A of the SFA)) the sole business of which is to hold investments and the entire share capital of which is owned by one or more individuals, each of whom is an accredited investor; or
(b) a trust (where the trustee is not an accredited investor) whose sole purpose is to hold investments and each beneficiary of the trust is an individual who is an accredited investor,
securities (as defined in Section 239(1) of the SFA) of that corporation or the beneficiaries’ rights and interest (howsoever described) in that trust shall not be transferred within six months after that corporation or that trust has acquired the Securities pursuant to an offer made under Section 275 of the SFA except:
1.1 to an institutional investor or to a relevant person defined in Section 275(2) of the SFA, or to any person arising from an offer referred to in Section 275(1A) or Section 276(4)(i)(B) of the SFA;
1.2 where no consideration is or will be given for the transfer; 1.3 where the transfer is by operation of law; or 1.4 as specified in Section 276(7) of the SFA or Regulation 32 of the Securities and Futures (Offers of Investments) (Shares and Debentures) Regulations.
No Securities have been offered or sold or will be offered or sold in the People’s Republic of China (excluding Hong Kong, Macau and Taiwan) as part of the initial distribution of the Securities. This presentation does not constitute an offer to sell or the solicitation of an offer to buy any securities in the People's Republic of China (excluding Hong Kong, Macau and Taiwan, the "PRC') to any person to whom it is unlawful to make the offer or solicitation in the PRC. The issuer does not represent that this presentation may be lawfully distributed, or that any Securities may be lawfully offered, in compliance with any applicable registration or other requirements in the PRC, or pursuant to an exemption available thereunder, or assume any responsibility for facilitating any such distribution or offering. In particular, no action has been taken by the issuer which would permit a public offering of any Securities or distribution of this document in the PRC. Accordingly, the Securities are not being offered or sold within the PRC by means of this presentation or any other document. Neither this presentation nor any advertisement or other offering material may be distributed or published in the PRC, except under circumstances that will result in compliance with any applicable laws and regulations.
By reading this presentation, each investor is deemed to represent that it understands and agrees to the foregoing restrictions.

5
KBC Group: A solid and well-capitalised bank-insurance group
Strong bank-insurance group with leading market positions and sound profitability in core geographies • ROAC Belgium BU of 28% and ROAC Czech Republic BU 35% in FY 2013
One of the best capitalised banks in Europe • Basel 3 pro forma1, fully-loaded2 KBC Group CET1 ratio of 12.5% • Fully-loaded Basel 3 leverage ratio at KBC Bank of 4.4%3
• Robust organic capital generation: based on consensus estimates, KBC Group is forecast to generate 1.9% p.a.4 of capital (gross of dividends)
Stable, conservative and retail-orientated business model with very modest wholesale funding needs and robust liquidity profile • LCR of 131% and NSFR of 111% at YE 2013
Low-risk approach to balance-sheet management • Loan book that has already been reassessed in view of EBA / ESMA paper and upcoming AQR • Conservative balance-sheet risk weighting (RWAs / total assets)
EC restructuring plan executed in full5 Numerous successful capital management exercises since Oct 2012 generating >3bn EUR in capital
1. Pro forma figures include the effects of the accelerated repayment of 0.33bn EUR of State aid to the Flemish Regional Government (+50% premium) and the impact of the signed agreements to divest KBC Bank Deutschland and Antwerp Diamond Bank. 2. Including remaining State Aid of 2bn EUR. 3. Based on current CRR legislation. 4. Based on consensus estimates for 2014 earnings as per 28th January 2014. 5. The agreements to divest KBC Bank Deutschland and Antwerp Diamond Bank are signed but closure is pending regulatory approval.

6
KBC’s proposed transaction
KBC Bank NV KBC Insurance NV
100% 100%
CRD IV-eligible Additional Tier 1 Capital issued by KBC Group
Perpetual maturity, callable after 5 years and on each interest payment date thereafter
5.125% transitional CRD IV CET1 trigger (KBC Group consolidated)
Temporary write-down loss absorption mechanism
Discretionary, non-cumulative coupons
Expected instrument ratings of [BB-] from S&P and BB from Fitch
Benchmark size
(KBC Group)
Issuing entity
Trigger level (consolidated basis)

7
Transaction rationale
Ensure 1.5% of RWA “bucket” of AT1 capital under CRD IV at all times
• Optimise the usage of CET1
• More flexible and efficient capital structure
Initiate refinancing of legacy Tier-1 instruments with CRD IV-compliant AT1 and optimise cost of capital over time
Further strengthen the Group’s leverage ratio position
Achieve equity credit from rating agencies
• Improves S&P Risk Adjusted Capital (RAC)

8
Investment thesis
1. Investor friendly structure with 5.125% trigger and temporary write-down mechanism
2. Very significant buffer to MDA restrictions – approx. 5.9%1 assuming a static capital position and 2019E fully loaded buffer requirements
3. Substantial buffer of 7.8%1 to the instrument trigger of 5.125% CET1
Including the 1bn-USD Tier-2 CoCo, the buffer to the instrument trigger increases to 8.6%
4. Extremely robust organic capital generation – 1.9% per annum2
5. Proven track record of prudent capital management (e.g. shareholder loans (2013), capital increase (2012))
6. AT1 coupon prioritisation and maintenance of capital hierarchy
1. KBC position based on Basel 3 phased-in figures adjusted for the impact of the divestment agreements signed for KBC Bank Deutschland and Antwerp Diamond Bank, as well as the repayment of the second instalment of aid received from the Flemish Regional Government.
2. Based on consensus estimates for 2014 earnings as per 28th January 2014.

9
Table of Contents
Strategy and Business Profile
Financial Performance
Asset Quality
Liquidity
Capital
Transaction Overview
Appendix 1: Supplementary P&L Information
Appendix 2: Selected Credit Exposures
Appendix 3: Further Details on Proposed Transaction
Appendix 4: Further Details on Capital
1
2
3
4
5
6

Strategy and Business Profile Section 1

11
BE¹ CZ SK HU BG
Loans and deposits
Investment funds
Life insurance
Non-life insurance
Well-defined core markets provide access to ‘new growth’ in Europe
1. Excluding Centea and Fidea 2. Source: KBC Economic Research Forecast, February 2014
MARKET SHARE, AS OF END 2013
20% 20% 10% 9%
2%
17% 7% 29% 35%
6% 17%
10% 3% 5%
10% 5% 3% 6% 9%
BE CZ SK HU BG
% of Assets
2013
2014e
2015e
1% 4% 3% 16% 65%
0.5% 1.0% 0.8%
-1.3%
0.2%
1.8% 1.8% 1.5% 1.5% 1.2%
2.5% 1.8% 1.7% 2.5% 1.4%
REAL GDP GROWTH OUTLOOK FOR CORE MARKETS2
Macroeconomic outlook Based on GDP, CPI and unemployment trends Inspired by the Financial Times
IRELAND UK
BELGIUM
NETHERLANDS
GERMANY CZECH REP
SLOVAKIA
HUNGARY
BULGARIA
GREECE
ITALY
PORTUGAL SPAIN
FRANCE
KBC Group’s core markets and Ireland

12
Overview of key financial data
Market cap (05/03/14): 19bn
Adjusted net result (FY 2013): EUR 1.0bn
Total assets: EUR 241bn
Total equity: EUR 15bn
CET1 ratio (Basel 3 transitional1): 12.9%
CET1 ratio (Basel 3 fully loaded1): 12.5%
S&P Moody’s Fitch
Long-term A- (Positive) A3 (Stable) A- (Stable)
Short-term A-2 Prime-2 F1
Adjusted net result (FY 2013): EUR 0.8bn2
Total assets: EUR 209bn
Total equity: EUR 12bn
CET1 ratio (Basel 3 transitional3): 12.9%
CET1 ratio (Basel 3 fully loaded3): 12.3%
C/I ratio (FY 2013): 52%4
Adjusted net result (FY 2013): EUR 0.3bn
Total assets: EUR 36bn
Total equity: EUR 3bn
Solvency I ratio: 281%
Combined operating ratio (FY 2013): 94%
KBC Group KBC Bank KBC Insurance
Credit Ratings of KBC Bank
1. Pro forma figures which include the effects of the accelerated repayment of 0.33bn EUR of State aid to the Flemish Regional Government (+50% premium) and the impact of the signed divestments of KBC Bank Deutschland and Antwerp Diamond Bank and include remaining State Aid of 2bn EUR 2. Includes KBC Asset Management ; excludes holding company eliminations 3. Pro forma figures which include the impact of the signed divestments of KBC Bank Deutschland and Antwerp Diamond Bank 4. Adjusted for specific items, the C/I ratio amounted to c.54% in FY 2013

13
A well-diversified, increasingly plain-vanilla balance sheet Balance-sheet overview (KBC Group consolidated at 31 December 2013)
Parent shareholders’ equity: 12bn EUR Tangible & intangible fixed assets (incl. Investment property): 4bn EUR
Loan book: 123bn EUR
(Loans and advances to customers)
Trading assets: 12bn EUR
Bank investment portfolio: 43bn EUR
Deposits from customers: 135bn EUR
Total Assets: 241bn EUR Total Liabilities and Equity: 241bn EUR
Other (incl. interbank loans): 27bn EUR
Trading liabilities: 10bn EUR
Other (incl. interbank deposits): 24bn EUR
Insurance investment contracts: 13bn EUR Technical provisions, before reinsurance: 19bn EUR
Liabilities under insurance investment contracts: 12bn EUR
KBC’s loan book is retail orientated and gravitates towards key markets
• Loans constitute approx. 51% of total assets
• Belgian business unit loans account for 64% of total loans. 74% of these loans are retail and 26% are SME/corporate
• Czech Republic business unit loans make up 15% of total loans. 68% of these are retail and 32% are SME / corporate
Deposits from customers in excess of the loan book
Wholesale senior debt outstanding is very manageable
Insurance assets well matched to insurance liabilities
Trading assets and liabilities are well balanced
Other funding: 29bn EUR
Insurance investment portfolio: 20bn EUR

14
Achieved disciplined RWA reduction targets and successful completion of EC-restructuring agenda
126.3
-42%
143.4
end 2013
end 2008
90.5
155.3
end 2012
end 2007
102.1
147.0
end 2011
end 2006
end 2010
140.0 132.0
end 2005
end 2009
128.7
KBC GROUP RISK WEIGHTED ASSETS (bn EUR) KBC FP Convertible Bonds KBC FP Asian Equity Derivatives KBC FP Insurance Derivatives KBC FP Reverse Mortgages KBC Peel Hunt KBC AM in the UK KBC AM in Ireland KBC Securities BIC KBC Business Capital Secura KBC Concord Taiwan KBC Securities Romania KBC Securities Serbia Organic wind-down of international MEB loan book outside home markets
Centea Fidea Warta KBL European Private Bankers Zagiel Kredyt Bank NLB Absolut Bank KBC Banka KBC Bank Deutschland Signed Antwerp Diamond Bank Signed
SELECTED DIVESTMENTS
-65bn EUR

15
3.5bn EUR 3.0bn EUR
0.5bn1 EUR
3.0bn2 EUR
A clear, steady path to repaying KBC’s remaining State Aid
Jan 2012 Dec 2012 2013 Jan 2014
Total remaining
amount
3.5bn EUR 2.33bn EUR 2.0bn EUR
Belgian Federal
Government
Flemish Regional
Government
The remaining to be repaid in six
equal instalments of 0.33bn EUR
(plus premium)6
1. Plus 15% premium amounting to 75m EUR 2. Plus 15% premium amounting to 450m EUR 3. Plus 50% premium amounting to 583m EUR 4. Plus 50% premium amounting to 167m EUR 5. Plus 50% premium amounting to 1 000m EUR 6. KBC, however, has the option to further accelerate these payments
3.5bn EUR 3.5bn EUR 3.5bn EUR 2.33bn EUR
1.17bn3 EUR
2.0bn EUR 2.0bn5 EUR
0.33bn4 EUR
7.0bn EUR 6.5bn EUR
2015-2020
0bn EUR

Financial Performance Section 2

17
Leading banking and insurance businesses create strong earnings capacity
1. Note that the scope of consolidation has changed over time, due partly to divestments 2. Difference between adjusted net result at KBC Group and the sum of the banking and
insurance contribution are the holding-company/group items
CONTRIBUTION OF BANKING ACTIVITIES TO KBC GROUP ADJUSTED NET RESULT1,2
390399363
231263251
356320
4Q13
-368
3Q13 2Q13 1Q13 4Q12 3Q12 2Q12 1Q12
-8
3Q13
90
-37
68
59
2Q13
97
-33
84
46
1Q13
74
-43
67
50
4Q12
71
-27
106
3Q12
117
-25
63
79
2Q12
105
-43
71
77
1Q12
146
-18
86
78
4Q13
68
-8
51
25
Non-technical & taxes Life result Non-Life result
CONTRIBUTION OF INSURANCE ACTIVITIES TO KBC GROUP ADJUSTED NET RESULT1,2
Amounts in m EUR
960
FY13 FY12
1,542
FY11
1,098
FY10
1,710
FY09
1,724
FY08
2,270
FY07
3,143
FY06
2,548
61213
FY13
1,015
FY12 FY11 FY10
1,860
FY09
-2,466
FY08
-2,484
FY07
3,281
FY06
3,430
NET RESULT1
ADJUSTED NET RESULT1,2
Excluding adjustments
Adjusted net result excl. one-off additional impairments
Losses on legacy structured credit
960
688
One-off additional impairments
1,648

18
NET PROFIT - BELGIUM NET PROFIT – CZECH REPUBLIC
2013
1,570
2012
1,360
FY13 ROAC1: 28%
Amounts in m EUR
1. [result after tax, including minority interests, of a business unit, adjusted for income on allocated capital instead of real capital] / [average capital allocated to the business unit]. The capital allocated to a business unit is based on risk-weighted assets for banking and risk-weighted asset equivalents for insurance
554581
2013 2012
FY13 ROAC1: 35%
NET PROFIT - INTERNATIONAL MARKETS
-853
-260
2013 2012
FY13 ROAC1: -50%
139145
2013 2012
NET PROFIT - INTERNATIONAL MARKETS EXCL. IRELAND
Consistent performance in key business units
Consistent Performer Consistent Performer
Consistent Performer

Asset Quality Section 3

20
Well-managed NPLs
Customer loan book: 123bn EUR at end 4Q13
Largely sold through own branches
BELGIUM BU
KBC GROUP
INTERNATIONAL MARKETS BU CZECH REPUBLIC BU
4Q13
5.9%
3Q13
5.8%
2Q13
5.5%
1Q13
5.3%
4Q12
5.3%
3Q12
5.5%
2Q12
5.3%
1Q12
5.2%
4Q13
2.3%
3Q13
2.6%
2Q13
2.3%
1Q13
2.3%
4Q12
2.3%
3Q12
2.6%
2Q12
2.5%
1Q12
2.5%
4Q13
3.0%
3Q13
3.2%
2Q13
3.3%
1Q13
3.2%
4Q12
3.2%
3Q12
3.5%
2Q12
3.4%
1Q12
3.5%
4Q13
19.2%
9.3%
3Q13
19.0%
9.0%
2Q13
18.5%
9.2%
1Q13
18.1%
9.0%
4Q12
17.6%
9.2%
3Q12
17.3%
9.5%
2Q12
16.9%
9.8%
1Q12
16.3%
9.7%
NPL excluding Ireland
NPL including Ireland
43%
3%
13%
41%
Other Retail Loans
Residential Mortgages
SME / Corporate Loans
Consumer Finance
Total retail = 59%

21
FY 2013 CREDIT COST RATIO
FY 2012 CREDIT COST RATIO
Belgium 0.37% 0.28%
Czech Republic 0.25% 0.31%
International Markets 4.48%1 2.26%1
Group Centre 1.85% 0.99%
Total 1.19%
(0.45% excluding special items)2 0.71%
Credit cost ratio: amount of losses incurred on troubled loans as a % of total average outstanding loan portfolio 1 The high credit cost ratio at the International Markets BU is due in full to KBC Bank Ireland. Excluding Ireland, the CCR at this business unit amounted to 108bps in FY 2013 2 Credit cost ratio amounted to 1.19% in FY13 due to the reassessment of the loan books in Ireland and Hungary. Excluding KBC Bank Ireland and the one large corporate file in 1Q13, the
credit cost ratio stood at 0.45% in FY13
Loan loss experience at KBC
Average credit cost ratio of 0.55% between 1999 and 2013

Liquidity Section 4

23
Predominantly customer-driven funding base
KBC Bank continues to have a strong retail/mid-cap deposit base in its core markets – resulting in a stable funding mix with a significant portion of the funding attracted from core customer segments and markets
5% 5%9%
-4%
5% 2% 3% 6%
FY12
10%
73%
FY11
3% 9%
69%
8% 0%
3% 9%
7%
100% 3%
FY10
70%
7%
8%
7%
FY13
3%
FY09
64%
7%
8%
75%
8%
8%
FY08
66%
7% 2% 7%
8%
7%
FY07
64%
8%
8%
8%
10%
14%
Funding from customers
Certificates of deposit
Total equity Net unsecured interbank funding
Net secured funding
Debt issues placed with institutional investors
6.0%
28.0%
3.0%
63.0%
Debt issues in retail network
Retail and SME
Government and PSE
Mid-cap
75% customer
driven

24
LCR and NSFR compliance; liquidity covers net ST funding >4x
KBC maintained an excellent liquidity position in FY 2013 given that:
• Available liquid assets are more than four times the amount of the net recourse on short-term wholesale funding
• Funding from non-wholesale markets is stable funding from core-customer segments in core markets
1. In line with IFRS5, the situation at the end of FY 2013 excludes the divestments that have not yet been completed (KBC Deutschland and Antwerp Diamond Bank)
2. Graphs are based on Note 18 of KBC’s quarterly report, except for the ‘available liquid assets’ and ‘liquid assets coverage’, which are based on the KBC Group Treasury Management Report
Ratios FY 2013 Target 2015
NSFR3,4 111% 105%
LCR3 131% 100%
3 LCR (Liquidity Coverage ratio) and NSFR (Net Stable Funding Ratio) are calculated based on KBC’s interpretation of current Basel Committee guidance, which may change in the future. The LCR can be relatively volatile in future due to its calculation method, as month-to-month changes in the difference between inflows and outflows can cause significant swings in the ratio even if liquid assets remain stable
4. Net Stable Funding Ratio of 111% does not incorporate the Basel Committee’s proposed revisions from January 2014
NSFR at 111% and LCR at 131% by the end of FY 2013 • In compliance with the implementation of Basel 3 liquidity
requirements, KBC is targeting LCR and NSFR of at least 100% and 105%, respectively, by 2015
(1,2)

25
Manageable medium-term funding maturities, diversified funding access, tightening spreads
KBC has successfully issued a total of 2.5bn EUR worth of benchmark covered bonds, a 1bn-USD Contingent Capital Note, and a 750m-EUR senior unsecured 5Y benchmark transaction in 2013. In February 2014, KBC issued a 750m-EUR covered bond
KBC’s credit spreads moved within a tight range during 4Q13
KBC Bank has five solid sources of long-term funding:
• Retail term deposits
• Retail EMTN
• Public benchmark transactions
• Covered bonds
• Structured notes and covered bonds using the private placement format
CHANGES IN THE CREDIT SPREAD FUNDING MATURITY BUCKETS BROKEN DOWN BY SENIOR, SECURED AND SUBORDINATED
It is KBC’s intention to refinance approx. 1.5bn of senior unsecured in 2014

Capital Section 5

27
10.0%
11.7%
10.5% 11.5%
13.1% 12.2%
12.8% 12.5%
Consistent track record of strengthening capital
1Q13 FY12 9M12 1H12 FY132 pro forma
FY13 9M13 1H13
3bn EUR repayment to Belgian State
1.2bn EUR repayment to Flemish Gov
0.3bn EUR repayment to Flemish Gov
Fully loaded B3 CET1 ratio of 12.5%1,2 based on Danish Compromise
1. With remaining State aid included in CET1 as agreed with local regulator. 2. FY13 pro forma CET1 includes the effects of the accelerated repayment of 0.33bn EUR of State aid to the Flemish Regional Government (+50% premium) and the impact of the signed agreements for the divestment of KBC Bank Deutschland and Antwerp Diamond Bank.
10% minimum target

28
80
100
120
140
160
180
200
220
240
Sep 2012 Jan 2013 May 2013 Sep 2013 Jan 2014
KBC Eurostoxx Banks
Active capital management by KBC
1. Bloomberg
Sale treasury shares: 16 Oct ‘12
• Capital release: +0.35bn EUR
Capital increase : 10 Dec ‘12
• Common increase: +1.25bn EUR
Coco: 18 Jan ‘13
• Increasing loss absorbing capital:
+1.0bn USD
Shareholder loans I: 3 July ‘13
• Capital release : +0.33bn EUR
TREND IN KBC SHARE PRICE COMPARED WITH EUROSTOXX BANKS INDEX 2012-YTD (31 DEC 2012 = 100)1
Numerous successful capital management exercises since Oct-2012 generating >3bn EUR in capital
Shareholder loans II : 19 Nov. ‘13
• Capital release : +0.67bn EUR

29
KBC has a strong CET1 ratio in a European context
BASEL 3 CET 1 RATIO (FULLY LOADED – Q4 2013 UNLESS OTHERWISE STATED IN THE FOOTNOTES)
Source: Company filings 1. Including: (i) the effects of the accelerated repayment of 0.33bn EUR of State aid to the Flemish Regional Government (+50% premium) and the impact of the signed agreements for the divestment of KBC Bank Deutschland and Antwerp Diamond Bank, and (ii) the remaining State aid of 2bn EUR 2. As of Q3 2013
18.9%18.3%
15.0%13.9% 13.6%
12.8% 12.5%11.5% 11.2% 10.9% 10.3% 10.3% 10.0%
9.9% 9.8% 9.7% 9.3% 9.2% 9.0%
Median: 10.9%

30
Conservative RWA calculations
RISK WEIGHTED ASSETS VS. TOTAL ASSETS (BASEL 2.5)1
1.. EBA Review (30-Jun-2013)
55%
46%45% 44%
42%40%
37%
33% 32%30%
26% 26% 25% 25% 24% 23% 23%20%
16%
Median: 30%

31
Optimising KBC’s capital structure
Additional Tier 1 (AT1) issuance is a further step towards reaching KBC’s optimal capital structure
CET1 target of >10%
• Minimum regulatory requirements of 4.5% CET1 and 2.5% “Capital Conservation Buffer” (CCB)
• KBC intends to maintain a CET1 ratio in excess of 10%, implying an excess of at least 3% to regulatory minima (including buffers)
AT1 target of 1.5%
• KBC considers AT1 instruments as an integral part of its capital structure going forward and intends to maintain the 1.5% Additional Tier 1 bucket with CRD IV-eligible AT1 instruments
Minimum T2 target of 2%
• KBC envisages maintaining minimum 2% Tier-2 capital position, with possibly a higher buffer in the future
7.0%
Note: Including remaining State Aid
KBC Minimum CRD IVCapital Structure
2.5% CCB
4.5%
2.0% T2
CET1
1.5%
3.0% Buffer Above Minimum CET1
AT1
Potential Additional Capital – Being Monitored
No less than 13.5% Total Capital Ratio

Transaction Overview Section 6

33
Transaction rationale
Ensure 1.5% of RWA “bucket” of AT1 capital under CRD IV at all times
• Optimise the usage of CET1
• More flexible and efficient capital structure
Initiate refinancing of legacy Tier-1 instruments with CRD IV-compliant AT1 and optimise cost of capital over time
Further strengthen the group’s leverage ratio position
Achieve equity credit from rating agencies
• Improves S&P Risk Adjusted Capital (RAC)

34
Selected summary terms
Issuer KBC Group NV (“Issuer”)
Instrument Undated Deeply Subordinated Additional Tier 1 Fixed Rate Resettable Callable Securities (“Securities”)
Ranking Deeply subordinated and senior only to ordinary shares of the Issuer and any other instrument ranking pari passu with such ordinary shares, or otherwise junior to the issuer’s obligations under the securities
Issuer ratings Baa1/BBB+/A- (Moody's, S&P, Fitch)
Instrument rating Expected to be rated [BB-] by S&P and BB by Fitch
Currency / size EUR [●]bn
Issue format PerpNC5
Optional redemption
Callable on the First Call Date and every interest payment date thereafter Callable on Tax or Regulatory event Securities callable at the Prevailing Principal Amount plus accrued interest, but only if the Prevailing Principal Amount is equal to the Original Principal
Amount Subject to regulatory approval (if required)1
Coupon Fixed rate of [●]% per annum until (but excluding) the First Call Date, reset every 5 years thereafter (non-step) Payable quarterly
Coupon cancellation Non-cumulative Fully discretionary Mandatory cancellation upon insufficient Distributable Items or if payment exceeds MDA
Principal write-down
Temporary write-down upon the occurrence of a Trigger Event The write-down amount will be the lower of
The amount of write-down required to cure the Trigger Event pro rata with similar loss absorbing instruments (post cancellation of accrued interest on the Securities and the prior or concurrent write-down or conversion into equity if any prior loss-absorbency instruments) and The amount necessary to reduce the Prevailing Principal Amount of the securities to 1 cent
Trigger event Issuer’s consolidated CET1 Ratio < 5.125% (on a transitional basis)
Return to financial health Gradual write-up2 to the Original Principal Amount if a positive consolidated net income of Issuer is recorded Fully discretionary write-up and pro rata with other similar instruments Subject to the Maximum Write-up Amount and to the MDA
PONV Statutory
1. The applicable banking regulations do not permit purchases in the first 5 years 2. Write-up will be based on the applicable transitional CET1 definition using the Danish Compromise

35
0.0 x
0.2 x
0.4 x
0.6 x
0.8 x
1.0 x
1.2 x
1.4 x
1.6 x
1.8 x
2.0 x
0.0
%
(4.0
)%
(8.0
)%
(12.
0)%
(16.
0)%
(20.
0)%
(24.
0)%
(28.
0)%
(32.
0)%
(36.
0)%
(40.
0)%
(44.
0)%
(48.
0)%
(52.
0)%
(56.
0)%
(60.
0)%
(64.
0)%
(68.
0)%
KBC demonstrates a very strong capital buffer to trigger…
SIMULATION ANALYSIS7
1. Buffer including the 8% 1bn USD Tier 2 CoCo. 2. Based on Basel 2.5 figures. 3. Source: Offering circular and investor presentation of the latest AT1 transaction. 4. Based on estimated phased in ratio as of 01-Jan-2014 at Credit Agricole Group as disclosed in the offering circular. Additional trigger at 5.125% CET1 at Credit Agricole S.A.
Equal to approx. 7.7bn EUR capital losses or 4.5x
net income6
Equal to RWA increase of 151bn EUR or approx. 169% of current RWA
BUFFER TO TRIGGER POSITION VS. SELECTED AT1 ISSUERS (AT ISSUE)
KBC Benefits from a Large
Buffer At Issue…
… and strong organic capital generation
CET1 CHANGE RW
A CH
ANGE
Does Not Trigger the AT1 Security
buffer at issue buffer at issue (% of total assets) buffer at issue / FY 2013 total income5
2014E net income6
/ Basel 3 RWA
KBC benefits from a large
buffer at issue…
5. Based on annualised net income at issue for Barclays, SocGen and Credit Agricole. 6. Based on 2014E analyst consensus net income estimates. 7. Based on Basel 3 phased-in CET1 and RWAs. Simulation includes the 1.0bn USD 8.0% Tier 2 CoCo.
Note: KBC figures adjusted for the impact of the divestment agreements signed for KBC Bank Deutschland and Antwerp Diamond Bank, as well as the repayment of the second instalment of aid received from the Flemish Regional Government. KBC position based on Basel 3 phased-in.
Trigger (%)
7.8% 7.7% 6.5% 6.5%
5.3% 4.0%
2.6%
0.8 %
8.6 %
7.7 %²
6.5 % 6.5 %²
5.3 %
4.0 %
2.6 %
KBC Group Danske SocGen³ BBVA³ Santander CreditAgricole
Barclays
3.2 %¹ 3.5 % 2.6 % 2.0 % 0.8 %
1.0 x¹ 1.0 x 3.0 x 1.8 x 0.4 x
1.9 % 1.0 % 1.1 % 0.9 % 1.1 %
€7.7bn¹ €20.9bn €28.6bn €21.0bn €14.2bn
1.6 %
2.9 x
1.0 %
€20.1bn
2.0 %
1.6 x
1.3 %
€8.8bn
5.125 % 5.125 % 5.125 % 7.0 % 7.0 % 5.125 % 7.0 %
Tier 2 CoCo

36
MDA Buffer of 5.9%1 (5.3bn EUR)
…and to Maximum Distributable Amount (“MDA”) restrictions
Note: Figures adjusted for the impact of the divestment agreements signed for KBC Bank Deutschland and Antwerp Diamond Bank, as well as the repayment of the second instalment of aid received from the Flemish Regional Government. MDA restrictions are only phased-in starting 2016 and KBC retains the flexibility to allocate the MDA, in the event that it faces any limitations. Based on the minimum CET1 requirement and the capital conservation buffer. A D-SIB buffer might be imposed in the future. 1. Buffer does not include the 8% 1bn USD Tier 2 CoCo: in the unlikely event that KBC’s CET1 ratio were to fall below 7%, the 8% 1bn USD Tier 2 CoCo will be written down thereby increasing the buffer by 0.7bn EUR. MDA calculations will be based on the applicable transitional CET1 definition using the Danish Compromise.
MDA Buffer of 9.4%1 (8.5bn EUR)
BUFFER TO COMBINED BUFFER REQUIREMENT, ASSUMING A STATIC CAPITAL POSITION
MDA Buffer illustratively computed versus the 12.9% phased-in CET1 ratio as of 2013YE. The actual buffer in 2019
would potentially be higher
3.5% 4.0% 4.5% 4.5% 4.5% 4.5% 4.5%
0.6% 1.3% 1.9% 2.5%
3.5% 4.0%
4.5% 5.1%
5.8% 6.4% 7.0%
0.0 %
2.5 %
5.0 %
7.5 %
10.0 %
12.5 %
15.0 %
2013 2014 2015 2016 2017 2018 2019
Minimum CET1 Ratio Capital Conservation Buffer
Minimum Targeted Fully Loaded CET1 Ratio: 10%
Phased-In CET1 Ratio as of 2013: 12.9%

37
KBC has not skipped any coupon payments on its publicly held CRD II T1 instruments to date
KBC management intends to prioritise coupons on AT1 instruments over other discretionary distributions
• Coupons not expected to be significant in comparison to KBC’s total discretionary distributions
KBC does not anticipate any regulatory restrictions on AT1 coupons with regard to the MDA1 in the foreseeable future
• KBC’s healthy capital position and earnings generation provide sufficient buffer
• As of today, KBC has 5.3bn EUR buffer to a fully loaded CET1 requirement of 7%
• Additionally, the Tier 2 CoCo (issued Jan 2013) will provide further 0.7bn EUR buffer in stress scenario (breach of 7% CET1 ratio)
Mitigating key risks to investors: Distributions
Note: Figures adjusted for the impact of the divestment agreements signed for KBC Bank Deutschland and Antwerp Diamond Bank, as well as the repayment of the second instalment of aid received from the Flemish Regional Government 1. MDA restriction phased-in from 2016.
Given CRD IV requirements, the securities will have fully discretionary coupons and do not include a dividend stopper or dividend pusher feature
Having approved the AT1 issue to strengthen KBC Group’s capital base, the KBC Board currently intends to respect to the fullest extent possible the hierarchy of capital instruments when making discretionary coupons

38
The trigger is set at a level of 5.125%, which is permissible under CRD IV and on a transitional basis
KBC has a strong capital position with transitional CET1 ratio of 12.9%
• There is currently a capital buffer of 7.8% to trigger as at YE 2013, which represents approx. 7.0bn EUR1 of buffer
• Additionally, the Tier-2 CoCo (issued Jan-2013) will provide further 0.7bn EUR buffer in stress scenario (breach of 7% CET1 ratio)
KBC has opted for a temporary write-down mechanism
• Allows the securities to be gradually written back up (subject to MDA restrictions) with profits once KBC Group returns to financial health and KBC Group’s capital position is above the trigger level
The securities can only be called at par protecting the investors from zero recovery
Mitigating key risks to investors: Loss absorption
Do not contain any contractual Point of Non-Viability
Once a resolution regime is in place in Belgium, the Securities could be written down should KBC Group be considered non-viable by the regulator or resolution authority
• This is similar to other Tier-1 and Tier-2 instruments in the capital structure
Note: Figures adjusted for the impact of the divestment agreements signed for KBC Bank Deutschland and Antwerp Diamond Bank, as well as the repayment of the second instalment of aid received from the Flemish Regional Government
1. Buffer does not include the 8% USD1bn Tier 2 CoCo.
If the Consolidated KBC Group CET1 ratio falls below 5.125%, the securities will be written down on a temporary basis
The securities are subject to statutory loss absorption

39
Investment thesis
1. Investor friendly structure with 5.125% trigger and temporary write-down mechanism
2. Very significant buffer to MDA restrictions – approx. 5.9%1 assuming a static capital position and 2019E fully loaded buffer requirements
3. Substantial buffer of 7.8%1 to the instrument trigger of 5.125% CET1
Including the 1bn USD Tier 2 CoCo, the buffer to the instrument trigger increases to 8.6%
4. Extremely robust organic capital generation – 1.9% per annum2
5. Proven track record of prudent capital management (e.g. shareholder loans (2013), capital increase (2012))
6. AT1 coupon prioritisation and maintenance of capital hierarchy
1. KBC position based on Basel 3 phased-in figures adjusted for the impact of the divestment agreements signed for KBC Bank Deutschland and Antwerp Diamond Bank, as well as the repayment of the second instalment of aid received from the Flemish Regional Government.
2. Based on consensus estimates for 2014 earnings as per 28th January 2014

Supplementary P&L Information Appendix 1

41
Net interest income and margin
Net interest income • Stabilised q-o-q and y-o-y, excluding deconsolidated
entities
• Sound commercial margins and lower funding costs more or less offset the negative impact from lower reinvestment yields and the deliberately decreasing loan portfolio at the foreign branches and the legacy Project Finance portfolio at the banking side
• Net interest income at the insurance side continues to suffer from lower reinvestment yields and the shift to unit-linked life insurance products
Net interest margin (1.80%) • Up by 3bps q-o-q and 9bps y-o-y
• Q-o-q, sound commercial margins, lower funding costs at KBC Group level (not allocated to specific BUs) and better ALM yield management more than offset the negative impact from lower reinvestment yields
NIM1
(excl. IFRS-5 entities and divestments)
NII
2 241,009
842
173
-6
3Q13
1,013
842
177
-6
2Q13
990
827
174
-11
1Q13
1,032
833
179
-4
4Q12
1,084
823
191
-1
71
3Q12
1,078
803
199 74
2Q12
1,153
4Q13
199
-2
87
1Q12
869 904
214
-1
100 1,217
4Q13
1.80%
3Q13
1.77%
2Q13
1.72%
1Q13
1.72%
4Q12
1.71%
3Q12
1.66%
2Q12
1.78%
1Q12
1.87%
Amounts in m EUR
1. Net interest margin (bank): net interest income divided by total interest bearing assets excl. reverse repos of KBC Bank
NII - banking contribution
NII - insurance contribution
NII - contribution of holding-company/group
NII - deconsolidated entities

42
Net fee and commission income and AUM
Strong net fee and commission income • Increased by 7% q-o-q and 11% y-o-y excluding
deconsolidated entities • Y-o-y increase driven by higher entry and
management fees on mutual funds • Q-o-q increase was mainly the result of higher fees
from payment transactions and other fees (mainly fees on investment services and booking fees) recorded in Hungary. In Belgium, significantly higher entry fees on mutual funds thanks to the savings campaign and increased management fees on equity & balanced funds were offset by higher cost charges regarding payment cards, lower commission income from financial services and higher commissions paid to insurance agents (as a result of higher sales of guaranteed interest products)
Assets under management (163bn EUR) • Rose by 5% y-o-y owing to net inflows (+1%) and a
positive price effect (+4%) • Up 2% q-o-q as a result of positive price effects
AUM
F&C
Amounts in m EUR
163160156156155155151153
4Q13 3Q13 2Q13 1Q13 4Q12 3Q12 2Q12 1Q12
369345
388
4Q13 3Q13 2Q13 1Q13
385
380
5
4Q12
359
332
27
3Q12
345
320
25
2Q12
309
317
-8
1Q12
312
322
-10
Deconsolidated entities

43
Operating expenses and cost/income ratio
Cost/income ratio (banking) at excellent 52% in FY13 • Driven by the high M2M impact of ALM derivatives, the
sale of AFS assets and high other net income • Adjusted for specific items, the C/I ratio amounted to
roughly 54% in FY13 • Operating expenses went down by 1% y-o-y excluding
deconsolidated entities, due to the FX effect, some restructuring charges recorded in 4Q12 in the Czech Republic and lower staff expenses in the Belgium BU. This was only partly offset by the financial transaction levy in Hungary and higher staff expenses in Ireland (increased number of FTEs, particularly in the MARS support unit). Excluding all one-off items, operating costs rose by 1% y-o-y
• Operating expenses increased by 5% q-o-q excluding deconsolidated entities due partly to seasonal effects such as traditionally higher marketing and ICT expenses. Excluding all one-off items, operating costs rose by 7% q-o-q
OPERATING EXPENSES
Amounts in m EUR
2Q12
1,016
859
50 129
74
2Q13 1Q12
1,110
856
130
847
124 124 65
898
4Q13
963
3Q13
913 921
1Q13
1,029
875
47
4Q12
1,068
923
28
848
95
65
3Q12
990
845
30
98
Bank tax Deconsolidated entities

Selected Credit Exposures Appendix 2

45
Hungary (1)
4Q13 net result at the K&H Group amounted to 16m EUR including impact of reassessment of loan portfolio (-21m EUR pre-tax and -17m EUR post-tax)
YTD net result amounted to 66m EUR including • ‘regular’ bank tax (-43m EUR post-tax) in 1Q13 • the additional one-off FTL-related charge (-22m EUR post-tax) in 2Q13 • impact of reassessment of loan portfolio (-17m EUR post-tax) in 4Q13
Loan loss provisions amounted to 43m EUR in 4Q13 including pre-tax impact of 21m EUR following reassessment of loan portfolio (3Q13: 12m EUR, FY13: 76m EUR)
The credit cost ratio amounted to 1.50% in FY2013 (versus 0.78% in FY2012), excluding the impact of reassessing the portfolio it would have been 1.08%
NPL (PD11-12) increased to 12.1% in 4Q13 from 11.7% in 3Q13, due mainly to a continuous rise in NPL in retail • share of PD 10-12 exposure was 15.4% in 4Q13 (after reassessment)
HUNGARIAN LOAN BOOK KEY FIGURES AS AT 31 DECEMBER 2013
Loan portfolio Outstanding NPL NPL coverage
SME/Corporate 2.7bn 6.5% 66%
Retail 2.4bn 18.5% 68%
o/w private 2.0bn 20.9% 68%
o/w companies 0.4bn 7.0% 63%
TOTAL 5.1bn 12.1% 67%
High Risk (probability of default > 6,4%) Non-Performing
1. Decline in high-risk portfolio (PD8-10) is due to the increasing share of both low-risk (PD1-7) and non-performing (PD11-12) portfolios
14.3%
13.3% 13.5% 13.5%13.0%
11.7% 11.9%
10.7%
11.3%
12.6%
11.9%11.4% 11.3% 11.2%
11.7%
12.1%
8
9
10
11
12
13
14
15
1Q12 2Q12 3Q12 4Q12 1Q13 2Q13 3Q13 4Q13
1
PROPORTION OF HIGH RISK AND NPLS

46
Hungary (2) Loan book reassessment
K&H Bank reassessed its loan book in 4Q13
As a result, 131m EUR performing restructured mortgage loans were moved from PD 9 to PD 10
This resulted in an additional impairment of 18m EUR on mortgage portfolio
For lease and unsecured consumer credit: extra impairment of 3m EUR
In total, this led to an additional impairment of 21m EUR in 4Q13
Cover ratios: • total impairments (incl. IBNR) / PD11-12 exposure: 64% for mortgage portfolio (and 67% for total portfolio) • total impairments (incl. IBNR) / PD10-12 exposure:
o 59% for mortgage portfolio (and 60% for total portfolio) before reassessment and
o 47% for mortgage portfolio (and 53% for total portfolio) after reassessment (due to the combined effect of (i) a higher cover ratio for previously impaired exposure and (ii) a relatively lower cover ratio for newly impaired exposure in view of their inherently better risk characteristics)
22m EUR, 18m EUR of which impairment charges following reassessment of loan book
131m EUR to PD10
PD Exposure Impairment Cover %
PD 1-8 1 078 4 0.4%
PD 9 368 28 7.6%
PD 10 0 0 -
PD 11 -12 350 179 51.1%
TOTAL PD1-12 1 796 211
Mortgage loan portfolio at end 3Q13 Mortgage loan portfolio at end 4Q13 (after reassessing loan book)
Amounts in m EUR
PD Exposure Impairment Cover %
PD 1-8 1 071 4 0.4%
PD 9 205 9 4.4%
PD 10 131 35 26.7%
PD 11 -12 363 186 51.2%
TOTAL PD1-12 1 769 233

47
05
101520253035
1. The total NPL coverage ratio amounted to 73% at the end of 4Q13 (54% in 3Q13) taking into account the adjustments for the Mortgage Indemnity Guarantee and Reserved Interest (62% for owner occupied mortgages and 71% for buy to let mortgages, respectively)
2. NPL coverage ratio calculated under the current definition (NPL = PD 11 & 12). If we apply the new definition (NPL = PD 10, 11 & 12), the NPL coverage ratio would amount to 37%
Loan loss provisions in 4Q13 of 773m EUR (87m EUR in 4Q12). A significant increase in the quarter, primarily as a result of the reassessment of the KBCI loan book in light of the EBA guidelines issued in October 2013 and the Central Bank of Ireland Impairment Provisioning Guidelines issued May 2013. Net loss in 4Q13 was 766m EUR (-67m EUR in 4Q12)
Signs of an improvement in Irish economic conditions emerged in the latter part of 2013, with rising employment and better consumer sentiment. Some further improvement is expected to build gradually through 2014
A more positive trend in transactions and prices in the residential property market became established as 2013 progressed. National prices ended the year 6.4% higher, primarily led by strong gains in Dublin of 15.3% over the year, contrasting with a 0.4% decrease in the non-Dublin area. Recent evidence of a turnaround in the commercial property market is expected to continue in 2014
KBCI is proactively engaging with those customers who are experiencing financial difficulty and is implementing its long term Mortgage Arrears Resolution Strategy. As part of this, KBCI has met the 4Q public target set by the Central Bank of Ireland
Continued successful retail deposit campaign with gross retail deposit levels increased by c.0.8bn EUR since end 2012 to 2.9bn EUR at end 4Q13 and approx. 6 000 new customer accounts opened in the quarter. Demand for mortgage products continues to increase with rising consumer confidence and increased brand awareness
Following the launch of personal current accounts in September 2013, KBCI will shortly introduce complementary consumer finance products, in the form of Credit Cards and Personal Loans. Customer growth is being driven by an expanding digitally led distribution model supported by selective new office locations
Local tier-1 ratio of 12.2% at the end of 4Q13 Going forward, loan loss provisions are expected to be in the range of 150m-200m EUR for
FY14 and 50m-100m EUR for each of FY15 and FY16. Profitability expected from 2016 onwards
The current definition of Non Performing loans (NPL) being PD11-12 will be reviewed in 2014 in the context of the draft October 2013 EBA paper and May 2013 Central Bank of Ireland Impairment Provisioning and Disclosure Guidelines. Based on this reviewed definition, the NPL coverage ratio will drop substantially
PROPORTION OF HIGH RISK AND NPLS
IRISH LOAN BOOK KEY FIGURES AS AT 31 DECEMBER 2013
LOAN PORTFOLIO OUTSTANDING NPL NPL COVERAGE
Owner occupied mortgages 9.1bn 19.9% 55%1
Buy to let mortgages 3.0bn 34.7% 65%1
SME /corporate 1.5bn 23.7% 123%
Real estate investment Real estate development
1.2bn 0.5bn
31.2% 88.7%
79% 78%
Total 15.3bn 26.2% 68%1 2
24.9% 24.0%
31.7%
25.8%
25.7%
25.9%
2Q12 3Q12
24.9%
4Q12
26.2%
4Q13 3Q13 2Q13
21.5%
20.0% 21.8%
22.5%
1Q12
24.4%
23.3%
High Risk (probability of default > 6.4%) Non-performing (PD11-12)
The High Risk portion of loans increased significantly in 4Q13 due to the reassessment of the loan book
Ireland (1)

48
CONTINUING TENTATIVE SIGNS OF GDP GROWTH UNEMPLOYMENT RATE DECREASED SLIGHTLY IN 2013
35455565758595
105
2007 2008 2009 2010 2011 2012 2013
% Change in Property Price - From Peak
All Properties National (exc Dublin) Dublin Houses Dublin Apartments
RESIDENTIAL PROPERTY PRICES SHOWING CONTINUED SIGNS OF STABILISATION
Source: Irish Residential Property Prices - CSO Index
Source: Irish Residential Property Prices - CSO Index
-10%-5%0%5%
10%15%20%25%
Dec-12 Jun-13 Dec-13
% Change in Property Prices - 2013 Only
All Properties National (exc Dublin) Dublin Houses Dublin Apartments
-8.0
-6.0
-4.0
-2.0
0.0
2.0
4.0
6.0
2007 2008 2009 2010 2011 2012 2013F 2014F
GDP %
02468
10121416
2007 2008 2009 2010 2011 2012 2013 2014F
% Unemployment Rate
Ireland (2) Key indicators show signs of stabilisation

49
-50
0
50
100
150
200
Arrears and NPL Trend (rolling 3 month average, EUR m)
NPL Arrears
Q2 2012 Q3 2012 Q4 2012 Q1 2013 Q2 2013 Q3 2013 Q1 2012 Q4 2011 Q4 2013
KBC IRELAND - DECREASING RESIDENTIAL MORTGAGE ARREARS & NPL
Ireland (3) Key indicators show tentative signs of stabilisation

50
+2.1bn EUR to PD 10
PD Exposure Impairment Coverage % PD 1-8 6 711 16 0.2%
Of which: Without restructure 5 984
Of which: In live restructure 817
PD 9 2 391 125 5.2% Of which: Without restructure 663
Of which: In live restructure 1 727
PD 10 273 78 28.6% PD 11 2 507 710 28.3% PD 12 310 155 49.9% Total PD1-12 12 192 1 084 Total impairment / NPL exposure 38.5% Total impairment / NPL exposure (taking MIG and RI into Account) 44.8%
• 2.1bn EUR of restructured mortgage loans moved from PD 1-9 (Performing) to PD 10 (Performing, but impaired)
• The subsequent recalibration of the Probability of Default Model resulted in a significant shift in exposures from the PD1-8 to the PD9 portfolio
• Only 0.3bn EUR of loans in Live restructure are left in PD 1-9
3Q13
+586m EUR increase in accumulated impairment, of which +563m EUR additional charge through P/L
Amounts in m EUR
4Q13
NPL
Ireland (4) Homeloans portfolio
PD Exposure Impairment Coverage % PD 1-8 5 594 18 0.3%
Of which: Without restructure 5 566
Of which: In live restructure 28
PD 9 1 259 91 7.2% Of which: Without restructure 1 016
Of which: In live restructure 243
PD 10 2 413 563 23.3% PD 11 2 491 806 32.4% PD 12 368 192 52.2% Total PD1-12 12 125 1 670 Total impairment / NPL exposure 58.4% Total impairment / NPL exposure (taking MIG and RI into Account) 65.4%
Perf
orm
ing
NPL
Pe
rfor
min
g
51
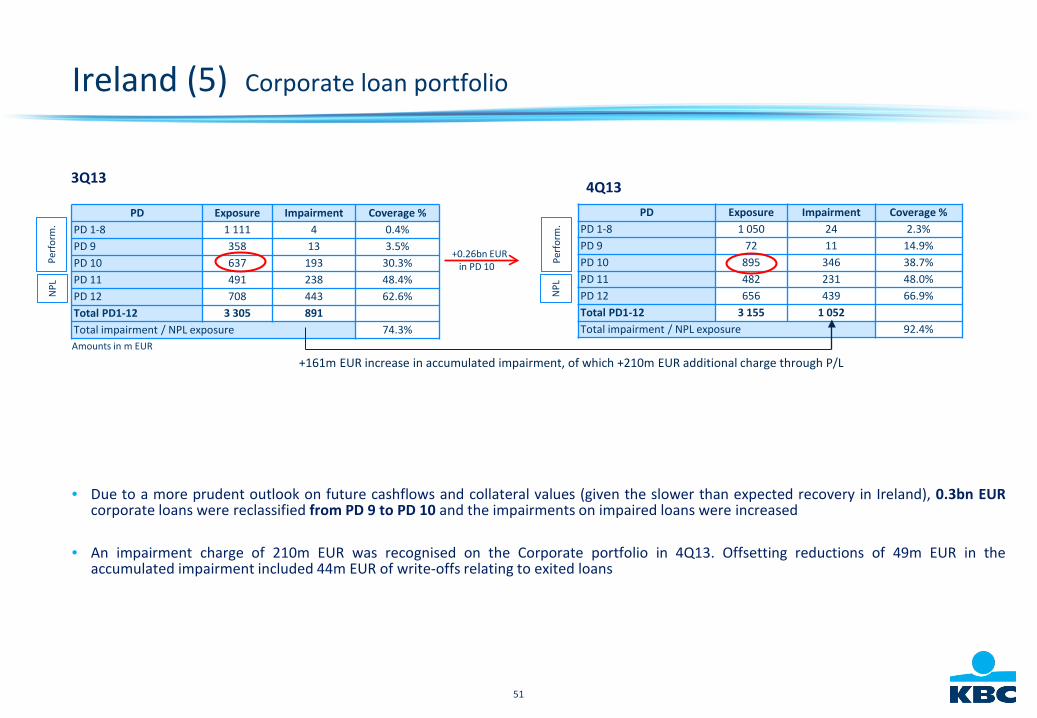
PD Exposure Impairment Coverage % PD 1-8 1 050 24 2.3% PD 9 72 11 14.9% PD 10 895 346 38.7% PD 11 482 231 48.0% PD 12 656 439 66.9% Total PD1-12 3 155 1 052 Total impairment / NPL exposure 92.4%
+0.26bn EUR in PD 10
PD Exposure Impairment Coverage % PD 1-8 1 111 4 0.4% PD 9 358 13 3.5% PD 10 637 193 30.3% PD 11 491 238 48.4% PD 12 708 443 62.6% Total PD1-12 3 305 891 Total impairment / NPL exposure 74.3%
• Due to a more prudent outlook on future cashflows and collateral values (given the slower than expected recovery in Ireland), 0.3bn EUR corporate loans were reclassified from PD 9 to PD 10 and the impairments on impaired loans were increased
• An impairment charge of 210m EUR was recognised on the Corporate portfolio in 4Q13. Offsetting reductions of 49m EUR in the
accumulated impairment included 44m EUR of write-offs relating to exited loans
Amounts in m EUR
3Q13 4Q13
+161m EUR increase in accumulated impairment, of which +210m EUR additional charge through P/L
Ireland (5) Corporate loan portfolio N
PL
Perf
orm
.
NPL
Pe
rfor
m.

52
Net CDO exposure significantly reduced over 2013 Reduction of 9.2bn EUR in net exposure in 2013 owing mainly to the collapsing of several CDOs. Please note that the net CDO exposure excludes all expired, unwound, de-risked or terminated CDO positions and is after settled credit events REMINDER: CDO exposure largely covered by a State guarantee
IN BN EUR NET CDO EXPOSURE
OUTSTANDING MARKDOWNS
CDO exposure protected with MBIA Other CDO exposure
5.3
1.1
-0.1
-0.2
TOTAL 6.3 -0.2
1. Taking into account the guarantee agreement with the Belgian State
P&L sensitivity decreased by 188m EUR over 2013 following collapses and de-risking activities in 1Q13 and 2Q13, and the tightening of the credit spreads for the names underlying the deals
Note that in 2Q13, the provision rate for MBIA was lowered from 80% to 60% after improvements in its creditworthiness
CDO exposure will continue to be viewed in an opportunistic way: we will reduce further if the net negative impact is limited (taking into account the possible impact on P&L, the value of the State guarantee and the reduction in RWA)
In this context, we already collapsed one CDO in 1Q14 (which will lead to a decrease in exposure of roughly 2bn EUR and a decrease in RWA of roughly 0.7bn EUR)
NEGATIVE P&L IMPACT1 (m EUR) OF A 50% WIDENING IN CORPORATE AND ABS CREDIT SPREADS
92119142
204280261
448438505
0
100
200
300
400
500
600
3Q13 2Q13 1Q13 4Q12 3Q12 2Q12 1Q12 4Q11 4Q13

53
Traditional dealing rooms, Brussels by far the largest, focus mainly on trading in interest rate instruments and for client-related business. Abroad, dealing rooms focus primarily on providing customer service in money and capital market products, on funding local bank activities and engage in limited trading for own account in local niches.
Limited trading activity at KBC Group
12%
Operational risk 11%
Market risk 9%
Credit risk 68%
Insurance activity
31-12-2012 31-12-2013
13%
Operational risk 12%
Market risk 5%
Credit risk 70%
Insurance activity
BREAKDOWN BY RWA

54
Government bond portfolio KBC Group – Carrying value Carrying value of 48.5bn EUR in government bonds (excl. trading book) at end of 2013, primarily as a result of a significant excess
liquidity position and the reinvestment of insurance reserves into fixed-income instruments
Carrying value of GIIPS exposure amounted to 1.7bn EUR at end of 2013
Reclassification of the government bond portfolio from available-for-sale to held-to-maturity
END 2013
(48.5bn EUR carrying value1) (45.6bn EUR notional amount)
1. Carrying value is the amount at which an asset [or liability] is recognised: for those not valued at fair value this is after deducting any accumulated depreciation (amortisation) and accumulated impairment losses thereon, while carrying amount is equal to fair value when recognised at fair value
2. 1% 3. 2%
7%
5%
4%
Ireland 2 Netherlands3
Austria3
Germany 3
Spain2
1% Other 9%
France
Italy3 2%
Slovakia
Hungary Poland2
1%
Czech Rep.
16% Belgium
49%
00%
10%
20%
30%
40%
50%
60%
70%
1Q11 2Q11 3Q11 4Q11 1Q12 2Q12 3Q12 4Q12 1Q13 2Q13 3Q13 4Q13
AFS HTM HFT FV L&R

Further Details on Proposed Transaction Appendix 3

56
Transaction summary Issuer KBC Group NV (“Issuer”)
Instrument Undated Deeply Subordinated Additional Tier 1 Fixed Rate Resettable Callable Securities (“Securities”)
Ranking Direct, unconditional, unsecured and deeply subordinated obligations of the Issuer Senior only to ordinary shares of the issuer and any other instrument ranking pari passu with such ordinary shares or otherwise junior to the Issuer's obligators under the securities
Issuer Ratings Baa1/BBB+/A- (Moody's, S&P, Fitch)
Instrument Rating Expected to be rated [BB-] by S&P and BB by Fitch
Currency / Size EUR [●]bn
Maturity Perpetual
Issuer Call Option
Callable in Year 5(“First Call Date") and every interest payment date thereafter, at the Prevailing Principal Amount plus accrued interest, but only if the Prevailing Principal Amount of each Security is equal to its Original Principal Amount and subject to regulatory approval (if required) “Prevailing Principal Amount” means, in respect of a Security at any time, the Original Principal Amount of such Security as reduced by any Principal Write-down of such Security (on one or more
occasions) at or prior to such time pursuant to the Principal Write-down and Principal Write-up Condition and, if applicable following any Principal Write-down, as subsequently increased by any Principal Write-up of such Security (on one or more occasions) at or prior to such time pursuant to the Principal Write-down Condition and the Principal Write-up Condition
Early Redemption Events
Callable at any time following a Tax ( gross up or deductibility) or Regulatory Event at the then Prevailing Principal Amount plus accrued interest, but only if the Prevailing Principal Amount of each Security is equal to its Original Principal Amount and] subject to regulatory approval (if required) A “Regulatory Event” shall occur if there is a change (or prospective change which the Lead Regulator considers to be sufficiently certain) in regulatory classification of the Securities that has
resulted or would be likely to result in them being fully excluded from the Additional Tier 1 Capital of the Issuer
Coupon Fixed rate of [●]% per annum until (but excluding) the First Call Date From (and including) the First Call Date, reset every 5 years to a fixed rate based on the then prevailing 5-year EUR mid-swap rate + a margin of [ ]bps Payable quarterly
Coupon Cancellation Non-cumulative; at full discretion of the Issuer Mandatory cancellation if coupon exceeds the distributable items or Maximum Distributable Amount (“MDA”)
Principal Write-down
If Trigger Event occurs, the Issuer shall first irrevocably cancel all interest accrued on each Security up to (and including) the Trigger Event Write-down Date (whether or not the same has become due at such time); and secondly irrevocably reduce the then Prevailing Principal Amount of each Security by the relevant Write-down Amount. The write-down amount will be the lower of (i) the amount of write-down pro rata with other similar loss-absorbing instruments (based on the then prevailing principal amount of each similar loss absorbing instrument) and that together with the prior or concurrent write-down or conversion into equity of the entire (save for any one-cent. floor) outstanding principal amount of any prior loss-absorbing instrument that would be sufficient to restore the Issuer’s consolidated CET1 ratio to 5.125% or (ii) the amount necessary to reduce the Prevailing Principal Amount to one cent of the securities
Trigger Event “Trigger Event” will occur if the Issuer’s consolidated CET1 Ratio as of any Quarterly Financial Period End Date or Extraordinary Calculation Date, is less than 5.125% (on a transitional basis)
Return to Financial Health (“Principal write-up”)
Gradual write-up1 to the Original Principal Amount if a positive consolidated net income of Issuer is recorded, at the Issuer’s sole discretion, pro rata with other similar instruments (based on the then prevailing principal amount of each similar instrument), subject to the Maximum Write-up Amount and subject to the MDA The maximum write-up amount means the consolidated net income of the Issuer multiplied by the ratio of the original principal amount of all written-down Additional Tier 1 instruments to the
total Tier-1 Capital of the Issuer
PONV In respect of the Status of the Securities Condition, reference is made to statutory loss absorption as more fully described in the risk factors entitled “Loss absorption at the point of non-viability”, “The principal amount of the Securities may be reduced (Written Down) to absorb losses” and “Change of Law”
Governing Law English law, save for provisions relating to form, status, meetings and modification, which will be governed and construed in accordance with Belgian law
Denominations EUR 100,000 per Security +1k increments (“Original Principal Amount”)
Listing Euronext Brussels
1. Write-up will be based on the applicable transitional CET1 definition using the Danish Compromise

57
Relative overview of the proposed structure and buffers
Date 13-Nov-2013 / 04-Dec-2013 29-Aug-2013 / 12-Dec-2013 15-Jan-2014 11-Feb-2014 05-Mar-2014 05-Mar-2014 18-Jan-2013 [●]
Coupon 8.250% / 8.000% 8.250% / 7.875% 7.875% 7.000% 6.250% 5.750% 8.000% [●]%
Type PerpNC5 / PerpNC7 PerpNC5 / PerpNC10 PerpNC10 PerpNC5 PerpNC5 PerpNC6 10NC5 PerpNC5 Size & Currency $2,000m / €1,000m $1,250m / $1,750m $1,750m €1,500m €1,500m €750m $1,000m €[●]m Inst. rating (M/S/F) - /B+/ BB+ Ba3 / BB+/ BB - / BB+ / BB+ - / - / BB- Ba2 / - / - - / BB+ / BB+ -/BB+/- [-/[BB-]/BB] Capital treatment Tier 1 Tier 1 Tier 1 Tier 1 Tier 1 Tier 1 Tier 2 Tier 1 Offer format SEC and Reg-S Regs / 144A / Reg-S 144A / Reg-S Reg-S Reg-S Reg-S Reg-S Reg-S Min. denoms. $200k x $1k / €200k x €1k $200k x $1k $200k x $1k €200k x €200k €100k x €100k €100k x €1k $200k x $200k €100k Coupon structure Reset after 5 / 7 years
No step-up Reset after 5/10 years No step-up
Reset after 5 years No step-up
Reset after 5 years No step-up
Reset after 5 years No step-up
Reset after 6 years No step-up
Reset after 5 years No step-up
Reset after 5 years No step-up
Coupon cancellation / deferral
Discretionary, non- cumulative
Discretionary, non-cumulative
Discretionary, non- cumulative
Discretionary, non- cumulative
Discretionary, non- cumulative
Discretionary, non-cumulative
Must pay Discretionary, non- cumulative
Issuer call Issuer call on Year 5 / 7 Reg call (loss of Tier 1
treatment) and tax call at par
Issuer call on Year 5 / 10 Reg call (full loss of Tier 1
treatment) and tax call at par
Instrument can be called based on the written down amount
Issuer call on Year 10 Reg call (full loss of Tier 1
treatment) and tax call at par
Instrument cannot be called if they are written down, until they are written back up again to par
Issuer call on Year 5 Reg call (if loss of any capital
treatment) and tax call at par
Issuer call on Year 5 Reg call (full loss of Tier 1
treatment) and tax call at par
Issuer call on Year 6 Reg call (partial loss of Tier 1
treatment) and tax call at par
Issuer call on Year 5 Reg call (full loss of Tier 2
treatment) and tax call at par
Issuer call on Year 5 Reg call (full loss of Tier 1
treatment) and tax call at par
Principal loss absorption
Conversion into shares on: Fully Loaded Basel III / CRD
IV CET1 ratio < 7.000 %
Temporary Write-down at 5.125% EBA CT1 Ratio (and 5.125% CET1 after 1 Jan 2014)
Based on phased in Basel III Common Equity Tier 1 Ratio
Temporary Write-down Credit Agricole Group <
7.000% CET1 Ratio CASA < 5.125% CET1 Based on phased in CRD IV
Common Equity Tier 1 Ratio
Conversion into shares on CET1 ratio < 5.125 %
Conversion into shares on CET1 < 5.125 %
Temporary Write-down at 7.00% CET1
Based on phased in Basel III Common Equity Tier 1 Ratio
Permanent Write-down at 7% CET1 ratio
Based on phased in Basel III Common Equity Tier 1 Ratio
Temporary Write-down at 5.125% CET1 ratio
Based on phased in CRD IV Common Equity Tier 1 Ratio
Conversion ratio and clawback
2/3 of spot share price at time of pricing
Clawback
NA NA Floored at approx. 51% No clawback
Prevailing share price floored at 4.34 EUR
NA NA NA
Non-viability loss absorption
No Contractual
acknowledgement of the UK bail-in power
No Risk factor regarding
statutory framework
No Risk factor regarding
statutory framework
No Risk factor regarding
statutory framework
No Risk factor regarding
statutory framework
No Risk factor regarding
statutory framework
No Risk factor regarding
statutory framework
No Risk factor regarding
statutory framework
Capital buffer at issue (buffer to trigger)2
Trigger Buffer
(T2 CoCo) (AT1)
1. Triggers include 1) CET1 ratio of the Bank or the Bank Group falling below 5.125%, 2) EBA CT1 ratio of the Bank Group falling below 7.000% , 3) Capital Principal and/or EBA CT1 ratios (if necessary) of the Bank Group falling below 7.000% and 4) Tier 1 ratio of the Bank or the Bank Group falling below 6.000%. The issuance qualified as core capital for the Bank of Spain
2. Based on the latest issuance
3. Basel 2.5 CT1 4. Basel 3 phased-in target as of 01-Jan-2014 5. Basel II 9M12 pro forma CT1 includes 1) the impact of the signed agreements for the divestment of Absolut Bank, NLB and a full exit of Kredyt Bank, 2) the impact of the capital increase and the sale of treasury shares and 3) the reimbursement of the remaining EUR 3bn Federal State aid (+ 15% penalty premium) 6. Basel III phased-in adjusted for the impact of the divestment agreements signed for KBC Bank Deutschland and Antwerp Diamond Bank, as well as the repayment of the second instalment of aid received from the Flemish Regional Government
7.0% 2.6%
9.6%
5.1%
6.5%
11.6% 2,3
7.0% 5.1%
4.0% 3.2%
11.0% 8.3%
CA Group 4 CASA4
5.1%
6.5%
11.6% 3
5.1%
5.3% 10.5%
7.0%
7.7%
14.7% 3
7.0%
5.7%
12.7% 5
5.1%
7.8%
12.9% 6

58
Details of existing Tier-1 securities
Tender Offer Organised in September 2009
KBC Bank KBC Bank KBC Bank KBC Bank
KBC Bank NV KBC Bank NV Funding Trust II Funding Trust III Funding Trust IV
Amount issued EUR 280,000,000 USD 600,000,000 EUR 300,000,000 GBP 525,000,000 EUR 1,250,000,000 EUR 700,000,000 Tendered EUR 161,300,000 USD 431,400,000 EUR 179,200,000 GBP 480,500,000 Net amount EUR 118,700,000 USD 168,600,000 EUR 120,800,000 GBP 44,500,000
ISIN XS0099124793 USU2445QAA68 / US48239AAA79
US48239FAA66 / USU2445TAA08 BE0119284710 BE0934378747 XS0368735154
First call date 30/09/2009 02/11/2009 10/11/2009 19/12/2019 14/05/2013 27/06/2013 Initial coupon 6.88% 9.86% 8.22% 6.20% 8.00% 8.00% Step-up coupon 3m euribor + 300bps 3m usd libor + 405bps 3m usd libor + 405bps 3m GBP libor +193% no step-up no step-up First (next) call date 30/06/2014 02/05/2014 10/05/2014 19/12/2019 14/05/2014 27/06/2014 ACPM - - - Yes Yes Yes Dividend stopper - - - Yes Yes Yes Conversion into PSC - - - Yes Yes Yes
Trigger - - - Supervisory Event or general "concursus
creditorum"
Supervisory Event or general "concursus
creditorum"
Supervisory Event or general "concursus
creditorum"
Dividend payments
Dividends are only payable with respect to any Dividend Period if, and to the extent that, the Dividends for the corresponding Dividend Period are declared (or deemed declared
for the purposes, and subject to the conditions of the Bank Guarantee or Holding Guarantee) on the securities owned by the Trust (together with the aforementioned
guarantees, the assets of the Trust). Dividends will be paid to the extent that the Trust has funds available for the payment of such Dividends from its assets.
EXISTING TIER-1 ISSUES FROM KBC BANK

Further Details on Capital Appendix 4

60
Common equity at end 2013 pro forma Fully loaded B31 based on Danish Compromise
Jan 2012 Dec 2012 1H 2013 2014-2020
B3 IMPACT AT NUMERATOR LEVEL (BN EUR)
IMPACT ON RWA (BN EUR)
Pro forma fully loaded B3 common equity ratio of approx. 12.5% at end 2013 based on Danish Compromise (DC)
Announced intention to maintain a fully loaded common equity ratio of minimum 10% as of 1 January 2013
B3 CET1 at end 2013
11.2
Other
-0.3
Penalty on reimbursed
principal YES
-0.2
Reimbursement of 0.33bn EUR principal YES
-0.3
Elimination of filter for AFS revaluation
reserves
0.3
Shareholders’ loans
-0.2
DTAs
-0.6
Deconsolidation of KBC
Insurance
0.4
CT1 at end 2013 (B2.5)
12.2
2013 (B3,DC)
89.6
Impact KBC Bank Deutschland and ADB
-1.8
RWA equivalent for KBC Insurance (DC3)
11.1
Elimination RWA equivalent for KBC Insurance (BBM)2
-12.1
B3 impact
1.9
2013 (B2.5,BBM)
90.5
1. With remaining State aid included in CET1 as agreed with local regulator 2. RWA equivalent for KBC Insurance based on BBM: required solvency capital divided by 8% 3. RWA equivalent for KBC Insurance based on DC: book value of KBCI multiplied by 370%

61
Jan 2012 Dec 2012 1H 2013 2014-2020
2013 (B3,DC)
89.6
Impact KBC Bank Deutschland and ADB
-1.8
RWA equivalent for KBC Insurance (DC3)
11.1
Elimination RWA equivalent for KBC Insurance (BBM2)
-12.1
B3 impact
1.9
2013 (B2.5,BBM)
90.5
B3 IMPACT AT NUMERATOR LEVEL (BN EUR)
IMPACT ON RWA (BN EUR)
Phased B3 common equity ratio of approx. 12.9% at end 2013 based on Danish Compromise (DC)
B3 CET1 at end 2013 (DC)
11.6
Other
-0.3
Penalty on reimbursed
principal YES
-0.2
Reimbursement of 0.33bn EUR principal YES
-0.3
Shareholders’ loans
0.2
Deconsolidation KBC Insurance
0.4
CT1 at end 2013 (B2.5)
12.2
1. With remaining State aid included in CET1 as agreed with local regulator 2. RWA equivalent for KBC Insurance based on BBM: required solvency capital divided by 8% 3. RWA equivalent for KBC Insurance based on DC: book value of KBCI multiplied by 370%
Common equity at end 2013 pro forma Phased B31 based on Danish Compromise

62
The value of Additional Tier 1 and Tier 2 under CRD IV
KBC intends to fill its 1.5% Tier 1 and 2.0% Tier 2 bucket with AT1 and Tier 2 instruments respectively, in order to maximise the quantum of CET1 available
This helps mitigate the risk of mandatory restrictions on discretionary distributions as
• MDA restrictions would currently apply if KBC falls below a 7.0% CET1 ratio
• This translates to a minimum CET1 of 4.5% and a capital conservation buffer of 2.5%, with the capital conservation buffer requirement phased-in over the CRD IV transition period
• KBC’s current capital target of 10% fully loaded CET1 implies a 3.0% buffer above the combined buffer requirement
1.5% AT1 and 2.0% Tier 2 allows KBC to meet the 10.5% total capital requirements with less CET1 therefore enabling KBC to demonstrate an ample buffers vs. capital requirements
CET1 (%) 10.0% 10.5%
Buffer (Over and Above CBR)
3.0% 0.0%
2.7bn EUR No Buffer
Optimised Capital Structurewith 1.5% AT1
and 2.0% Tier 2
Capital Structure with8.0% CET1 &
No AT1 or Tier 2
4.5% CET1
2.5% CBR held
in CET1
2.5% equity buffer
requirement
Minimum 8.0%
Discretionary distributions restricted if CBR< 2.5% MDA
60% 40% 20%
0%
Restrictions on distributions are
scaled as the Combined Buffer
Requirement ("CBR") falls below 2.5%
Currently, the 2.5% Capital Conservation
Buffer is the only buffer relevant
for KBC
4.5% CET1
1.5% AT1
2.0% Tier 2
2.5% of CBR held in CET1
3.0% Internal buffer
7.0% 6.375%
5.75% 5.125%
4.5%
CET1 Ratio Min. 10.0% CET1 Target
1.5% CET1
2.0% CET1

63
AT1 amortisation and the implied cost of capital
2 101 1 896
1 691 1 486
1 281 1 076
871 615
410 205
205 410
615 820
1 025 1 230
1 486 1 691
1 896 2 101
0%
10%
20%
30%
40%
50%
60%
70%
80%
90%
100%
Basel II 2013 2014 2015 2016 2017 2018 2019 2020 2021 2022Phased out Grandfathered
Grandfathered as a % of
RWA (31/12/2013) 2.07% 1.86% 1.64% 1.41% 2.24% 1.19% 0.96% 0.68% 0.45% 0.23% 0.00%
8.2% 9.2% 10.5% 12.3% 14.8% 18.4% 26.3% 39.7%
12.0% 13.5% 15.4% 18.1% 21.7% 27.1% 38.7% 58.4%
79.7%
117.2%
Coupon per unit capital (before minority interest adjustments)
Coupon per unit capital (after minority interest adjustments1)
1. Assumes minority interest haircut of 32%

64
KBC in context (1): Best-in-class capitalisation and earnings capacity
FULLY LOADED BASEL 3 CET 1 RATIO BASEL 3 T1 LEVERAGE RATIO3
2014E NET INCOME / B3 RWA 2014E ROE (IBES)4
Note: Data as of YE2013 unless otherwise stated 1. Figures include the effects of the accelerated repayment of 0.33bn EUR of State aid to the Flemish Regional Government (+50% penalty) and the impact of the signed agreements to divest KBC Bank Deutschland and Antwerp Diamond Bank, and includes the remaining State Aid of 2bn EUR 2. B3 RWA estimated as of Q3 2013 3. All fully loaded, CASA as under “CRR” 4. IBES estimates as of 26-Feb-2014
5.6%
3.8% 3.5% 3.3% 3.1%
4.4%
BBVA KBC Bank CA Group SociétéGénérale
Danske Barclays
12.8%11.2%
10.0% 9.8% 9.3%
12.5%
Danske KBC¹ CA Group SociétéGénérale
BBVA Barclays
1.3%1.1% 1.0% 1.0% 0.9%
1.9%
KBC Danske Barclays BBVA² SociétéGénérale
CASA
13.0%
7.9% 7.9% 7.7% 7.6% 7.3% 6.8%
KBC Barclays Santander Danske BBVA SociétéGénérale
CASA

65
KBC in context (2): Excellent liquidity, revenue stability and underlying asset quality
Note: Data as of YE2013 unless otherwise stated 1. Information not available for BBVA, CA Group and Santander.
NPL RATIOS
LIQUIDITY COVERAGE RATIO1
NPL COVERAGE
REVENUE MIX
Net interest income Net fee and commission income
Other income
127%
102% >100%
131%
KBC Danske Barclays Société Générale
42 %68 % 56 % 69 % 55 % 65 %
44 %
31 %
21 %24 %
29 %20 %
25 %29 %
27%11%
21%3%
25% 10%27%
Barclays BBVA Danske CA Group KBC Santander SociétéGénérale
0.8%
2.8%3.9%
5.6% 5.8% 6.0%6.8%
Danske Barclays CA Group Santander KBC SociétéGénérale
BBVA
3.0% (Excl.
Ireland)
72%62% 60% 58% 58% 55%
72%
KBC BBVA Santander Barclays Danske SociétéGénérale
CA Group