institutional investor study report of the securities'...
TRANSCRIPT
-92d Congress, 1st Session House Document -No. 9?-64, Part 2
INSTITUTIONAL INVESTOR STUDY REPORT
OF THE
SECURITIES' AND EXCHANGE COMMISSION
VOLUME 2
CONSISTING OF
INTRODUCTIO~ TO PART TWO OF THE STUDY: INSTITUTIONS AS INVESTMENT MANAGERS, AND THE FOLLOWING CHAPTERS:
CHAPTER IV.-INVESTMENT ADVISORY COMPLEXES
CHAPTER V.-BANK TRUST DEPARTMENTS
CHAPTER VI.-INSURANCE COMPANIES
OF THE INSTITUTIONAL INVESTOR STUDY REPORT, BEING A STUDY AND INVESTIGATION OF THE PURCHASE, SALE AND HOLDING OF SECURITIES BY INSTITUTIONAL INVESTORS OF ALL TYPES, PURSUANT TO SECTION 19(e) OF THE SECURITIES EXCHANGE ACT OF .1934 (PUBLIC
LAW 90-438, 91-410)
MARCH 10, 1971.-Referred ~ the Committee on Interstate and _ Foreign Commerce and ordered to be printed -


92d Congress, 1st Session - - - - - House Document No. 92-64, Part 2
INSTITUTIONAL INVESTOR STUDY REPORT OF THE
SECURITIES AND EXCHANGE COMMISSION
VOLUME 2
CONSISTING OF 0
INTRODUCTION TO PART TWO OF THE STUDY: INSTITUTIONS AS INVESTMENT MANAGERS, AND THE FOLLOWING CHAPTERS:
CHAPTER IV.-INVESTMENT ADVISORY COMPLEXES
CHAPTER V.-BANK TRUST DEPARTMENTS
CHAPTER VI.-INSURANCE COMPANIES
OF THE INSTITUTIONAL INVESTOR STUDY REPORT, BEING A STUDY AND INVESTIGATION OF THE PURCHASE, SALE AND HOLDING OF SECURITIES BY INSTITUTIONAL INVESTORS OF ALL TYPES, PURSUANT TO SECTION 19(e) OF THE SECURITIES EXCHANGE ACT OF 1934 (PUBLIC
LAW 90-438, 91-410)
MARCH 10, 1971.-Referred to the Committee on Interstate and Foreign Commerce and ordered to be printed
63-9400
U.S. GOVERNMENT PRINTING OFFICE
WASHINGTON : 1971
For sale by the Superintendent of Documents. U.S. Government Printing Office Washington. D.C. 20402 - Price $3.25


SUMMARY TABLE OF CONTENTS OF VOLUME 2
Introduction to Part Two of the Study: Institutions as Investment Page ~anagers_______________________________________________________ 125
Chapter IV. Investment Advisory Complexes___ ___ _ __ _ ___ _ __ _ ___ ___ _ __ _ __ _ __ _ 139
A. The Investment Advisory Industry_______________________ 139 E. Characteristics of Advisory Accounts______________________ 164 C. Competition for New Accounts_ ___ __ _ __ _ __ _ _ _ __ ___ __ _ _ __ _ 193 D. Advisory Fees____ _____ __ ___ __ __ _ __ __ _ ___ __ _ _ __ _ _ _ _ __ _ __ 207 E. Economic Structure of the Advisory Industry _ _ _ _ _ _ _ _ _ _ _ _ _ _ 225 F. Performance Fees_ _ _ _ _ _ _ _ _ _ _ _ _ _ _ _ _ _ _ _ _ _ _ _ _ _ _ _ _ _ _ _ _ _ _ _ _ _ _ 254 G. Organization of Advisory Firms for Investment Decision
~aking_____________________________________________ 266 H. ~anagement of Speculative Funds________________________ 283 I. Size, Growth and Performance of Registered Investment
Companies___________________________________________ 325 J. Preferential Treatment in the ~anagement of Different Types
of Accounts__________________________________________ 348 K. Summary and Conclusions_ _ _ _ _ _ _ _ _ _ _ _ _ _ _ _ _ _ _ _ _ _ _ _ _ _ _ _ _ _ _ 360
V. Bank Trust Departments_______________________________________ 413 A. Introduction_ _ _ _ _ _ _ _ ____ ____ __ __ ___ _ __ _ __ _ __ _ _ _ _ __ __ _ _ _ 413 B. Data Sources____ _ __ _ __ _ __ _ _ _ _ _ _ _ _ _ __ _ __ _ __ __ _ ___ __ _ _ _ __ 415
• C. Types of Accounts and Assets Administered________________ 420 D. Legal, Regulatory and Tax Environment__________________ 439 E. Competition_ _ _ _ _ _ _ _ _ _ _ _ _ _ _ _ _ _ _ _ _ _ _ _ _ _ _ _ _ _ _ _ _ _ _ _ _ _ _ _ _ _ _ 454 F. Operational Factors_ ___ _ __ __ _ _ _ _ __ ___ _ _ ___ _ __ __ ___ ___ _ _ _ 458 G. The Association With Commercial Banking________________ 468 H. Compensation____ __ __ ___ __ __ _ __ ___ __ _ _ _ _ __ __ _ _ __ __ ___ _ _ 476 I. Summary and Conclusions________________________________ 487
VI. Insurance Companies __________________________________________ _
The Life Insurance Industry
A. Coverage and Focus_____________________________________ 505 B. Structure of the Industry _ _ _ _ _ _ _ _ _ _ _ _ _ _ _ _ _ _ _ _ _ _ _ _ _ _ _ _ _ _ _ _ 508 C. Financial Integration and the Development of Equity Products_ 511 D. Life Insurance Companies as Funding Agents for Pension-
Benefit Plans: The Group Annuity Business_ _ _ _ _ _ _ _ _ _ _ _ _ 541 E. Equity Separate Accounts: Their Development, Growth,
Characteristics and Management Fees__ _ _ _ _ _ _ _ _ _ _ _ _ _ _ _ _ _ 642 F. Portfolio Management: Investment Organization, Techniques,
Policies and Results_ _ _ _ _ _ _ _ _ _ _ _ _ _ _ _ _ _ _ _ _ _ _ _ _ _ _ _ _ _ _ _ _ _ _ 685 G. Summary and Conclusions_______________________________ 771
The Property-Liability Insurance Industry H. Introduction_ _ _ _ _ _ _ _ _ _ _ _ _ _ _ _ _ _ _ _ _ _ _ _ _ _ _ _ _ _ _ _ _ _ _ _ _ _ _ _ _ _ _ 783 I. Structure of the Industry_________________________________ 786 J. Behavior as Portfolio Managers___________________________ 810 K. Summary and Conclusions_______________________________ 863
(m)


INTRODUCTION TO PART Two: INSTITUTIONS AS INVESTlIfENT MANAGERS
A. INSTITUTIONAL MANAGERS AND MANAGED PORTFOLIOS
Part One (Chapters II and III; NBER Report) has examined longterm trends in the structure of national balance sheets and flows of funds through financial institutions. Broad changes in the composition of the financial asset holdings of major financialmstitutions and portfolios have been traced. Part Two (chapters ,IV through IX) examines in greater detail the recent organization and behavior of those institutional managers active in the equity securities market.
In performing this analysis the Study has attempted to maintain a clear distinction between the institutional managers, on the one hand, and, on the other, the institutional portfolios being managed. The principal institutional managers are studied. They are investment advisory firms (chapter IV), bank trust departments (chapter V) and insurance companies (chapter VI). Certain substantial portfolios, including some pension and profit-sharing plan assets and educational and foundation endowments, are not externally managed but rather are administered by personnel of the funding employer, or officers or affiliated persons of the educational institutions and foundations. These "self-administered" portfolios are examined in chapter YIII and compared to similar portfolios managed by bank trust depart-ments and investment advisory firms. .
Among the types of managed portfolios considered in Part Two are various commingled funds, such as mutual funds and hedge funds (chapter IV), offshore funds (chapter VII), common trust funds (chapter V), pooled employee-benefit funds (chapter V) and life insurance and property and liability insurance company investment accounts (chapter VI). Also examined are various management or advisory accounts (chapters IV and V), personal trusts (chapter V), endowments and foundations (chapter VIII), and retirement plans (chapter VIII). The distribution and characteristics of common stocks held in portfolios of institutions are considered in ohapter IX.
In general, the Study selected institutional and portfolio groups for analysis because they were: (1) large holders of equity securities, (2) active traders of equity securities, or (3) had displayed the potential interest and ability to become significant factors in equity security markets. Thus, bank trust departments and investment advisory firms qualified because they constitute the largest classes of institutional asset managers investing significantly in equity securities. Among the portfolios studied, corporate pension benefit plans and investment companies are the largest investors in common stock. Offshore funds (chapter VII) and hedge funds (chapter IV) receive attention because of their propensity to trade equity securities actively. Life insurance companies and state and local government retirement system's qualify as institutions and portfolios respectively because of the mag-
(125)

126
nitude of the assets under their coptrol and their developing interest in equity security investments.1
An approximate measure of the assets and common stock which came under the Study's purview is provided in Tables 1 and 2. These tables attempt to classify assets (and common stock) under management by both type of manager and type of portfolio. This is a difficult t.ask because of the process of financIal integration that has developed increasingly during recent years-that is, institutions moving into related activities have blurred conventional institutional category distinctions. Thus, for example, where insurance companies have acquired control of investment advisory complexes it is not obvious whether the mutual funds and other portfolios managed by the advisory complex should be regarded as managed by the insurance or by the mvestment advisory industry.2 Identification of portfolio managers also is made difficult by the use of multiple advisers by some portfolios and the wide variance in investment responsibility and discretion granted by beneficial owners or controlling persons to some types of investment managers. These practices make some double countmg of assets un-avoidable. .
In order to ffovide a measure of the problem, TrubleR 1 and 2 show an estimat.e 0 the total assets for which investment advisory firms PJ'Ovide investment advice or management and in parentheses the portion of those assets over which investment advisers have sole invc~ment discretion. The amount of assets managed exclusively by investment advisers in each category is somewhere between the two numbers shown. A somewhat similar problem exists in bank-managed accounts; a description of the extent of banks' investment discretion is provided in chapter V for a sample of accounts from the 50 largest bank trust departments. The amounts of insurance company assets which also are counted elsewhere is believed to be relatively inconsequentia1.3
Assets shown in Table 1 are estimated at market value, except for the greater portion of the assets of insurance companies. Most assets managed by insurance companies, other than common stock and assets of registered investment companies, are valued at amortized cost. All common stock estimates in Table 2 are at market value.
Tables 1 and 2 nece..."8arily make some ad hoc allocations of assets between common stock and debt securities. For example, a portion of insurer-managed assets and common stocks is allocated to the interests of employee-benefit plans. This is done by allocating insurers' general account assets to employee-benefit plans in the ratio of reserves for these plans to total insurance reserves. All such allocations are detailed in footnotes to Tables 1 and 2.
Of the $714 billion total assets in 1969 shown in Table 1, ·about 44 percent are invested in common stocks. This proportion is reduced by
1 Among managers and portfOlios excluded from the Study's coverage are muttlal savings banks, which hav!' modest common stock Investments. law firms. which manage or advise a substantial, but unknown, amount of funds. religious organizations and brokerage accounts wher!' (even when transactions are discretionary or solicited) no direct compensation for Invf!stment advice Is as~eR~ed.
2 In this case the tables allocate these portfolios to the Investment advisory Industry and only assets of Invpstment companies which represent separate accounts registered under the Investment Compan,y Act of 1940 and mutual funds created by Insurers are counted as Insurer manngeil.
3 Chapter IV provides el<timates of the amount of Insurer assets receiving investment advice from investment advisory firms.

127
the large fraction of insurance company general account assets held in debt securities. Excluding insurer assets, about 62 percent of the remaining assets managed by institutional types covered by the Study are in vested in common stock.
B. THE INSTITUTIONS DURING THE 1960'S: THEIR ACTIVITIES AND THE
ISSUES
In conducting its analyses of institutional organization and behavior the Study was particularly consc;ous of several frequently mentioned trends in institutional activity. These include the movement of some institutions and portfolios into equity securities, the increased emphasis on investment performance accompanied by a greater willingness to accept investment risks, and the process of financial integration (or di versification) .
The movement toward equities was especially prominent, for example, in life insurance company portfolios, primarily through the development of equity separate accounts as funding media for pensionbenefit plans, and in state and local government retirement system portfolios. Other types of portfolios which previously had held significant amounts of equity securities increased the proportion of their common stockholdings. Part Two of the Study describes these movements and some of the pressures and incentives responsible for the increased interest in equities.
Investment performance consciousness developed at a number of levels. In some cases it meant that beneficial owners or other controlling interests came to recognize that professional investment management offered a possibility of increasing investment return from what previously had been essentially unmanaged portfolios. In some cases, performance consciousness meant a new concern with total investment return, including realized and unrealized capital gains (losses) rather than a focus upon current income, and investment policies were changed accordingly. Financial pressnre'l on some affected part;es, such as universities and other nonprofit institutions and employers required to fund retirement benefits promised in collective-bargaining agreements, lea to their exercising closer scrutiny of investment managers, shifting portfolios to other investment managers and, in some cases, splitting assets among several investment managers.
In order to appraise the investment rpsult.s produced by these managers, an interest in better measures of performance evolved, and much has been accomplished technically in developing such measures. 'Whereas some portfolio owners and managers have simply attempted to increase investment return by increasing risk, others have been cons~;ous of risk-return relationship and some portfolio managers are being evaluated on the basis of return adjusted for risk. Finally, 'performance consciousness in some cases has been identified with very aotive short-term trading, leveraging and speculation in equity issues of thinly capitalized enterprises.
At each of these levels of performa.nce consciousness it appeared that an increased interest in investment return was accompanied by increases in the turnover of {'('{uity security portfolios. These turnover rate increases were significant for"many types of portfolios. In

128
Part Two, turnover rates during 1965 to 1969 are computed and analyzed for a wide variety of institutional manager and portfolio classes. For limited types of accounts it is possible to investigate the relationship between realized investment performance, volatility and turnover rates.
The process of financial integration began to have major effects upon the structure and behavior of financial institutions during the 1960's. Some institutions, such as commercial banks, have integrated numerous financial services for many years. Even banks, however, have desired to add additional services, such as commingled agency accounts, and through holding companies have established affiliations with investment advisory firms and insurance companies. Insurance companies, in addition to placing greater emphasis upon the investment management of assets generated by insurance operations, have affiliated with mutual funds and investment advisory firms. Some brokers have expanded into the investment advisory and mutual fund businesses. Part Two attempts to deal with some of the implications of these developments.
One of the effects of financial integration is that it tends to create or increase potential conflicts of interest and problems of equitable treatment when many customers' investment and other financial needs are being serviced. Potential conflict situations are created when institutions, through their asset management activities (1) are simultaneously creditors to and shareholders in a corporation, (2) are brokers and investment advisers, (3) accept deposits and manage portfolis, or (4) offer insurance or other financial services and provide investment management.
The chapters include material bearing on these trends and issues. They explore the nature and intensity of competition among investment managers, economies of size realized at the manager or account level and the extent to which realized economies are passed on to customers, the influence of other financial services offered by institutions upon investment selections, trading decisions and the viability of competion among investment managers, and managerial policies and practices developed to deal with conflict of interest questions.
Although data and information utilized in Part Two were derived from many sources, the primary source in each chanter was information obtained through the Study'S questionnaires. These were of three basic ,types: (1) survey questionnaires, (2) institutional "intrinsics" questionnaires,and (3) portfolio or account questionnaires. Survey questionnaires were utilized to establish some knowledge of the universe of institutions or portfolios where no satisfactory information existed. Thus, one such questionnaire provided something approaching a census of investment advisory firms. Another provided a basis for sampling bank trust department accounts, and other survey questionnaires provided a census of large pension-benefit plans, state and local government retirement systems and educat;onal endowments.
Institutional intrinsics questionnaires were sent to bank trust departments, investment adVIsory firms, insurance companies and some self-administered portfoli'Os. These questionnaires elicited informat.ion on the inve"tment organization and structure of the mana<rers, services offered, affiliations and other data intrinsic to the institutional class.

129
Account questionnaires produced data on individual accounts, including detailed asset composition, holdings of individual equity securities, purchases and sales of common stocks, management fees charged and other characteristics of the accounts. Some of these account samples were drawn from the groups of managers-that is, from banks, investment advisory firms and insurance companies---and some from their clients, the portfolio's beneficial owners-that is, from pension plans, universities, foundations, etc. The structure of these questionnaires assured a substantial degree of uniformity in the treatment of these data in each of the various c.hapters.
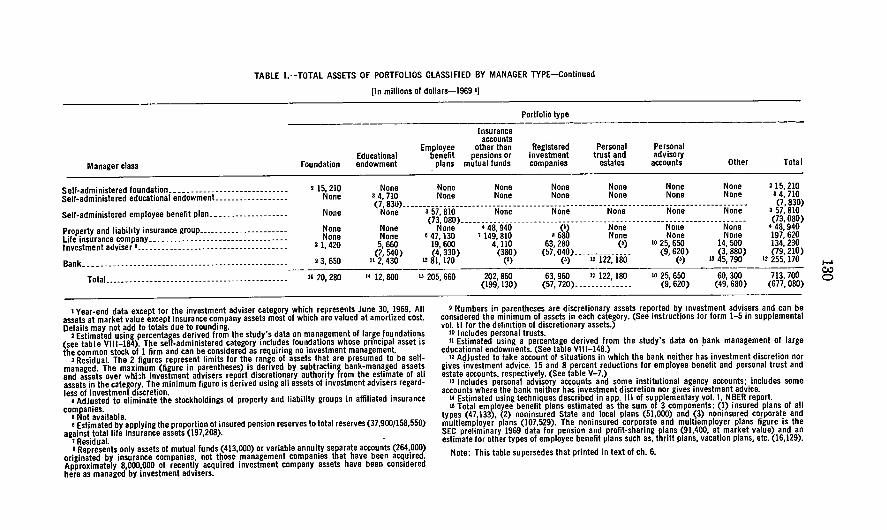
TABLE I.-TOTAL ASSETS OF PORTFOLIOS CLASSIFIED BY MANAGER TYPE-Continued
[In millions of dollars-1969 I[
PortfoliO type
Manager class Foundation Educational endowment
Employee benefit
plans
Insurance accounts
other than pensions or
mutual funds
Registered investment companies
Personal trust and
estates
Personal advisory
accounts other Total
2 15,210 None None None None None None None • 15,210 None 3 4,710 None None None None None None 3 4, 710
Self-administered foundation ____________________________ _ Self-administered educational endowment. ________________ _
(7, S30)__ _ __ ___ _ _ _ _ ___ __ _ _ _ _ _ _ _ _ _ _ __ _ _ _ _ _ _ _ _ _ _ __ _ _ __ __ __ _ _ _ _ _ _ _ _ _ _ ____ __ _ _ _ _ _ _ _ _ _ _ _ _ _ _ _ _ _ _ _ (7, S30)
None None 3 57, SIO None None None None None 3 57, SIO Self-administered employee benefit plan __________________ _ (73, OSO) _________ . ___ . __ .. _ _ _ _ _ __ __ _ _ __ _ _ _ _ __ _ _ _ _ ___ _ _ _ ____ _ _ _ _ ____ _ _ __ __ _ _ ___ (73,OSO)
None None None • 4S, 940 (') None None None • 48,940 None None , 47, 130 7 149, SIO 8 680 None None None 197,620
Property and liability insurance group _____________ . _______ _
~~f:e!~~:~r~~~~~t:.~~ ~ ~:::::::::::::::::::::::::::::::: • 1,420 5, 660 19, 600 4, 110 63, 2S0 (.) 10 25, 650 14, 500 134, 230 (2,540) (4,330) (380) (57,040)______________ (9,620) (3, SSO) (79,210)
Bank ________ . __________________ . __ . ________________ .__ '3,650 112,430 12 SI, 120 (') (') 12 122, ISO (') 13 45,790 .. 255, 170
TotaL ____________ . ________________ ._____________ "20,280 .. 12,SOO "205,660 202,860 63,960 "122,180 10 25,650 60,300 713,700 (199,130) (57,720)._____________ (9,620) (49,6S0) (677,080)
I Year-end data except for the investment adviser category which represents June 30, 1969. All assets at market value except insurance company assets most of which are valued at amortized cost Details may not add to totals due to rounding.
• Estimated using percentages derived from the study's data on management of large foundations (see table VIII-IS4). The self-administered category includes foundations whose prinCipal asset is the common stock of I firm and can be considered as requiring no investment management
3 Residual. The 2 figures represent limits for the range of assets that are presumed to be selfmanaged. The maximum (figure in parentheses) is derived by subtracting bank-managed assets and assets over whi:h investment advisers report discretionary authority from the estimate of all assets in the category. The minimum figure is derived using all assets of investment advisers regardless of investment discretion.
• Adjusted to eliminate the stockholdings of property and liability groups in affiliated insurance companies.
• Not available. • Estimated by applying the proportion of insured pension reserves to total reserves (37,900/15S,550)
against total life insurance assets (197,208). 7 Residual. . I Represents only assets of mutual funds (413,000) or variable annuity separate accounts (264,000)
originated by insurance companies, not those management companies that have been acquired. Approximately S,OOO,OOO of recently acquired investment company assets have been considered here as managed by investment adVisers.
• Numbers in parentheses are discretionary assets reported by Investment advisers and can be considered the minimum of assets in each category. (See instructions for form 1-5 in supplemental vol. II for the definition of discretionary assets.)
10 I ncludes personal trusts. II Estimated using a percentage derived from the study's data on bank management of large
educational endowments. (See table VIII-14S.) . " Adjusted to take account of situations in which the bank neither has investment discretion nor
gives investment advice. 15 and S percent reductions for employee benefit and personal trust and estate accounts, respectively. (See table V-7.)
13 Includes personal advisory accounts and some institutional agency accounts; includes some accounts where the bank neither has investment discretion nOr gives investment advice.
.. Estimated using techniques described in app. III of supplementary vol. I. N BER report. 13 Total employee benefit plans estimated as the sum of 3 components: (I) insured plans of all
types (47,\33), (2) noninsured State and local plans (51,000) and (3) noninsured corporate and multiemployer plans (107,529). The noninsured corporate and multiemployer plans figure is the SEC preliminary 1969 data for pension and profit-sharing plans (91,400, at market value) and an estimate for other types of employee benefit plans such as, thrift plans, vacation plans, etc. (16,129).
Note: This table supersedes that printed in text of ch. 6.
..... ~ o

TABLE 2.--COMMON STOCK Of PORTFOLIOS CLASSIFIED BY MANAGER TYPE
[In millions of dollars--1969 ')
Portfolio type
Insurance accounts
Employee other than Registered Personal Personal Educational benefit pensions or investment trust and advisory
Manager class Foundation endowment plans mutual funds companies estates accounts Other Total
Self-administered foundation _____________________________ 2 11,620 None None None None None None None 2 11,620 Self-administered educational endowmenl. _________________ None 32,570 None None None None None None 32,570
Self-administered employee benefit plan ___________________ None (4,550)
None • 13,390 None None None None None (4, 550~
3 13,39 (20,730)
Property and liability insurance group ______________________ (20,730)
None None None • 11,720 (.) None None None • 11,720 Life insurance company __________________________________ None None 04,390 75,720 8530 None None None 10,640 Investment adviser , _____________________________________ • 1,070 3,610 9,940 1,270 51,610 (.) 10 20, 200 7,760 95,470
(1,620) (200) (47,960) (7,650) Bank __________________________________________________ 22,600 111,540 ~2, 600)
12 0,370 None (.) 12 81,360 (.) ~2, 470)
13 9,260 (6V80~
1216 ,14 TotaL ____________________________________________
It 15,290 It 7, 720
I Yearend data except for the investment adviser category which represents J.une 30, 1969. All common stock is reported at market value Details may not add to totals due to rounding.
2 Estimated using percentages derived from the Study's data on management of the common stock of large foundations (see Table VII 1-189). The self-administered category includes foundations whose principal holding is the common stock of one firm and can be considered as requiring no investment management.
3 Residual. The 2 figures represent limits for the range of common stock assets that are presumed to be self-managed. The maximum (figure in parentheses) is derived by subtracting bank-managed common stock and common stock over which investment advisers report discretionary authority from the estimate of all common stock in the category. The minimum figure is derived using all common stock of all investment advisers regardless of investment discretion.
• Adjusted to eliminate the common stockholdings of property and liability insurance groups in affiliated insurance companies.
• Not available. o Estimated using 2,700.000 of common stock reported in separate accounts (primarily employee
benefit plans) plus 1,690.000 estimated as general account common stock supporting general account pension plan assets. The general account common stock associated with pension plans is derived by applying the proportion of general account pension reserves to total general account reserves (34,-400/155,050) to general account common stock (7,618).
7 Residual. , Estimated on the assumption that the common stock to total assets rallo of registered investment
companies originating with Investment advisers (0.78) holds for registered investment companies originated by life insurance companies. ApprOXimately 6,000,000 of stock held in recently acquired management companies have been considered here as managed by investment advisers.
, Numbers in parentheses are common stockholdings over which investment advisers report they have legal discretion. The instructions for Form 1-5 in Supplemental Vol. II defines legal discretion.
10 I ncludes personal trusts. 11 Estimated ~sing a percentage derived from the Study's data on management of the common
stock of large educational endowments. (See Table VIII-153.)
I' 78,100 18,710 (17,650)
52,140 (48,480)
81,360 20,200 37,020 310,550 (7,650) (31,730) (287,980)
12 Adjusted to take account of Situations which the bank neither has investment discretion nor gives investment advice; 15 percent and 8 percent reductions for empJoyee benefit and personal trust and estate accounts respectively. (See table V-7.)
13 Includes personal advisory accounts and some institutional agency accounts; includes some accounts where the bank neither has investment discretion nor gives investment advice.
I. Estimated using techniques described in app. III of Supplementary Vol. I: N BER report. " Total employee benefit plans estimated as the sum of 3 corrponents: (I) insured plans of all
types (4,390), (2) noninsured State and local plans (5.827) and (3) noninsured private plans (67,882). The noninsured private plans figure is the SEC preliminary 1969 data for corporate and multiemployee pension and profit sharing plans (57,670 at market value) and an estimate for other types of employee benefit plans (10,212) .
Sources for Tables 1 and 2: 1. Foundallons: Supplemental Vol. I: NBER Report app. III. Total assets data were extrapolated
from Table AlII-I, 5 and the common stock was extrapolated from Table AI 11-3, 8. 2. Educational endowments: Supplemental Vol. I: NBER Report, app. III. Total asset and common
stock data were extrapolated from Table AIII-5, 13. 3. Employee benefit plans: Insured plans, Institute of Life Insurance, Life Insurance Fact Book,
1970, 38; noninsured State and local plans, Board of Governors of the Federal Reserve System, et al .. "Financial Assets and liabilities as of Dec. 31. 1969," "Flow of Funds," statistical release, May 15, 1970, 2; noninsured corporate plans, Securilles and Exchange Commission, Office of Policy Research.
4. Property and liability insurance groups: A. M. Best Co., Best's Aggregates and Averages-Property and Liability 1970, I, 52, 152.
5. Life insurance companies: Institute of Life :nsurance, Lila Insurance Fact Book 1970, 70 84,85. 6. Investment advisers: Institutional Investor Study, ch. IV, Table IV-I. Securities and Exchange
Commission, 35th annual report of the Securities and Exchange Commission, 125. 7. Banks: Board of Governors of the Federal Reserve System, et aI., Trust Assets of Insured Com
mercial Banks 1969, Table I, 5.
Note: This table supercedes that printed in text of ch. 6.
~ ~ ~


CHAPTER IV
INVESTMENT ADVISORY COMPLEXES
DETAILED TABLE OF CONTENTS
A. THE INVESTMENT ADVISORY INDUSTRY Paee
1. Overview of the Industry ______________________ - - _ _ _ _ _ _ _ _ _ _ _ _ _ _ _ _ 139 2. Concentration of Advisory Assets_________________________________ 143 3. Regulatory Pattern _ _ _ _ _ _ _ _ _ _ _ _ _ _ _ _ _ _ _ _ _ _ _ _ _ _ _ _ _ _ _ _ _ _ _ _ _ _ _ _ _ _ _ _ _ 144
a. Registered investment advisers_____________________________ 144 b. Investment advisers acting exclusively for investment com-
panies_________________________________________________ 146 c. Federal income tax considerations__________________________ 147
4. Organization Forms, Age and Affiliations of Advisory Firms_ _ _ _ _ _ _ _ _ _ 148 a. Organizational form_ _ _ _ _ _ _ _ _ _ _ _ _ _ _ _ _ _ _ _ _ _ _ _ _ _ _ _ _ _ _ _ _ _ _ _ _ _ 148 b. Age distribution of advisory firms__________________________ 148 c. Affiliations of advisory firms_ _ _ _ _ _ _ _ _ _ _ _ _ _ _ _ _ _ _ _ _ _ _ _ _ _ _ _ _ _ _ 148 d. Sources of advisory complex revenue________________________ 149
B. CHARACTERISTICS OF ADVISORY ACCOUNTS
1. Introduction___________________________________________________ 164 2. Data Organization_ _ _ _ _ _ __ _ _ _ _ _ _ _ _ _ _ _ _ _ _ _ _ __ __ _ _ _ __ ___ _ _ _ _ _ __ _ _ _ 164 3. Age of Advisory Accounts _____________________________ ~_~________ 165 4. Size of Advisory Accounts________________________________________ 165 5. Asset Composition of Advisory Accounts___________________________ 166 6. Investment Objective____________________________________________ 166 7. Valuation Frequency____________________________________________ 167 8. Investment Discretion__ _ __ _ _ _ __ _ __ _ _ _ _ _ _ _ _ _ __ _ _ _ _ _ _ __ _ _ _ _ __ _ _ __ _ 167 9. Federal Income Tax Liability for Individual and Personal Trust
Accounts_____________________________________________________ 168 10. Number of Participating Accounts in Pooled (Jointly Managed)
Accounts____________________________________________________ 168 11. Placing of Account Portfolio Orders_ _ _ _ _ _ _ _ _ _ _ _ _ _ _ _ _ _ _ _ _ _ _ _ _ _ _ _ _ _ 168 12. Designation of Portfolio Brokerage_ _ _ _ _ _ _ _ _ _ _ _ _ _ _ _ _ _ _ _ _ _ _ _ _ _ _ _ _ _ _ 169 13. Common Stock Turnover Rate__________________________________ 170 14. Factors Affecting Advisory Account Turnover Rates_ _ _ _ _ _ _ _ _ _ _ _ _ _ _ 170
a. Age of accounL _ _ _ _ _ _ _ _ _ _ _ _ _ _ _ _ _ _ _ _ _ _ _ _ _ _ _ _ _ _ _ _ _ _ _ _ _ _ _ _ _ 171 b. Total account assets_____________________________________ 172 c. Investment objective_ _ _ _ _ _ _ _ _ _ _ _ _ _ _ _ _ _ _ _ _ _ _ _ _ __ _ _ __ _ _ _ _ _ 172 d. Investment authority _ _ _ _ _ _ _ _ _ _ _ _ _ _ _ _ _ _ _ _ _ _ _ _ _ _ _ _ _ _ _ _ _ _ _ _ 172 e. Federal income tax liability __ _ _ _ _ _ _ _ _ _ _ _ _ _ _ _ _ _ _ _ _ _ _ _ _ _ _ _ _ _ 172 f. Broker-dealer affiliation__________________________________ 173 g. Trading status of the accounL____________________________ 173 h. Allocation of brokerage___________________________________ 173 i. Size of the advisory complex______________________________ 174 j. Mutual fund complex variable_ _ _ _ _ _ _ _ _ _ _ _ _ _ _ _ _ _ _ _ _ _ _ _ _ _ _ _ 174
C. COMPETITION FOR NEW ACCOUNTS
1. Introduction___________________________________________________ 193 2. New and Terminated Accounts_ _ _ _ _ _ _ _ _ _ _ _ _ _ _ _ _ _ _ _ _ _ _ _ _ _ _ _ _ _ _ _ _ _ _ 194 3. Origin of New Accounts_ _ _ _ _ _ _ _ _ _ _ _ _ _ _ _ _ _ _ _ _ _ _ _ _ _ _ _ _ _ _ _ _ _ _ _ _ _ _ _ _ 194 4. Destination of Terminated Accounts______________________________ 195 5. Minimum Asset and Fee Requirements for New Accounts____________ 195 6. Promotional Methods Used to Obtain New Accounts or Additional
Subscriptions for Existing Accounts_____________________________ 196 7. Importance of Referrals_________________________________________ 196
(133)

134
D. ADVISORY FEES
1. Introduction __________________________________________________ _ 2. Services Supported by the Advisory Fee __________________________ _ 3. Distribution of Advisory Fee Ratios ____________________ . _________ _ 4. Advisory Fee Bases ____________________________________________ _ 5. Relationship of Fee Ratio to Account Size ________________________ _ 6. Factors Affecting Advisory Fees _________________________________ _
a. The age of the accounL __________________________________ _ b. Valuation frequency _____________________________________ _ c. Total account assets _____________________________________ _ d. Account investment objective _____________________________ _ e. Investment discretionary authority ________________________ _ f. Federal income tax bracket of the clienL ___________________ _ g. Broker-dealer affiliation of the adviser ______________________ _ h. Trading status of the account _____________________________ _ i. Brokerage allocation _____________________________________ _ j. Size of the advisory complex ______________________________ _ k. Mutual fund complex factor ______________________________ _ I. Turnover of common stock portion of portfolio ______________ _
E. ECONOMIC STRUCTURI, OF THE ADVISORY INDUSTRY
Page
207 207 208 209 209 210 211 211 211 212 212 213 213 214 214 214 215 215
1. Introduction___________________________________________________ 225 2. Analysis of Operating Revenues_ _ _ _ _ _ _ _ _ _ _ _ _ _ _ _ _ _ _ _ _ _ _ _ _ _ _ _ _ _ _ _ _ _ 225 3. Analysis of Operating Expenses___________________________________ 226 4. Analysis of Advisory PersonneL _ _ _ _ _ _ _ _ _ _ _ _ _ _ _ _ _ _ _ _ _ _ _ _ _ _ _ _ _ _ _ _ _ _ 228 5. 'Analysis of Profitability Data_ _ _ _ _ _ _ _ _ _ _ _ _ _ _ _ _ _ _ _ _ _ _ _ _ _ _ _ _ _ _ _ _ _ _ 228 6. Summary______________________________________________________ 231
F. PERFORMANCE FEES
1. Introduction_ _ _ _ _ _ _ _ _ _ _ _ _ _ _ _ _ _ _ _ _ _ _ _ _ _ _ _ _ _ _ _ _ _ _ _ _ _ _ _ _ _ _ _ _ _ _ _ _ _ _ 254 2. Types of Performance Fees_______________________________________ 2.'i6 3. Legislative Background of Existing Regulatory Framework_ _ _ _ _ _ _ _ _ _ 259 4. Performance Standards and Incentive Fee Arrangements____ _ _ _ _ _ _ _ _ _ 262
a. Definition of the problem__________________________________ 263 , b. Some baRic concepts______________________________________ 263
c. Implications for performance measurement_ _ _ _ _ _ _ _ _ _ _ _ _ _ _ _ _ _ 264 d. Incentive fees_ _ _ _ _ _ _ _ _ _ _ _ _ _ _ _ _ _ _ _ _ _ _ _ _ _ _ _ _ _ _ _ _ _ _ _ _ _ _ _ _ _ _ _ 264
5. Considerations for the Administration of Incentive Fee Arrangements_ _ _ 265
G. ORGANIZATION OF ADVISORY FIRMS FOR INVESTMENT DECISION MAKING
1. Introduction _ _ _ _ _ _ _ _ _ _ _ _ _ _ _ _ _ _ _ _ _ _ _ _ _ _ _ _ _ _ _ _ _ _ _ _ _ _ _ _ _ _ _ _ _ _ _ _ _ _ _ 266 2. Concentration of Decision Making Authority _ _ _ _ _ _ _ _ _ _ _ _ _ _ _ _ _ _ _ _ _ _ _ 266 3. Numbers of Advisory PersonneL__________________________________ 268 4. Duties and Educational Backgrounds of Investment PersonneL_______ 268 5. Security Evaluation Procedures___ _ _ _ _ _ _ _ _ _ _ _ _ _ _ _ _ _ _ _ _ _ _ _ _ _ _ _ _ _ _ _ _ 269 6. Use of Computers for Administration and Decision Making Purposes_ _ _ 270
H. MANAGEMENT OF SPECULATIVE FUNDS
1. Introduction__________________________________________________ 283 2. The Funds Sampled_ _ _ _ _ _ _ _ _ _ _ _ _ _ _ _ _ _ _ _ _ _ _ _ _ _ _ _ _ _ _ _ _ _ _ _ _ _ _ _ _ _ _ _ 283 3. An Overview _ _ _ _ _ _ _ _ _ _ _ _ _ _ _ _ _ _ _ _ _ _ _ _ _ _ _ _ _ _ _ _ _ _ _ _ _ _ _ _ _ _ _ _ _ _ _ _ _ _ 284 4. Size__________________________________________________________ 287 5. Year of Registration or Formation_ _ _ _ _ _ _ _ _ _ _ _ _ _ _ _ _ _ _ _ _ _ _ _ _ _ _ _ _ _ _ 287 6. Growth of Fund Assets_ _ _ _ _ _ _ _ _ _ _ _ _ _ _ _ _ _ _ _ _ _ _ _ _ _ _ _ _ _ _ _ _ _ _ _ _ _ _ _ _ 288 7. Registered Speculative Fund Shareholder Accounts and Minimum
Purchase Requiremen ts_ _ _ _ _ _ _ _ _ _ _ _ _ _ _ _ _ _ _ _ _ _ _ _ _ _ _ _ _ _ _ _ _ _ _ _ _ _ _ 289 8. Hedge Fund Partners and Their Capital Contributions_ _ _ _ _ _ _ _ _ _ _ _ _ 290 9. Capital Inflow _ _ _ _ _ _ _ _ _ _ _ _ _ _ _ _ _ _ _ _ _ _ _ _ _ _ _ _ _ _ _ _ _ _ _ _ _ _ _ _ _ _ _ _ _ _ _ _ _ 291
10. Assets________________________________________________________ 292 11. Cash Position_________________________________________________ 293 12. Liabilities_ _ _ _ _ _ _ _ _ _ _ _ _ _ _ _ _ _ _ _ _ _ _ _ _ _ _ _ _ _ _ _ _ _ _ _ _ _ _ _ _ _ _ _ _ _ _ _ _ _ _ _ _ 294 13. Exchange Listings of Portfolio Securities_ _ _ _ _ _ _ _ _ _ _ _ _ _ _ _ _ _ _ _ _ _ _ _ _ _ 297 14. Common Stock Turnover and Activity Rates______________________ 298

135 Page
15. Purchases of New Issues________________________________________ 299 16. Expense and Advisory Ratios___________________________________ 300 17. Postscript_____________________________________________________ 302
1. Srzg, GROWTH _~ND PERF'ORMANCE OF REGISTEREfl INVES'lMENT COMPANIES
1. Introduction _ _ _ _ _ _ _ _ _ _ _ _ _ _ _ _ _ _ _ _ _ _ _ _ _ _ _ _ _ _ _ _ _ _ _ _ _ _ _ _ _ _ _ _ _ _ _ _ _ _ 325 2. Volatility Adjusted Measurement of Investment Performance________ 325 3. Relation of Performance to Size, Growth and Turnover_____________ 328
a. Dcscription of data base and definition of variables__________ 328 b. Description of regression modeL _ _ _ _ _ _ _ _ _ _ _ _ _ _ _ _ _ _ _ _ _ _ _ _ _ _ 329 c. Discussion of regression results_ _ _ _ _ _ _ _ _ _ _ _ _ _ _ _ _ _ _ _ _ _ _ _ _ _ _ _ 330
4. Summary and Conclusions~ _ __ _ _ __ _ _ _ _ _ __ _ _ _ _ _ _ __ _ _ __ _ _ _ _ _ __ _ _ _ _ 332
J. PREFERENTIAL TREATMENT IN THE MANAGEMENT OF DIFFERENr TYPES OF ACCOUNTS
1. Introduction _ _ _ _ _ _ _ _ _ _ _ _ _ _ _ _ _ _ _ _ _ _ _ _ _ _ _ _ _ _ _ _ _ _ _ _ _ _ _ _ _ _ _ _ _ _ _ _ _ _ 382 2. Policies of Investment Advisers Regarding the Allocation of Certain
Purchases and Sales and Regarding the Allocation of Limited Quantities of SecUlities in High Demand___ _ __ _ _ ___ _ _ _ _ _ _ _ ___ _ _ _ 348
a. Purchase and sales programs_ _ _ _ _ _ _ _ _ _ _ _ _ _ _ _ _ _ _ _ _ _ _ _ _ _ _ _ _ _ 348 b. Limited quantities of securities in high demand_____________ 350
3. Allocations of New Issues Among Advisory Accounts___ _ _ _ _ _ _ _ _ _ _ _ _ 352
K. SUMMARY AND CONCLUSIONS
1. The Investment Advisory Industry ______________________________ _ a. Legal and regulatory pattern _____________________________ _ b. Size and growth of asscts ________________________________ _ c. Concentration of advisory assets _________________________ _ d. Organizational forms, age and affiliations of advisory firms ___ _
2. Characteri"tics of Advisory Accounis ____________________________ _ a. Common stock turnover rate _____________________________ _
., v. Competition for Accounts-New and Terminated A('colmts ________ _ 4. 5. 6. 7. R. 9.
Advisory Fees ________________________________________________ _ Economic Structure of the Advisory Industry ____________________ _ Perfornlance Fees _____________________________________________ _ Organization of Advisory Firms for Investment Decisionmaking ____ _ Management of Speculative Funds ______________________________ _
lO. Size, Growth and Performance of Registered Investment Companies __ Preferential Treatment in the Management of Different Types of Ac-
IV-1 IV-2
IV-3
IV-4
IV-5
IV-6
IV-7
IV-8
IV-9 IV-10 IV-U IV-12 IV-13
counts-The Problem of Conflicts of Interest- ___________________ _
LIST OF TABLES
Investment Advisory Industry Survey (June 30, 1969) _________ _ Investment Advisory Industry Survey (June 30, 1969, Percent-ages) ___________________________________________________ _
Advisory Asset Composition and Growth Rate, Large Fund Com-plexes ($100 Million and Over) ____________________________ _
Advisory Asset Composition and Growth Rate, Small Fund Com-plexes (Under $100 Million) ______________________________ _
Advisory Asset Composition and Growth Rate, Large Non Fund Complexes ($100 Million and Over) _______________________ _
Advisory Asset Composition and Growth Rf!,te, Small Non Fund Complexes (Under $100 Million) __________________________ _
Advisory Asset Composition and Growth Rate, All Large Advisory Complexes ($lOO Million and Over) ________________________ _
Advisory Asset Composition and Growth Rate, All Advisory Com-plexes Under $100 Million ________________________________ _
Advisory Asset Concentration by Advisory Complex ___________ _ Total Advisory Asset Concentration by Client Type ___________ _ Organizational Forms of Advisory Firms _____________________ _ Year of Entry Into Advisory Industry _______________________ _ Affiliations of Advisory Firms (September 30, 1969) ____________ _
360 360 360 361 361 362 363 363 363 365 366 367 369
370 372
150
151
152
153
154
155
156
157 158 159 160 161 162

IV-14
IV-15 IV-16 IV-17 IV-18 IV-19 IV-20 IV-21 IV-22 IV-23 IV-24 IV-25
IV-26
IV-27 IV-28 IV-29 IV-30 IV-31 IV-32
IV-33 IV-34 IV-35 IV-36 IV-37 IV-38 IV-39 IV-40
IV-41
IV-42 IV-43 IV-44 IV-45 IV-46
IV-47
IV-48
IV-49 IV-50 IV-51
IV-52
IV-53
IV-54 IV-55
IV-56
IV-57
IV-58
IV-59
136
Percentage of 1968 Advisory Complex Consolidated Gross Income from Specific Sources ____________________________________ _
Average Ages of Advisory Accounts _________________________ _ Distribution of Advisory Account Establishment Years ________ _ Average Sizes of' Advisory Accounts __________________________ _ Distribution of Advisory Account Asset Sizes _________________ _ Advisory Account Asset Composition ________________________ _ Distribution of Advisory Account Common Stock Holdings ____ _ Average Investment Objective of Advisory Accounts __________ _ Distribution of Advisory Account Investment Objectives _______ _ Distribution of Valuation Frequencies of Advisory Accounts ____ _ Distribution of Discretionary Authority Responses ____________ _ Federal Income Tax Liability, Individual and Personal Trust Accounts _______________________________________________ _
Distribution of Number of Participating Accounts in Pooled Accounts _______________________________________________ _ Distribution of Advisory Account Trading Arrangements _______ _ Designation of Brokerage By Advisory Clients ________________ _ Distribution of Advisory Account Turnover Rates _____________ _ Analysis of Account Turnover Data _________________________ _ Effect of Broker-Dealer Affiliations on Turnover Rates _________ _ Turnover Rates for Accounts Managed in Mutual Fund Com-plexes __________________________________________________ _ Rate at Which Advisory Clients Move Their Accounts _________ _ Origination of New Accounts _______________________________ _ Destination of Terminated Accounts _________________________ _ Minimum Stated Asset and Fee Requirements for New Accounts_ Distribution of Minimum Asset Size for New Accounts ________ _ Distribution of Minimum Fee Size for New Accounts __________ _ Importance of Advertising for Obtaining New Business _________ _ Importance of Direct Mail Promotional Literature for Obtaining
New Business ___________________________________________ _ Importance of Own Retail Sales Force for Obtaining New Accounts
or Additional Subscriptions for Existing Accounts ___________ _ Importance of Referrals for Achieving New Accounts (1969) ____ _ Average Advisory Fees _____________________________________ _ Distribution of Average Advisory Fee Ratios _________________ _ Distribution of Advisory Fee Bases __________________________ _ Distribution of Advisory Fee Ratios and Size of Account and Size
of Advisory Complex- ___________________________________ _ Distribution of Advisory Fee Ratios by Size of Account and Size of
Advisory Complex _______________________________________ _ Distribution of Advisory Fee Ratios by Size of Account and Size
of Advisory Complex ____________________________________ _ Analysis of Advisory Fee Ratios ____________________________ _ Impact of Broker-Dealer Affiliation on Fee Ratios _____________ _ Advisory Fee Ratios for Accounts Advised in Mutual Fund Com-plexes __________________________________________________ _
Gross Operating Revenue of Large Advisers ($100 Million or More of Advisory Assets) ______________________________________ _
Gross Operating Revenue of Small Advisers (Less Than $100 Million of Advisory Assets) _______________________________ _
Log,. of 1968 Total Advisory Revenue Vs_ Log. of Advisory Assets_ Brokerage Commissions on Advisory Client Transactions as a
Percentage of Total Revenue _____________________________ _ Total Operating Expenses for Large Advisory Firms ($100 Million
or More of Advisory Assets) ______________________________ _ Total Operating Expenses for Small Advisory Firms (Less Than
$100 Million of Advisory Assets) __________________________ _ Operating Expenses of Registered Investment Company Advisory
and Distribution Functions-Large Advisory Firms ($100 Mil-lion or More of Advisory Assets) __________________________ _
Operating Expenses of Registered Investment Company Advisory and I)istribution Functions, Small Advisory Firms (Less than $100 Million of Advisory Assets) __________________________ _
Page 163 175 176 177 178 179 180 181 182 183 184
185
186 187 188 189 190 191
192 197 198 199 200 201 202 203
204
205 206 216 217 218
219
220
221 222 223
224
232
233 234
235
236
237
238
239

IV-60
IV-61
IV-62
IV-63 IV-64
IV-65 IV-66
IV-67
IV-68
IV-69
IV-70 IV-71
IV-72
IV-73
IV-74 IV-75
IV-76
IV-77
IV-78
IV-79
IV-80 IV-81
IV-82
1"\'-83
IV-84
IV-85
IV-86
IV-87
IV-88
IV-89
IV-90
IV-91 IV-92
IV-93
IV-94
137
Loge of 1968 Total Operating Expenses vs. Log. of Advisory Assets ________________________________________________ - __
Advisory Personnel-Large Adviserl'1- ($100 Million or More of Advisory Assets) ________________________________________ _
Advisory Personnel-Small Advisers (Less than $100 Million of Advisory Assets) ___________________________________ - ____ _
Profit Summary ___________________________________________ _ Profit Analysis-Investment Company Advisers (Corporations Only) __________________________________________________ _ Profit Analysis _____________________________ -_______________ _ Profit Ratios for Advisory Complexes with Corporate Organiza-
tional Forms-1964 ______________________________________ _ Profit Ratios for Advisory Complexes with Corporate Organiza-
tional Forms-1968 ______________________________________ _ 1968 Total as a Percentage of Advisory Assets vs. Loge of Advisory Assets __________________________________________________ _
1968 Reg. Investment Company Profits as a Percentage of Reg. Investment Company Assets vs. Loge of Investment Company Assets __________________________________________________ _
Summary of Profitability Regression Results _________________ _ Mutual Fund Incentive Fee Arrangements Bases for Performance
Comparison _____________________________________________ _ Proportion of Advisory Firms with Investment Committees and
Account Managers _______________________________________ _ Authority of Account Managers To Make Investment Decisions for
Accounts Where Firm Has Discretionary Authority __________ _ Investment Research and Management PersonneL ____________ _ Percentage of Account Manager's Time Devoted to Investment
Decision Making and Related Supervision of Accounts _______ _ Percentage of Investment Research Analyst's Time Spent in Per
sonal Contact (Visits, Telephone Calls, etc.) With Issuers of Securities ______________________________________________ _
Proportion of Full-Time Equivalent Account Managers and Security Analysts With Law Degrees or Advanced Degrees in Business Administration __________________________________ _
Approaches to Security Evaluation-Importance of Specific Alternatives ____________________________________________ _
Importance of Specific External Information Sources to the Securi-ties Research Process ____________________________________ _
Functions for Which Computers Are Used in Advisory Firms ___ _ Distribution of Total Assets Among Hedge Funds and Registered
Speculative Funds Surveyed as of December 31, 1968 ________ _ Classification of Registered Speculative Funds and Hedge Funds
by Asset Size, and Year of Registeration or Formation _______ _ Numbers of Shareholder Accounts Among 40 Registered Specula-
tive Funds by Size of Fund at December 31,1968 ___________ _ Distribution of Limited Partners of Hedge Funds By Asset Size
as of December 31,1968 __________________________________ _ Minimum Initial Investments Required of Limited Partners For
71 Hedge Funds By Asset Size as of December 31,1968 ______ _ Year of Formation, Assets. Number of Partners and Capital Con-
tributions of 28 Largest Investment Partnerships ____________ _ Net Cash Inflows of the Registered Speculative Funds During 1968 ___________________________________________________ _
Monthly Net Cash Inflow For 35 Registered Speculative Funds in Operation Throughout 1968 ____________________________ _
Net Cash Inflow by Performance Ranking for 35 Registered Spec-ulative Funds in Operation Throughout 1968 _______________ _
Net Additional Capital Inflow of 28 Largest Investment Partner-ships ___________________________________________________ _ Percentage Asset Comparison as of December 31, 1968 _________ _ Total Assets and Cash Position of Registered Speculative Funds,
Hedge Funds and ICI Members Classified by Fund Asset Size_ Liabilities of Registered Speculative Funds and Hedge Funds as of
December 31,1968 (stated as a percentage of total assets) ____ _ Use of Speculative Investment Techniques By 28 Largest Hedge
Funds During the Year 1968 _____________________________ _
53-940 0-71-11t. 2--2
Page
240
241
242 243
244 245
246
248
251
252 2'53
259
271
272 273
274
275
276
277
279 282
303
304
305
306
307
308
309
310
311
312 313
314
315
316

138
IV-95 Registered Speculative Funds Which Indicated They Could En- Page gage in Investment Activities Involving Special Risks_ _ _ _ _ _ _ _ 317
IV-96 Registered Speculative Investment Companies Net Amount Payable Quarterly for Securities Purchased__________________ 318
IV-97 Composition of Portfolios of 43 Registered Speculative Funds and 27 Hedge Funds by Market Listing as of December 31,1968_ 319
IV-98 Common Stock Turnover and Activitv Rates for Registered Spec-ulative Funds, Hedge Funds and leI Members_ _ _ _ _ _ _ _ _ _ _ _ _ _ 320
IV-99 Allocation of 15 Initial Stock Offering to Registered Speculative Funds and Hedge Funds in 1968 (Ranked By Total Percentage of Participation by Both Groups of Funds Combined) _ _ _ _ _ _ _ _ 321
IV-100 Registered Speculative Funds Operating Expenses and' Advisory Fees as a Percentage of Average Net Assets_________________ 322
IV-101 Total Assets and Number of Partners of 28 Largest Hedge Funds at December 31,1968 and September 30,1970_______________ 323
IV-102 Decrease in the Assets of the Registered Speculative Funds (December 31,1968 to June 30,1970)_______________________ 324
IV-103 Performance Summary-All Funds with Complete Data for 1960-69 Period_______________________________________________ 333
IV-104 Performance Summary-All Funds with at Least 9 Observations_ 334 IV-105 Relationship Between Stated Investment Objectives and Mutual
Fund Volatility _ _ _ _ _ _ _ _ _ _ _ _ _ _ _ _ _ _ _ _ _ _ _ _ _ _ _ _ _ _ _ _ _ _ _ _ _ _ _ _ _ _ 335 IV-106 Funds With Complete Data for 1960-69 Period January 1960-
December 1969 Evaluation Period_ _ _ _ _ _ _ _ _ _ _ _ _ _ _ _ _ _ _ _ _ _ _ _ _ _ 338 IV-107 Funds With Complete Data for 1960-69 Period January 1960-
December 1964 Evaluation Period_ _ _ _ _ _ _ _ _ _ _ _ _ _ _ _ _ _ _ _ _ _ _ _ _ _ 339 IV-108 Funds Witp. Complete Data for 1960-69 Period January 1965-
December 1969 Evaluation Period___ _ _ _ _ _ _ _ _ _ _ _ _ _ _ _ _ _ _ _ _ _ _ _ 340 IV-109 Funds With at Least 9 Observations January 1960-December 1969
Evaluation Period__ _ _ _ _ _ _ _ _ _ _ _ _ _ _ _ _ _ _ _ __ _ _ _ _ _ _ _ _ _ _ _ _ _ _ _ _ _ 341 IV-110 Funds With at Least 9 Observations January 1960-December 1964
Evaluation Period_ _ _ _ _ _ _ _ _ _ _ _ _ _ _ _ _ _ _ _ _ _ _ _ _ _ _ _ _ _ _ _ _ _ _ _ _ _ _ _ 342 IV-ll1 Funds With at Least 9 Observations January 1965-December
1969 Evaluation Period_ _ _ _ _ __ _ _ _ _ _ _ _ _ _ _ _ _ __ _ _ _ _ _ _ _ _ _ _ _ _ _ _ 343 IV-1l2 Significance Tests for Aggregate Performance Measures_ _ _ _ _ _ _ _ _ 344 IV-1l3 Distribution of Total Net Assets For Sample of 136 Mutual
Funds-31 Dec 1969_ _____ _ _ _ _ _ _ _ _ _ _ _ _ _ _ _ _ _ _ _ _ _ _ _ _ _ __ _ _ __ _ 345 IV-1l4 Performance Regression Statistics Dependent Variable-Mutual
Fund Performance (Alpha) _ _ _ _ _ _ _ _ _ _ _ _ _ _ _ _ _ _ _ _ _ _ _ _ _ _ _ _ _ _ _ _ 346 IV-1l5 Turnover Regression Statistics Dependent Variable-Mutual
Fund Common Stock Turnover Rate (Turn)_________________ 347 IV-1l6 New Issue Allocation and Aggregate Common Stock Holdings_ _ _ 356 IV-1l7 New Issue Allocation and Common Stock TurnoveL___________ 357 IV-1l8 Allocation of New Issues By Account Type____________________ 358 IV-1l9 Relative Allocation of New Issues by Account Type____________ 359
APPENDICES
A. Description of Investment Adviser Account Questionnaire Respondent Groups______________________________________________________ 374
B. Statistical Summaries From Form 1-14____________________________ 375 C. Statistical Summaries of Data From'Form 1-65____________________ 387
Appendix to Section F _ _ _ _ _ _ _ _ _ _ _ _ _ _ _ _ _ _ _ _ _ _ _ _ _ _ _ _ _ _ _ _ _ _ _ _ _ _ _ _ 400

CHAPTER IV
INVESTl\IENT ADVISORY COMPLEXES
A. THE INVESTMENT ADVISORY INDUSTRY
1. Overview of the Industry
The Investment Advisory Industry is one of the largest United States financial industries. It is probably the largest for which so little aggregate information has been publicly available. As of December 1970, the industry is composed of approximately 3,500 advisory firms which provide 'professional investment advice to a wide array of corporate, institutIOnal and individual clients. As of June 30, 1969, assets under advisement of one type or another (",advisory assets") totalled $130 billion, of which $54 billion was that of registered open-end investment companies ("mutual funds"). Firms in the industry range from several billion dollars of advisory assets 'and several thousand advisory clients to firms whose sole activity is publication of invest-ment news letters. .
As defined in Section 202(a) (11) of thelnvestment Advisers Act of 1940,15 U.S.C. 80b-2(a) (11) (Supp. V., 1965-1969), the term "Investment Adviser" means:
Any person who, for compensation, engages in the business of adYising others, either directly or through publications or writings, as to the yalue of securities or as to the advisability of inyesting in, purchasing, or selling securities, or who, for compensation and as part of a regular business issues or promulgates analyses or reports concerning securities.'
For the purposes of this chapter only those advisers with "investment advisory clients" have been considered. Advisers whose sole service consist.s of issuing written reports which are distributed to a wide number of clients (for example, investment newsletters) are excluded.2
1 The act then excludes the following from the definition: (A) a bank, or any bank holdIng company as defined In the Bank Holding Company Act of 1956, which Is not an Investment company; (B) any lawyer. accountant, engineer. or teacher whose performance of such services Is solely incidentnl to the practice of his profession; (C) any broker or dealer whose performance of such services is solely incidental to the conduct of his business as a broker or dealer and who receives no special compensation therefor; (D) the publisher of any bona fide newspaper, news magazine or business or financial publication of general and regular circulation; (E) any person whose advice, analyses, or reports relate to no securities "ther than securities which are direct obligations of or obligations guaranteed as to principal or Interest by the United States, or securities issued or guaranteed by corporations In which the United States has a direct or Indirect Interest which shall have been designated by the Secretary of the Treasury, pursuant to section 3(a) (12) of the Securities Exchhange Act of 1934, as exempted s'ecurities for the purposes of that Act; "r (F) such other persons not within the Intent of this paragraph, as the Commission may designate by rules and regulations or order.
2 The publication oriented advisers were considered In eh, III of the Special Study of th .. Securities Markets, H.R. Doc. No. 95, 88th Cong., 1st Sess., Pt. 1 at 330-386 (1963) ("Special Study").
(139)

140
This chapter considers both registered and non-registered investment advisers.3 Among the non-registered advisers included are advisers whose only clients are mutual funds, the officers of several internally managed closed-end registered investment companies, the general partner(s) of a number of private investment partnerships ("hedge funds") and the advisers to several offshore funds. Specifically excluded from this chapter were bank trust departments 'Und insurance. companies, which are considered in chapters V and VI of the Study.
The variety of advisory firms is as great as the variety of clients, and the variety of services and bcilities of these firms covers a wide range. The origin of the investment ftdviser can be traced to the professional trustee who oc.rly in this century performed the role of family financial counsellor. Gradually, some of these trustees joined together, and from these groups the profession of investment counsel evolved after World War 1. In general, investment counsel firms and individual investment counsellors follow professional standards and are either exclusively or primarily engaged in rendering (on a continuing basis) advice "as to the investment of funds on the basis of the individual needs of each client." 4 Historically, they had little or no affiliation with brokers. bankers or underwriters and their compensation 'Was designed to be independent of the number or frequency of transactions and unrelated ,to a share of capital gains of the client. 5
In addition to investment counselors other sources of in vestment advice developed. Brokerage firms historically rendered investment advice to their customers, generally with payment in the form of commissions on transactions. Others have hIstorically through the publishing business provided a general investment research service on a subscription basis rather than "investment supervisory services." 6
Finally, registered open end management type investment companies ("mutual funds") grew over the same period particularly since World War II, and provided a vehicle for more direct investment mana~ement. There were thus four separate roots from which the present lllvestment advisory industry developed.
These varied forms of investment advisers have in turn developed at an accelerated pace in different directions. Some counselors have remained independent entities advising individuals and institutions. A number of formerly independent investment counsel firms 7 were acquired by brokerage firms and investment advisory departments were organized by other brokerage firms. Many of the publishing firms developed investment supervisory facilities. Bank and insurance company holding companies and even individual corporations have entered
3 Registration under the Investment Advisers Act has not been required for: . (1) Advisers whose only clients are Investment companies and Insurance com·
panles; (2) Advisers who have fewer than 15 clients and who do not hold themselves out
generally to the public as In vestment managers. Investment Advisers Act. sec. 203(b). 15 U.S.C. § SOb-3(b) (1964). The Invest.ment Company Amendments Act of 1970. Pub. L. No. 91-547, signed into law on December 14, 1970, modifies tMs exemption. See sub sec. 3 below. .
• Spe the definition of "Investment supervisory sprvlces" In sec. 202(a) (113) of the Investment Advisers Act, 15 U.S.C. SOb-2(a) (13) (1964), .
5 See Standards of Practice for Member Firms of the Investment Counsel ASSOCiation of America .
• Investment Advisers Act, sec. 20S(c) (2),15 U .. S.C. SOb-S(c) (2) (1964). 7 Section 20S(c) of the Investment Advisers Act, 15 U.S.C. SOb-S(c) (1964.1: prohibits
any registered Investment adviser from representlDg that he or It Is an IDvestment counsel" unless (1) his or Its business consists of acting as Investment adviser, and (2) a subSltantial part of his or its business consists of rendering Investment supervisory services.

141
the area through acquisitions and the organization of new firms. Also, in the recent past, many firms which were formerly entirely or primarily investment company advisers or managers have diversified through seeking other advisory clients, notably large institutional advisory clients. Other investment advisers entered the investment company area for the first time.
The advisory clients oan be divided into three basic oategories: (a) In vestment companies; (b) Institutional and corporate accounts; and ( c) Individuals and persona.} trusts.
The Investment company category is comprised of registered investment companies and several types of non-registered companies, the most promment of which are offshore funds and private investment partnerships ("hedge funds"). Offshore investment companies are mutual funds whose shares are available only to non-U.S. citizens and residents, and which invest all or a substantial part of their funds in U.S. securities. These funds are typically resident in a "tax haven" and pay no U.S. tax on capital gams realized.s
The institutional and corporate accounts include employee benefit plans, college endowments, relis-ious organizations, insurance companies and various types of non-financial corporate accounts. The final category is individual and personal trust accounts. All these different types of accounts can be advised on a separate or joint basis.
Tttbles IV-1 and IV-2 provide a breakdown of advisory assets as of June 30, 1969. The tables were prepared from data collected through the use of Study Questionnaire 1-5.9 The tables represent data from 1,343 firms which, to the extent possible to ascertain, represent all the significant advisory firms in the industry.
The data sho,v that the largest single account category is registered open-end investment companies. They represent $54.7 billion of the $130 billion total, or 42.0 percent of industry assets. Individuals and personal trusts, while accounting for 82 percent of the number of accounts managed, represent only 19.6 percent of assets. Employee benefit plans, including state and local retirement systems, are bhe next major category and represent 15 percent of t<Ytal industry assets.
Of the $130 billion of assets, $78 billion is listed as discretionary and $52 billion as non-discretionary.lO The major portion of the discretionary assets are made up of registered investment companies (open end and closed end), which account for $55.7 billion 11 of such assets.
8 See ch. VII of the Study for a discussion of offshore funds. • For a discussion of the respondent universe for the various Investment adviser ques
tlonnllires. see ap". IV.A. ,. "Discretionary" was defined to Include any account for whiCh the advisory firm or
Its affiliate has legal authority to select the securities bought or sold, without obtaining the consent of the client or another person or firm before the transaction Is effected, whether or not consent Is customarily obtained.
"Affiliate" was defined to Include any general partner, director, officer, or employee of the firm or a person or firm that directly or Indirectly controls. is controlJed by, or Is under common control with, the firm, except that no bank or insurance company was to be deemed an affiliate.
11 Registered Investment companies are typlcalJy advised by a management company whose employees are also officers of the Investment company. The high proportion of discretionary fund assets resulted from questionnaire Instructions rather than adviser response. Instructions to respondents provided "if your firm is the investment adviser of a regi~tered management Investment company, treat the account as discretionary, but If your firm merely furnishes recommendations to Ilnother firm which In turn acts as Investment adviser to the investment company, treat the account as non-discretionary."
Thus from the tllbles It Is seen that $2.3 billion of registered Investment company assets were advised on the non-discretionary basis described.

142
Th~ institutional and corpomte accounts totalled approximately $40 billion of which $31 billion weTe non-discretionary. A major portion of individual and persona..! trust assets ($16 billIon of $26 billion) were also designated as non-discretionary advisory assets.
T,a;bles IV -3 through IV -8 provide data on the composition of advisory russets within advisory complexes as well as the growth mtes of ,Vhe number of !l!Ccounts and v'alue of assets under advisement during the five year period 1964-1969. The data represent responses of a sample of 120 advisory firms to Study Questionnaire 1-65.12
In much of the statistical dUitJa in this chapter, the responding firms were stratified by their major type of advisory activity and by size of advisory assets as of December 31, 1969. The activity stratification was into "fund" and "non-fund" advisory complex. A "fund" complex is defined 'as an advisory firm where more than one-third of assets being advised (as of September 30, 1969) were represented by assets of registered investment companies. All other advisory firms were classified as "non-fund" complex.es. This was done in order to separate the essentially mutual fund advisory firms from the investment counsel firms,13 An advisory firm was classified as "large" if it provided 'advice for more than $100 million of advisory assets as of December 31, 1969.14 All other advisory firms were classified as "small."
TUibles IV -3 and IV -4 provide data for large and small fund complexes. Trubles IV-5 and IV-6 present non-fund advisory oomplex data and Tables IV-7 and IV-8 combine the two types of advisory complexes.
The data 'indicate a rapid rate of growth of assets under advisement in the sample of firms. For large firms, the five year rate of growth of total advisory assets was 14.4 percent . per year (Table IV-7). For small firms the growth rate was 19.0 percent per year (Table IV-8). During the period large non-fund complexes had a
12 See app. A for a description of the respondent group for form 1-65. 13 The structure of the mutual fund Industry was described in ch. XI of the Special
Study and In ch. II of the Commission's Report on the Public Policy Implications of Investment Company Growth, H.R. Rep. No. 2337, 89th Congo., 2d Seas., 45-59 (1966) ("Public Policy Report"). and a detailed discussion Is not called for here.
In summary. it may be said that most mutual funds contract out their principal funetlons to other organizations that work for them on a fee basis. This extemalizatlon of management is the most striking feature of the mutual fund Industry's organizational pattern. This external manager Is known as the fund's "Investment adviser" and the fund pays the adviser an "advisory fee."
The Investment adviser usually has organized and remains closely atllllated with the fund. The adviser selects the fund's portfolio and operates or supervises most other aspects of Its business. While a mutual fund adviser can he an Individual, most are partnerships or corporations. A mutual fund Investment adviser may have no nonfund clients, or It may eomblne Its mutual fund activities with a general Investment counseling and/or securities business. •
Many mutual fund advisers organize and manage a number of funds which have different types of Investment policies. This enahles the mutual fund adviser to reach a broader cross section of potential Investors and to offer each investor the opportunity to apportion his aggregate mutual fund investment among several funds with different Investment objectives all managed by the same adviser.
U In the classification of firms by asset size several points should be noted. First, size of assets In the advisory industry should not be compared directly with size of such institutions as banks trust department or Insurance companies because the relationshtp Is essentially advisory and most often terminable at the client's option on short notice. Second, the composition of advisory assets can vary significantly among firms If there Is a different composition In clients. For example, large Institutional clients may have a substantially higher proportion of bonds than aggressive Individual accounts. Third, the degree of Infiuence of an investment adviser over assets on which he pro'l'1des Investment ad'l'1ce may vary significantly, particularly with respect to such matters as a placement of brokerage and the voting of proxies In portfolio securities.

143
substantia.lly higher rate of growth than large fund complexes (21 percent per yettr vs. 9.5 percent per year) .
The bstest growing advisory account was that of non-registered investment companies other than offshore funds. As indicated previously, this category is comprised mostly of private investment pa.rtnerships ("hedge funds"). 'Vhile all small advisory complexes as a whole were growing at a yearly rate of 19.0 percent, accounts of nonregistered investment companies other than offshore funds advised in such complexes were growing at the rate of 152.7 percent per year (T'able IV -8). This 'account category was also the f.astest growing with respect to all large ad ,risory complexes, growing at the rate of 39.9 percent as opposed to the total per year growth rate of all large advisory complexes as a whole of 14.4 percent (Table IV-7).
2. Concentration of Advisory Assets
Table IV-9 shows the cumulative distribution of advisory ,assets by numbers of advisory complexes. Of the $130 billion of total adVIsory assets reported by the 1,343 respondents to Study Questionnaire 1-5, 23.5 percent of these assets were concentrated in five advisory firms. The largest 25 firms advised 60.3 percent of assets, the top 50 firms 75.6 percent. '
For the $78.0 billion of discretionary advisory assets reported, the distribution was somewhat more concentrated. The top five firms advised 26.9 percent of discretionary assets, the top 25 firms 63.4 percent and the top 50 firms 78.9 percent of discretionary assets.
When the common stock portion of advisory assets was examined, a degree oLconcentration similar to that for total assets was found. Also the discretionary common stock component of advisory account assets was more concentrated by advisory firm than total common stock holdings.
Registered open-end investment company assets were found to be the most highly concentrated. 'When advisory complexes were ranked by their total mutual fund 'assets, the top five firms advised 34.6 percent of these assets, the top 25 firms 75.4: percent and the top 50 firm3 90.0 percent of mutual fund assets.
The above results are shown graphically in Figure IV a-1, where the cumulative percentage of various categories of advisory assets is plotted aga;inst the number of advisory complexes.
Table IV-10 presents simil:ar concentration statistics for the various classes of advisory asssets reported on Form 1-5. The statistics were obtained by ranking the advisory complexes by the 'amounts of assets advised in each category. For separately managed individual and personal trust accounts, 22 percent of assets were advised by five ~rms, 62.0 percent by 25 firms and 77.3 percent by 50 firms. InstitutIOn and corporate advisory assets were found to be most highly concentrated. The ten largest advisory firms for each type of client were fOUl~d t? advise 66.5 percent of employee benefit phtns, 84.6 percent of hfe lllsurance company accounts and 81.0 percent of university and college endowments.

10
to
. -I(tl ~ IL o
~w "I
··U (.)= LJ (\- ?1·
144 Figure IV a - i.
c"unmu]ativc r"';:Cclltn:.;", of Advisor.y A&sctG by !{w,:lJ'-'l:" oJ: Ac\v.i.~ory Cor:-.j>lcxcs
3. Regulatory P'attern
a. Registered investment advisers With minor exceptions, Section 203(a) of the Investment Advisers
Act of 1940, 15 U.S.C. 80b-3(la) (1964), makes it unlawful for any investment adviser, unless registered with the Commission, to make use of the mails or any means or instrumentality of interstate commerce (the "jurisdictional means") in connection wIth the 'adviser's business. Investment adviser is defined broadly to include, among other things, any person who, for a fee, engages in the business of advising others with respect to securities.15
" Section 202(a) (11), 15 U.S.C. 80b-2(a) (11) (1964). This section excludes from the definition of an Investment adviser, among others, "any broker or dealer whose performance of such services Is solely Incidental to the conduct of his business as a broker or dealer and who receives no special oompensatlon therefor."

145
However, exempted from the registration requirement are, among others, investment advisers "whose only clients are investment companies and insurance companies." 16 These advisers, however, are affected by cert'ain provisions of the Investment Company Act.
Registration under the Investment Advisers Act is accomplished by filing with the Commission a form which contains items pertaining to the name and form of organization of the investment adviser; education and prior business affiliations of its ,principals; the nature of the adviser's business; the scope of its 'authority; ,the basis of compensation, and other specified information.
Thereafter, the registered investment adviser becomes subject to special regulation governing his contracts; the maintenance and preserva,tion of specified kinds of books and records,17 and other regulatory provisions relating to the conduct of his business. Thus, the Investment Advisers Act prohibi,ts any investment adviser, unless exempt from registration pursuant to Section 203 (b), from using the jurisdictional means with respoot to any investment advisory contraot which (1) "provides for compensation to ,the investment adviser on the basis of a share of capital gains upon or capital 'appreciation of the funds or 'any portion of the funds of the client," 1~ or (2) "fails to provide, in substance, that no assignment of such contract shall be made by the investment adviser without the consent of the other party to the contract." 19
The Investment Advisers Act also contains sections prohibiting fraudulent, deceitful and manipulative conduct,20 and prohibiting misstatements or omissions of a material fact in any registration application or report required to be filed with the Commission.21 These antifraud provisions appl.}' to all investment advisers, whether or not they are required to be registered.
Pursuant to the provisions of Section 206, the Commission has adopted a rule containing specified prohibitions and related requirements governing the publication, circulation or distribution of any advertisement by any investment adviser.22 Among other things, the rule (1) prohibits any advertisement which refers to any testimonial of any kind concerning any adviser or his advice; (2) requires ~he investment adviser to furnish a list containing specified informat~on respecting all recommendations made by the investment adviser dur~ng the past year if he refers in the advertisement to any past specIfic recommendations that would have been profitable; (3) prohibits him from representing that any graph, chart, formula or other device
,. Section 203(b) (2), 15 U.S.C. 80b-3 (b) (2) (1964). The Investment Company Amend· ments Act of 1970 removes the exemption for Investment company advisers effective December 14, 1971, by deleting the words "investment companies and" from Section 203 (b) (2) of the Investment Adviser .. Act.
17 Section 204 of the Investment Advisers Act, 15 U.S.C. 80b-4, and Rule 204-2 thereunder, 17 CFR 275.204-2.
18 Section 205(1), 15 U.S.C. 80b-5(1). Investment advisers whose only clients are Investment companies have not been covered by this provision, and the charging of a "performance fee" by such advisers has become common. The Investment Company Amendments Act changes this situation effective December 14, 1971. by deleting the exemption from registration now enjoyed by such advisers, and by prohibiting snch fee arrangements unless the fee increases or decreases proportionately on the basis of Investment performance against an appropriate index of securities prices or other appropriate measure of performance. See sec. F of tbls chapter for a discussion of performance fees.
,. Section 205 (2), 15 U.S.C. 80b-5 (2). 20 Section 206, 15 U.S.C. 80b-6. :n Section 207, 15 U.S.C. 80b-7. 2!lRule 206(4)-1, 17 CFR 275.206(4)-1. Advertisement Is defined broadly In the rule
to cover communications by radio, television or in writing.

146
being offered can in and of itself be used to determine investment decisions, without prominently disclosing in the advertisement the limitations and difficulties with respect to its use; (4) prohibits any statement to the effect that any report, analysis or service will be furnished free of charge unless there is m fact no condition or obligation, directly or indirectly; and (5) prohibits statements which are otherwise false or misleading.
There is no requirement in the Investment Advisers Act for the filing of financial statements or periodic or other reports with the Commission by investment advisers. Hence the Commission normally has no information available to it as to the size of investment advisory organizations, both in terms of personnel and amount of assets being advised; the number of advisory clients; the amount of assets being advised on a discretionary as opposed to nondiscretionary bases; the range of advisory fees being charged; and other pertinent data.
b. Investment advisers acting exc7lusively for investment companies As stated above, investment advisers who act exclusively for in
vestment companies have been exempt from those provisions of the Investment Advisers Act which apply to investment advisers required to be registered under that Act. However, these investment advisers are affected by certain provisions of the Investment Company Act .
. Section 9 of that Act, 15 U.S.C. 80a-9, prohibits persons convicted or enjoined from unlawful conduct involvmg securities from being an investment adviser to any registered investment company, unless such persons receive an exemption from the Commission. At least 40 percent of the board of directors of a registered investment company must consist of persons who are unaffiliated with its investment adviser,2J thus requiring that there be a substantial minority (or majority) of "independent" members of the fund's board of directors. In the statutory sense, however, unaffiliated does not mean completely unrelated. Directors unaffiliated with the investment adviser may have strong ties with the fund's managers. For example, a director is presently deemed unaffiliated even though he owns up to 4.99 percent of the adviser's stock, has substantial business or professional relationships with the investment company or its adviser, or is closely related by blood, marriage or friendshi p to the fund's managers.2
'1
Transactions in which investment companies engage in joint transactions with, lend money to, sell property to, or buy property from mvestment advisers, or affiliated persons of an investment adviser, are prohibited unless Commission approval has first been obtained.25
In addition, the Investment Company Act requires that the investment company's contract with its adviser be·in writing and that the
.. Section 10(a), 15 U.S.C. 80A-10(a). The Investment Company Act provides its own definition of "Investment adviser" In Section 2(a) (111l), 15 U.S.C. 80a-2(a) (19).
As a practical matter, most Investment companies are required to have a majority of their board unaffiliated with the Investment adviser. The reason for this Is that most investment companies have as a principal underwriter (1) a company which Is also the investment adviser, or (2,) a company which has offi~ers and directors affiliated with the investment company. Section 10(a) (2) requires that a majority of the board of the Investment company by unaffiliated with the principal underwriter.
". See the definition of "affiliated person" In Section 2(a) (a) of the Investment Company Act. See also Acampora; v. Birkland, 220 F. Supp.·527, 535-536, (D. Colo. 1963). Eft'ective December 14, 1971, the Investment Company Amendments Act Improves protection In this area by requirln/: that at least 40 percent of the Investment company's board of directors be persons which are not "Interested perrons," a term which Is defined more broadly than "affiliated persons."
.. Section' 17 of the Investment Company Act, 15 U.S.C. 80a-17.

147
adviser's compensation thereunder be precisely described. Before an advisory contract can become effective, it must be approved by the holders of a majority of the investment company's outstanding voting securities. Investment advisory contracts may be continued beyond two years only if approved annually by either (a) the board of directors as a whole, including a majority of the unaffiliated directors, or (b) the vote of the holders of a majority of the outstanding voting securities. An investment company has the right to terminate an advisory contract on 60 days notice at any time, without penalty, and such a contract is automatically terminated in the event of its assignment.26
Section 31 of the Investment Company Act, 15 U.S.C. 80a-30, requires the investment adviser to keep certain books and records as prescribed by rule by the Commission~ and the Commission has adopted such rules comparable to the rules adopted under the Investment Advisers Act.27 Finally, the Commission is empowered to bring suit to enjoin an,investment adviser from gross misconduct or gross abuse o:f trust. 28
o. Federal income taw considerations A fund may qualify as a regulated investment company under Sec
tion 851 of the Internal Revenue Code. A regula'ted investment company must distribute to its shareholders
at least 90% of its net investment income. Moreover, it must derive less than 30 percent of its gross income for the taxa;ble year from the sale or other disposition of stock or securities which were held for less than three months.
As a regulated investment company, a fund pays no Federal income tax on the net investment income and realized capital gains which it distribU'tes to its shareholders. Any distribution paid from the excess, if any, of a fund's net realized long-term capital gains over its net realized short-term capital losses is taxable to the shareholders as a ]onO'-term capital gain. Dividends from net investment income (inclu8ing net short-term capital gains) normally are taxable to recip-
- ients at ordinary rates and will, to the extent permitted by the Internal Revenue Code, qualify for the exclusion from gross income of the first $100 of dividends received by the shareholders during the year. Such exclusion is not available with respect to the capital gains distribution. Section 19 of the Investment Company Act, 15 U.S.C. 80a-19 (1964) requires a fund to notify its shareholders as to the source of every dIvidend and distribution paid.
Net gain on the sale of portfolio securities, if both realized and distributed (actually or constructively), is taxa;ble as capital gain to the shareholder. If the net asset value of shares were reduced below it shareholder's cost by distribution of gain realized on the sale of securities, such distribution would be a return of capital invested though taxable as stated above.
Any dividend or distribution paid shortly after a purchase of shares by an investor will have the effect of reducing the per share net asset
"" Section 15, 15 U.S.C. 80a-15. 27 Rules 31a-1 and 31a-2. 17 CFR 270.31a-1, 270.31a-2. 28 Section 36, 15 U.S.C. 80a-35. The Investment Company Amendments Act changes.
this proviSion effective May 14, 1972, by authorizing a suit by the Commission to enjoiu a "breach of fiduciary duty Involving personal misconduct." The new Section 36 also specifies that the adviser has a fiduciary duty with respect to the receipt of compensation, and that the Commission or an investment company shareholder may bring an action alleging breach of this duty.

148
value of his shares by the per share amount of the dividend or distribution. Furthermore, such dividends and distributions, although -in effect a return of capital, a,re subject to tax.
4. Organization Forms, Age and Affili3ltions of Advisory Firms
The purpose of this section is to present data concerning a number of physical characteristics of advisory firms. These include the organizational form of the firms (partnership, corporation, etc.), the age distribution of advisory firms, the types of affiliations between advisory firms and other institutions, and data on the J?roportion of the revenue that the advisory firm and its affiliates obtamed from investment advisory and broker-dealer functions. The data were collected via the 1-65 Investment Adviser Intrinsics Questionnaire. a. Organizatiorutl form
The 1-65 respondents were asked to specify a code designating the organization form of their firms. The choices were (a) sole proprietorship, (b) partnership, (c) corporation, (d) other. The distribution of responses is given in Table IV-11. The predominant organizational form is the corporation (approximately 70 percent of all firms). No fund complexes were sole proprietorships, while 11 percent of nonfund complexes took this form. b. Age distribution of advisory firms
The respondents were asked to specify the year during which their firms entered the advisory business (including any predecessors of the current firm). The distribution of responses IS given in Table IV -12. The average age for all firms in the sample was 19 years. The average age for large firms was 26 years. This is approximately the same for fund and nonfund advisory complexes. The average age for small nonfund advisory complexes was 16 years, which is substantially older than for small fund complexes which average 3.5 years old. This later difference reflects the surge of entries into the mutual fund industry during the last half of the nineteen sixties. c. Affiliations of advisory firms
The advisers were asked to specify if they were affiliated 2.9 with any of the following entities as of September 30, 1969: -
( a) A broker-dealer; (b) A life insurance company; ( c) A nonlife insurance company; (d) A bank or trust company; (e) Other investment adviser (s) ; (f) An investment partnership; and (g) Others.
The distribution of responses is given in Table IV-13. Thirty-five percent of all the firms indicated affiliations with broker-dealers. When broken down, the figures are 59 percent for fund complexes and 24 percent for nonfund complexes. Twenty-five percent of the total sam-
!Ill An "affiliated company" was defined for the purposes of this question to include any company that directly or indirectly controls, is controlled by or is under common control with the respondent firm. A "company" was defined to include a corporation, a partnership, an association, a joint stock company, a trust, a fund, or any organized group of persons whether incorporated or not.
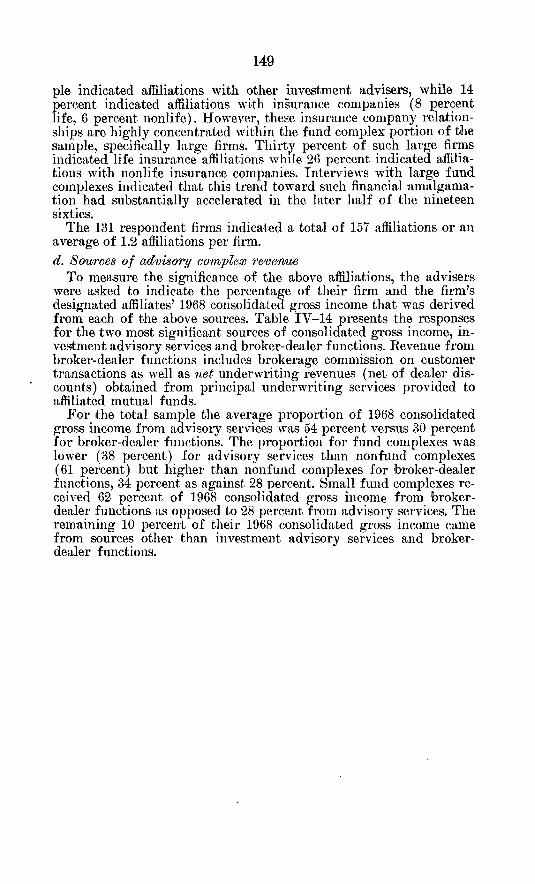
149
pIe indicated affiliations with other investment advisers, while 14 percent indicated affiliations ·with insurance companies (8 percent life, 6 percent nonlife). However, theEe insurance company relationships are highly concentrated within the fund complex portion of the sample, specifically large firms. Thirtx percent of such large firms indicated life insurance affiliations whIle 26 percent indicated affiliations with nonlife insurance companies. Interviews with large fund complexes indicated that this trend toward such financialamalgamation had substantially accelerated in the later half of the nineteen sixties.
The 131 respondent firms indicated a total of 157 affiliations or an average of 1.2 affiliations pel' firm.
d. Sources of advisory complex revenue To measure the significance of the above affiliations, the advisers
were asked to indicate the percentage of their firm and the firm's designated affiliates' 1968 consolidated gross income that was derived from each of the above sources. Table IV-14 presents the responses for the two most significant sources of consolidated gross income, investment advisory services and broker-dealer functions. Revenue from broker-dealer functions includes brokerage commission on customer transactions as well as net underwriting revenues (net of dealer discounts) obtained from principal underwriting services provided to affiliated mutual funds.
For Ithe total sample the average proportion of 1968 consolidated gross income from advisory services was 54 percent versus 30 percent for broker-dealer functions. The proportion for fund complexes was lower (38 percent) for advisory services than nonfund complexes (61 percent) but higher than nonfund complexes for broker-dealer functions, 34 percent as against. 28 percent. Sman fund complexes reo ceived 62 percent of 1968 consolidated gross income from brokerdealer functions as opposed to 28 percent from advisory services. The remaining 10 percent of their 1968 consolidated gross income came from sources other than investment advisory services and brokerdealer functions.

TABLE IV-l
INVESTMENT ADVISORY INDUSTRY SURVEY (JUNE 30, 1969)
Number of Accounts Assets ~Thousar.ds2 ~Millions of Dollars2
Non- Non-Categor:l, of Advisers' Account Discretiona~ Discretionar}! Total Discretionarx Discretionarx
Registered Management Invest-ment Companies:
Open End 495 214 709 52,332 2,358 Closed End 135 49 184 3,449 960
Non-Registered Investment Companies:
il-i -Offshore Fends 73 39 947. _ 610 Other Investment Funds 564 710 1,274 612 221
Instltutional and Corporate: Employee Benefit Plans 2,170 2,167 4,337 4,228 8,902 State and Local Pension 33 158 191 116 6,356 Uni versi ty and College Endowme.nt 130 341 477 2,537 3,128 Religious Organizations 94 367 461 245 845 Other Non-Profit Organizations 430 923 1,353 650 2,917 Insurance Companies (Life) 34 171 205 . 81 1,798 Insurance Companies (Other) 46 188 234 296 1,939 Other Corporate Accounts
(Financial) 107 615 722 510 4,378 Other Corporate Accounts (Other) 616 828 1,444 420 1,214
Individuals and Personal Trusts: Separately Managed 35,566 29,350 64,916 9,116 13,860 Join tly Managed 2,030 2,677 4,707 505 2,166
Other 2 057 784 2 841 333 436 Investm~nt Advisers' Own Portfolio 804 0 804 1 585 0
TOTALS 45,390 39,581 84,971 77,962 52,088 Number of Investment Advisers or Advisorv Fl~s: 1,343.
Common Stock ~Millions of Dollars2
Non-Total Discretionarx Di8cretiona~ ~
54,690 42,709 2,104 44,813 4,409 2,670 825 3,495
1,557 667 424 1,091 833 403 162 565 -~
13,130 2,525 5,900 8,425 6,472 79 1,441 1,520 5,665 1,625 1,985 3,610 1,090 157 530 687 3,567 432 2,011 2,443 1,879 30 443 473 2,235 172 622 79"
4,888 122 936 1,058 1,634 318 932 1,250
22,976 7,238 11,064 18,302 2,671 413 1,485 1,898
769 264 298 562 1 585 1 178 0 1 178
130,050 61,002 31,162 92,164

TABLE IV-2
INVESTMENT ADVISORY INDUSTRY SURVEY (JUNE 30, 1969)
(PERCENTAGES)
Number of Accounts Assets Non- Non-
Categorx of Advisers' AccounI;§. Discretionarx Discretionarx Total Discretionar:r: Discretionar:r:
Registered Management Invest-ment Companies:
Open End 0.58 0.25 0.83 40.24 1. 81 Closed End 0.16 0.06 0.22 2.65 0.74
Non-Registered Investment Companl.cs:
Offshore Funds 0.09 0.05 0.13 0.73 0.47 Other Investment Funds 0.66 0.84 1. SO 0.47 0.17
Institutional and Corporate: Employee Benefit Plans 2.55 2.55 5.10 3.25 6.84 State and Local Pension 0.04 0.19 0.22 0.09 4.89 University and College Endowment 0.16 0.40 0.56 1.95 2.41 Religious Organizations 0.11 0.43 0.54 0.19 0.65 Other Non-Profit Organizations 0.51 1.09 1. 59 0.50 2.24 Insurance Companies (Life) 0.04 0.20 0.24 0.06 .. 1. 38 Insurance Companies (Other) 0.05 0.22 0.28 0.23 1.49 Other Corporate Accounts
( Financial) 0.13 0.72 0.85 0.39 3.37 Other CorD orate Accounts (Ocher) 0.72 0.97 1. 70 0.32 0.93
Individuals and Personal Trusts: Separately Managed 41.86 34.54 76.40 7.01 10.66 Jointly Managed 2.39 3.15 5.54 0.39 1. 67
Other 2.42 0.92 3.34 0.26 0.34
Investment Advisers' Own Portfolio 0.95 0.0 0.95 1. 22 0.0
0 12.;.21 ~
Number of Investment Advisers or Advisory Firms:~ 1,343.
Total
42.05 3.39
1.20 0.64
10.10 4.98 4.36 0.84 2.74 1.44 1.72
3.76 . 1. 26
17.67 2.05
0.59
1.22
l22.:.!22
Common Stock Nan-
Discretionar:t:: Discretionarx
46.34 2.28 2.90 0.90
• 0.72 0.46 0.44 0.18
2.74 6.40 0.09 1. 56 1. 76 2.15 0.17 0.57 0.47 2.18 0.03 0.48 0.19 0.67
0.13 1.02 0.34 1.01
7.85 12.00 0.45 1. 61
0.29 0.32
1.28 0.0
66.19 33.81
Total
48.62 3.79
1.18 0.61
9.14 1. 65 3.92 0.75 2.65 0.51 0.86
1.15 1.36
19.86 2.06
0.61
1. 28
100.00
I-' C;1 I-'
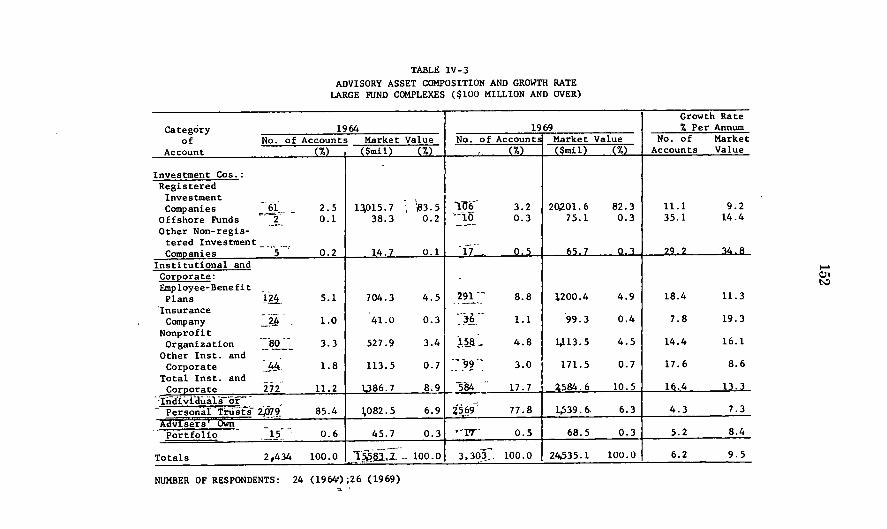
TABLE IV-3 ADVISORY ASSET COMPOSITION AND GROWTH RATE
LARGE FUND COMPLEXES ($100 MILLION AND OVER)
1964 1969 Category of
Account No. of Accounts Market Value No. of Accounts Market Value
Investment Cos.: Registered
Investment Companies 61
Offshore Funds =-~2~-Other Non-regis- - .• -.
tered Investment Companies --"f-'
Institutional and Corporate: Employee-Benefit Plans ~li
'Insurance
.JJ.l.
2.5 0.1
0.2
5.1
($mil) (%)
13,015.7 ~3.5 38.3 0.2
14.7 0.1
704.3 4.5
TO'lr ··~·JJi
17
291 - ..
Company ._.2.b. 1.0 41.0 0.3 :)~--Nonprofit
Organization ""80 3.3 527.9 3.4 ~21L Other Inst. and ,- --.--
.JJ.l.
3.2 0.3
0.5
8.8
1.1
4.8
Corporate :j!A. 1.8 113.5 0.7 "~92'- 3 o Total Inst. and
.J.. $'II.ill-------.i %1.
2(},201.6 75.1
65.7
:\.200.4
99.3
1,113.5
82.3 0.3
0.3
4.9
0.4
4.5
0.7
Growth Rate % Per Annum
No. of Market Accounts Value
11.1 35.1
29.2
18.4
7.8
14.4
17.6
9.2 14.4
...34.8
11. 3
19.3
16.1
8.6
Corporate 272 11.2 1.386.7 8.9 584'" 17.7 4584.6 10.5 I 16.4 13.3 "Ind'1vl'dualil or ---_. I - Person'a[ trosts- 2lfl?~ 85.4 \082.5 6.9 ~5§?-: 77.8 1,539.6. 6.3 4.3 7.3 'AQV sers own -- _. -Portfolio' -15'- 0.6 45.7 0.3 'L'T"' 0.5 68.5 0.3 5.2 8.4
6.2 Totals 9.5 2,434 100.0 Il~iiiJ~~- 100.0 I 3.303-::' 100.0 I 24,535.1 - --~ --- 100.0
NUMBER OF RESPONDENTS: 24 (1964') ;26 (1969)
~ <:11 ~

;i
1"
TABLE IV-4 ADVISORY ASSET COMPOSITION AND GROWTH RATE SMALL FUND COMPLEXES (UNDER $100 MILLION)
1964 1969 Category of
Account No. of Accounts Market Value
llmi~m No. of Accounts Market Value
.(§mil) __ (%)
Investment Cos.: Registered
Investment Companies --29
Offshore Funds -~O Other Non-regis
tered Investment Companies \0
Institutional and Corporate: Employee-Benefi t _~
Plans 10 Insurance
Company Nonprofi t Organization
Other Inst. and Corporate
Total Inst. and COIJl.Orate
--IndiViduals or-
:0
o
,0
o
. --P-e-rsonar-Tr,ist-s I ,0 AdviseJ;s' .0wD.--
_ PordoIio
Totals
~ 10 '-39_ .
~~
75.0 0.0
0.0
0.0
0.0
0.0
0.0
0.0
0.0
25.0
100.0
59.6 0.0
0.0
0.0
0.0
0.0
0.0
0.0
0.0
17.0
76.6
NUMBER OF RESPONDENTS: 3 (1964); 14 (1969).
77.8 0.0
0.0
20 ~ -1~
-3."
0.01 ___ 5 __
0.0'
0.0 I
0.0
0.0
0.0
22.2
o
---_r ---f"
'7
-7:3--
--:r-
.{'7.1
18.2 0.9
6.4
4.5
0.0
0.9
0.9
6.4
65.5
2.7
100.0 In----- 100.0
323.6 0.1
6.6
0.8
0.0
0.3
0.2
1.3
9.8
25.1
366.6
88.3 0.0
1.8
0.2
0.0
0.1
0.0
0.4
2.7
6.9
100.0
Growth Rate % Per Annum
No. of Market Accounts
46.1 0.0
0.0
0.0
0.0
0.0
0.0
0.0
0.0
24.6
94.0
Value
40.3 0.0
0.0
0.0
0.0
0.0
0.0
0.0
0.0
8.2
36.8
'""' CJ1 ~

Category of
Account
Investment Cos.: Registered
Investment Companies
Offshore Funds Other Non-regis-
tered Investment Companies
Institutional and Coq~orate:
Employee-Benefit Plans
Insurance Company
Nonprofit Organization
Other Inst. and Corporate
Total Inst. and Cor~orate
InaividuaIs or . '--'Personal'Tryats xav! sed' own' . , Portfolio
- ....
Totals
TABLE IV-5 ADVISORY ASSET COMPOSITION AND GROWTH RATE
LARGE NON FUND COMPLEXES ($100 MILLION AND OVER)
1964 1 69 No. of Accounts Market Value No. of Accounts Market Value
(%) ($mil) (%) .-' (%1 ($mil) (%1
._~8 0.2 763.2 8.3 jl; 0.2 1,892.8 7.9 . ,_ 0 0.0 0.0 0.0 ··~0· 0.1 79.1 0.3
. 35 0.4 J4 . .9 0.2 ··'64,· 0.5 93.0 0.4 --~ _ _ J. _
,
. ?4Z ' 2.8 1.672.2 18.2 1!~~:,· . 6.1 &253.6 26.1
4~'- 0.5 449.8 4.9 11'r 0.7 4110.0 8.8
'352' 4.0 1,316.8 14.3 1 ;0'06 ' 6.0 3411. 9 14.3 ,
:i;..2J 1.3 341.8 3.7 '2·~ 1.7 1,518.3 6.3
'16.( 8.6 1787.8 41.2 2,"431 14'.5-' 13,310.8 55.6
!1in ~9Q.f.. 14.597.1 50.1 lA 186 • 84 6 8t.86.2 ,35.5
.- HI 0.2 26.6 o c3 "17 ,J1..1 86.1. 0.4
8,808 100.0 9;1.84.3 100.0 16J 76if 100.0 23,932.3 100.0
NUMBER OF RESPONDENTS: 24 (1964); 32 (1969).
Growth Rate % Per Annum
No. of Market Accounts Value
13.2 19.9 0.0 0.0
19.5 44.3
32.9 30.2
20.7 36.2
23.5 21. 0
20.3 34.8
24.0 28.6
11 7 1 ~ ,0
t..o 7f. "
13.8 21.1
-CoIl ~

Category
TABLE IV-6 ADVISORY ASSET COMPOSITION AND GROWTH RATE
SMALL NON FUND COMPLEXES (UNDER $100 MILLION)
1964 1969 of No. of Accounts Market Value No. of Accounts Market Value
Account (%) ($mil) (%) (%) ($mil) .(%}
Investment Cos.: Registered
Investment Companies i 1
0 0.0 1.0 0.1 0 0.0 9.0 0.6 Offshore Funds 10 0.0 0.0 0.0 ~-:i_ 0.1 88.9 6.1 Other Non-regis-
tered Investment -,-C2!!!Eanies --2.. 0.0 0.2 0.0 __ lB~ 0.2 13.2 0.9
Institutional and Corporate: Employee-Benefit
3~ __ Plans - 0.7 26.9 3.9 _~_~L_ 1.9 103.9 7.1 Insurance
Company ~" ~. 0.1 2.9 0.4 - 9 0.1 14.7 1.0 Nonprofit -Organization ~iL-" 0.8 49.2 7.2 ~_~'i~ 0.6 38.9 2.7
Other Inst. and Corporate ' 10" 0.6 44.1 6.4 _11 0.8 57.5 3.9
Total Inst. and 'nO'--Corl!0rate 2.2 122.9 17.9 "301 - 3.4 213.0 14.6
Individuals or - -- , Personal Tru;i:~ ff. 854 " 97 .. ':!_ 513.1 74.5 ~/il_O - 95.9 - - 1,006.2 68.8 Advis!!.!:.!!' Own_
~ortfolio _~O 0.4 51. 2 7.4 -,"~-" 0.4 130.0 8.9
Totals 4,984 100.0 688.5 100.0 8,833 100.0 ]J.62.4 100.0
NUMBER OF RESPONDENTS: 28 (1964); 48 (1969)
Growth Rate % Per Annum
No. of Market Accounts Value
14.9 55.2 0;0 0.0
58.5 133.0
34.9 31.1
7.4 38.4
8.5 -4.6
17.4 5.5
21. 5 11. 6
11.9 14.4
12.5 20.5
12.2 16.3
.... <:.To <:.To

TABLE IV-7 ADVISORY ASSET COMPOSITION AND GROWTH RATE
ALL LARGE ADVISORY COMPLEXES ($100 MILLION AND OVER)
Category 1964 1969 of No. of Accounts Market Value No. of Accounts Market Value
Account (%) ($mil) (%) "'" ('7.) ($mil) (%)
Investment Cos.: Registered
Investment \
Companies ?'L 0.7 13,778.9 55.6 14L 0.7 22,094.3 45.6 Offshore Funds 0 0.0 38.3 0.2 20 0.1 154.2 0.3
-Other Non-regis-
tered Investment Companies 34 0.3 29.6 0.1 10-0- 0.5 158.6 0.3
Institutional and CorEorate: Employee-Benefit _. - --
-i;304 Plans _:nt 3.3 2p76.4 9.6 6.5 7~54.0 15.4 Insurance -- ---
Company __ 6:1 _ 0.6 490.8 2.0 _ l61_ 0.8 2,209.4 4.6 Nonprofit
",-- -J,l64 Organization 922. 3.8 1.844.8 7.4 5.8 4,525.3 9.3
Other Inst. and - -.. -Corporate ]..57 1.4 455.3 1.8 .~~~ , 1.9 1,689.8 3.5
Total Inst. and Corporate WZ! 9.1 5,174.5 20.9 3;onr -15.0 15.895.4 32.8
In,i'{viduals or , .. ---.- ---:" Personal Trusts 1£>.075 __ ---89-;] 5p79.6 22.9 ~6-, 7-57 ----83-.S- 1qQ25.8 20.7 ---"\,dvisers '_-<lim --- -PortIoho 2_L- 0.2 72.3 0.3 {tD- 0.2 154.7 0.3
'l'ot~s _____ ._ l!L23~O.Q.. 24,768.L 10(LO 20.&68 100.0 481+67.4 100.0
NUMBER OF RESPONDENTS: 48 (1964); 58 (1969).
Growth Rate 'X. Per Annum
No. of Market Accounts Value
11. 6 9.9 58.5 32.1
21.0 39.9
28.7 26.7
16.9 35.1
22.0 19.7
19.6 30.0
22.2 25.2
10.4 12.0
4.6 16.4
12.3 14.4
~ C71 ~

Category
TABLE IV-B ADVISORY ASSET COMPOSITIO~ AND GROWTH RATE ALL ADVISORY COMPLEXES UNDER $100 MILLION
1964 1969 cf No.. of Account Market Value No.. of Acccunts
I Market Value
Acccunt - -. (%) ($mil) (i:;)
-.-. (%) ($mil) (%)
Investment Cos.: Registered
Investment _. -Companies 5 .. 0.1 60.6 7.9 . .17.- 0.3 332.6 IB.2
Offshcre Funds ~- 0 0.0 0.0 0.0 _9 0.1 88.9 4.9 -
Other Non-regis-tered Investment .- . Companies 0 0.0 0.2 0.0 . .21. 0.3 19.8 1.1
Instituticna1 and CorEcrate: Emplcyee-Benefit .. - 17.0:. Plans . ..15 - 0.7 26.9 3.5 l.9 104.7 5.7 Insurance
Company . -i. 0.1 2.9 0.4 :) . 0.1 14.7 0.8 Ncnprcfit
-'40 Organizaticn 0.8 49.2 6.4 '-54 - 0.6 39.2 2.1 Other ,Inst. and
~~- ''if" Ccrpcrate 0.6 44.1 5.8 0.8 57.7 3.2 Tcta1 Inst. and
Ccrporate iit{ 2.'1' 122.9 16.1 '36{'~ 3.4 214.3 11. 7 'Tmn:VLlIUID:lI-Ur--
"
--'EiiSQnat'Ii;'iiiit~ J-4ffjT .f52.f?· ~-.~ 95. '5--97.'3 .. 513.1 67.1 1,016.1 55.6 Advisers' Own
• J.
Pcrtfclic ~io . 0.4 68.2 8.9 ~.- 0.4 155.1 8.5
Tcta1s 4,972 100.0 765.1 100.0 8·~3-? 100.0 1828.9 100.0 -
NUMBER OF RESPONDENTS: 31 (1964; 62 (1969).
'---, \ Growth Rate % Eer annum
No.. of Market Accounts Value
36.8 40.6 0.0 0.0
68.3 152.7
35.7 31. 3
7.4 38.4
8.8 -4.5
17 7 5.5
22.1 1l. 7
12.0 14.6
13.2 17.8
12.4 19.0
-~ -.J

TABLE IV-9
ADVISORY ASSET CONCENTRATION BY ADVISORY COMPLEX
Cummulative Percentage Managed by Number of Firms Category of Advisory Asset
5 10 15 25 50 100 ~
Total Assets 23.5 37.2 46.4 60.3 75.6 87.2 ~
Discretionnary Assets 26.9 41.2 52.0 63.4 78.9 89.5
Total Common Stock 22.5 36.2 45.5 59.3 74.6 86.6
Discretionnary Common Stock 28.5 43.2 53.2 64.5 79.8 89.9
Registered Open End Investment Companies 34.6 52.4 63.2 75.4 90.0 97.7 - ~

TABLE IV-lO
TOTAL ADVISORY ASSET CONCENl'RATION BY CLIENr TYPE
___ (;ullIlUlative Percentage of Total Assets by Number of Firms* Category of Account
3 5 10 15 25 50
Registered Investment Company -- Open End 24,3 34,6 52,4 63.2 75.4 90,0 Regis~ed Investment Company -- Closed End 32.7 43,6 62.8 73.9 88.1 99 3 Employee Benefit Plans 39.8 54.3 66.5 74 5 84 5 Q40 State and Local Pension Systems 79.5 91.7 98.3 99.5 100.0 100.0 University and College Endowments 46,0 65.3 81.1 88.9 95.5 99 6 Religiotiis~ Organizations 52.0 65.5 81.0 86.5 92.9 98.8 Other Nonprofit Organizations 35.8 44.4 59.6 69,3 80.3 92.2 Off!,hore Funds 53.0 60.2 73.4 82.3 91.9 99.8 Other Nonregistered Investment Companies :l4._4 36.9 52.4 64.7 78.5 90.4 Life Insurance Companies 64.7 74.7 84.6 89,7 94.9 99.5 Nonlife Insurance ComP-anies 4J ,5 58,2 78 4 88 4 95 6 -Q~ Q
Other Financial Corporations 55.6 73.7 89.8 92.8 96 2 Other Nonfinancial Corporations 43.2 54,6 64.8 72.3 82,7 Individuals -- Separately Managed 22.0 29,7 42.4 51.2 62.0 Individuals -- Jointly Managed 40.2 50.9 72.6 86.1 93.0 Advisers Own Portfolio 46.7 57,5 70.9 77 ,6 85.3
Total Advisory Assets 23.5 37.2 46,4 60.3 --
*The advisory firms which comprise the number of firms shown are not necessarily the same for each category of 'account. Thus, for example, 50 firms advise 90 percent of registered open end investment company accounts, and 50 perhaps totally different firms advise 99.5 percent of life insurance company accounts.
99 3 93.2 77 3 97.5 93.2
75.6 -
-0-. <:0

TABLE IV-ll
Organizational Forms of Advisory Firms
Type Size Number Distribution of Responses by Category (%)
of of of Sole Firm Firm Firms Proprietorship Partnership Corporation Other
Large 27 0.0 11.11 85.19 3.70
Fund Complex Small 14 0.0 7.14 92.86 0.0
..... 8
Total 41 0.0 9.76 87.80 2.44
Large 38 0.0 34.21 63.16 2.63 Nonfund Small 52 19.23 17.31 61. 54 1. 92 Complex
Total 90 11.11 24.44 62.22 2.22
Large 65 0.0 24.62 72.31 3.08
Total Sample Small 66 15.15 15.15 68.18 1. 52
Total 131 7.63 19.85 70.23 2.29

Type Size Number of of of
Firm Firm Firms
Large 26 Fund Small 13 Complex
Total 39
Large 38 Nonfund Small 52 Complex
Total 90
Large 64 Total Small 65 Sample
Total 129
TABLE IV-12
Year of Entry Into Advisory Industry
Distribution of Responses by Category (0/0)
Before 1931-1950 1951-1960 1961-1964 1965-1969 1931
15.38 53.85 11.54 3.85 15.38
0.0 0.0 0.0 15.38 84.62
10.26 35.90 7.69 7.69 38.46
15.79 42.11 15.79 2.63 23.68
7.69 25.00 15.38 9.62 42.31
11.11 32.22 15.56 6.67 34.44
15.62 46.88 14.06 3.12 20.31
6.15 20.00 12.31 10.77 50.77
10.85 33.33 13.18 6.98 35.66
Average Age of
Firm (Years)
27.1
3.5
19.3
25.4
16.1
19.1
25.6
12.8
19.1
~ 0) ~

Type Size Number of of of
Firm Firm Firms
Large 27 Fund
Small 14 Complex Total 41
Large 38 Nonfund Small 52 Complex
Total 90
Large 65 Total Small 66 Sample
Total 131
TABLE IV-13
Affiliations of Advisory Firms (September 30, 1969)
Percent~ge of Responses Indicating Affiliation' With Follo~ing Entities
Broker Life Ins. Nonlife Bank or Other Invest- Investment Others Dealer Co. Ins. Co. Trust Co. ment Adviser Partnership
56 30 26 15 33 15 44
64 7 0 0 35 21 21
59 22 17 10 34 17 37
37 5 3 11 37 5 34
15 0 0 6 10 13 6
24 2 1 8 21 10 18
45 15 12 12 36 9 38
26 2 0 5 15 15 9
35 8 6 8 25 12 24 -- - ------- '-----
I
I
I
-~ I I

-- TABLE IV-14
Percentage of 1968 Advisory Complex Consolidated Gross Income from Specific Sources
Type Size Number Distribution of Responses by Category (%) Average %
Income of of of of Consolida-Source Firm Firm Firms ted Gross
0-20% 21 - 40% 41 - 60% 61 - 80% 81 - 100% Income
Large 27 37.04 14.81 7.41 18.52 22.22 43.44 Fund Small 14 64.29 7.14 7.14 0.0 21.43 27.86 Complex
Total 41 46.34 12.20 7.32 12.20 21.95 38.12
Invest- Large 38 31.58 2.63 7.89 0.0 57.89 62.71 ment Advisory Nonfund Small 52 36.54 5.77 0.0 0.0 57.69 60.40 Complex Services Total 90 34.44 4.44 3.33 0.0 57.78 61. 38 -Large 65 33.85 7.69 7.69 7.69 43.08 54.71
Total Small 66 42.42 6.06 1. 52 0.0 50.00 53.50 Sample
~
Total 131 38.17 6.87 4.58 3.82 46.56 54.10
Large 27 62.96 14.81 14.81 0.0 7:41 19.44 Fund Small 14· 28.57 7.14 7.14 7.14 50.00 62.07 Complex
Total 41 51.22 12.20 12.20 2.44 21. 95 34.00
Broker Large 38 73.68 2.63 5.26 7.89 10.53 19.92 Dealer Nonfund Small 52 78.43 0.0 0.0 5.88 15.69 33.25
Functions Complex Total 90 76.40 1.12 2.25 6.74 13.48 27.56
Large 65 69.23 7.69 9.23 4.62 . 9.23 19.72 Total Small 66 67.69 1. 54 1. 54 6.15 23.08 39.46 Sample
Total 131 68.46 4.62 5.38 5.38 16.15 29.59 -- ---- --

164
B. CHARACTERISTICS OF ADVISORY ACCOUNTS
1. Introduction
The purpose of this section is to describe the types of accounts which are advised in investment advisory complexes. The account characteristics analyzed include age of the account, asset size, portfolio composition, investment objective, trading and brokerage allocation status and portfolio turnover during the September 1968-September 1969 period. '
The data were obtained using the 1-14 Account Description Questionnaire which was sent to 158 large and small advisory firms. The responses contained data on all accounts advised by these firms-a total of 42,118 advisory accounts. While the number of accounts surveyed represent only 50 percent of the estimated total number of advisory accounts, (based on 1-5 questionnaire responses), the aggregate advisory assets of the surveyed accounts represent approximately 83 percent of total industry ad visory assets. .
Of the 42,118 accounts in the sample, 320 were registered investment companies, 7,269 were institutional or corporate accounts and 34,529 were individual or personal trusts.
The average registered investment company account had $174 million of assets as of September 30, 1969, was 74 percent invested in common stock, was 14 years old, had a growth oriented investment objective and a common stock turnover rate of 57 percent for the 12 months ending September 30,1969. The average institutional and corporate aCcount, on the other hand, had $2.0 million of assets, waS 66 percent invested in common stock, was 7 years old, had an income-growth oriented objective and a turnover rate of 23 percent. The average individual account had $0.6 million of assets, was 79 percent invested in common stock, was 9 years old, had a growth-income investment objective and a turnover rate of 20 percent.
2. Data Organization
'While various groupings of account types will be used in summarizing the account data, the basic in formation was collected using 27 primary account identification codes. These account types were organized into eight account groups which are used in presenting data in the remainder of this section. The account types included in these eight groups are given below:
1. Registered investment companies: Open end companies (mutual funds) ; closed end companies.
2. Nonregistered investment companies: Offshore funds; investment partnerships (hedge funds) .
3. Emnloyee benefit plans: Single employer plans; multi-employer plans; pooled plans; HR 10 accounts (aggregated for each firm) ; State and local government retirement systems.
4. Insurance companies: Life insurance company accounts; nonlife insurance company accounts.
5. Non-profit organizations: Educational endowment accounts; religious organization accounts; foundation accounts; other non-profit organizations. '

165
6. Corporate accounts: Corporate account-non-financial corporation; corporate account-financial corporation.
7. IndivIduals and personal trusts: Individual account-separately managed; individual account-jointly managed.
8. Other accounts: Adviser's own portfolio; in vestment clubs; venture capital funds; other accounts.
9. Total accounts: All of the above categories. In addition, a further aggregation of account types will be used
from time to time. This is the three category group discussed above, Registered Investment Companies, Institutional and Corporate Accounts and Individuals and Personal Trusts. The Institutional and Corporate category will include account groups 2, 3, 4, 5, 6, and 8 in the above listing.
In the following discussions the data from the 158 advisory firms have been aggregated and presented as if from a single advisory firm of 42,118 accounts.30
3. Age of Advisory Accounts (Refer to Tables IV-15 and IV-16)
The average advisory account is 8.4 years old. The average registered investment company account is 14.0 years old, being founded in 1956. Institutional and corporate accounts range from an average age of 4.4 years for non-registered investment companies to 8.6 years for the accounts of non-profit organizations and corporations. The average institutional and corporate account was approximately 7.0 years old. Individual and personal trust accounts average 8.6 years old.
The growth of advisory clientele is indicated by an examination of the distribution of account ages. Fifty-six percent of all registered investment company accounts were started in 1960 or later, with 34 percent having been started between 1967 and 1969. A substantially higher proportion of institutional and corporate accounts were started in the nineteen sixties. Ninety percent of nonregistered investment companies, 89 percent of employee benefit plans, 75 percent of corporate accounts, 74 percent of ll1surance company accounts, and 68 percent of non-profit organization accounts were started between 1960 and 1969, with an accelerating pace toward the later years. Seventytwo percent of aU individual and personal trust accounts were begun in the nineteen sixties, with 38 percent started between 1967 and 1969.
4. Size of Advisory Accounts (Refer to Tables IV-17 and IV-18)
The average advisory account contained $2.6 mrllion as of September 30, 1969. The average registered investment company a£COunt contained $173.8 million of assets. The average size of institutional and corporate accounts ranged from $2.4 million for non-registered investment company !tccounts to $12.7 million for insurance company accounts. The average institutional and corporate account contained $2.0 million of assets. The average individua1 and personal trust account contained $0.6 million of assets.
Approximately 48 percent of all registered investment company accolmts had in excess of $50.0 miHion of assets, with 8.7 percent with
30 The analysis of account turnover rates however does consider various adviser characteristics In explaining dllferences in turnover rates.

166
assets in excess of $500.0 million. On the other hand, 75 percent of individual rund personal trust accounts had assets less than $0.5 million and only 11 out of 34,529 of such accounts had assets in excess of $50.0 million.
5. Asset Composition of Advisory Accounts (Refer to Tables IV-19 and IV-20)
The asset structure of the average advisory account was composed of 8.4 percent cash and short-term debt securities, 9.6 percent non-convertible debt and preferred stock, 4.3 percent convertible debt and preferred stock, 76.5 percent common stock and was 1 percent invested in other portfolios (such as mutual funds) advised by the adviser.
The average registered investment company account contained 72.9 percent common stock. Institutional and corporate account holdings of common stock ranged from a low of 39.9 percent for the insurance company accounts to a high of 77.6 percent for non-registered investment companies. The 1werage institutional and corporate account contained 66 percent common stock. Individual and personal trust accounts held an average of 78.6 percent of assets in common stock as of Septemoor 30, 1969.
Approximately two-thirds of all registered investment company accOU:llts held more than 70 percent of assets in the form of common stock. Approximately 75 percent of all indivi.dual and personal trust accounts held more than 70 percent of assets in the form of common stock. Approximately 53 percent of all non-registered investment company accounts held more than 80 percent of assets in the form of commonstock.
6. Investment Objective (Refer to Tables IV-21 and IV-22)
The adviser was asked to select one of the following four investment objectives for each advisory account which best described the objectiveofthe account as of September 30, 1969.31
1. Maximal Capital Gain-Capital appreciation is the sole objecti ve and high risks will be taken to achieve it.
2. Growth-Primary objective is capital appreciation, but characterized by less willingness to bear high risk and a higher degree of price sta:bility than maximal capital gain.
3. Growth/Income-Combined objective of capital appreciation and current income.
4. Income-Primary objective is to provide as Ebaral a current income as possible.
The typical advisory account had a growth-income oriented investment dbjective. Registered investment companies tend to have more growth oriented objectives. Fifty-six percent of registered investment companies have either maximal oapital gain or growth objectives. The typical institutional and corporate account tends to have an incomegrowth investment orientation. However, substantial differences exist among objectives of the account types which make up this category.
31 The adviser responded by specifying a code (1 through 4) which corresponded to the maximum capital gain through Income objective range.

167
The typicaJ individual and personal trust account ha.d a growth-income orientation.
7. Valuation Frequency (Refer to Table IV-23)
Eighty-five percent of all advisory accounts are valued quarterly or more frequently. Ninety-three percent of all registered investment company accounts were valued on a monthly or more frequently basis (typically daily for mutual funds). Typically 90 percent of all institutional and corporate accounts are valued quarterly or more frequently. Eighty-three percent of individual and personal trust accounts were valued quarterly or more frequently, with 70 percent specifying a quarterly valuation period.
S. Investment Discretion (Refer to Table IV-24)
The advisers _were asked to specify a code for each advisory account which best described the adviser-client relationship from the point of view of the degree of discretion of the adviser to make portfolio decisions for the'account. The following response options were available:
1. The investment adviser has sole investment authority to select the securities bought or sold and never (or rarely) consults with the client prior to execution of trades.
2. The investment adviser sometimes consults with the client or other palties prior to execution of trades.
3. The invest.ment adviser frequently consults with the clients or other parties prior to execution of trades.
4. The investment adviser has no investment authority for this account and must always obtain approval from client prior to
. execution of trades. The responses indicate that registered investment companies allow
the adviser the greatest degree of investment discretion, with 75 percent of responses in this category indicating the adviser had sole investment authority. This response would appear to represent a practical rather than a formal view of the typical mutual fund-adviser relationship. Registered invest.ment companies normally delegate day to day investment discretion to the adviser (usually called the "management company"). Employees of the adviser act as administrative and investment officers for the fund. The portfolio manager is an officer (and is sometimes the president) of the fund. However, approval of the board of directors of the fund is sometimes required for pro· posed changes in the fund's investment portfolio, and thus in these cases the portfolio manager (or adviser) does not have sole investment discretion. The Study's interviews indicated that the function of the board of directors appeared to be in formulation of an investment strateg'y for the fund, while leaving the portfolio manager a degree of discretIOn in implementing this program through the selection of types and amounts of various securities. As with all corporations, however, the ultimate responsibility for the investment company's activities lies with its board of directors.
The second highest proportion of com}?lete authority relationships is for non-registered investment compames, where 56 percent of the hedge funds and offshore funds surveyed were found to delegate sole

168
responsibility to the adviser. The adviser, in the case of a hedge fund, was considered to be the general partner or partners who managed the fund. Thus in the case where the general partner was being advised by an investment adviser, the hedge fund would not have responded that it delegated complete authority to its adviser. Institutional and corporate accounts ,vere typically advised on a non-discretionary basis, with 79 percent of insurance company accounts, 67 percent of nonprofit organization accounts, 64 percent of corporate accounts, and 47 percent of employee benefit accounts indicating that the adviser had no authority to make 'investment decisions for the account. The accounts of individuals were 'also typically non-discretionary in nature, with 56 percent of accounts indicating no discretion, 8 percent indicating some discretion and 26 percent indicating complete discretion.
9. Federal Income Tax Liability for Individual and Personal Trust Accounts (Refer to Table IV-25)
The adviser was asked to categorize the federal tax bracket on ordinary income to which the account (if a trust) or other beneficial owner is subject. Approximately 25 percent of responses were in each of the categories (a) zero to 30 percent, (b) 30 percent to 50 percent, ( c) grea;ter than 50 percent and (d) unknown.
10. Number of Participating Accounts in Pooled (Jointly Managed) Accounts (Refer to Table IV-26)
If the advisory account was pooled (jointly managed), the adviser was asked to specify the number of participating accounts as of September 30, 1969. If the account was an investment company, the adviser was asked to enter the number of shareholders or limited partners of the fund.
Data were obtained from 1,593 jointly managed accounts, of which 308 were registered investment companies, 138 were non-registered investment companies, 884 were jointly managed individual or personal trusts and the remainder were institutional and corporate accounts. For all classes of accounts, except registered investment companies, more than 95 percent of all accounts contained less than 500 participating accounts. The average for employee benefit plans was 592 accounts; for nonprofit organizations 56; for corporate accounts 29; for individual and personal trust accounts 220. For registered investment companies, 50 percent of the responses indicate in excess of 10,000 shareholders. The average number of shareholders for the 308 registered company sample was 3,169.
11. Placing of Account Portfolio Orders (Refer to Table IV-27)
The adviser was asked to sJ?OOify a code for each advisory account which best descrihed the way III which orders to purchase or sell portfolio securities were transmitted to the executing broker-dealer.
1. Adviser's order department placed orders with broker-dealers for the account more than 50 percent of the time;

169
2. The account manager for the account placed orders with brokerdealers for the account more than 50 percent of the time;
3. Both the order department and the account manager placed orders with broker-dealers for the account, but each less than 50 percent of the time;
4. The order department never placed orders with broker-dealers for the account; the account manager does, but for less than 50 percent of the account's orders ;
5. The account manager never placed orders with broker-dealers for the account; the order depa,rtment does, for less than 50% of the account's orders;
6. Neither the order department nor the account manager placed orders with broker-dealers for the account.
The results indicate that the adviser places orders for virtually all registered investment company clients. The adviser in this case places orders more than 50 percent of the time for 90 percent of all registered investment company accounts. For other types of accounts, the adviser typically places a lower percentage of purchase and sell orders. For approximately one-third of all institutional and corporate, and individual accounts the adviser does not place purchase and sell orders. However, for the remaining accounts, the adviser in most cases places the orders for portfolio transactions more than 50 percent of the time.
12. Designation of Portfolio Brokerage (Refer to Table IV -28)
For accounts for which the advisory firm places some purchase or sell orders with broker-dealers, the adviser was asked to specify the code which best described the proportion of brokerage business which the client had designated to go to' particular broker-dealers.
The designation categories specified were the following: 1. Brokerage commissions or portfolio transactions are not
designated. 2. Some, but less than 15 percent of the brokerage commissions
on portfolio transactions are designated (subject to variations necessary to achieve best execution).
3. At least 15 percent, but not more than 85 percent of the brokerage commissions ('n portfolio transactions are designated (subject to variations necessary to achieve best execution).
4. More than 85 percent of the brokerage commissions on portfolio transactions are designa,ted (subject to variations necessary to achieve. best execution). .
5. Firm does not place or execute any orders for the account. The responses show that 65 1?ercent of brokerage business associated
w~th advisory account securitIes transactions was designated by the clIent or was beyond the control of the adviser due to the fact that he did not place orders for purchases and sales of securities.
For registered investment companies the results were substantially different. In 65 percent of these cases, the adviser was free to allocate 100 percent of the brokerage business. The average percentage of brokerage designated by registered investment company clients was
53-940 O-71-pt. 2--4

170
27 percent. For institutional and corporate accounts, the client typically designated approximately two-thirds of the brokerage business, leaving the adviser complete dIscretion in only 25 percent of th~ cases. In individual and personal trust accounts the picture was similItr to institutional ·and corporate accounts. On the average 65.4 percent of brokerage business was designated, with the adviser having full authority to allocate brokerage business for only 28.7 percent of such accounts.
13. Common Stock Turnover Rate (Refer to Table IV -29)
For each Il.dvisory account, the adviser was asked to estimate the annual turnover rate for the common stock portion of the account. The turnover rate was defined as the total cash purchases or total cash sales, whichever is smaner, of common stock during the 12 months preceding September 30, 1969, divided by the average market value of the common stock during the previous twelve month period. The following ranges were used to categorize the turnover rates.32 (1) 0-10 percent; (2) 10-50 percent; (3) 50-100 percent; (4) over 100 percent.
The turnover rate for the common stock portion of the typical advisory account was found to be 21.3 percent per year. This varied substantIally by type of advisory account. Registered investment companies had an average turnover rate of 56.7 percent. Unregistered investment companies turned over at a 47.1 perCent rate.33 The typical institutional and corporate account had a turnover rate of 23 percent ranging from a high of 27.7 percent for employee benefit plans to [\ low of 20.6 percent for insurance company accounts. The average individual and personal trust account had a turnover rate of 20.2 percent, with ·approximately 49 percent of accourrts with rates less than 10 percent, and It further 46 percent of these accounts with rates less than 50 percent.
14. Factors Affecting Advisory Account Turnover Rates (Refer to Tables IV -30, IV -31, IV -32)
The above discussion of turnover rates points up differences in 1969 turnover rates among different account types, but a great deal of additiona.l information is available when the relationships between account turnover rates and various characteristics of the account and the advisory firm are examined. For example, what is the effect of size of the advisory account on turnover mte, of investment objective or investment discretion allocated to ·adviser? Correspondingly, what impact does the size of the advisory firm have on turnover rates of client accounts? The above questions can be examined using the data from the 1-14 account description questionnaire.
32 In the following discussions, responses in a particular category, for example 5() per· cent, were arbitrarily assigned the mid-range value (30 percent in the above case) _ For the over 100 percent turnover rate, responses in this category were arbitrarily assignell a 15,0 Ilercent rate.
33 This figure is probably unreasonably low due to the utilization of the clasSification technique described in the preceding footnote. More representative statistics for turnover of unregistered investment companies can be obtained from sec. H of this chapter with respect to hedge funds (annual turnover .. ate for 1968 of 317 percent) and from ch. VIII.H with respect to offshore funds (turno\'er rate of 121 percent in 1968 and 151 percent in 1969).

171
The joint effect of the following factors on advisory account turnover rate have been examined. The term "joint" refers to the fact that the effect of each factor has been measured while holding all other factors constant. Thus, the following question can be answered through this type of ·analysis-other factors being the same, what is the impact on portfolio turnover rate of a change in a specific factor ~
(1) Age of Account (year) : The number of years since the account was established. . (ii) Total Assets of Account (ASST) : Total assets as of Sep-tember 30, 1969. .
(iii) Investment Objective (OBJT). (iv) Investment Authority (AUTH) : A coded factor, ranging
from 1 for complete discretion in the adviser to 4 for no investment authority in the adviser.
(v) Marginal Tax Position of Client (TAX) : The percentage of federal tax liability of account on ordinary income.
(vi) Broker-Dealer Affiliation of Adviser (BR. D) : A factor designating the affili3ltion of the adviser with a broker-deaIer firm that executed security orders (as opposed to a mutual fund principal underwriter which is not considered to be a broker-dealer for the purposes of this analysis) .34
(vii) Trading Authority of the Adviser (TRAD) : The percentage of account brokerage business that can be designated by the adviser (100 percent minus the percentage designated by client). .
( viii) The Size of the Ad visory Firm (SIZE) : The total assets advised in the advisory complex at September 30, 1969.
(ix) Fund Complex Factor (FUND) : A factor describing the composition of advisory assets within the oomplex. The fund complex factor designates more than % of advisory assets as being composed of registered investment companies.35
The marginal impact of each of these factors on the level of account turnover rates, both for the total number of accounts and for individual account types will now be considered. a. Age of account
Older accounts typically have lower turnover rates. For the total group of accounts, a 100 percent increase in account age is associated with a 1.7 percentage pomt decrease in account turnover rate.36 For registered investment companies the reduction in turnover rate is larger-a 100 percent increase in fund age is associated with a four
.. If the adviser was affiliated with an active broker-dealer firm (as defined above) the variable BR. D was set equal to 1.0 In the regression analysiS for all accounts; If not BR. D was set at zero.
"" If more than 113 of advisory assets are composed of registered Investment companies, t1te variable "fund" was set equal to 1.0 for all accounts of that adviser; If not "fund" was set equal to zero.
36 The changes In the explanatory factors (1) age of account, (2) assets of account and (3) size of advisory firm will be presented as percen.tage change from a base amount. For example, a 100 percent Increase In age would result from Increasing the age of the account from 2 to 4 years, or 10 to 20 years. Changes In the turnover rate and the other seven factors will be dlscllssed In terms of absolute changes. For example, a change In turnover rate from 20.0 to 22.0 would be described as a 2 percentage point increase In turnover rate.
For the age, asset and size variables, a 100 percent Increase In the factor would result In a change in turnover rate equal to the regression coefficient of the factor times 0.7 (which Is approximately the natural logarithm of 2).

172
percentage point reduction in turnover rate. The age effect for institutional and corporate accounts varies depending on the account type. The impact on portfolio turnover of doubling account age varies within a plus or minus one percentage point range. The effect of age on individual and personal trust account turnover rate is the same as for the total number of accounts. b. Total accmmt assets
The impact of account size on turnover rate differs among the v·arious account types. The relationship between these two factors is typically not statistically significant, except for individual and personal trust accounts, in which case·a 100 percent increase·in asset size is associated with a 0.2 percentage point reduction in account turnover rate. c. Investment objective
For all types of accounts, a strong relationship was found between the advisory account turnover rate and investment objective. Accounts with more aggressive investment objectives experience higher turnover. For the total number of accounts, the difference between the average turnover rate for maximal capital gain oriented accounts and accounts with income objectives is 29 percentage points. The result is palticularly large for registered investment companies, where the difference in turnover rates between maximal capital gain oriented accounts with income objectives is 72 percentage points. For institutional and corporate accounts the difference ranges from 20 percentage points for insurance company accounts to 32 percentage points for employee benefit accounts. For individual and personal trust accounts the difference is 28 percentage points.
d. Investment attthority Accounts where the adviser has sole authority to make portfolio
changes tend to turn over more rapidly than accounts for which the adv·iser has limited or no discretionary authority. For the total number of accounts, the difference in turnover rates between accounts where the adviser has complete investment authority and no authority is 10 percentage points.
The direction of the effect is the same for all account types. The magnitude is 6.4 percentage points for registered investment companies, 11.0 for institutional and corporate accounts and 10.0 for individual and personal trust accounts. e. Federal income tam liability
It is typically suggested that accounts of clients in high income tax brackets will have lower turnover rates in order to reduce, to defer or even through retention until death, to avoid the payment of capital gains taxes. The hypothesis is supported by the results for the total number of ·accounts, when taken as a whole, which show that higher Federal income tax brackets are negatively related to account turnover rates.
A 10 percent increa·se in Fideral income tax bracket is, on the average, associated with a 0.5 percentage point reduction in turnover rate. This difference is largely due to the higher turnover rates -of institu-

173
tional and corporate accounts of clients in low or zero tax positions relative to individual accounts, which on the average have lower turnover rates and high tax brackets.
The situation within various account types (where the range of tax position is typically mucll smaller than for the total nwnber of accounts) shows little impact of taxes. In contrast to the totals for all accounts as a whole, in the cast of individual accounts the analysis shows that accounts of individuals in higher 'tax positions on the average have slightly higher turnover rates, indicating that the account of typically wealthier clients are being more actively managed.
f. Broker-Dealer affiliation Accounts which are advised by advisory affiliates of firms doing a
brokerage business tend to be turned over somewhat more rapidly than accounts advised by advisers not affiliated with firms doing a brokerage business. For the total number of accounts, all other factors being the same, a broker-dealer affiliated advised account will have a 1.7 percentage point higher turnover rate. The effect differs in size and magnitude among the various account types. Broker-dealer affiliated advised registered investment companies have a 3.7 percentage point higher turno'Ver rate than those advised by an adviser not affiliated with a broker-dealer. For individual and personal trust accounts, the increase is 2.7 percentage points. Corporate and employee benefit accounts advised by broker-dealer affiliated advisers tend to have lower turnover rates than similar accounts whose adv,isers are not so affiliated.
Table IV -31 displays the turnover rates for broker-dealer and non-broker-dealer advised accounts. The average turnover rate for the non-broker-dealer accounts is 20.9 percent, as opposed to 22.9 percent for broker-dealer advised accounts. While Table IV-31 shows the differences in average turnover rates by type of adviser, the turnover differentials described above are better mdicators of the impact of the brokerage affiliation than the distributions shown in the table. The reason is that the previous analysis controls for differences in other factors which are also related to turnover rate, such as investment objective and discretionary authority, which is not the case in Table IV -31. g. Trading 8tatu,8 of the a(}co'U!nt
The extent to which the adviser places purchase or sale orders for client accounts was in general unrelated to turnover rate for all account classes except individual and personal trust accounts. For this class of accounts, the difference in average turnover rate between accounts for which the adviser placed orders more than 50 percent of the time and ~ccounts for which the client placed his own brokerage orders was approximately 2 percentage points. The higher turnover rates were, on the average, associated with accounts where the adviser placed the orders.
h. Allocation of brokeraqe Greater authority delegated to the adviser to select broker-dealers
for security transactions had a mixed effect on turnover rates among the various classes of accounts. Greater adviser freedom was associated

174
with increases in turnover rates for employee benefit and non-profit organization accounts and lower turnover rates for indiv-idual and personal trust accounts. The impact on turnover of this factor, while statistically significant, tends to be very small-less than 1/10 of a percentage point. i. Size of the advisory complex
The size of total assets under advisement in the advisory complex was statistically significantly related to turnover rates for three classes of accounts--non-registered investment companies, employee benefit accounts and individual and 1?ersonal trust accounts. In each case, accounts advised in large advIsory complexes tended to have lower turnover rates. A 100 percent increase in size of the advisory complex was associated with a 3.0 percentage 1?oint reduction in turnover rate for non-registered investment compames, a 1.0 percentage point reduct.ion for employee benefit plans and a 0.4 percentage point reduction for individual and personal trust accounts. The effects for other classes of accounts are small, of mixed direction and not statistically significant. j. Mutual fund complex variable
The fund complex factor was included to assess any differences in turnover rates that existed for accounts advised in mutual fund complexes.37 The results of the analyses indicate that accounts advised in mutual fund complexes tend to have substantially higher turnover rates. This finding holds for all classes of accounts. Were all other factors to be the same, registered investment companies in fund complexes would have a 27 percentage point higher turnover rate. For institutional and corporate accounts the rate lllcreases range from 7.0 percentage points for employee benefit plans to 15.0 percentage points for insurance company accounts. Individual and personal trust accounts advised in fund complexes on the average had a 8.5 percentage point higher turnover rate. The average increase in turnover rate for the total number of accounts was 10.0 percentage points.
8'1 Fifty-three of the 158 respondent firms had more than one-third of the total dollar value of advisory assets represented by registered Investment companies and were thus classified as fund complexes.

ACCOUNT TYPE
1. Registered Investment Companies
2. Nonregistered Investment Companies
3. Employee Benefit Plans
4. Insurance Companies
5. Nonprofit Organizations
6. Corporate Accounts
7. Individuals and Personal Trust
8. Other Accounts
9. Total Accounts
TABLE IV-15
AVERAGE AGES OF ADVISORY ACCOUNTS
NUMBER OF ACCOUNTS AVERAGE AGE (YEAR)
320 14.0
187 4.4
3027 4.8
347 7.8
2063 8.6
1058 8.6
34529 8.6
587 8.1
42118 8.4
STANDARD DEVIATION OF AGE (YEAR)
13.2
5.8
4.9
8.1
8.3
10.0
8.6
9.3
8.5
..... ""-l 01

TABLE IV-16
DISTRIBUTION OF ADVISORY-ACCOUNT ESTABLISHMENT YEARS
ACCOUNT PERCENTAGE OF ACCOUNTS ESTAB ISHED BY YEAR TYPE 1960-
1969 1968 1967 1966 1965 1964 1963 1962
1. Registered Investment Companies 7.8 15.0 10.9 7.2 4.7 2.8 1.2 6.6
2. Nonregistered Investment Companies 19.0 30.0 16.6 6.1 2.8 5.3 1.6 8.5
3. Employee Benefit Plans 20.0 21.8 14.8 9.3 6.5 4.0 4.3 8.3
4. Insurance Companies 15.8 16.9 12.3 5.2 6.3 3.7 3.2 10.9
5. Nonprofit Organizations 11.3 18.8 9.4 6.3 4.4 4.0 4.0 9.8
6. Corporate Accounts 12.5 19.5 12.6 7.1 6.2 4.0 3.6 9.2
7. Individuals and Personal Trust 11.0 15.6 1l.1 8.0 5.9 4.8 4.1 10.9
8. Other Accounts 10.0 21.6 10.0 4.0 6.1 12.6 3.3 8.8
9. Total Accounts 11.8 16.5 t1.4 7.9 5.9- 4.8 4.0 10.5
1950-1959
15.0
8.1
9.7
16.3
22.9
14.8
18.2
14.2
17.6
1949 or before
28.7
2.0
1.4
9.5
9.2
10.3
10.4
8.8
9.7
\
.... -..t ~

TABLE IV-17
AVERAGE SIZES OF ADVISORY ACCOUNTS
AVERAGE GROSS ACCOUNT TYPE INVESTMENT ASSETS (MILLIONS)
1. Registered Investment Companies $173.8
2. Nonregistered Investment Companies 2.4
3. Employee Benefit Plans 5.4
4. Insurance Companies 12.7
5. Nonprofit Organizations 5~3
6. Corporate Accounts 3.0
7. Individuals and Personal Trust 0.6
8. Other Accounts 1.6
9. Total Accounts 2.6 --- -- - ----- -- --
STANDARD DEVIATION (MILLIONS)
365.3
1.6
27.1
2.2
36.8
2.1
2.5
4.1
37.6 - -- -- - -- -- -
I-' '-l '-l

ACCOUNT Type
1. Registered Investment Companies
2. Nonregistered Investment Companies
3. Employee Benefit Plans
4. Insarance Companies
5. Nonprofit Organizations
6. Corporate Accounts
7. Individuals and Personal Trust
8. Other Accounts
9. Total Accounts
TABLE IV-18
DISTRIBUTION OF ADVISORY ACCOUNT ASSET SIZES
PERCENTAGE OF ACCOUNTS BY SIZE CATEGORY (MILLIONS OF DOLLARS) Less than 0-001- 0.1 - 0.5 - '1.0- 5.0 - 25.0- 50.0 - 100.0 - Greater Than 0-001 0.1 0.5 1.0 5.0 25.0 50.0 100.0 500.0 500.0
0.0 0.6 1,.7 3.1 9.4 21.2 13.1 16.9 22.2 8.7
0.8 7.3 27.1 9.8 8.3 l3.0 3.2 0.4 0.0 0.0
0.1 10.9 34.6 16.5 23.0 11.0 2.3 0.8 0.9 0.1
0.6 2.6 7.4 8.6 43.3 27.8 5.7 2.6 1.1 0.3
0.0 9.8 32.5 17.7 27.7 9.7 1.1 0.7 0.6 0.0
0.5 14.0 33.3 13.8 23.5 12.8 1.6 0.5 0.1 0.0
0.1 19.4 54.8 14.9 9.8 0.9 0.1 0.0 0.0 0.0
2.1 18.3 38.9 16.4 18.5 4.2 1.5 0.2 0.0 0.0
0.1 17.9 50.6 15.0 12.5 2.9 0.5 0.3 0.3 0.1
...... -.:r 00
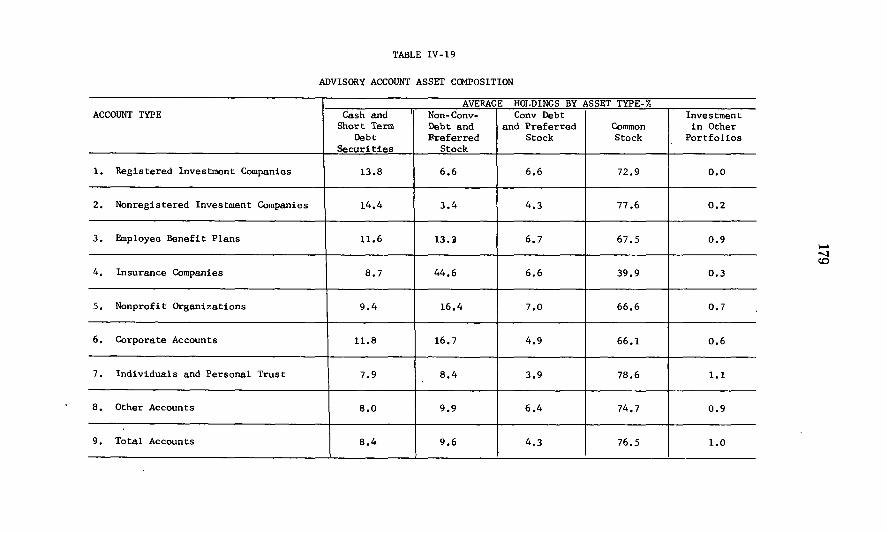
ACCOUNT TYPE
1. Registered Investment Companies
2. Nonregistered Investment Companies
3. Employee Benefit Plans
4. Insurance Companies
5. Nonprofit Organizations
6. Corporate Accounts
7. Individuals and Personal Trust
8. Other Accounts
9. Total Accounts
TABLE IV-19
ADVISORY ACCOUNT ASSET COMPOSITION
AVERAGE HOLDINGS BY ASSET TYPE-% Cash and Non-Conv- Conv Debt
Short Term Debt and and Preferred Common Debt Breferred Stock Stock
Securi ties Stock
13.8 6.6 6.6 72.9
14.4 3.4 4.3 77.6
11.6 13.l 6.7 67.5
8.7 44.6 6.6 39.9
9.4 16.4 7.0 66.6
11.8 16.7 4.9 66.1
7.9 8.4 3.9 78.6
8.0 9.9 6.4 74.7
8.4 9.6 4.3 76.5
Investment in Other
Portfolios
0.0
0.2
0.9
0.3
0.7
0.6
1.1
0.9
1.0
I-' ""-l <:0

TABLE IV-20
DISTRIBUTION OF ADVISORY Accourrr COMMON STOCK HOLDINGS
PERCENTAGE OF ACCOUNTS WITH SPECIFIED COMMON STOCK HOLDINGS 0% 10% 20% 30% 40% 50% 60% 70%
0 - - - - - - - -10% 20% 30% 40% 50% 60% 70% 80%
1. Registered Investment Companies 4.1 0.6 0.9 1.9 0.9 5.6 6.9 14.1 18.5
2. Nonregistered Investment Companies 2.4 0.4 1.2 1.2 3.7 3.7 7.3 13.5 13.9
3. Employee Benefit Plans 3.7 1.6 1.3 1.9 3.3 6.6 11.7 17.7 19.5
4. Insurance Companies 12.3 15.8 12.0 10.3 7.2 6.9 4.3 6.6 5.2
5. Nonprofit Organizations 3.1 1.0 1.6 2.0 3.1 6.5 13.0 23.0 21.9
6. Corporate Accounts 11.9 1.8 1.4 2.7 3.6 3.8 6.6 8.8 14.7
7. Individuals and Personal Trust 1.1 0.3 0.6 1.0 1.5 2.9 5.8 12.5 20.6
8. Other Accounts 4.8 1.3 0.4 1.1 2.1 4.4 7.8 11.8 17.7
9. Total Accounts 1.9 0.6 0.8 1.2 1.8 3.5 6.6 13.2 20.2
80% -
90%
23.8
24.9
17.0
3.7
13.2
16.9
22.0
17.3
20.9 -
90% -
00%
22.6
27.8
, 15.9:
:
15.8 '
11.6
27.7
31.6
31.2
29.1
tOO o
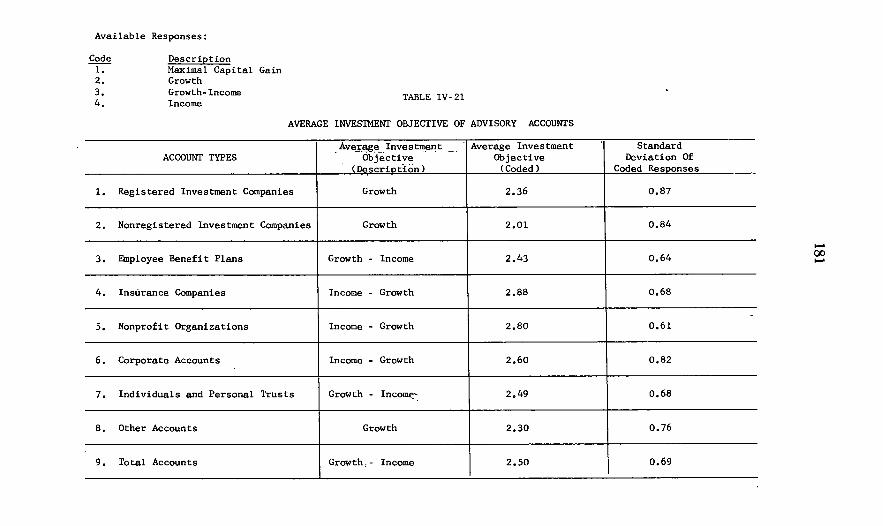
Available Responses:
Code l. 2. 3. 4.
Description Maximal Capital Gain Growth Growth-Income Income TABLE IV-2l
AVERAGE INVESTMENT OBJECTIVE OF ADVISORY ACCOUNTS
_ AV~:F_~~ __ Inves t~n t __ _ ' Average Investment ACCOUNT TYPES Objective Objective
(Description) (Coded)
1. Registered Investment Companies Growth 2.36
2. Nonregistered Investment Companies Growth 2.01
3. Employee Benefit Plans Growth - Income 2.43
4. Insurance Companies Income - Growth 2.88
5. Nonprofit Organizations Income - Growth 2.80
6. Corporate Accounts Income - Growth 2.60
7. Individuals and Personal Trusts Growth - IncomE:"-_ 2.49
8. Other Accounts Growth 2.30
9. Total Accounts Growth; - Income 2.50 ----_._-
Standard Deviation Of
Coded Responses
0.87
0.84
0.64
0.68
0.61
0.82
0.68
0.76
0.69 ---
-
---
.-00 .-

TABLE IV-22
DISTRIBUTION OF ADVISORY ACCOUNT INVESTMENT OBJECTIVES
PERCENTAGE OF ACCOUNTS BY INVESTMENT OBJECTIVE Maximal
I
/
ACCOUNT TYPES Capital Growth-Gain Growth Income
1. Registered Investment Companies 17.5 39.1 33.4
2. Nonregistered Investment Companies 32.4 42.5 20.6
3. Employee Benefit Plans 5.6 48.6 42.5
4. Insurance Companies 1.7 24.6 57.9
5. Nonprofit Organizations 3.0 23.2 65.0
6. Corporate Accounts 7.5 42.8 35.7
7. Individuals and Personal Trusts 6.2 43.5 45.6
8. Other Accounts 12.6 46.1 36.8
9. Total Accounts 6.3 42.7 45.8 - -- ---- -
Income _~
10.0
4.5
3.3
15.8
-8.9
14.0
4.7
4.6
5.2 ---
-00 t-.:)
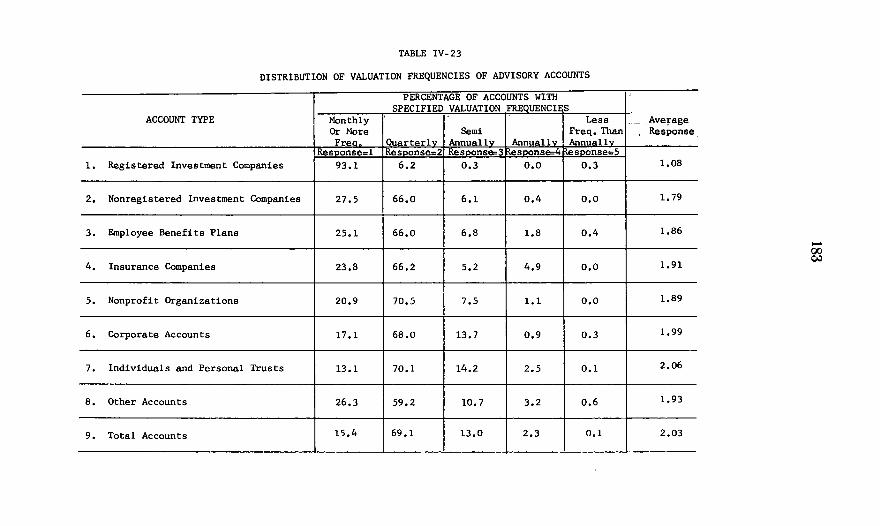
TABLE IV-23
DISTRIBUTION OF VALUATION FREQUENCIES OF ADVISORY ACCOUNTS
PERCENTAGE OF ACCOUNTS WITH SPECIFIED VALUATION FREOUENCII S
ACCOUNT TYPE Monthly Less Or More Semi Freq. Than Fren IOllArterlv Annuallv Annuallv Annuallv
ResDonse_l ResDonse=2 ResDonse:3 IResDonse:4 ResDonse=5 1. Registered Investment Companies 93.1 6.2 0.3 0.0 0.3
2. Nonregistered Investment Companies 27.5 66.0 6.1 0.4 0.0
3. Employee Benefits Plans 25.1 66.0 6.8 1.8 0.4
4. Insurance Companies 23.8 66.2 5.2 4.9 0.0
5. Nonprofit Organizations 20.9 70.5 7.5 1.1 0.0
, 6. Corporate Accounts 17.1 68.0 13.7 0.9 0.3
7. Individuals and Personal Trusts 13.1 70.1 14.2 2.5 0.1
8. Other Accounts 26.3 59.2 10.7 3.2 0.6
9. Total Accounts 15.4 69.1 13.0 2.3 0.1
,
... _ Average Response.
- .
1.08
1. 79
1.86
1.91
1.89
1.99
2.06
1.93
2.03
I-' 00 c.:I

TABLE IV-24
DISTRIBUTION OF DISCRETIONARY AUTHORITY RESPONSES
PERCENTAGE OF ACCOUNTS WITH SPECIFIED ACCOUNT TYPE DEGREE OF DELEGATED AUTHORITY TO ADVISER
\ Complete . Consul ts Consults No Authority Sometimes Often Authority
Resoonse-l Resoonse=2 ResDonses-3 ResDonse=4
1. Registered Investment Companies 75.3 1.9 1.6 21.2
2. Unregistered Investment Companies 55.9 6.9 9.7 27.5
3. Employee Benefits Plans 39.3 7.4 6.3 47.0
4. Insurance Companies 12.3 2.9 6.0 78.9
5. Nonprofi t .'.Organizations 21.1 5.9 6.2 66.8
6. Corporate Accounts 21.6 6.9 7.6 64.0
7. Individuals and Personal Trusts 26.2 8.0 9.8 56.1
8. Other Accounts 40.4 19.2 5.9 34.5
9. Total Accounts 27.4 7.8 9.1 55.6 . ------
Average Respon-ses For Account
Tvoe
1.7
2.2
2.7
3.6
3.2
3.2
3.0
2.7
2.9
Standard Deviation
bf Resoonses
1.2
1.3
1.4
1.0
1.2
1.2
1.3
1.3
1.3
..... 00 ~

185
TABLE IV-25
FEDERAL INCOME TAX LIABILITY
INDIVIDUAL AND PERSONAL TRUST ACCOUNTS
Federal Income Number Percentage
Tax Of Of Bracket * Accounts Accounts
Tax Exempt (Zero) 329 1.0
0-30% 7255 21.0
30%-50% 10,969 31.8
50% and Above 7871 22.8
Not Known 8106 23.5
* Upper end of range included in range.
53-940 0 - 71 - pt. 2 -- 5

TABLE IV-26
DISTRIBUTION OF NUMBER OF PARTICIPATING ACCOUNTS IN POOLED ACCOUNTS
No. of NUMBER OF PARTICIPATING ACCOUNTS ACCOUNT TYPE Pooled 1 - 500- 1000 - 5000 - 10000 -
Accounts 500 1000- 5000 10000 20000
1- Registered Investment Companies 308 52 20 57 24 46
2. Unregistered Investment Companies 138 122 2 9 2 1
3. Employee Benefits Plans 69 62 1 1 3 1
4. Insurance Companies 1 1 0 0 0 0
5. Nonprofit Organizations 28 27 1 0 0 0
6. Corporate Accounts 31 31 0 0 0 0
7. Individuals and Personal Trusts 884 843 0 3 5 12
8. Other Accounts 134 132 0 0 0 1
9. Total Accounts 1593 1270 24 70 34 61 - -- -- -- - --
20000 and above
109
2
1
0
0
0
21
1
134
Average Number Of
Accounts
3169
464
592
96
56
29
220
139
814
---
~ 00 ~

TABLE IV-27
DISTRIBUTION OF ADVISORY ACCOUNT TRADING ARRANGEMENTS
PERCENTAGE OF ADVISORY ACCOUNTS BY RESPONSE TYPE ACCOUNT TYPE Trading Account Trad. Dept. Account Trading
Dept Mgr. 1lc Act. Mgr. Mgr. Dept "750% ., 50% 50% <" 50% ",50%
1. Registered Investment Companies 71.6 17.5 0.0 1.6 1.2
2. Unregistered Investment Companies 26.7 55.1 0.0 1.2 2.0
3. Employee Benefits Plans 21.5 45.8 1.2 2.5 4.2
4. Insurance Companies 20.1 22.9 3.2 6.6 6.0
5. Nonp~afit Organizations 24.4 36.0 0.4 2.8 5.7
6. Corporate Accounts 15.3 34.0 0.5 9.0 2.7
7. Individuals and Personal Trusts 22.1 41.9 0.7 1.8 2.4
8. Other Accounts 13.1 59.0 1.1 1.9 2.7
9. Total Accounts 22.3 41.6 0.7 2.1 2.7
- ----- ---- - -- ---- ------ ----
Do Not Trade
8.1
15.0
24.8
41.3
30.7
38~2
31.2
22.1
30.6
..... 00 ~

TABLE IV-28
DESIGNATION OF BROKERAGE BY ADVISORY CLIENTS
PERCENTAGE OF AC OUNTS DESIGNATING BROKERAGE Less Than More Than Adviser Does
15% 15-85% 85% of Not Place Or-0% Brokerage Brokerage Brokerage Brokerage ders - 100% Desienated Desil!Ilated Desienated Desienated Desie:nated 1. Registered Investment Companies 65.0 3.4 7.8 19.7 4.1
2. Nonregistered 47.4 2.4 7.7 28.3 14.2
3. Employee Benefits Plans 27.4 2.3 7.8 40.3 22.2
14. Insurance Companies 20.9 3.4 8.6 28.9 38.1
5. Nonprofit Organizations 27.7 1.8 4.7 33.7 32.0 I
·6. Corporate Accounts 19.1 1.2 4.4 39.0 36.2 I
7. Individuals and Personal Trusts 28.7 0.7 4.4 36.2 30.0
8. Other Accounts 36.0 1.0 2.5 40.4 29.2
19
• Total Accounts 28.7 0.9 4.7 36.3 29.4
Average %
Designated By
Client
27.0
51.0
63.1
72.4
64.5
75.4
65.4
59.4
65.4
Standard Deviation
Of Amount
DesiEnated
40.5
45.4
42.0
39.6
43.8
38.2
43.0
45.6
43.4
I-' 00 00

TABLE IV-29
DISTRIBUTION OF ADVISORY ACCOUNT TURNOVER RATES
PERCENTAGE OF ACCOUNTS BY TURNOVER RATE Average Standard Over \ Turnover Deviation
o - 10% 10 - 50% 50 - 100% 100% Rate-% Of Turnover Rates - %
1. Registered Investment Companies 16.9 44.7 20.9 17.5 56.7 49.0
2 •• Nonregistered Investment Companies 18.2 51.8 15.4 14.6 47.1 43.3
3. Employee Benefits Plans 29.4 59.8 7.6 3.2 27.7 23.8
- -4. Insurance Companies 48.1 47.0 2.3 2.6 20.6 22.3 ~
5. Nonprofit Organizations 45.7 49.0 3.9 1.4 21.1 20.4
6. Corporate Accounts 42.1 51.5 5.8 0.7 23.1 21.0
7. Individuals and Personal Trusts 49.1 46.4 4.0 0.5 20.2 19.4
8. Other Accounts 47.8 41.5 8.0 2.7 24.0 26.7
9. Total Accounts 46.9 47.6 4.5 1.0 21.3 20.8

TABLE IV-30
ANALYSIS OF ACCOUNT TURNOVER DATA
g~tK~g~6nt Regression Coefficients and T Values CONST INDEP. VAR YEAR ASST OBJT AUTH TAX BR.D TRAD BROK SIZE FUND
Reg. Inv. 293
REG. COEF. -5.8434 1.0795 -18.3410 -1. 6469 -0.2239 3.7410 7.4057 0.0502 1.7699 27.8735 65.1 Co. T STAT. -1. 97 0.64 -5.50 -0.61 -0.65 0.44 1. 17 0.67 0.80 3.91
Non-Reg. 187 REG. COEF. 3.8597 0.5938 -15.4881 -3.0104 -0.6178 -12.9302 2.8461 -4.1345 Inv. Co. 0.0062 15.1596 106.2 T STAT. 1.21 0.35 -4.19 -1.11 -4.05 1.86 0.60 0.09 -2.69 2.19
Employee 2716
REG. COEF. -1.1823 0.4645 -8.0292 -1. 9798 -0.0468 -1.3249 -0.6650 0.0802 -1. 3250 6.9815 58.2
Benefit Plans T STAT. -2.16 1.77 -11. 38 -5.61 -0.60 -1.37 -1.15 7.12 -4.24 5.23
Insurance 320
REG. COEF. -0.8702 -0.8396 -4.4365 -3.8949 -0.0228 3.3680 -1.8635 0.0723 0.0405 15.2187 47.8 Co. T STAT. 0.66 -0.99 -2.25 -2.86 -0.34 1.09 -1.13 1.82 0.04 3.50
Non Profit 1662 REG. COEF. -1.3563 0.4166 -6.1475 -2.9572 -0.0132 5.8340 -0.6670 0.0332 0.0797 9.1236 46.8
Organizations T STAT. -2.74 1.41 -7.82 -6.67 -0.16 4.86 -1.02 2.54 0.23 6.12
Corporate REG. COEF. 1.6654 0.4558 -6.3760 -3.0454 -0.0044 -3.3906 0.1918 0.0310 0.2616 9.6737 43.8 991
Accounts T STAT. 2.48 1.09 -6.94 -4.61 -0.12 -2.12 0.21 1.60 0.56 5.50
Individual & REG. COEF. -2.3628 -0.2923 -6.5568 -2.2880 0.0182 2.7201 0.9360 -0.0060 -0.4795 8.4872 45.6 Personal 30952 T STAT. -22.51 -3.04 -42.88 -24.64 2.56 10.30 6.61 -2.08 -7.52 27.34
Trusts
Other REG. COEF. -4.2966 0.8946 -11. 7409 -1.0921 0.0691-14.1366 2.5000 -0.0511 -0.7131 13.3678 65.8 Accounts 359 0.91 -6.07 -0.79 1.02 -4.15 1.18 -1.30 -0.76 2.23 T STAT. -2.82
Total REG. COEF. -2.4910 1. 0802 -7.1806 -2.4641 -0.0584 1.6653 0.4924 0.0104 -0.5110 9.9961 53.5
(All 37480 T STAT. -24.47 15.18 -48.80 -27.62 -11.49 6.62 3.55 3.76 -8.19 32.96 Accounts)
REGRESSION EQUATION
TURN = CONST + b1
LOG (YEAR) + b2
LOG(ASST) + b3
(OBJT) + b4
(AUTH) + b5
(TAX) + b6
(BR.D) + b7
(TRAD) + b8
(BROK)
+ b9
LOG (SIZE) + b10
(FUND)
2 R
0.23
0.41
0.14
0.15
0.14
0.16
0.18
0.34
0.18
...CO o

TABLE IV-31
EFFECT OF BROKER-DEALER AFFILIATIONS ON TURNOVER RATES
NON BROKER-DEALERS
- . No. of No. of Average No. of -_& .<
•• _ _ • ~ -.._ •• J •• ~. Advisers Accounts Turnover Advisers ACCOUNT TYPE (%)
1. Registered Investment Companies 62 262 57.9 19
2. Nonregistered Investment Companies 36 166 42.2 18
3. Employee Benefit Plans 64 2,007 27.7 27
4. Insurance Companies 41 256 20.0 13
5. Nonprofit Organizations 58 1,341 19.8 25
6. Corporate Accounts 54 794 23.6 20
7. Individuals and Personal Trust 84 25,052 19.7 29
B. Other Accounts 34 259 28.5 12
9. Total Accounts 118 30,137 20.9 39
BROKER-DEALERS No. of Average
Accounts Turnover (%)
42 49.9
52 61.3
812 27.8
73 23.9
432 25.6
234 21.4
7,536 22.0
109 14.3
9,290 22.9
~ ~ ~

1.
2.
3.
4.
5.
6.
7.
8.
9.
TABLE IV-32
TURNOVE~=~XE.:s-=FQi. ·~C!;qQ!i't~ J1f!.NA.~ID> .Ui }1WUAL· fIiND··-q)r:wL."EXE~ ~ : ..
NON-FUND COMPLEX ACCOUNTS FUND COMPLEX ACCOUNTS No. of No. of Average No. of No. of Average
Advisers Accounts Turnover Advisers Accounts Turnover ACCOUNT TYPE (%) (%)
Registered Investment Companies 28 69 35.9 53 235 62.9
Nonregistered Investment Companies 36 170 40.1 18 48 70.3
Employee Benefit Plans 70 2,468 26.3 21 351 37.6
Insurance Companies 42 301 19.3 12 28 37.3
Nonprofit Organizations 66 1,580 20.0 17 193 30.7 .
Corporate Accounts 56 864 20.8 18 164 35.0
Individuals and Personal Trust 90 28,787 18.8 23 3,801 31.2
Other Accounts 36 332 22.4 10 36 41.9
Total Accounts 105 34,571 19.6 53 4,856 33.8
I-' <:0 t...:l

193
Table IV-32 presents the average turnover rates for funds advised in non-fund and fund complexes. The average turnover rate for accounts ill non-fund advisory complexes was 19.6 percent; the figure for accounts in fund complexes was 33.8 percent. As was discussed in the case of the broker-dealer affiliations of advisers, part of the differences between turnover rates shown in Table IV -32 can be explained in terms of differences in other factors between the two groups of accounts. The turnover rate differences obtained via the initial "other things the same" analysis are the most relevant for compariroll purposes.
C. COMPETITION FOR NEW ACCOUNTS
1. Introduction
The purpose of this section is to describe the methods used by advisory firms to .obtain new client accounts. The areas examined include the origin of new accounts, the successor advisory relationships of terminated account?, restrictions placed upon minimum fee and asset sizes for new accounts and the· Importance .of various promotional devices for obtaining new business.
The data were obtained from the 1-14 and 1-65 Investment Adviser Questionnaires. For each account in the 1-14 sample which was started or terminated between January 1, 1969 and September 30, 1969, the adviser was asked to designate a code indicating the predecessor or successor account adviser. This information was obtained for 10,605 new accounts and 5,737 terminated accounts.
The remaining data are from the 1-65 questionnaires. The 132 firms in that sample were asked to specify whether they required either a minimum size of asset or size of fee requirement for new accounts and if so, how much were the amounts. They were also asked to state the relative imp.ortance of the following promotional devices to obtain new accounts or additional subscriptions for existing accounts: (a) Advertising (Newspapers, TV, etc.); (b) Direct mail promotional lIterature; (c) Own retail sales force.
To gauge changes in the relative importance of these methods, the 1-65 sample firms were requested to respond for both 1964 and 1969.
In addItion, the advisers were asked to specify the importance of the following sources of client referrals to the achieving: of new accounts for their firms: (i) Referrals by broker-dealers; (Ii) Referrals by existing or former advisory clients. The importance of these categories was obtained for 1969 only.

194
The degree of importance used for responding to the above pro-motional qnestions were as follows:
1. Very important, always used. . 2. Important, used often but not always. :3. Somewhat important, used sometimes but not frequently. 4. Not important, used only infrequently or rarely. 5. Unimportant, never used. To supplement these quantitative responses, the advisers were reo
quested in Part B of the 1-65 questionnaire to submit a written descriptIOn of the procedures used to attract new accounts and any major changes in promotional methods implemented during the past five years.
The responses to these questions are summarized in the following pages.
2. New and Terminated Accounts
The data on new and terminated accounts from the 1-14 sample show a substantial movement of advisory accounts. The data are summarized in Table IV-:3:3. The table presents the total number of 1-14 accounts, the number of new accounts, the number of terminated accounts nnda movement ratio for each account class. The ratio at which advisory clients move their accounts is computed by taking the lesser of new and terminated accounts divided by the total number of accounts as of September :30, 1969. The ratios have been normalized to 'a twelve-month base (i.e., multiplied by 1.:3:3). The results indicate an 'average annual rate of movement of approximately 18 percent. Employee benefit accounts (one of the newer classes of adviser clients) show a higher than average movement rate. The results indicate a surprising degree of mobilIty on the part of institutional, corporate and individual clients.
:3. Origin of New Accounts
Table IV-:34 summarizes the data on the advisory status of the accounts previous to their becoming clients of the advisers responding to the questionnaire. The responding advisers were asked to indicate whether the account had come to them from a (an) :
1. Individual or Non-financial Institution; 2. Bank or Trust Company; :3. Investment Advisory Firm; 4. Insurance Company ; 5. Brokerage Firm not designated thereafter for brokerage
from the account; 6. Brokerage Fi.rm which thereafter received less than 50% of
the brokerage from the account; 7. Brokerage Firm which thereafter received more than 50%
of the brokerage from the account; 8. Other Financial Institution; 9. Unknown.
The primary observation from the table is that most advisers profess to be unaware of the previous advisory relationships of their new accounts. Significantly, however, It substantial portion of advisory

195
accounts whose previous adviser was identified came from bank advisers. This pattern is particularly pronowlced for employee benefit accounts, where 19 percent of new employee benefit accounts were previously 'advised by banks. This figure represents approxima~ly 60 J?ercent of the employee benefit accounts where the respondmg ad vlser was able to specify the previous adviser.
4. Destination of Terminated Accounts
Table IV-35 summarizes the data on the advisory status of the accounts after they had ceased to be clients of the advisers responding to the questionnaire. The responding advisers were asked to indicate whether the account, upon leaving them, had gone to a (an):
1. Individual or Non-financial Institution; 2. Bank or Trust Company; 3. Investment Advisory Firm; 4. Insurance Company; 5. Brokerage Firm; 6. Other Financial Institution; 7. Death of Client-Successor -adviser chosen; 8. Death of Client-Assets distributed; 9. Unknown.
Again, the most prominent observation is that the advisers profess to be largely unaware of the advistory stat.us of their ter:minated accounts. Of the accounts for which de~ignation was made, the most prominent successor category is another investment advisory firm, indicating again account mobility ,yithin t.his industry.
5. Minimum Asset and Fee Requirements for New Accounts
As previously indicated, for the tables produced from the 1-65 data, the respondents have been stratified into "fund" and "non-fund" complexes and into "large" and "small" firms.
Table IV -36 presents the proportion of firms with minimum stated asset or minimum fee requirements for new accounts other than registered investment company accounts. The data indicate that large firms are more likely to have minimums t.han small firms. The data also indicate that some firms have both minimum asset and minimum fee requirements.378
Tables IV -37 and IV -38 summarize the distribution of responses to the minimum asset and minimum fee questions. The tables indicate that fund complexes have higher minimum asset and minimum fee requirements for their non-fund clients than do non-fund complexes, and that small firms have lower minimum asset and minimum fee requirements than la.rge firms. The minimum fee size averages $1,610 for fund complexes and $906 for non-fund complexes .
• 7. The Study's examination Indicates that while many firms have substantial minimums for separately managed accounts, firms with such minimums also advise mutual funds which proylde an adYlsory vehicle for clients with small amounts of savings. It is also common for the mutual funds managed by firms with large separately managed account operations to have no sales lond. In these cases the funds are primarily a vehicle for "In-house" pooled management of small accounts rather than aggressively promoted (In terms of sales compensa tlon) equl ty products.

196
6. Promotional Methods Used to Obtain New Accounts or Additional Subscriptions for Existing Accounts
Tables IV -39 through IV -41 present frequency distributions for the responses to the questions on the relative importance of specific promotional methods.
Table IV-39 contains the results on use of advertising during 1964 and 1969. The prominent result is the virtual lack of importance of advertising as a promotional method. Only approximately two percent of the respondents considered advertising to be very Important in both 1964 and 1969 while more than half said that it was so unimportant that it was never used. Fund complexes rated advertising slightly more important to them than non-fund complexes. Since advertising is typically one of the lowest cost promotional devices for American business, the reasons for this lack of usage may be regulatory constraints.ss Another reason may be that investment counsel consider themselves to be professionals and like lawyers, doctors, etc., do not consider it proper to advertise.
Table IV -40 summarizes the responses to the promotional literature question. Direct mail promotIOnal literature is seen to be less frequently used than advertising. The reasons for this may be similar to those relating to advertising.
Table IV -41 summarizes the responses regarding the importance of the adviser's own retail sales force. For the entire sample, 56 percent of the advisers responded that for 1964 their own retail sales force was "unimportant, never used," while 48 percent made this response for 1969. To the extent that this promotional method is used, it appears that fund complexes rely more heavily on in-house sales forces than non-fund advisory complexes. The results show a somewhat greater relative importance of tlie adviser's own retail sales forces in 1969 compared to 1964.
7. Importance of Referrals
Table IV -42 presents the summary of responses to the question of the importance of referrals (a) by broker-dealers and (b) by existing or former clients to the achieving of new accounts for the responding advisory firms. The data are for 1969 only. Broker-dealer referrals are most important to fund complexes, and somewhat more important for lll.rger vs. smaller advisory complexes. Client referrals are of greater importance for non-fund advisory complexes, particularly large firms in this category.
88 The C~mmlsslon's rules with respect to advertising by Investment advisers are described In sec. A of this chapter. In addition to these rules, the Commission has issued a Statement of Policy concerning the use of advertising and supplemental sales literature In thp sale of Investment company shares. This Statement of Policy. which Is reproduced at CCH Fed. Sec. L. Rep. at § 48.902. describes certain practices wlolch the Commission will consl"er "materially mlsleadln~." Moreover. during the period between the filing of the registration statement covering mutual fund shares which are to be Issued to the public and the date on which the reg\stratl~n statement becomes effective (the so-called "waiting period"). Rule 134 under the SE'Curltles Act of 19?3. 17 CFR 2.~0.134. limits the content of any advertisement or other communications with any person concerning the shares to be offered which may be made without being accompanied by a statutory prospectus.

TABLE IV-33
Rate at Which '~dvisory Clients Move Their Accounts
- 2 - 3 - 4
NUMBER OF -NUMBER OF NUMBER OF NEW TERMINATED RATE
CLASS OF ACCOUNTS ACCOUNTS ACCOUNTS (ANNUAL) ACCOUNT (SEPT. 30, 1969) (JAN.-SEPT. 1969) (JAN. - SEPT. 1969) %
Non R~gist~red I,nyestment Co. 358 104 43 16 :-6 Em~loyee Benefit 3 027 1 181 608 26.7 Insurance Co. 347 113 66 25.3 Non Profit Organization 2,063 466 216 13.9 Corporate Accounts 1,059 539 211 20.5
Indi vidua 1 & Personal Trus ts 34,529 8,124 4,545 17.5 .
Other 414 1 78 48 15.4
TOTAL * ! I I 18.~ 41,797 I 1°2 605 5,737
* Regiscered investment companies rarely, if ever, change their investment adviser, and their movement rate would, therefore. be around zero. For a discussion of this phenomena, see the Commission's report on Public Policy Implications of Investment Company Growth, H.R Rep. No. 2337, 89th Congress, 2nd Session 125-132 (1966).
...... -0 -..:)

TABLE IV-34
ORICV1ATIOi\ 'OF '?'lEI.] ACCOUNTS
CATEGORIES 0F PREVIOUS INVESTMENT ADVISER
1 2 3 4 5 6 7 8 9
Individual or aonfinancial Institution Bank or Trust Company Investment Advisory Firm Insurance Company Brokerage Firm not designated thereafter for brokerage from the account Brokerage Firm which thereafter ~eceived Lel?s than 50~~ of the ~~~1.<~~~g~_!,r~~ __ th~_accoimt Brokerage Firm which thereafter t.eceived more than 50/~ of the brokerage from the account Other Financial Institution Unknown
I ;lUNBm I OF - _. ~.~. .. . : - -
I DI STRllllJT ION .oF ~_ESPONSES BY CATEGORY OF ,PRruTIOT]S ADV-ISER .. ¢O
ACCOUNT TYPE J NJ:W
ACCOUNTS CAT 1 r CAT 2 CAT 3 CAT 4 .CAT.5, CAT 6 , CAT 7 I CAT 8
I. .-. J J
I fNon. Reg. Inv. Co., 104 9.3 1.0 2.0 0 2.0 3.0 0 2.0 ~ployee Benefit
I 1,181 6.2 19.0 2.8 1.5 1.5 0.3 3.0 0.3 IInsurance Co. 113 13.2 5.1 5.1 9.6 0.9 0 0.9 0 .'Ion Profit Drg. 466 14.1 12.4 3.4 0 1.3 0 3.1 0 ICoq~orate Account 539 11.2 10.4 I 3.2 0.4 -~-'~- f------;; 0 0.4 0 lInd. I:. Pars. Trusts 8,124 14.0 6.4 4.0 () 3.0 0.8 2.0 0.4 iOti1er 78 _~3.5 6.0 5.0 0 0 1.0 0 0
!TOTAL l' 1:1,605 I
.! l 13.1 8.4 4.0 0.3 2.7 0.5 2.2 0.4
--.
I CAT 9
80.7 65.4 65.2 65.7 72.8 69.4 74.5
68.4
-CO 00

TABLE IV-35
Destination of Terminated Accounts
CATEGoRIES OF SUCCESSOR INVESTMENT ADVISER
1 Individual or Nonfinancial Institution 2 Bank or Trust Company 3 Investment Advisory Firm 4 5 6 7 8
9
Insurance Company Brokerage Firm Other Financial Institution Death of Client--Successor Adviser Death of Client--Assets Distributed Not Known
NUMBER
Chosen
-'~ --TERMINATED DISTRIBUfION .OF RESPONSES BY _CATEGORY OF_SIJCCESSOR ADVISER C'll ---
- ACCOUNT TYPE ACCOUNTS CAT 1 j CAT 2 CAT 3 I CAT 4 CAT 5 i CAT 6 CAT 7 CAT 8 ; I
, 43
I 14.2 2.5 I
2.5 0 Non Reg. Inv. Co. 9.2 5.0 0 2.5 Employee Benefit 608 1.5 ! 6.0 4.0 1.0 1.0 0 0 0.5 Insurance Co. 66 1.5 ! 4.5 8.5 1.5 7.0 1.5 0 0 Non Profit 216 3.0 ! 4.0 8.0 0 3.0 0 0 1.0 Corporate Account 211 2.5 i 1.5 , _ 8.0 0 4.0 0.8 0 2.5 t~d. &~~rs. trust 4,545 10.0 ; 3.8 5.4 0 3.8 0.8 0.8
I 3.1 I
Other 48 0 5.0 I 2.0 0 0 0 0 I 5.0 I
I I
I !
TOTAL _5,737 8.0 4.0 i 5.8 0.2 3.5 0.8 0.6 I "
CAT 9
64.10 86.00 75.50 81.00 80.70 72.30 88.00
I 74.8il
-<:0 <:0

TABLE IV-36
MINIMUM STATED ASSET AND FEE REQUIREMENTS FOR NEW ACCOUNTS
PROPORTION PROPORTION NUMBER OF WITH MINIMUM WITH MINIMUM
TYPE OF FIRM SIZE OF FIRM RESPONDENTS ASSET REQUIREMENT FEE REQUIREMENT
Mutual Fund Complex Large 27 44% 48% Small 14 36 21 TOTAL 41 42 39 ~ o
Non Fund Complex Large 38 76 87 Small 52 46 58 TOTAL 90 59 70
I Total 1-65 Sample I Large 65 63 71
I Small I 66 44 50 I ! TOTAL 131 I 53 60 I I
I !

~ ~
<0 ~ 0
0
;;
~ SIZE RANGE Category 1 Category 2 Category 3 Category 4 Category 5
TYPE OF'-' FIRM
Mutual Fund Complexes
Non Fund Complexes
Total Sample
TABLE IV-37
DISTRIBUTION OF MINIMUM ASSET SIZE FOR NEW ACCOUNTS
Greater Greater Greater Greater Greater
,
than zero; less than $10,000 or equal to $10,000; less than $50,000 or equal to $50,000; less than $100,000 or equal to $100,000; less than $500,000 or equal to $500,000
I NUMBER DISTRIBUTION OF RESPONSES SiZlfoF OF BY ASSET SIZE CATEGORIES (%)
FIRM FIRMS CAT, 1 CAT. 2 CAT. 3 CAT. 4
_ L~rge 12 57.69 0.0 -- 0.0 19.23 Small 5 71.43 14,.29_ ' 0.0 14.29 TOTAL 17 62.50 5.00 0.0 17.50
Large 29 23.68 2.63 0.0 52.63 Small 24 59.62 9.62 1.92 23.08 TOTAL 53 44.44 6.67 1.11 35.56
Large 41 37.50 1.56 0.0 39.06 Small 29 i 62.12 ! 10.61 I 1.52 21. 21
I TOTAL 70 i 50.00 I 6.15 ! 0.77 I 30.00 , \
AVERAGE FOR TYPE AND SIZE CLASSIFICATION
CAT. 5 (thousands of dollars) ~ -23.08 359.62
0.0 17.50 15.00 239.87
21.05 341.18 5.77 125.60
12.22 216.62
21.88 348.67 4.55 102.67
13.08 i 223.78

TABLE IV-38
DISTRIBUTION OF MINIMUM FEE SIZE FOR NEW ACCOUNTS
FEE CATEGORY Category 1 Greater than zero; less than $1,000 Category 2 Greater or equal to $1,000; less than $1,500 Category 3 Greater or equal to $1,500; less than $2,500 Category 4 Greater or equal to $2,500; less than $5,000 Category 5 Greater or equal to $5,000
NUMBER DISTRIBUTION OF RESPONSES TYPE OF SIZE OF OF BY FEE SlZ~ QAI~~QRIES {%)
FIRM FIRM FIRMS CAT. 1 CAT. 2 CAT. 3 CAT. 4
Mutual Fund Complex Large 13 60.00 12.00 4.00 12.00
Small 3 85.71 7.14 0.0 0.0 TOTAL 16 69.23 10.26 2.56 7.69
Non-Fund Complex Large 33 23.68 28.95 15.79 26.32
Small 30 76.92 13.46 7.69 1.92 TOTAL 63 54.44 20.00 11.11 12.22
Total Sample Large 46 38.10 22.22 11.11 20.63 Small 33 78.79 12.12 6.06 1.52 TOTAL 99 I 58.91 17 .05 8.53 10.85
CAT. 5
12.00 7.14
10.26
5.26 0.0 2.22
7.94 1.52 4.65
AVERAGE FOR TYPE AND SIZE CLASS IF ICATION
(dollars)
:
2,340.00 307.14
1,610.26
L,4l3.16 536.35 906.56
1 :780.95 487.73
1,'119.30
t-:l o t-:l

TABLE IV-39
I'II'ORTANCE OF ADVERTISING FOR OBTAINING NEW BUSINESS
CATEGORIES OF AVAILABLE RESPONSES: Category Category 2 Category 3 Category 4 Category 5
Very important, always used Important, used often but not always Some~hat important, used sometimes but not frequently Not important, used only infrequently O~ rarely Unimportant, never used
NUMBER DISTRIBUTION OF RESPONSES BY TYPE OF SIZE OF OF IMPORTANCE CATEGORIES (%)
EAR FIRM FIRM FIRMS CAT. 1 CAT. 2 CAT. 3 CAT. 4
Mutual Fund Complex Large 23 4.35 17.39 13.04 26.09
Small 6 0.0 0.0 16.67 0.0 TOTAL 29 3.45 13-.-7'( 13.79 20.69
Non-Fund 1964 Complex Large 31 0.0 0.0 12.90 25.81
Small 41 2.44 9.76 2.44 9.76 TOTAL 72 1.39 5.56 6.94 16.67
Total Sample Large 54 1.85 7.41 12.96 25.93 Small 47 2.13 8.51 4.26 8.51 TOTAL 101 1.98 7.92 8.91 17.82
Mutual Fund Complex Large 25 4.00 16.00 28.00 16.00
Small 14 0.0 14.29 7.14 35.71 TOTAL 39 2.56 15.38 20.51 23.08
Non-Fund 1969 Complex Large 38 0.0 0.0 13.16 39.47
Small 51 3.92 3.92 7.84 13.73 TOTAL 89 2.25 2.25 10.11 24.72
Total Sample Large 63 1.59 6.35 19.05 30.16 Small 65 3.08 6.15 7.69 18.46 TOTAL 128 2.34 6.25 13.28 24.22
----- ---- - --
CAT. 5 AVERAGE RESPONSE
39.13 3.78 83.33 4.67 48.28 3.97
61.29 4.48 75.61 4.46
~ C.:l
69.44 4.47
51.85 4.19 76.60 4.49 63.37 4.33
36.00 3.64 42.86 4.07 38.46 3.79
i I
47.37 4.34 I
70.59 4.43 60.67 4.39
42.86 4.06 64.62 4.36 53.91 4.21 I
I

TABLE IV-40
IMPORTANCE OF DIRECT MAIL PROMOTIONAL LITERATURE FOR OBTAINING NEW BUSINESS
CATEGORIES OF AVAILABLE RESPONSES: Category 1 Very important, always used Category 2 Important, used often but not always Category 3 Somi~Nhat important, used sometimes but not frequently Category 4 Not important, used only infrequently or rarely Category 5 Unimportant, never used
YEAR NUMBER P!~TRIB\lTI9N OF RESPONSES BY
TYPE OF SIZE OF OF .IMPORTANCE CATEGORIES (%) FIRM FIRM FIRMS CAT. 1 CAT. 2 CAT. 3 CAT. 4
I Mutual Fund Large 23 0.0 4.35 17.39 30.43 I
I Complex Small 6 0.0 0.0 0.0 16.67
i TOTAL 29 0.0 3.45 13.79 27.59
! Hon-Fund Large 31 0.0 9.68 3.23 16.13
! Complex Small 39 5.13 7.69 5.13 0.0 TOTAL 70 2.86 8.57 4.29 7.14
1964
! Total Sample Large 54 0.0 7.41 9.26 22.22 Small 45 4.44 6.67 4.44 2.22 TOTAL 99 2.02 7.07 7.07 13.13
, Mutual Fund Large 28 0.0 3.85 30.77 23.08 Complex Small 14 7.14 0.0 7.14 28.57
TOTAL 40 2.50 2.50 22.50 25.00
Non-Fund Large 38 0.00 7.89 7.89 21.05 Complex Small 50 2.00 4.00 4.00 10.00
1969
TOTAL 88 1.14 5.68 5.68 14.77
Total Sample Large 64 0.0 6.25 17 .19 21.88 Small 64 3.12 3.12 4.69 14.06
I TOTAL 128 1.56 4.69 10.94 17.97
.. AVERAGE ..
XESPONSE CAT. 5
47.83 4.22 83.33 4.83 55.17 4.34
I>:l
70.97 4.48 ~ 82.05 4.46 77.14 4.47
61.11 4.37 82.22 4.51 70.71 4.43
42.31 4.04 57.14 4.29 47.50 4.12
63.16 4.39 80.00 4.62 72.73 4.52
54.69 4.25 75.00 4.55 64.84 4.40

TABLE IV-4l
IMPORTANCE OF OWN ~TAI~_SALES FORCE FOR OBTAINING NEW ACCOUNTS OR ADDITIONAL SUBSCRIPTIONS FOR EXISTING ACCOUNTS
CATEGORIES OF AVAILABLE RESPONSES: Category 1 Very important, always used Category 2 Important, used often but not always t::ategory 3 Somewhat lmportant, used sometimes but not frequently Category 4 Not important, used only infrequently or rarely Category 5 Unimportant, never used
NUMBER DISTRIBUTION OF RESPONSES BY _ AVERAGE _____ YEAR TYPE OF SIZE OF OF :-r}!ioRIANCE CAT~CO:RIE_S'-X%)- -- RE6P9N&fl-'
FIRM FIRM FIRMS CAT. 1 CAT. 2 CAT. 3 CAT. 4 CAT. 5
Mutual Fund Large 23 26.09 8.70 8.70 0.0 56.52 3.52 Complex Small 6 33.33 0.0 0.0 0.0 66.67 3.67
TOTAL 29 27.59 6.90 6.90 0.0 58.62 3.55
~ Non-Fund Large 31 22.58 19.35 6.45 9.68 41.94 3.29 0
1964 Complex Small 40 22.50 0.0 2.50 10.00 65.00 3.95 C;t
TOTAL 71 22.54 8.45 4.23 9.86 54.93 3.66
Total Sample Large 54 24.07 14.81 7.41 5.56 48.15 3.39 Small 46 23.91 0.0 2.17 8.70 65.22 3.91 TOTAL 100 24.00 8.00 5.00 7.00 56.00 3.63
Mutual ~und Large 26 23.08 11.54 15.38 3.85 46.15 3.38 Complex Small 14 71.43 0.0 0.0 0.0 28.57 2.14
TOTAL 40 40.00 7.50 10.00 2.50 40.00 2.95
1969 Non-Fund Large 38 23.68 15.79 7.89 7.89 44.74 3.34 Complex Small 52 23.08 3.85 3.85 11.54 57.69 3.77
TOTAL 90 23.33 8.89 5.56 10.00 52.22 3.59
Total Sample Large 64 23.44 14.06 10.94 6.25 45.31 3.36 Small 66 33.33 3.03 3.03 9.09 51.52 3.42 TOTAL 130 28.46 8.46 6.92 7.69 48.46 3.39

TABLE IV-42
IMPORTANCE OF REFERRALS FOR ACHIEVING NEW ACCOJNTS (1969)
CATEGORIES OF AVAILABLE RESPONSES: Category 1 Very important, always used Category 2 Important, used often but not always Category 3 Somewhat important, used sOffietimes but not frequently Category 4 Not important, used only infrequently or rarely Category Unimportant, never used
NUMBER DISTRIBUTION OF RESPONSES BY SOURCE OF TYPE OF SIZE OF OF IMPORTANCE CATEGORIES (%) REFERRAL FIRM FIRM FIRMS CAT. 1 CAT. 2 CAT. 3 CAT. 4
Mutual Large 25 16.00 16.00 32.00 12.00 Fund ~m!,ll 12 0.0 8.33 8.33 16.67 Complex IO!'(l) 37 10.81 13.51 24.32 13.51
Broker Non-Fund Large 38 5.26 5.26 26.32 50.00 Dealers Complex Small 49 4.08 16.33 22.45 18.37
f otal , I 87 4.60 11.49 24.14 32.18
Total Sample Large 63 9.52 9.52 28.57 34.92 Small 61 3.28 14.75 19.67 18.03 Total 124 6.45 12.10 24.19 26.61
Mutual Large 24 25.00 29.17 16.67 8.33 Fund Small 13 15.38 0.0 30.77 7.69 Complex Tota! 37 21.62 18.92 21.62 8.11
Existing or Non-Fund Large 38 47.37 31.58 21.05 0.0
Fonner Complex Small 52 36.54 32.69 9.62 3.85 Clients Total 90 41.11 32.22 14.44 2.22
Total Sample Large 62 38.71 30.65 19.35 3.23 Small 65 32.31 26.15 13.85 4.62 Total L 127 35.43 28.35 16.54 3.94
- --
CAT. 5
24.00 66.67 37.84
13.16 38.78 27.59
17.46 44.26 30.65
20.83 46.15 29.73
0.0 17 .31 10.00
. 8.06 23.08 15.75 --
AVERAGE RESPONSE
3.12 4.42 3.54
3.61 3.71 3.67
3.41 3.85 3.63
2.71 3.69 3.05
1. 74 2.33 2.08
2.11 2.60 2.36
---------
t-:) o 0;

207
D. ADVISORY FEES
1. Introduction
The purpose of this section is to present an analysis of the advisory fees charged by advisers to their various types of clients. The basic data consist of the advisory fees charged to the 42,118 accounts in the 1-14 respondent group for calendar year 1969. This information was combined with the other items collected by that questionnaire to examine the relationship between fee rate, expressed as a percentage of total account assets as of September 30, 1969, and various characteristics of the client, the account and the advisory complex.
2. Services Supported by the Advisory Fee
The ability of the following analysis to explain differences in fee ratios by the various characteristics of the client, account and adviser will be reduced to the extent that the advisory fee supports different levels of tangible services, such as administrative expenses, custodian fees and so on. To the extent that the adviser provides special services or bears an unusual proportion of expenses associated with an advisory account, the advisory fee ratio would be expected to be higher, and vice versa. The analyses describe the typical allocation of account expenses between the adviser and the client for registered investment company and other types of clients.
The following, based on an examination of externally managed registered investment company prospectuses, are the typical division of expenses between the investment company and the adviser.39
TYPICAL DIVISION OF INVESTMENT COMPANY EXPENSES
Expenses of the Fund: Advisory Fee; Transfer Fees; Custodian Fees; Taxes; Interest and Insurance; Filing Fees; Legal and Auditing; Shareholder Reports (printing and postage) ; Stationary;* Director's Fees;$ Registration Fees.'"
Expenses of the Adviser (Supported by the Advisory Fee) : Administrative, Clerical and Bookeeping; O1Iice Rental and Equipment; Research and Statistical; Telephone and Utilities; Stationary;· Director's Fees;* Registration Fees.·
-Indicates an expense divided according to advisory contract.
For other types of accounts the definition of the level and quality of services provided becomes more difficult. Some advisory firms provide a wide variety of services which can have a distinct bearing on the total relationship with the client and advisory fee levels. The following are examples of services which are provided by a number of advisory firms to client accounts:
(i) Taxes-maintenance of tax records; preparation of income tax returns; advice on tax sheltered investing; advice on impacts of tax laws on investors .
• 9 The expenses In addition to the advisory fee borne by a group of 87 externally man· aged mutual funds with June 30, 1968 nssets of $100 million and over, for their fiscal years ended betwepn July 1. 1967 and June 30. 1968, avpra"ed 0.14 percent of averng-e net assets during the fiscal year (medium value=0.09 percent of average net assets). Source: HearlnA'S on H.R. 11995, S. 2224. H.R. 13754 and R.R. 14737. Before the Subcommittee on Commerce and Finance of the House Committee on Interstate and Foreign Commerce, 91st Cong .. 1st Sess., pt. 2. at 879-880 (1969). While the allocation of expenses shown In the display Is typical of the fund Industry. exceptions do exist. A small number of large fund complexes pay all expenses of their mutual fund advisory accounts.

208
(ii) Financial planning services-estate planning for individuals-employee benefit and corporate planning for institutional and corporate accounts.
(iii) Order placing-facilities for placing orders with brokerdealers and associated record-keeping.
(iv) Banking relationships-establishment of custodian, loan and other bank relationships.
(v) Other consulting advice-matters affecting institutional clients such as insurance company accounting and regulations, pension fund actuarial considerations, etc.
(vi) Special services-bond and mor~gage supervision and other forms of active income and tax sheltered investing.
The advisory fee paid by the non-fund client typically supports all of the services provided by the adviser. There is no separate administrative expense charged to the account, as in the case of most registered investment company clients.
An exception to the above rules, however, are custodian fees. Advisory complexes typically do not maintain custody of client securities. Custodial services, in the cases of institutional, corporate and individual clients are usually contracted and paid for by the client. The magnitude of the custodian fees depends on the total assets of the account, the activity rate and the· cash balances maintained. Those fees typically range from about 0.2 percent for small accounts (under $0.5 million) down to 0.05 percent for large accounts. Comparability in advisory fee data is maintained between mutual fund and other account types, however, since custodian fees are typically paid by the fund and not the adviser.40
3. Distribution of Advisory Fee Ratios (Refer to Tables IV -43 ,and IV-44)
The advisory fee ratio was computed by dividing the 1969 advisory fee by the total account assets as of September 30, 1969, and expressing the result as a percentage. Table IV-43 summarizes both the average of the account fee ratios and the total fees paid expressed as a percentage of the total assets for the accounts in the I -14 sampleY
The ,average fee ratio is an unweighted average of the individual account fee ratios, and thus reflects the fee paid by a typical account of that type. The total fees divided by the total assets for the !lJCcount types reflects a dollar weighted average of fee ratios. The latter reflects the average fee obtained per dollar of advisory assets of the account types.42
The average fee ratio for the total number of accounts was 0.46 percent of assets. On a dollar weighted basis, the result is 0.28 percent of assets. The same ratios for registered investment companies ~ere 0.45 percent and 0.39 percent of assets. The average fee ratios for institutional and corporate accounts range from 0.60 percent for
.. To support this assertion, the advisory contracts of a randomly choRen sample of 78 externally managed open-pnd Investment companies were exnmlned as of December 1, 1970. Of the 7R cases. the adviser paid the custodian fee in onlv three cases .
.. The 42,118 accounts in the 1-14 Rurvey have been grouppd into the same eight account types that were described In sec. B of this chapter .
.. The unwelghted average of advisory fee ratios w!I1 typically be larger than the dollar-weighted average due to the preponderance of smaller accounts with higher fee ratios in all of the account categories.

209
nonregistered investment companies down to 0.20 percent for insurance company accounts. The dollar weighted fee ratios for the same accounts were 0.66 percent and 0.07 percent of assets. For the accounts of individuals and personal trusts, the average fee ratio was 0.48 and the dollar weighted fee ratio was 0.29 percent.
The distribution of average advisory fee ratios show that 6.4 percent of all accounts paid no fees. Of the 2,691 accounts which paid no fees, 1,942 were small individual and personal trust accounts and were typioally satellite accounts of larger accounts in the same category. Additionally 290 accounts of nonprofit organizations (14.1 percent of total nonprofit accounts) and 207 employee benefit plans (6.8 percent of the total) paid no fees.
For accounts where fees are paid, 13.8 percent had average advisory fee ratios between 0 and 0.2 percent, 24.3 percent had fee ratios between 0.2 percent and 0.4 percent, 39.9 percent were between 0.4 percent and 0.6 percent and 15.6 percent were above 0.6 percent.
The average advisory fee ratios for registered investment companies showed the strongest central grouping, with 54.1 percent of funds with fee ratios between 0.4 percent and 0.6 percent of assets. Individual and persona,l trust account fee ratios were also highly concentrated, with 43.0 percent of accounts with fee ratios between 0.4 and 0.6 percent of assets.
4. Advisory Fee Bases (Refer to Table IV-45)
For 78 percent of all advisory accounts, the adviser was compensated through an advisory fee which ,vas based on a percentage of the assets llnder advisement. A further 17 percent of accounts compensated the adviser via either a flat fee which did not depend on annual variation in account size and/or ,activity, or a combination of a flat fee and a fee based on a percentage of assets.
For registered investment companies, 73 percent of advisory contracts provided for a percentage of assets advised type of fee. A further 17 percent of registered investment companies had incentive fee arrangements, of which the majority (43 out of 54) were based on the performance of the fund relative to a market index.
The absence of performance fee arrangements for non investment company accounts relates to the prohibition of such arrangements by the Investment Advisers Act, which continues in effect until December 14, 1971, the effective date of the alllendment to Section 205 of that Act contained in the Investment Company Amendments Act of 1970. For a discussion of performance fees generally, see section F of this chapter.
5. Relationship of Fee Ratio to AC<lonnt Size (Refer to Tables IV-46, IV-47 and IV-48)
The following display summarizes the average fee ratios for accounts in various size ranges for registered investment companies, institutional and corporate accounts and individual and personal trust accounts.43
43 Institutional and corporate accounts Include non-registered Investment companies, employee benefit plans. Insurance company accounts, nonprofit organization accounts, corporate accounts and other accounts.

210
Size range of account (dollars in millions)
o to 0.25 _____________________________________________ : ____ _ 0.25 to L _________________________________________________ _ 1 to 10 ____________________________________________________ _ 10 to 100 __________________________________________________ _ 100 plus __________________________________________________ _
Average fee ratios (percent)
Registered investment companies
0.85 .78 .40 .47 .44
Institutional and
corporate
0.64 .42 .26 .12 .03
Individuals
0.55 .38 .19 .06 .02
Average advisory fees for registered investment companies decline to 0.44 percent of assets for funds over $100 million of assets. This average is based on 94 companies with an average size of approximately $450 million.
Average fee ratios for institutional and corporate accounts decline to 0.03 percent of assets for accounts over $100 million of assets. This average is based on 41 accounts with an average size of approximately $250 million.
For individual and personal trust accounts, the situation is similar to the institutional and corporate accounts. For accounts over $100 million of assets (5 accounts with average size of $150 million) the average fee ratio for individual'and personal trust accounts was 0.02 percent of assets advised.
The results indicate that economies of scale exist for all types of accounts and that some savings are being passed along to the investor via lower advisory fees for larger accounts. The results show, however, that substantially greater reductions in fee ratios exist for institutional, corporate and individual accounts, than for investment company accounts.
The results also indicate that the average fee ratios for institutional and corporate accounts are higher than for individual and personal trust accounts over the full range of account sizes.
6. Factors Affecting Advisory Fees
In order to examine the simultaneous relationships of various client, account and adviser relationships and advisory fee ratios, a more powerful technique must be used than the tabular presentations used In the above discussion of account size and fee ratios. The analytical technique employed was regression analysis, which allows theexamination of the relatIOnship of a single factor to fee ratio while holding all other factors that have been included in the analysis constant. This then allows "other things being the same" statements to be made about the impact of one explanatory factor on advisory fee ratios.
The following factors were included in the regression analysis to ascertain their statistical relationship to the advisory fee ratio.44
(i) Age ofthe Account (Year). (ii) Account Valuation Frequency (VFR). (iii) Total Assets of Account (ASST). (iv) Investment Objective of Account (OBJ). (v) Investment Authority of Adviser (AUTH) .
.. Refer to sec. B of this chapter for a description of these factors.

211
(vi) Federal Income Tax Bracket of Client (TAX). (vii) Broker-Dealer Affiliation of Adviser (BR-D). (viiI) Account Trading Status (TRAD). (ix) besignationofBrokerage (BROK). (x) Size of Advisory Complex (SIZE). (xi) Mutual Fund Complex Factor (FUND). (xii) Turnover of Common Stock Portion of the Portfolio
(TURN). The expected relationship of each factor to advisory fees and the
results obtained in the regression analysis are now discussed for each of the above factors.45 a. The age of the account (YEAR)
Advisory fee arrangements for accounts other than registered investment companies are typically not renegotiated every year.46 Many advisory firms appear to be reluctant to change the terms of existing armngements to conform to the fees charged to new accounts. Thus to the extent that any increase or decrease over time exists in the fee ratio charged to new accounts, the 'age of the account would probably be a significant factor in explaining differences in fee ratios on existing accounts.
For all types of accounts except investment companies, the age of the account was negatively related to the size of the fee ratio. For individual and personal trust accounts, for e::mmple, a 1 percent increase in account age is associated with a 0.07 percent decrease in advisory fee ratio. The effect for institutional and corporate accounts of a 1 percent increase in age ranges from a 0.09 percent reduction for employee benefit plans to a 0,27 percent reduction for insurance company accounts. The effect is in the opposite direction for investment compames (registered and non-registered), with an increase in age being associated with an increase in advisory fee ratio, but the relationship is not statistically significant. D. Valuation frequency.
The v,aluation frequency can be considered as 'a measure of the information processing activity 'associated with the ,account. Thus accounts with more frequent valuations would involve a higher level of expenses.
The results of the analysis are consistent with this hypothesis for all classes of accounts. For the total number of accounts, a 1 percent increase in valuation frequency is associated with a 0.11 percent increase in fee ratio. ' . c. Total account assets
The economies of scale aSSOCIated with the ,administration of larger amounts of 'assets should be reflected in terms of lower advisory fee ratios. It would also be expected that the economies of scale would
"In the following discussion. where the Impact of changes In the explanatory factors are dlscllssed. the followll'g convention will be used:
Changes In the following will be percentage changes from a starting amount-for example, a 100% IncreaRe In account asset size would result from an asset Increase from $1 million to $2 million-Fee Ratio, Valuation Frequency, Total Account Assets, Advisory Compl~x.
Changes In the remaining factors wUl be dlscuss'ed In terms of ab"olute differences. For example. a 10 percentage point Increase In turnover rate would result from an Increase from a 30 percent to 40 percent turnover rate .
.. As noted In sec. A of this chapter, Section 15 of the' Investment Company Act requires Investment advisory contracts that are to be continued beyond two years to be approved annually.

212
differ by account type. For example, there are differences in expe.nses between taking on an increment of $100 million of corporate account assets and the s'ame amount of new mutual fund assets.
For all tvpes of accounts, an increase in asset size was associated with a statistically significant decrease in the average fee ratio. For the total number of accounts, a 1 percent increase in account assets was associated with a 0.25 percent reduction in fee ratio.
The fee ratio reduction percentage differed substantially among account types, however. For registered invef1tment companies, a 1 percent increase in assets was associated with a 0.05 percent reduction in fee ratio. For institutional and corporate accounts the percentage reduction ranged from 0.26 percent for the accounts of non-profit organizations to 0·36 percent for corporation accounts. The reduction in fee ratio for individual ,and personal trust -accounts associated with a 1 percent increase in account assets was 0.25 percent. d. Account i1VVestment objective
This factor is included to represent the additional advisory attention needed to advise accounts with aggressive (maximal oapital gain oriented) investment objectives. These accounts may require the adviser to follow more stocks more intensively than would be required for less aggressively managed accountsY
For all classes of accounts (exoept "other"), more aggressive investment objectives were associated with higher advisory fee ratios. For the total number of accounts, a 35 percent increase in fee ratio was associated with a change from an income to capital gain oriented account. e. I nve8tment discretiO'1UJ,TY authority
The experience of the advisory industry is that non-discretionary relationships require more time and paper work than discretionary accounts. For e~ample, in completing an ·account tram-action, the client must be reached by telephone or letter and the basis for the recommendationand its applicability to that client explained ·to him. The client sends back his approval, the transaction is ·arranged, the client is 'advised. In a discretionary account, on the other hand, the program is developed, the transactions are ·arranged and the client mayor may not be informed 'at the time. Thus, the theory goes, there is a substantial saving of time otherwise involved in trying to reach the client in advance and presenting a full expl-anation to him for his ,approval.
The regression results, however, are at odds with the cost based hypotheses developed above. The results indicate that, on the average, non-discretionary accounts have lower advisory fee ratios. For the total number of accounts, the fee rate for a non-discretionary account is approximately 38 percent lower than that of a fully discretionary account. The result is statistically significant for. individual accounts
.. An aggressively mannged income account, however, can require following a large number of real estate opportunities (mortgnges, sale·lease backs), corporate, state and municipal credits nnd economic trends. Also. certain firms with aggressively managed stock portfolios have advertised themselves as concentrating on a very limited number of secur· ities. (For a discussion of concentmtlon In institutional portfOlio holdings. see ch. X. C.) Thus, it would be expected that the hypotheses stated above would be true in general but various exceptions will exist.

213
and for all types of institutional and corporate accounts. It is not statistically significant for investment company and "other" accounts.
One explanation for this effect may be that firms with high concentrations of discretionary accounts may charge higher advIsory fees. This is consistent with the fact that many newer advisory firms which will only take discretionary accounts charge higher fees than older firms. Another explanation might be that an adviser with a non-discretionary account may have less responsibility in selecting investments and less risk of client dissatisfaction with the account's performance, and thus is willing to charge a lower foo. f. Federal income taw braoketof the olient
In the case of individual and personal trust accounts, the fee for identical professional advisory services rendered might be related to the ability of the client to pay, as in the case of other professions (doctors, lawyers, etc.). If this practice is 'prevalent in the advisory industry, there would be a positive relationship between the marginal tax bracket and the fee ratio charged, other things being equal.
The client tax bracket was found to have a significant statistical relationship to the advisory fee charged to the individual and personal trust account. On the average, a one percentage point increase in federal income tax bracket was associated with a 0.3 percent increase.in advisory fee ratio. g. Broker-Dealer affiliation of the adviser
When an account is advised in a complex which is affiliated with a broker-dealer, the possibility exists that some fraction of the brokerage commission generated by the account will be returned in terms of lower advisory foos.48 It would be expected that the effect would be particularly significant for registered investment companies, where opportunities to offset brokerage from affiliated mutual funds against advisory fees may well exist.
The regression results support the above contentions. For the total number of accounts, the broker-dealer affiliation factor is associated with approximately a 12 percent reduction in fee rate. The result of the brokerage offset is particularly striking for registered investment company accounts. The reduction in fee ratio for these accounts is approximately 40 percent, other things being the same. For individual and personal trust accounts, the reduction is approximately 15 percent. The direction of relationship varies among the institutional and corporate accounts and is statistically significant only for this category of account.
Table IV-50 presents the average fee ratios for the various classes 0'£ accounts segmented by broker-dealer affiliation. The results conform to the above discussion of differences in fee ratios associated with the affiliations. Where differences in magnitude exist, however, they are due to the fact that other factors may differ between broker-dealer and non broker-dealer accounts which have not been controlled for in the table.
'8 The only broker-dealer affiliations considered In this analysis are relationships with firms acting as agents or principals in the execution of client portfolio transactions. This definition excludes any broker-dealer affiliations limited to mutual fund underwriting activities.

214
h. Trading 8tatu8 of the account Placing orders for ,the client is an additional service for which the
adviser may be compensated through higher advisory fees. Thus, for accounts where the adviser places orders most or aJl of the time (without receiving brokerage commissions), the -average advisory fee would be expected to be higher.
The result is as predicted for the total number of accounts, where the increase in average fee ratio between accounts for which the adviser does no trading to accounts where he trades most or all of the time is approximately 6 percent. The result is statistically significant, however, only for accounts of non-profit organizations and individual and personal trusts. In these cases the increase is approximately 2 percent for the former and 6 percent for the latter type of accounts. i. Brokerage allocation
The extent to which the client designates the broker-dealers to be used for his portfolio transactions can affect the advisory fee level in a number of ways.
If the client designates the brokerage, the adviser loses the use of these commissions to purchase additional services from the brokerage community. To compensate for this loss, accounts with high degrees of designated brokerage may be charged higher fees.
On the other hand, designation of brokerage may make things easier for the adviser. There is no need, for example, to have a trading desk to check alternative prices that may be av,ailable for the same securities. On this basis, It would be expected that accounts which designate brokerage pay lower fees, other things being the same.
For the total number of accounts, the effect is consistent with the latter hypotheses. Accounts which do not designate brokerage tend to pay slightly higher fees. The fee rate increases approximately 0.05 percent between accounts where all brokerage is designated and accounts where the client designates no brokerage. The magnitude of the effect is similarly small for the various types of accounts and is statistically significant for only three ,account types. j. Size of the advisory complex
As the advisory complex grows in terms of assets under advisement, economies of scale will result which can be passed on to clients in several ways. One would be by reduction of advisory fees; this would be reflected in terms of a negative relationship between fee ratio and size of the advisory complex. Another way would be through the provision of extra services to clients (for example, tax planning) without increase in advisory fee. If done that way, the economies associated with larger advisory complexes would not be reflected in terms of lower fee ratios.
The regression results indicate that any economies of scale that do exist are not reflected in terms of st-atistically signifioant reductions in advisory fee ratios. For the total number of accounts, a 100 percent increase in the size of the advisory complex assets is associated with a 0.36 percent reduction in advisory fee ratio. The effect is similarly small, of mixed direction and not statistioally significant among the various types of 'accounts.

215
k. Muturil fund complem factor This factor is included to measure the effect on advisory fees charged
to accounts which are advised within mutual fund complexes. The regression results show that accounts managed in fund com
plexes tend to pay higher 'advisory fees than accounts in non-fund complexes. This result is true for the total number of accounts and is statistically significant for each of the various account types.
For a typical account advised ina fund complex, the fee ratio is approximately 18 percent higher, other things being the same. For a registered investment company, the increase is 62 percent. For institutional and corporate accounts, the increases range from 21 percent for corporate accounts to 35 percent for accounts of insurance companies. For individual and personal trust accounts the difference is approximately 7 percent.
The difference in average fee ratios between fund complex and nonfund complex advisory accounts are presented in Table IV-51. The figures give the same general picture as discussed above. Where differences in magnitude exist between percentage differences in Table IV-51 and the regression results, they are due to differences in other factors between fund and non-fund complexes which are not controlled for in the tabular presentation. l. Turnover of common stock portion of portfolio
'Portfolio turnover may be a measure of the degree to which the portfolio is aggressively managed. High turnover implies frequent review and evaluation of the account. If ,this were the only consideration, accounts with high turnover rates would have higher advisory fee ratios, other things being the same.
This is not typically the whole story. The brokerage commissions that result from higher turnover rate may be useful to obtain additional services from the brokerage community, such as security research or promotional considerations. This is particularly true for advisers of mutual funds, where brokerage commissions haye typically been used to reward broker-dealers who sell shares of affilIated funds. Thus some advisers may actually prefer accounts with high turnover rates and may seek them out via lower advisory fees.
The regression results show that turnover rates are positively correlated with advisory fee ratios for all classes of accounts except investment companies. For the total number of accounts, a 10 percentage point increase in turnover rate is associated with a 6 percent increase in fee ratio. For registered investment companies the opposite effect is observed. A 10 percentage point increase in turnover rate is associated with a 2.0 percent reduction in fee ratio. The results from a 10 percentage point increase in turnover rate for individual and institutional and corporate accounts range from a 2.5 percent increase for employee benefit accounts to a 5.6 percent increase for individual and personal trust accounts.
The pattern of results show that the adviser must be compensated to provide higher turnover rates for non-investment company accounts, but are willing to accept lower levels of advisory fees for investment companies with higher turnover rates.

Number of Advisory
ACCOUNT TYPE Firms
l. Registered Investment Companies 86
2. Nonregistered Investment Companies 109
3. Employee Benefit Plans 133
4. Insurance Companies 133
5. Nonprofit Organizations 137
6. Corporate Accounts 140
7. Individuals and Personal-Trust 152
8. Other Accounts 157
9. Total Accounts 157
TABLE IV-43
AVERAGE ADVISORY FEES
Number of Average Advisory Accounts Fee Ratio
(%)
320 0.45
245 0.60
3,019 0.40
347 0.20
2,062 0.28
1,053 0.40
34,460 0.48
514 0.39
42,020 0.46
~~~_~a_ge_ Fe~_..!'a,i_q_ (Total Fees )
-- '--(Total Assets)--' --(%) --------
0.39
0.66
0.10 t-:l I-' O':l
0.07
0.09
0.11
0.29
0.13
0.28

j TABLE IV-44
il- DISTRIBUTION OF AVERAGE ADVISORY FEE RATIOS
PERCENTAGE OF liCCODlHS BY AVERAGE ADVISORY FEE Kl!:IIO Greater than Greater than Greate r than Greater than Greater than Greater than
0% .2% 0.4% 0.6% 0.8% than TYPE OF ACCOUNT 0 % 0.2% 0.4% 0,6% 0,8% 1.0% 1%
5.0 7.il . -2'1.6 54.1 8.1 2:2 '-l.Z· .<_.---- ----- -.. - --_. - - .-1. Registered Investment Companies
tv 11. 7 8.9 16.2 32.4 14.6 3.6 12.6 -~ 2. Nonregistered Investment Companies
3. EmElo~ee Benefit Plans 6.8 20.1 29.8 29.5 6.5 2.9 4.3
4. Insurance Comeanies 5.7 55.9 22,6 11.2 3.4 0.6 0.6
5. Nonprofit Organizations 14.1 31.4 34.3 14.9 2.5 1.4 1.5
6. Corporate Accounts 2.8 30.8 20.8 31.8 5.8 2.8 5.2
7. Individual and Personal Trust 5.6 11.4 23,5 43.0 8.1 3.1 5.4
~Other Accounts 29.9 14.3 15.2 29.5 3.2 1.9 5.9
9. Total Accounts 6.4 13.8 24.3 39.9 7.6 2.9 5.1

TABLE IV-45
.-- _. - ------01 STRl BUTfoN . -OF ADVI sORY - FEE BASES' --------.--- ... --~ ._-- ... -'
PERCENTAGE OF ACCOUNTS BY FEE BASIS Percentage Combination
Flat of of First Incentive No Fee ACCOUNT TYPE Fee Assets Two Fee Paid Other
1. Registered Investment Companies 2.2 72.8 0.3 16.8 1.2 6.6
2. Nonregistered Investment Companies 3.2 70.9 9.3 6.5 2.4 6.1
3. Employee Benefit Plans 5.4 81.5 7.0 0.0 1.3 4.8 I:\:) -00
4. Insurance Companies 16.0 60.7 18.6 0.0 1.4 3.2
5. Nonprofit Organizations 12.4 69.8 9.2 0.0 3.1 5.4
6. Corporate Accounts 14.2 65."4---'--- - ~ 16.9 0.0 0.3 3.0
7. Individual and Personal Trust 8.7 79.0 8.0 0.1 1.2 2.9
8. Other Accounts 7.6 52.0 6.5 0.0 8.6 24.6
9. Total Accounts 8.8 77.8 8.3 0.2 1.3 3.5

219
TABLE IV-46
DISTRIBUTION OF ADVISORY FEE RATIOS AND SIZE OF _ ~Cg<?~N,!,. ~~_.S):Z~_ 9.E'._ A~IJ.rSO~¥_. C211t:~E~ __
REGISTERED INVESTMENT COMPANY ACCOUNTS
Total Advisory
~---- .- ... - -- -Assets of Size Range - -----_ .. -- - - Average Size Average Fee
Complex of Accounts Number of of Account Ratio (~OOO) (~OOO) Accounts (~OOO) (%)
0 - 100 o - 0.25 0 0.00 0 0.25 - 1.0 3 0.54 0.47
1.0 - 10.0 9 3.22 0.61 10.0 • 100.0 2 17.11 0.52 100 + 00 0.0 0.0
100 - 750 o - 0.25 1 0.06 1.56 0.25 - 1.0 7 0.50 0.45
1.0 - 10.0 15 5.04 0.44 10.0 - 100.0 60 42,87 0.47 100.0+ 18 275.44 0.44
750 ~ 0 - 0.25 3 0.14 0.61 0.25 - 1.0 5 0.62 1.42
1.0 - 10.0 25 5.38 0.38 10.0 - 100.0 69 47.33 0.47 1mr~b-+- 76 524.57 0.44 ...... -.- .-
TOTAL 0 - 0.25 4 .12 0.85 0.25 - -1.<i- ---,- 15 .55 0.78
1.0 - -io:o 49 4.88 0.40 10.0 - 100.0 131 44.83 0.47
100.0 .. 94 476.86 0.44

220
,- -_. TABLE IV-47
DISTRIBUTION OF ADVISORY FEE RATIOS BY SIZE OF ACCOUNT AND SIZE OF ADVISORY COMPLEX
INSTITUTIONAL AND CORPORATE ACCOUNTS Total
Advisory Assets of Size Range Average Size Average Fee
Complex of Accounts Number of of Account Ratio (~OOO) (~OOO) Accounts (~OOO) (%)
o - 100 0 - 0.25 205 0.10 0.83 0.25 - 1.0 81 0.50 0.53
1.0 - 10.0 42 2.80 0.35 10.0 - 100.0 5 19.17 0.26
100.0 + 0 0.0 0.0
100 - 750 o - 0.25 508 0.13 0.70 ~~f:<G§::~ 449 0.54 0.45
1.0 - 10.0 387 3.09 0.36 10.0 - 100.0 68 22.74 0.23
1:00.0 + 3 234.72 0.02
750 + o 0 - 0.25 964 0.14 0.57 0.25 - 1.0 1,477 0.55 0.40
1.0 - 10.0 1,574 3.31 0.24 10.0 - 100.0 435 26.28 0.10
100.0 + 38 267.08 0.03
TOTAL 0 - 0.25 1,677 .13 0.64 0.25 - 1.0 2,007 .55 0.42-
1.0 - 10.0 2,003 3.26 0.26 10.0 - 100.0 508 25.74 0.12
100.0 + 41 264.71 0.03

Total Advisory Assets of
Complex ($000)
o - 100
100 - 750
750 +
TOTAL
221
TABLE IV-48
DISTRIBUTION OF ADVISORY FEE RATIOS BY SIZE OF ACCOUNT AND SIZE OF ADVISORY COMPLEX
INDIVIDUAL AND PERSONAL TRUST ACCOUNTS
Size Range of Accounts
(SOOO)
'0 :""(f~i5' 0,2"5 - '1.0
1.0 - 10.0 10.0 - 100.0
100.0 +
o - 0.25 0.25 - 1.0
1.0 - 10.0 10.0 - 100.0
100.0 +
o - 0.25 0.25 - 1.0
1.0 - 10.0 10.0 - 100.0
100.0 +
o - 0.25 0.25 - 1.0
1.0 - 10.0 10.0 - 100.0
100.0 +
Number of Accounts
1,632 544
85 o o
5,371 3,356
994 26
1
8,461 8,144 2,287
70 4
15,464 12,044 3,366
96 5
Average Size of Account
($000)
0.09 0.45 1.80 0.0 0.0
0.12 0.48 2.20
18.38 117.08
0.14 0.49 2.19
20.33 157.28
.13
.49 ~T.r8:"· "'-""19:M-" .-149.24
Average Fee Ratio
(%)
0.93 0.39 0.17 0.0 0.0
0.59 0.26 0.20 0.07 0.0
0.45 0.22 0.18 0.06 0.02
0.55 0.38 0.19 0.06 0.02

~tA~g~6nt I NA'bg:
Reg. Inv. Co.
Non Reg. Inv. Co.
Emp. Benefit Plans Insurance Companl.es
Non Proflt argo
Corpora te Accounts
293
187
2716
320
1662
991
INDEP. VAR
REG. COEF. T STAT.
REG.' COEF. T STAT.
REG COEF. T STAT.
REG COEF·. T STAT.
REG. COEF. T STAT.
REG COEF. "T'STAT.
TABLE IV-49
ANALYSIS OF ADVISORY FEE RATIOS
R~esslOn Coefflcients and T Values
YEAR V FR 0.0793 -0.0795 1.54 -0.71
0.0333 --0.1863
0.54 -2.2'
-0.0911 -0.1548 -5_04 -8.90
ASST
-0.0585 -1.97
-0.1947
-5.14
-0.3021 -34.59
-0.2703 -0.1680 -0.4222 -5.32 -2.93 -13.33
-0_1853 -0~0191 -0.2663 -9.07 -0.71 -21.89
OBJT -0.0919 -1.54
-0.2223
-2.99
-0.2075 -8.71
-0.2095 -2.85
-0.0722 -2.21
-0.1240 -0.1969 -0.3611 -0.3893 -4.88 -6.17 -23.05 -10.67
AUTH
-0.0556 -1.14
-0,0739
-1.43
-0.0622 -5.23
TAX 0.0095 1.57
-0.0002
-0.06
0.0025 0_ 95
-0.1363 -0.0005 -2.66 -0.19
-0.0621 -0.0000 -3.30 -0.01
-0.1047 -0.0014 -4.10 -0.96
BR.D
-0.5216 -3.73
-0.1023
-0.76
0.0172 0_53
TRAD -0.2079 -1.87
0.0883
0.98
0.0266 1.41
0.0456 -0.0117 0.40 -0.19
-0.0590 0.1171 -1.20 4.11
0.2805 4.53
-0.0202 -0.58
Ind. & I I REG COEF,' -0.0704 -0.0663 -0.2432 -0.0561 -0.0819 0.0027 -0.1641 Pers. Trusts 30957 T STAT. -18.22 -12.94 -70.74 -9.74 -23.52 10.02 -17.09
0.0313 5.74
Other Accounts
Total All Accounts
359
37480
REGRESSION EQUATION
REG COEF. T STAT.
REG COEF. T STAT.
-0.1765 -0.1225 -3.07 -1.06
-0.0728 -0.1052 -19.30 -21.58
-0.2844 0.0941 0.0101 -7.78 1.24 0.19
-0.2541 -0.0752 -0.0814 -97.42 -13.47 -24.07
0.0037 1.37
0.0026 13 b8
-0_0716 -0.59
-0.1220 -13_28
-0.0511 -0.63
0.0295 5 _61
BROK 0.0052 3.97
-0 .. 0002 .0.17
0.000 0.07
0.0056 3.63
-0.0005 -0.94
SIZE -0.0387 -0.99
-0.0403
-1.33
-0.0210 -1.94
0.0237 0.62
-0.0090 -0.57
0.0014 -0.0338 1.86 -1.79
0.0006 5.40
-0.0026 -1.87
0.0005 5.19
0.0068 2.62
0.0277 0.89
-0.0036 -1.44
FUND
0.4832 3.73
0 .. 2010
1 .. 50
0.2687 6 37
0.3003 1.97
0.1875 3.18
0.2187 3.34
lURN
-0.0021 -2.06
0 .. 0002
0 .. 11
0.0025 4.13
CONS
0.51
-0.03
0.65
0.0049 I 0.65 2.43
0.0032 I 0.35 3.21
0.0013 1.08
1.22
0.0731 0.0056 I 0.37 6.67 27.34
0.5965 3.26
0.1664 15.92
0.0073 3.41
0.0055 29.56
0.20
0_42
R2
0.24
0.36
0.49
0.68
0.40:
0.69
0.33
0.56
0.37
LOG (FEE) - LOG(OONST) + bl
LOG(YEAR) + b2
LOG(V FR) + b3
LOG (ASSET) + blO
LOG (SIZE) + b4
(OBJT) + b5
(AUTIO + b6
(TAX) + .b7
(8R .D) + b8<TRAD) + b9 (BROK) + b" (FUND)
+ b12
(lURN)
t-:l
~
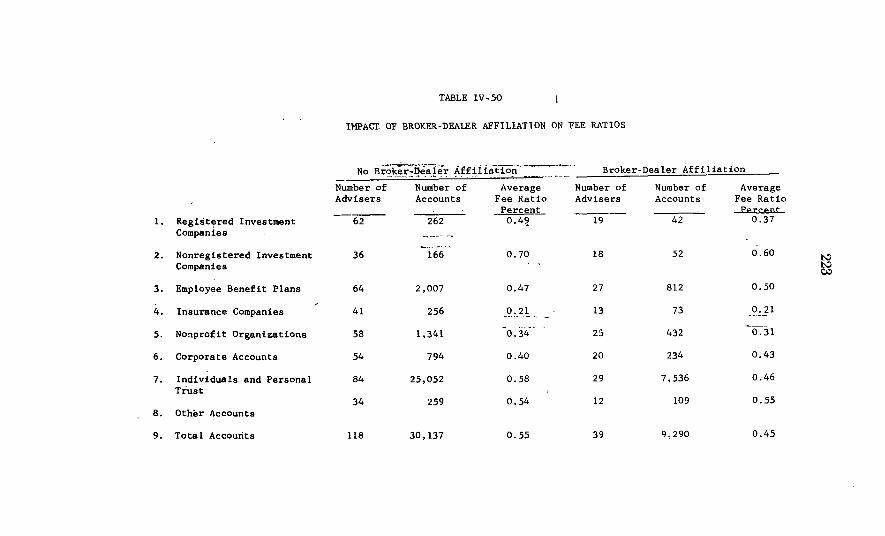
1. Regist~red Investment Companies
2. Nonregistered Investment Companies
3. Employee Benefit Plans
4. Insurance Companies
5. Nonprofit Organizations
6. Corporate Accounts
7. Individuals and Personal Trust
8. Other Accounts
9. Total AccOunts
TABLE IV-50
IMPACI OF BROKER-DEALER AFFILIATION ON FEE RATIOS
No Br;;~~~~a~!e~- ~fnTfati0"!t---~-=-.-=-- Broker-Dealer Affiliation
Number of Number of Average Number of Number of Average Advisers Accounts Fee Ratio Advisers Accounts Fee Ratio
Percent Ee:cceDt --~ 262 0.4~ 19 42 0.37
36 166 0.70 18 52 0.60
64 2,007 0.47 27 812 0.50
41 256 0.21 13 73 0.21 ---------58 1,341 0.34 25 432 0.31
54 794 0.40 20 234 0.43
84 25,052 0.58 29 7,536 0.46
34 259 0.54 12 109 0.55
118 30,137 0.55 39 9,290 0.45
t>:) t>:) t/.:l

TABLE IV-51
ADVISORY FEE RATIOS FOR ACCOUNTS ADVISED IN MUTUAL FUND COMPLEXES
I Non-Fund Com~lex Accounts Fund Complex Accounts - I . .. - Average Average
Account No. of No. of Fee No. of No. of Fee Type Advisers Accounts Ratio (%) Advisers Accounts Ratio (%)
1. Registered Investment Companies 28 69 0.39 53 235 0.50
2. Nonregistered Invest-ment Companies
36 170 0.58 18 48 1.00
3. Employee Benefit 70 2,468 0.47 21 351 0.58 Plans t.:)
~ 4: Insurance Companies 42 301 0.20 12 28 0.30
5. Nonprofit Organiza- . tions 66 1,580 0.32 17 193 0.38
6. Corporate Accounts 56 864 0.36 18 164 0.66
7. Individuals and 90 28,787 0.50 23 3,BOl 0.90 Personal Trust
B. Other Accounts 36 332 0.44 10 36 1. 52
9. Total Accounts 105 34,571 0.47 53 4,856 0.83 -- - "--- --- ~--- - -- ---- ---- --

22.5
E. ECONOMIC STRUCTURE OF THE ADVISORY INDUSTRY
1. Introduction
The purpose of Ithis section is to present an analysis of the economic structure of the advisory industry. The topics for analysis include operating revenues, operating ·expenses, advisory personnel and the profitability of firms ill the advisory industry. Where the data permitted, an attempt was made ,to separate regIstered investment company opemtions from other activities of the advisory firms.
The respondent group includes 129 advisory firms which were selected on the basis ·of mformation obtained from the 1-5 screening questionnaire. This number includes a random sample of 64 large ad-visory firms and a random sample of 65 small firms. .
The data for this seotion were obtained from the 1-65 guestionnaire, in particular from tables 3 (Statement of Gross Operatmg Revenue) and 5 (Personnel in Various CUitegOries) .
For a group of the firms with mutual fund principal underwriting operations, summary statistics are presented for net distribution revenue as a percentage of fund sales and total advisory profit. Alsol for advisory firms wh.ich acted as broker-dealers for client transactIOns, a summary table is included which contains the amounts of brokerage commissions obtained as a percentage of total operating revenue.
2. Analysis of Operating Revenues (see Tables IV-5·2 to 55) Operating revenue is composed of the following items: management
fees from adv:isory accounts, subscriptions and other revenue from publications, .commissions and give-ups on advisory client securities transactions, net distribution revenue from principal underwriting functions of the. adviser and affiliates and other revenue.49
Ta:bles IV-52 and IV -'53 show the composition of revenues for typical large and small advisory firms. Management fees have been separately reported for registered investment companieS, non-regis'tered investment companies, institutional and corJ?orate accounts, and individual and personal trust accounts. Distribution revenues are included with the "other revenue" category in the tables.
The average large advisory firm had $2.4 million of revenue in 1964 .and $3.2 million in 1968.50 In both years approximately 60 percent of total revenues were obtained from advisory fees, of which two ,thirds resulted from registered investm~nt·companies. A relatively small percentage (8 percent) of revenues resulted from publications. Brokerage commissions on advisory client transactions amounted to 4.6 percent of total revenue in 1964 and 12.3 percent in 1968. Other operating revenue (including mutual fund net distribution revenue) amounted to 27.4 percent of total revenue in 1964 and 16.4 percent in 1968.51
For small advisory firms, the average revenues amounted to $129,-000 in fiscal 1964 and $279,000 in 1968. Whereas 72 percent of revenue
,. The net distribution revenue Is the fraction of mutual fund sales loads retained by the adviser and any affiliated principal underwriters .
.. The datil. were renorted for the fiscal years of the advisory firms and thus do not represent results for Identical calendar periods. However, approximately 80 percent of the firms had December al year-endings.
111 Since the number of firms In the sample differ for 1964 and 1968, part of the change In the distribution of revenues over the four-year period may refiect structural changes with the remalnder due to change In the composition of the sample.

226
resulted from advisory fees in 1964, only 48 percent came from this source in 1968. Publication revenues were typically insignificant. Revenues from brokerage commissions increased substantially, from 14.3 percent of revenue in 1964 to 36.6 percent in 1968. Other operating revenues amount to approximately 12 percent of revenues in both years.
A substantial difference existed in both years between the composition of advisory fees for small and large firms. Whereas two-thirds of the advisory fees of large firms resulted from registered investment companies, a very small fraction of advisory fees resulted from this source for small firms. For small advisory firms approximately 85 percent of advisory fees resulted from individual and personal trust accounts.
Table IV-54 presents a diagram of total advisory revenue versus total advisory assets for the 1968 year. Revenues ranged from a high of $24 million to a low of less than $1,000. Advisory assets range from a high in excess of $5 billion to a low of $6,000.52 When a regression line was ,fitted to the data points, a 1 percent increase in advisory assets was found on the average to correspond to a 0.73 percent increase in advisory revenue. Simultaneously, as the proportion of registered investment companies in the total advisory assets increased, revenues increased. A 1 percent increase in the proportion of registered investment companies was on average associated with a 0.0082 percent increase in operating revenue. 53
Twenty-four advisory firms repol'lted receiving mutual fund underwriting revenues during 1968. Expressed as a percentage of mutual fund sales for these 24 firms during the year, net underwriting revenues averaged 1.09 percent of fund sales for the 24 firms.54 The values ranged from approximately 0 percent to a high of 5.0 percent of sa~es. Expressed as a percentage of total revenue, the average (unwelghted) percentage was 26.9 percent. Individual values ranged from 0.4 percent of 80.2 percent, with the higher values occurring in small advisorv firms.
Table IV-55 presents a distribution of brokerage commissions on client transactions as a percentage of total 1968 revenue. For the 32 broker-dealer affiliated advisers reporting, the average (unweighted) percentage was 51 percent.55 Individual values ranged from 0.05 percent to 100 percent. Again. the higher percentages tend to be associated with small advisory complexes.
3. Analysis of Operating Expenses (See TaJbles IV-56 to IV-60)
Tables IV-56 through IV-59 present operating expense data for the adv~sory firms in the 1-65 survey. The data were reported for the advlsory firms' 1964 and 1968 fiscal years. The first two tables
•• Table IV-54 shows thp natural IOf!'arlthm of revenue ver~U8 th'p naturAl IO~Rrlthm of advisory assets. To maintain confidentiality of the data, three firms with advisory assets in excess of $4 billion have been removed from the table .
.. Thp rpgresslon equation Is given by: Log. (REV) + -2.58 X 0.7348 Log. (ASRETS) X 0.0082 (Percent-REG. Ie)
(t=17.34) . (t=3Ji2) R·=0.77.Number Observations = 112 (Number of Firms with Completed Data) .
.. Tlnwelghted average of Indlvlrlual advisory firm percentages .
.. The weighted average for 1968 (see table IV-52) was 12.6 percent of total revenue.

227
provide total expense data for large and small advisory firms. The second two tables provide expense breakdowns for the registered investment company advisory and distribution functions for the subgroup of firms which reported separate investment company expense data.56
The total expense data for large advisory firms indicate that an average firm in the sample had $1.7 million of expenses (before taxes) in 1964 and $2.4 million in 1968. The largest single expense category was employee compensation, which amounted to 68 percent of total expenses in 1964 and 61 percent in 1968. Advertising and other solicitation of new business amounted to aP1?roximately 5 percent of expenses. Administrative expenses for chents amounted to a similar proportion of expenses.
The total expense data for small advisory firms presents a similar picture. Employee compensation was the major expense, amounting to 69 percent of expenses in 1964 and 63 percent in 1968. The total expenses for an average small advisory firm were $98,000 in 1964 and $222,000 in 1968.
For the sub-group of large firms providing an expense breakdown for registered investment companies (Table IV-58), these expenses were $1.8 million in 1964 and $2.1 million in 1968. Of these totals, personnel expenses amounted to 69 percent in 1964 and 60 percent in 1968. Advertisin~ expenses rose from 3.6 percent of expenses to 5.2 pereent between 1964 and 1968. Administrative services for registered investment companies averaged approximately 6.5 percent of total expenses for the two years.
Table rv' -60 shows a diagram of total advisory expenses versus total assets for 1968. Total expenses ranged from a high of $11.0 million to a low of $2,000.57
The reason for distinguishing between corporations and other or~anizational forms in the scattergrams and the rewession analyses results from the fact that small partnerships and sole proprietorships may have inflated expense values resulting from the practice of partners and proprietors taking what amounts to dividend payments from the firms in the form of salaries. This is not usually the case for larger corporations where officers are paid a salary and the excess of revenues over exnenseR after corporate taxes is either retained or pain out in the form of dividends. Respondents who were sole proprietorships or partnerships were asked to report an "equivalent" salary for principals rather than reporting as compensation the composite of salary as well as return on capital. In determining such equivalence, the partnership or sole proprietorship was asked to give due consideration to the rates of salaries or other compensation paid to officers or other policymaking employees by investment advisers similarly situated but doing business as a corporation. However, to give explicit recognition to the data quality problems, the scattergrams differentiated between the two types of organizational forms .
.. If an advIsory firm bad more tban 10 percent of its 1964 or 1968 total operatIng revenue from reglster!'iI Investment companIes a separate statement of advisory and dl9trlbutlon expenses for tbese advIsory accounts was requested.
117 Tbe scattergram sbow~ tbe natural 10gArltbm of revenue versus tbe nn.tural logarltbm of assets. To malntn.ln conflilentlallty of tbp ilata. tbree firms with total advisory assets In excess of $4.0 blllion bave been eliminated from tbe diagram.

228
Regression analysis was used to e:x:amine the statistical relationship between total expenses and total advisory assets. A factor was included in the regression to allow for differences in organizational form and hence, potential upward bias in expense data from sole proprietorships and partnerships. 58 The regression results indicated that, on average, a 1 percent increase in advisory assets during 1968 was associated with a 0.69 percent increase in expenses. Simultaneously, as the proportion of registered investment companies in the total advisory assets increased, expenses increased. A 1 percent increase in the proportion of registered investment companies was associated with a 0.0079 percent mcrease in total expenses. 59
4. Analysis of Advisory Personnel (Tables IV-61 and IV-62)
Tables IV-61 and IV-62 show the average numbers of advisory personnel in typical large and small advisory firms as of December 31, 1969. Within the eight employee categories used, the numbers of fulltime equivalent personnel are broken down between officers (that is, proprietors, partners or officers) and employees. The tab1es indicate that typically one-half of the employee category represent clerical employees. When the two categories are considered together, it is found that an average large firm had 76.9 full-time equivalent personnel in 1964 and 103.3 'full-time equivalents 'in 1969 while an average small firm had 10.5 full-time equivalents in 1964 and 12.0 in 1969.
Regression analysis was used to examine the relationship between advisory personnel and total advisory assets. The results indicated that, on average, a 1 percent increase in total advisory assets was associated with a 0.56 percent increase in the numJ?er of full-time et],uivalent personnel. The results also indicated the advisory firms WIth regi,stered investment company accounts tended to be some what more labor intensive. A 1 percent increase in the proportion of registered investment companies in the mix of total advisory assets was associated with a 0.0084 percent increase in the number of full-time equivalent personnel.60
5. Analysis of Profitability Data (Tables IV-63 through IV-69)
The purpose of this sootion is to combine the revenue, expense' and advisory asset data to develop measures of the profirta;bility of advisory firms. The primary profit measure used is the rate of before tax profits to advisory assets. Where the advisory firms had provided sepal\'\te expense data for registered investment company and other advisory
.. The structural variable, designated "FORM" had a value of 1.0 for sole proprietorships and partnerships and 0.0 for corporations.
58 The regression equation Is given by : Log. (EXP) =2.35-0.1481 (FOJ?M) +0.687& Log. (ASSET) +0.0079 (Percent R1!JGI'STERED Ie.) (t= -0.174) (t=16.24) (t=3.34) R"=0.75 Number of Observations = 112
eo The regreSSion equation Is given by : Log. (Personnel) -0.58 0.557'5 Log. (ASSETS) 0.0084 (Percent REGISTERED I.e.)
(t=13.90) (t=3.84) R"=0.70 Number of ObServations = 112.

229
aCIOOunts, profit mtios were computed for ·these aotivities as well as for the total firm.61
Tables IV-63 through IV-65 present profit summaries for the corporate form advisory firms in the 1-65 sample. Partnerships and sole proprietorships were eliminated to avoid potenti'al downW<!\Il'd bi'as in the profit ratios due to potentially inflated expense figures.
Table IV -63 presents profit data for the total advisory firm for fiscal yea;rs 1964 and 1968. 11he 60 respondent advisers for 1964 had totnJ adv:isory assets of $15.4 billion, total revenues of $97.2 million and total expenses of $59.7 million. The profit before federal taxes for these firms was $37.5 million which was 0.23 percent of total 1964 advisory assets. Expressed as a percentage of total advisory revenues, the profit amounted to 39 percent of 1964 revenues. When the advisory firms were grouped according to total 1964 adVoisory assets, the profit r·atio was seen to increase with tJhe size of the advisory firm. Adv:isers wibh less than $100 million of assets earned a total of 0.148 percent of the assets, advisers wjth more than $750 million of assets eUirned la total of 0.281 percent of advisory assets.
In 1968 there were 90 advisers with corporate organizational forms in the sample. These firms accounted for $40.7 billion of the estimated $130 billion of advisory assets. The sa;mple estimate for revenues, expenses and before tax profits were $170.3' million, $114.6 million and $55.6 million respectively. The profit figure represented 0.137 percent of 'advisory assets, about one-half the size of the 1964 profit ratio. The relationship between size of adVoisory firm and p~ofit ratio was not uniform in 1968. Middle range ($100 million to $750 million) advisory firms had the highest profit ratio (0.192 percent of assets) with large firms next (0.118 percent) followed by smaller firms (0.091 percent). The total profit for the 90 corporations in 1968 amounted to 33 percent of total advisory revenues.
Tables IV -64 and IV -65 are the results of the attempt to separate regis~d investment companies from other advisory clients to obtain separate profit measures. The first Table shows profit calculations for the advisory firms which furnished separate expense schedules for registered investrrnent companies. These calculations were possible for 27 adviser corporations in 1964 and 38 adviser oorporatJions in 1968. Profit ratios for the other assets advised by these firms are included in Table IV -64 for comparison purposes. Table IV -65 shows the aggregate profit calculations for the corporate form advisers who either advised no registered investment companies or for which no sepamte expense breakdowns were provided.62
For Ithe 27 advisers in 1964 and 38 in 1968 Ithe profit mitios were 0.36 percent of inveStmenlt oompamy ru:;sets in 1964 ·and 0.21 percent in 1968. These figures are based on $9.3 biJ,lion of IUSSelbs in 1964 and $17.6
61 In order to compute separate profit ratios for reg:lstered Investment companies and other clients when the required expense data were avaIlable, allocation of certain revenue Items was required. Publication revenue was deleted from consideration. Commissions and give-ups on advisory client securities transactions were allocated on the basis of the relative magnitude of registered Iu.vestment company and other client assets. The net distribution revenue component of "other revenue" was allocated entirely to Investment company revenues. The remaining "other revenue" was allocated on a basis of assets .
.. The latter group of firms advised relatively small amounts of registered investment compaBY assets. For example, $764 million versus $17.6 bUllon for the companies rep-resented in Table IV-Gi, -
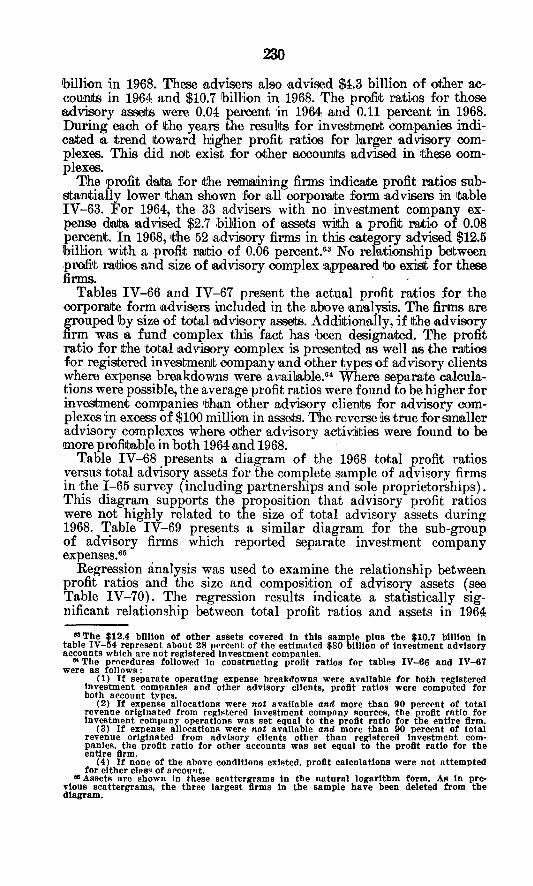
230
billion in 1968. These advisers also ,advised $4:.3 billi.on .of .other a.ccounJts in 1964 and $10.7 billi.on in 1968. The profit rati.os f.or those advisory assms were 0.04 percent in 1964 o!I!nd 0.11 percent in 1968. During eaoh .of It.he years !the resu~ts f.or investment companies indicruted a trend ltoward higher profit ratios for larger advisory oomplexes. This d1d ndt. exist fur other aooounts advised in these complexes.
The profit aruba for the remaining firms indicate profit ratios subs/:.8;ntially lower than sh.own for all corpol13Jte f.orm advisers in ltable IV-63. For 1964, the 33 advisers with no investment company expense daJOa !advised $2.7 bilEon .of la.$eJts wirth. a profi't l"llIti.o .of 0.08 percent. In 1968, Ithe 52 advisory firms in this category advised $12.5 billi.on wilth aprofi,t. l'Iruti.o .of 0.06 percent.63 N.o rel'llJt.i.onship oot.ween profi't. rwmos and size .of advisory complex appeared tbo exist. for these finn5. '
Tables IV -66 and IV -67 present the actual profit ratios for the corporaJte f.orm advisers included in the above analysis. The fimlS are grouped 'by size .of rotal ,advisory asseJts. Addilti.onally, if Ithe advisory firm wws a fund complex this :f,act has been designated. The profit rati.o for Ithe rot.al advisory complex is presen'ted ws well as It.he rrutios :lior registered invest.menlt oompany and .other types .of ,advisory clients where expense breakdowns were aVTailable.64 Where separalte calculations were possible, the average profit ratios were found to be higher for investment. oompanies 'ohan .other 3!dvisory clients f.or advisory complexes in excess of $100 million in asseIts. The reverse >is true ror smaller advisory oomplexes where .ot1her 'advisory activilt.ies were round to be m.ore profitable in both 1964 ,and 1968. '
Table IV -68 presents a diagram .of the 1968 t.otal profit ratios versus total advisory assets for the complete sample of advisory firms in the 1-65 survey (including partnerships and sole proprietorships). This diagram supports the proposition that advisory profit ratios were not highly related to the size of total advisory assets during 1968. Table IV -69 presents a similar diagram for the sub-group of advisory firms which reported separate investment company expenses.65
Regression analysis was used to examine the relationship between profit ratios and the size and compositi.on of advisory assets (see Table IV -70). The regression results indicate a statistically significant relationship between total profit ratios and assets in 1964
03 The $12.4 bUlIon ot other assets covered In this sample plus the $10.7 blIIlon In table IV-54 represent abont 28 pprcent of the estimated $80 bllIIon of Investment advisory accounts which are not registered Investment companies .
.. The procpdures followed In constructing profit ratios for tables IV-66 and IV-67 were as foll ows :
(1) If separate operating expense breakdowns were available for both registered Investment companies and other advisory clients, profit ratios were computed for both account types.
(2) If expense allocations were not available and more than 90 percpnt of total revenue originated from reglRtered Investment company Rources, the profit ratio for Investment company operations was set equal to the profit ratio for the entire firm.
(3) If expense all<>eatlons were not available and more than 90 percent of total revenue originated from advisory clients other than registered investment companies. the profit ratio for other accounts was set equal to the profit ratio for the entire firm.
(4) If none of the above conditions existed, profit calculations were not attempted for either claso of accolI'lt.
os Assets are shown In these scattergrams In the natural logarithm form. As in pre· vlous scattergrams, the three largest firms In the sample have been deleted from the diagram.

231
but the relationship does not continue to the 1968 period. There is also some indication ,that the investment company profit ratios tend to be higher with increased proportions of registered investment company assets but the result is not statistically significant.o6
6. Summary
The weighted average profit ratios for corporate form advisers were 0.23 percent and 0.14 percent in 1964 and 1968 respectively. While average profit ratios declined approximately 40 percent, total advisory assets grew from $15.3 billion to $40.7 billion and r.rofits went from $37.5 million (39 percent of revenues) to $55.6 mIllion (33 percent of revenues).
For advisory firms with separate expense breakdowns for registered investment companies, the profit ratios on these operations were seen
·to be substantially higher than. for other advisory accounts. The weighted average profit ratios were 0.36 percent and 0.21 percent of investment company assets in 1964 and 1968 respectively. This is contrasted with profit ratios of 0.04 percent and 0.11 percent for other advisory clients of the same firms.
For lLdvisory firms with little or no mutual fund accounts, the average profit ratios were 0.08 percent and 0.06 percent of total advisory assets in 1964 and 1968 respectively.
While large mutual fund complexes appeared to be typically more profitable than non-fund complexes, the reverse was true for fund complexes with less than $100 million. In 1968, the weighted average profitability ratio for ten small fund complexes was approximately -0.50 percent .
... The lack of slgni1lcance Is due at least In part to the mlxl.ng of profit ratios from large and small advIsory complexes. As seen from tables IV-66 and IV-67, the relative profitability for the two account -types chan~s between large and small advisory forms.

(a)
(b)
(c)
(d)
TABLE IV-52
GROSS OPhlOITl"NGliliVt;NUl; W- LARGE ADVISERS ($HRr MILLION OR-MO[E"""OF- ADVISOR'ir ASSETS)
964 YlSUL 'UR· 1968 FISCAL YEAR ..
Management Fees from Investment Advisory Services Averages ($000) 7. Averages ($000) 7-
(1) Registered Investment Companies 848.4 36.0 1258.9 38.9
(2) Offshore Funds 0.5 0.0 6.5 0.2
(3) Other non-registered investment companies (including 2.7 0.1 18.0 -, 0.6 investment partnerships [hedge funds]. clubs, venture capital funda, and other entities)
(4) All Other CHent Accounts
(a) Institutional and Corporate 168.3 7.1 262.2 8.1
(b) Individuals or Personal Trusts 389.8 16.5 497.2 15.4
lAoJ.-:-7- -- -2:042:8 _~ -TOTAL MANAGEMENT FEES ~59.7 63.Q
Subscriptions and Other Revenue FrOlll Publications 195.4 8.3 256.2 7.9
Commissions and Give-Ups on Advisory Client Securities Transactions 109.3 4.6 396.2 12.3
Other Operating Revenue 645.9 27.4 531.1 16.4
TOTAL OPERATING REVENUE 2,36Q 3 - 100.0 3,22fU- --- 100.0 -- --
* Number of Respondents 55 Average Firm Size (Dec. 1964) $516 Million.
** Number of Respondents 64 Average Firm Size (Dec. 1968) $859 Million.
t-:I Cr.j t-:I
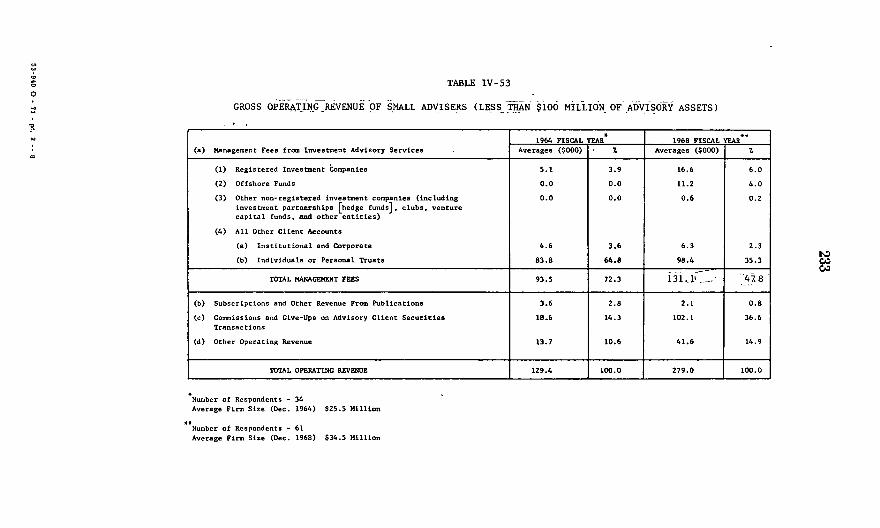
;2
~
. **
TABLE IV-53
GROSS OPER.\T31'!_G:"REVENUE -()F S_MALL ADVISERS (LESS_ T_HAN $106 MILLION_ OF _A~VI~ORY ASSETS)
* .. 1964 FISCAL YEAR 1968 FISCAL YEAR
(a) Management Fees from Investment Advisory Services Averages ($000) t Averages ($000) 7-
(1) Registered Investment Companies 5.1 3.9 16.6 6.0
(2) Offshore Funds 0.0 0.0 11.2 4.0
(3) Other non-registered investment companies (inc luding 0.0 0.0 0.6 0.2 investment partnerships [hedge funds], clubs, venture capitsl funds, and othe%' entities)
(4) All Other Client Accounts
(a) Institutional snd Corporate 4.6 3.6 6.3 2.3
(b) Individuals or Personal Trusts 83.8 64.8 98.4 35.3
TOTAL MANAGEMENT FEES 93.5 72.3 iji._l1~_- --47.8 -
(b) Subscriptions and Other Revenue From Publications 3.6 2.8 2.1 0.8
(c) Commissions and Give-Ups on Advisory Client Securities 18.6 14.3 102.1 36.6 Transac tions
(d) Other Opera tiog Revenue 13.7 10.6 41.6 14.9
TOTAL OPERATING REVENUE 129.4 100.0 279.0 100.0
Number of Respondents .. 34 Average Firm Size (Dec. 1964) $25.5 Million
Number of Respondents .. 61 Average Firm Size (Dec. 1968) $34.5 Million
!
i i
I I
I
I
l\:) C/.j C/.j

~e '.'H' Revenue
8.97 x
___ ._..1,9b_X _____ ~_ .. ____ ._
-b.~5 X
5.94 x.
4.94 X _2
3.93 X
---- ---i.C;2 x .... _.1
-2 l. cH x
o.en X I . __
TABLE IV-54 Loge of 1968 Total Advisory Revenue
Vs. Loge of Advisory Assets
I 2 I 2
I 2 2 X 22
I 2 2
2 22 21 2 2 2
II 22 I 2
2 I -------.----~-.- I 22
i -2
_ 2._
2 2
2 2
2 2
2 I
I 2
2
2 2
x2 I
• 2
22 2 2 I
2 __
2 2
S)'lI1bols:_ 1. Sole Proprietorship or.~E~nershl 2. Corporat.ion X. Multiple Observation
••••••••• + ••••••••• + ••••••••• - ••••••••• + ••••••••• + ••••••••••••••••••• + ••••••••• + ••••••••••••••••••• +--0.9395 ..:!'1563 1.2522 2.348<) 3.1t .. 38 4.5396 5.6354 6.7312 1. e211 8.9229
---------Loge ASSets
I:>:)
~

235
TABLE IV-55
BROKERAGE COMMISSIONS ON ADVISORY CLIENT TRANSACTIONS AS A PERCENTAGE OF TOTAL REVENUE
1968 FISCAL YEAR - 32 BROKER-DEALER AFFILIATED ADVISORY FIRMS
Percentage Range Number of Firms
0-5 3 5-10 1 10-15 0 15-20 0 20-25 1 25-30 2 30-35 3 35-40 1 40-45 2 45-50 1 50-55 3 55-60 3 60-65 1 65-70 2 70-75 2 75-80 2 80-85 2 85-90 1 90-95 1 95-100 1
32

TABLE IV-56
TOTAL OPERATING EXPENSES FOR LARGE ADVISORY FIRMS ($100 OR MORE OF ADVISORY ASSETS)
EXPENSE ITEM
SUbSCriptl0ns to Other Publ:Lcatl0ns and Statistical Servlces
h. Advertising and Other Solicita[10n of Customers
Employee Compensatlon (includ1ng partners, officers, directors, consultants. etc.)
(1) Account Supervlsors. Counselors. and Portfolio Managers Research Staff Sales Personnel Professional Traders Clerical. Secretarul Executivl:'!S (not lncluded above Other Personnel (specifv
d. Cost of Publ1catl.ons Sold
Occupancy Expense
f. Communications Expense
g. Equipment Expense
h. Travel and Entertalnment Expense
1. Adrlllnistrative Services for Chent&
j. Depreciation
k. Other Operating Expenses
1. TOTAL Operating Expense
Number of Respondents: 55 (1964); 64 (1968).
1964 TOTAL EXPENSES AV. (SOOO) I %
9.5 0.6
84.4 5.0
301.4 17.R
158.2 9.4 346.0 20.S
11.3 0.7 168.3 10.0 92.9 •• 5
64.8 3.8
44.1 2.6
57.0 3.4
47.1 2.8 I 21.8 l.3l 31.3 l.9l 78.5 4.6
18.7 1.1
154.2 9.1
1689.5 100.0
1968 TOTAL E.'{PENSES
AV. (SOOO) I 7.
18.8 0.8
130.1 5.5
430.) 18.2 215.1 9.1 l 251.9 10.6
22.8 l.0
266 147.1 6.2 110.0 4.6
53.1 2.2
84.9 I 3.6
89.4 I 3.8
58.4 I 2.5
60.7 I 2.6
135.1 I 5.7-
34.0 I 1.4
255.7 I 10.8
2363.9 I 100.0
~ C\j Cf)

TABLE IV-57
TOTAL OPERATING EXI?ENSES FOR,SMALl: ADVISORY FIRMS
(LESS THAN $lOO'-MiLLION OF·AnViSORY.AS.SETS)
I%ZI--- ----r965 EXPENSE ITEM I TOTAL EXPENSE TOTAL EXPE~SE
AV. {SOOO % A". "oom 7.
Subscrlptions to Other Publications and Statistieal Servlces I 2.0 1 2.0 4.3 I 1.9
b. AdvertiSing and Other Solicitation of Customers 1 3.9 1 4.0 6.5 I 2.9
Employee Compcns8tl.On (includlng partncr;s, affic".'>. directors. consultants, etc.)
(1) Account SUoervlsors Counselors nod Portfolio Mana£':crs 33.2 33.9 44.3 20.0
Research Staff 5.0 5.1 13.2 5.9 3 Silles Personnel ... ..7 47.4 21.4
~41 Prafe.sicnal Traders 0.0 0.0 1.2 0 ••
.is) Clerical Secret<Jrial 13.9 14.3 19 0 8 •
Executives not lnc luded above 4.6 4.7 11.5 S.::! Other Personnel {seeclf:t: 2.8 2.9 3.5 I..
d. Cost of Publications Sold 0.4 0.4 0.9 0.4
Occupancy Ex.pense 6.4 •. 5 8 .• 3.9
f. Communlcations Expense 4.3 4.4 11.2 5.0
g. EqUipment Expense 1.5 1.5 4.9 2.2
h. Trave 1 and Enterta lnmcnt Expense 2.8 2.8 4.8 2.2
Adminlstrative Services for Clients 0.3 0.3 1.9 0.8
j. Depree 1a tion 0 •• 0 .• 1.4 D ••
k. Other Operating Expenses 9.7 9.9 37.2 16.8
1. TOTAL Operating Expense 98.0 100.0 221. 8 100.0
Number of Respondents: 35 (1964); 61 (1968).
t>:) c,.:) ~

TABLE IV-58
OPERATING EXPENSES OF REGISTERED INVESTMENT COMPANY ADVISORY AND DISTRIBUTION FUNCTIONS-LARGE ADVISORY FIRMS ($100 MILLION OR MORE OF ADVISORY ASSETS)
EXPENSE ITEM
Subscnptions to Other Pubhcations and Statistical Services
b. Advertising and Other Solicitation of Customers
Employee Compensation (including partners, officers, d1-rectors. consultants, etc.)
~l) Account Supervisors. Counselors. snd Portfolio Managers Research Staff Sa les Persanne 1 Professional Traders Clerical. Secretarial Executives (not lncluded above Other Personnel (specifv
d. Cost of Publicatl.ons Sold
Occupancy Expense
f. Communications Expense
g. Equipment Expense
h. Travel snd Entertalnment Expense
1. Admlnlstrative Services for Clients
j. Deprecia tion
L"9o' REG. INV. CO.
AV. ($0001
6.1
63.6
212.9
~ lli-l.
14.8
!QLl.
ll&. 0.0
39.2
55.2
26.8
29.4
110.3
19.4
0.4
3.6
!1..J! 5.8
~ ....Q.&
7·' ...Ll hi! 0.0
2.2
3.1
1.5
1.1
6.2
1.1
1905 REG. n:v. CO.
AV. (SOOO
121
111.5
1.§l.:2 140 J
ll..U ...1!!..:1.. 205.3
ill.J!. l.QQ..&
0.0
6:>.0
94.6
65.6
61.4
144.1
28.4
0.6
5.2
12.3 6.6
!l..:..§. ...!.:1
9.6
..JL.!t !41. 0.0
3.0
4.4
3.1 i
2.9
6.7
1.3
k. Other Operating Expenses -~1 190.0 I 10.8 I 273.7 I 12.8
I 1. TOTAL Operating Expense 1767. l 100.0 213~.8 100.0
Number of Respondents: 29 (1964); 36 (1968)
~

b.
d.
f.
g.
h.
J.
k.
I.
TABLE IV-59
OPERATING EXPENSES OF REGISTERED INVESTMENT COMPANY ADVISORY AND DISTRIBUTION FUNCTIONS SMALL ADVISORY FIRMS (LESS THAN $100 MILLION OF ADVISORY ASSETS)-
1964 1968 EXPENSE ITEM REG. 1NV. CO. REG. lW. CO.
7. AV_ soon SubSCrtptIons to Other Publications and Stattstieal Servlces 6_ I I 11.5 4.::!
Advertlslng and Other Solicltatlon of Customers 0.2 10 4 3.7
Employee CompcnS8tl.On (i.nciuding partners, officers, dIrectors, consultants, etc.)
Account Su etvlSOrs Counselors and Portfolio Managers 50.0 46.0 )0.8 11.1 2) Research Staff o 2 0 I.S 1.5 0.6 3 Sales Personnel 1.2 1.1 87.6 31.6
~42 Profelsional Traders 0.0 0.0 1.0 0.41 (52 Clerica 11 SecretarIal 16 2 14.9 19.9 1.21 6 Executives not tOC ludcd above) 1.0 0.0 S.' 3.2
Other Personnel sn~clfv 5.8 5.3 2.2 O.S
Cost of Publications Sold 0.0 0.0 1.6 0.6
Occupancy Expense 4.4 4.1 5.3 1.0
Co=nlcatlons Expc!nsc 5.0 4.6 10.8 3.0
Equipment Expense 0.2 0.2 1.5 0.6
Travc 1 and Entertainment Expense 3.6 3.3 75 2.7
Adminlstrative Services for Clients 0.0 0.0 4.' 1.6
Depreclation 0.4 0.4 o 7 0.2
Other Operating Expenses 12.0 11.0 71.2 25.7
TOTAL Operating Expense IOS.6 100.0 277 100.0
Number of Respondents: 5(1964) ; 13( 1968)
tv C>:l ~

~Loge <).<:;4 'J(
, "E'ip'ens'e>,
8.56 x
7.62 )(
6.65 X
5.6<; X .
4.72 X
3.76 )('
- .
2.80 X
-2 . __ ._ 1.83.)(
9.87 x
_ 1.
2 .
TABLE IV-60
Loge of 1968 Total Operat1ng Expenses vs~ Loge of
Advisory Assets
2
2 21 2
_2
___ .. _ .. ____ . 22
.2 __
22
221 1
III 222
2 x2 1 21 2
11
2 2 22
1 2'
1 .
.,
2 2 2
2
. ___________ 2.. __ 1.
'2 . 2
2 2
22
22
2. 2
1 1
21 2 _
. _________ 2 . _______ . __ -.5.¥.mbcl.s..:... __ ._. ___ .. 2
_ 2. _2.._ 1. Sole Proprietorships .o.r Partner.ships 2. Corporations
1 - 3.- Multiple Observations
_. 2
1 ___ . ____ . __
••••••••• + ••••••••• + ••••••••• + ••••••••• + ••••••••• + ••••••••• + ••••••••• + ••••••••• + ••••••••• + ••••••••• + -0.9395 Ca1563 1.2~22 2.3460 3.4438 4. 53C;6 5.6354 6.73127.82718.9229
Loge Assets
~

TABLE IV-61
ADVISORY PERSONNEL -LARGE ADVISERS ($100 MILLioN OR 11ORt: Ot' ADVISORY ASSETS)
NUMBER OF FULL-TIME EQt:I\·,\ LENTS
EMPLOYMENT Proprietors, Partners Employees CATEGORY or Officers
Dec. 31, 1964 Dec. 31. 1969 Dec. 31, 19f14 Dec. 31. 1969
Average % Average % Average ~, .-\\'crage .. , 1. Account Supervisors, Counselors and 3.5 42.8 4.8 40.3 4.5 6.5 fl.3 fl.9
Portfolio Managers
2. Economic Research Staff 0.4 4.3 0.6 4.8 0.6 0.9 0.9 1.0
3. Investment Research Staff 1.0 12.5 1.3 11. 2 7.4 10.8 9.0 9.9
4. Sales Personnel 0.9 11.1 1.3 11. 3 18.2 26.6 13.9 15.2
5. Professional Traders 0.1 1.6 0.3 2.1 0.7 1.0 1.5 1.6
6. Clerical, Secretarial 0.1 0.7 0.1 0.9 28.0 40.8 43.8 47.8
7. Executives (not included above) 2.0 24.6 3.1 26.2 1.2 1.7 1.5 1.6
8. Other 0.2 2.6 0.4 3.2 8.0 11.7 14.6 15.6
TOTAL PERSONNEL OF 8.'2 00.0 H.g' 00.0 68.6 00. 91. 5 00.0 INVESTMENT ADVISER
Number of Respondents: 1964. 55; 1969, 64
~ -

TABLE IV-62
ADVISORY PERSONNEL - SMALL ADVISERS -(LESS THAN :;;IOu MILLION ur' ADVL:iORY A;3SET5)--
EMPLOYMENT
CATEGORY
1. Account Supervisors, Counselors and Portfolio Managers
2; Economic Ii esearch Staff
3. investment R e~earch Staff
4 .• Sales Personnel
. 1
5. Professional Traders
6. Clerical, Secretarial
7. Executives (not included above)
8. Other
NUMBER OF FULL-TIME EQUIVALENTS
Proprietors, Partners Employees or Officers
1.2 61.41 1.2 48.7 I 0.9 10.8 I 0.8
0.1 5.0 I 0.1 3.8 I 0.0 0.31 0.1
0.2 10.0 0.3 11.2 0.3 3.6 0.5
0.1 6.7 0.3 13.8 2.2 25.3 2.6
0.0 0.0 0.0 1.4 0.1 0.6 0.2
0.0 0.0 0.0 1.7 4.8 55.2 4.8
0.2 10.51 0.4 14.4 I 0.2 2.31 0.4
0.1 6.21 0.1 5.1 I 0.2 1.91 0.3
1969
%
8.0
0.8
5.3
lUI
1.5
~O.O
4.2
3.5
TOTAL PERSONNEL OF INVESTMENT ADVISER
1.9 100.a 2.4 100.Q .~.7 100. ~ .9_,J 1100.0
Number of Respondents: 1964, 33: 1969, 61
~

FIRM SIZE
(~ MILLION)
750+
100-750
Less Than 100
., Totar , .. -
I
243
TABLE IV-63
PROFIT SUMMARY
ALL ADVI3ERS WHO-WERE CORPORATIONS -- 1964
--
ASSETS I REVENUE NUMBER OF EXPENSES -AIivisERS ({ "MILLiON) ($ MILLION) (S MILLION)
-9~436~} _ ~i-.67 ---7 35.16
22 _5,874-.6 30.26 20.56
31 -- ... -
5.30 4._00 .- __ 876. R
.- -' 60
I 15-,388; ~ 97.23 59.72
PROFIT (S MILLION)
26.50
9.70
1.30 "
37.5
I
ALL AQYISERS WHO WERE CORPORATIONS -- 1968
PROFIT TO ASSETS
PERCENT
.281
_165
.148 '-..-"
-' .232
--~F~InRUM---'-----------'---------r-----------r----------"----------P-R-O-FI-T--T-O
SIZE NUMBER OF ASSETS REVENUE EXPENRES -PROF ii- ASSETS (S MILLION) ADVISERS. ($ 'MILLION) ($ MILLION) Lt MILLION) ($' -MILLiON) PERCENT
750+
100-750
Less Than 100
Total
14
33
43
90
1 28,736.4
10,710.6
.1,272.2
40,719.2
99.25
62.00
9.01
170.26
41.48
7.85
114.62
33.96
,20.51
1.16
55.63
.118
.192
.091
.137 --------~--.------L-______ _L ________ _L _______ ~ ________ _L ____ __

FIRM SIZE
$ MILLION)
750+
100-750
Less Than 100
Total
FIRM SIZE
,.; ~($-1-iILLION)
750+
100-750
Less Than 100
Total !
TABLE IV-64
PROFIT ANALYSIS -- INVESTMENT COMPANY ADVISERS (CORPORATIONS ONLY)
1964 ASSETS ($ MILLION) REVENUE ($ MIL.) EXPENSES ($ MIL.) PROFIT L~ MILLION)
NUM3ER OF INVESHIENr INVESTHENT INVESTHENT I IIIVESTMENT I COMPANY OTHER COMPANY OTHER COMPANY OTHER COMPANY ' OTHER
6,'219.9 I ,-
5.41 25.76 .75 7 13 ,216.8 55.61 6.15 29.76
1
, , 13 2,930.6 964. 3 16.62 2.25 8'.99 1.30 7.63 .95: , 7 176.9 90.3 1.24 0.24 0.79 - 0.41 0.46 ,-.p,
i .. ... 27 9,327. 4 4,270.4 ~_-:i3,:47 8.64 39:'51 7,.1.2 i 33.66 1.53
I -
1968'
ASSET S ($ MILLION) REVENUE ($ MIL.) EXPENSES ($ HIL.) PROFIT ($ MILLION) NUM3ER Qf INVESTMENT INVESrHE~T INVESTMENT INVESTMENT ADVISERS' l' • COMPANY OTHER COI1?ANY OTHER COMPANY OTHER COMPANY OTHER
. 29.60 3.59 11 12,599.4 8,701.6 ' 75.88 13.55 4'6.28 9.96
17 ,
4,7io.7' 1,870-<0 2~;~95 I 15.60 15.15 7:75 8.8'1 7.85
Ie ' -
'1.,28 0.4{.
I '2.20 0.47 -.92 I ~O: 19 192.0 llt,.4
;... 'R
'r
I -..
l,ll:25 38 17.5,6£: 1_ ,l0,68g.0 1O:1.11 29.59 63.63 18.18 37.4</ ! '
---I
PROFIT ASSETS % INVESTMENT
COMPANY OTHER
~4~4 0.0233
.260 0.0986
.260 -0.1883 ,
'.3'61 0.0358
t
PROF IT ASSETS % INVESTMENT
COMPANY OTHER
.235 ' 0-.0413
.185 'O.,4198-~
-.479 -0.i66i
.2135 0.IU53

Firm Number Size of
($mil) Advisers
750+ 0 100-750 9 Less Than
100 24 Total 33
Firm Number Size of
($mil) Advisers
750+ 3 100-750 16 Less Than
~ 33 Total 52
245
TABLE IV-65
PROFIT ANALYSIS
ADVISERS WITH NO iNVESTMENT COMPANY
EXPENSE DATA (CORPORATIONS ONLY)
1964
Assets Revenue Expenses ($mil) ($mil) ($mil)
0 0 0 1 980.7 11.39 10.27
.-99i 3 "i.82 _i:81 2 678.0 15.21 13.08
1968
Assets Revenue Expenses ($mil) ($mil) ($mil)
7 435.5 -- 9.8~ 9.05 4,069.9 22.44 18.58
965.7 7.45 5.58 12 471.1 39.72 33.21
Profit Profit Assets ($mil) (%)
0 -1.12 _ .0.0565
LOl 0.1448 2.13 0.07Q5
Profit Profit Assets ($mi 1) (%)
0.77 0.0104-
3.Jl6 0.0948
2.27 Q.2351 6.90 0.0553

246
TABLE IV-66
PROFIT RATIOS FOR ADVISORY COMPLEXES WITH CORPORATE ORGANIZATIONAL FORMS - 1964
Size Profit Ratios - Percent of Advisory Mutual Other Registered
Complex Fund Advisory Investment Total ($ Million) Complex Clients Companies Complex
750 -0.004 .161 .092 and Excludaq to - .295 .295 over preserv~ - .991 .991 . -
confide'ltiality - .323
I
.323 - .227 .227
- .001 .220 .017 ; .050 -.158 .047
Averages .015 .294 .285 (3) 0) (7)
I yes - .102 .102 yes - .202
I yes - .200
I .206
no -.002 .301 .074 yes - .187 .187 yes - .276 .276
100- yes - .636 .636 yes - .181 . 181
750 no .054 -.061 .023 yes -.253 .0lD - .027 yes .620 .664 .644 yes 1.249 .194 .196
I no - .002 - - .002 no
I - - .004
no .025 - .025 no - .048 - - .048
I no .031 - .031 no -.031 .428 .007 yes - 0.369 .369 no .016 - .016 no .001 - .001 no .720 - .720
Averages .182 .269 .174 (3) (3) ( 22)
yes - .156 .156
Less yes - .685 .685
Than yes - - .172
100 nO .620 - .620 no -
I - .235
no .018 - .018 -. --

Size of Advisory
Complex ($ Million)
Less- than 100 (continued)
Mutual Fund
Complex
no nO
no no no yes nO
no nO
no
247
TABLE IV-66 (continued)
Other Advisory Clients
.015
.733
.600 -.142
-1. 333 .095
Ratios - Percent Registered Investment
prrit
r I -I -3.397
I
Total Complex
.055
.015
.733
.600 -.142
-5.397 - 1. 333
.095 1.297
.165 .105 ,no .265 .265 I no -2.857 -2.857
I no . 305 . 305 no .024 no -.478 -.478 no .045 .045
I no .031 .031 no . 259 I .259
I no -0.031 - I -0.031
------ - ----'-- - n~ ____ --!-__ ---'-·72=-=59 -----=--::-::--=1 .259 Averages - (~:~ --T -.852 - --~8-5--
+-------1---~~--I-+- __ .llL - -- .Q~)* --
Averages .029 .130 I .066 (34) (23)! (55)
* Five advisors with less than $1,000 or assess were deleted from the sample

248
TABLE IV-67
PROFIT RATIOS FOR ADVISORY COMPLEXES WITH CORPORATE ORGANIZATIONAL FORMS - 1968
Size of Advisory
Complex ($ Mi 11 ion)
750 or more
Mutual Fund
Complex
yes yes yes yes yes yes yes no
t
no I nO I no I
Other Advisory
- Clients
.013
.015
.143
nO t-no ---l----=-no _
- .015 .021 .018 .006 .080 .015 .036 .030 (10)
100-
750
yes yes yes yes yes yes yes yes yes yes yes yes yes no no no nO no no no no no yes no no
- .169
.070
.048
.398
.448
.983 0.008
.003 1.010
.158
.037 -0.017
- .009 .001
-.031
Profit Ratios - Percent
I I
Registered -- ,---------Investment Companies
.355
.042
.270
.312
.305
.176
.188 -.146
.212
.009
-.494
.112 (11)
.148
.219
.124
.279 -.074
.136
.015
.099
.037
.636
.127
1. 137
.317
.344
Total Complex
.141
.017
.270
.312
.305
.176 · 181
- .032 .075
I O:~~;
.015 _-j-__ .:.2?_6 _
.113
---I~)-· 148 · 150 .219 .124 .270
.. 074 .136 .05l .099 .020 .524 .172 .226 .995 .008 .003
- .010 .158 .037 .010
- .009 .001 .344
-.031 .704
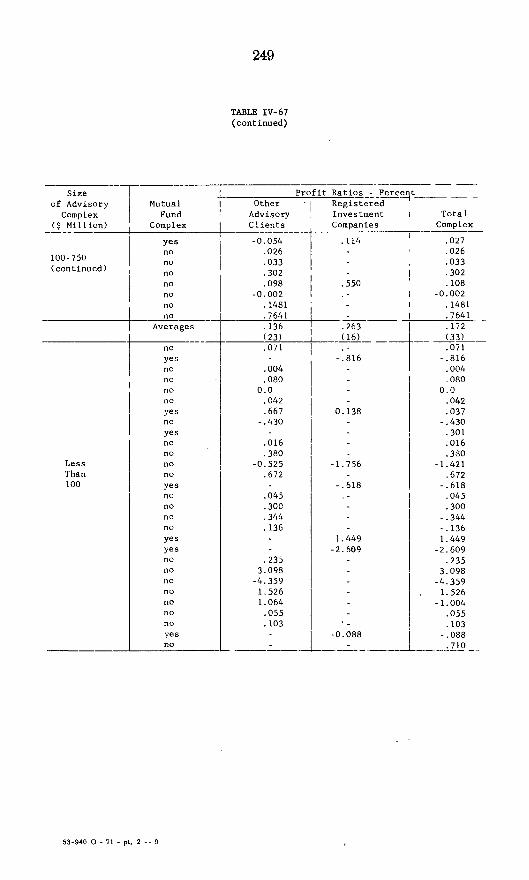
--T Size of Advisory Mutual
Complex Fund
-'"-"uu~ Complex I
yes I
100-750 nO
I no (continued) no
I
nO nO nO no
-I Averages
no --r yes I no
-I no no
I no yes no yes no no
Less no Than no 100 yes
no no no no yes yes no no no no no no no yes no
53-940 0 - 71 - pt. 2 - - 9
249
TABLE IV-67 ( continued)
Other Advisory Clients
-0.054 .026 .033 .302 .098
-0.002 .1481 .7641 . 136 (23) .071
.004
.080 0.0
.042
.667 -.430
.016
.380 -0.525
.672
.045
.300
.344
.136
.235 3.098
-4.359 1. 526 1.064
.055
.103
Profit - I
I
---------- - ---Ratios :)~~E!:~t _____ Registered Investment I Total Companies Complex
.114 .027 .026 .033 .302
.550 .108 -0.002
.1481 I .7641 -"'-i _m' _(16)_ _ _ -.-U~_
. - .071 -.816 -.816
- .004 .080
0.0 .042
0.138 .037 - .430
.301
.016
.380 -1. 756 -1. 421
.672 -.618 -.618
.045
.300 -.344 -.136
1.449 1.449 -2.609 -2.609
.235 3.098
-4.359 1. 526
-1. 004 .055 .103
- ~0.088 - .088 - - ._-,11.9 __ ------ ._--

Size of Advisory
Complex ($ Million)
Less than 100 (continued)
TOTAL
Mutual Fund
Complex
no no no no no no no no no no no no nO
250
TABLE IV-67 (continued)
I Other I ~?visor ~ients
I .250 . . '50
1. 015 .302 .478
0.098 1.580 -.093
.984
Profit Ratios - Percent ____ _ Registered Investment 1 Total
. Companies Complex -r-------- -- -I ----- :---, . - .2)0
1 .750
.550
1.015 .302 .478 .108
-1. 500 -,093
.984 -.002 -.002
- . 300 1 - • 300
nO Averages ~
'148 - .148
-1.114 I - i -1.114
-j-_--:---"'e..-___ :g;t- r-_j03- - -l----:~;i-
I (36)+_(_8_) _____ 1 ____ ~4~ __ _
I .076 .041 I - .066_ (69) I (35) ___ I ___ (~_. _
Parenthesis indicate number of firms

profit
3.C2 )(
2.28 X
_I. ~3 _X _. _ .• _ -2
0.19 X
0.04 X
-0.7CJ X
-1.45 X
-2-.20-X
-2.94 oj.
-3.09 X
.. 2.
TABLE IV-68
.l_~68 Total as a Percentage
ef Advisory Assets VB. Loge of Advisory ASsets
.2. 2 1
1 X X 1 2 2
22 1 2 X Xl 22 12 1 Z
2
-_. _ .. --. _. --r-
1 1 2 1 2 2 2 2 2 1 X 22 2222 1 Z
X2 lX2Xl Xlx22221 222 X Xl X
__ Symbols: .1. Sole Proprietorship or Partnership _._ 2. Corporation X. Multiple Observation
••••••••• + ••••••••• + ••••••••• + ••••••••• + ••••••••• + ••••••••••••••••••• + ••••••••• + ..................... .. -0.9395 O.1~o3 1.2522 2.34803.04438 4. 53t;6 5.63546.73127.81718.9229
Loge 8ssecs
t-:) C;1 ~

Ie PkCFITS \IS. Ie ASSETS,
1. 1,1 '<2
1.00 x
1 ~;:)'J
TABLE IV-69 l'Jt.U IU.l..o. INVL.,lNI~Nl l.U~U.·J\N'l L'!lUlll:... i\~ h 1'I1IcrNThCr. OF nrc, TNvr.'1'fHr,NT
COMPAN~ ASSETS VS. LOGiOF INVESTMENT COMPA~ ASSETS
.. 0.60 X - - - _. ~- -----~~ _ .. --- -- --- ._-- - __ .-l--_______ . _____ . 2
C.19 X
-0.21 ,
-(' .62 X
-1.03 x
-1.43 x
2-
.=.1.<4 X
-2:24 x
2 2 2
2 2
2 2 X .X_2 __ 22 _ L
221 22
•.•••••••• + ........... + ....................... + ••••••••• + ••• , ••••• + ..................... + ..................... + -0.9579 J. 036-5 1. ,17J:8 2.1051 3.1395 4.1738 5.2081 6.2425 7.2768 8.3112
CELL SIZES -.- C.1G34 . o.vQ1Z LOGE ASSETS
I:>:) 01 I:>:)

TABLE IV-70
SUMMARY OF PROFITABILITY REGRESSION RESULTS
DEPENDENT - % _cL09'E_ ' LOGE
VARIABLE INTER- LOGE ' REG _ ft.§SET ASSET 2 YEAR PROFIT RATIO NO. OBS. CEPT FORM R.lA* R.BD** ASSET I.C REG' IC . OTHER R
TOTAL 77 -0.63 -0.1531 -0.0035 0.0003 0.0782 0.0018 (-1.05) (-2.07) (0.36) (2.26) (0.98) 0.19
• 1964 REG. IC 29 0.50 -0.2852 -0.0000 0.0005 -0.0139 0.08
(-1.34) (-0.01) (0.13) (-0.24)
OTHER 55 -2.14 0.0577 -0.0031 0.0005 0.2003 (0.22) (-0.99) (0.35) 0.21) 0.19
TOTAL 112 0.55 -0.0606 -0.0026 0.0004 -0.('267 0.0018 (0.34) (-1.21) (0.35) (-0.70) (0.83) 0.04
1968 REG. Ie 43 -0.15 -0.2450 0.0000 0.0014 0.0129
(-0.58) (-0.00) (l.87) (0.13) 0.13
OTHER 83 0.,05 -0.0046 -0.0021 0.0004 0.0141
I (-0.04) (-1.74) (0.54) (0.58) 0.07
* Percentage of 1969 gross income of adVisory complex and affil~ated companies from investment advisory services.
** Percentage of 1969 gross income of advisory complex and affiliated companies from broker- deale.r ~ functions (t statistic)
t..:l c-. CA:I

254
F. PERFORMANCE FEES
1. Introduction
The use of performance fees to reward investment company advisers is now commonplace. A significant proportion of all investment companies, particularly those with growth oriented investment objectives, have incentive fee advisory contracts. This is a relatively recent development. In mid-1966 there were only four mutual funds with performance fees, but one year later, there were 16. By mid-1968 there were 54: 120 by mid-1969 and on June 30,1970, 12R were in effect 'with 52 additional performance fee contracts proposed for funds whose registration statements were pending at the Commission. Reflecting the dramatic trend to incentive fee arrangements, approximately 40 percent of the registered investment companies which commenced operations during 1968 and 1969 proposed to use incentive fee arrangements.
The Investment Company Amendments Act of 1970 substantially restricts the type of performance fee arrangement permissible and proscribes the classes of advisory accounts for which incentive fees may be charged.67 Notwithstanding these legislative protections, which will be discussed in detail in section 3 below, other questions remain. Issues must be resolved such as how performance is to be evaluated, the characteristics of an' appropriate index against which performance may be measured, the payment of fees and credits, and protecting shareholders against the adviser's possible default in satisfying liabilities resulting from poor performance.
This section discusses (a) the current situation relating to perform-31nce fee usage, (b) the legislative history of statutory provisions relating to performance fee arrangements, (c) the .question of measurement of the adviser's performance, and (d) certain other issues raised by incentive fee arrangements.
Performance fees have been criticized on the grounds that they are a one-way street to higher fees, that they encourage specul3Jtion and that they create severe conflict of interest problems within an advisory complex. The following excerpts from a letter by Mr. George S . • Johnston, Chief ExecutIve Officer of Scudder, Stevens and Clark, the larQ,'est inveqtment counsel firm, established in 1919, clearly present this point of view: 68
We ... urge the concept that the identity of interest between client and adviser should be maximized whenever possible and conflict between the two should be reduced to the minimum. We believe that leveraged advisory fees have the opposite tendency . . .
It seems to us that other than the desire for more management fees, the adviser's justification of leveraged fees is based upon two premises, both of which we consider untrue. The first false premise is that an investment advisory fee based upon a specific percentage of capital and terminable a-t will, lack~ incentive to provide the best service for a client. This is simply inaccurate. 3'here is built into such a fee structure a reward for appreciation. Of greater importance, however. is the fact that a fee structure without a long term contract provides a tremendous incentive from the opposite point of view. If the adviser fails to
67 Investment Company Amennments Act of 1970. Section 25, amending Section 205 of the Investment Advlser~ Act of 1940. effective December 14, 1971.
68 Letter to the MemberR of the House Committee on Interstate and Foreign Commerce, August 27, 1970, commenting on H.R. 17333.
deliver a competitive performance, he is going to lose the 'account. As a practical matter, it is difficult to think of a greater or more properly oriented incentive than this factor alone. Indeed, the claSSic form of fee schedule probably identifies the objectives of the client and the adviser as closely as can be done.
The second major premise behind the arguments for the leveraged fee is rtlult the investment adviser has it within his power to vary the invest.ment performance of his client's account in proportion to the fee to be paid by the client. If this were true it must follow that the advice he gave for an unleveraged fee is not his best. Our experience is that this is also untrue. We believe that unsuccessful decisions of a professional nature involve the best effort at the time and the introduction of a possible bonus at that point would not have changed it one bit. Furthermore, professional standards of conduct and compensation to do a good job make it indefensi'ble that an adviser will withhold a decision that has been very enthusiastically arrived at because the fee is inadequate.
If the adviser's current investment advice is the best he can produce, the leveraged fee inevitably tempts him to get "superior" results either by taking increasing nsks or taking extreme positions. That is the nub of our objection to a Omgressional endorsement of leveraged fee schedules. Such a schedule spawns a confiict of interest in which an adviser can be encouraged to take inappropriarte risks with other people's money. If an adviser takes the risk and is wrong, he loses a client. But, as you can imagine and as your mail may have shown, the application of the error can be disastrolliS to the capital of the client. By dint of salesmanship, the adviser can replace the client far more easily than the investor cran replace his capital.
We believe that leveraged fees will inexorably lead in this direction because the adviser has a disproportionate amount to gain and little to lose. While this conflict could theoretically be mitigated by a fee schedule which provided for a sharing of losses, there are, as a practical matter no investmenlt advisers who could be either bonded or provide the capital for this.
Finally, in addition to the principles involved, a variety of technical problems exist if the fee is not to be unfair. These include the difficulty of establishing a really fair formula, the need for a prohibition agillinst an adviser receiving leveraged fees in boom markets and then shifting to flat fees when markets are difficult. and a proper definition of the base to be used (should the base not be an average of funds which take similar risks rather than a conservative composite?). What of the arithmetic importance of "Valuation Day" and related possible abuses to aftect the fel' such as security valuations in markets of limited liquidity, tlle need for accruals (down and up) including a segregation by the adviser of adequate funds in contemplation of a possible reduction in fee and the prejudice to shareholders who purchase or redeem just before or after Valuation Day? These are extremely difficult problems which have received limited study and attention.
On the other hand, pe.rformanc.e fees have been defended on the grounds that they allow sophisticated clients additional degrees of freedom in negotiating fee arrangements with advisers, permit superior advisers to obtain additional compensation and permit profitable
o operations of smaller economic units which do not have access to large efficient sales organizations. The following excerpts from a letter by Mr. J. M. Hartwell, President of J. M. Hartwell and Company, a prominent medium sized investment advisory firm established in 1965, J)resents this point of view: 69
We believe very strongly that fees paid for money management should be based upon performance. To the extent that fees create a reward for good performance and penalize poor performance. they constitute an effective incentive to tbe money manager. It is this type of compensation formula which has attracted bright new competitive talent into the industry. Such arrangements also appeal to numeroU/s investors who are loathe to pay sizeable management fees during bad periods. but who are quite content to pay substantial am(lunts where their investments have Shown above average appreciation. Although it might be said
69 Letter to Senntor .Tohn J. Sparkman. Chairman, Senate Banking and Currency Committee, April 28, 1969. orlnted In Hearings before the flenate Bflnklng and Currency Committee on S. 34 and 8. 296, 91st Cong., 1st Seas., 421-424 (1969).

256
that the traditional fee based upon a percentage of the total value of a fund rewards good performance since the fee increases with an increase in the value of ,the fund, for the most pad the increase or decrease in the size of a fund and thus in the amount of such type fee is a function not of investment performance, but of the efficiency and capability of the sales organization utilized by the fund managers. In other words, if a mutual fund organization with a traditional fee arrangement has a good sales force it is guaranteed to have sizeable income from mutual fund management fees, irrespective of whether the investment performance of the funds under management is good or bad.
The more effective of the younger money managers today are imaginative and extremely competitive. A performance type incentive fee appeals to them not only because of its moneymaking potential, but becau~e its many possible variations stimulate their competitive instincts. It is in the best interest of all mutual fund shareholders that these managers be encouraged to enter into the mutual fund industry rather than into other forms of money management. They will not, however, be very encouraged by legislation which restricts performance type fees and tends to intrench the traditional established methods of compensation and benefit the older fund organizations with large, well-developed sales organizations at the expense of younger and smaller competitors trying to break into the field.
2. Types of Performance Fees
Perf'ormance fee arrangements typically fall into two general categories: (1) fee bases related to the performance of ,a market index or (2) a fee based solely on the performance of the fund itself without reference to the performance of any index. In the latter case the advisory fee is typically based on a percentage of the net unrealized capital gains, or net realized capital gains, or dividend and interest inoome.
The following is a description of a representative market index related performance fee:
For its services as Investment Adviser and Manager, the Fund pays [Adviser] an annual fee that is divided into two parts: a basic fee based on net asset value plus a fee based on performance. The latter fee gives management a bonus when the Fund performs well and penalizes management in any year in wbicb its performance is below that of the Standard & Poor's Composite Stock Price Index of 500 Stocks. This dual management fee is designed to give the Fund's manager [Adviser] an incentive to achieve maximum eapital appreciation consistent with the purposes and investment policy of the Fund. The agreement with this fee arrangement became effective October 1, ]968.
The basic fee is payable munthly and is computed on the net asset value of the Fund as of the close of business each day. The fee is based on the fol
. lowing annual rates: .75% on the first $5 million and .50% on the excess over $5 million.
The performance fee, which is in addition to the basic fee, is computed at the end of each year by comparing the Fund's performance for the year with the Standard & Poor's Composite Stock Price Index of 500 Stocks (the "Index") for the same year. Each percentage point (fractions to be prorated) that the Fund's performance exceeds the "Index" performance is multiplied by .10% of the Fund's average net assets. The maximum perf.ormance fee is .00% of the average net assets.
On the other hand, if the performance of the Fund does not equal the "Index" performance for the year [Adviser] must give the Fund a refund. The amount of 'this refund is equal to .10% of the average annual net assets for each percentage point (fractions to be prorated) that the Fund's ,performance drops below the "Index" performance. The maximum refund can be no more than .50% of the average net assets.
In computing the ,performance fee or refund, the Fund's performance is measured by the change in the net asset value per share during the fiscal yea'r. This change is adjusted to compensate for any distribution of capital gains. In making this adjustment it is assumed that all distributions of capital gains have 'been reinvested in shares .of the Fund as of the payment date a:t net asset value per sha're.

257
N€t asset value at-the €nd 'Of each year reflects net investment-inc'Ome received and dividends paid by the 'Fund during the year. No adjustment is made for diyidends in measuring the Fund's performance_ The performance 'Of the "Index" is measured by the difference between the "Index" at the beginning and the end 'Of the year. Any increase d'Oes not include dividends paid on the stocks listed in the "Index," except ins'Ofar as the "Index" aut'Omatically adjusts f'Or dividends_
It is imp'Ortant to remember that the performance fee is based on the Fund's perf'Ormance f'Or each year. A perf'Ormance fee may be paid for a year when the Fund 'Outperf'Orms the "Index," alth'Ough the Fund's performance over a longer period 'Of time may be bel'Ow the "Index" average. C'Onversely, a .performance fee will n'Ot be paid in a yea'r in which the Fund performs below the "Index" average, alth'Ough the Fund's perf'Ormance over a I'Onger peri'Od 'Of time exceeds the "Index" average. It is P'Ossibl€ for a perf'Ormance fee to ·be earned even if the Fund's aS3ets decline in value during the year, provided the "Index" .perf'Ormance sh'OWS a greater percentage decline. :Thus f'Or fiscal year ended May 31, 1970 the net asset value per share 'Of the Fund, adjusted fQr capital gains distributions, declined 24.82% but during the same period th€ "Index" declined 26.01% SQ that the Fund paid a performance f€e 'Of $3,182 based 'On th€ 1.19% differ€nce in the rate ·'Of decline. FQr fiscal 1009. the net asset value per share increased by 11.59% and the "Index" increased 4.84% so that the Fund paid a performance fee of $15,109 based 'On the 6.75% difference.
Mutual funds usually pay management fees as a ·percentage of average net assets. Generally investment f€es based 'On net asset value apprQximate one-half 'Of 1 percent 'Of such net asset value annually, althQugh s'Ome 'Of the 'smaller mutual fundi! 'pay management fees 'On a higher percentage of up tQ 1 % 'Of such net asset value. Based uPQn ''One-half 'Of 1% 'Of net assets, the investment advisory fees W'Ould have been $14,879, $15,109 and $13;005 respectively f'Or the fiscal years ended May 31, 1963, 1969 and 1970.
"The follQwingschedule c'Ompares the perfQrmance 'Of the ... Fund with that 'Of 'Stand'a'rd & P'O'Or's C'Omposite Price Index 'Of 500 Stocks fQr the years ended May 31, 1963 thr'Ough 1970. It sets fQrth the estimated fees [Adviser] WQuid have received had the present agreement been in effect during such periods 'reflecting separately the basic fee only and the ,basic fee as adjusted by the ,perfQrmance fee.
Fiscal year ended May 31
1963 ________________________________ _ 1964 ________________________________ _ 1965 ________________________________ _ 1966 ________________________________ _ 1967 ________________________________ _ 1968 ________________________________ _ 1969 ________________________________ _ 1970 ________________________________ _
FEE SCHEDULE AGREEMENT
Percent change in
asset value of share
of fund 1
HO.70 +18.26 +6.39
+18.55 +12.64 +8.97
+11.59 -24.82
Percent change in Standard & Poor's
composite stock price
index of SOO stocks
+18.73 +13.52 +10.02 -2.59 +3.43
+10,78 +4.84
-26.01
Difference between
fund and Index
+1.97 +4.74 -3.63
+21.14 +9.21 -1.81 +6.75 +1.19
Basic fee only
$11,375 13,399 14,501 16,164 17,823 22,319 22,664 20,060
Basic fee plus or minus performance
fee
$14,362 21,868 7,483
26,940 29,705 16,933 37,773 23,242
1 This column indicates the percentage change in asset value of a share of the fund (capital gain distributions reinvested) and the Index, respectively, over the years ended May 31st. 70
An example of a fee based solely on the performance of the fund itself without reference to the performance of any index as follows:
Management Fee Formula
N'O management fee is paid for any year in which no investment pr'Ofit is made. In any 'Other year, the Fund will pay the Investment Adviser for its services an annual fee equal t'O 10% 'Of the aggregate 'Of the dividend income, interest incQme, and investment profit 'Of the Fund for the year with regard to which the fee is to be paid. Expenses and taxes payable by the Fund are not taken into account in c'Omputing such investment profit and dividend and interest income. The invest-
.0 CommiSSion Public File No. 2-9748, prospectus dated Oct. 1, 197'0, at 5; 6.

258
ment profit for any year is defined to mean capital gains, both realized and unrealized allocable to such year.
The management contract prescribes certain rules for the computation of gains and losses for management fee purposes to insure that unrealized gains allocable to a particular year will not be used as the basis for the payment of additional management fees in subsequent year. Accordingly, in the case of a security or commitment held at the end of a particular year, the value used in computing gains and losses at the end of such year is taken as the base for the computation of gains and losses in that security or commitment for management fee purposes in the following year. If the Fund should sustain an investment loss for any year, such loss will be offset against dividend and interest income in computing the management fee for that year, but will not be carried over to offset gains or income in computing the management fee for any subsequent year.
Although most mutual funds pay management fees based on a percentage of their net asset value, the Investment Adviser's compensation under the foregoing arrangement will depend solely upon its success in producing investment profit and dividend and interest income for the Fund. Management fees based on net asset value generally approximate one-half of one percent of such net asset value annually, so that there may be wide variations in the management fee paid by the Fund in relation to its net asset value as compared to other funds. The management fee will be large in relation to net asset value and income in a year in which there is a substantial investment profit; on the other hand, if losses are sustained, the fee will to such extent be smaller and under certain circumstances no fee may be payable."
The Commission during the 1969 Congressional Hearings on its legislative program listed 137 investment companies which had performance fee arrangements in effect or proposed as of .Tune 30, 1.969.72 Six were closed-end companies. Of the remaining 131 funds, the fees of 120 were related to the performance of market indexes. The Standard & Poor's 500 Stock Composite Index was the most popular comparison standard used by 60 funds. The Dow Jones Industrial Average (30 stocks) was used by 28; the NYSE Composite Index (all stocks on the Exchange) was used by 21 funds; and the best performance of the foregoin~ three indexes was nsed by nine. The Dow Jones Composite Index (75 stocks) and the National Quotation Bureau Over-the-Counter Industrial Exchange (35 stocks) were used by one fund each. No fund determined fees by relating its performance to an index of funds. However, 11 based fees solely on the performance of the fund itself.
Funds are continuing to use performance-based incentive fee arrangements and the same indexes as perfollffiance standards. Of 508 funds listed in a commercial survey, 110 had incentive fee arrangements as of December 3, 1970.73 The total assets of these 110 funds amounted to $3.14 billion or 6.9 percent ofthe total assets of the funds included in the survey. All but one of these funds had growth as their primary investment objective and thus were more volatile than nonperformance funds.
An earlier survey published by the same organization found 101 funds with incentive fee arrangements as of March 12, 1970.74 The per-
., Commission Public File No. 2-16341, prospectus dated October 31. 1969, at 6. 7' This table appears in Hearing8 tin H.R. 11995, S. 111l1l4, H.R. 18754, and H.R. 1!,737,
Before the Subcommittee on Oommerce and Finance of the Hou8e Oommittee on Inter-8tate and Foreign Oommerce, 91st Cong., 1st Sess., pt. 2,882-884,888 (1969) ["1969 House Hearlngs"J.
73 Arthur Lipper Corp. Mutual Fund Performance Analysi8, December 3, 1970 . .. Arthur Lipper Corp., Note on Incentive Management Fees, March, 1970. The Increas
ing popularity of Incentive fee arrangements In 1968 and 1969 was Indicated by the fact that of 152 new funds incorporated into the Lipper Service between January 1, 1968 and March 12, 1970, 67, or 44 percent, used Incentive fee compensation arrangements. The 67 funos repre~'mte(l $1.:1 billion or 48.5 percent of the $2.8 billion of new fund assets reported as of December 31, 1969.

259
formance comparison standards used by these 101 funds as of March 12, 1970 and their total assets as of December 31, 1969 are set forth in Table IV -71 below.
TABLE IV-71.-Mutual Fund Incentive Fee Arrangements Bases for Performance Comparison 16
Total Assets
Dec. 31
Basis for Performance Comparfson Number of 1969 Percentage
Funds (millions) of Assets
20 $1,593.2 41.7 48 1,479.3 38.7 3 29.1 .8
Dow Jones Industrial Average •.•....••••••••••••.•....••••••••• Standard & Poor's 500 ........................................ . Standard & Poor's 425 ......................................... .
17 270.0 7.1 1 41.3 1.1 1 7.8 .2 4 278.9 7.3 7 119.0 3.1
New York Stock Exchange Composite ......................... . Dow Jones 65 Stock Composite ................................ . Over·the-counter Industrial avera~e ........................... .. Combination (DJIA-NYSE-B. & P. 500) ...................... . Other .......................................................... .
Total ........................................ : •...•.•..... 101 3,818.6 100.0
Of the 120 index related performance fee arrangements listed by the Commission during the 1969 House Hearings, 76 funds had no reductions in basic fee rates for inferior performance, or had reductions which were not proportionate to fee rates for superior performance. The fee provisions of 115 of the 120 funds which were related to index performance contained annual basic fee rates stated as a percent of net assets, and 94 of those rates were 0.5 percent of average net assets or higher. Total fees authorized by the various provisions ranged as high as 6 percent annually of net assets. Only 20 of the 115 basic fee provisions were subject to any reduction in the fee by reason of increases in the amount of net assets managed. While all 115 afforded additional compensation for outperforming the market index used, only 87 of them provided for any reduction III the basic fee for performance below that of the index, and only 44 of these 87 imposed as large a total reduction for performing below the index as the additional compensation provided for outperforming the index.
It can be seen from the foregoing that, aside from the question of a proper index to measure performance, the fee formulae generally provided a one-sided basis of compensating the adviser. In most cases, the basic fee rates guaranteed the adviser are no lower than the rates received under contracts which have no performance fee provisions and, in a vast majority of the cases, there are no provisions for reductions in the basic fee rates in recognition of the economies of size. In addition, in the majority of cases, the advisers are afforded the opportunity to receive even higher fees for performance, without the r-isk of commensurate reductions in fees, or any reductions at all, the poor performance.
3. Le.Q,'islative Background of Existing Regulatory Framework Until the Investment Company Amendments Act of 1970, invest
ment advisers registered under the Investment Advisers Act of 1940 were prohibited from charging clients an advisory fee "on the basis of a share of capital gains upon or capital appreciation of the funds or any portion of the funds of the client." 76 However, the Investment Ad-
71 Arthur Llpppr Corp., Note on Incentive M'n'"~m~nt Fee .•. 1\{"rch 1970. 's Investment Advisers Act § 205. 15 U .S.C. 80b-5 (1964).

260
visers Act excepted from that prohibition without any limitation, fee arrangements with investment companies.77 Also, an "investment adviser whose only clients are investment companies and insurance companies" was exempt from registration under the Investment Advisers Act 78 and therefore such advisers were not restricted from charging performance-based advisory fees.
In the legislation as originally proposed in March of 1940, all performance fee arrangements of investment companies would have been prohibited by both Title I, the Investment Company Act of 1940 and Title II, the Investment Advisers Act. The Investment Advisers Act would have prohibited registered advisers, including advisers to investment companies, from charging fees based upon a share of capital gains upon or capital appreciation of the client's funds. 79 It also contained a declaration that: the national public interest and the interest of investors are adversely affected
... . ... ... ... . . (3) when the compensation of investment advisers is based upon profit sharing contracts and other contingent arrangements conducive to excessive speculation and trading.""
The proposed Investment Company Act would have prohibited compensation based upon capital gains or capital appreciation by excluding such contingent compensation arrangements from enumerated permissible fee arrangements.S1
Application of these limitations to advisers of investment companies was criticized by industry representatives on the grounds that performance fees were not characteristic of the advisory profession 82 and that proof of any specific abuses in the investment advisory field was lacking.83 The investment adviser of a fund complex whose fee was based on fund investment profits objected to the bill's limitation on contingent fees on the grounds that one of the important objectives of the complex was to "closely link the interests of investors and management throughout the life of the investment" and that this was best achieved by compensating management in proportion to and at the time when the investor hImself profits from hIS investment.B4
At the close of the Senate Hearings, Arthur H. Bunker, Executive Vice President of Lehman Corporation, outlined proposals embodying "the considered and agreed views of a large and, . . . representative portion" of the industry.85 With respect to compensatIOn of management he stated that the provision "should contain substantially the &ame requirements fOl" approval by stockholders ... [as in the original bill]. It. should not, however, dictate the basis of management compensation, provided that the method of 'Payment is clearly and adequately set forth to shareholders ... ".86 The memorandum setting
"Investment Advisers Act § 205,15 U.S.C. SOb-5 (1964). See a180, 1969 House Hear-in2"B 204-205. .
7. Investment Advisers Act § 203(b) (2), 15 U.S.C. 80b--3(b) (2) (1964). ,. S. 3580 and H.R. 8935, 76th Cong., 3rd Sess. § 205 (1940). 80 S. 3580 and H.R. 8935, 76th Cong., 3rd Sess. § 202 (1940). 81 Section 15 (a) of S. 3580 would have permitted compensation paid by an investment
company to be based upon one or more of the following bases, and no other: a definite sum of money for a definite period; a definite percentage of the company's income from interest and dividends; or a definite percentage of the value of the company's net assets as of a definite date or averaged OVer a definite "erion .
• 0 Hearing8 on S. 3580 before the Subcommittee on Securitie8 and Exchange of the Senate Oommittee on Banking and Ourrency, 76th Cong., 3d Sess. 713 (lIMO) [hereinafter cited as 1940 Senate Hearing8].
83 1940 Senate Hearing8 711-712,761. .. 1940 Senate Hearing8 664. 86 1940 Senate Hearing8 1052. 86 1940 Senate Hearing8 1055.

261
forth the "agreement in principle" between the Commission and the industry referring to compensation of management, stated " ... The Commission recommends, but does not insist, that certain types of pr0fit-sharing contracts be outlawed .... " 87
In the compromise bill which emerged from discussions between representatives of the industry and the Commission after the close of the 1940 Senate Committee Hearings, the Title I limitations upon the type of compensation an investment company could pay were deleted and investment advisers whose only clients were investment compani~ and insurance companies were exempted from registration under Title II, the Investment Advisers Act, and from the prohibition against charging performance fees. The Investment Advisers Act declaration referring to profit sharing and other contingent arrangements as "conducive to excessive speculation and trading" was ~lso deleted.
Commission Counsel David Schenker explained that the revisions in the Investment Advisers Act were based upon a draft submitted by a representative of Scudder, Stevens & Clark. Summarizing the changes in the Act, Mr. Schenker stated:
There are just one or two slight changes in title 2; and I personally feel that there will not be any vigorous objection to it. I think we have tried to meet all the objections that were asserted at the committee hearing."
Congressional attention did not return to investment company 'performance fees until 1967, after completion. of the Study of Mutual Funds prepared for the Commission by the Wharton School of Finance and Commerce,89 the Report of the Special Study of the Securities Markets of the Securities and Ex~hange Commission90 and Public Policy Implications of Investment Company Growth.91 Neither the Wharton Report nor the Special Study treated performance fees as significant, since, as pointed out above, when these reports were published very few investment <:ompanies had performance-based fee arrangements.
The Public Policy Report, published in December, 1966, focused primarily upon the level of fees rather than the method of their computation. However, in it the Commission recommended that the Investment Advisers Act be amended to require that investment advisers to investment companies be subject to the registration provisions of the Act and also to require that contracts between registered investment companies and their advisers not provide for compensation to the investment adviser on the basis of a·share of capital gains or capital appreciation of the funds of the investment company.92 In so doing, the Commission at the same time made clear that it believed that "the 8ustained investment performance of a company would be an appropriate consideration in evaluating the reasonableness of its advisers' compensation." 93 [Emphasis added.]
87 Memorandum of May 13. 1940, entitled "Framework of Proposed Investment Company Bill (Title I). Embodying Suggestions Resulting from Conferences between Securities and Exchange Commi.slon and Representatives of Investment Companies." Hearings on H.R. 10065 before a Subcommittee of the House Committee on Interstate and Foreign Commerce. 76th Cong., 3d Sess. 98 (1940) .
.. 1940 Senate Hearings 1124. 59 Wh'arton School of Commerce and Finance, A Study of Mutual Funds, H.R. Rep.
No. 2274, 87th Cong., 2d Sess. 580 (1962) [hereinafter referred to as the "Wharton Report"].
00 SEC. Report of the Special Study of the Securities Markets, H.R. Doc. No. 95 88th Cong., 1st'Sess. (1963-1964) [hereinafter referred to as the "Special Study"] .
• , H.R. Rep. No. 2337, 89th Cong., 2d Sess. (1966) [hereinafter referred to as the "Public Pollcy Report"] .
.. Publle Polley Report 32, 346 .
.. Publle Polley Report 145.
262
The Commission's recommenda.tions were embodied in a bill to amend the Investment Company Act submitted by the Commission to Congress in May of 1967.94 However, since the Commission's then limited experience with performance fees charged to investment companies indicated that the main concern with such fees was that they increased for good performance but did not correspondingly decrease for poor performance, the Commission, after discussions with the industry, modified its recommendation. As modified, the Commission proposed that investment company perfprmance fees be permitted provided thllit they increase and decrease proportionately on the basis of the fund's performance measured against an appropriate index of securities prices or such other measure of investment performance as the Commission may specify. During Congressional hearings in 1969 on the Commission's legislative proposals, the Commission argued that performance-based fees are unfair for 'the following reasons: 95
1. Bonuses are paid when a fund outperforms an index, but no penalties (or disproportionately small penalties) are imposed when the index outperforms a fund-truly a one-way st~t.96
2. Fees for favorable performance are paid in cash by investment companies to advisers, but refunds of fees owed by advisers to funds (because of underperformance) often result only in credits against future fees.
3. Investment companies have no assurance that advisers will be financially able to meet obligations to pay any performance fee owed to them.
4. Carry-forward fee credits for inferior performance tend to discourage the termination of advisory contracts despite a poor record of management if advisers cannot pay unsatisfied credits.
5. Asset value of fund shares cannot be accurately computed when outstanding "credits" are owed by advisers.
6. Many such fee arrangements are so complex that it is virtually impossible to understand them.
The Investment Company Amendments Act of 1970 reflects the Commission's recommendations. It amends the Investment Advisers Act to require registration of advisers even though their only clients are investment companies and it prohibits registered advisers from charging performance fees to investment companies unless such fees increase and decrease proportionately in relation to an appropriate index of securities prices or other measure of investment performance as the Commission may specify.97 It also permits a registered adviser to charge any other person a performance fee, but only if the contract relates to the investment of assets in excess of $1 million and the client is not a trust, collective trust fund or separate account which is part of an employee benefit plan qualified under Section 401 of the Internal Revenue Code. These prOVIsions will become effective on December 14, 1971, one year from the date of passage of the Amendments Act .
•• S. 1659. H.R. 9510 and H.R. 9511, 90th Cong., 1st Sess. (1967) • .. 1969 House Hearings 870-872 . .. Commission exhibits demonstrated that rate schedules of performance fee contracts
were not subject to decreases for Inferior performance proportionate to Increases in fee rates for superior performance .
• 7 Sections 24 (a) and 25 of the Investment Company Amenilments Act of 1970, respectively, amending sections 203 and 205 of the Investment Advisers Act of 1940.

263
4. Performance Standards and Incentive Fee Arrangements
This section provides a discussion of some of the concepts and methodology used in measuring the investment performance of institutional investors. Additionally, the implications of using various performance standards as part of incentive fee arrangements are examined.98
a. Definition of the problem The basic premise of an incentive fee arrangement is that superior
performance by an adviser will be rewarded by additional compensation. The converse, of course, is that inferior performance will be penalized via a reduction in compensation. The result of this type of arrangement should be to align the objectives of the adviser and his client as closely as possible toward producing superior investment results.
While the concept of rewarding those who perform well and pena:lizing those who perform poorly is not controversial, its practical application in the area of investment management is not strruightforward.99
The crux of the difficulty lies in the measurement of investment performance. If the way in which a manager's investment performance is measured is poorly devised, it may no longer be true that the objectives of client and adviser are the same. Indeed, differences betweeen the interests of the two may well be created or accentuated.
Virtua:lly all performance fee arrangements in effect at the present time fall short of the goal expressed above. As discussed below, existing incentive fee arrangements provide an incentive to the adviser to invest his clients' funds in securities having high volatility, even though such action may not be consistent with the investment objectives of the account. The thrust of this subsection and the next is to suggest one possible mehod for measuring investment performance which would reduce incentives on the part of an adviser to expose his client's funds to excessive risk. b. Some basio oanoepts
There are a number of basic propositions and empirical findings, relating to rates of return on financial assets 100 that are useful III attempts to measure the performance of institutional investors:
1. Average rates of return achieved by "riskier" or more volatile securities (and hence more volatile portfolios) tend, in the long run, ,to be greater than those on less volatile securities (or portfolios). During any particular period of time, of course, riskier portfolios expose their owners to greater potential losses than less risky portfolios.
2. Although work remains to be 'done on risk measurement, there is evidence that the volatility of rates of return on institutional portfolios provides a useful measure of the risk borne by 1?ortfolio shareholders.101 The higher the relative volatility of a secunty or portfolio relative to a broadly based market index, the greater will be the response of the portfolio's net asset-value to movements in the market as
98 A more detailed dlBCuAslon of the performance measurement techniques can be found In the appendix to this section.
'" See testimony of Chairman Hamer H. Budge, Hearing8 before the Subcommittee on Oommerce and Finance Of the House Oommittee on Interstate and Foreign Oommerce on H.R. 11999 and S. 224, 91st Cong., 2d Sess. 868--872 (1969).
100 Return Includes dividends and capital distributions .plus unrealized capital appreciation. before taxes.
101 See the appendix to this section for more detalled references and a discussion of volatillty measures.

264
a whole. Thus, mutual funds or other diversified portfolios having high volatility will tend to have substantially higher rates of return than the index during market upswings and substantially lower rates of return during downturns.
3. Investment returns on well diversified portfolios are, on average, highly correlated with returns on the market as a whole. c. Implwations for performance measurement
Empirical evidence indicates that returns on diversified portfolios (such as mutual funds) are highly predictable once market returns over the period are known. Thus, such predicted values may be used as a standard aKainst which actual returns can be compared. The standard in this case would be chosen to have the same degree of volatility as that displayed on the average by the institutional portfolio (for example, mutual funds) during the evaluation period.
The rate of return generated by a standard portfolio of given volatility is defined as: the yield on treasury bills (treated for analytical purposes as a risk free asset) plus the volatility coefficient (the volatility of returns on the fund relative to similiarly calculated returns on a broadly based market index, such as the Standard and Poor 500 Stock Index) times the difference between returns on the market and on treasury bills. The &tandard, in effect, represents a combination of two portfolIos, the market portfolio and a rIskless portfolio, where the relative amounts of each are such that a specified volatility factor is obtained. For comparison with a specific managed portfolio, the riekless and market portfolios would be combined to obtain a volatility equal to that displayed on the average by the fund being evaluated. The fund manager would be entitled to a performance fee only if the average total return produced under his management, net of all expenses, exceeds the rate of return displayed by an unmanaged, standard portfolio having the same average volatility. d. Incentive fees
The procedure discussed above permits the decomposition of returns on managed portfolios into two components, one attributable to the manager's skill in selecting individual securities or anticipating broad movements in the market itself, and the . second attributable to the average degree of investment risk (or market volatility) borne by the portfolio's shareholders during the period in question. In devising an incentive fee arrangement it is the first component which is relevant for the compensation of investment managers.102
102 There are essentially two ways by which a fund manager can outperform a standard portfolio having the same average volatility. The first is by being able to select stocks which performed in a superior way during the evaluation ppriod. These would be securities which had higher rates of return than would be Implied by the market related risk displayed by the stock. The second would be by predicting movements in the market Itself, and shifting the volatility of the portf<)lIo before the movement takes place. Thus, If a manager were able to predict the market. he could (and presumably would) move Into less volatile securities. Including short-term debt if permitted by the advisory contract, before a downswing, and into more volatile securities prior to a market upswing.
If the adviser could operate successfully In either of these modes, the result would be a positive excess return for the fund during the evaluation period. However. if his insight into either Individual stocks or market movements were no better than average. his portfolio rebalancing actions may well not generate enough additional return to cover the incrpmental brokprage anll administrative exprnsps involved In RllCh chnnges, In which case the fund's performance would be Inferior to that of the unmanaged standard against which it Is compared (for which, of course, no portfolio transactions other than the reinvestment of dividends and no Investment advisory expenses of any sort are required).

265
When an adviser is compensated on the basis of total fund return, or on the basis of fund return relative to an index having lower volatility than the fund itself (the usual case with current incentive fees), an incentive exists on the part of the manager to cause the portfolio to asume greater risk since additional portfolio volatility is, on the average, associated with higher rates of return and, hence, higher levels of managerial compensation. Thus, when a nonrisk-adjusted performance fee standard is chosen, the adviser is rewarded for additional risk borne by the fund's shareholders. Volatility adjusted performance standards are designed to remove this bias and, thereby, reduce incentive for an adviser to fashion excessively volatile portfolios. Combined with adequate disclosure in a fund's prospectus or elsewhere of the degree of volatility (relative to a market index) assumed by the portfolio, risk-adjusted performance fee arrangements such as those sketched above would appear to more closely align the interests of portfolio managers and their clients than most existing types of fee arrangements. -
5. Considerations for the Administration of Incentive Fee Arrangements
The foregoing discussion leads to considerations of what safeguards would accompany the type of volatility adjusted performance measure discussed above. Of course, rates of return on fund shares and the comparison pOldolio would be computed in identical fashion and include aU distributions made on both portfolios. Further, the comparison standard portfolio would have to display the same degree of volatility during the evaluation period as the managed portfolio.
A further consideration concerns the symmetrioal handling of superior ml'd inferior performance. To the extent that an incentive fee is paid for superior performance by the adviser, a penalty would be charged to the adviser for relatively poor performance. Thus, the incentive fee would increase and decrease proportionately for superior or inferior performance relative to the standard portfolio.lo3 Moreover, relatively small or random changes in portfolio return should not trigger large changes in the arrangement of incentive compensation paid.
The interval of time over which performance is measured also must be considered. This interv,al should be sufficiently long to insure that accurate measures of fund volatility and adviser performance can be obtained. As discussed in the appendix, one to three year intervals have been suggested as the minimum time period over which such evaluations should be conducted.
The ,preceding discussion focuses on incentive fee ,arrangements between advisers and their clients. Similar considerations apply to the
103 Where the po~slbl1lty of negative fees exist. conslilE'ratlon'S cont'ernlng the rE'fundlng of these amounts on the same basis as that for which positive payments are made come Into play.
Also. where adviser liabilities for negative fees are possible. prOVisions for the protection of fund sharehol"ers agninst the possibility that the adviser would not be able to return the amounts due hecome a conshleratlon. One pO&8lblllty would be capital or bonding requirements for advisers using incentive fee structures.
53-940 o-71-pt. 2--10

procedures used by.advisers to compensate portfolio managers. To prevent possible conflict of objectives between portfolio managers and either the shareholders or the advisory organization, if portfolio managers also are compensated on an incentive basis, the considerations discussed above would be equally applicable to these arrangements.
APPENDIX TO SECTION F
The appendix to Section F appears at the end of Ohapter IV.
G. ORGANIZATION OF ADVISORY FIRMS FOR INVESTMENT DECISION MAKING
1. Introduction
The purpose of this section is to provide information regarding the manner in which advisory firms are organized for investment decIsion making and associated management functions. The data were obtained from the 1-65 Investment Advisor Intrinsics Questionnaire. As before, advisory firms have been designated as either "fund" or "non-fund" complexes, and the sample has been stratified into "large" and "small" firms.
The following pages summarize the data collected. Section G.2 deals with the basic question of the degree of centralization of decision making authority within advisory firms; section G.3 presents data on the number of portfolio managers and analysts employed by different types and sizes of advisory firms; section G.4 deals with aspects of the duties of portfolio managers and security analysts; section G.5 presents data on the security evaluation principles employed in advisory firms and the external sources of information relied upon; and section G.6 summarizes the proportion of advisory firms which use computers for various research and administrative functions.
2. Concentration of Decision Making Authority
Virtually all types of centralized and de-centralized organizat.ions existed within the 1-65 sample. The most centralized forms of organization (where the top management effectively made the investment decisions) provide a list of securities which 'are rigidly rated or a set of decision making rules for subordinate account managers to implement. In the least centralized organizations the top ma.na~ement of the firm appeared to lay -down a very broad and general policy for investment decision making. The account. managers, or portfolio managers, would then in a virtually autonomous fashion make investment decisions for their accounts. It was difficult to put tog-ether a pattern that could be stratified by type and size of advisory firm. To the ext~nt it could be done it is shown in figure IVg-1.
Differences exist between fund and non-fund complexes and between large and small advisory firms. For small fund complexes the management of the advisory firm in effect was the portfolio manager. For a large fund complex the decision making tended to be more noncentralized. An investment committee of the senior management of

267
the firm typically generated either an approved list of securities or very general polIcy with respect to investment decision making. The portfolio managers then, WIth authority ranging from complete to limited, implemented policies for their mutual funds and other clients.
For non-fund complexes similar differences existed between large and small firms. For small firms the pattern was typically that of the various l?rincipals of the firm advismg their own group of accounts on a semI-autonomous basis. For large non-fund comrlexes the principals of the firm tended to form an investment comnuttee which, as in the case of fund complexes, made investment policy. In the case of large firms decision making authority tended to be more centralized for non-fund complexes than for fund complexes. That is to say, the investment committee tended to lay down a very rigid approved list of securities or, in some cases, actually made decision rules which specified the securities to be bought and sold for individual accounts.
Figure IVg-I
TYPICAl, INVESTMENT DECISION AUTHORITY PATTERNS
Small
DeCis~ons 'V
I I Portfolios
Deci lions ~,
p~incipa~'s Accounts
Small
fUl1d Compjel>es
Large
I General Policy or Approved List
J, ~ ~,
.. Non J:und Comolexes _ Large
Dec sions
Accounts
268
Table IV-72 indicates the proportion of advisory firms with investment committees and account managers. As could be expected large firms are more likely to have investment committees than small firms. For the sample as a whole 80 percent of large firms had investment committees while only 40 percent of small firms had investment committees. Similarly, large firms are more likely to have portfolio or account managers than small firms. This is less true in the case of fUT'rl complexes where approximately 79 percent of small fund complexes have portfolio managers compared to 89 percent for large fund complexes. In the case of non-fund complexes almost 94 percent of the large firms reporting said they used portfolio managers while only 60 percent of the small firms stated that they used a portfolio manager system.
Table IV-73 summarizes the data that were collected on the investment authority of account managers to make investment decisions for accounts where the advisory :(i.rm had discretionary authority. The advisers were asked to indicate whether their portfolio managers had (a) complete authority (b) limited authority or (c) no authority. The responses tend to be very similar for all types of advisory complexes and sizes of advisory complexes. Typically about 70 percent of the firms responded that portfolio managers had limited authority while approximately 25 percent indicated complete authority.
3. Numbers of Advisory Personnel
Table IV-74 summarizes statistics on the average numbers of account managers, economic research analysts, and investment research a:nalysts that were maintained by average firms of different types and SIzes. The table shows that fund complexes tend, on the average, to have more than twice the number of securities analysts than non-fund complexes, but only about one-half the number of people involved in economic research. On the average, non-fund complexes tended to have 7.4 portfolio managers per firm while fund complexes, with substantially fewer accounts, tended to have 5.8 portfolio managers per firm. Table IV-74 also provides a comparison between the average personnel breakdowns in 1964 and 1969. The most substantial rates of personnel growth are among large fund complexes.
4. Duties and Educational Backgrounds of Investment Personnel
Table IV-75 summarizes information about the percent of an account manager's time which is devoted to decision making and related supervision of accounts. The data are tabulated for those firms that indicated on 1-65 that they used the account manager or portfolio manager system. The results show that, in large fund and large nonfund complexes, portfolio managers tend to spend about 75 percent of their time in investment decision making and related supervision of portfolios. The percentages are lower for small fund and non-fund complexes where, as might be expected, portfolio managers have a broader range of other duties.
Table IV-76 presents data on the percentage of an investment research analyst's time that is spent in personal contact-that is to say visits, telephone calls, etc.-with issuers of securities. The responses indicate that the typical analyst spends about 24 percent of his time in contact with .portfolio companies. This percentage is somewhat

269
higher for fund complexes than for non-fund complexes, 34 percent as against 20 percent. .
Table IV-77 presents data collected on the educational backgrounds of account managers and security analysts. The adviser was asked to indicate the proportion of his account managers and security analysts with either law degrees or advanced d!:'grees in business administration. The data indicate that, in the case of account managers, fund complexes tend to have a higher proportion of analysts with law or advanced business degrees (51 percent) than non-fund complexes (39 percent). The same differenCes appe!1r to exist for investment research analysts where 74 J?ercent of fund complex analysts had law or advanced degrees in busmess as compared to 47 percent for nonfund complex analysts. Differences also exist between large firms and small firms, with more investment research analysts and account managers in la,rge firms holding law or advanced business degrees than those in small firms.
5. Security Evaluation Procedures
Table IV-78 summarizes the response with respect to the importance of various types of approaches to security evaluation. The advisory firms were asked to rate the importance of the following approaches, using the importance categories utilized throughout this chapter (that is, 1 = most important, 5= least important) :
a. Fundamental approaches. b. Technical approaches. c. Economic outlook approaches. d. Other approaches.
The following definitions were given to supplement these descriptions. For the fundamental approach, the emphasis is on analysis and projections of corporate earnings. The techmcal approach relies particularly on market action as the central factor. The economic outlook approach relies primarily on the interpretation of various aggregate economlC series and indicators such as money supply, GNP, etc. for key si~als about market movements. In the "other approaches" category the firms were asked to explain the particular approach(es) indicated.
The results indicate that the fundamental approach is typically the most important, with 77 percent of the total sample indicating that this approach is "very important, always used." The import.ance appears somewhat greater to large firms who had an average response of 1.16, than sma'll firms whose average response was 1.50. Technical approaches 'appear only of moderate mterest with 63 percent of the total sample responding that this approach was either somewhat important but not used frequently, or not important and used only rarely. This approach had seemingly greater importance to small firms whose average response was 2.92 than to large firms whose average response was 3.86. Economic projection approach appears to be more important to large firms relative to small firms. There is very little difference between fund complexes and non-fund complexes with respect to the importance attached to these three eva1uation techniques. Thus, the picture emerges of large firms making more use of fundamental approaches to security evaluation which rely on fundamental econOllllC analysis whereas small firms appear to 'be putting somewhat more emphasis on technical approaches to security evalua.tion.

270
Table IV-79 presents the data collected on the importance of specific external information sources to the securities research process. The purpose of this question was to obtain information about the extent to which advisory firms currently utilize various external sources for securities research and information. For each of the external sources the adviser was asked to assign a code number which best described utilization of that source in making decisions about which security to purchase or to sell for advisory accounts. The importance codes were as previously used. The external information sources were:
a. Information and recommendations from broker-dealers purchased via commission dollars;
b. Information and recommendations purchased from other investment advisers on a continuing or contractual basis;
c. Information and recommendrutions received from other research organizations not included above (with or without compensation) ;
d. Direct contact with secunty issuers; e. Financial statements of issuers, and f. Others (in which case the adviser was asked to explain the
source being indicated) . The results indicate that the most important source of investment
information appears to be the financial statements of issuers which, for all sizes and types of firms, receive the highest importance ranking.'04
Direct contact with security issuers ranked next, followed by information received from other research organizations and then information purchased from broker-dealers via commission dollars. Information purchased from other investment advisers on a contractual basis appeared to be relatively unimportant for most firms.
6. Use of Computers for Administration and Decision Making Purposes
Table IV-80 summarizes data collected on 1-65 about the use of computers in investment advisory organizations. The table indicates that 78 percent of fund complexes and 62 percent of non-fund complexes own or rent an electronic computer either on an in-house or service bureau basis. Larger finns tend to be more likely to use computers than smaller firms, 88 percent as against 47 percent.
The most common funotion for which the computer was utilized was account administration, with 50 percent of the res:ponding firms indicating this use. This was followed by general admmistratIOn duties, with 39 percent. A substantial number of firms also indicated that a computer was being used for trading administration (30 percent) as well as investment research (27 percent). As expected, these percentages tended to be substantially higher for large firms as opposed to smaller firms which tend to be less automated.
, .. In a report publishpd In March 1969, a Commission study group reported that financial analysts make only meager use of periodic reports (8Ks. 9Ks, etc.) filed with the Commission pursuant to the Securities Exchange Act of 1934. "Disclosure to Investors. A Reappraisal of Administrative Policies Under the '33 and '34 Securities Acts" (The Wbeat Report), at 318-319. Reasons advanced for this were that these reports are filed spasmodically rather than on a fi,-pd bal'is and that analysts did not have ready access to these reports. Assuming the Wheat Report findings to be valid and the responses to the current !:audy to be accurate It would appear that the finandal statements ut\1lzed by the respondents to the Study were those found In prospectuses filed with the CommiSSion pursuant to the Securities Act of 1933, or found In annual reports to shareholders required by the Commission's proxy rules or by applicable stock exchange rules.

271
TABLE IV-72
PROPORTION OF ADVISORY FIRMS WITH
INVESTMENT COMMITTEES AND ACCOUNT MANAGERS
Type of Size of Number of Proportion Proportion Firm Firm Respondent with with
In;'estment .. -
Firms , Account Committees Managers
I (%) (%)
I
I Large 27 70.3 89.0
Fund Complex Small 14 50.0 78.6
i I Total ! 41 63.4 ! 85.4 ~
! Large I 37 86.5 93.5
Non Fund Complex Small 52 36.5 59.6
Total 89 57.3 74.3
Large 64 79.7 92.2 Total
Sample Small 65 39.4 64.6
Total 129 59.2 78.2
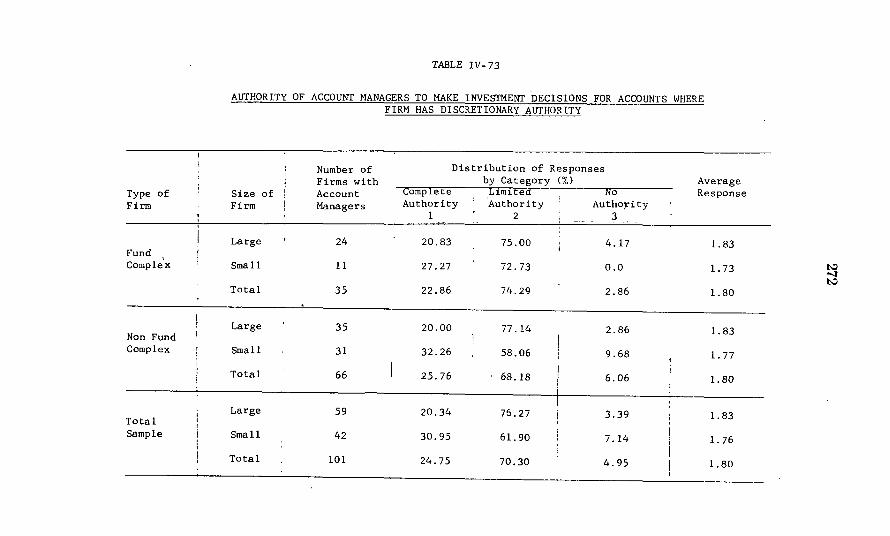
Type of Firm
Fund Comple'x
Non Fund Complex
Total Sample
TABLE IV-73
AUTHORITY OF ACCOUNT MANAGERS TO MAKE INVESTMENT DECISIONS FOR ACCOUNTS WHERE FIRM HAS DISCRETIONARY AUTHORITY
Number of Distribution of Responses Firms with by Category (%) Average
Size of I Account Complete L1m1ted No Response
Firm Managers Authority -Authority Au t!t0:rit y 1 2 3
Large 24 20.83 75.00 4.17 1. 83
Small 11 27.27 72.73 0.0 1. 73
Total 35 22.86 74.29 2.86 1.80
Large 35 20.00 77 .14 2.86 1. 83
Small 31 32.26 58.06 9.68 1.77
Total 66 25.76 68.18 6.06 1.80
Large 59 20.34 76.27 3.39 1. 83
Small 42 30.95 61.90 7.14 1. 76
Total 101 24.75 70.30 4.95 1.80
tv -..:r tv

TABLE IV-74
INVESTMENT RESEARCH AND MANAGEMENT PERSONNEL
AVERAGE NUMBER OF FULL TIME EQUIVALENTS
Type of Size of Number of Account Economic Research Investment Research-
Firm (1969) Firm (1969) Firms Managers Analysts Analysts
-i 19641969 1964 1969 1964 1969 1964 1969
Large 24 26 4.5 8.0 0.5 0.6 10.2 13.9 Fund Complex Small 4 13 1.3 1.3 0.0 0.2 0.7 1.1 t,:)
'"'l CI:i
Total 28 39 4.1 ' 5.8 0.4 0.5 8.9 9.6
Large 30 38 11.0 13.6 1.3 2.0 7.3 8.2 Non Fund
L Complex Small 28 42 2.2 2.1 0.1 0.2 0.5
Total 58 I 80 6.7 i 7.4 0.7 1.0 4.0 4.2
I Large 54 64 8.1! 11.3 0.9 1.5 8.6 I 10.5
Total , I
Sample Small 32 55 2.1 1.9 0.1 0.2 0.6 I 0.8
I Total 86 119 5.9: 6.8 0.6 0.8 5.6 I 6.0

Type of Size of Firm Firm
Large Fund Complex Small
Total
Large Non Fund Complex Small
Total
Large Total Sample
I Small
Total
TABLE IV-75
PERCENTAGE OF ACCOUNT MANAGER'S TIME DEVOTED TO INVESTMENT DECISION MAKING AND RELATED SUPERVISION OF ACCOUNTS
Number of Distribution of Responses Firms with b Categor (%) Account Managers 0-20% 21-40% 41-60% 61-80% 81-100%
24 11.11 3.70 11.11 22.22 51.85
11 21.43 0.0 42.86 0.0 35.71
35 14.63 2.44 21. 95 14.63 46.34
35 7.89 0.0 13.16 26.32 52.63
31 40.38 0.0 1 19.23 19.23 21. 15
66 26.67 0.0 16.67 22.22 34.44
59 9.23 1. 54 12.31 24.62 52.31
42 36.36 0·9. _ 2l!.24 15.15 24.24
101 22.90 0.76 18.32 19.85 38.17
Average (%)
74.37
56.43 t-.:l
68.24 ~
76.97
45.58
58.83
75.89
47.88
61. 78

Type Slze of of
Flrm Flrm
Laroe Fund Complex Small
Total
Laroe Non-Fund Complex Small
Total
Laroe Total Sample Small
Total
TABLE IV-76
PERCENTAGE OF INVESTMEm' RESEARCH ANALYST'S TIME SPEm' IN PERSONAL COm'ACT (VISITS, TELEPHONE CALLS, ETC.)
WITH ISSUERS OF SECURITIES
Number of Firms Distribut~on o~D:~~~~~~es by Category Wl.th Security
Analysts 0-20% 21-40% 41-60% 61-80% 81-100%
23 21. 74 43.48 21. 74 8.70 4.35 14 28.57 42.86 28.57 o 0 0.0 37 24.32 43.24 24.32 5.41 2.70
35 54.29 37.14 5.71 2.86 0.0 41 70.73 19.51 9.76 0.0 0.0 76 63.16 27.63 7.89 1. 32 0.0
58 41.38 39.66 12.07 5.17 1.72 55 60.00 25.45 14.55 0.0 0.0
113 50.44 32.74 13.27 .65 0.88
Average (percent)
36.0 30.0 34.0
21.0 18.0 20.0
27.0 21.0 24.0
I'V ~ 01

Category of
Employee
Acco:.Jnt Manager
Investment Research Analysts
(Secunty Analyst)
TABLE IV-77
PROPORTION OF FULL-TIME EQUIVALENt' ACCOUNT MANAGERS AND SEC1,"ITY ANALYSTS WITH LAW DEGREES OR ADVANCED DEGREES. IN BUSINESS ADMIN:, ;':RATION
Type Size Number of D1stribut10n of Responses by Category of of ' Respondent (nercent)
Fl.rm F.irm Fl.rms 0-20r. 21-40r. 41-60r. 61-80% 81-100r.
Fund Laroe 21 30 43 8.70 26.09 13.04 21.74 Complex Small 11 27.27 9.09 18.18 18.18 27.27
Total 34 29.41 8.82 23.53 14.71 23.53
Non-Fund Laroe 35 25.71 25.71 22.86 17.14 8.57 Complex Small 31 45.16 16.13 12.90 6.45 19.35
Total 66 34.85 21.21 18.18 12.12 13.64
Total Laroe 58 27.59 18.97 24,14 15.52 13.79 Sample Small 42 40.48 14.29 14.29 9.52 21.43
Total 100 33.00 17.00 20.00 13.00 17.00
Fund L'arae 22 9.09 9.09 27.27 27.27 27.27 Complex Small 11 27 27 9.09 18.18 9.09 36.36
Total 33 15.15 Q.09 24.24 21. 21 30.30
Non-Fund Larae 33 12.12 18.18 27.27 30.30 12.12 Complex Small 31 41.94 12.90 19.35 6.45 19.35
Total 64 26.56 15.62 23.44 18.75 15.62
Total Laroe 55 10.91 14.55 27.27 29.09 18.18 Sample Small 42 38.10 11.90 19.05 7.14 23.81
Total 97 22.68 13.40 23.71 19.59 20.62
Average Response
(percent)
49.86 54.52 51. 37
41.09 36.10 38.75 ~
0)
44.57 40.93 43.04
83.47 55.45 74.13
54.09 38.48 46.53
65.84 42.93 55.92

CATAGORIES OF AVAILABLE RESPONSES: CATAGORY 1. VERY IMPORTANT, ALWAYS USED CATEGORY 2. IMPORTANT, USED OFTEN BUT NOT ALWAYS CATEGORY 3. SOMEWHAT IMPORTANT, USED SOMETIMES BUT NOT FREQUENTLY CATEGORY 4. NOT IMPORTANT, USED ONLY INFREQUENTLY OR RARELY CATEGORY S. UNIMPORTANT, 'NEVER USED
TABLE IV-78
- APPROACHES--'tO-- SECuRITY EVALUATION - IMPORTANCE OF SPECIFIC ALTERNATIVES
T)'~e Sl.ze __ ~mbe.r Al ternat1 ve of of of
D~str~b,lt~on of Ret-poroses by I U
f-~-:-_-r!~!1l",p=o",=-,-t.=a,-,nce CuteO'or\! (%) ;"\,el.~ g2.
FundameT~t al Approac'h
Technlcal Approac'1
1 I 2 r--3 I 4 5, Res!,-~
Laroe 26 J 92.31 1 3.85 --:~5 r 0.0 0.0 I -1.1-2---:
Fl:::-m Fl.r'11 -ResE..~
Fur.d Complex
!\or.-Fur:d Co:-:,plex
S'T.all 14 71.43 21.43 7.14 u. 0.0 L36 I 'Iotal '40 85. 0 lU.OO O.UU U. o.u I L-20 :
! I ' ii i Lar-08 38' 84.21 13.16 2.63 0.0 0.0, 1.18 : ~all 52 65.38 25.00 3.85 1.9. .8~---r.-54 _;
Tot"l 90 73.33 20.00 3.33 1.11 I 2.22; 1.3_'L-____ , . . I I II Total Laroe 64 87.50 9.37 3.12 0.0 0.0 1.16
Sa:npl,,' Srall 66 66.67 24.24 4.55 1.52 3.03 I 1~~~_=: Total I 130 76.92 16.92 r 85 I 0.77 1.54 I 1.33
-I Fur.d . Larae . 26 7.69 11.54 ~.46 , 42.31 I 0.0 I 3.15 Complex S'N>.11 14 14.29 35.71 I 28 ••. ~+ __ ~1.43 I 9.0 ~o7 I
Total 'Il 10.00 20.00: 35.00. ___ 12.,0o_. 0.0 I 2.95
, I I I I I I No!C-Fund ~ce 38 0.0 15.79 i 26.32 I 47.37 I 10.53 3 .. 53
Cor--.olex ~ll 52 21.15 11.54 30.77 17.31! 19.23 3.02 . Total t- 90 I 12.22 13.33 28.89 30.00 15.56 3.23
I Total Large I 64 3.12 14.06 i 31.25 45.31 6.25 i 3.37 I Sa-:-ple SI7.a11 66 19.70 16.67 30.30 18.18 15.15, 2.92 I Tote! i 130 I 11.54 15.38 I 30.77 31.54 10.77 I 3.15
I'.:> "-l "-l

I AJternatlve i r
I r
I I SCOn04111C
ProJeclIon
I
I r
Otl!er Approaches
I
TABLE IV-78 (cqntinued)
APPROACHES TO SECURITY -E.\TALUATiON -:--iMf>bRTANCE- OF Si!ECIFIc-ALTERNATIVES
Type Size . _.~urnber D~str1but2on of Responses by I I of of -- of Imnortance Cateaorv (%) h.~"er;: ... ge I F1r:TI Firm Resn. 1 2 3 I 4 ~ Re~~0~~e
i I I
Fund Lnrae 25 24.00 64.00 12.00 0.0 0.0 1.88 I Cor.plex Sf"cd 1 14 28.57 28.57 28.57 14.29 0.0 I
2.29 Total 39 . 25.64 51. 28 17.95 5.13 0.0 2.03
Non-Fund Lc.!:"ae 38 26.32 55.26 15.79 2.63 0.0 ! 1.95 Cornplex Sf,lall 51 27.45 33.33 23.53 7.84 I 7.84 2.35
Tctal 89 26.97 42.70 20.22 5.62 ---=-~-: 49 j 2.18 r
Total Larcc 63 25.40 58.73 14.29 1.59 0.0 I 1.92 Sample S:na1l 65 27.69 3 .31 24.6 9. b.IH 2.34
Total 128 26 56 45.31 19.53 5.47 3.12 2.13
Fur.c . ~rqe 10 30.00 10.00 0.0 0.0 ! 60.00 I 3.50 Co~plex ~f11 5 40.00 0.0 0.0 0.0 60.00 ! 3.40
~rot21 15 33.33 6.67 0.0 0.0 60.00 3.47 !
9.09 I I Non-Fu!'ld bl.arce 11 18.18 0.0 0.0 72.73 4.18 COr7.,,1ex ~S,tc 11 21 0.0 14.29 0.0 0.0 I 85.71 I 4.57
'I ..... , cl 32 6.25 9.37 0.0 3.12 81. 25 I 4.4-4---1
Total Lc:rc;e 21 23.81 0.0 I ! 4.76 4r76 66.67 r 3.86 t Sa::-.ple S:\all GO .b9 11.54 0.0 -~ "U. ---,--
10c81 47 14.89 8.51 0.0 2.13 74.47 4._~_3 ___ !
t-:) '-l 00

CATEGORIES OF AVAILABLE RESPONSES: CATEGORY 1. VERY IMPORTANT, ALWAYS USED CATEGORY 2. IMPORTANT, USED OFTEN BUT NOT ALWAYS CATEGORY 3. SOMEWHAT IMPORTANT, USED SOMETIMES BUT NOT FREQUENTLY
CATEGORY 4, NOT IMPORTANT, USED ONLY INFREQUENTLY OR RARELY
CATEGORY 5. UNIMPORTANT. NEVER USED
TABLE IV-79
IMPORTANCE OF SPECIFIC EXl'ERNAL INFORMATION SOURCES TO THE SECURITIES RESEARCH PROCESS
! Lx~ernal ! Type Sl.ze .' Numbe.r Distn.butl.on of Responses by j 'I 1 Inf:rrnatlon cf of _.' of - Importance cateaorv (%) J..ver-....:ge. I ,.,-",o'Jrce Flr."1 FIrm Hesp. 1 2 3 4 :;. Res~;:;rse "
: I I I I! i I Fur.d Larae 26 7.69 51.85 21.08 3.85 11.54: 2.58 I Cc:-plex Sm"U 14 7.14 35.71' 7.14 I 7.14 42.86 3.43 :
Broker D·=alers - Purchased
VIa Co:r.:1l:ss1on Dollars
'I Q\;,a 1 40 7.50 47.50 17.50 5.00 22.50 2.87 \
I Larce 38 10.S3 34.21 15.79 10.53 28.95 3.1~3~ __ __ ~11 SO 2.00 18.00 16.00 10.00 54.00 3.96
, TGtal- - - 885.68 - 25.00 TS.91-- -ro-:2T; 43.1$- --3~60 ,
LTotal 'l Larae 64 9.37 42.19 18.75 7.81 I 21.88 2.91 I
~:Or:.-Fu~c Co~,plex
Sa''''ple 'I.. _S:nall 64 3.12 21.88 14,06 9.37 J 51.56 3.8_4 ___ 1
r .
rl1r.d , Lar E 26 3.85 7.69 15.38 19.23 I 53.85', 4.12 Complex ~1 14 7.14 7.14 28.57 I 7.14 I 50.00 ~:86
Total 40 5.00 7.50 '20.00 IS.00 52.50, 4.02
,-,<'c" '" ,",;".0; , "." ,."',,. ", U' _I
other Invest-I! I'! I l1>!>nt Advlsers ; Non-::"."d i La"",", 38 2.63 5.26 I 23.68 21.0S I 47.37! 4.05
on a Contl~ulng I Co;-pl€:=< t=sn:al1 S1 9.80 1.96 15.69 17.65 ~ 54.90.' .. 4:06---
I Or Contractual I T,,~ol' 89 6.74 3.37 19.10 19.10--l....-2l...:~ __ ~06
BaSlS i I
! Tot,,1 i L""t;e 64 3.12) 6.25 20.31 20.31' 50.00: 4.08 I I I Sa"'ple S'·,2.11 6S ".~3_ 3.yts _~ts.·5_b -,,_:>.3ts I _~j._ts~', 4.02 I \ I ',",otal 12 6.20 4.65 19.38 17.83 S1.94 I 4 . .05 ,
~ -.:r <:0

I
!
I i
TABLE IV-79 (Continued)
IMPORTANCE OF SPECIFIC EXTERNAL INFO~ION SOURCES TO THE SECURITIES RESEARCH PROCESS
External T~'pe S1ze .... Ifumbe.r Distribution of Responses by Information of of of IlTIDortance Cateoorv (%)
Source F~rm Flrm Reso. 1 2 3 4 5
Fund Laroe 26 0.0 7.69 38.46 34.62 19.23 Complex Small 14 14.29 35.71 28.57 7.14 14.29
Total 40 5.00 17.50 35.00 25.00 17.50 Research I Organl.Zatlons Non-Fund Laroe 38 0.0 26.32 23.68 36.84 13.16
Not Included Complex Small S( 14.00 34.00 22.00 12.00 18.00 Above (Wlth Total 88 7.95 30.68 22.73 22.73 15.91 or Wlthout
Compensatlon) Total Laroe 64 0.0 18.75 29.69 35.94 15.62
I Sa:nple SITall "4 14 06 34 38 23 44 10 94 17.19 Total 128 7.03 26 56 26~56 23.44 16.41
Fund Laroe 26 46.15 34.62 11.54 3.85 3.85 Co:nplex S:i1211 14 0.0 57.14 7.14 :>1 43 14.29
'Iotal 40 30.00 42.50 10.00 10,00 7.50 Dlrect Contact With Secunty Non-Fund Larqe 38 26.32 31.58 21.05 15.79 5.26
Issuers Complex S:nall ,,' 9.80 21.57 21. 57 21. 57 25.49 ' Total B9 16 85 25.84 21. 35 19.10 16.85
Total I Large 64 34.38 32.81 17.19 10.94 4.69 Sample Small 65 7.69 29.23 18.46 21.54 23.08
Total 129 20.93 31.01 17.83 16.28 13.95
Aver?ge Resp~nse
3.65 2.71 3.32
3.37 2.86 3.08
3.48 2.83 3.16
1.85 2.93 2.22
2.42 3.31 2.93
2.19 3.23 2.71
I I
I
I
~ 00 o

~ ~
'" .. o o
~
]1.
:::
:
,
Extcrn.1.1 Informut 10n
5qll
Flnanc1al Statements of Issuers
Other
TABLE IV-79 ( continued)
IMPORTANCE OF SPECIFIC EXTERNAL INFORMATION SOURCES TO THE SECURITIES RESEARCH PROCESS
Type S1ze ... tiurnber Distribut10n of Responses by of of of Imnortance Cateoorv (%l . -. F~rm Firm Resn. 1 2 3 4 5
Fund Laroe 26 80.77 11 54 ~ 85 o 0 3.85 Ccr:~plex Snall 14 50 00 28 57 14 2 ·00 7.14
Total 40 70 00 7.5C 7 50 o 0 5.00
Non-Fund L2.rae 3R I 68 42 11.1 Ii 10.53 5 26 2.63 Con:plex Small 4 IR ~. ~ 1'Q2 9.80
Total RC ~R' '4 2 :-?4 4 49 6.74
Total Large 64 73.44 12.50 7.81 3.12 3.12 Sample S'11al1 65 43.08 32.31 12.31 3.08 9.23
Total 129 58.14 22.48 10.08 3.10 6.20
Fund Larqe 8 12.50 25.00 0.0 0.0 62.50 Complex S'l1all 4 o 0 o 0 0.0 0 100.00
Total l' 8 33 16.67 0.0 0.0 75.00
Non-Fund Larce ~5 13.33 20.00 6.67 6.67 53.33 Corr,plex Smal '7 - ~ 1 11 3.70 55.56
7ctal ., 1';.'; 1 29 Q.52 4.76 54.76
Total Large 23 13.04 21. 74 4.35 4.35 56.52 Sample Sr:'lall 31 16.13 9.68 9.68 3.23 61.~9
'l'otal 54 14.R 14 81 7.41 3.70 59.26
hverage Resr;anse
1. 35 1.86 1. 52
1.61 2.08 1.88
1. 50 2.03 1. 77
3.75 5.00 4.17
3.67 3.67 3.67
3.70 _3.94 3.78
I I I
I I I
I
t-:) 00 -

Number
of Firms
Typt' of Size of In 1-65 Firm Firm Sample
Fund Large 27 Complex
Small 14
Total 41
Non Large ,
38 Fund Complex Small, 52
Total 90
Total Large - 65 Slmple
Small 66
Total 131
TABLE IV-80
Functions for Which Computers are used in Advisory Fims
Proportion of Firms Prol22rtion of Users who Emplo;:t Computer for Tasks SEecified (%)
Using a Computer I nVle s tmen t Economic Account Trading Sales General
t Research Research Admin - Admin Admin Admin
89 41 33 63 52 52 59
57 14 7 43 29 36 43
78 32 24 56 44 46 54
87 39 21 74 34 21 42
44 13 6 27 15 13 25
62 24 12 47 23 17 32
88 40 26 69 42 34 49
47 14 6 30 18 18 29
67 27 16 50 30 26 39
Other
15
0
10
13
10
11
14
8
11
~ 00 ~
283
H. MANAGEMENT OF SPECULATIVE FUNDS
1. Introduction
The purpose of this section is to provide a description of the ways in which aggressive capital gain oriented funds are managed and to examine differences in the portfolio behavior of two groups of such funds: (1) registered open-end funds which indicated they would engage in certain speculative investment techniques ("registered speculatIve funds"), and (2) unregistered private investment partnerships ("hedge funds"). This section reviews the growth of the hedge funds and' the registered speculative funds and compares the numbers of shareholders and limited partners, the average sizes of their holdings and the net capital inflows of both types of funds. It analyzes the aggre~te assets and liabilities of each type of fund including their cash pOSItions, borrowings and short sales. The aggregate common stock and convertible security holdings of each type of fund are classified by exchange listing, and the turnover and activity rates of their com-mon stock portfolios are contrasted. '
The extent to which the respective types of funds dealt in new issues during 1968 is reviewed and advisory fees and expenses of the two types of funds are examined. An attempt is made to determine what differences in the characteristics and operations of the two types of speculative funds can be attributed to differences in regulation, characteristics of investors and the size of the funds.
2. The Funds Sampled
The information contained in this section is derived from surveys of registered inve~tment companies and unregistered investment partnerShIPS conducted in 1969 by 'the Commission's Divisions of Corporate Regulation and Trading and Markets. The data obtained from the registered open-end investment companies cover calendar year 1968 and are based upon the responses of 43 such funds which, as of December 31, 1968, indicated that their policies included the use of one or more of the following investment techniques: (1) buying restricted securities; (2) selling securities short; (3) borrowing to purchase or carry securities; (4) purchasing or selling put and call options and (5) arbitraging.los The data obtained from the survey of unregistered private investment partnerships are based upon the statements provided by 140 such entities.lo6
106 Responses were requested from 44 funds, selected on the basis of a staff survey Indicating that these were the only funds which Indicated In their statements of policy thilt they could engage In one or more of the Investment techniques, One fund was excused from responding. In addition, responses were obtained from six closed-end Investment companies which Indicated they would engage in one or more of the speculative Investment techniques, However,' this section omits the data submitted by these closed-end companies.
100 The survey, conducted by the Division of Trading and Markets, was intended to assemble Information about investment entities which depended to a significant extent upon the use of margin accounts. bank loans, short sell1ng and the writing and buying of options, The survey was not confined to entities which engaged in this type of activity since Information was not available to Identify such investment partnerships, Originally 215 Investment partnerships and similar entities were included in the survey, Of these, 75 were eliminated because they were inactive during 1968 or were entities such as private investment clubs, family partnerships and others.

284
Unless otherwise indicated the data contained in this section are as of December 31, 1968. On that date, the 43 registered speculative funds had total assets of almost $1.7 bil1ion or approximately 3 percent of the estimated $58 billion invested in mutal funds, and were 7 percent of the 603 active open-end funds registered. The 140 hedge funds surveyed had total assets of $1.3 billion.
3. An Overview
The registered speCUlative funds were smaller and more recently registered than average mutual funds. The average size registered specul'ative fund was $39 million and the median size was $13.6 million, while the average size mutual fund was $96 million at December 31, 1968.107 The ,average hedge fund was $9 million and the medi'an size hedge fund was $2.7 million at December 31,1968. The average age of the mutual fund which reported to' the Study was 14 years 'as of September 30, 1969.10S More than half of the registered speculative funds surveyed, 24, were registered in the years 1966-1968. More than half of the hedge funds, 78, were formed in 1968 alone.
The hedge funds had fewer participants (none had as many as 100), but they were generally persons of greater means than the shareholders of the registered speoulative funds. The median number of shareholder ,accounts for the registered speculative funds was 3,250 and the average account size was $3,787. The avera~e account size for members of the Investment Company Institute ("ICI") was $5,800 as of December. 31, 1968.109 On that date the 28 largest hedge funds accounted for over 82 percent of the assets of all hedge funds. At the time of formatioh of those 28 hedge funds, the median capital contribution of their general partners was $100,000; for their limited partners, it was $149,000.
The median minimum purchase requirement for the 26 registered speculative funds which had such requirements was $500. For 14 of the 28 largest hedge funds, those which had a minimum requirement for new limited partners, the medi'an was $250,000.
The 35 registered speculative funds in operation throughout 1968 enjoyed a huge net capital inflow during the year, 105 percent of their beginning of the year net assets., For all members of the 101 net capital inflow was just over five percent of beginning of the year net assets.110 The net oapital inflow of the 43 registered specul'ative funds accounted for 34 percent of the net capital mflow for all members of the ICI.111 For the hedge funds during 1968 net capital inflow was 8.7
lOT In the sample of 320 registered Investment company accounts advised by 158 advisory firms reported In see. B of this chapter, the average account size was $174 million at September 30, 1969.
1<>1 Sec. B. above. 100 leI, 1969 Mutual Fund Fact Book. At yearend 1968, the leI represented 240 open
end Investment companies, with total assets of almost $52.7 bUllon, or about 90 percent of the total assets of all open-end Investment companies on that oate. Throughout this Reetion, data published by the leI for all 240 members In the 1969 Mutual Fund Fact Book will be referred to. '
110 leI, 1969 Mutual Fund Fact Book. 111 leI, 1969 Mutual Fund Fact Book.

285-
percent of the beginning year assets of those hedge funds which were in operation throughout the year. Total hedge fund ,assets grew flapidly from $333 million at yearend 1966 for the 35 hedge funds organized in 1966 or earlier to $1.3 billion for 140 hedge funds 'at year end 1968.
The largest portion of the assets of members of the 101, of the registered speCUlative funds and of the hedge funds was invested in common stocks as of December 31, 1968. However, the hedge funds and registered speculative funds had smaller portions of their portfolios invested in common stocks (61 percent of the hedge funds' and 74 percent of the registered speculative funds' portfolios) than did members of the ICI, who had 84 percent. Cash and cash items accounted for 6.1 percent of the total assets of ICI members, 8.8 percent of the registered speculative funds' and 9.5 percent of the hedge funds' total assets.
The relative total liabilities of the hedge funds (equal to 31.7 percent of total hedge funds assets) were about three times greater than the relative total liabilities of the registered speculative funds (10.8 percent of registered speculative funds total assets). Hedge fund borrowings were equal to 14.6 percent of their total assets, while borrowings were only 2.4 percent of the total assets of the registered speculative funds. Short selling played a significant role in the hedge funds' market strategy for 1968, but was of relatively minor importance for the registered speculative funds. Short positIons accounted for 11.6 percent of the yearend total assets of hedge funds, but less than one percent of the registered speculative funds' total assets. The ratios of short sales to total sales of the hedge funds were 10 times as high a those of the registered speculative funds during the first two quarters of 1968.
Although New York Stock Exchange listed common stocks were the largest stockholdings of the hedge funds and the registered speculative funds, they accounted for less than half of the stock portfolios of each, 49.4 percent of the registered speculative funds' portfolios and 46.7 percent of the largest hedge funds'.1l2 In contrast, NYSE listed stocks accounted for 92 percent of the common stock holdings of registered investment companies represented in Table IX-14, as of September 30, 1969.113 .
Over-the-counter ("OTC") stocks were the second largest of the common stock holdings of the registered speculative funds and of the hedge funds. Almost 29 percent of the registered speculative funds' common stock portfolios and 26.4 percent of the common stock portfolios of the largest hedge funds were OTO stocks. The registered speculative funds had 20 percent of their portfolios in American Stock Exchange ("Amex") listed stocks and the hedge funds had 25 percent as of December 31, 1968. In contrast, OTO common stocks accounted
110 Throughout this section the 28 largest hedge funds. with aSflets accounting for 82 percent of the a"Fets of the hedl!e fundR slIrveye<1. will be referred to. However Information on market listing was available for only 27 of the largest hedge funds_
113 Table IX-14 also in<1lcates that 96 percent of the common stock portfolios of all Institutions were Invested In NYSE listed stocks.

286
f'Or 6.2 percent 'Of the c'Omm'On st'Ock P'Ortf'Oli'Os 'Of a sampling 'Of 37 leI members f'Or the latter P'Orti'On 'Of 1970, and Amex listed st'Ocks acC'Ounted f'Or 5.7 percent 'Of the P'Ortf'Oli'OS 'Of registered investment c'Ompanies as 'Of September 30, 1969, as indicated in Table IX-14.
The registered speculative funds engaged in a much greater pr'OP'Orti'On 'Of trading in relati'On t'O their assets than did all members 'Of the ICI and the hedge funds engaged in a greater pr'OPortion than did the registered speculative funds.
The 30 registered speculative funds which purchased new issues during 1968 participated in about 30 percent of the number 'Of all 1968 new issues. These purchases of new issues were valued at almost $8 million at their initial offering price, or slightly less than 0.5 percent of the value of all new issues. The 82 hedge funds which purchased new issues participated in 64 percent of the number of 1968 new issues. The value of the hedge funds' new issue purchases amounted t'O $23 million or 1.2 percent of the value of all new issues. The registered speculative funds and the hedge funds combined received about 9.7 percent of the shares 'Offered in the 15 new issues in which they were most highly concentrated in 1968. On the average ,the hedge funds received three shares for every two shares the registered speculative funds received of these 15 new issues.
F'Or fiscal years ended during 1968 the registered speculative funds had significantly higher expense l"aitioo and 'advisory fees than did all members of the leI. The expense ratios 'Of 34 'Of Ithe registered speculative funds f'Or 1968 were 1.16 percent 'Of their 1968 average net assets on a weighted basis. Their 1968 advisory fees were 0.70 percent 'Of their average neit assets 'On a weighted basis. In contrast, the Ie] claimed expense ratios 'Of 0.46 percent of average net asoots and advisory fees 'Of 0.35 perceilit 'On a weighted basis in 1968 f'Or a srumple group representing 90 percent of the assets of i:s members.ll4 The higher expense and advisory fee ratios 'Of the registered speculative funds may be explained to a great degree by the hIgher percentage 'Of performance fees among the registered speculative funds. Of the 35 registered speculative funds which comprised the sample, 51 percent had perf'Ormance fee arrangements for 1969 while only 17 percent of the industry sample described in section D 'Of this chapter had performance fee arrangements as 'Of September 30, 1969. Of ,the 28 largest hedge funds, 23 oompenswted ,their general partners 'On the basis 'Of a perce1lltage 'Of the fund's realized oo,p~bal gains. Of these funds, 19 paid their managers 20 perceilit of net realized cap-i-tal gains, 'Operating profit 'Or income.
By September 30, 1970, the total assets 'Of the 28 hedge funds which were largest 3it December 31, 1968 were almost 70 percent less ,than at yearend 1968 and rut least 5 of ithe 28, including -the one which was
114 But see, 1969 Hou8e Hearings 874-877 for the Commission's cr1t1cism of these averages.

287
previously the largest, had either been diss'Olved 'Or were in the process 'Of liquidating. The net assets 'Of the registered speculative funds were 40 percent less at June 30, 1970 than they were as 'Of yearend 1968.
4. Size
In general, ,the hedge funds were smaller <than the registered speculative funds. Table IV -81 classifies the 43 registered speculative funds and 140 hedge funds into six 8elts by asset size and indicates the 'percellitage which each set represents 'Of ,the t'Otal number 'Of hedge funds and 'Of :the total number 'Of registered speculative funds and 'Of 'the aggregBJte It'Olbal assets 'Of each type 'Of fund as 'Of December 31, 1968. Of ,the registered speculwtive funds surveyed, 15, 'Or 35 percent, had assets 'Of less than $5 m'illi'On. In OOIl'trast 99, 'Or 71 percent, 'Of the hedge funds had assets 'Of less than $5 milli'On. The registered specu},a.tive funds ranged in size from $355,000 ,t'O $356 milli'On in assets as 'Of December 31,1968. The median size 'Of the registered speculrutive funds was $13.6 milli'On, while Ithe average size was $39 milli'On. The hedge funds ranged in size fr'Om less than $50,000 in assets 'to $118 milli'On. The median hedge fund size was $2.7 milli'On and the average size was $9 milli'On. The 28 largest hedge funds, th'Ose with assets in excess of $10 million at December 31, 1968, held 82 percent 'Of the total assets 'Of the 140 hedge funds included in the survey.. .
5. Year 'Of Registrati'On 'Or Formation
Most 'Of ,the funds studied were relatively new. Only 10 percent, 14 'Of the 140 investment partnerships 'llOtive in 1968, had existed five years earlier. Of ,the registered specul,a;tive funds, 17, 'Or 30 percent, were registered five years earlier. M'Ore ,than half 'Of Ithe hedge funds, 78, were formed during 1968, while m'Ore than half 'Of the registered specUlative funds, 24, were f'Ormed in ,the peri'Od 1966 through 1968.
Table IV-82 classifies the registered speculative and hedge funds surveyed by asset size and year 'Of registration 'Or f'Ormation. Although the 'Oldest hedge fund surveyed was f'Ormed in January, 1949, it was n'Ot until the latter part 'Of the 1960's that hedge funds began t'O pr'Oliferate. Table IV-82 indicates that 116 'Of the 140 hedge funds were formed in the years 1966-1968. The sharp contrast. in the time pattern in the f'Ounding of the hedge funds and registered funds is dem'Onstrated by Chart IV H-a. This c'Ontrast may be explained in part by the absence 'Of any registrati'On 'Or minimum size requirements f'Or the hedge funds. Differences in the rewards t'O the managers, normally the general partners, may als'O explain the increase in hedge funds.ll5
U5 See see. H. 16 below.

Number of Funds Formed or
Registered
100
90
80
70
60
50
40
30
20
10
288
Chart IV H-A'
Year of Registration or Formation of Speculative Funds
-""",. ... _---- -------
o ,.
.... " .... .---------,
Pre 1964 1964
Registered Funds
1965
Hedge Funds _____ _
1966
6. Growth of Funds Assets
1967 1968
The growth in the numbers of registered speculative funds amI hedge funds was accompanied by an increase in their asset size. The 35 hedge funds organized in 1966 or earlier had aggregate assets of $333 million at yearend 1966, $588 million at yearend 1967 and $830 million at yearend 1968.116 Those hedge funds that had been in ex-
110 Includes fiscal year rather than calendar year data for three funds and net assets rather than total asset values for two funds.

289
istence for several years grew through admission of new partners, additional investments by existing partners and market appreciation of their portfolios. '
The registered speculative funds had net assets of $162 million or less than 0.5 percent of the $38.1 billion invested in mutual funds !lit the end of 1965. During the next three years, total assets of all mutual 'funds increased 53 percent, but total net assets of the funds which indicated that they would engage in speculative techniques grew more than 825 percent to ,almost $1.5 billion. During the three year period, three registered speculative funds accounted for a large portion of the growth, expanding from approximately $83 million at the beginning of the period to approximately $737 .million at yearend 1968. A fourth fund jumped from just over $1 million in assets to over $100 million in the year 19'68 alone. '
The' asset growth of the registered speculative funds reflected not only new cash inflows but also capital appreciation. Of the 22 registered funds with speculative investment policies which had made a public offering before 1967, 13 had per share appreciation of 50 percent or more. At yearend 1968, the 31 speculative funds in operation throughout the' year showed an average appreciation for the year of more than 21 percent.
7. Registered Speculative Fund Shareholder Accounts and Minimum Purchase Requirements
At least 389,000 shareholder accounts, or almost 4.2 percent of the shareholder accounts of all rCI member funds were represented at December 31, 19'68, by the 40 registered speculative funds for which such information was provi~ed. The number of shareholder accounts per registered speculative fund ranged from as few as 100 in a $359,-000 fund to almost 89,000 in a $278.3 million fund. The median number of shareholder accounts for the registered speculative funds was 3,250, while the average number of shareholder accounts per registered speculative fund was 9,722. In contrast, half of 308 registered investment companies surveyed had 10,000 or more shareholder accounts,117
Table IV -83 ranks the funds by size and indicates the number of shareholder accounts by fund size among the 40 registered speculative funds for which informUition was provided. It indicates that more than half of the registered speculative funds, 24 of 40, had less than 5,000 shareholder accounts and that }5 of these 24 had between 1,000 and 5,000 shareholder accounts. As might be expected, the largest funds tended to have the largest numbers of shareholder accounts, 13 funds with assets of $25 million or more each had 5,000 or more shareholder accounts. In the 'aggregate, the four largest registered funds had almost 220,000 shareholder accounts and together accounted for almost 57 percent of the 389,000 shareholder 'accounts of the registered funds which supplied information.
The average shareholder account size for the 40 registered speculative funds was $3,787. This compares with an average account size of $5,800 for all ICI members as of December 31, 1968. The median size
117 See Table IV-26.

290
of shareholder accounts for each of the registered speculative funds at December 31, 1968, ranged from $692 per account to $27,200.
Of the 43 registered speculative funds surveyed, seven had no minimum dollar imtial investment requirement. For the 26 which required minimum dollar investments, the average minimum dollar purchase requirement was $1,105 and the median was $500. A minimum share purchase requirement of from five to 100 shares was required by nine funds. For these funds the minimum investment requirement at December 31,1968, ranged from $50 to $915. At the.other end of the spectrum, the remaining fund, a so-called "swal? fund", which issued its securities only in exchange for other securi "les, required an exchange of securities with a value of not less than $10,000. The highest minimum purchase requirement was $15,000.
8. Hedge Fund Partners and Their Capital Contributions
The typical hedge fund is organized as a limited partnership with . one or more general partners who manage the fund and a much larger number of limited partners who do not ,Participate in investment decisions. Of the 140 investment partnershIps surveyed 127 were so constituted (93 with only one or two general partners),11s In all, the 140 hedge funds had· 482 general partners and 3,240 limited partners 3Jt December 31, 1968. .
Table IV-84 indicates the distribution of limited partners among the 127 hedge funds set up as limited partnerships. It indicates that 73 of the 127 partnerships had 15 or more limited partners.ll9 Although the number of limited partners varies greatly, all of the hedge funds had less than 100 participants since they would be required to register under the Investment Company Act 1£ they were to exceed this number.l~o Generally there is a positive correlation between the assets of the partnership and the number of limited partners. Of the 27 largest typical private investment partnerships (those with assets of $10 million and over) only one had less than 15 limited partners, six had between 15 and 29 limited partners, 9 had between 30 and 49 limited partners, 9 had between 50 and 74 limited partners and two had between 75 and 99 limited partners.
Capital contributions to a hedge fund do not end with its formation. In all, 71 hedge funds reported a minimum initial investment
l18In 10 of the remaining 13, all participant. werp gpneral partners. None of these had assets In excess of $1.5 million. The other three had only one limited partner and seven 01' eight genpral partners.
U9 Section 203(b) (3) of the Investme'lt Advlse"s Act, 15 U.S.C. SOh-3Ib) (3) (1964), excepts from the registration requirement of that Act any Investment adviser who during the course of the preceding 12 months has had fewer than 15 clients and who does not hold himself out generally to the public as an Investment adviser. The Investment Company Amendments Act of 1970 (P.L. 91-547) adds the requirement effective December 14, 1971 that to qualify for the excpption from registration the Investment adviser may not be an Investment adviser to any Investment company registered under the Invpstment Company Act.
]20 Spction 3(c) (1) of the Investment Company Act excludes from the definition of Investment Company any Issuer whose outstanding securities (other than short-term paper) are beneficially owned by not more than 100 persons and which Is not making and does not presently propose to make a public offering of its securities. See Securities Act Release No. 4552 (1962). Registration under the Investment Company Act may be required even if a partnership has less than 100 partners If some of the partners are not Individuals but are joint accounts 01' other entities investing in the fund. In such case each participant could be counted separately. Registration could also be required If n public oll'erlng were made or more than one partnership is created whose memberships aggregate more than 100 persons and they are operated on a parallel or integrated basis. Only two of the hedge funds approached the 100 per.on maximum. One had 96 limited partners, three general partners and assets of $250.000, and the other had 95 limited partners, two general partners and assets of almost $5 mUlIon at year end 1968.

291
requirement for new limited partners.121 Of these, 27 had assets of $5 million or more and all 27 reported a minimum requirement of $100,-000 or more. The minimum amount of initial investment required by the 71 hedge funds which reported this information is shown in Table IV-85.
The 28 largest hedge mnds (representing 82 percent of the assets of the hedge funds surveyed) received contmuing contributions from both their general and limited partners from their formation through December 31, 1968. These contributions took the form of cash, securities, reinvestment of dividends and capital gains distributions or any combination of the three. Table IV -86 indicates the number of partners, the average capital contribution at time of formation and the minimum capital contribution for new limited partners for the 28 largest hedge funds as of December 31, 1968. The capital contribution of the limited partners of the 26 hedge funds which had limited partners at the time of their formation ranged from $1,000 to $800,000 and the median capital contribu~ion at the time of their formation was $149,000. The general partners' average capital contribution at the time of formation ranged from $1 to $1,027,000 and the median of the average capital contributions of the general partners was $100,000.
Half of these 28 hedge funds required a minimum capital contribution for new limited partners. The minimums ranged from one fund with $100,000 to four funds with a $500,000 minimum contribution. The median value of the minimum capital contribution requirements for new limited partners of these 14 hedge funds was $250,000.
9. Capital Inflow
Of the 43 registered specUlative funds, 35 were in operation throughout 1968. As indicated in Table IV-87 their total net cash inflow for the year was $538 million or 105 percent of their net assets at the beginning of the year.122 For all members of the ICI 1968 net capital inflow was almost 5 percent of beginning of the year net assets.123 The eight registered speculative funds which began operations during the year received $195 million in their initial offerings 124 and an additional $.'39 million during the year for a total of almost $234 million. The total net inflow of the eight new funds accounted for 30 percent of the total capital inflow of the 43 registered speculative funds and 18 percent of the year-end total net assets of this group. The $772 million total net inflow of the 't3 registered speculative funds accounted for 34 percent of the net inflow of all members of the ICI for 1968.125
121 These hedge funds were rl'Quested to state whether any minimum amount was r~ qulred as an Initial Investment by any new partners. Many funds were so new at the time they responded that they had not considered this question. Others stated they had no Inttmtlon of admitting new partners.
IJ!2 The registered speculative funds were not asked to report purchases and sales of their shares .. However. estimates of thplr net cash Inllow and Initial capitalization were based upon Informa~lon contained in their monthly balance sheets. Net cash Inllow was estimated on the baSIS of the number of shares outstanding at the end of each month. and the average net asset value per share durin!!" each month with adjustments made for di.trlllUtions. Relm"ested InCOme and capital gains distributions were not counted as capital Inllow. The amount of capital contributed in a fund's initial public offering was equal to the firr.t rpportPd value of net assets for tha t fund.
'''' ICI, 1969 Mutual Fund Fact Book 13-19. ,.. Shares sold at Initial offering price. 120 ICI. 1969 Mutual Fund Fact Book 13-19. ICI figures inClude reinvested Income dis
tributions of $632 million as capltallnllow.
292
As is indicated in Table IV -88 the monthly total net cash inflow for the 35 registered speCUlative funds in operation throughout 1968 ranged from $31 million to $64 million and the average monthly cash inflow for the group was $45 million, or 9 percent of net assets as. of the beginning of the year. During the first half of 1968, net cash Inflow averaged 7.5 percent of the net assets of the 35 registered speculative funds as of the beginning of each month; however, it declined to 4.8 percent during the second half of the year.
The correlation between net cash inflow and unadjusted performance may be examined in Table IV -89 which classifies the 35 registered speculative funds which operated throughout the year into seven groups of five funds each, according to their relative rates of return for 1968.126 The funds in the group WIth the best rates of return over the year accounted for 27 percent of the total net inflow of all 35 registered speculative funds. The net cash inflow of the funds in the other performance groupings ranged from 13 percent to 119 percent of their beginning of the year net assets. However, the group with the best rates of return over the year had a net cash inflow which amounted to more than 46 times (4,606 percent) their beginning of the year net assets. The ratio of the 1968 net inflow to December 31, 1967 net assets for the five funds with the best 1968 performance was 39 times higher than the next highest ratio for the groups of registered speculative funds and affords dramatic evidence of the strong correlation between performance and sales of funds shares among the registered speculative funds.
Hedge funds may derive capital inflow from new partners, existing partners or both. Table IV -90 indicates that the average net additional capital inflow 127 per fund for the 28 largest hedge funds increased over the 3-y'ear period, from $2.5 million in 1966, to $4.4 million in 1967 and $4.7 mIllion in 1968. Their 1968 total net additional capital inflow of $113.4 million represented 10.7 percent of the 28 hedge funds' year-end total assets. The 23 hedge funds in this group which were in existence throughout the year had total net capital inflow of/$78.2 million during 1968 128 which was 8.7 percent of their total assets at the beginning of the year.
10. Assets
A comparison of the assets held by the 43 registered speculative funds, 129 hedge funds and all members of the 101 at yearend 1968 is contained in Table IV -91. It indicates a number of significant differences between the operation of the hedge funds and the registered speculative funds and between the speculative funds and the general fund population represented by leI members.
The hedge funds used leverage to a much greater extent than the registered speCUlative funds. Liability items were equal to almost 30 percent of the total assets of the hedge funds as of December 31, 1968,
12<1 The rates of return discussed are not the volatility adjusted performance measures dlscussed In other parts of the Study, but simply represent the total return to stock· holders during the Interval.
U7 Partner contribUtions (cash, securities, and reinvestment of dividends and capital gains) less partner withdrawals. .
128 This figure represents the $113.4 million total net arlrlltlonlll capItal Inflow for 1968, less $35.2 million attributable to the fiye hedge funds formed during that year.

293
while they equaled only about 11 percent of the assets of the registered speculative funds.129 The net asset figure published by the ICI did not dIstinguish between total and net assets of its members.
Although the largest portion of the total assets of each of the three groups was invested in common stocks, the hedg~ funds held a significantly smaller portion of their assets, 61 percent, in common stocks than did the registered speculative funds, 74 percent. In contrast, the portfolios of ICI members as a group consisted of 84 percent common stocks.
Convertible preferred stocks accounted for 5.4 percent of the port· folios of the registered speculative funds and 6.7 percent of the hedge funds' portfolios. The data published by the ICI do not distinguish between convertible and non-convertible preferred stocks or between non-convertible and convertible bonds. However, a comparison of all senior securities indicates that ICI members' portfolios contained 9.7 percent senior securities, compared with 7.0 percent of the registered speculative funds' portfolios.
The hedge funds' portfolios contained 4.2 percent warrants while the registered speculative funds held half that percentage of warrants, 2.1 percent. For the industry as a whole warrants were a negligible item and were not separately stated in the aggregate data. The hedge funds held receivables for securities sold of 7.9 percent which was more than double the 2.9 percent receivable for securities sold held by the registered speculative funds. This is probably a reflection of the hIgher turnover rate of hedge funds, almost double that of the registered speculative funds.13O
The "other assets", which comprise 4.9 percent of the portfolios of the registered speoulative funds and 3.6 percent of the hedge funds portfolios, include dividends and interest receivable, accounts receivable for shares subscribed ·and proceeds from short sales and accounts receivable for securities sold where that item accounted for less than 10 percent of a respondent's total assets.
11. Cash Position
Both types of speculative funds consistently held relatively greater percentages of cash and cash items than did members of the ICI. At December 31, 1968, ICI members held cash and cash items of 6.1 percent of total assets. The hedge funds were 9.5 percent in oash and cash items and the registered speculative funds held 8.8 percent in cash and oash items.
Cash may be held for several reasons: (1) as proceeds from fund shares sold but not yet invested; (2) as proceeds from sales of portfolio securities not yet re
invested; (3) as proceeds from dividends received on portfolio securities; (4) for operations, such as maintaining minimum bank bal
ances, payroll and other current liabilities; (5) for distribution to stockholders; (6) to meet redemptions; and
,.. They also used other forms of leverage such as buying and selUng puts and calls and investing in warrants. See Tabe IV-94. '
130 For a more comphte discussion of turnover rates. see sec. H-14 on Common Stock Turnover and Activity Rates.

294
(7) as a portfolio strategy, to maintain a defensive position or for portfolIO flexibility.
Table IV-92 compares the 1968 quarterly cash positions of the registered speculative funds and the hedge funds, classifying the funds by asset size. The higher percentage or cash held by the registered speculative funds and hedge funds, and all speculative funds as a group compared to the percentage of cash held by all ICI members, probably reflects the smaller size of the speculative funds, the need to meet current liabilities and the portfolio flexibility maintained by both the registered speculative funds and the hedge funds.
12. Li'abilities Table IV -93 reveals a number of significant contrasts between
the percentages of liabilities to total assets of the registered speculative funds and the hedge funds as of December 31, 1968. One striking difference has already been indicated in the discussion of assets above, i.e., that the relative total liabilities of the hedge funds (equal to 31.7 percent of total assets) were about. three times greater than the relative total liabilities of the registered speculative funds (which were equal to 10.8 percent of total assets).
Hedge funds borrowingS were equal to 14.6 percent of total assets and 20 percent of net assets. These borrowings were composed of loans due to broker-dealers on margin of 4.5 percent of total assets,l3l loans payable to banks under Regulation U of 0.3 percent of total assets and other loans payable to banks of 9.8 percent of total assets. On the other hand, although 41 of the 43 registered funds were authorized to borrow from banks their loans outstanding amounted to .only 2.4 percent of total ,assets as of December 31, 1968.
Another significant difference is that short positions were equal to 11.6 percent of the total assets of hedge funds but only 0.8 percent of the registered speculative funds' total assets. Thus short selling was a relatively important part of the portfolio strategy of the hedge funds during 1968, but was not significant for registered speculative funds as a group. The small short position of the registered speculative funds reflects, in part, a self-imposed limitation. Only 17 registered speculative funds indicated in their investment policies contained in their registration statements under the Investment Company Act that they would engage in such activity.132 It also reflects the Commission staff's interpretation of Section 18 of the Investment Company Act which limits borrowings by investment companies.l33 The hedge funds, on
131 The registered speculative funds had no loans payable t; broker·dealers on margin. This Is explained by the Commission staff B Interpretation of the prohibition against borrowing hy open-end investment companies contalnen In Section 18 of the Im-estment Company Act. Unless such borrowing is from a bank, the Commission stall"s Interpreta· tlon Is that open-end companies may not establish a margin account with a broker for the purpose of effecting .ecul'ities transactions on margin. [Investment Company Act Release No. 5633, (1969) p. 6.]
132Pursuant to Section 13(a) of the Investment Company Act, having Indicated a fundamental policy with respect to short selling, a fund may not alter It without a vote of a majority of Its outstanding voting securities.
133 The staff regards a short sale (other than "against the box") as Involving borrow. Ing prohibited by Section 18 of the Act. However, the staff wUl not recommend any action for violation of Section 18 If the fund deposits and maintains collateral with the broker In the form of cash or government securities equal to the market value of the securities sold short. Both the proceeds and the collateral so deposited must each be equal to the value of the securities sold short so long as the short position Is open, and the value of the collateral deposited against short sales, exclusive of proceeds, must not exceed 35 percent of the value of the fund's net assets. [Investment Company Act Release No. 5633, (1969) p. 6]·

295
the other hand, were not under such restrictions. As indicated in Table IV-94, 25 of the largest hedge funds engaged in short-selling activities during 1968. The maximum month-end short positions of these 25 hedge funds were over 100 percent of their long positions in two instances, and ranged between 50 and 100 percent of the long position in 11 other instances.
Short selling, a tool for the sophisticated investor, is characterized by high risks. In an ordinary long position, the investor's risk is limited to 100 percent of his investment; in a short position, the investor's potential loss' is unlimited. In general, there a.re three types of short sales:
(1) Short sales for profit are used when the seller expects the price of the security to decline in the future. The difference between the price at the time of the short sale and the price when the short position is covered determines the profitability of the transaction.
(2) Short sales as a hedge are used when the seller desires to protect his portfolio against the possibility of large lo&.es due to market fluctuations. Such short sales would not be made for profit per se, but would be selected in conjunction with an analysis of all portfolio holdings in order to minimize the risk of ma,rket fl uduati on.
(3) Techmical short sales occur principally in two instances: when the seller goes short against the box, i.e., holds a long position at least equal to a short position in the same security or when the seller engages in lany of several types of arbitrage trans,actions, e.g., purchasmg convertible bonds ·and selling the common stock short.
In theory, the hedge fund concept relies upon combining short sales with leverage through borrowing to capitalize upon the ability to discriminate selectively between stocks. Successful hedging requires the selection of short positions in conjunction with long positions to minimize market risk. If price movements of the stocks are unrelated, a short sale in a stock with greater volatility would increase the risk of loss and the use of leverage would make such a portfolio even more speculative.134
To the extent that the short 'position of 11.6 percent of hedge fund total assets represented defensIve hedging it would have tended to offset the 14.6 percent loans outstanding of the hedge funds and there:by to have diminished the market exposure of the hedge funds. To the extent that it represented short sales for profit it would have tended to increase the speculative characteristics of th~ hedge funds.
The various speculative investment techniques which the 43 openend !Ul1d~ surveyed indicated they could engage in as of yearend 1968 are lIsted In Table IV -95. By far the most prevalent practice was bank borrowing. As indicated in the table, 41 of the 43 funds were authorized to borrow from banks. Short selling was the next most popular speculative technique, indicated by 17 funds. Buying and selling put
, .. For example, if a hedge fund has $1,000,000 in assets and borrows $500,000, it may buy $750,000 worth of securities and sel! an equal amount of securities short. If all or most of the securities decline then the profits on the short sales wlll oO'set losses on the long position-a classical "hedge". If, however, the securities purchased decline and those sold short go up the combination of unlimited loss potential on short sales and 150 percen t loss on assets due to the leveraging eO'ect of borrowing can be disastrous.

296
and call options was authorized by 12 funds. Hedging 135 and short term trading 136 were each authorized by 11 funds, whIle eight were authorized to invest on margin and six to write put and call options.
An indication that a fund could engage in a particular speculative practice did not necessarily indicate that it consistently followed that· practice. For example, although 17 of the funds indicated that they could sell short, only six actually held non-technical short positions on October 8,1968.137 Similarly, while 12 funds indicated they could trade in options, only six actually purchased put and call options and then only on 55,800 shares. Although six registered speculative funds indicated they could write options, only two actually did so during 1968. The options they wrote covered 8,000 shares for which they received premiums totaling $59,362.
Table IV-93 indicates that the registered speculative funds had 58 percent of their total liabilities, which equalled 6.3 percent of total assets, under the item "Payable for Securities Purchased." Although securities purchased in "general accounts" familiar to investors must be paid for within five business days, investment companies customarily utilize "special cash accounts" to pay for their securities.13B The payment requirement of a special cash account is ordinarily seven full business days. However, a broker is permitted to extend credit to a oustomer for up to 35 calendar days (or more, if proper authorities grant specific approval) when a broker executes an order in a special cash account "with the understanding that he is to deliver the security promptly to the customer, and the full cash payment by the customer is to be made promptly against such delivery." 139 During periods of heavy market activity it is not unusual for brokers not to receive and deliver securities, especially those which are heavily traded, to customers within seven business days. The 35 calendar days permitted by Regulation T may enable a fund with a high turnover rate to continually own a relatively large amount of securities for which it has not yet paid.
The net balance payable for securities purchased, for each quarter of 1968, for the registered speculative funds that reported such balances is shown in Table IV -96. It indicates, on an overall basis, the extent to which these funds were using the "float" or balance payable for securities purchased to own securities for which they had not paid. Deducting the amount receivable by funds for securities they had sold, the net balance payable for securities purchased exceeds 5 percent of net assets of all of the funds in the group for the last three quarters of 1968. Although the aggregate figures do not appear startling, in eight instances the balance payable for securities purchased exceeded 25 percent of the net assets of the fund, (and in one of the eight instances, it exceeded 50 percent) thus providing an important source of leverage for these registered speculative funds.
135 Hedging Is definPd for these purpoRes as the use of Investment techniques, most commonly selling short, to protect the value of a portfolio In the event of a general decline In securities prices.
136 The purchase and saIl' of a security within a six month period. 131 This Is a representative date for which the New York and American Stock Exchanges
reported total short positions. 138 The provisions governing special cash accounts are set forth In Reg. T, 12 CFR
220.4(c) ("Credit by Brokers and Dealers'·) issued by the Board of Governors of the Federal Rpserve System pursuant to the Securities Exchange Act of 1~34.
1"12 CFR 220.4 (c) (5).

297
Such use of shori; term credits, either alone or in conjunction with borrowings, in some cases may have boosted the leverage employed by the registered speculative funds beyond the point envisioned in the Investment Company Act.140
13. Exchange Listings of Portfolio Securities
The exchange listings of the portfolio securities of the hedge funds and the registered speculative funds are relatively similar when compared to each other, although some differences exist. Table IV -97 sets forth the composition of the portfolios of the 43 registered speculative funds and 27 of the 28 largest hedge funds by market listing as of December 31, 1968. Their portfolios are divided into common stocks ~nd convertible securities. As indicated by Table IV-97, NYSE listed stocks were the largest common stock holding of both groups, although less than half of the portfolios of both, 49.4 percent of the registered speculative funds' portfolios and 46.7 percent of the hedge funds'. The next largest holdmg of common stocks of the registered' speculative and hedge funds was in OTC stocks, 29 percent of the registered speculative hedge funds' and 26 percent of the hedge funds'. Almost 25 percent of the common stock por"folios of the hedge funds and 20 percent of the common stock portfolios of the registered speculative funds were invested in Amex listed common stocks. These percentages should be viewed in the context of Table VIII-48, which indicates that about 75 percent of the value of all common stocks a year later (yearend 1969) was listed on the NYSE and almost 6 percent on the Amex.
A significant difference between the way the registered speculative' fllnds and hedge funds we,re managed and the way other types of funds were managed is indicated by comparing the exchange listings of the stocks in the portfolios of the registered speculative funds and hedge funds with those of other investment companies and other accounts of investment company advisers, as shown in the distribution of institutional class portfolIOs in Table IX-14. That Table, which shows exchange listings for the portfolios of representative industry groups, includes the exchange listings of the portfolios of the registered investment companies and of the other accounts of the 72 investment advisers ·of the largest investment company complexes at September 30,1969.141 Table IX-14 indicates that 96 percent of the portfolios of all institutions, 92 percent of the portfolios of registered investment companies and 96 percent of the other accounts of the investment advisers represented were in NYSE listed stocks, almost double the holdings of NYSE listed common stocks for both the registered speculative funds and the hedge funds.142
The OTe holding;; of the representative industry accounts included in Table 14 of Chapter IX were only 2.2 percent and 1.8 percent respectively-less than one-tenth of the 26.4 percent and 28.9 per-
,,. Investment Company .Act § 18 (f), in effect, limits borrowings to 50 percent of net aRsets.
1<1 The data contained in Table IX-14 were as of a date nine months later than the data contained in Table 1"-97.
H2 The Amex listed stor.ks of the representative industry accounts were as follows as of September 30. 1969: all institutions 2.4 percent; registered investment companies 5.7 percent; and other accounts of investment advisers 2.3 percent.
53-940 O-71-pt. 2-12

298
cent of OTe common stocks held by the hedge funds !tnd the registered speculative funds. The percentages of OTe common stocks held by the registered speculative funds and the hedge funds were also substantially in excess of the 6.2 percent of assets held in OTe common stock by a group of 37 investment companies of various sizes and investment objectives for dates between June 30 <Lnd November 4, 1970,143 Similarly, the 25.3 percent holdings of OTC traded convertible securities by the registered speculative funds and the 21.6 percent holdings of such OTC traded securities by the hedge funds at December 31, 1968 substantially exceed the 6.5 percent of OTC traded bonds and preferred stocks held by the 37 funds in the leI industry sample for the latter part of 1970,14~
These marked differences in the exchange listings of the portfolios of the registered speculative funds, the hedge funds and the broader samples, are an indication of the extent to which the registered speculative funds and the hedge funds were investing in more volatile stocks.
14. Common Stock Turnover and Activity Rates
The active stock market of 1968 began with a steep decline during the first quarter, was followed by a sharp and pronounced recovery during the second quarter and subsequent smaller gains in each of the two remaining quarters. Table IV -98 indicates the common stock turnover and activity rates for registered speculative funds and hedge funds and ICI members by quarter during 1968.145 It also shows the quarterly changes in the NYSE Composite Index and the quarterly purchases and sales, both long and short, for the funds.
The hedge funds were much more active than their registered connterparts. The quarterly turnover rates for the hedge funds' common stock portfolios averaged almost 95 percent during the first half of the year, while the comparable rate for the registered speCUlative funds was about 36 percent per quarter. In the second half of the year hedge funds had an average turnover rate of 65 percent per quarter while the registered speculative funds had an average turnover rate of 30 percent per quarter. These produced annual turl10ver rates for the registered ~peculative funds in the neighborhood of 143 percent and for the hedge funds of 317 percent.146 The annual turnover rate for members of the ICI approached 45 percent.147 Thus, the registered speculative funds engaged in substantially greater short-term trading than did leI member funds in general and the hedge funds
143 Source ICI. The 37 funds Included In this sample had total assets of $20.7 billion. 1" Source ICI. Sample Includes convertible and non-convertible preferred stocks and
bonds. H5 Portfolio turnover Is the lesser of purchases or sales divided by the average asset
value of the securities concerned during the period in which the transaction occurred. "Activity rate" measures the market Impact of an portfolio transactions and Is defined
as the average of purchases and sales divided by the same base used to compute turnover. Since this formula uses the a vernge of purchases and sales, the activity rate will always be larger than the turnover rate.
143 For 1969, the 17 hedge funds which submitted Form 1-26 to the Study had an. annual turnover rate of 393%. A similar 1969 turnover rate, 360% was indicated by seven offshore funds (three publicly and four privately offered) which submitted form 1-26 to the Study.
14' Similarly, the annual turnover rate for 1968 was 44 percent for a group of 18 reg· Istered closed-end Investment companies which submitted Form 1-26 to the Study_

299
engaged in substantially greater short-term trading than did the registered speculative funds.
The registered speculative funds showed their greatest portfolio activity in the rising market of the second quarter of 1968 and were least active in the fourth quarter and in the declining market of the first quarter. In contrast, the hedge funds' transactJions were particularly heavy in both the first and second quarters, with activity rates exceeding 100 percent in both periods.
The short sales turnover and activity rates for the registered speculative funds were higher than the corresponding rates for the hedge funds in each quarter. However, the rates for the registered speculative funds were based on a significantly smaller volume of short sales. The short sale turnover rate for the registered speculative funds exceeded 100 percent in each quar:er and was highest, 277 percent, in the first quarter. For the second and fourth quarters the short sale turnover rates of the hedge funds were approximately equivalent to their long sale turnover rates. On the other hand, the short sale turnover rates for the registered speculative funds far exceeded their long sale turnover rates.
The ratios of short sales to total sales for the hedge funds were 10 times as high as those for the registered speculative funds during the first two quarters of 1968 and ranged during the year from 41.6 percent to 17.5 percent per quarter compared to a range of 2.3 percent to 9.3 percent for the registered speculative funds.148 This is evidence of the significant role that short selling played in the hedge funds' market strategy for 1968 and of the relatively minor importance of short selling to the registered speculative funds as a group.
15. Purchases of New Issues 149
During 1968, 654 stock issues were offered to the general public by issuers registering their securities with the Commission for the first time. Most of these new issues were small offerings by companies with assets of less than $5 million. Gross proceeds realized from these offerings amounted to approximately $1.9 billion.
Of the 43 registered speculative funds, 30 purchased initial offerings rluring 1968. The 30 funds participated in over 200, or about 30 percent, of the initial offerings. Their J.)Urchases of new issues were valued at almost $8 million at ,the initIal offering price, or slightly less than 0.5 percent of the value of all new issues. The $8 million worth of new issues was also equal to 0.06 percent of the 1968 yearend total assets of the 30 registered speculative funds which participated in the new issue market. This 0.06 percent does not differ markedly from the 0.04 percent to 0.05 percent of new issues to yearend total assets acquired by the funds in the 33 advisory complexes described in chapter XIV.
148 It Is also Interesting to note the contrast In the trends of short seiling rates. While the reRglstered Rpeculntlve funds almost doubled their rates of short sales to total sales (from 4.7 percent to 9.R percent) during the final quarter of 1968, the hedge funds cut their rate almost In half (from 30.4 percent to 17.5 percent).
". The definition of new issues differs from the one us~d in Chapter XIV.

300
Of the 134 hedge funds reporting this information, 82 purchased initial offerings of new common stock from registrants during 1968. The 82 hedge funds participated· in 421, or 64 percent, of the number of initial offerings. The value of their purCJhases amounted to $23 million or 1.2 percent of the value of all new offerings in 1968 and represents 0.02 percent of these 82 hedge funds' yearend total assets.
In some instances the combination of the registered speculative funds and the hedge funds received a large portion of a given new issue. Table IV -99 ranks, by descending order of concentration, the percentage participation by the combined group in the 15 most highly concentrated issues. The registered speculative funds and the hedge funds combined received about 9.7 percent of the shares offered in the 15 most concentrated new issues!50 The hedge funds received about 5.8 percent and the registered speculative funds about 3.8 percent 151
of these shares. Stated differently, of the 15 new issues most popular with the hedge funds and registered speculative funds during 1968, the hedge funds received, on 'average, three shares for every two shares the regIstered speculative fWlds received.
The largest percentage participation was 22 percent of one (100,000 share) new issue. In three of the other new issues the registered speculative funds and hedge funds comhined received between 11.9 and 13.1 percent. The largest number of registered speculative funds which purchased a single new issue was four, while as many as 18 hedge funds purchased one of the new issues.
16. Expense and Advisory Ratios
The ratios of operating expenses and of advisory fees to average net assets for the registered speculative funds by size group for their fiscal years ended during 1968 and 1969 are set forth in Table IV-I00. For 1968 the average expense ratio of the registered speculative funds was 1.16 percent of average net assets on a weighted basis. This expense ratio is significantly greater than the weighted expense speculative funds, 0.70 in 1968, was exactly dotuble that of the 101 funds representing 90 percent of the assets of its members in 19.68.152
Similarly, the weighted average advisory fee ratio of the registered speculative funds, 0.70 in 1968, was exaotly double that of the 101 sample.
For fiscal years ended during 1969 the ratio of operating expenses to average net assets of the registered speculative funds declined to 0.94. To a large extent this decline resulted from the decline in the average advisory fees of the registered speculative funds to 0.46. The 1969 advisory fees of the registered speculative funds were much closer to those for the industry sample, 0.39, for the 320 funds shown in Table IV -43. .
u;o These figures are not weighted by value, but refer to numbers of shares purchased only, While the method used could have resulted In a bias In the event a large fraction of a large offerln/( was purchased, In fact no such bias exists. The AVerage percentage of shares acquired, 9.6 percent, In each of the 15 offerings does not differ substantially from the average of 9.7 percent shown In the text.
151 Numbers do not add to total due to rounding. ' 50 1969 Hou8e Hearings 429. But see, ill. 874-877 for the Commission's criticism of these
averages.

301
The differences between the 1969 advisory fees of the registered speculative funds and the industry sample are most likely attributable to the relatively smaller assets size of the registered speculative funds. The higher 1968 advisory fees for the registered speculative funds relative to fiscal years ended during 1969 and also relative to the industry sample of other funds for 1968 is traceable to the large prop 01'
tiOll of performance fees among the registered speculative funds. Of the 35 registered speculative funds included in Table IV-100,
51 percent paid performance fees while only 17 percent of the funds in the industry sample 153 reported performance fees for 1969. Such performance fees decreased substantially from 1968 to 1969. In 1968 the average advisory fee for the registered speculative funds which paid performance fees was 0.73 percent of average net assets (weighted) ; in 1969 this figure declined to 0.35 percent. In contrast, the average advisory fee (weighted) for the registered speculative funds wIuch paid their advisers on .a straight percentage of assets basis remained relatively constant, moving from 0.59 in 1968 to 0.61 in 1969.154
After deducting advisory fees from the expense ratios, the other expenses of the regIstered speculative funds are nevertheless considerably higher than those of the industry sample. On a weighted basis the other expenses in 1968 were 0.46 for the registered speculative funds (1.16 less 0.70) and 0.11 for industry sample. An examination of the income and expense statemen~s of the registered speculative funds indicated that the higher ratio of their other expenses to average net assets was largely traceable to a combination of disproportionately higher legal and accounting fees (six funds), interest expenses (five funds), and bookkeeping and clerical expenses (two funds).
The expense ratios of the hedge funds were not reported on the same basis as the registered funds. Their advisory compensation can best be presented on a descriptive rather than a statistical basis.155 The general partners are commonly the managers of the partnership portfolios. Of the 28 largest hedge funds, 23 compensated their managers on the basis of a percentage of the fund's realized capital gains. Of these funds, 19 utilized the figure 20 percent of net realized capital gains, operating profit, or income.156 Only two partnerships based their
11,3 Table IV-45. . 154 On an unwellthted basis a similar picture emerged. The ml'an advisory fee for the
reglsterl'd speculative funds which paid performance fees was 1.22 percent of average net assets In 1968 and 0.52 percent In 1969. For the registered speculative funds which paid their advisors on a straight percentage of asspts basis the m~an advisory fee declined from 0.58 pprcent of average net assets in 1968 to 0.49 percent In H169.
1M The partnershlll agreements generally provided for adjustments to the capital accounts of the general partners dl'pendlng upon performance of the fund. "Compensation" may carry thp unwanted connotation that gpneral partners are akin to salaried employees of the fund. If payments to a gener"1 partnpr "for sprvicps" Wl're not hasl'd upon the level of partnl'rshlp Income. then under Section 707 (c) of the Internal Revenue Code, such payments would be ordinary Income to the general partner. Convprsely, where a payment is based on partnprship income. It Is taxed at canltal gains rates to the extent that the sum was d~rlvpd from thl' partnprshlps' sale of capital assets.
106 In addition. five of these 19 funds expressly stated that the gl'neral partners also share In the remaining 80% of gains pro rata according to their invested capital.
There were some yarlations in this fee arrangement by those fund~ which compensated thl'ir partners on a percentage of capital gains basis. Four funds expressly stated that genl'ral partners were compensated on a percentnge of both realized and unrealized capitals gainR. Another of thp fundA permitted a mnnng-ement f!'e to Its g-enPral partuer only if, after past losses were repaid to all partners, the fund's capital earned more than 6%.

302
general partners' compensation on a percentage of the funds' net asset value. Two other funds compensated their managers on the basis of salary plus bonus. One fund compensated its managers on a straight salary basis.
17. Postscript
A survey of the 28 largest hedge funds, as of September 30, 1970, and of the 43 registered speculative funds as of June 30, 1970, found them significantly smaller. The assets of the hedge funds were 70 percent less than they were on December 31, 1968 and the number of their limited partners had declined by one-third. Some of these hedge funds had distributed portions of their assets, at least five, including the hedge fund which was previously the largest/57 had either dissolved or were in the process of liquidating. Table IV-101 indicates the total assets of the 28 largest hedge funds as of December 31, 1968, and their total assets as of ~eptember 30,. 1970, and shows the percentage decrease or increase (one fund) in the total assets of each fund over the period. It also sets forth the numbers of their general or limited partners on both dates.
The net assets of the 43 registered speculative funds on December 30, 1968 and June 30, 1970, are set forth in Table IV-102. The net assets of these registered speculative funds on June 30, 1970, were about 60 percent of their net assets on December 31, 1968. Only four of the 43 registered speculative funds showed an increase in assets during the one and one-half year period. The five largest registered speculative funds which had combined net assets of $862.6 million at December 31,1968, had net assets of $532.7 million at June 30,1970.
The decrease in the size of the registered speculative funds and hedge funds may be explained to an extent by dissolution, distributions and withdrawals. However, it may also be explained by different amounts of borrowings at the hedge funds and by decreases in general market values of securities during the period and the higher volatility of the registered speculative funds' and hedge funds' portfolios relative to the market. Regardless of the reasons, these funds had become substantially smaller.15S
ll17 A liquidating distribution of approximately $98 million, representing approximately 95% of the fund's capital was distributed to the partners In early January, 1970.
'68 For a discussion of measures of volatility see sec. F.4 and the appendix to See. F.

TABLE IV-81 Dis_tJ;:~bJl_tJ_QIl_ :~}~ _:rotai Assets Among Hedge Funds
and Registered Speculative Funds Surveyed as of D~cember __ 31, 1968
Hedge Funds 1 / Registered S~eculative Funds Agsresate Assets Aggregate Assets
Asset Size %--or-- Total _% c:>L % of Total % of (million) Number Total - $<0-00) Total Number Total $ (000) Total
Less than $1 49 35 18,873 1.5 2 5 714 0.0
$1 to $4.9 50 36 123,550 9.5 13 30 32,666 1.9 CIj 0
$5 to $9.9 l3 9 90,052 7.0 2 5 18,354 1.0 CIj
$10 to $24.9 15 11 244,550 18.9 11 26 188,925 11.3
$25 to $99 10 7. 418~~7_~ ___ 37.0 10 23 493,633 29.4
$100 and over 3 2, 338 ,~~_9~_ 26.1 5 11 944,499 56.3
140 100 $1, 293 ;~~4:-~_ 100.0 43 100 $1,678,791 100.0
J/ Includes fiscal year rather than calendar year data for ~i:hree --funos.

TABLE IV-82 Classification of Registered Speculative Funds and
Hedge Funds by Asset S1ze, and Year of Formatioh or- Kegi"st'rat1.bn -uiioer the Invest~ent Company Act of- 1940
Total Assets As Of December 31, 1968
(million)
Less than $1
$1 to $4.9
$5 to $9.9
$10 to $24.9
$25 to $99.9
$100 and over
Before 1964
~ ]
0 3
7 8
1* 0
4* 0
2 0
3 3
7 14
1964 ~
0
1*
0
0
0
0
1
R Registered Speculative Funds H Hedge Funds
]
0
1
1
2
1
0
5
Year of Registration or Formation
1965 1966 1967 ~ ] ~ ] ~
0 0 0 2 1
0 2 2 1 2
0 0 0 3 0
0 0 3* 1 2
1 3 2 4 2
0 0 1 0 1
1 5 8 11 8 - - - . - --
* Includes one registered fund which switched to a speculative investment policy during 1967 or 1968.
] I ~
8 1
8 1
2 1
7 2
2 3
0 0
27 8
1968 TOTAL ] ~ ]
36 2 49
30 13 50
7 2 13 ~ ~
5 11 15
0 10 10
0 5 3
78 43 140

305
TABLE lV-83
Numbers of Shareholder Accounts Among 40 Registered Speculative Funds by Size of Fund
at December 31, 1968
Number of Shareholder Accounts Total RegJstered
Total Assets _. - less than 1,000- 5,000- 10,9.90.:.. 25,000- ~S'pec~Cl!..tT'1L~ p (mUlion) 1,000 4,999 9,999 ~ and over Funds
less than $1 2 0 0 0 0 2
$1 to $4.9 : 7.' 4 0 0 .0 __ 11
$5 to $9.9 0 2 0 0 0 2
$10 to $24.9 _0 .. . .7 __ ..1. 0 0 10
$25 to $99.9 0 -_.2. 5 3 0 10_
$100 and over 0 0 0 4 5
9 .l~ 18 4 4 40

306
TABLE IV-84
Distribution of Limited Partners of Hedge Funds By Asset Size as of December 31, 1968.L1
Number of Limited Partners Asset Size less than - (m:£rlioi1) - ~ 15 15-29 30-49 50-74 75-99 All Funds
(number of funds) Under 1.0 31 4 3 0 39
1.0 to 4.9 19 19 5 4 48
5.0 to 9.9 3 6 4 0 0 13
10.0 to 24.9 6 6 0 14
25.0 to 99.9 0 0 :r- 6 10
100 and over 0 0 0 2 3
Total 54 35 :a- 13 4 12~
11 Includes only those hedge funds with two Or more limited partners.

307
TABLE IV-8s
Minimum Initial Investments Required of Limited Partners ,For 71 Hedge "Funds ByeAs·s-et -Stz;;--_
as of December 31, 1968
Minimum Ini t'tal All Hedge Funds Investment - Asset Size (~millions) Reporting Minimum
(~) Under 1.0 1.0 - 4.9 5.0 and over Investments
(number of funds)
5,000 or less 11 3 14
10,000 - 20,000 4 2 6
25,000 - 40,000 3 2 5
50,000 3 5 8
100,000 - 125,000 10 8 18
150,000 - 200,000 6 7
250,000 7 7
300,000
500,000 5 5
Total 21 23 27 71
1/ No instances were found other than within the classes indicated.

308
TABLE IV-66
YEAR OF fORMATION. ASSETS, NUMBER OF PARTNERS AND CAPITAl. CONTRIBUTIONS
Naill"
"' Partl'Ulrlhlp
A
6
M
o
Q
T
v
x
AA
BB
Year
"' ~
1')56
1961
1949
1964
1'l05
1965
1966
1967
1966
1967
1966
1966
1965
1'167
1968
1968
1967
1967
1968
1967
1968
1966
1964
1964
1967
Iqb7
1967
1968
OF 28 LARCEST INVESlMENT PARTNERSHIPS
Total A"eli No. of Partners
12111/66 On 12131/66
~ill ~ ~
UB) 85
1136 55
106.6 70
89' 17
751 73
6),1 " 50.5 32
47.3 47
37,4 50
33.S
29.4 50
26.7 67
26,0 " 239 " 19.8 J4
19.4 ]I
19.0
18.9
18.2 24
17.4 43
14.8 25
14.7 36
14.5 36
13.3 36
13.2 20
130
12.5 27
12.1 26
AveraSIl Clio". Con~rlb1.1liQI'I
by Partners at Tict! of FOl'1lll<!ltlon
Cenenat UmUed
--ill- -"-'-
JOO 15,000
119,000 145,000
20,000 ~I
112,000 101,000
303,000 158,000
371,000 208,000
100,000
213,000 153,000
112,000 106,000
47,000 )66,000
284,000 It.2,OOO
2,000 1,000
238,000
46.000 74,000
425,000 280,000
100,000 318,000
246,000 )81,000
1,000,000 800,000
50,000- 141,000
IOU ,000. 63,000
250,000 342,000
34,000 63,000
25,000 33,000
60,000 36,000
102,000 3)0,000
1,(l27,000 l'
3b,OOO 212,000
10,000 317,000
11 'oIhere no figure Is Iho'olrl, eitheT the PllTtl'lershlp h",s no lalnllllUlll capital requirement or It h",s not ",dtolttpd neW p",rtners. Evld"ntly.l:"eau6e of the "'ppreclatlon In the value of the fund'6 net allsets, sOllIe funds now requore " larger IIIlnllllulII capil",1 contribution tban they did at thlll tlllle of their inception
1:.' Reported that tht!yhad no IIl11lted partners at the time nf theH form .... tlon.
MlnlcuCl Capll .... 1 Contribution
for New Limited Partners !'
{$I
500,000
300,000
250,000
200,000
500,000
200,000
200,000
250,000
500,000
100,000
500,000
250,000
250,000
200,000

11 TABLE IV-87 NET CASH INFLOWS OF THE REGISTERED SPECULATIVE FUNDS DURING 1968
Net Assets December 31, 1967
Net Assets December 31, 1968
Capital Received in 1968 Initial Offerings
1968 Net Cash Inflows
Total New Capital Recei ved 1968
35 Funds in Operation Throughout 1968
$(000)
511 ,853
1,233,916
538,513
538,513
11 Estimated on a monthly basis by following formula:
8 Funds Which Began Operation During 1968
$(000)
265,351
194,757
38,857
233,614
Total 43 Registered Speculative Funds
$(000)
511,853
1,499,267
194,757
57 7,370
772,127
Net Inflow for Month: S.number of shares outstanding at l end of month
- number of shares outstandini/. at beginning of month -5. times
(average net asset value per share in the month) minus (distributions paid during the month)
C/o:) o CO

310
TABLE lV-88
Monthly~Net Cash Inflow For 35 Registered Speculative Funds in Operat!.~n Throughout 1968
Net Cash Inflow as % of Net Cash Inflow as
Net Assets ($000) Assets at % of ASBeLS
At Beginning Net Cash Beginning of at Beginning of Month Inflow Month of Year
January 511,853 $43,666 8.5?: 8.5?:
February 501,896 33,2t!4 I 6.6 6.5
t-tarch 515,856 31,524 6.1 6.2
April 548,523 64,262 11.7 12.6
May 692,085 47,U14 6.8 <t.2
June 790 ,033 42,792 5.4 8.3
July 827,071 42,340 5.1 8.3
August 842,258 4.5.611 5.4 8.9
September 922,050 56,105 6.1 1l.0
October 1,052,900 39,540 3.8 7.7
November 1,087,785 52,093 4.8 10.2
December 1,229,611 40,2a2 .2.:1.. L..L
Monthly Average $ 793,493 $44,d76 5.n 8.8%
Total Net CAsh loflow $53R, 513.
Total Net Cash Inflow as Percentage of Assets at Beginning of Year 105.2%.

311
TABLE IV-89
Net Cash Inflow by Performance Ranking f9r 35 ~egistered Seeculative _Funds in Operation
Throughout 1968
Year-End Relative Unadjust-ed ',Performance Ranking ~£ the 3~ Ne~'Assets Net Inflow as Registered Si'ecu~ati-ve As of a Percentage of Net Assets Funds Operating December 31, 1967 Net _Inflow on December 31, 196~r ~'hrougho\1~ 1'168 (000) (000)
top 5 3,217 $148,166 4605.7'
second 5 293,787 263,530 89.7
third 5 39,704 5,114 12.9
fourth 5 45,420 20,407 44.9
fifth 5 84,951 58,622 69.0
sixth 5 34,889 41,434 118.8
seventh 5 9,885 -~~ _!.hL-
'511 ,853 538,513 105.2

312
TABLE IV-90 NET ADDITIONAL CAPItAL INFLOW OF
28 LARGEST INVESTMENT PARTNERSHIPS
Percentage Total Assets Additional
Total Net Additional (Millions) Inflow to Assets Hedge Year of Capital Inf10w* (Millions) As of As of Fund Formation 1966 1967 1968 Dec. 31, 1968 Dec. 31, 1968
A 1964 $ 5.4 $ 9.5 $ (8.5) $ 89.6 (9.5) % B 1965 10.1 8.6 8.0 63.1 12.7 C 1967 4.4 5.0 47.3 10.6 D 1967 13.3 20.3 33.5 70.2 E 1966 5.1 7.5 .5 29.4 1.7 F 1966 4.4 16.5 26.7 '/i1.8 G 1967 2.6 4.3 23.9 18.0 H 1968 7.0 19.8 35.4 I 1967 1.8 19.0 9.5 J 1968 5.8 18.2 31.9 K 1967 17.4 L 1968 4.4 14.8 29.7 M 1967 .• 9 5.1 13.2 38.6 N 1968 8.3 12.1 68.6 0 1956 1.6 1.1 (7.1) 118.3 (6.0) P 1961 (3.7) (7.7) 113.6 Q 1949 (1.6) (5.8) 106.6 R 1965 6.1 (1.0) 13.7 75.1 18.2 S 1966 1.0 10.0 13.6 50.5 26.9 T 1966 37.4 U 1965 3.4 12.0 (7.5) 26.0 (28.9) V 1968 9.7 19.4 50.0 W 1967 8.9 3.0 18.9 15.9 X 1966 .6 4.6 (.3) 14.7 (.2) y 1964 1.8 1.2 3.0 14.5 20.7 Z 1964 .7 4.4 2.5 13.3 18.8 Ai. 1967 4.6 13.0 35.4 BB' 1967 (.3) 12.5 (2.4)
Total $ 30.5 $ 78.9 $113.4 $1,061.8 10.7 % Average $ 2.5 $ 4.4 $ 4.7 $ 37.5
* Cash, securities and reinvestment of dividends & capital gains. Notes: (1) Blanks indicate incomplete information.
(2) Figures in parentheses indicate capital outflow exceeded inflow.

313
TABLE IV-9l Percentage Asset Comparison
as of December 31, 1968 R!'.si_s):,e.r::~~ __ ~eculative Funds Hedge Funds
ASSETS
Cash 8.8
Receivable Securities Sold 2.9
Common Stocks 74.3
Convertible Pre- al ferred 5.4-
Non-Convertible al Preferred 1.6-
Corporate Bonds * Warrants 2.1
Other Securities .0
Other Assets 4.9
Total Assets 100.0 Net Assets 89.2 Liabilities 10.8
Number of Respondents 43 Total Assets $<000,000) - '1,679
~I Includes debt securities
,21 Includes non-convertible preferred stock.
9.5
7.9
61. 2
al 6.7-
al 2.0-
* 4.2
4.8
3.6
100.0 70.5 29.5
129 '1,245
ICI Members s.I
6.1
,21 3.2
6.5
52,677
* Included in entries for: convertible preferred and non-convertible preferred • . ,
£1 ICI members reported only cash, common stock, preferred stock, corporate bonds, Bnd total net assets.
53-940 0 - 71 - pt. 2 -- 13

TABLE IV-92 Total Assets and ·---C·ash ,Posltlon of Reglstered Speculative Funds,
Hedge Funds ;nd --icY Members Classlfied by Fund Asset Size 11
1968
Classihed by Asset No. Total 2/ Per-3 No. T~::~~ JV 2/ Per-3 No. Total 21 Per-3 No. Total 2/ Per-31 S,ze ($ mlllio~) Funds Assets Ca;h cent- Funds Assets Ca;h cent- Funds Assets Ca;h cent- Funds Assets Ca;h Cent-
March 31 June 30 Sentember 30 O=cember 31
Registered Funds 35 ~ 591 $119 19.8 36 $ 1 024 $85 8.3 38 Sl 289 S128 9.9 41 S 1 653 5;140 8.5
Less than 2.5 14 12 1 11.5 11 10 1 6:3 11 12 1 7.1 9 11 1 9.4 2.5-9.9 7 39 9 22.9 5 24 4 16.8 6 30 5 17.3 8 40 6 15.2 10.0-24.9 8 119 22 18.5 10 150 14 9.2* 8 139 12 8.8 9 163 7 4.3 25.0-49.9 4 136 15 11.1 66 224 8 3.5 6 219 11 5.1 6 242 15 6.3 50-0-99.9 0 --- --- 2 172 20 11.7 5 368 75 20.4* 4 252 15 5.9 100.0 and over 2 285 70 24.4 2 444 39 8.7 2 520 24 4.6 5 944 96 10.1*
Hed~e Funds 42 $695 $106 15.3 55 $860 $67 7.8 67 $993 $t09 11.0 74 $1 007 $ 85 8.4
Less than ',1.0 8 3 6.2 12 5 1 14.4 15 6 1 10.2 18 7 1 9.8 1.0-4.9 10 24 5 19.9 15 41 9 21. 7 18 42 4 10.0 23 55 4 8.1 5.0-9.9 7 47 5 10.1 8 59 4 6.2 10 69 8 12.0 10 69 4 6.3 10.0-24.9 9 137 25 18.1 10 156 10 6.5 14 222 25 11.1 13 208 20 9.7 25.0 and over 8 484 72 14.8 10 599 44 7.3 10 655 71 10.9 10 668 55 8.2
All SDeculatlve Funds 77 $1286 $223 17.3 91 $1884Sl52 8.1 105 $2282 S237 10.4 115 S2 669 S225 8.5
All Members of the ICI S+2,412 $3.919 9.2 $48 426$3 272 6.8 $51030 S3 747 7.3 $52 677S3 187 6.1
* Includes one fund which experienced huge cash inflow. 11 Quarterly comparability, ~.e., each member of the population reported for the four consecutive months concerned. 11 Includes U. S. Governments and short-term corporates. 11 Cash as a percent of total assets computed before the amounts were rounded to mill,ons of dollars.
w '",...
~

315
TABLE IV-93
Liabilities of Registered Speculative Funds and Hedge Funds
as of December 31, 1968 (stated as a percentage of ~otal assets)
Liabilities
Short posi tions
Loans payable to Broker-Dealer (margin)
Other loans payable to Broker-Dealer
Loans payable to Bank (secured under Regulation U)
Loans payable to Banks (good faith)
Loans payable to Banks (unsecured)
Loans due to others (secured)
Loans due to others (unsecured)
Other Liabilities
Payable for Securities Purchased
Total Liabilities
Number of Funds
Registered Speculative Funds
0.8
none
0.8
0.8
none
0.8
0.0
0.0
1.3
6.3
10.8
43
Hedge Funds
11.6
4.5
none
0.3
9.8
0.0
none
0.0
1.0
4.5
31.7
74

Name of Partnership
A II C D
E F G H
I J K L
~~I 0 p-
~ S T
U V w X
Y Z M BB
316
TABLE IV-94 Use of Speculative Investment Techniques
By 28 Largest Hedge Funds During the Year 1968
Maximum Mo)nth-End Maximum Month- End Borrowings Short Posltion as As '1. of Total AS'H!tS' '1. of LonS Positlon 11 ~ From Broker-Dealers
30 1 396 54 6 4.2 12 4 23 8 8 3 7.6 5.5 o 8
72.1 11.9 13 6 84 4 17 1
117.1 14 5 9.6 54 8 226 152
79 1 121 10.9 49.2 197 97.3 13.1 3.1 14.7 15 0 31.7
38.4 2.0 3.9
40,0 15 4 20 1 67.4 17 4 6.6
70 5 17.2 10 8 94.1 14 7 13 3 41.6 9 6 54.7 20 2 33 8
15 6 67,3 18.2 32 3
-- 1I 22.7 10.9
27.4 29.1 6.0
23.6 21.5 13 2 30.1 19.3 38 2
127 9 4.8 24.2 35.5 19.2 18.3
Value of Put and CAll Options Held as 7. of
11 Common Stock HoldinB~ ,}..1
0.6 12
':.1 1 211
-- ':J 4 9
20.6 11 4 5
o 4
o 8 16
0.1 11 0.1
1 6 l.l o 2
1.6 11 2.5
1/ Based on dollar value. Different months are included for different f ::i 2/ Margi n acc0.vnts. un s. JJ HaxLmum value of optlons held at the end of any calendar quarter compared wlth common ~tnck hllldingc; nt
tht> fOnd of the same quarter. Value of options based on premium paId. '=.1 Less than 0 05 percent. 51 Partnership also wrote opt Ions during the year 61 Partnership was formed In Nuvc'llber 1968. 11 Long pO!.ltlon not avallublu for month of maXimum short POSition.

317
TABLE IV-9S REGISTERED SPECULATIVE FUNDS WHICH INDICATt.D THEY COULD ENGAGE IN rNVESlMENT ACTIVItiES INVOLVING SPECIAL RlSKS
Total b;sets Borrow Purchas Dec. 31 t 1968 from Securities
Short_ Write Buy &. Sell
($000,000) ~ l-ll\~Bin
~!lc.!ll Leon B. Flmd..1 Inc.+-;;--. __ -! "..J~ __ X B.r'[§..El'!i!,-~Il\CllUl{ty SP!,cillt rund • _ _ !ttL-._ IH,!!ir Fund~. (The) ._ 10,3 __ X fh[,.5C Frontier Fun~ Inc. .59.2 X
y
()i'.c;':l)~d Fund. Inc -.---"-i---P ..... , l\ l'"uruL-lnc , .!:r.:'!1~1 lties Fund 13.6 Frtiriir.l Inc. 103.3 'F"f r<:!-. Nutu nd of Rho£lc Island i 1.6 G~hrl'!.ltl:r Grouth Fund. Inc. (The) I 580 2~}'!-~i~~2Q!!!!1(!1 Fund. Inc, I 1 4 1l.1novcr Fund (The) 3 1
Sell Short
X
1/ term 2 Put & Put & Call Hedge - Trading - Call Options of
X
~~
-"-
• • y
-~-X y
v X X --'---X X -~ X
[n~~~ll &. CaMpbell Fund, Inc. _-;;4",3."S'--+--;;_-t ____ t-ll,,!t\'cll t. COlupbell Leverage Fund • ..l.!!s.---cc,7",2~.,6;-+-;;;-_I_-+' __ I-~_+-j:-_t---;;_+ __ -t
!!~f,c Fund of Amcr':£!L,~ ====:r=~li015"-.~3~=~t=1~==1~=~~=E!=Ej2~~1=1==E=~==j !:~;:J.tn\ c Fund. Inc •. .rrhe) 3.3 X IluLshml1n Fund. Inc, 13.B Impet'lnl C ... !2!~.h~.'}d Inc. IB.O X X Ind!lstr1~s Exchange Fund. Ine. 19.0 X Investmentl Indicators Fund 4.9 Inve<.:tors Reseilich Fund. Inc. B.B Josten G.r0uth Fund. Inc. 1.6 Lin£! Fund. inc. 9.5 y
Mnte,> inV(!<;tlnent Fund Inc 22 5 Nness Eo Thomns Special Fund Inc. 24.5 Neuwirth Fund Inc. 101.9 Northeast Investors Trust 37.2 ~us_l-'und 3.0 0 1 Neil Fund 62.1 X
X A -j A A
X
2.lw.£!lheimer Fund. Inc. 278.3 Pennsylvl'lnto l-Iutual Func!, Inc. 19.0 Pilot Fund. Inc. 47.4
X 'r X
RepubliC Technology Fund. Inc. 39.8 Revere Fund Inc. 22 Samson Fund. Inc. 1 6 SC'curitie$ FU'~fl. Inc. -.llIE£!?!lrr....1-_.9Q."£~!<!.!:l~!LJn,"-c'-'. )c-_-+_.ll.L-~ _~ ,§..h-.!J.L!!£.9r.2 ... Lllnd,_lnc. 1 X. ----I-.l:---I'2<-j-x'-- --X--
fuD;;;';:trti~'~~~d Inc. ~::_9 ~ - -::~~-=f--x _JI~=~- __ -~_rl:~~ --__ -:-_-_-_I,I_~ __ - ~ __ ~I __ -_X=_ ~~ I2..vs.r ... !:\u}d-L lnc. ('(he) 12.3 x _ _ _. _~
Vclille Line Spcda 1 Situations I I f ___ ~"_n.d~~,.J:!h.) 355.7 1<- --v_ -- '--X--- -X--- ------ ---- -------l:!!!-t'pj"',Sj'l!'·.ns:~,M. Fund (The) 1.1 ~ .. " -- -- ____ 1 ____ .. _____ . ___ _
!i9.ll.h..f.!I!:1.!!.~~' ,,:~IQ ~:.- .. S --- .-;;~ .. I---l~---I- 11---t-6-1---;2--~- • - _0 ___ L_____ _ _ __ '--__J
Jj The use of investment techniques, most commonly selhng shJrt, to protect the value of a portfoho in the event of a general dechne in securit1es prices.
,£1 The purchase and sale of 8 security w1thin a six month period.

318
TABLE IV-96
Registered Speculative Investment Companies Net Amount Payable Quarterly for Securities Purchased
$(000,000)
3-31-68 ~-30-68 9-31-68 12-31-68 Receivable for Securities
Sold 18 21 35 48
Payable for Securities Purchased ~ .2L 91 ~
Balance Payable for Securities Purchased 5 38 56 57
Net Assets 370 6413 911 1109
Balance as a Percentage of Net Assets 1.4% 5.9% 6.1% 5.1%
Number of FUld" Reporting 20 23 26 28

,
319
TABLE IV-97
Composition of Portfolios Registe~~d_Speculative Funds and 27 Hedge Funds
of 43 by Market Listing as of December 31, 1968
Common Stocks
Registered Funds El<change Percentage
Hedge
Listing 2(000,000) of Total $(000,000) -NYSE 656 49.4 302
Amel< 265 20.0 159
Regional El<change 13 1.0· 2
OTe 384 28.9 171
Not Publicly Traded 9 .7 13
TOTAL $1327 100.0 $6~
Convertible SecuritIes
NYSE 28 30.7 21
Amel< 30 33.0 24
Regional Exchanges
OTC 23 25.3 17
Not Publicly Traded 10 11.0 17
TOTAL $9l 100.0 ~
Funds Percentage of Total
46.7
24.6
.3
26.4
2.0
100.0
26.8
29.9
21. 6
21. 7
100.0

TABLE IV-98 Common Stock Turnover and Activity Rates for Registered Speculative
Funds. Hedge Fur.ds and leI Me,mbers 11
(1968 Quarterly and Annual Rates)
Reg~stered Speculati ve Funds IJeGge Funds Jan. - AprIl- July- Oct. - Jan.- Apn.l- July- Oct. -
Com.-non Stock Retlos March ~ ~. De~_. ~ V-arch ~ Sept. Dec. Year
(percentage) h0.E.&
Purchdses/Sales 107.2 190.0 129.8 170.9 139.6 107.5 126.2 91. 9 115.3 110.7 Turnover Rate 2/ 33.6 39.4 35.8 25.6 143.2 97.7 90.8 67. " 63.6 316.7 Actl.vl.ty Rate ~/ 34.8 52.2 41. 3 34.7 171. 5 101.4 102.8 70.5 68 5 333.3
leI jI.:cmbers
Turnover Rate 9.3 11.8 11. 3 12.8 44.7 Actl.vuy Rate 9.7 13.1 11. 4 13.9 46.6
Short Sales/Tolal Sales 4.1 2.3 4.7 9.3 4.5 41. 6 25.2 30.4 17.5 29.6 Turnover Rate 4/ 277 .5 148.8 106.3 185.0 712.3 133.8 92.0 104.1 63.0 458.1 ActlVlty Rate 11 346.5 186.1 153.0 187.2 747.2 150.4 119.6 111. 9 76.8 474.1
Common Stock Transactions (colla:-s in ffil1lions) <dollars 1n milhons) SU:ll of SUI:! of
~ Qcarters Quar~crE.. Purchases 149 477 397 485 1508 401 554 376 451 1,772 Sales D2. 251 306 284 1080 373 431 409 391. 1.604 Net 10 226 9t 20T 528 28 113 (3) 60 i68 Long POSl.tlon 390 784 940 1; 232 3,346 325 549 594 637 2,105
Short Sales 4 9 8 30 51 266 145 179 83 673 Purchases to Cover -..L 6 15 29 ~ 213. 232 156 119 723 Net Short ill -7- (IT 5 53 (87) 23 (36) {47) Short Pos1t1on 4 11 12 29 184 134 162 117 597
NYSE Cornpos1te Index C7 .0) 12.0 2.9 2.1 C7 .0) 12.0 2.9 2.1
Number of Funds 35 36 38 t,: 42 55 67 74
1../ Quartt!r 1)' comparabl1::. ty, 1. e. each r.'lember of the population repoi';:ed for thc; fOJi:" consccu~ 1 Vo; ;no:;.t:~s concer.h"c. £l I Esser of purchases or sales ciivl.ded by the averaga r"arket value of the r..::sp2c~lV~ co;n.-r.on 3::0CK P03::..tHln du .... l:16, ;:he
per-lad. 31 Average of purchases plus sales divided by th-;. same base as in footnoteS (2) and (4) !t Lesser of purchases or sales diVided by the average dollar amount of the short pOSition.
C>j t-:) 0

~
A B C D F G H 1 J K L M N 0 p
TABLE IV-99
ALLOCATION OF 15 UnTIAL STOCK OFFERING TO REGISTERED SPECULATIVE FUNDS AND HEDGE FUNDS IN 1968
(R8nk~.k..12ta1 Percenta.:;e of Participation by B'lth Groups_C!.f Funds Combined>
Total TOT A L Shares : Sh8.res Bought p;;Cent of Number of Shares
Off~~ By Funds Fund Participation Funds Buy!!!g Bought
100,000 22,000 22.0 1 137,500 18,000 13.1 10 ~ 10.300 700,000 91,1)00 13.0 6 90,8-?O 345,000 41.050 11.9 S 25,550 200,000 18,300 9.2 10 16,400 225,000 19,320 B.6 10 --9,820 562,500 43,050 B.6 7 .11,700 400,000 31,600 7.9 4 2,000 100 ,(X)() 7,700 7.7 6 7,100 220,000 16,600 7.6 9 4.860 150,000 11,200 7.5 4 5,200 257,142 19,015 7.4 21 13,790 100,003 6,750 6.B 3 6,750 296,000 20,100 6.B 2 20;100 100,000 ~ 6.2 2._ ~
3,893,142 376,885 avg. 9.6 103 227.220
HEDGE FUNDS Pe~-
Participation
7.5 13.0: -7.4 : 8,2, 4.4. 2.1 0.5 7.7 2.2 3.5 • 5.4 6.8. 6.B
~
avg. 5.2
The fercentage of combined regl.stered speculative fund and hedge fund participation wa'i 9.71 of the n.lJIlber of shdr offered. The Percentage of hedge fund participation was 5.8 7. of the number of shares offered. The Percentage of registered speculative funj participation was 3.81 of the number of shares offered.
o
'~EGiSTERED SPECULATIVE FUNDS NumOler 0: Shares Percent of Number of Funds 8UYin~ Bought Participation !!!.nds Buying
I 22,000 22.0
I 7.700 5.6
I 15,500 4.5 2 1,900 1.0 2
I 9,500 4.2 4 Cr.:l 36,350 6.5 ~ I 29,600 7.4 -I
11,800 5.4 6,000 4.0
1B 5,225 2.0 3 2 _,_ 4,000 _ ~:.<L ...L
7B 149,575 avg. 4.4 25

.-IV-2S5
TABLE IV-lOO Registered SQ.eculatLve Funds
OperatLng- Expenses and Adv1sory Fees as A Percentage of Av~t:~ge Net Assets
'for Fis_co¥ ~el~'f~6~ded During For Fl.scal Y~ars l:.:ldcd DUrl.ug
1969
Operating Expenses Advisory Fees I Operating Exp~nses Adv1sory Fees
NET ASSETS ,I ($000,000)
1100.0 and over 'i 150.0 - 99.9 !I r'O - 49.9
j 10.0 24.9
11 2.5 9.9
less than 2.5
Total
ICI Members11
87 Funds W1th June 30, 1968 Net Assets of $100 M1lllon and Over 11
320 Investment , Compan1es AdI vised by 86 ~ Advisory Fums ~ I
-'-'0. of Funds
II 8-
II
3J:-1
e1gntea unwe1gntea Average Average
0.95 0.94
1.47 1.47
1.02 1.03
1. 39 1.26
3.39 3.21
2.20 3.48
1.16 2.26
0.46
0.61
e,s e unw~ Average Average
0.71 0.70
0.67 0.67
~lo'._Of ~ __ Weighted Funds Average
I 2 - i 0.74
4 I 0.92
0.61 0.64 7!1 0.79
0.76 0.67 8 1.85
1.21 1. 22 6 1.59
0.75 1.20 ~
8 1.49
0.70 0.94 I
35Y i 0.94
0.35
0.47
I "-- -- --L __
11 Includes one fund which reported operating expenses but which d1d not report advisory fees.
Unweighted I Weighted I Aver~e : Average
0.73 0_52 :
1.02 0.43
0.80 0.43
1. 77 0_39
1.59 0.65
2_24 0.59
i 1.51 0.46 ;
I II
0.39 I
Q
11 As reported by the leI 1n Hearings Before the Subcommittee on Commerce and Finance of the House Committee on Interstate and ForeIgn Commerce, 91st Cong., 1st Sess., Ser. No. 91-33, pt I, at 429 (1969). but see.1d. opt. 2--aC 874-8 SO.
11 For flsca1 years _e~d~d July I, i967 to June 30, 1968,reported in 1969House HearI"'nSS'1itte.d in footnote 2 al:inw'.At" R""70_IH30
~I Source: Forms N-lR flled for fiscal years ended during 1968 and 1969, except as otherwise indicated. •
Unweighted Average
0.45
043
0.43
0.39
0.63
0.69
0.50
0_45
!I If
1 I
II I
I I
I I I
II ;1
~ I:>:) I:>:)

323
TABLE IV-101 TOTAL ASS)ITS AND NUMBER OF PARTNERS OF 28 LARGEST HEDGE fUNllS
AT DECEMBER 31, 1968 AND SEPTEMBER 30, 19/0
Hedge Funds' Assets and Partners y
T,otal Assets Total Assets General Limited As of As of Partners Partners
Dec. 31, 1968 Sept. 30, 1970 PcrCt'ntage Dec. 31 Sept. 30 Dec. 31 Sept. 30
A?J qmil~ ($m~ (~gaz:r lQ.1 1968 1970 1968 1970
- 1"&73 --5-.7, - - .'-,-- 1"'-- liS-- -8)""""
B 113.6 12.5 (89.0) 8 7 55 30 C 106.6 18.2 (82.9) 8 7 70 46 D 89.6 20.0 (77 . 7) 5 3 77 39 E 75.1 15.0 (80.0) 3 4 73 73 F 63.1 27.6 (56.3) 5 5. 69 50 G 50.5 23.0 (5/ •• 5) I, 3 32 27 H 47.3 49.7 5.1 3 3 47 50 I 37.4 12.5 (66.6) 4 4 50 -41 J 33.5 33.1 (1.2) 3 3 46 50 K 29.4 8.0 (72 .8) 2 3 50 35 Ll! 26.7 (100.0) 1 67 M 26.0 5.9 (77.3) 3 3 1.1 22 NY 23.9 (100.0) 3 62 0 19.8 5.3 (73.2) 3 4 34 36 P 5/ 19.4 6.7 (66.5) 2 0:-''/ 31 12 'j/ Q 19.0 12.1 Y (36.3) 3 3- 27 26 R 18.9 11.7 (38.1) 1 1 11 17 S 18.2 6.5 , (64.3 ) 1 1 24 26 T 17.1. 1.0 (94.3) 1 1 43 12 U 14.8 10.5 (29.1) 2 2 25 22 V 14.7 1. 0-7./ (93.2) 4 3 36 21 8/ W 14.5 1.9 (86.9) 5 36 18-x§.1 13.3 1.7 (87.2) 2 36 22 §.I y§J 13.2 11.3 (14.1. ) 2 2 20 18 Z 13.0 7.8 (40.0) 6 5 1 1
AA 9/ 12.5 (100.0) 2 27 BS -~ ~".Q __ (~0..,!U ...l 1 ~ -1i Totals 1,061.8 314.4 (70.4) 88 69 1,201 795
1/ Many of the fjgures'are approximate because the partnerships do not - have monthly td a1 ba lances.
2/ Dissovod 12/31/69 _ \1j strlbuted 'UlllrolCimate1y $98 million or about 95% of - partnership capital in January 1~7U.
'if Could not be located.
~/ Disso\ved 12/31/69.
~J Last General Partner ,dj.eif:'- _:-_-~. 9/25/70 in process of liquidati.on.
§J Figures ar" for Aug. 31, 1970.
21 Figures are cpprOXinl!lte due to prcJblem::.: of vr.lua::jon of Jetter &tock.
§./ Partnership3 haVe b~comE' corporationS Numbct"R: shO'.m refe:- to shareholders.
2/ Uisso1ved 9/30/70.
lQl "Percentage Change" should not be construed as investment performance, it also includes dissolut~ons, withdrawals and different borrowings.

324
TABLE IV-I02
CHANGES IN TIlE ASSETS OF THE REGISTERED SPECULATIVE FUNDS (DECEMBER 31, 1968 TO JUNE 30, 1970)
Neuwirth Fund Inc. Northeas t Investors Trust Olympus Fund O'Neil Fund 0EEenheimer Fund I Inc. Pennsylvania Mutual Fund Inc. Pilot Fund Inc. Republic Technology Fund Inc. Revere Fund Inc. Samson Fund Inc. Securities Fund, Inc.
(Hed berg & Gordon Fund Inc.) Shiff Hedge Fund, Inc.
{Integrated Growth Fund Inc. ) Sigma Capital Shares TMR Appreciation Fund Inc. Tower Fund Inc. he Value Line Special Situatl.ons
Fund Inc. (The) Whipple Clarence M. Fund Worth Fund Inc.
Total
]J As of June 30, 1968.
1/ As of November 30, 1968.
1/ As of October 31, 1968.
The
94.5 43.0 35 5 34 9
1 0 5 49 7 14.9
262.7 279.1 14.7 10.3 44. 3 .7 33.0 16.3 22.1 13.0
.4 .4
12 o 3 10 6
7 6 2 8 24 3 40.0 15.2 110 44
336 2 136.7 1 0 1 2 1.8 1 2
1 496.3 888.3
54 5 1 o 0
70.0 6.2
29.9 24.6. 50.6 41.2
(71.4
_ ..(.1.hIL
114.3) 12 6 62.0 60 0
(59 3) 20 0 33 3
(40.6)