additional combined science 5130/02 - …theallpapers.com/papers/cie/olevels/science -...
TRANSCRIPT
This document consists of 19 printed pages and 1 blank page.
SPA (NH/BI) S61128/3© UCLES 2004 [Turn over
UNIVERSITY OF CAMBRIDGE INTERNATIONAL EXAMINATIONS General Certificate of Education Ordinary Level
ADDITIONAL COMBINED SCIENCE 5130/02
Paper 2October/November 2004
2 hours 15 minutesAdditional Materials: Answer Paper
READ THESE INSTRUCTIONS FIRST
Write your Centre number, candidate number and name on all the work you hand in.Write in dark blue or black pen.You may use a soft pencil for any diagrams, graphs or rough working.Do not use staples, paper clips, highlighters, glue or correction fluid.
Section AAnswer all questions.Write your answers in the spaces provided on the question paper.
Section BAnswer one part of each of the three questions.Write your answers on the separate answer paper provided.
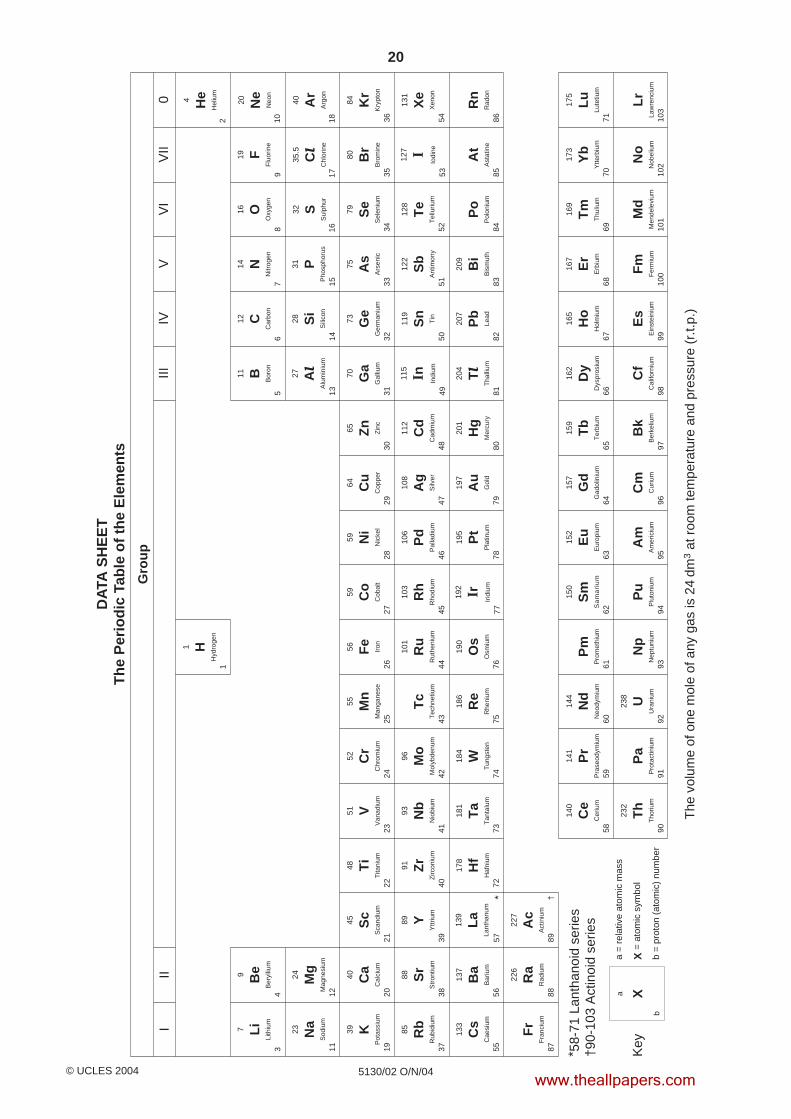
At the end of the examination, fasten all your work securely together.The number of marks is given in brackets [ ] at the end of each question or part question.A copy of the Periodic Table is printed on page 20.
Centre Number Candidate Number Name
If you have been given a label, look at thedetails. If any details are incorrect ormissing, please fill in your correct detailsin the space given at the top of this page.
Stick your personal label here, ifprovided.
For Examiner’s Use
Section A
11
12
13
Total
www.theallpapers.com
2
5130/02 O/N/04
Section A
Answer all the questions.
Write your answers in the spaces provided on the question paper.
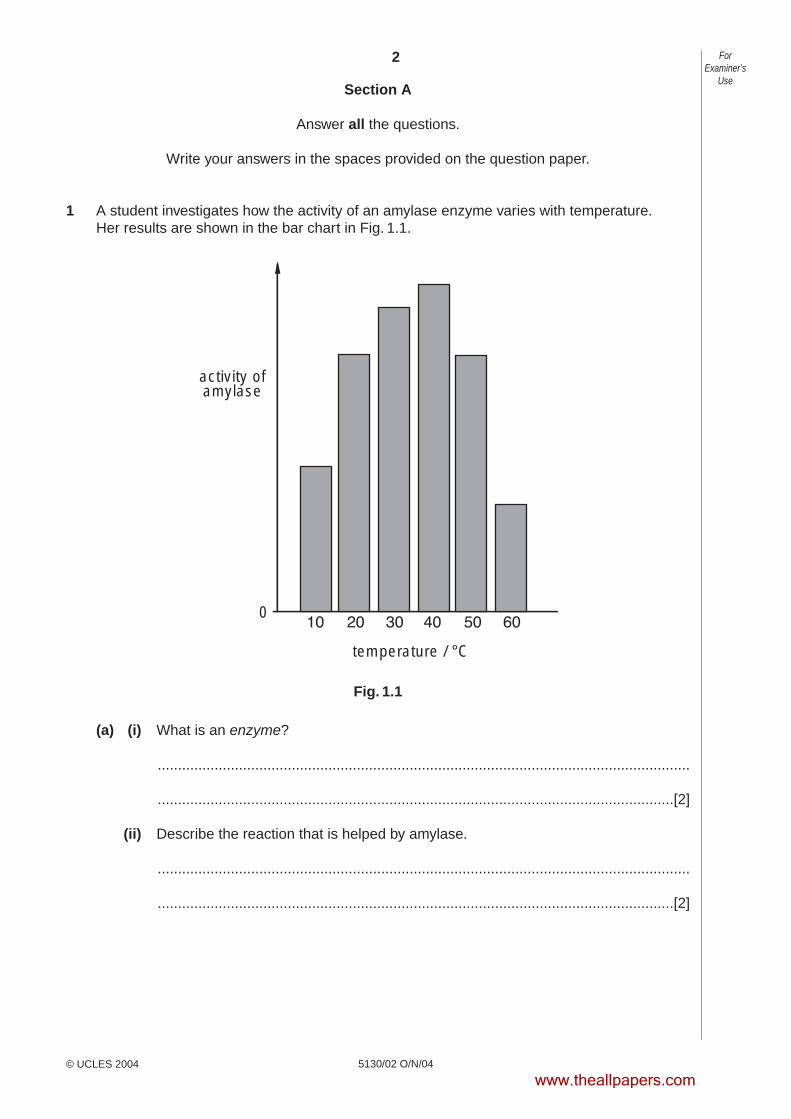
1 A student investigates how the activity of an amylase enzyme varies with temperature.Her results are shown in the bar chart in Fig. 1.1.
Fig. 1.1
(a) (i) What is an enzyme?
...................................................................................................................................
...............................................................................................................................[2]
(ii) Describe the reaction that is helped by amylase.
...................................................................................................................................
...............................................................................................................................[2]
activity ofamylase
temperature / °C
0
ForExaminer’s
Use
© UCLES 2004
www.theallpapers.com
3
5130/02 O/N/04 [Turn over
(b) (i) Use Fig. 1.1 to describe the effect of increase in temperature on the activity of theamylase.
...................................................................................................................................
...................................................................................................................................
...............................................................................................................................[2]
(ii) Explain the change in activity of the amylase above 40 °C.
...............................................................................................................................[1]
(c) State two conditions which must be the same for each experiment in this investigation.
1 .......................................................................................................................................
..........................................................................................................................................
2 .......................................................................................................................................
......................................................................................................................................[2]
ForExaminer’s
Use
© UCLES 2004
www.theallpapers.com
4
5130/02 O/N/04
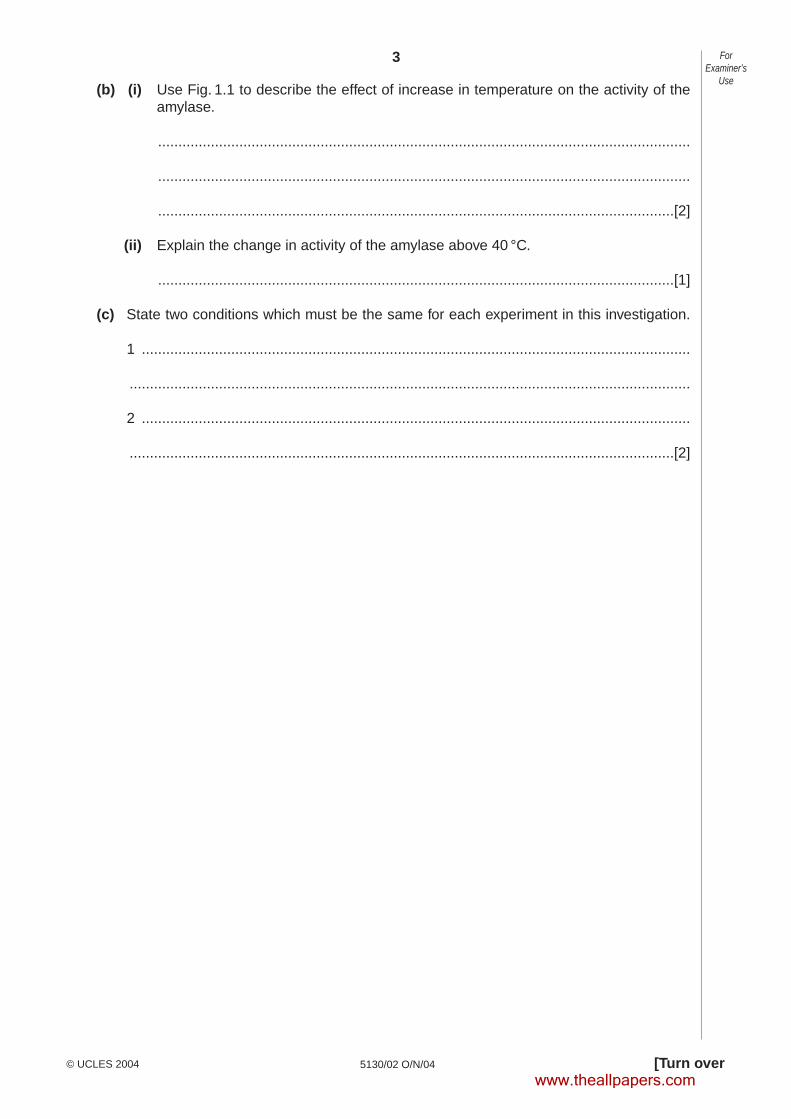
2 Fig. 2.1 contains definitions of three scientific terms.Choose the correct terms from the list to complete the table.
diffusion mass
osmosis polyester
protein weight
Fig. 2.1[3]
the movement of gas molecules, from a region oftheir higher concentration to a region of their lowerconcentration, down a concentration gradient
a macromolecule made by joining together amino acids
a measure of the amount of substance in a body
scientific term definition
ForExaminer’s
Use
© UCLES 2004
www.theallpapers.com
5
5130/02 O/N/04 [Turn over
3 Crude oil is a mixture of many different hydrocarbons. Before use the crude oil is separatedinto several fractions.
(a) The list contains some of the apparatus that is used to separate crude oil into fractionsin the laboratory.
condenser
five test-tubes
flask
thermometer
(i) Draw a diagram of the apparatus after it has been set up.Label each piece of apparatus.
[4]
(ii) Mark with C on your diagram the place where you would put the crude oil and markwith F the place where you would obtain one of the fractions. [2]
(b) Name and give a use for two of the fractions obtained from crude oil.
1 .......................................................................................................................................
..........................................................................................................................................
2 .......................................................................................................................................
......................................................................................................................................[4]
ForExaminer’s
Use
© UCLES 2004
www.theallpapers.com

6
5130/02 O/N/04
4 Fig. 4.1 shows a light ray being reflected from the surface of a mirror.
Fig. 4.1
(a) (i) Complete the three labels in Fig. 4.1. [3]
(ii) What is the relationship between the angles P and Q?
...............................................................................................................................[1]
mirror
light ray
angle ofangle of
P Q
……………………
……………………
……………………
ForExaminer’s
Use
© UCLES 2004
www.theallpapers.com
7
5130/02 O/N/04 [Turn over
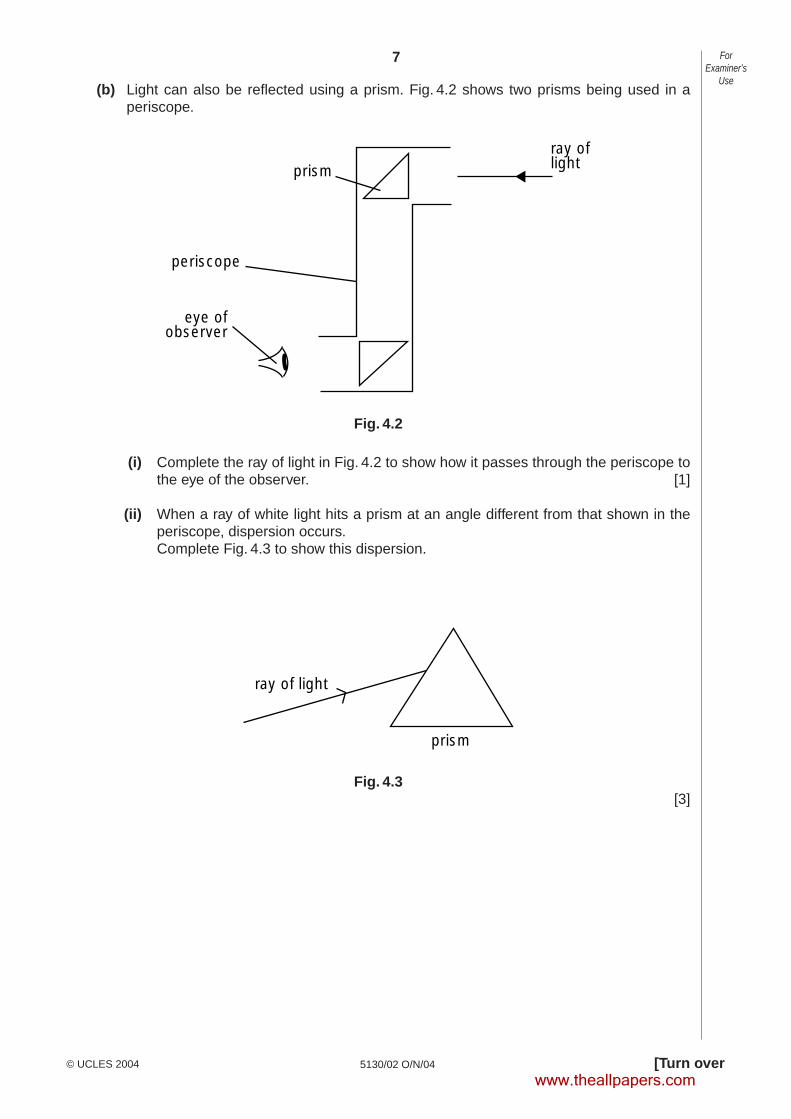
(b) Light can also be reflected using a prism. Fig. 4.2 shows two prisms being used in aperiscope.
Fig. 4.2
(i) Complete the ray of light in Fig. 4.2 to show how it passes through the periscope tothe eye of the observer. [1]
(ii) When a ray of white light hits a prism at an angle different from that shown in theperiscope, dispersion occurs.Complete Fig. 4.3 to show this dispersion.
Fig. 4.3[3]
ray of light
prism
prism
periscope
eye ofobserver
ray oflight
ForExaminer’s
Use
© UCLES 2004
www.theallpapers.com
8
5130/02 O/N/04
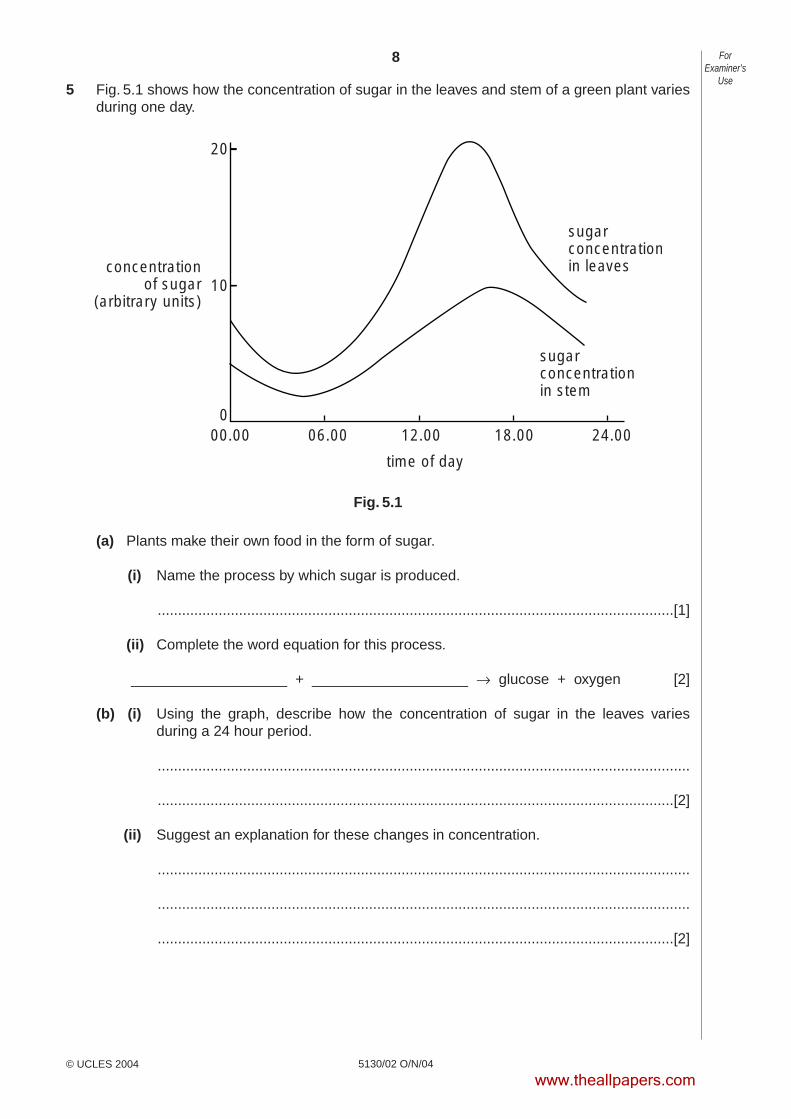
5 Fig. 5.1 shows how the concentration of sugar in the leaves and stem of a green plant variesduring one day.
Fig. 5.1
(a) Plants make their own food in the form of sugar.
(i) Name the process by which sugar is produced.
...............................................................................................................................[1]
(ii) Complete the word equation for this process.
___________________ + ___________________ → glucose + oxygen [2]
(b) (i) Using the graph, describe how the concentration of sugar in the leaves variesduring a 24 hour period.
...................................................................................................................................
...............................................................................................................................[2]
(ii) Suggest an explanation for these changes in concentration.
...................................................................................................................................
...................................................................................................................................
...............................................................................................................................[2]
00.00 06.00 12.00 18.00 24.00
time of day
sugarconcentrationin stem
sugarconcentrationin leavesconcentration
of sugar(arbitrary units)
0
10
20
ForExaminer’s
Use
© UCLES 2004
www.theallpapers.com

9
5130/02 O/N/04 [Turn over
(c) Fig. 5.1 shows that the highest sugar concentration in the leaves occurs at about 15.00hours, but the highest concentration of sugar in the stem occurs at about 16.00 hours.Suggest an explanation for this.
..........................................................................................................................................
..........................................................................................................................................
......................................................................................................................................[2]
ForExaminer’s
Use
© UCLES 2004
www.theallpapers.com
10
5130/02 O/N/04
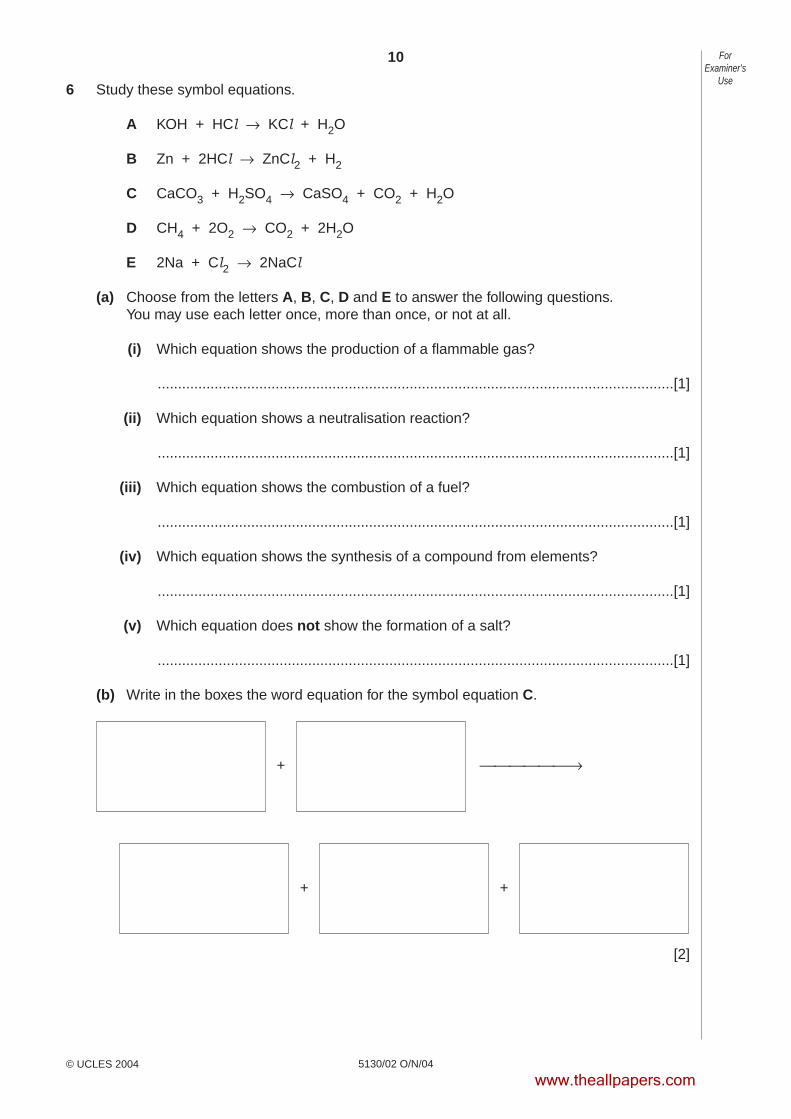
6 Study these symbol equations.
A KOH + HCl → KCl + H2O
B Zn + 2HCl → ZnCl2 + H2
C CaCO3 + H2SO4 → CaSO4 + CO2 + H2O
D CH4 + 2O2 → CO2 + 2H2O
E 2Na + Cl2 → 2NaCl
(a) Choose from the letters A, B, C, D and E to answer the following questions.You may use each letter once, more than once, or not at all.
(i) Which equation shows the production of a flammable gas?
...............................................................................................................................[1]
(ii) Which equation shows a neutralisation reaction?
...............................................................................................................................[1]
(iii) Which equation shows the combustion of a fuel?
...............................................................................................................................[1]
(iv) Which equation shows the synthesis of a compound from elements?
...............................................................................................................................[1]
(v) Which equation does not show the formation of a salt?
...............................................................................................................................[1]
(b) Write in the boxes the word equation for the symbol equation C.
[2]
ForExaminer’s
Use
© UCLES 2004
+ →
+ +
www.theallpapers.com

5130/02 O/N/04 [Turn over© UCLES 2004
11
BLANK PAGE
Turn to page 12 for Question 7.
www.theallpapers.com
12
5130/02 O/N/04
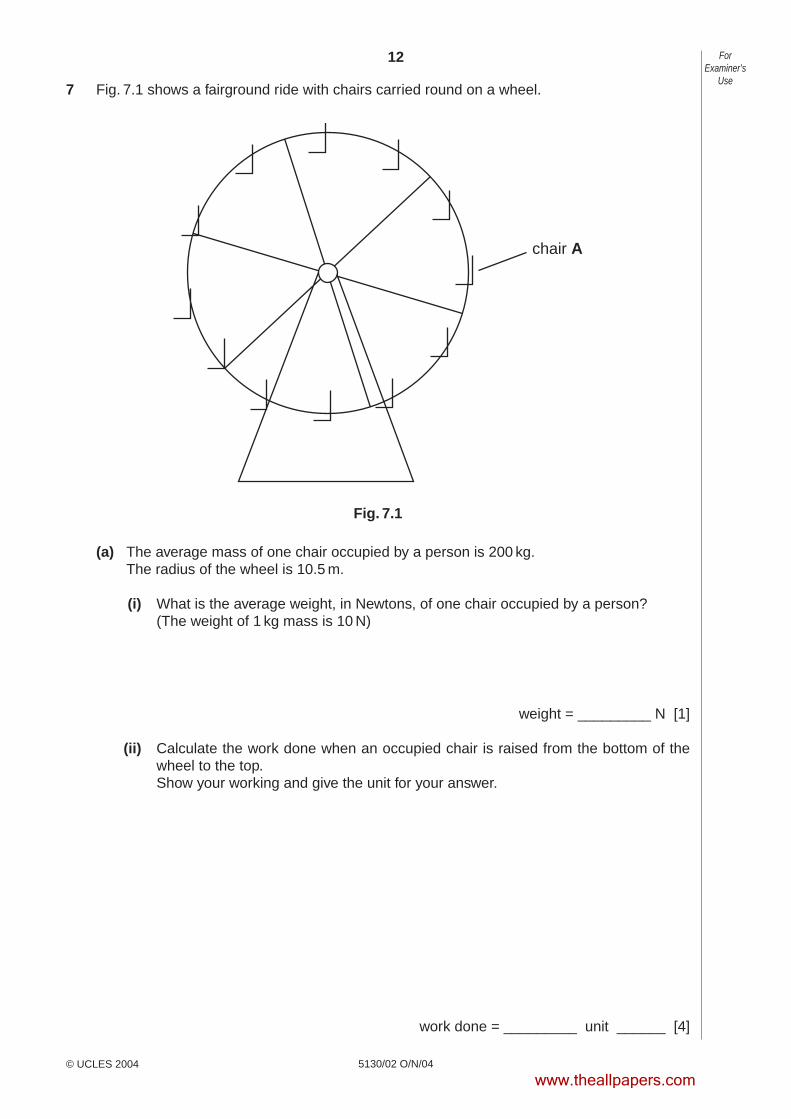
7 Fig. 7.1 shows a fairground ride with chairs carried round on a wheel.
Fig. 7.1
(a) The average mass of one chair occupied by a person is 200 kg.The radius of the wheel is 10.5 m.
(i) What is the average weight, in Newtons, of one chair occupied by a person?(The weight of 1 kg mass is 10 N)
weight = _________ N [1]
(ii) Calculate the work done when an occupied chair is raised from the bottom of thewheel to the top.Show your working and give the unit for your answer.
work done = _________ unit ______ [4]
chair A
ForExaminer’s
Use
© UCLES 2004
www.theallpapers.com
13
5130/02 O/N/04 [Turn over
(b) The circumference of the wheel is 66 m.The wheel makes one turn each minute.Calculate the speed at which each chair travels.Show your working and give your answer in m/s.
speed = _________ m/s [2]
(c) Calculate the moment about the centre of the wheel caused by the weight of chair Aand its occupant.Show your working and give the unit for your answer.
moment = _________ unit ____ [3]
ForExaminer’s
Use
© UCLES 2004
www.theallpapers.com
14
5130/02 O/N/04
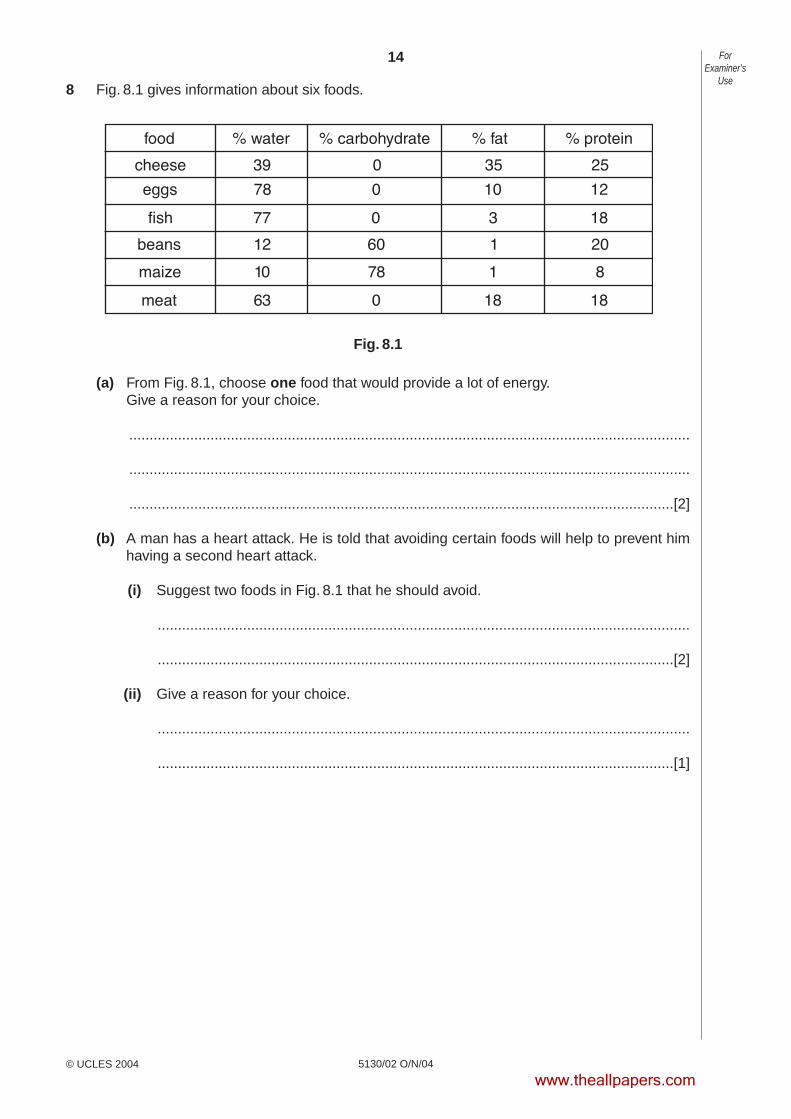
8 Fig. 8.1 gives information about six foods.
Fig. 8.1
(a) From Fig. 8.1, choose one food that would provide a lot of energy.Give a reason for your choice.
..........................................................................................................................................
..........................................................................................................................................
......................................................................................................................................[2]
(b) A man has a heart attack. He is told that avoiding certain foods will help to prevent himhaving a second heart attack.
(i) Suggest two foods in Fig. 8.1 that he should avoid.
...................................................................................................................................
...............................................................................................................................[2]
(ii) Give a reason for your choice.
...................................................................................................................................
...............................................................................................................................[1]
ForExaminer’s
Use
© UCLES 2004
www.theallpapers.com
15
5130/02 O/N/04 [Turn over
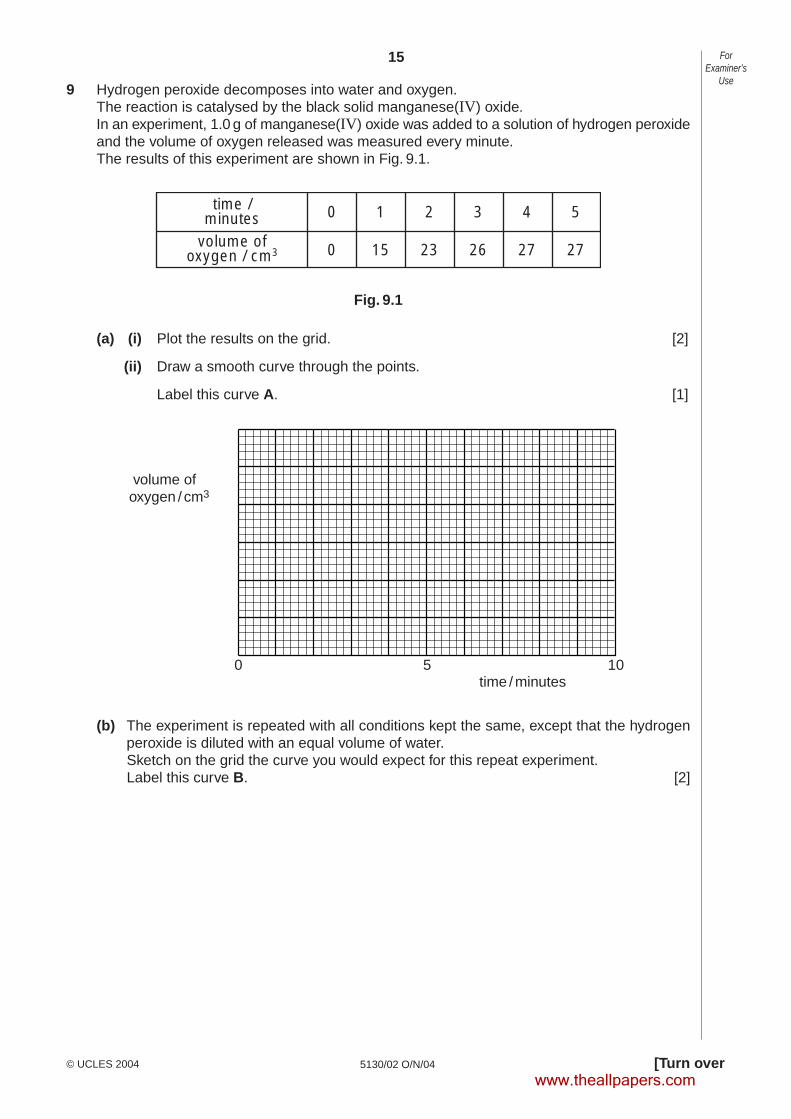
9 Hydrogen peroxide decomposes into water and oxygen.The reaction is catalysed by the black solid manganese(IV) oxide.In an experiment, 1.0 g of manganese(IV) oxide was added to a solution of hydrogen peroxideand the volume of oxygen released was measured every minute.The results of this experiment are shown in Fig. 9.1.
Fig. 9.1
(a) (i) Plot the results on the grid. [2]
(ii) Draw a smooth curve through the points.
Label this curve A. [1]
(b) The experiment is repeated with all conditions kept the same, except that the hydrogenperoxide is diluted with an equal volume of water.Sketch on the grid the curve you would expect for this repeat experiment.Label this curve B. [2]
time / minutes
volume ofoxygen / cm3
0 5 10
time /minutes
volume ofoxygen / cm3
0 1 2 3 4 5
0 15 23 26 27 27
ForExaminer’s
Use
© UCLES 2004
www.theallpapers.com
16
5130/02 O/N/04
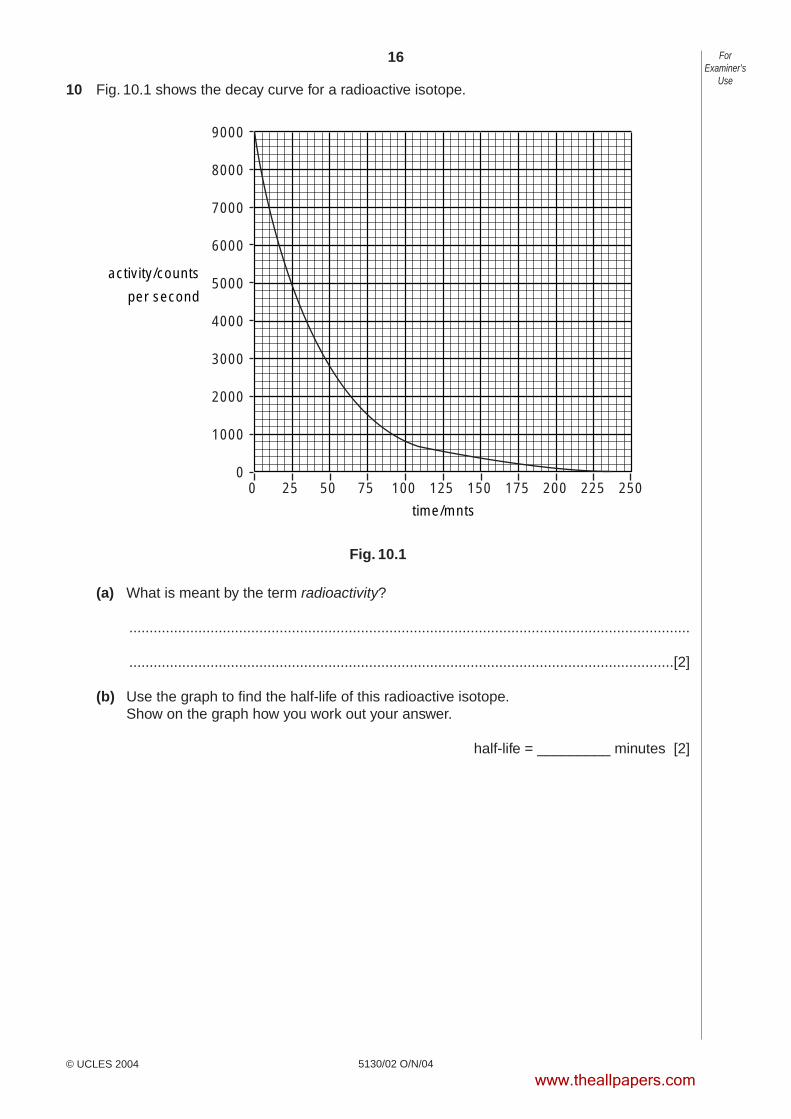
10 Fig. 10.1 shows the decay curve for a radioactive isotope.
Fig. 10.1
(a) What is meant by the term radioactivity?
..........................................................................................................................................
......................................................................................................................................[2]
(b) Use the graph to find the half-life of this radioactive isotope.Show on the graph how you work out your answer.
half-life = _________ minutes [2]
time/mnts
activity/counts
per second
00
1000
2000
3000
4000
5000
6000
7000
8000
9000
25 50 75 100 125 150 175 200 225 250
ForExaminer’s
Use
© UCLES 2004
www.theallpapers.com
17
5130/02 O/N/04 [Turn over
Section B
Answer one part, (a) or (b), of each of the three questions.
Write your answers on the separate answer paper provided.
11 Either
(a) (i) Explain how pollen from one plant can fertilise the ovules of another plant.Include in your answer descriptions of transfer of pollen and fertilisation of ovules. [5]
(ii) The colour of fruit produced by a plant is controlled by a pair of alleles.Red is the dominant colour and yellow is recessive.A farmer uses pollen from a heterozygous red-fruited plant to fertilise the flowers of ahomozygous yellow-fruited plant. He uses the seeds from the fruit of this plant to grow100 new plants.Predict and explain the number of yellow-fruited plants that he obtains.You may use a genetic diagram to make your answer clear.Use the symbol R for the dominant allele and r for the recessive allele. [5]
Or
(b) (i) The body temperature of a human varies little despite large changes in the temperatureof the surroundings.Describe how humans maintain a constant body temperature. [4]
(ii) Explain how urea is excreted from the human body. In your answer give details of theroute followed by urea from the liver where it is formed, until it is removed from the body.Why is it essential for urea to be removed from the body? [6]
© UCLES 2004
www.theallpapers.com
18
5130/02 O/N/04
12 Either
(a) In the Periodic Table, Group I contains the alkali metals and Group VII contains the halogens.
(i) Describe trends in the properties of the elements in these two Groups of elements. [6]
(ii) Sodium is an alkali metal with the electron arrangement 2,8,1 and chlorine is a halogenwith the electron arrangement 2,8,7.Using this information, draw a diagram to show bonding in the compound sodium chloride.
[4]
Or
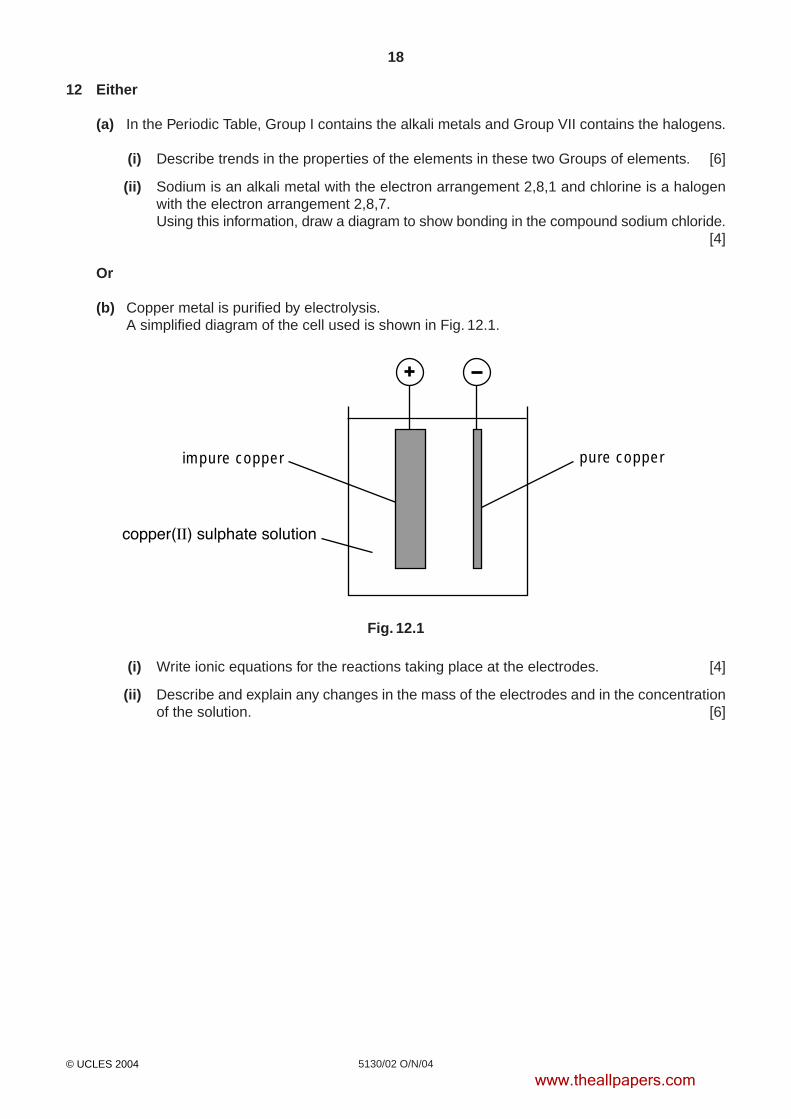
(b) Copper metal is purified by electrolysis.A simplified diagram of the cell used is shown in Fig. 12.1.
Fig. 12.1
(i) Write ionic equations for the reactions taking place at the electrodes. [4]
(ii) Describe and explain any changes in the mass of the electrodes and in the concentrationof the solution. [6]
impure copper pure copper
© UCLES 2004
www.theallpapers.com
19
5130/02 O/N/04
13 Either
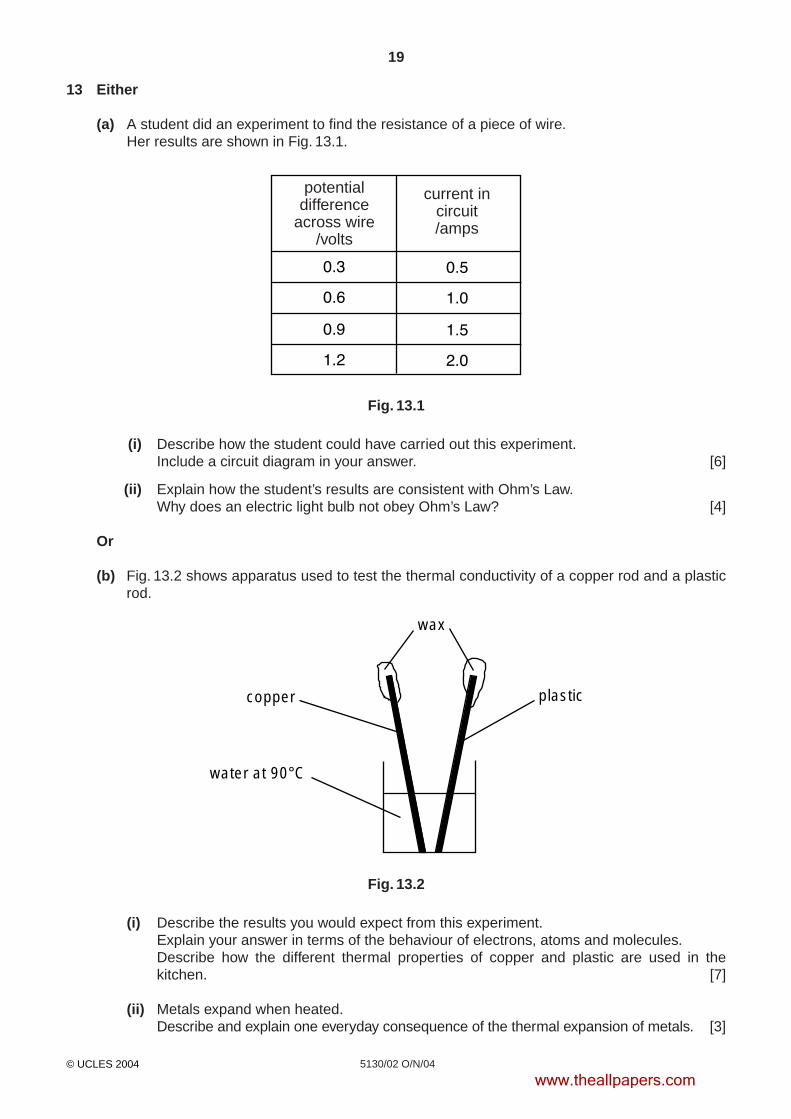
(a) A student did an experiment to find the resistance of a piece of wire.Her results are shown in Fig. 13.1.
Fig. 13.1
(i) Describe how the student could have carried out this experiment.Include a circuit diagram in your answer. [6]
(ii) Explain how the student’s results are consistent with Ohm’s Law.Why does an electric light bulb not obey Ohm’s Law? [4]
Or
(b) Fig. 13.2 shows apparatus used to test the thermal conductivity of a copper rod and a plasticrod.
Fig. 13.2
(i) Describe the results you would expect from this experiment.Explain your answer in terms of the behaviour of electrons, atoms and molecules.Describe how the different thermal properties of copper and plastic are used in thekitchen. [7]
(ii) Metals expand when heated.Describe and explain one everyday consequence of the thermal expansion of metals. [3]
copper
water at 90°C
plastic
wax
potentialdifference
across wire/volts
current incircuit/amps
© UCLES 2004
www.theallpapers.com
5130/02 O/N/04© UCLES 2004
20
Gro
up
DA
TA S
HE
ET
Th
e P
erio
dic
Tab
le o
f th
e E
lem
ents
140
Ce
Cer
ium
58
141
Pr
Pra
seod
ymiu
m
59
144
Nd
Neo
dym
ium
60
Pm
Pro
met
hium
61
150
Sm
Sa
ma
riu
m
62
152
Eu
Eur
opiu
m
63
157
Gd
Gad
olin
ium
64
159
Tb
Ter
bium
65
162
Dy
Dys
pros
ium
66
165
Ho
Hol
miu
m
67
167
Er
Erb
ium
68
169
Tm
Thu
lium
69
173
Yb
Ytte
rbiu
m
70
175
Lu
Lute
tium
71
232
Th
Tho
rium
90
Pa
Pro
tact
iniu
m
91
238 U
Ura
nium
92
Np
Nep
tuni
um
93
Pu
Plu
toni
um
94
Am
Am
eric
ium
95
Cm
Cur
ium
96
Bk
Ber
keliu
m
97
Cf
Cal
iforn
ium
98
Es
Ein
stei
nium
99
Fm
Fer
miu
m
100
Md
Men
dele
vium
101
No
Nob
eliu
m
102
Lr
Law
renc
ium
103
1 HH
ydro
gen
1
7 Li
Lith
ium
3
23 Na
Sod
ium
11
24 Mg
Mag
nesi
um
12
40 Ca
Cal
cium
20
45 Sc
Sca
ndiu
m
21
48 Ti
Tita
nium
22
51 VV
anad
ium
23
52 Cr
Chr
omiu
m
24
55 Mn
Man
gane
se
25
56 Fe
Iron
26
59 Co
Cob
alt
27
59 Ni
Nic
kel
28
64 Cu
Cop
per
29
65 Zn
Zin
c
30
70 Ga
Gal
lium
31
27 Al
Alu
min
ium
13
11 BB
oron
5
12 CC
arbo
n
6
14 NN
itrog
en
7
16 OO
xyge
n
8
19 FF
luor
ine
9
28 Si
Sili
con
14
31 PP
hosp
horu
s
15
32 SS
ulph
ur16
35.5
Cl
Chl
orin
e17
40 Ar
Arg
on18
20 Ne
Neo
n10
4 He
Hel
ium
2
73 Ge
Ger
man
ium
32
75 As
Ars
enic
33
79 Se
Sel
eniu
m
34
80 Br
Bro
min
e
35
84 Kr
Kry
pton
36
39 KP
otas
sium
19
88 Sr
Str
ontiu
m
38
89 YY
ttriu
m
39
91 Zr
Zirc
oniu
m
40
93 Nb
Nio
bium
41
96 Mo
Mol
ybde
num
42
Tc
Tec
hnet
ium
43
101
Ru
Rut
heni
um
44
103
Rh
Rho
dium
45
106
Pd
Pal
ladi
um
46
108
Ag
Silv
er
47
112
Cd
Cad
miu
m
48
115
In Indi
um
49
119
Sn
Tin
50
122
Sb
Ant
imon
y
51
128
Te
Tel
luriu
m
52
127 I
Iodi
ne
53
131
Xe
Xen
on
54
137
Ba
Bar
ium
56
139
La
Lant
hanu
m
57
*
178
Hf
Haf
nium
72
181
Ta
Tan
talu
m
73
184
WT
ungs
ten
74
186
Re
Rhe
nium
75
190
Os
Osm
ium
76
192 Ir
Irid
ium
77
195
Pt
Pla
tinum
78
197
Au
Gol
d
79
201
Hg
Mer
cury
80
204
Tl
Tha
llium
81
207
Pb
Lead
82
209
Bi
Bis
mut
h
83
Po
Pol
oniu
m
84
At
Ast
atin
e
85
Rn
Rad
on
86
Fr
Fra
nciu
m
87
227
Ac
Act
iniu
m
89
†
9 Be
Ber
ylliu
m
4
III
IIIIV
VV
IV
II0
85 Rb
Rub
idiu
m
37
133
Cs
Cae
sium
55
226
Ra
Rad
ium
88
The
vol
ume
of o
ne m
ole
of a
ny g
as is
24
dm3
at r
oom
tem
pera
ture
and
pre
ssur
e (r
.t.p.
)
a Xb
a =
rel
ativ
e at
omic
mas
s
X =
ato
mic
sym
bol
b =
pro
ton
(ato
mic
) nu
mbe
r
Key
* 58-
71 L
anth
anoi
d se
ries
†90-
103
Act
inoi
d se
ries
www.theallpapers.com