across the great divide - sodipress
TRANSCRIPT

December 2020
Across the Great Divide:North American asset management in a year of many shocks but few surprises

Authors and acknowledgements
Pooneh Baghai
Senior Partner New York and Toronto [email protected]
Kevin ChoPartner New York [email protected]
Onur ErzanSenior Partner New York [email protected]
Ju-Hon KwekPartner New York [email protected]
The authors would like to thank Edgardo Bonilla, Emile Daou, Manraj Singh Dhillon, Owen Jones, and Raksha Pant Tuladhar for their contributions to this article.
2 Across the Great Divide: North American asset management in a year of many shocks but few surprises
A dual shock to the system
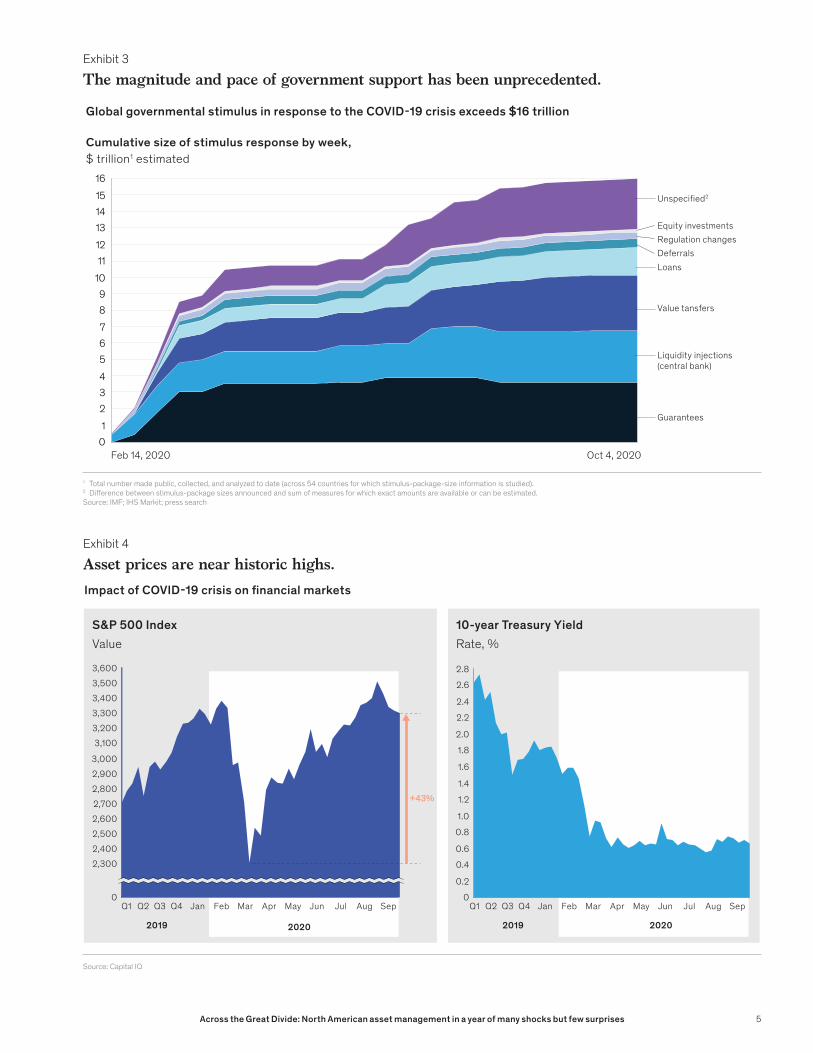
The unprecedented economic slowdown was met with an unprecedented response: extraordinarily large and swift government and central bank interventions (Exhibit 3). Fiscal stimulus packages and central bank balance sheets, in particular, have swelled to historic proportions. The U.S. Federal Reserve has seen its assets grow from $3 trillion before the COVID-19 crisis to $7 trillion today (with some forecasts projecting $10 trillion in the foreseeable future).
When an unstoppable force meets an immovable object . . .The shocks of 2020 have opened up a number of great divides—between the real economy and the financial markets, between sectors that have ground to a halt because of the pandemic and those that have thrived in the world of “work from home,” and, more broadly, between a set of vastly different visions of the role of business and capital in addressing socio-economic inequities.
For the asset management industry, the stage has always been the financial markets. And here, the industry finds itself on the advantaged side
of the great divide, at least in terms of financial performance. Despite the weight of the pandemic on traditional macroeconomic indicators (GDP growth, unemployment, consumer confidence, manufacturer confidence), stock and bond markets recovered quickly from the lows of March to reach all-time highs over the past few months (Exhibit 4). And despite the recent market volatility caused by a second (and in some cases third) wave of the pandemic, valuations remain high as the low rate environment has nudged investors towards risk assets.
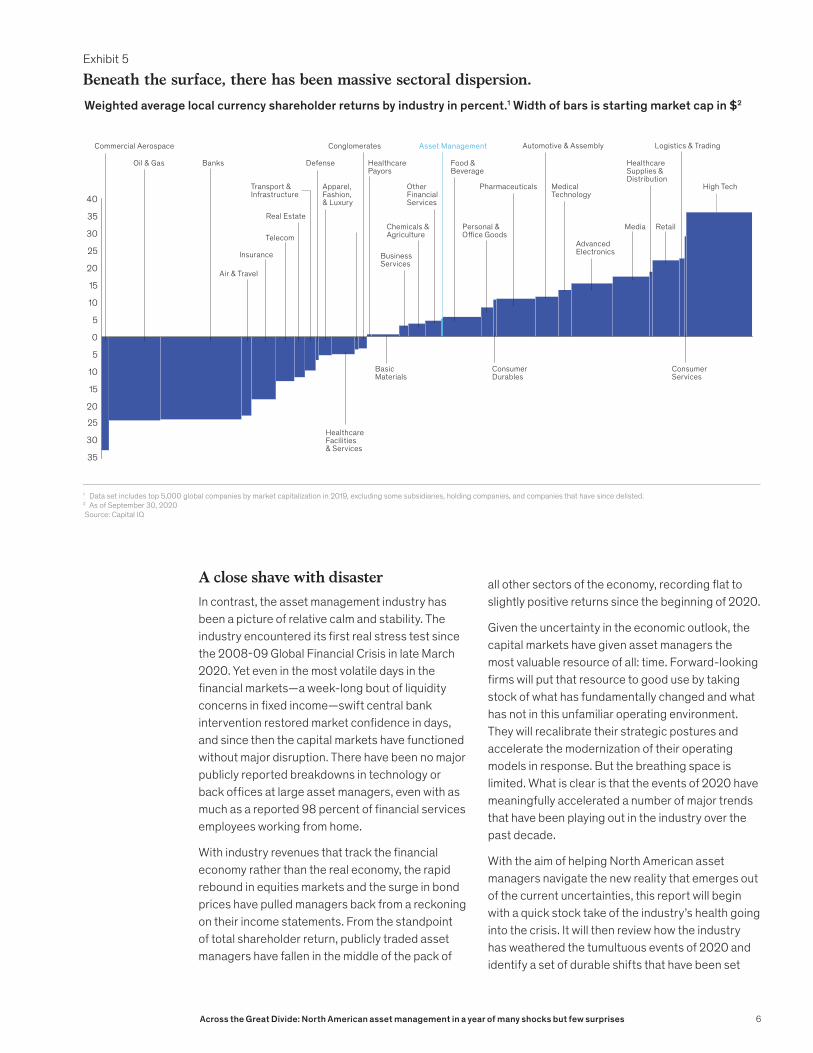
Beneath the recovery in financial markets, however, another starkly bifurcated landscape has taken shape. Sectoral dispersion has spiked as the work-from-home and pandemic economies (e.g., media and entertainment, e-commerce, healthcare supplies and distribution) have roared, while physical sectors (e.g., aviation, oil and gas) have been badly hit (Exhibit 5). The politicized and uncertain outlook for further fiscal stimulus in the near-term, particularly in a fraught Presidential election year in the United States, already appears to be contributing to a sputtering recovery in the real economy.
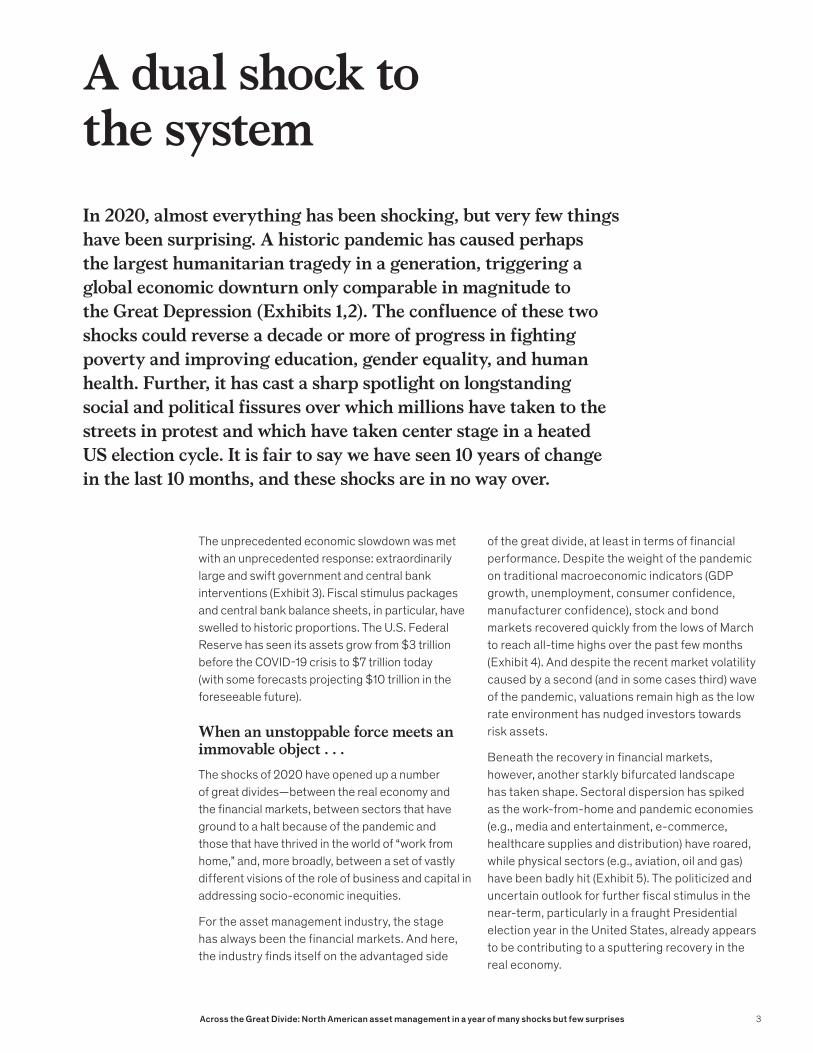
In 2020, almost everything has been shocking, but very few things have been surprising. A historic pandemic has caused perhaps the largest humanitarian tragedy in a generation, triggering a global economic downturn only comparable in magnitude to the Great Depression (Exhibits 1,2). The confluence of these two shocks could reverse a decade or more of progress in fighting poverty and improving education, gender equality, and human health. Further, it has cast a sharp spotlight on longstanding social and political fissures over which millions have taken to the streets in protest and which have taken center stage in a heated US election cycle. It is fair to say we have seen 10 years of change in the last 10 months, and these shocks are in no way over.
3Across the Great Divide: North American asset management in a year of many shocks but few surprises
Source: Johns Hopkins University, Historical Statistics of the United States Vol 3, Bureau of economic analysis; McKinsey analysis in partnership with Oxford Economics
March April May June July
15.0
0
47.5
7.5
2.55.0
10.012.5
17.520.022.525.027.5
45.0
30.032.5
42.5
35.037.540.0
Mexico
France
China
Rest of the world
UKColombia
SpainArgentina
Brazil
India
US
Russia
August September October
Cumulative number of COVID-19 cases since March 1Millions
Exhibit 1
A historic pandemic has been accompanied by an economic downturn unlike anything since the Great Depression.
Source: Bureau of Economic Analysis; McKinsey analysis in partnership with Oxford Economics
-4
-5
-8
-2
-6
0
-7
-1
-3
-9+Q2
COVID-19
+Q4 +Q14+Q6 +Q8 +Q10 +Q12
1981 recession(begins Q3 1981) 1973 oil shock
(begins Q2 1973)
Dot-com bubble(begins Q4 2000)
Global �nancial crisis(begins Q4 2007)
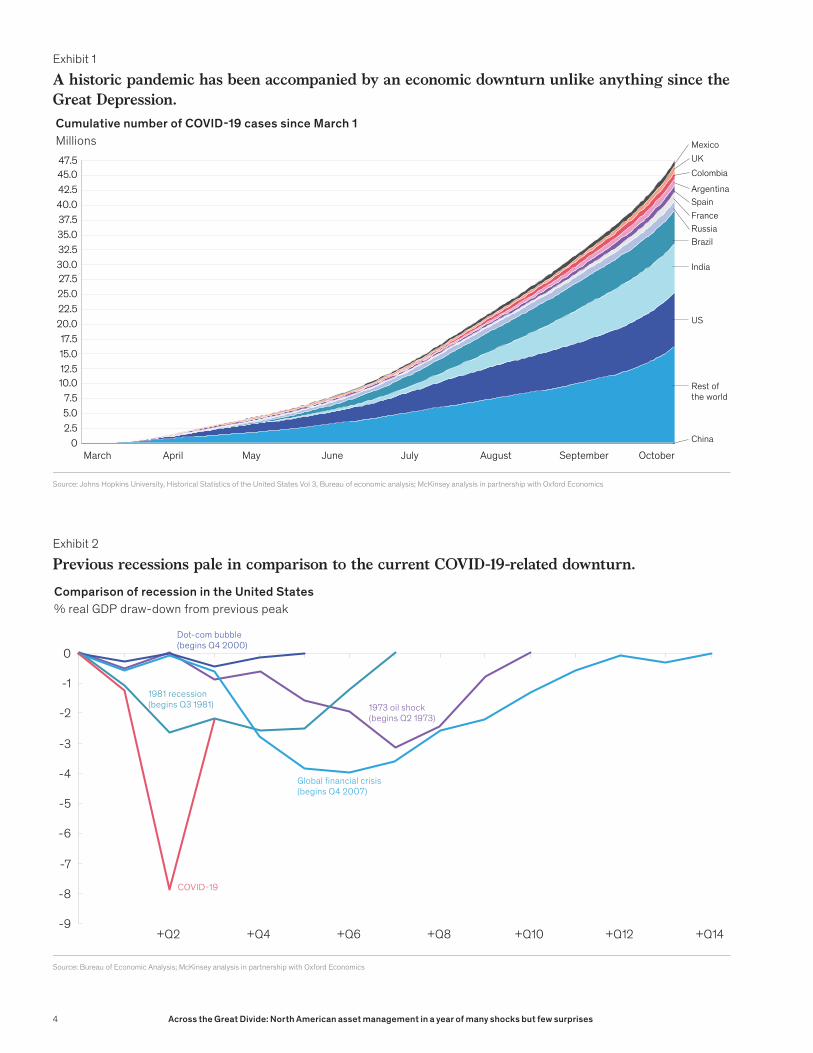
Comparison of recession in the United States% real GDP draw-down from previous peak
Exhibit 2
Previous recessions pale in comparison to the current COVID-19-related downturn.
4 Across the Great Divide: North American asset management in a year of many shocks but few surprises
1 Total number made public, collected, and analyzed to date (across 54 countries for which stimulus-package-size information is studied).2 Di�erence between stimulus-package sizes announced and sum of measures for which exact amounts are available or can be estimated.Source: IMF; IHS Markit; press search
012
7
14
5
8
34
6
910111213
1516
Feb 14, 2020 Oct 4, 2020
Global governmental stimulus in response to the COVID-19 crisis exceeds $16 trillion
Cumulative size of stimulus response by week,$ trillion1 estimated
Value tansfers
DeferralsLoans
Unspeci�ed2
Equity investmentsRegulation changes
Guarantees
Liquidity injections(central bank)
Exhibit 3
The magnitude and pace of government support has been unprecedented.
Source: Capital IQ
2,700
2,500
3,200
2,600
3,400
0
3,5003,600
2,400
3,300
3,000
2,300
2,8002,900
3,100
Jun JulQ1 Q2 AugQ4Q3 Jan Feb Mar Apr May Sep
+43%
0.6
0
1.2
0.8
0.2
0.4
1.0
1.4
1.6
1.8
2.0
2.2
2.4
2.6
2.8
MarQ2 SepFebQ1 Q3 Q4 Jan Apr May Jun Jul Aug
S&P 500 Index 10-year Treasury YieldValue Rate, %
2019 20192020 2020
Impact of COVID-19 crisis on �nancial markets
Exhibit 4
Asset prices are near historic highs.
5Across the Great Divide: North American asset management in a year of many shocks but few surprises
A close shave with disasterIn contrast, the asset management industry has been a picture of relative calm and stability. The industry encountered its first real stress test since the 2008-09 Global Financial Crisis in late March 2020. Yet even in the most volatile days in the financial markets—a week-long bout of liquidity concerns in fixed income—swift central bank intervention restored market confidence in days, and since then the capital markets have functioned without major disruption. There have been no major publicly reported breakdowns in technology or back offices at large asset managers, even with as much as a reported 98 percent of financial services employees working from home.
With industry revenues that track the financial economy rather than the real economy, the rapid rebound in equities markets and the surge in bond prices have pulled managers back from a reckoning on their income statements. From the standpoint of total shareholder return, publicly traded asset managers have fallen in the middle of the pack of
all other sectors of the economy, recording flat to slightly positive returns since the beginning of 2020.
Given the uncertainty in the economic outlook, the capital markets have given asset managers the most valuable resource of all: time. Forward-looking firms will put that resource to good use by taking stock of what has fundamentally changed and what has not in this unfamiliar operating environment. They will recalibrate their strategic postures and accelerate the modernization of their operating models in response. But the breathing space is limited. What is clear is that the events of 2020 have meaningfully accelerated a number of major trends that have been playing out in the industry over the past decade.
With the aim of helping North American asset managers navigate the new reality that emerges out of the current uncertainties, this report will begin with a quick stock take of the industry’s health going into the crisis. It will then review how the industry has weathered the tumultuous events of 2020 and identify a set of durable shifts that have been set
1 Data set includes top 5,000 global companies by market capitalization in 2019, excluding some subsidiaries, holding companies, and companies that have since delisted. 2 As of September 30, 2020 Source: Capital IQ
Oil & Gas Banks
Insurance
Real Estate
Transport &Infrastructure
Apparel, Fashion, & Luxury
Healthcare Facilities & Services
Defense
Conglomerates
HealthcarePayors
BasicMaterials
Business Services
Chemicals & Agriculture
Other Financial Services
Personal & O�ce Goods
Consumer Durables
Consumer Services
Pharmaceuticals
Automotive & Assembly
MedicalTechnology
Advanced Electronics
Media Retail
High Tech
Logistics & Trading
Healthcare Supplies & Distribution
Telecom
5
35
30
40
15
10
5
0
15
25
10
20
20
25
30
35
Asset ManagementCommercial Aerospace
Air & Travel
Food & Beverage
Weighted average local currency shareholder returns by industry in percent.1 Width of bars is starting market cap in $2
Exhibit 5
Beneath the surface, there has been massive sectoral dispersion.
6Across the Great Divide: North American asset management in a year of many shocks but few surprises

in motion as second- and third-order effects of the pandemic. The report will conclude by mapping out a set of potential trajectories for the industry over the next three to five years and laying out an agenda for asset managers in these uncertain times. The chapters that follow will draw into focus the following overarching themes:
— The lower for (even) longer macroeconomic backdrop, which is reshaping portfolio construction and accelerating longer-term product trends
— The structural shifts in sources and uses of capital that are being driven by behavioral
changes and new funding realities on the part of retail and institutional end investors
— The widening gap between the best and the rest in the asset management industry
— The renewed opportunity to restructure and transform operating models as consolidation accelerates and competitors make bold moves to win the recovery
— The opportunity (and urgent need) for a redefinition of the industry’s purpose in society in the face of a financial security crisis
7Across the Great Divide: North American asset management in a year of many shocks but few surprises
Before the crisis – A mixed bill of health
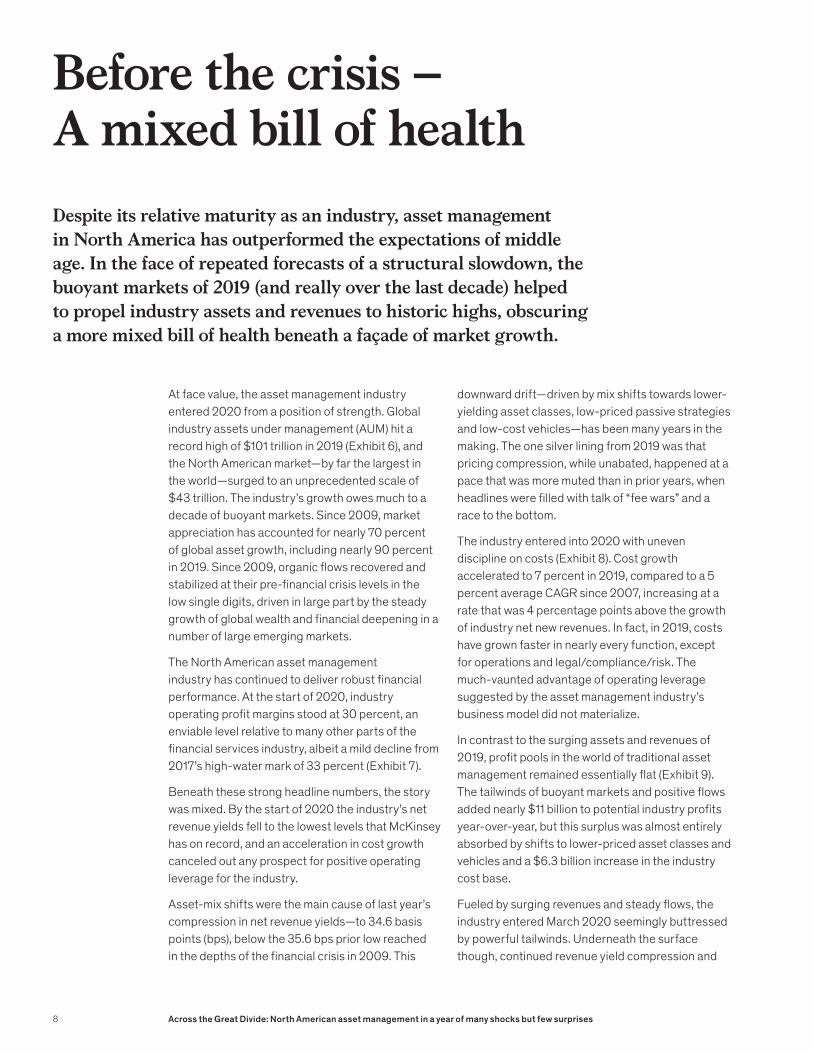
At face value, the asset management industry entered 2020 from a position of strength. Global industry assets under management (AUM) hit a record high of $101 trillion in 2019 (Exhibit 6), and the North American market—by far the largest in the world—surged to an unprecedented scale of $43 trillion. The industry’s growth owes much to a decade of buoyant markets. Since 2009, market appreciation has accounted for nearly 70 percent of global asset growth, including nearly 90 percent in 2019. Since 2009, organic flows recovered and stabilized at their pre-financial crisis levels in the low single digits, driven in large part by the steady growth of global wealth and financial deepening in a number of large emerging markets.
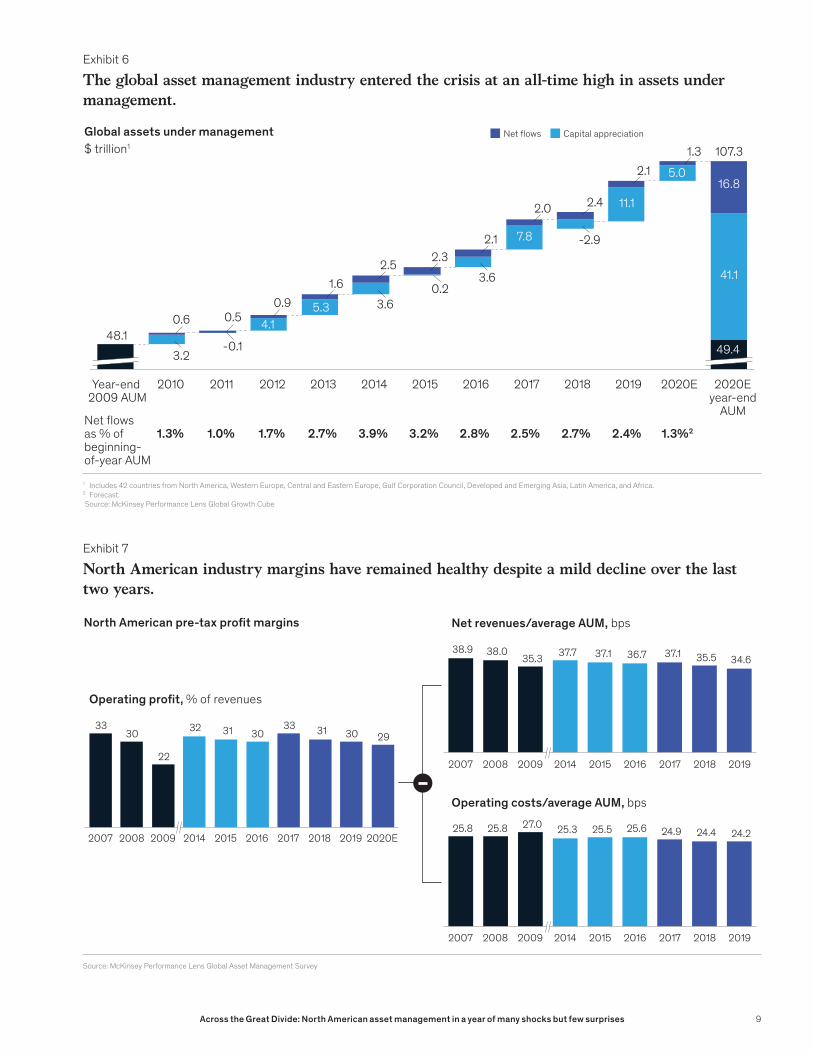
The North American asset management industry has continued to deliver robust financial performance. At the start of 2020, industry operating profit margins stood at 30 percent, an enviable level relative to many other parts of the financial services industry, albeit a mild decline from 2017’s high-water mark of 33 percent (Exhibit 7).
Beneath these strong headline numbers, the story was mixed. By the start of 2020 the industry’s net revenue yields fell to the lowest levels that McKinsey has on record, and an acceleration in cost growth canceled out any prospect for positive operating leverage for the industry.
Asset-mix shifts were the main cause of last year’s compression in net revenue yields—to 34.6 basis points (bps), below the 35.6 bps prior low reached in the depths of the financial crisis in 2009. This
downward drift—driven by mix shifts towards lower-yielding asset classes, low-priced passive strategies and low-cost vehicles—has been many years in the making. The one silver lining from 2019 was that pricing compression, while unabated, happened at a pace that was more muted than in prior years, when headlines were filled with talk of “fee wars” and a race to the bottom.
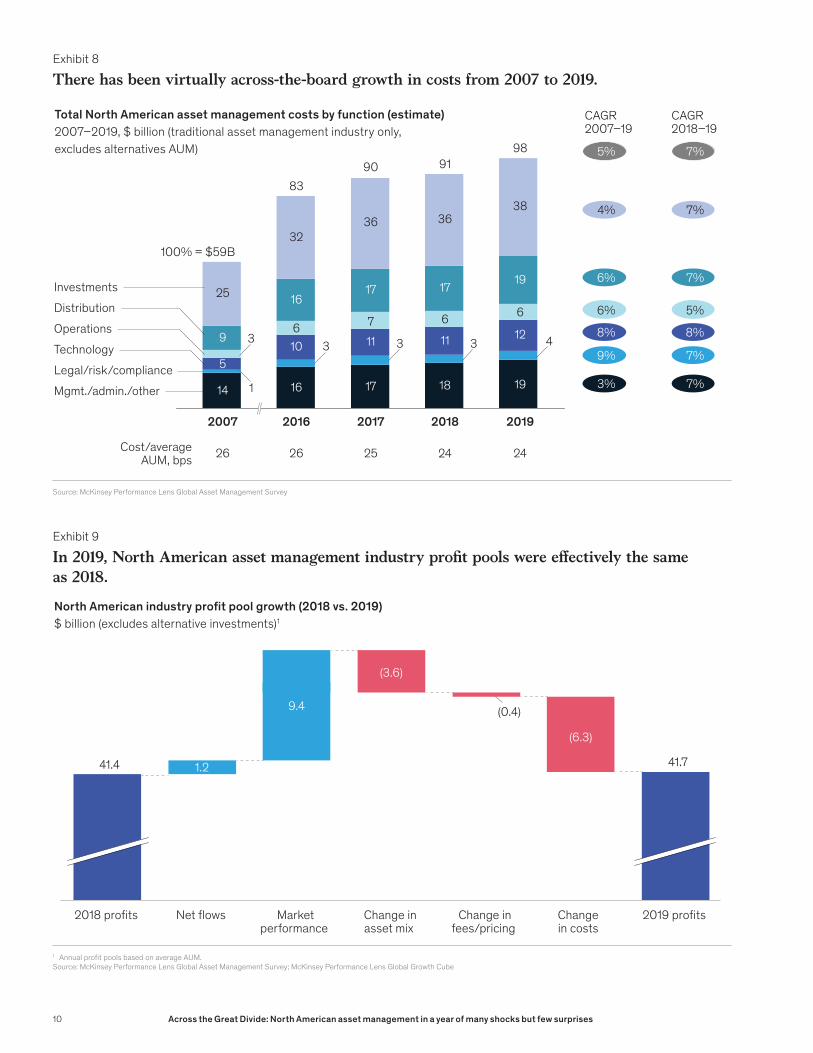
The industry entered into 2020 with uneven discipline on costs (Exhibit 8). Cost growth accelerated to 7 percent in 2019, compared to a 5 percent average CAGR since 2007, increasing at a rate that was 4 percentage points above the growth of industry net new revenues. In fact, in 2019, costs have grown faster in nearly every function, except for operations and legal/compliance/risk. The much-vaunted advantage of operating leverage suggested by the asset management industry’s business model did not materialize.
In contrast to the surging assets and revenues of 2019, profit pools in the world of traditional asset management remained essentially flat (Exhibit 9). The tailwinds of buoyant markets and positive flows added nearly $11 billion to potential industry profits year-over-year, but this surplus was almost entirely absorbed by shifts to lower-priced asset classes and vehicles and a $6.3 billion increase in the industry cost base.
Fueled by surging revenues and steady flows, the industry entered March 2020 seemingly buttressed by powerful tailwinds. Underneath the surface though, continued revenue yield compression and
Despite its relative maturity as an industry, asset management in North America has outperformed the expectations of middle age. In the face of repeated forecasts of a structural slowdown, the buoyant markets of 2019 (and really over the last decade) helped to propel industry assets and revenues to historic highs, obscuring a more mixed bill of health beneath a façade of market growth.
8 Across the Great Divide: North American asset management in a year of many shocks but few surprises
1 Includes 42 countries from North America, Western Europe, Central and Eastern Europe, Gulf Corporation Council, Developed and Emerging Asia, Latin America, and Africa.2 Forecast. Source: McKinsey Performance Lens Global Growth Cube
Capital appreciationNet �ows
-2.9
3.6
3.60.2
2011
4.10.6
2.4
2015 2016
2.0
2.12.32.5
1.60.9
2017 2018 2020E 2020Eyear-end
AUM
Year-end 2009 AUM
0.5
20192012
3.2
201420132010
--0.1 49.4
1.3% 1.7% 2.7% 3.9% 3.2% 2.8%1.0% 2.7% 2.4%2.5% 1.3%2Net �ows as % of beginning-of-year AUM
107.31.3
5.0
11.1
41.1
16.8
7.8
5.3
48.1
2.1
Global assets under management$ trillion1
Exhibit 6
The global asset management industry entered the crisis at an all-time high in assets under management.
Source: McKinsey Performance Lens Global Asset Management Survey
3330
22
32 31 3033 31 30 29
38.9 38.035.3 37.7 37.1 36.7 37.1 35.5 34.6
20162007 2008 20142009 2015 2017 2018 2019
20162007 2008 20142009 2015 2017 2018 2019
20162007 2008 20142009 2015 2017 2018 2019 2020E25.8 25.8 27.0 25.3 25.5 25.6 24.9 24.4 24.2
Operating pro�t, % of revenues
Net revenues/average AUM, bpsNorth American pre-tax pro�t margins
Operating costs/average AUM, bps
Exhibit 7
North American industry margins have remained healthy despite a mild decline over the last two years.
9Across the Great Divide: North American asset management in a year of many shocks but few surprises
Source: McKinsey Performance Lens Global Asset Management Survey
9%
6% 7%
4% 7%
6% 5%
3%
7%
7%
8% 8%
5% 7%
6 7 6 625
3236 36
38
2017
98
CAGR2007–19
CAGR2018–19
1
Distribution
83
Investments
Technology
Legal/risk/compliance
100% = $59B
2019
Mgmt./admin./other
4Operations
3
2016 20182007
90 91
Cost/averageAUM, bps 26 26 25 24
14 16 17 18 19
10 11 11 129
1617 17 19
5
24
333
Total North American asset management costs by function (estimate)2007–2019, $ billion (traditional asset management industry only, excludes alternatives AUM)
Exhibit 8
There has been virtually across-the-board growth in costs from 2007 to 2019.
1 Annual pro�t pools based on average AUM.Source: McKinsey Performance Lens Global Asset Management Survey; McKinsey Performance Lens Global Growth Cube
Change infees/pricing
Change inasset mix
2018 pro�ts Net �ows Marketperformance
Change in costs
2019 pro�ts
(6.3)
(3.6)
9.4
1.2 41.7
(0.4)
41.4
North American industry pro t pool growth (2018 vs. 2019) $ billion (excludes alternative investments)1
Exhibit 9
In 2019, North American asset management industry pro�t pools were e�ectively the same as 2018.
10 Across the Great Divide: North American asset management in a year of many shocks but few surprises

a cost structure that was seemingly variable on the upside but rigid on the downside lingered. After a decade of macroeconomic conditions dubbed “the Great Moderation”—low inflation, positive economic
growth, and rising financial markets—how would the industry face a massive shock to both the financial markets and the “real economy”?
11Across the Great Divide: North American asset management in a year of many shocks but few surprises
During the crisis – The market calls the shots
For the financial markets, 2020 started on a strong footing. But as the rapid growth of COVID-19 and its associated global disruptions came into sharper focus, the conditions were set for a March shock. After several small pullbacks by investors in the first few months of the year, the markets entered an intense period of stress towards the end of March, and, with that, the industry experienced a year’s worth of asset allocation shifts in just several weeks. This initial period of volatility and uncertainty was marked by a dramatic flight to safety.
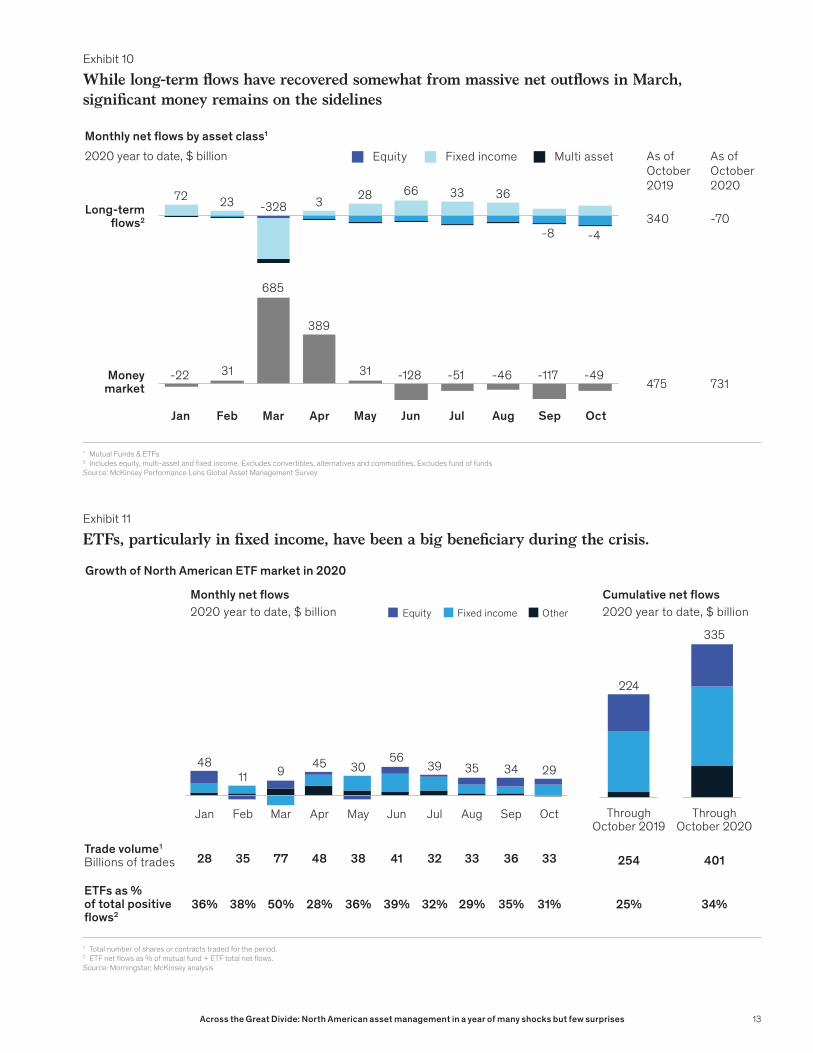
An initial flight to safetyBut while prior flights disproportionately pulled assets out of equities and other risk assets, this time the traditional safe haven of fixed income experienced the largest net outflows, as concerns over liquidity hit market participants and the long ends of yield curves flattened beyond what most investors believed was possible. In the month of March alone, long-term outflows from fixed-income funds totaled almost $300 billion, compared with an average monthly inflow of $45 billion the year prior. Despite a massive round of central bank interventions, which stabilized the markets, investors pulled far back to the sidelines. In just two months, money market instruments in North America accumulated an additional roughly $1.8 trillion in net inflows, including nearly $1 trillion in money market mutual funds alone.
To be sure, long-term flows have recovered quite significantly since March, as confidence in the market’s stability has returned (Exhibit 10). A mix of central bank actions and massive fiscal stimuli catalyzed a rapid surge in asset prices to pre-crisis levels. And investors did return to the market, with
close to $200 billion of net flows in North America in the second and third quarters. Yet somewhat paradoxically, despite the surge in risk-asset valuations, investors have returned primarily to the safest part of the public markets (fixed income). Equities remain in aggregate outflow for the year to the tune of $280 billion as of the third quarter. The flight to safety has proved to be an extended one for a meaningful pool of assets. We estimate that an additional $1.3 trillion in assets previously invested in third-party investment portfolios (and $780 billion in money market mutual funds) remain on the sidelines as of September 2020.
Winners and losers amidst volatility Passive strategies have also been a beneficiary of the recovery since late March. Passive strategies and ETFs (particularly those featuring fixed income) have captured a meaningful share of the recovery in positive flows to date, gathering $205 billion in positive flows through the third quarter. On the face of it, active flows appear to have kept pace with passive in the recovery ($209 billion in positive flows through the third quarter). But below the surface, the active story is almost entirely driven by a resurgence in active fixed-income net flows after April.
The real winner of 2020 sat at the intersection of fixed-income and passive-oriented vehicles. Fixed-income ETFs have been on a roll in the six months since March (Exhibit 11). Globally, fixed-income ETFs have grown to $1.4 trillion in AUM as of September 2020. ETFs overall have performed extremely well through the crisis, with positive and relatively stable monthly flows despite a brief period of net outflows from fixed-income ETFs in
In previous years, we’ve explained the industry’s performance by falling back on the familiar “It’s the economy, stupid.” This time, that explanation was flat-out wrong. In 2020, more so than in any other year, it was the market and not the economy that called the shots.
12 Across the Great Divide: North American asset management in a year of many shocks but few surprises
1 Mutual Funds & ETFs2 Includes equity, multi-asset and �xed income. Excludes convertibles, alternatives and commodities. Excludes fund of fundsSource: McKinsey Performance Lens Global Asset Management Survey
Equity Multi assetFixed income
-46
MarJan AugFeb
-128
Apr JulMay OctJun Sep
-22 31
685
389
31 -51 -117 -49
3372 2823 -328 3
-8
66 36
-4-70
731
340
475
Monthly net ows by asset class1
2020 year to date, $ billion
Exhibit 10
While long-term �ows have recovered somewhat from massive net out�ows in March, signi�cant money remains on the sidelines
Long-termows2
As of October 2020
As of October 2019
Moneymarket
1 Total number of shares or contracts traded for the period.2 ETF net �ows as % of mutual fund + ETF total net �ows.Source: Morningstar; McKinsey analysis
35 77 48 38 4128
AprJan AugMayFeb
35
Mar JulJun Sep Oct
4811 9 45 30
5639 34 29
OtherFixed incomeEquity
335
ThroughOctober 2019
ThroughOctober 2020
224
38% 50% 28% 36% 39%36%
32 33 36
32% 29% 35%
33
31%
401254
34%25%
Trade volume1
Billions of trades
ETFs as % of total positive �ows2
Cumulative net �ows 2020 year to date, $ billion
Monthly net �ows2020 year to date, $ billion
Exhibit 11
ETFs, particularly in �xed income, have been a big bene�ciary during the crisis.
Growth of North American ETF market in 2020
13Across the Great Divide: North American asset management in a year of many shocks but few surprises
March. Ironically, fixed-income ETF growth appears to have been accelerated by disruptions in the fixed-income markets in March, as an increasing number of institutional and institutional-like investors adopted these instruments as a tool for portfolio positioning, price discovery, and liquidity in a time of volatile markets.
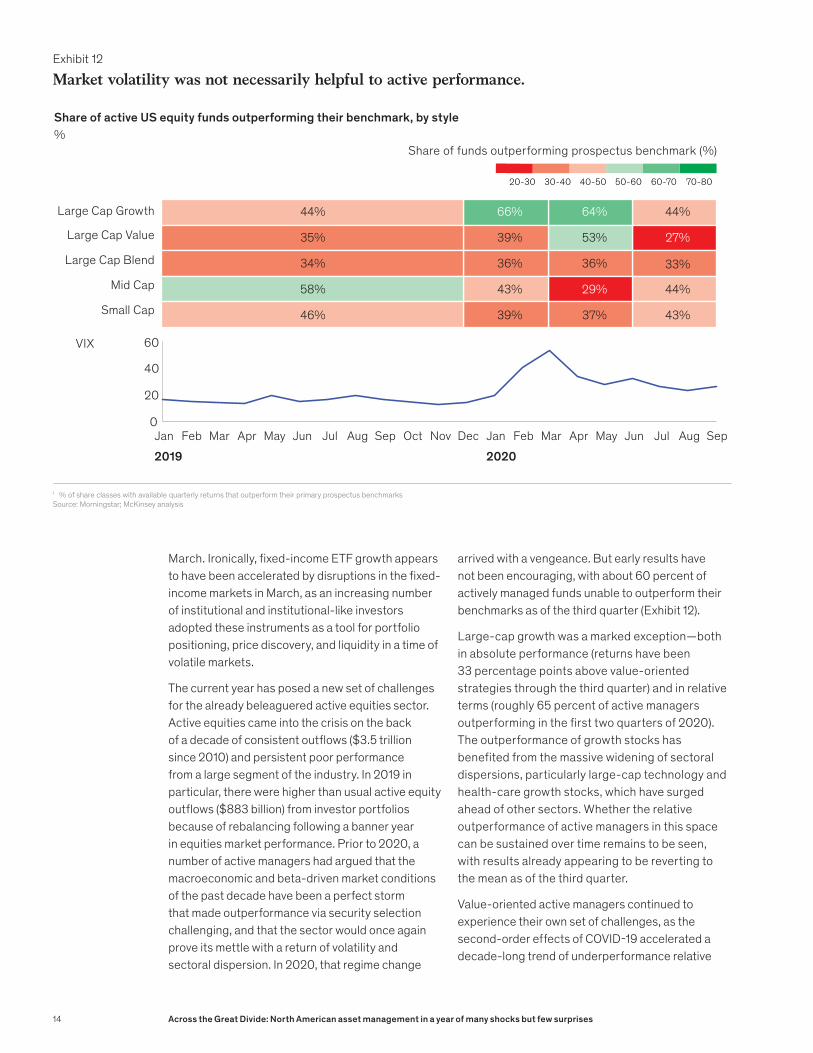
The current year has posed a new set of challenges for the already beleaguered active equities sector. Active equities came into the crisis on the back of a decade of consistent outflows ($3.5 trillion since 2010) and persistent poor performance from a large segment of the industry. In 2019 in particular, there were higher than usual active equity outflows ($883 billion) from investor portfolios because of rebalancing following a banner year in equities market performance. Prior to 2020, a number of active managers had argued that the macroeconomic and beta-driven market conditions of the past decade have been a perfect storm that made outperformance via security selection challenging, and that the sector would once again prove its mettle with a return of volatility and sectoral dispersion. In 2020, that regime change
arrived with a vengeance. But early results have not been encouraging, with about 60 percent of actively managed funds unable to outperform their benchmarks as of the third quarter (Exhibit 12).
Large-cap growth was a marked exception—both in absolute performance (returns have been 33 percentage points above value-oriented strategies through the third quarter) and in relative terms (roughly 65 percent of active managers outperforming in the first two quarters of 2020). The outperformance of growth stocks has benefited from the massive widening of sectoral dispersions, particularly large-cap technology and health-care growth stocks, which have surged ahead of other sectors. Whether the relative outperformance of active managers in this space can be sustained over time remains to be seen, with results already appearing to be reverting to the mean as of the third quarter.
Value-oriented active managers continued to experience their own set of challenges, as the second-order effects of COVID-19 accelerated a decade-long trend of underperformance relative
1 % of share classes with available quarterly returns that outperform their primary prospectus benchmarksSource: Morningstar; McKinsey analysis
2019 2020AugJul
40
0
20
60
AprFebJan Feb Mar Apr May SepJun Sep Oct Nov Dec Jan AugMar May Jun Jul
Large Cap Growth
Large Cap Value
Large Cap Blend
Mid Cap
Small Cap
VIX
44%
34%
35%
58%
46% 39%
39%
36%
66%
43%
37%
53%
36%
64%
29%
43%
27%
33%
44%
44%
Share of funds outperforming prospectus benchmark (%)
70-8060-7050-6040-5030-4020-30
Share of active US equity funds outperforming their benchmark, by style%
Exhibit 12
Market volatility was not necessarily helpful to active performance.
14 Across the Great Divide: North American asset management in a year of many shocks but few surprises
to growth managers. Value has underperformed growth by close to 3 percent on an annualized basis over the past decade, a duration and magnitude that has been historically anomalous and likely driven by an unusual secular environment of lower inflation and lower interest rates.1 COVID-19 accelerated this trend, as the “work from home” environment provided a shot in the arm to traditional growth sectors (e.g., technology, pharmaceuticals) while unleashing massive disruptions across traditional value sectors (e.g., travel, energy, financials). The asymmetries in these factors had a disproportionate impact on active equities managers in North America. Some 17 percent of the total stock of active equity assets resides in value strategies and these funds accounted for 21 percent of active equity manager outflows.
To be sure, a small number of active managers managed to take advantage of these shifts and were rewarded for their performance. The top 10 active equity funds in North America gathered about $48
1 Howard R. Gold, “The value-stock premium is shrinking,” Chicago Booth Review, June 2020.
billion of flows. For the majority of the industry that struggled with performance, 2020 has been yet another year of challenges.
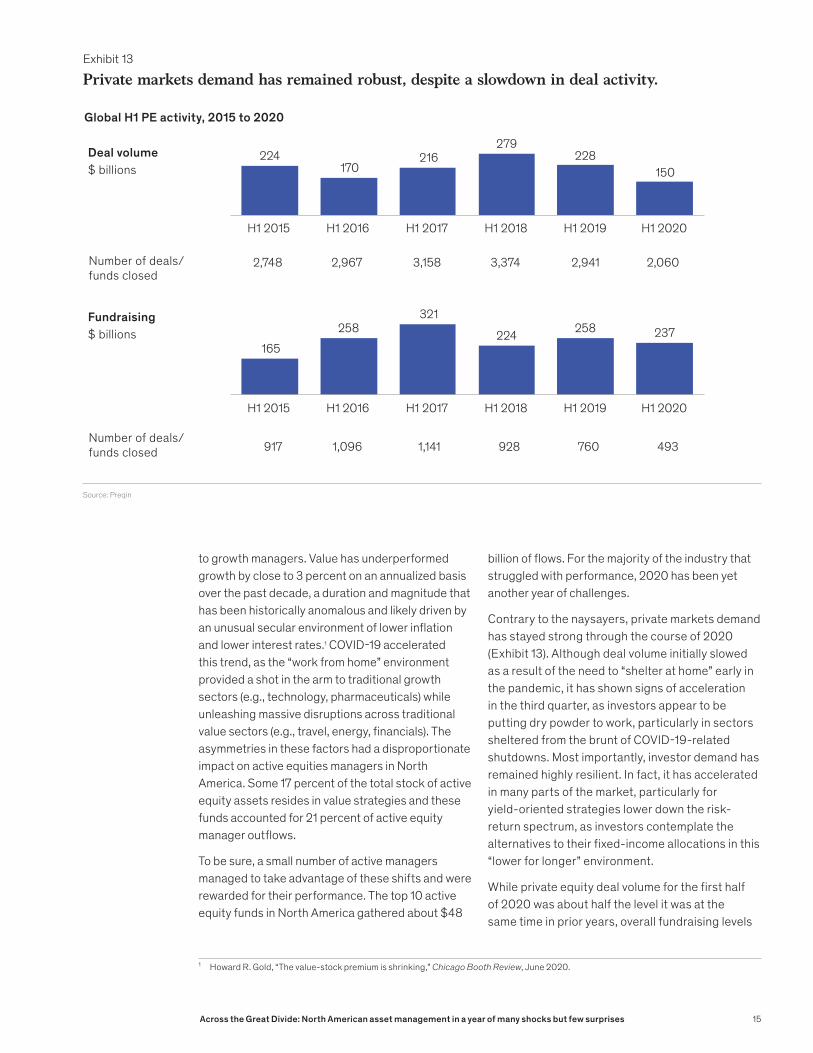
Contrary to the naysayers, private markets demand has stayed strong through the course of 2020 (Exhibit 13). Although deal volume initially slowed as a result of the need to “shelter at home” early in the pandemic, it has shown signs of acceleration in the third quarter, as investors appear to be putting dry powder to work, particularly in sectors sheltered from the brunt of COVID-19-related shutdowns. Most importantly, investor demand has remained highly resilient. In fact, it has accelerated in many parts of the market, particularly for yield-oriented strategies lower down the risk-return spectrum, as investors contemplate the alternatives to their fixed-income allocations in this “lower for longer” environment.
While private equity deal volume for the first half of 2020 was about half the level it was at the same time in prior years, overall fundraising levels
Source: Preqin
Deal volume$ billions
Number of deals/funds closed
Number of deals/funds closed
Fundraising$ billions
224170
216279
228150
165258
321
224 258 237
H1 2020H1 2015 H1 2019H1 2016 H1 2017 H1 2018
H1 2020H1 2015 H1 2019H1 2016 H1 2017 H1 2018
2,748
917
2,967
1,096
3,158
1,141
2,941
760
2,060
493
3,374
928
Global H1 PE activity, 2015 to 2020
Exhibit 13
Private markets demand has remained robust, despite a slowdown in deal activity.
15Across the Great Divide: North American asset management in a year of many shocks but few surprises
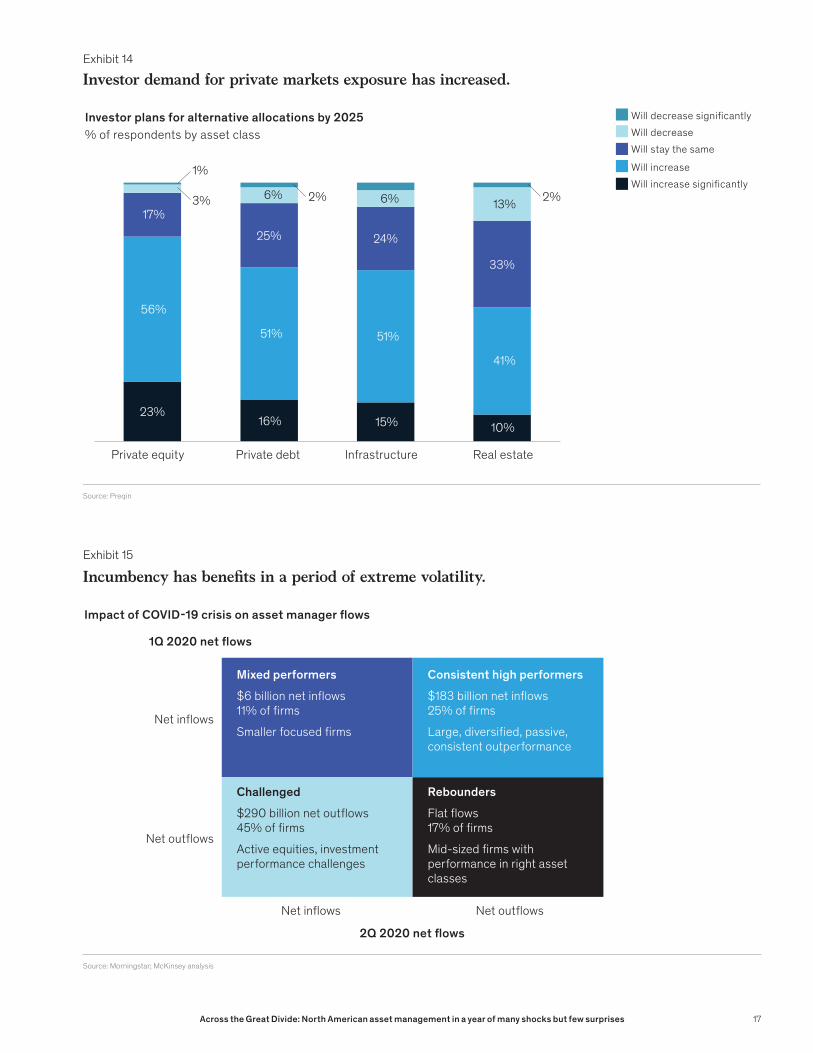
have remained stable. Globally, private equity funds raised $237 billion in the first half of the year, similar to the same period in 2018 and 2019. Larger funds continued to capture more than their fair share of commitments in the first half of 2020, as clients sought investors who can deploy capital quickly and at scale to take advantage of opportunities amid variable economic conditions. Looking forward, institutional investor demand for private markets asset classes has increased through the crisis; for example, almost 80 percent of investors plan to increase their allocations to private equity and close to 70 percent report intentions to increase allocations to private debt and infrastructure (Exhibit 14).
A flight to strength (and familiarity)How did the pressures of the first half of 2020 play out in the competitive landscape of North American asset management? Here too we witnessed the opening of yet another great divide: a widening gap between best and the rest as clients and investors gravitated towards a relatively small group of managers—those whom they believe had the skill, stability, and breadth of capabilities to navigate a year of extreme uncertainty.
Exhibit 15 characterizes how North American asset management fund families fared in the downturn of markets in the first quarter and the rebound that followed in the second quarter. Firms in the top-right quadrant of the chart were “consistent high performers” throughout the first half of the year, across two wildly different market and operating environments. These firms saw $183 billion in net inflows through the first two quarters of 2020. Although these high performers represented a seemingly representative sample of 25 percent of all firms in the industry, 80 percent of the flows to this group went to just 10 asset managers. Firms that managed to maintain a consistent growth trajectory through this disruption were typically large and diversified, had track records of consistent outperformance, and often offered the passive investment strategies that benefitted from an environment of rapid rebalancing. Part of this group’s success can be attributed to a unique sales-related dynamic stemming from the massive global shift to working from home. In the absence of in-person meetings, many clients defaulted to familiar, well-established relationships with incumbents.
The converse of these dynamics were experienced by the “mixed performers”—a set of smaller firms that entered the crisis with significant growth momentum. For these firms, representing some 11 percent of North American asset managers, the crisis created a new set of obstacles that slowed their trajectories. For example, the remote environment made it difficult for them to win new business via new clients and relationships, and their limited product shelves made it harder for them to pivot to meet new client needs. Yet, the momentum of this group did not stop completely as they netted $6 billion of new money across both quarters.
“Rebounders”—firms that were in outflows pre-crisis, but managed to turn the crisis into an inflection point and rally in the second quarter—eked out flat organic growth in the first half of the year. Representing some 17 percent of firms in the industry, this segment consisted largely of mid-sized firms with good investment performance and well-positioned products with strong client demand, as well as agile smaller firms that leaned into their strengths.
“Challenged” firms—the final category—were already experiencing the outflows wrought by long-standing industry pressures, which only intensified in strength with the onset of the crisis. Some 45 percent of the industry fell into this group. Active equities-focused firms with challenged investment performance and facing other internal disruptions were heavily represented here. In the first half of the year, this group of managers suffered $290 billion in net outflows, exceeding the inflows taken in by all other segments by over 50 percent and further widening the “Great Divide” of industry performance.
This divide has been reflected in the capital markets’ view of the asset management sector (Exhibit 16). Despite the industry’s financials having fared relatively well in the year to date, asset manager valuations have taken a hit. The gap between the industry’s forward P/E multiples and the S&P 500 has widened significantly, growing from 6.9x at the start of the year to 12x as of the end of the third quarter.
Dig a little deeper and it is clear that a large part of this valuation gap is driven by a divide in perceived performance and prospects within the industry. The valuation spread between top- and bottom-quartile asset managers has generally widened over time—
16 Across the Great Divide: North American asset management in a year of many shocks but few surprises
Source: Preqin
Investor plans for alternative allocations by 2025% of respondents by asset class
23%16% 15% 10%
56%
51% 51%
41%
17%
25% 24%
33%
6% 6% 13%
1%
2%
Private equity InfrastructurePrivate debt Real estate
3% 2%
Will decrease signi�cantlyWill decreaseWill stay the same
Will increaseWill increase signi�cantly
Exhibit 14
Investor demand for private markets exposure has increased.
Source: Morningstar; McKinsey analysis
Net inows
Net inows
Net outows
Net outows
Impact of COVID-19 crisis on asset manager ows
1Q 2020 net ows
2Q 2020 net ows
Mixed performers
$6 billion net inows11% of �rms
Smaller focused �rms
Challenged
$290 billion net outows45% of �rms
Active equities, investment performance challenges
Consistent high performers
$183 billion net inows25% of �rms
Large, diversi�ed, passive, consistent outperformance
Rebounders
Flat ows17% of �rms
Mid-sized �rms with performance in right asset classes
Exhibit 15
Incumbency has bene�ts in a period of extreme volatility.
17Across the Great Divide: North American asset management in a year of many shocks but few surprises
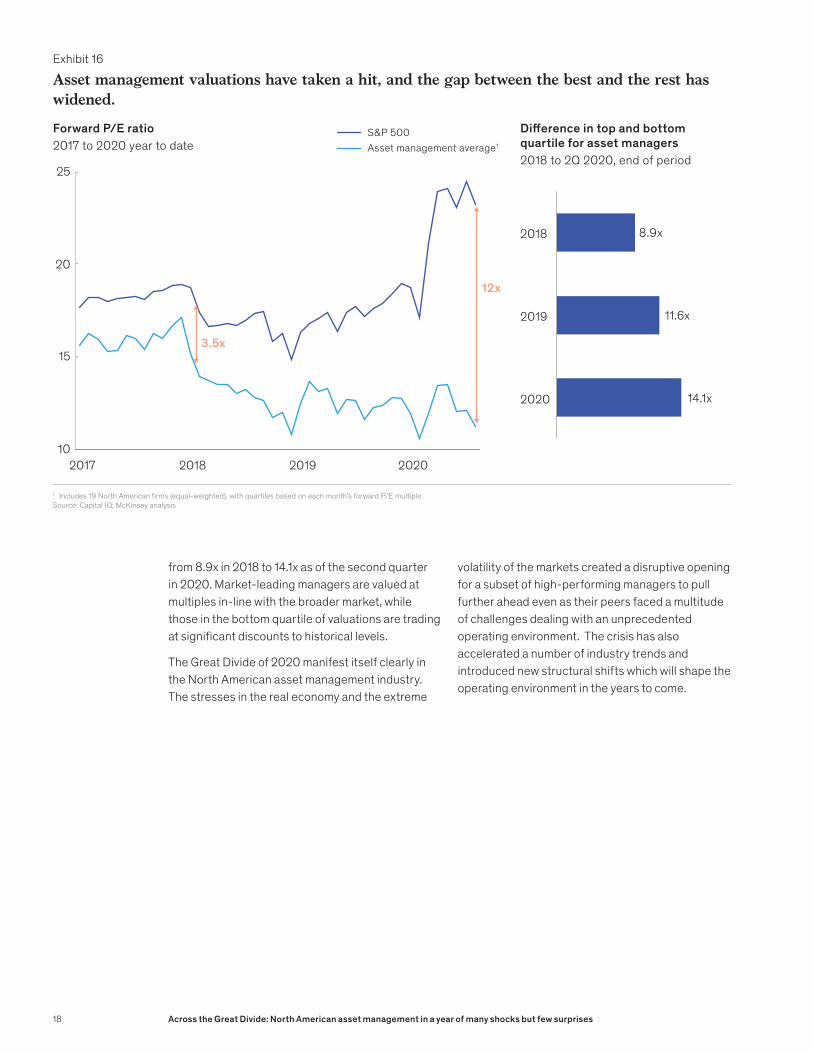
from 8.9x in 2018 to 14.1x as of the second quarter in 2020. Market-leading managers are valued at multiples in-line with the broader market, while those in the bottom quartile of valuations are trading at significant discounts to historical levels.
The Great Divide of 2020 manifest itself clearly in the North American asset management industry. The stresses in the real economy and the extreme
volatility of the markets created a disruptive opening for a subset of high-performing managers to pull further ahead even as their peers faced a multitude of challenges dealing with an unprecedented operating environment. The crisis has also accelerated a number of industry trends and introduced new structural shifts which will shape the operating environment in the years to come.
1 Includes 19 North American �rms (equal-weighted), with quartiles based on each month’s forward P/E multiple.Source: Capital IQ; McKinsey analysis
Forward P/E ratio2017 to 2020 year to date
Di�erence in top and bottom quartile for asset managers2018 to 2Q 2020, end of period
8.9x
11.6x
14.1x2020
2018
2019
Asset management average1
S&P 500
15
10
20
25
2017 2018 2019 2020
3.5x
12x
Exhibit 16
Asset management valuations have taken a hit, and the gap between the best and the rest has widened.
18 Across the Great Divide: North American asset management in a year of many shocks but few surprises

Durable shifts in the industry
Asset managers navigating the eventual post-pandemic environment will need to determine how to position themselves against five major shifts which we outline in this chapter: 1) The emergence of new paradigms of investing; 2) A reshuffling of sources of capital; 3) Renewed pressure on asset management operating models; 4) An acceleration of industry consolidation; and 5) A pressing need to rethink the industry’s social purpose.
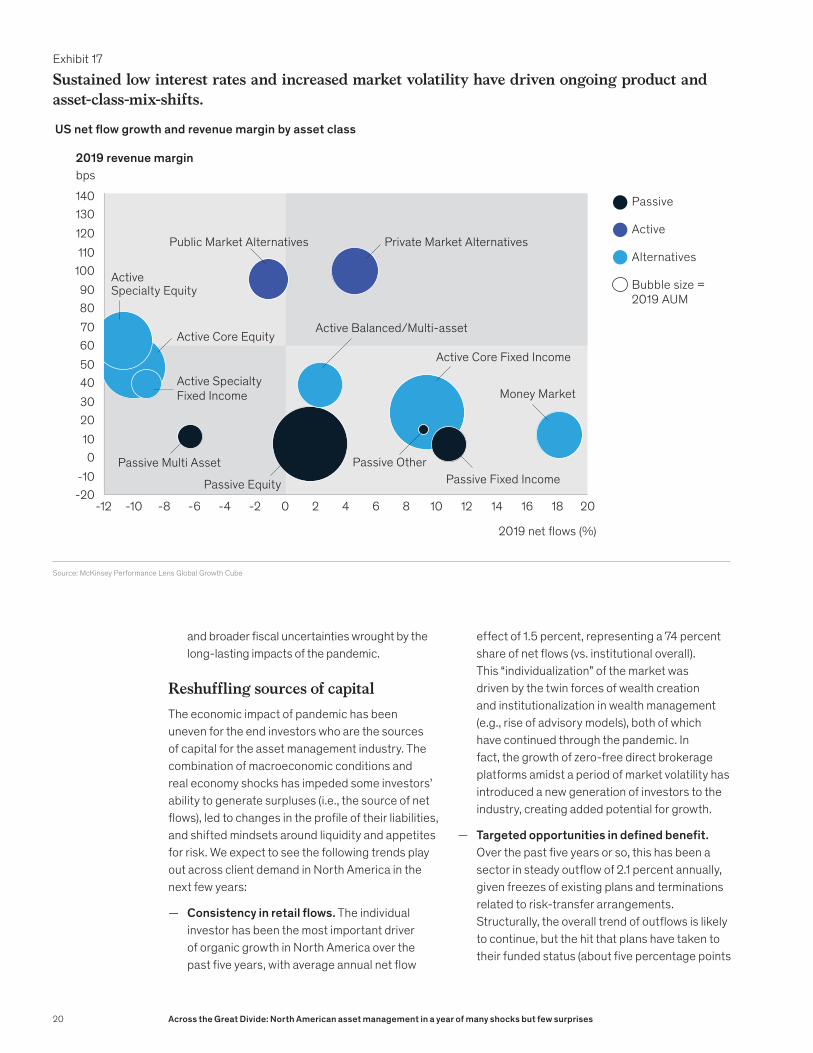
New paradigms of investingDisruptions triggered by the COVID-19 economy have accelerated an evolution of the craft of investing that had already been underway pre-pandemic. This evolution includes the adoption of risk-factor-oriented approaches in portfolio construction (e.g., looking beyond traditional asset class and sectoral boundaries), a focus on total portfolio outcomes over relative returns, liability-sensitive investment approaches, and a greater appetite for harvesting illiquidity premia. These new approaches to investing had already been reshaping product demand in previous years (Exhibit 17). Going forward, they will create new fast-flowing rivers of growth for the industry in some of the following areas:
— Massive appetite for non-traditional sources of yield as substitutes for fixed income in a world where interest rates remain at or near zero for an extended period. This dynamic will likely create continued upside in growth areas like private credit and real assets
— Continued momentum for multi-asset strategies, particularly those that look across and between the lines of traditional asset classes to deliver both relative returns and yield (e.g., dividend/income-generating equities, private/public strategies)
— Sustained appetite for return-oriented private markets strategies such as buyouts and growth equity. These have a combination of nimbleness and scale that will enable them to ride major shifts in the economy and reposition assets in favor of secular trends
— Renewed interest in strategies that navigate volatility, including new opportunities for some hedge funds and related strategies (particularly global macro and multi-strategy) which are agile enough to naturally take advantage of market dislocations. They can do that while managing increased swings brought on by unpredictable shifts in macroeconomic factors
— Shift to “whole portfolio” solutions by small and mid-sized investors (both intermediaries and institutions), who will increasingly seek out partners to help manage asset allocation and implementation. This will drive the continued uptake of model portfolios in intermediary channels and investment outsourcing for smaller institutions
— Demand for tax-efficient solutions by retail investors, given the confluence of an increased capital gains drag from recent market momentum
It has become of a bit of a cliché to say that the pandemic has accelerated trends that were already underway. But in every cliché there is a grain of truth. For the asset management industry, the shock to the real economy, the volatility of markets, and the intensified focus on social issues emerging from the pandemic have set off a cascade of second- and third-order effects which are indeed amplifying industry trends that have been in motion for several years.
19Across the Great Divide: North American asset management in a year of many shocks but few surprises
and broader fiscal uncertainties wrought by the long-lasting impacts of the pandemic.
Reshuffling sources of capitalThe economic impact of pandemic has been uneven for the end investors who are the sources of capital for the asset management industry. The combination of macroeconomic conditions and real economy shocks has impeded some investors’ ability to generate surpluses (i.e., the source of net flows), led to changes in the profile of their liabilities, and shifted mindsets around liquidity and appetites for risk. We expect to see the following trends play out across client demand in North America in the next few years:
— Consistency in retail flows. The individual investor has been the most important driver of organic growth in North America over the past five years, with average annual net flow
effect of 1.5 percent, representing a 74 percent share of net flows (vs. institutional overall). This “individualization” of the market was driven by the twin forces of wealth creation and institutionalization in wealth management (e.g., rise of advisory models), both of which have continued through the pandemic. In fact, the growth of zero-free direct brokerage platforms amidst a period of market volatility has introduced a new generation of investors to the industry, creating added potential for growth.
— Targeted opportunities in defined benefit. Over the past five years or so, this has been a sector in steady outflow of 2.1 percent annually, given freezes of existing plans and terminations related to risk-transfer arrangements. Structurally, the overall trend of outflows is likely to continue, but the hit that plans have taken to their funded status (about five percentage points
Source: McKinsey Performance Lens Global Growth Cube
-10
-4
10
6-6
130120
-8
0
2030
-12 -10
40
-2 0 2
5060
4
90
188
70
100110
10
140
12 14 16 20-20
80
Passive Other
Passive Equity
Money Market
Active Balanced/Multi-asset
Active Core Fixed Income
Passive Fixed Income
Active SpecialtyFixed Income
Passive Multi Asset
2019 net �ows (%)
Public Market Alternatives
Active Core Equity
Active Specialty Equity
Private Market Alternatives
US net �ow growth and revenue margin by asset class
2019 revenue marginbps
Passive
Active
Alternatives
Bubble size = 2019 AUM
Exhibit 17
Sustained low interest rates and increased market volatility have driven ongoing product and asset-class-mix-shifts.
20 Across the Great Divide: North American asset management in a year of many shocks but few surprises
since the start of the year) creates an urgent need for yield and ongoing market volatility could unlock latent demand for outsourcing to third-party managers.
— Deceleration in defined contribution. Previously a growth engine in North America (1.8 percent annual average net flows over the last five years), the defined contribution market could see a near-term slowdown in light of the over 25 million jobs lost in the United States between February and April. Pressure will be heightened by the potential for growth in early withdrawals if labor market challenges persist and with continued regulatory attention continuing to put a lid on pricing.
— Pull-back in endowments and foundations. Previously a highly resilient source of patient capital, this segment faces pressure in the pandemic economy with increased demand for drawdowns by their beneficiaries. The higher education sector in particular could be heavily impacted; should the effects of the pandemic persist, the growth trend in this segment over the past five years (1.5 percent annual average net flows) could be reversed.
— Growth in insurance general accounts. With their longer-dated liabilities and the challenge of generating surpluses in a low-rate environment, insurance general accounts face increased pressure to rethink their investment models in favor of moving up the credit spectrum and in the direction of more illiquid assets. The increased complexity of the operating environment could also catalyze a new wave of investment outsourcing, accelerating the organic growth of this segment beyond its historical five-year average of 2.4 percent.
Renewed pressure on operating models Industry leaders have spoken for years about the need for the asset management industry to transition to a “next-generation operating model” that better responds to client needs and generates greater scalability for their businesses. Advances in data, analytics, and technology, in particular, are said to offer the promise of the fully digitized asset manager that delivers superior performance with massive operating leverage.
But the rhetoric has not been matched by action, as many in the industry have been content with making tweaks around the edges. Many asset managers
continue to operate in vertical functional silos with fiercely independent (and often overlapping) portfolio management teams, a structure that creates a natural resistance to sharing of data, analytics, or even infrastructure and execution capabilities (e.g., trading). In distribution, the industry as a whole has been slow to embrace the possibilities of digitally-led selling models, preferring to augment a tried and tested approach of “feet on the street.” And in the back and middle office, “best of breed” systems have become a euphemism for lack of connectivity, which generates a high-degree of manual processing and hampers flexibility and innovation.
The current environment has been a catalyst for operating model innovation. For example, the sudden shift to working from home forced a new reality of remote and digital sales models and opened up new possibilities for distribution powered by geographically dispersed teams. Since the onset of the pandemic, the market has also spoken in two important ways. First, clients have signaled that they are more than receptive to remote sales and service models and expect their best elements to remain in place once the pandemic ends. Second, these clients are also signaling that asset managers have some way to go in recalibrating their operating models.
For example, in a recent McKinsey survey, financial advisors indicated that their satisfaction with their asset management partners fell by nearly one-third, driven by dissatisfaction with every type of remote interaction from one-on-one online meetings to emails. This should serve as a cautionary tale for what happens when asset managers try to jam a traditional sales model through a digital interface.
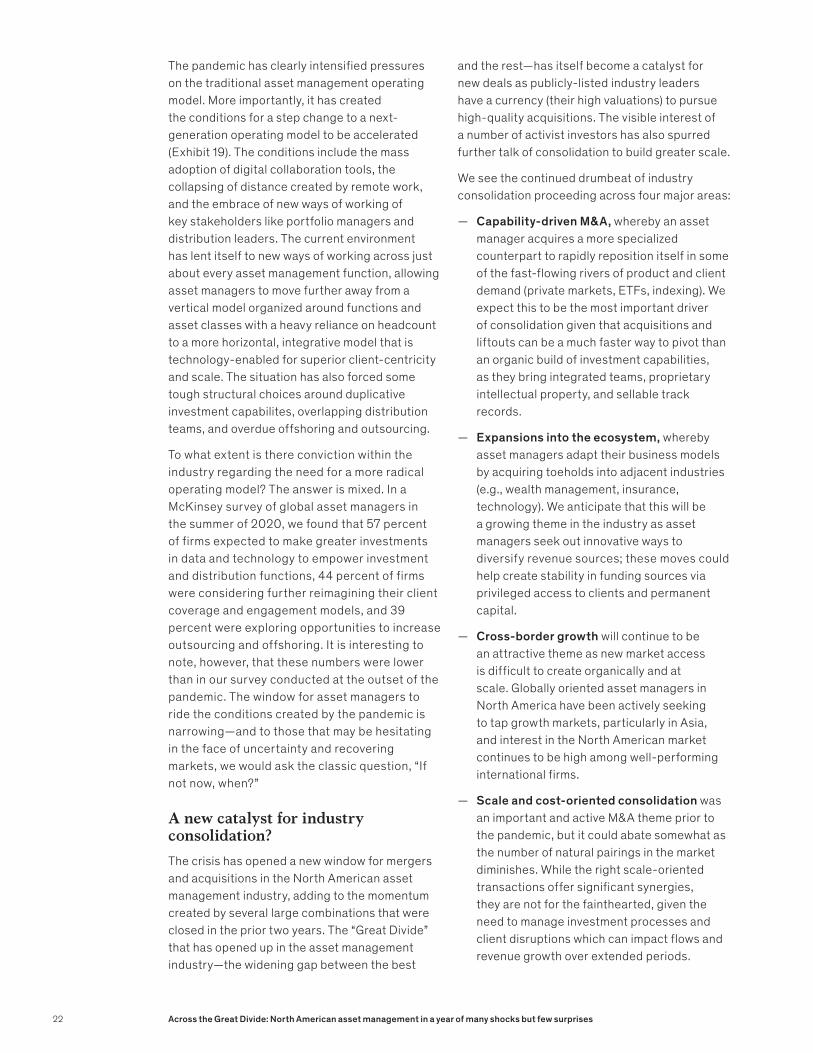
Managers who got their remote operating models right benefitted tremendously. Asset managers with the strongest digital and remote capabilities saw sales and service satisfaction climb by four percentage points relative to their performance a year earlier. Conversely, those that had strong field capabilities but struggled to adapt to a digital-led operating model, saw satisfaction drop by similar amounts. Most importantly, these differences translated into tangible sales impact, with digital leaders achieving a 14-percentage-point gross sales lead relative to their more traditional counterparts. It appears that the pandemic has also opened up a great digital divide in distribution (Exhibit 18).
21Across the Great Divide: North American asset management in a year of many shocks but few surprises
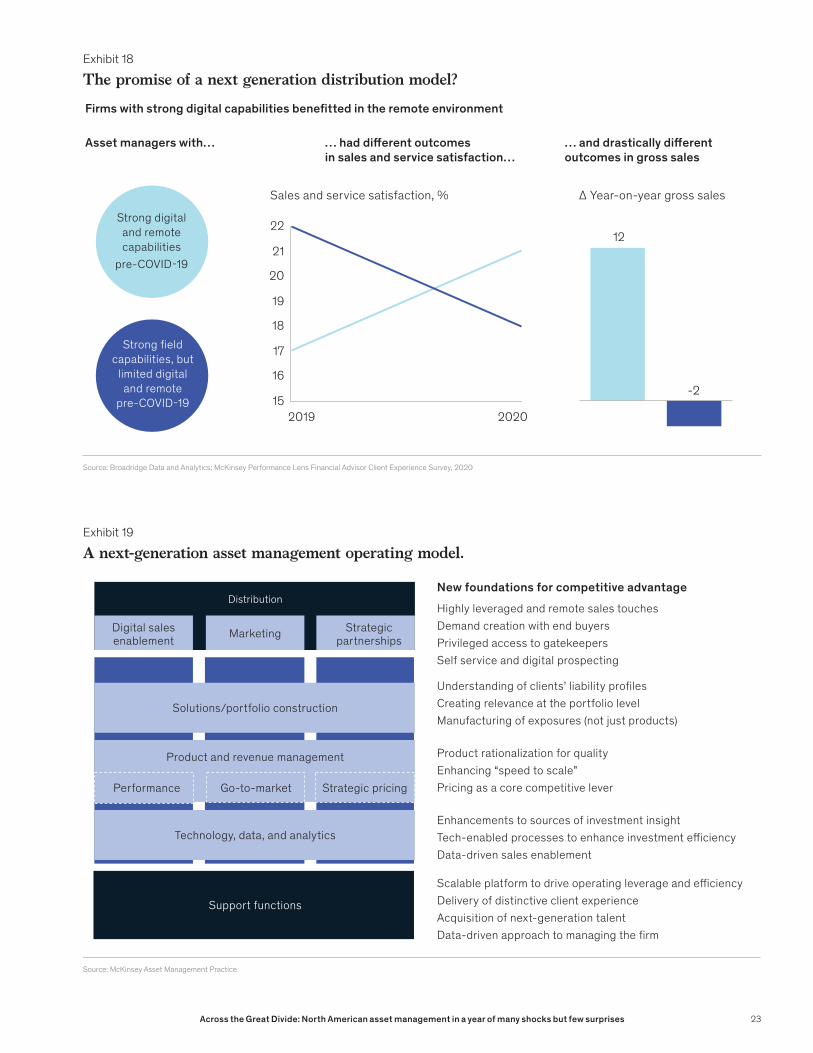
The pandemic has clearly intensified pressures on the traditional asset management operating model. More importantly, it has created the conditions for a step change to a next-generation operating model to be accelerated (Exhibit 19). The conditions include the mass adoption of digital collaboration tools, the collapsing of distance created by remote work, and the embrace of new ways of working of key stakeholders like portfolio managers and distribution leaders. The current environment has lent itself to new ways of working across just about every asset management function, allowing asset managers to move further away from a vertical model organized around functions and asset classes with a heavy reliance on headcount to a more horizontal, integrative model that is technology-enabled for superior client-centricity and scale. The situation has also forced some tough structural choices around duplicative investment capabilites, overlapping distribution teams, and overdue offshoring and outsourcing.
To what extent is there conviction within the industry regarding the need for a more radical operating model? The answer is mixed. In a McKinsey survey of global asset managers in the summer of 2020, we found that 57 percent of firms expected to make greater investments in data and technology to empower investment and distribution functions, 44 percent of firms were considering further reimagining their client coverage and engagement models, and 39 percent were exploring opportunities to increase outsourcing and offshoring. It is interesting to note, however, that these numbers were lower than in our survey conducted at the outset of the pandemic. The window for asset managers to ride the conditions created by the pandemic is narrowing—and to those that may be hesitating in the face of uncertainty and recovering markets, we would ask the classic question, “If not now, when?”
A new catalyst for industry consolidation?The crisis has opened a new window for mergers and acquisitions in the North American asset management industry, adding to the momentum created by several large combinations that were closed in the prior two years. The “Great Divide” that has opened up in the asset management industry—the widening gap between the best
and the rest—has itself become a catalyst for new deals as publicly-listed industry leaders have a currency (their high valuations) to pursue high-quality acquisitions. The visible interest of a number of activist investors has also spurred further talk of consolidation to build greater scale.
We see the continued drumbeat of industry consolidation proceeding across four major areas:
— Capability-driven M&A, whereby an asset manager acquires a more specialized counterpart to rapidly reposition itself in some of the fast-flowing rivers of product and client demand (private markets, ETFs, indexing). We expect this to be the most important driver of consolidation given that acquisitions and liftouts can be a much faster way to pivot than an organic build of investment capabilities, as they bring integrated teams, proprietary intellectual property, and sellable track records.
— Expansions into the ecosystem, whereby asset managers adapt their business models by acquiring toeholds into adjacent industries (e.g., wealth management, insurance, technology). We anticipate that this will be a growing theme in the industry as asset managers seek out innovative ways to diversify revenue sources; these moves could help create stability in funding sources via privileged access to clients and permanent capital.
— Cross-border growth will continue to be an attractive theme as new market access is difficult to create organically and at scale. Globally oriented asset managers in North America have been actively seeking to tap growth markets, particularly in Asia, and interest in the North American market continues to be high among well-performing international firms.
— Scale and cost-oriented consolidation was an important and active M&A theme prior to the pandemic, but it could abate somewhat as the number of natural pairings in the market diminishes. While the right scale-oriented transactions offer significant synergies, they are not for the fainthearted, given the need to manage investment processes and client disruptions which can impact flows and revenue growth over extended periods.
22 Across the Great Divide: North American asset management in a year of many shocks but few surprises
Source: Broadridge Data and Analytics; McKinsey Performance Lens Financial Advisor Client Experience Survey, 2020
Firms with strong digital capabilities bene�tted in the remote environment
Asset managers with… … had di�erent outcomes in sales and service satisfaction…
… and drastically di�erent outcomes in gross sales
Strong digital and remote capabilities
pre-COVID-19
Strong �eld capabilities, but
limited digital and remote
pre-COVID-19
20
15
17
2019
19
2020
18
16
21
22
Sales and service satisfaction, % ∆ Year-on-year gross sales
12
-2
Exhibit 18
The promise of a next generation distribution model?
Source: McKinsey Asset Management Practice
Distribution
Support functions
Digital salesenablement Marketing Strategic
partnerships
Asset Class 1 Asset Class 3
Solutions/portfolio construction
Product and revenue management
Performance Strategic pricing
Technology, data, and analytics
Go-to-market
New foundations for competitive advantageHighly leveraged and remote sales touches Demand creation with end buyersPrivileged access to gatekeepersSelf service and digital prospecting
Scalable platform to drive operating leverage and e�ciencyDelivery of distinctive client experienceAcquisition of next-generation talentData-driven approach to managing the �rm
Understanding of clients’ liability pro�lesCreating relevance at the portfolio levelManufacturing of exposures (not just products)
Product rationalization for qualityEnhancing “speed to scale” Pricing as a core competitive lever
Enhancements to sources of investment insight Tech-enabled processes to enhance investment e�ciencyData-driven sales enablement
Exhibit 19
A next-generation asset management operating model.
23Across the Great Divide: North American asset management in a year of many shocks but few surprises
Rethinking asset management’s social purpose In the past few years, there has been an intensifying conversation on the role of business in society, in particular around the question of how traditional models of shareholder capitalism might need to be adapted to the realities of a new age. The events of 2020 have only sharpened the tone and profile of these debates.
With its critical role in being responsible for nearly half of global managed assets, North American asset management sits at the fulcrum of this conversation. The industry is the beating heart of capital allocation—channeling funds from investors and retirement savers to support investment, jobs, and growth—and the engine for the generation of returns and management of risk that are critical to the financial well-being of millions.
The social purpose of the asset management industry is not simply a set of abstract philosophical questions. It is a set of issues with pragmatic consequence for business leaders. Asset managers’ clients and their employees are holding them to a standard that rises increasingly above and beyond the dictum of “do no harm.” And some of these stakeholders are voting with their feet, channeling both financial and human capital to firms with a clear purpose.
We believe that three sets of issues will be central to defining the broader role of the asset management industry in the years to come: financial security, socially responsible investing, and diversity and inclusion.
Financial security COVID-19 has engendered a near-term healthcare and economic crisis, but in the longer-term it will deepen a crisis in retirement security that has been many years in the making. Americans filing for weekly unemployment benefits peaked at 25 million at the beginning of the summer, with filing rates remaining around 7 million in recent weeks, still four times greater than a year earlier. Americans are thus not just taking a near-term hit to their livelihoods, but also facing a longer-term impact on their retirement savings—a loss of 401(k) matches and an uptick in plan withdrawals to meet critical liquidity needs.
2 Zorast Wadia and Charles J. Clark, “Pension Funding Index November 2020,” Millman.com, November 2020.3 Barbara Zhan, Jeffrey N. Saret, and Subhadeep Mitra, “Investment Return Assumptions of Public Pension Funds,” Twosigma.com, March
2016.4 Danielle Walker and Billy Nauman, “Ethnic and Racial Diversity at Asset Management Firms,” www.mminst.org, Fall 2017
Even those covered by defined benefit retirement plans have been affected by the crisis. Since the start of the year, the average funded status of US corporate defined benefit plans has fallen by 4.7 percent, driven in a large part by declines in discount rates.2 And public defined benefit plans, which have struggled to earn returns above their actuarially required rate of 7.2 percent (with actual long-term average returns of 5.7 percent),3 will face a new set of challenges meeting this hurdle in the low-interest-rate environment.
With the looming long-term gap in retirement readiness, asset managers have a critical role to play in retirement security: working with pension funds of all types to close funding gaps and shore up their resilience in delivering benefits; delivering innovative, customized retirement savings and income products; and continuing to democratize affordable access to a broader range of returns engines across the public and private markets.
Diversity and inclusionThe events of 2020 have been a global wake-up call on diversity and inclusion, adding particular urgency to conversations on racial injustice and gender diversity. The North American industry’s response has been positive, with senior executives across the industry redoubling their firms’ commitments on each of these fronts.
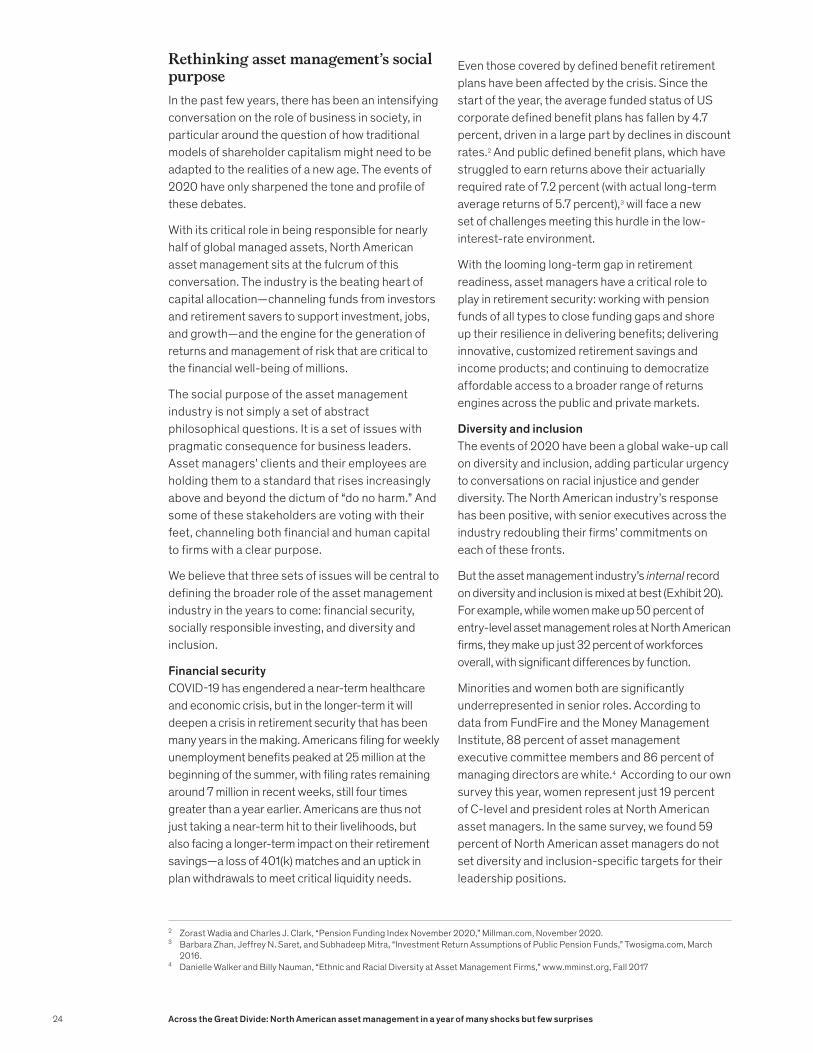
But the asset management industry’s internal record on diversity and inclusion is mixed at best (Exhibit 20). For example, while women make up 50 percent of entry-level asset management roles at North American firms, they make up just 32 percent of workforces overall, with significant differences by function.
Minorities and women both are significantly underrepresented in senior roles. According to data from FundFire and the Money Management Institute, 88 percent of asset management executive committee members and 86 percent of managing directors are white.4 According to our own survey this year, women represent just 19 percent of C-level and president roles at North American asset managers. In the same survey, we found 59 percent of North American asset managers do not set diversity and inclusion-specific targets for their leadership positions.
24 Across the Great Divide: North American asset management in a year of many shocks but few surprises
Firms are making progressive efforts, as 63 percent of North American managers have implemented policies and practices to reduce gender bias in their evaluation systems and the vast majority of asset managers globally have adapted evaluation systems for career disruptions and working flexibility choices.
But the industry needs a more fundamental shift for reasons both principled and pragmatic: McKinsey research shows that companies in the top quartile for racial and ethnic diversity were 33 percent more likely to be profitable than their peers, and companies in the top quartile for gender diversity were 21 percent more likely to have above-average profitability.5 The challenge for asset managers is to embrace diversity and inclusion as more than just a corporate and social responsibility initiative, but instead as a core ingredient of a business model that harnesses diverse views and perspectives to deliver sustainable, superior performance.
5 Vivian Hunt, Sara Prince, Sundiatu Dixon-Fyle, and Lareina Yee, “Delivering through diversity,” McKinsey.com, January 2018.
Socially responsible investingEnvironmental, social, and governance (ESG) considerations have long been a feature of asset management. But the broader focus on ensuring that asset managers deploy capital in socially responsible ways—particularly when it comes to climate risk—has been sharpened in 2020, as a slew of natural disasters in North America, from wildfires to hurricanes, coincided with growing consensus among investors that climate risk and financial risk are inextricably linked.
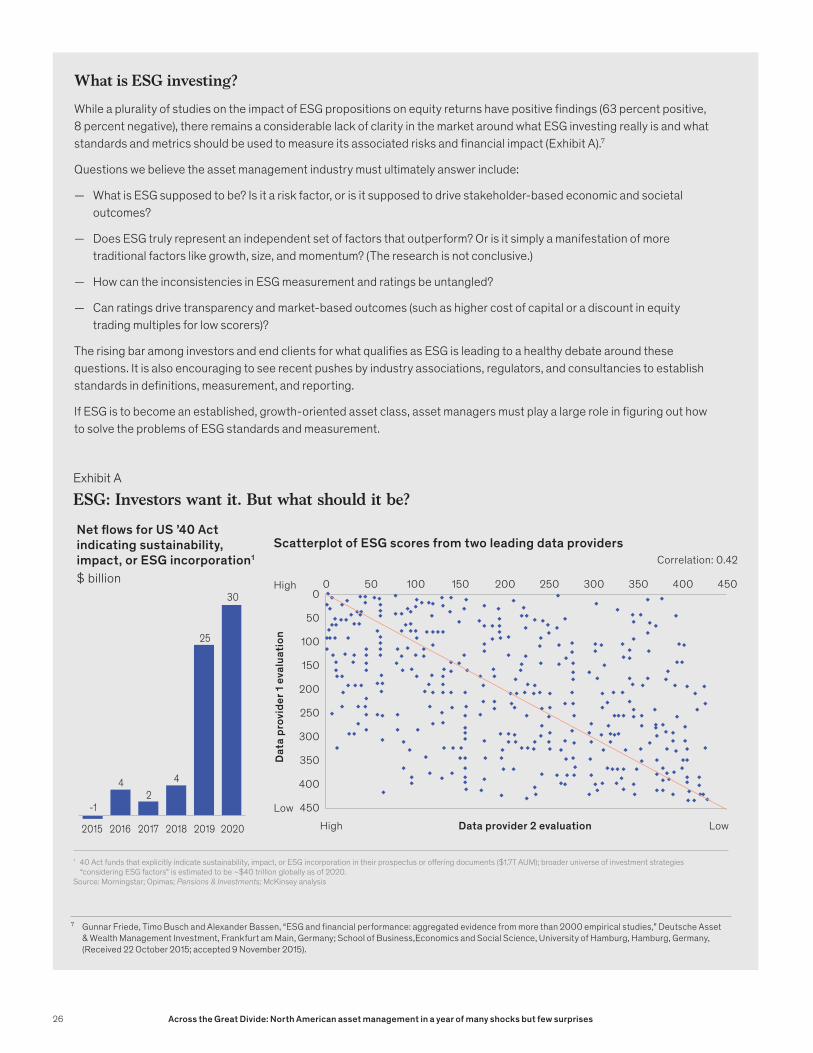
Client demand for responsible investment products has been ratcheting upwards, with a growing desire for portfolios to be built not only to optimize an individual’s risk and return, but also align with the values of a given institution or individual. In the United States, flows to sustainability, impact, and ESG-oriented funds reached record levels of $26 billion in 2019 and accelerated to hit $30 billion through the third quarter of 2020 (see sidebar “What is ESG investing?”). Asset mangers have also
Source: 2020 McKinsey Performance Lens Global Asset Management Survey
Sales and marketing
Investment management
Operations
Technology
Management and admin.
Total
Overall North America Europe
15%
44%
23%
41%
27%
31%
49%
44%
23%
33%
15%
32%
39%
23%
20%
37%
16%
29%
Women as a % of total FTEs by function
Exhibit 20
Gender diversity varies by function amongst asset managers.
25Across the Great Divide: North American asset management in a year of many shocks but few surprises
What is ESG investing?
While a plurality of studies on the impact of ESG propositions on equity returns have positive findings (63 percent positive, 8 percent negative), there remains a considerable lack of clarity in the market around what ESG investing really is and what standards and metrics should be used to measure its associated risks and financial impact (Exhibit A).7
Questions we believe the asset management industry must ultimately answer include:
— What is ESG supposed to be? Is it a risk factor, or is it supposed to drive stakeholder-based economic and societal outcomes?
— Does ESG truly represent an independent set of factors that outperform? Or is it simply a manifestation of more traditional factors like growth, size, and momentum? (The research is not conclusive.)
— How can the inconsistencies in ESG measurement and ratings be untangled?
— Can ratings drive transparency and market-based outcomes (such as higher cost of capital or a discount in equity trading multiples for low scorers)?
The rising bar among investors and end clients for what qualifies as ESG is leading to a healthy debate around these questions. It is also encouraging to see recent pushes by industry associations, regulators, and consultancies to establish standards in definitions, measurement, and reporting.
If ESG is to become an established, growth-oriented asset class, asset managers must play a large role in figuring out how to solve the problems of ESG standards and measurement.
1 40 Act funds that explicitly indicate sustainability, impact, or ESG incorporation in their prospectus or o�ering documents ($1.7T AUM); broader universe of investment strategies “considering ESG factors” is estimated to be ~$40 trillion globally as of 2020.
Source: Morningstar; Opimas; Pensions & Investments; McKinsey analysis
Scatterplot of ESG scores from two leading data providersNet ows for US ’40 Act indicating sustainability, impact, or ESG incorporation1
$ billion
Data provider 2 evaluation
Dat
a pr
ovid
er 1
eval
uatio
n
0350100
50
0 50 150
300
200
200
400250 300 450
100
150
250
350
400
450High Low
High
Low
Correlation: 0.42
-1
42
4
25
30
2015 201820172016 2019 2020
Exhibit A
ESG: Investors want it. But what should it be?
7 Gunnar Friede, Timo Busch and Alexander Bassen, “ESG and financial performance: aggregated evidence from more than 2000 empirical studies,” Deutsche Asset & Wealth Management Investment, Frankfurt am Main, Germany; School of Business,Economics and Social Science, University of Hamburg, Hamburg, Germany, (Received 22 October 2015; accepted 9 November 2015).
26 Across the Great Divide: North American asset management in a year of many shocks but few surprises

been responding in kind, as the breadth of products available to meet this demand has never been greater. For example, as of mid-2020, there were 311 sustainable and open-ended funds and ETFs in the United States, more than three times the number a decade ago. Even in the alpha-oriented private markets, industry leaders have begun to move beyond viewing ESG as mere “hygiene,” towards launching impact investing funds aimed at delivering on a “double bottom line.” According to our annual survey, North American asset managers believe 30 percent of their assets under management will integrate ESG in the next five years, compared to 53 percent for European asset managers.
A clear stance on ESG is increasingly emerging as table stakes; but if thoughtfully implemented, it can also be a competitive differentiator. To reconcile their traditional role as client fiduciary with a redefined role as a responsible allocator of capital, asset managers will need to shore up
their capabilities in three areas: First, they will need to clarify how their investment approaches link ESG considerations emphasized by their products and portfolio construction tools to a clear set of investment performance and societal outcomes. Second, they will need to develop more thoughtful approaches to ESG-related investment stewardship which guide how they use their clout as some of the most influential shareholders of public and private companies. Third, they will need to develop a more consistent set of standards on the measurement of ESG-related factors to enable clients to make informed product decisions and portfolio tradeoffs.
We believe that the five shifts highlighted above are durable multi-year trends that will reshape the contours of the North American asset management industry. They will shape the demands that firms will face from their clients, shareholders, and employees and determine which firms emerge as winners.
27Title of literature
The big picture – Uncertainty beckons
Where do we go from here? Scenario planning is a time-tested tool for managing uncertainty. Building out a set of divergent but plausible futures can help set tangible boundaries around possible macroeconomic and industry outcomes, and enable a structured conversation about beliefs and implications for the future. While the approach does not provide the comfort of a point prediction, it fosters a debate on “what ifs” and an evaluation of tradeoffs across potential strategic actions.
To understand the longer-term impact of the pandemic on the North American asset management industry, we examine what each of three macroeconomic scenarios set out by McKinsey8 could mean for client and competive dynamics (Exhibits 21, 22). These scenarios are not meant as predictions per se; they are meant as tools for strategic planning in an environment of extreme uncertainty.
The first scenario (A3) posits a recovery in economic momentum, a trajectory that would be similar to that of the 2008-09 global financial crisis. This scenario assumes an effective path of public health and economic interventions, including containment of health impacts and a widespread rollout of a vaccine in 2021.
Predictably, the industry impact of this scenario leans positive. A stabilization of pandemic conditions would create a clear pathway to economic recovery, and this combined with the
continued low-rate environment would sustain “risk-on” investor sentiment, encouraging new capital to enter the market. The stable conditions would facilitate a return of global trade and capital flows, widening international channels of growth for North American asset managers.
In this scenario, we have modeled organic growth of the North American asset management industry returning to an average of 1.5 to 2.5 percent per year through 2022, with revenue growth returning (15 to 20 percent increase from 2019, including the impact of market appreciation). Industry profit pools would grow at a healthy but more muted rate (5 to 10 percent increase from 2019), as growth in costs is somewhat “overlooked” given the quick recovery in the market. Key beneficiaries of flow growth in this scenario would be retail-oriented firms with global footprints and capabilities that serve the product “barbell” of passive, ETFs, and private markets.
The second scenario (B5) is built around a W-shaped recovery, and assumes a failure to contain the virus over the winter and a recurrence of outbreaks globally, resulting in the sporadic reintroduction of lockdowns. It also assumes a slow vaccine rollout, but aggressive new health and fiscal programs which eventually set economies on a course for sustained recovery. The scenario results in a deceleration of institutional flows because of structural pressures (e.g., slowed DC plan formation and increased drawdowns by endowments and foundations), with some
As we near the end of 2020, the asset management industry stands at the threshold of an extremely uncertain period. What other disruptions to the macroeconomic environment lie ahead? And will the industry be able to stay on the favorable side of the Great Divide as we head into 2021 and beyond?
8 “Nine scenarios for the COVID-19 economy,” McKinsey.com, October 29, 2020. Note: We are using three of the nine scenarios presented by McKinsey.
28 Across the Great Divide: North American asset management in a year of many shocks but few surprises
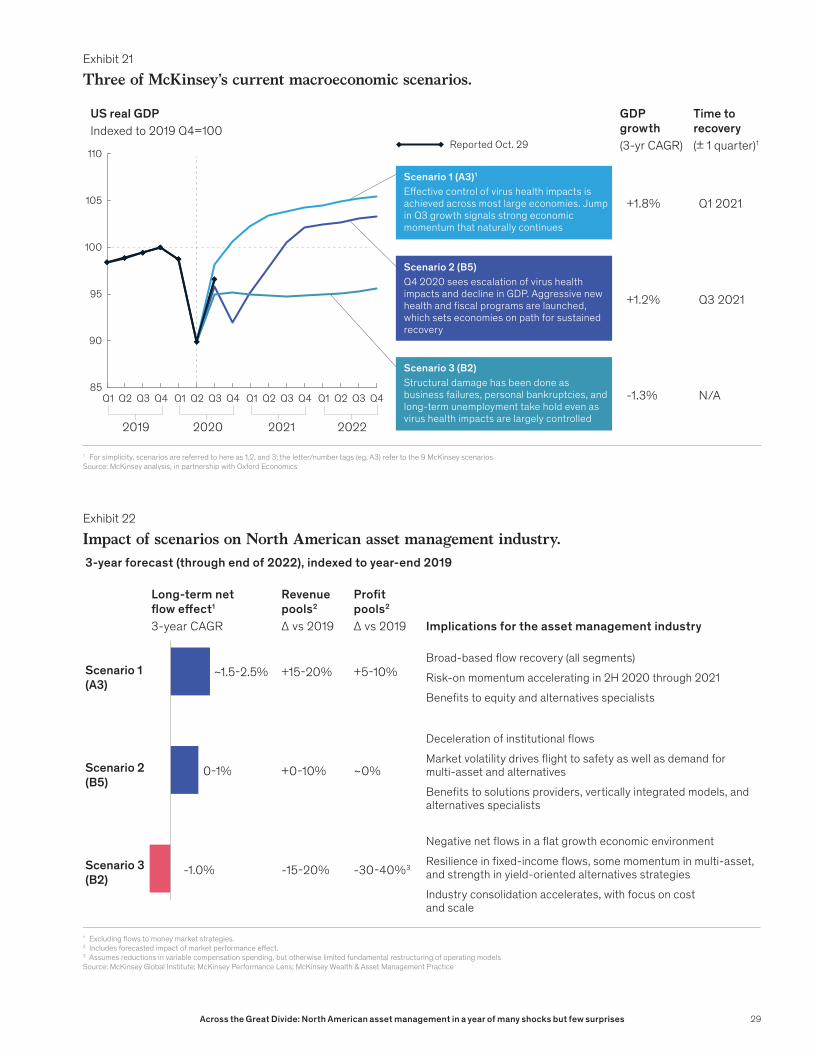
1 For simplicity, scenarios are referred to here as 1,2, and 3; the letter/number tags (eg, A3) refer to the 9 McKinsey scenarios.Source: McKinsey analysis, in partnership with Oxford Economics
Q1 2021
Q3 2021
N/A
+1.8%
+1.2%
-1.3%
2019 2020 2021 2022
110Reported Oct. 29
95
90
85
100
105
Q1 Q2 Q3 Q4 Q1 Q2 Q3 Q4 Q1 Q2 Q3 Q4 Q1 Q2 Q3 Q4
GDP growth(3-yr CAGR)
US real GDPIndexed to 2019 Q4=100
Time to recovery (± 1 quarter)1
Scenario 3 (B2)Structural damage has been done as business failures, personal bankruptcies, and long-term unemployment take hold even as virus health impacts are largely controlled
Scenario 2 (B5)Q4 2020 sees escalation of virus health impacts and decline in GDP. Aggressive new health and �scal programs are launched, which sets economies on path for sustained recovery
Scenario 1 (A3)1
E�ective control of virus health impacts is achieved across most large economies. Jump in Q3 growth signals strong economic momentum that naturally continues
Exhibit 21
Three of McKinsey’s current macroeconomic scenarios.
1 Excluding �ows to money market strategies.2 Includes forecasted impact of market performance e�ect.3 Assumes reductions in variable compensation spending, but otherwise limited fundamental restructuring of operating modelsSource: McKinsey Global Institute; McKinsey Performance Lens; McKinsey Wealth & Asset Management Practice
~1.5-2.5%
0-1%
-1.0%
+5-10%
~0%
-30-40%3
+15-20%
+0-10%
-15-20%
3-year forecast (through end of 2022), indexed to year-end 2019
Long-term net �ow e�ect1
3-year CAGR
Revenue pools2
Δ vs 2019
Pro�t pools2
Δ vs 2019 Implications for the asset management industry
Scenario 1(A3)
Scenario 2(B5)
Scenario 3(B2)
Broad-based �ow recovery (all segments)
Risk-on momentum accelerating in 2H 2020 through 2021
Bene�ts to equity and alternatives specialists
Deceleration of institutional �ows
Market volatility drives �ight to safety as well as demand for multi-asset and alternatives
Bene�ts to solutions providers, vertically integrated models, and alternatives specialists
Negative net �ows in a �at growth economic environment
Resilience in �xed-income �ows, some momentum in multi-asset, and strength in yield-oriented alternatives strategies
Industry consolidation accelerates, with focus on cost and scale
Exhibit 22
Impact of scenarios on North American asset management industry.
29Across the Great Divide: North American asset management in a year of many shocks but few surprises
pockets of growth created by increased appetite for outsourcing by smaller pools of capital. In this scenario, we model annualized net flows in the range of zero to one percent, with positive flows created in the face of uncertainty and the lower-for-longer rate environment by yield-seeking liquidity assets moving into the domain of third-party managed funds.
In this scenario, money market funds and fixed income would be expected to capture more than their fair share of flows, as assets remain parked on sidelines because of the uncertainty created by market swings. A higher level of equity volatility could portend a pull back from risk assets, with multi-asset solutions strategies gaining as investors increase outsourcing of allocation decisions. Private market allocations would remain robust, particularly to strategies with the agility to take advantage of choppier valuations and distressed opportunities.
Revenue growth in this W-shaped recovery scenario would be in the range of 0 to 10 percent, as the flight to safety, away from higher-revenue risk assets, and to lower-priced fixed-income/multi-asset investments will lead to a compression in industry revenue yields overall. Profit pools should remain flat in this scenario. Asset managers likely to benefit will be those that are able to serve clients through periods of extreme uncertainty—these include large established solutions providers (who would benefit from a “flight to familiarity”), vertically integrated firms that combine manufacturing and distribution, and private market specialists.
The final scenario (B2) lays out a flatlining recovery. In this scenario, the crisis leaves meaningful scar tissue in the real economy, with business failures, personal bankruptcies, and sustained long-term unemployment (even as virus health impacts become largely controlled) holding back a near-term economic turnaround. In this scenario, valuations of risk assets would finally be subject to the laws of gravity, leading to meaningful outflows as asset values stabilize to a new equilibrium. Negative real rates would result in a search for alternatives to core fixed income, precipitating a mix shift towards specialty strategies (e.g., international, high yield, or structured). Multi-asset strategies could also benefit as investors seek to outsource asset allocation and look for creative sources of yield.
The conditions of this scenario would precipitate a resurgence of consolidation in the asset
management industry, with a pull-back from weaker firms and cost-driven M&A making a comeback. In this scenario, average net flows would be flat over the three-year period. Despite the anemic economic conditions of this scenario, there would be one limiting factor to outflows: investors in such a slow recovery might remain invested in third-party funds with the hope of real returns rather than accepting near-zero or even negative real yields for a sustained period. Overall, this will have a large effect on revenue pools (15 to 20 percent decline) and on profit pools (30 to 40 percent decline).
History doesn’t repeat itself, but it often rhymes….Regardless of which scenario comes to pass, it is clear that the next few years will be a period of significant change as industries, and indeed whole economies, are restructured by the changes wrought by an extended pandemic.
What is the right strategic posture for an asset manager seeking to navigate these uncertainties? To cast light on this question, we looked back at the last major macroeconomic disruption—the global financial crisis of 2008-09—for lessons from asset managers that successfully navigated that disruption and emerged with momentum. While far from a perfect analogy, the financial crisis represented the closest example of a stress test of the industry in its current structure.
To do this, we conducted a forensic analysis of the performance of about 100 asset managers in North America before, during, and after the financial crisis using longitudinal data from our proprietary survey of the industry to identify and distill patterns in how individual managers used the catalyst of the last crisis to put themselves on new trajectories. We came away from the exercise with the following five lessons:
— “Where to play” was the central decision in a crisis. Managers that made major pivots in their business focus or those who already had prior strength in strategic growth areas (e.g., passive, ETFs, fixed income) achieved meaningfully higher net flow growth in the three years after the crisis.
— Positioning to win the recovery was also critical. While a good number of managers spent the post-crisis years in a defensive crouch, those that had the highest revenue growth were
30 Across the Great Divide: North American asset management in a year of many shocks but few surprises
well-positioned for a reinvigoration of investor risk appetites, which happened more quickly than many expected. Managers with high-performing strategies in traditional equities, specialty equities, and private markets achieved the most rapid post-crisis revenue growth.
— It is difficult to simply cost-cut your way to greatness. In the last crisis, asset managers who cut costs aggressively tended to achieve the worst revenue growth outcomes in subsequent years. In contrast, firms that invested meaningfully to build new sets of capabilities (e.g., portfolio solutions, digital) reaped the benefits for many years to come, while the rest of the industry was on the defensive.
— Active resource reallocation was an essential skill. Managers who made focused “conviction investments” in major growth areas and sustained these on a multi-year basis captured disproportionate growth; conversely, those that spread their investments and management attention across a multitude of initiatives often failed to reach lift off, regardless of the size of their aggregate investments.
— Fortune often favored the brave. Leaders in the industry recognized that a major system-wide disruption could create unique opportunities to expand their role across the investing ecosystem. A number of signature transitions were executed in the years of crisis and proved to be meaningful growth engines in the years to come.
Navigating the Great DivideIn the near term, we propose a five-point strategic agenda for North American asset managers seeking to navigate the extreme uncertainty that lies ahead in the next 12 months:
1. Keeping the client at the center. If this is an uncomfortable moment for asset managers, it is even more so for clients. Both institutional and retail clients are seeking out partners (rather than product providers) to help them manage the volatility of the markets and changes in their industries. This a moment for asset managers
to invest deeply and strategically into the “platinum” clients that anchor their franchises.
2. Finding growth that is hidden in plain sight. While the uncertainties of the present have put a damper on net flow growth, they have created an unprecedented set of money-in-motion opportunities, whether through big shifts in asset allocation, the emergence of new sets of client needs (e.g., generating yield amidst low interest rates), or in helping to deliver products that turn disruptions into investible themes.
3. Managing uncertainty by leaning into “known knowns.” Amidst the current uncertainty, there is much that can be known, for example the realities of volatile markets, lower-for-longer interest rates, and the realignment of industry sectors (e.g., impact of e-commerce) that has been accelerated by the pandemic. Asset managers need to be nimble in adapting their investment strategies and portfolio construction approaches to help clients create value amidst these major shifts.
4. Launching bold moves. The question that asset managers should be asking today is, “If not now, then when?”, with regard to bold M&A moves, significant talent liftouts, operating model re-engineering (e.g., digitization, outsourcing), radical reallocation of resources towards growth priorities, or structural shifts in the cost base to create a currency for growth. Apart from the uniqueness of the external environment, organizations are expecting change and internally poised for bigger moves.
5. Planning to win the recovery. Even in the most pessimistic scenarios, markets ultimately bounce back. And across all of the narratives, demand for high-quality investments remains. Asset managers need to be thinking today about what they need to do to win the recovery of tomorrow. Who are the emerging leaders within their organizations who will push the envelope on growth? Where do investment engines need to be retooled? Where do distribution capabilities need to be strengthed to build “relationship alpha”? How do business models need to be repositioned within a changing investment ecosystem?
31Across the Great Divide: North American asset management in a year of many shocks but few surprises

December 2020 Copyright © McKinsey & Company www.mckinsey.com
@McKinsey @McKinsey