accuracy and interferences for enzyme-linked immunoassay tests for atrazine
TRANSCRIPT

ACCURACY AND INTERFERENCES for Enzyme-linked Immunoassay Tests for AtrazineAuthor(s): CRAIG ADAMS, HUA JIANG, MICHAEL MCGUIRE, NICOLE GRAZIANO, ALANROBERSON and MICHELLE FREYSource: Journal (American Water Works Association), Vol. 96, No. 12 (December 2004), pp.126-139Published by: American Water Works AssociationStable URL: http://www.jstor.org/stable/41311948 .
Accessed: 08/07/2014 09:22
Your use of the JSTOR archive indicates your acceptance of the Terms & Conditions of Use, available at .http://www.jstor.org/page/info/about/policies/terms.jsp
.JSTOR is a not-for-profit service that helps scholars, researchers, and students discover, use, and build upon a wide range ofcontent in a trusted digital archive. We use information technology and tools to increase productivity and facilitate new formsof scholarship. For more information about JSTOR, please contact [email protected].
.
American Water Works Association is collaborating with JSTOR to digitize, preserve and extend access toJournal (American Water Works Association).
http://www.jstor.org
This content downloaded from 195.194.14.2 on Tue, 8 Jul 2014 09:22:01 AMAll use subject to JSTOR Terms and Conditions
BY CRAIG ADAMS,
HUA JIANG,
MICHAEL MCGUIRE,
NICOLE GRAZIANO,
ALAN ROBERSON,
AND MICHELLE FREY
Enzyme-linked immunosorbent assay (ELISA) methods have become a common alternative
to gas chromatography methods for analyzing atrazine in raw and finished drinking water.
This study investigated several leading ELISA atrazine test kits currently in use. This work
demonstrates that although all the kits analyzed provided precise results, their accuracy varies
greatly between kits and water matrixes. In most cases, the ELISA test kits provided
positively biased results, although some negatively biased results were also observed.
That is, the ELISA atrazine concentrations were usually greater than the actual
concentrations. Although a part of this positive bias was because of cross-reactivity with
other chloro-s-triazines in the water matrix, much of the observed interference appeared
to be related to natural organic matter, chlorination and/or quenching, and other factors. Even
though the observed positive bias tends to cause the kits to provide a conservative result
with respect to atrazine concentration, the role of ELISA test kits for regulatory purposes
requires more study and discussion.
ACCURACY and INTERFERENCES
for Enzyme-linked
Immunoassay Tests
for Atrazine
Atrazine that per with
and
year, may
approximately is
primarily
one
be weeds. applied
of the
on
Because
most
both
75 corn
mil commonly
before and
of
lb
its
(34 soybeans.
and relatively
x 106 used
after
kg) Atrazine
herbicides
planting long
of active
half-life
is an to
in ingredient
control effective
the
and
United
its broadleaf herbicide
solubil-
applied States,
with approximately 75 mil lb (34 x 106 kg) of active ingredient applied per year, primarily on corn and soybeans. Atrazine is an effective herbicide that may be applied both before and after planting to control broadleaf and grassy weeds. Because of its relatively long half-life and its solubil-
ity, atrazine has been a concern from a federal regulatory perspective, both under the Federal Insecticide, Fungicide and Rodenticide Act (FIFRA) (USEPA, 1947) and the Safe Drinking Water Act (SDWA) (USEPA, 1976).
Atrazine was first registered for use as an herbicide Dec. 1, 1958. Groundwater and surface water mitigation measures were put into place in 1990 and 1992, respectively. As part of the FIFRA reregistration process, a special review was ini- tiated in 1994. This special review resulted in the collection and analysis of a mul- titude of health effects and occurrence studies.
In March 2002, the US Environmental Protection Agency (USEPA) released a report detailing a common mechanism of toxicity between atrazine, propazine, simazine and three of the chlorinated metabolites (USEPA, 2002a). On the basis of the available weight of evidence, USEPA concluded that these six compounds
126 DECEMBER 2004 | JOURNAL AWWA • 96:12 | PEER-REVIEWED | ADAMS ET AL
This content downloaded from 195.194.14.2 on Tue, 8 Jul 2014 09:22:01 AMAll use subject to JSTOR Terms and Conditions

TABLE 1 Results of Battelle's environmental technology verification study for Abraxis, SDI, and Beacon test kits*
Comparison of Method "Approved" Syngenta Beacon Test Kits AG-625 With AG-625
Test Parameter Abraxis SDI Beacon Criteriaf Criteria
Accuracy of performance test samples^ - 102-127 96-151 82-133 73-145 Pass % recovery Accuracy of environmental samples - 100-140 102-177 75-171 56-137 Fail - 171>137 % recovery Precision of performance test samplest - 6.9-24.1 0.9-51.1 5.0-25.4 19 Fail - 25.4>19 % RSD Precision of environmental samples - 3.5-15.2 2.6-16.7 3.9-22.8 <33 Pass % RSD Linearity - slope of regression equation 1.23 0.93 0.81 NC Linearity - y -intercept -0.025 0.26 0.24 NC Linearity - correlation coefficient (i) 0.9937 0.995 0.9575 >0.997 Fail - 0.9575<0.997 Method detection limit - atrazine pig/L 0.06 0.1 Atrazine not detected <0.05 Fail - 0.1>0.05
with 0.1-pg/L spike Cross-reactivity - 3 pg/L DEA, 0.06 0.07 <0.05 NC average atrazine indicated Cross-reactivity - 3ptg/LHA, 0.25 0.34 0.11 NC average atrazine indicated Matrix interference effects No apparent Possible minor Positive bias observed NC
interferences interference in brackish from matrixes from brackish pond pond water
tested water matrix sample results False-positive results 4 of 38 4 of 38 6 of 38 NC False-negative results none none none NC DEA - deethylatrazine, HA - hydroxyatrazine , NC - no criteria, RSD - relative standard deviation *The Beacon kits analyzed were the "approved" kits (not the "revised" version). Comparison of Battelle results with the Beacon method AG-625 (USEPA, 2002c) criteria are shown for the "approved" kits analyzed by Battelle. tAbraxis LLC, Warminster, Pa.; Strategic Diagnostics Inc., Newark, Del.; Beacon Analytical Systems Inc., Portland, Maine; Syngenta Method AG-625, Atrazine in Drinking Water by Immunoassay, Syngenta Crop Protection Inc., Greensborough, N.C. (USEPA, 2002c) tASTM type 1 water (Spec. D1 193-90): conductance <0.056 pS/cm; resistivity >18.0 Mft/cm; total silica < 3.0 pg/L; chloride < 1.0 |ig/L; total organic carbon < 100 Ug/L
can be grouped by a common mechanism of toxicity for disruption of the hypothalamic-pituitary-gonadal axis. This disruption causes attenuation of the lutenizing hor- mone surge, alteration of the estrous cycle, altered preg- nancy maintenance, and delayed pubertal development. USEPA revised its human health risk assessment based on this new health effects endpoint (USEPA, 2002b).
In February 2003, USEPA released its Interim Rereg- istration Eligibility Decision (IRED) for atrazine (USEPA, 2003a). Among other things, the IRED required the reg- istrant to conduct a monitoring program in approxi- mately 175 drinking water sources. This IRED was revised later in 2003 to incorporate a similar ecological moni- toring program in 40 watersheds (USEPA, 2003b).
On the drinking water side, atrazine was regulated under the SDWA as part of the Phase 2 regulation (USEPA, 1991). The maximum contaminant level was set at 3 pg/L. Compliance was based on the annual aver- age of quarterly samples, which is typical for most SDWA- regulated contaminants. At that time, USEPA methods 505, 507, and 525 (USEPA, 1995a-c) were approved for use in atrazine compliance monitoring.
As part of the 1996 SDWA Amendments, USEPA is required to review existing drinking water regulations on a six-year cycle. The first six-year review was finalized in June 2003, and USEPA determined that of the existing 69 regulations, only the Total Coliform Rule necessitated revision at that time (USEPA, 2003c). USEPA's Office of Ground Water and Drinking Water wanted to wait until the completion of the revised IRED before making a deci- sion on whether to review the atrazine standard. The atrazine drinking water standard may be revised "out- of-cycle" from the six-year review process.
Chloro-5-triazines are typically measured using gas chromatography/mass spectrometry (GC/MS) methods for screening, routine compliance, and research pur- poses. GC/MS methods can be expensive and time-con- suming, and often cannot be run onsite at water utilities. It is for these reasons that simpler, less-expensive ana- lytical methods have been developed for atrazine analy- sis such as the enzyme-linked immunosorbent assay (ELISA) methods. ELISA is commonly used for screen- ing purposes and has been considered for compliance purposes as well. USEPA approved an ELISA test for
ADAMS ETAL | PEER-REVIEWED | 96:12 • JOURNAL AWWA | DECEMBER 2004 127
This content downloaded from 195.194.14.2 on Tue, 8 Jul 2014 09:22:01 AMAll use subject to JSTOR Terms and Conditions
TABLE 2 Cross-reactivity of ELISA test used in study as reported in manufacturer literature supplied with test kits (except where noted)
Kso'-eg/L ciw-% Chemical Abraxisf Beacon SDI Abraxis Beacon SKI
Ametryn 0.44 0.16 0.39 159 313 185 Atrazine 0.7 0.5 0.72 100 100 100 Cyanazine 47 77 >10,000 1 1 0 Cyromazine NR NR NR NR NR NR Deethylatrazine 4.75 19 3.21 15 3 22 Deisopropylatrazine 970 120 217 0 0 0 Didealkylatrazine >1,000§ >1,000§ >1,000§ <0.07§ <0.04§ <0.08§ 2-Hydroxyatrazine 20 NR 148 4 NR 0 Propazine 1.18 0.38 0.74 59 132 97 Prometon 2.2 1.3 2.22 32 38 32 Prometryn 0.8 0.12 0.64 88 417 113 Simazine 3.4 6.2 4.9 21 8 15 Simetryne NR 0.9 NR NR 56 NR Terbuthylazine NR NR 15.5 NR NR 5 Terbutryn 210 1.4 5.5 0 36 13
CRatr - atrazine cross-reactivity, ELISA - enzyme-linked immunosorbent assay, NR - not reported Concentration required for 50% absorbance reduction tPercent cross-reactivity relative to atrazine ^Abraxis LLC, Warminster, Pa.; Beacon Analytical Systems Inc., Portland, Maine; Strategic Diagnostics Inc., Newark, Del. §This study
atrazine (using Method Syngenta AG-625) in October 2002 (USEPA, 2002c).
Considerable research has been published on the development and application of ELISA methods for atrazine (Muldoon et al, 1993; Hot- tenstein et al, 1996) and other chloro-s-triazines (Muldoon et al, 1994; Muldoon &: Nelson, 1994a-b; Del Valle et al, 1996). Selected stud- ies addressing the applicability of atrazine ELISA kits are summarized in the following text.
Ohmichron/SDL In a study con- ducted by Ohmicron, Hayes et al (1996) examined the 1996 version of the Atrazine RaPID Assay Kit by Ohmicron Environmental Diagnostics (currently Strategic Diagnostics Inc. [SDI]) in which the polyclonal anti- bodies are on magnetic particles. This study examined municipal water, well water, and surface water samples unspiked and spiked with 0.15, 1.0, or 3.0 pg/L atrazine. The authors con- cluded that the Ohmicron kit was accurate and precise as defined by the kit calibrators (i.e., the standards sup- plied with the kit).
In an earlier study conducted on the Ohmicron test kit, Rubio et al (1991) found a strong correlation (r = 0.97) between atrazine concentrations in groundwater samples determined by GC/MS versus ELISA, although
FIGURE 1 Cross-reactivity of ELISA test kits with respect to atrazine, DEA, DIA, and DDA in Dl and SWfrom Schuman Pond containing <0.05 ljg/L atrazine
128 DECEMBER 2004 | JOURNAL AWWA • 96:12 | PEER-REVIEWED | ADAMS ET AL
This content downloaded from 195.194.14.2 on Tue, 8 Jul 2014 09:22:01 AMAll use subject to JSTOR Terms and Conditions

a 45% positive bias for the ELISA values was observed. The study concluded that this test was robust for groundwater samples, but made no inferences for sur- face water samples.
Watts and Novak (1997) examined false-positives in groundwater samples tested using the Ohmicron atrazine test kit. GC/MS analyses showed that 70% of the false- positives could be attributed to cross-reactivity with prometon or deethylatrazine. It was not known what caused the other 30% of false-positive-biased results ranging from 0.29 to 1.03 pg/L. Neither dissolved organic carbon (DOC) concentrations nor the depth of the aquifers from which the groundwater samples were taken was reported.
The Ohmicron test kit was also examined by Lydy et al (1 996) in a study on 149 surface water samples ana- lyzed by both GC/MS and ELISA. Correlation between the paired samples was good (r = 0.84-0.89). For samples within the linear range of calibration, a positive bias of 6-7% in the ELISA results was observed that could par- tially be explained by cross-reactivity with other triazine compounds.
Millipore. Stearman and Wells (1993) examined inter- ferences in atrazine and metolachlor using the ELISA plate method developed by the Millipore Corp. of Bed- ford, Mass., and found varying degrees of interference by halogens and DOC, including humic acid. The authors concluded that when diverse water sources are analyzed, matrix effects limit the ELISA test to screening rather than quantitation purposes.
In a study conducted for Millipore, Comber et al (1996) examined the Envirogard ELISA kit by Millipore and concluded there was no significant bias associated with drinking water samples compared with laboratory standards for atrazine concentrations near 0.1 pg/L. The authors also concluded that for distilled-deionized (DI) waters spiked with 0, 0.02, and 0.08 pg/L atrazine, there was no significant effect of pH, inorganic anions and cations, and selected chlorination by-products at levels up to their MCLs. Higher atrazine concentrations were not examined in this study.
Beacon. In a study conducted by Brady et al (2001), the Beacon Analytical Systems Inc. (Portland, Maine) test kit was examined in an interlaboratory study that analyzed both field and reagent waters spiked with atrazine and shipped as blind samples to participants for ELISA analy- sis. This study concluded that the Beacon test kit was unaffected by nonspecific matrix interferences (i.e., matrix effects other than cross-reactivity with other triazines) in either raw or finished field samples.
Environmental technology verification . In Fall 2003, a USEPA Environmental Technology Verification (ETV) Program study was conducted at Battelle's Advanced Monitoring Systems center in Columbus, Ohio, to eval- uate the performance of Abraxis, Beacon, SDI, and the Watersafe Pesticide Test (Silver Lake Research Corp.,
FIGURE 2 Effect of pH on indicated atrazine concentration with the ELISA test kit in deionized water
FIGURE 3 Effect of chloroform - a trihalomethane - on the indicated atrazine concentration in deionized water
ADAMS ETAL | PEER-REVIEWED | 96:12 • JOURNAL AWWA | DECEMBER 2004 129
This content downloaded from 195.194.14.2 on Tue, 8 Jul 2014 09:22:01 AMAll use subject to JSTOR Terms and Conditions
FIGURE 4 Effect of monochloramine on the indicated atrazine concentration in Dl with and without a 1-pg/L atrazine spike
FIGURE 5 Effect of monochloramine on the indicated atrazine concentration in Dl with and without a 1-pg/L atrazine spike for "approved" and "revised" Beacon atrazine ELISA kits
Monrovia, Calif.) ELISA test kits for atrazine (USEPA, 2004; White et al, 2004a-c). The results of this study are summarized in Table 1 for the same Abraxis, SDI, and Beacon atrazine ELISA kits examined in the study described in this article. For environmental samples, the tests' accuracy was examined by their percent spike
recovery, which ranged from 100 to 140, 102 to 177, and 75 to 171% for the Abraxis, SDI, and Beacon kits, respectively. These results indicate a general positive bias for the kits, except the Beacon kit, which showed both positive and negative biases. All of the kits showed relatively good pre- cision with relative standard devia- tions ranging from 2.6 to 22.8% (Table 1). Linearity of standards curves was assessed with regression coefficients ( R 2) of 0.994, 0.995, and 0.958 for the Abraxis, SDI, and Bea- con kits, respectively (Table 1). Method detection limits were 0.06 and 0.1 for the Abraxis and SDI kits, respectively. A method detection limit was not reported for the Beacon kit because atrazine was not detected in the 0.1-pg/L spike samples in the Bat- telle ETV study. The results for the Beacon atrazine ELISA kit were also compared in Table 1 with the criteria established in the AG-625 method (USEPA, 2002c). The comparison shows that the Beacon test kit failed four of the AG-625 method criteria and passed two others (Table 1).
Purpose and objectives. The purpose of this study was to examine the per- formance of three ELISA test kits by Abraxis, Beacon Analytical, and SDI in a laboratory comparison on Dl water, surface waters, and waters from 16 municipal utilities. The effects of a variety of inorganic and organic con- stituents were examined.
MATERIALS AND METHODS Chemicals. The atrazine (atrazine; 2-
chloro-4-ethylamino-6-isopropylamino- s-triazine; CAS 1912-24-9) standard stock solution used for GC/MS analy- sis and sample spiking was purchased commercially1 at >99% purity. The chloro-s-triazine standards simazine (SIM; 2-chloro-4, 6-diethylamino-s-tri- azine; CAS 122-34-9), propazine (PROP; 2-chloro-4, 6-diisopropyl-
amino-s-triazine; CAS 139-40-2), cyanazine (CYAN; 2- chloro-4-ethylamino-6-(cyano-l-methyl)-(ethylamino)-s- triazine; CAS 21725-46-2), deethylatrazine (DEA; 2-amino-4-chloro-6-isopropylamino-s-triazine; CAS 6190- 65-4), deisopropylatrazine (DIA; 2-amino-4-chloro-6-eth- ylamino-s-triazine; CAS 1007-28-9) and didealkylatrazine
130 DECEMBER 2004 | JOURNAL AWWA • 96:1 2 | PEER-REVIEWED | ADAMS ET AL
This content downloaded from 195.194.14.2 on Tue, 8 Jul 2014 09:22:01 AMAll use subject to JSTOR Terms and Conditions
(DDA; 2-chloro-4,6-diamino-s-triazine; CAS 3397-62-4; also known as chloro- diamino-s-triazine) as well as the recov- ery standard tert-butylazine (TBUT; 2- (tert-butylamino)-4-chloro-6-(ethyl- amino)-s-triazine; CAS 5915-41-3) were also obtained commercially1 with puri- ties of 99, 99.5, 99.9, 95, 95, 96, and 99%, respectively. Stock solutions used for spiking were prepared in methanol at 500 mg/L except for SIM and DDA, which were prepared at 100 mg/L. Deuterated standards2 were used as inter- nal standards for GC/MS.
Surface waters used in laboratory experiments were obtained from the Missouri River in Jefferson City, Mo., from Schuman Pond in Rolla, Mo., and from 16 municipal water treatment plants from the central, eastern and southern regions of the United States. These 16 surface waters were selected to span a wide array of drinking water sources and watersheds, DOC concen- trations, hardness, alkalinity, and other parameters. Lab- oratory water used in interference testing consisted of DI water prepared using a water purification system3 and with resistivity greater than 18.2 Mft.
Analytical methods. DOC was measured using a total organic carbon analyzer.4 Ultraviolet (UV) absorbance was measured using a spectrophotometer,5 and pH was measured using a meter and probe.6
The concentrations of atrazine, DEA, DIA, DDA, and other chloro-s-triazines were measured in surface waters and stock solutions using solid-phase extraction (SPE) followed by GC/MS (Jiang et al, 2004). This method used mixed-mode extraction using SPE cartridges (6 mL/0.5 g7 and 6 mL/150 mg8) connected in series to allow extrac- tion of both the less-polar compounds - atrazine, DEA, and DIA - as well as the more-polar DDA. GC/MS analy- sis was conducted using a gas chromatograph9 with an MS capillary column10 (30-m/0.25-mm diameter; 0.25-pm film thickness), a mass-selective detector11 (150 and 230°C quad and source temperature, respectively), and an autosampler.12 GC conditions were 2 pL injection, 225°C injection temperature, 12.2-psi inlet pressure, and a 1.0- mL/min gas flow. The temperature ramp was 100°C ini- tial temperature, 40°C/min to 170°C, 3°C/min to 185°C, 10°C/min to 220°C, 60°C/min to 280°C, and hold for 1 min. Deuterated internal standards were used for quan- titation and as recovery standards. The limit of detection was 0.01 pg/L for SIM, DEA, DIA, and DDA and 0.02 pg/L for atrazine and PROP in surface water. Mean recov- eries for atrazine, SIM, PROP, DEA, DIA, and DDA were 94, 104, 103, 110, 108, and 102%, respectively, in sur- face water. The method was also validated by matrix
4.5-1 _ Abraxis- pH 7.6 4 0- -B- Abraxis- pH 9.1 ^ ^
Beacon- pH 7.6 3 5- -0- Beacon- pH 9.1 W
2 -A- SDI- pH 7.6 / i 3.0- -A- SDI- pH 9.1 /
1 25 "
/
I 2"°" / "
1 1.5- /
°.5- >/ /
4 , * , ■ r 0 2 4 6 8
HOCI and OCf - mg/L DI - distilled-deionized water, HOCI and OCI~-free chlorine
FIGURE 6 Effect of HOCI and OCh on the indicated atrazine concentration in DI at 7.6 and 9.1 pH
spikes into eight raw and treated natural surface waters (Jiang et al, 2004).
ELISA tests. Three types of ELISA tests were examined in this research - Abraxis,13 Beacon,14 and SDI.15 Each of these kits use similar principles of ELISA to determine atrazine concentrations in water. The kits are not spe- cific to atrazine alone and are subject to cross-reactivity (CR) with other related triazines (Table 2).
In the Beacon test method, a water sample potentially containing atrazine and an atrazine-enzyme conjugate are added to a test tube coated with a polyclonal antibody that binds both atrazine and the conjugate. The sample is allowed to incubate for 20 min, during which time the atrazine and the conjugate competitively complex with the binding sites. The greater the atrazine concentration in the sample, the fewer the sites bound by conjugate. Next, the test tube is rinsed sequentially with water, thereby leaving sites bound by either atrazine or conjugate. A substrate is then added that binds to the conjugate-com- plexed sites (and not the atrazine-complexed sites), pro- ducing a blue color for which the absorbance is inversely related to the atrazine concentration in the original sam- ple. After incubation, a solution is added that stops the reaction and converts the blue to yellow, which is then quantitatively measured spectrophotometrically at 450 nm. The atrazine concentration is calculated based on the equation
Absorbance = m x to (Qvtr) + ̂ (I)
in which CATR is the atrazine concentration the constants m and b are determined using vendor-supplied standards.
ADAMS ETAL | PEER-REVIEWED | 96:12 • JOURNAL AWWA | DECEMBER 2004 131
This content downloaded from 195.194.14.2 on Tue, 8 Jul 2014 09:22:01 AMAll use subject to JSTOR Terms and Conditions
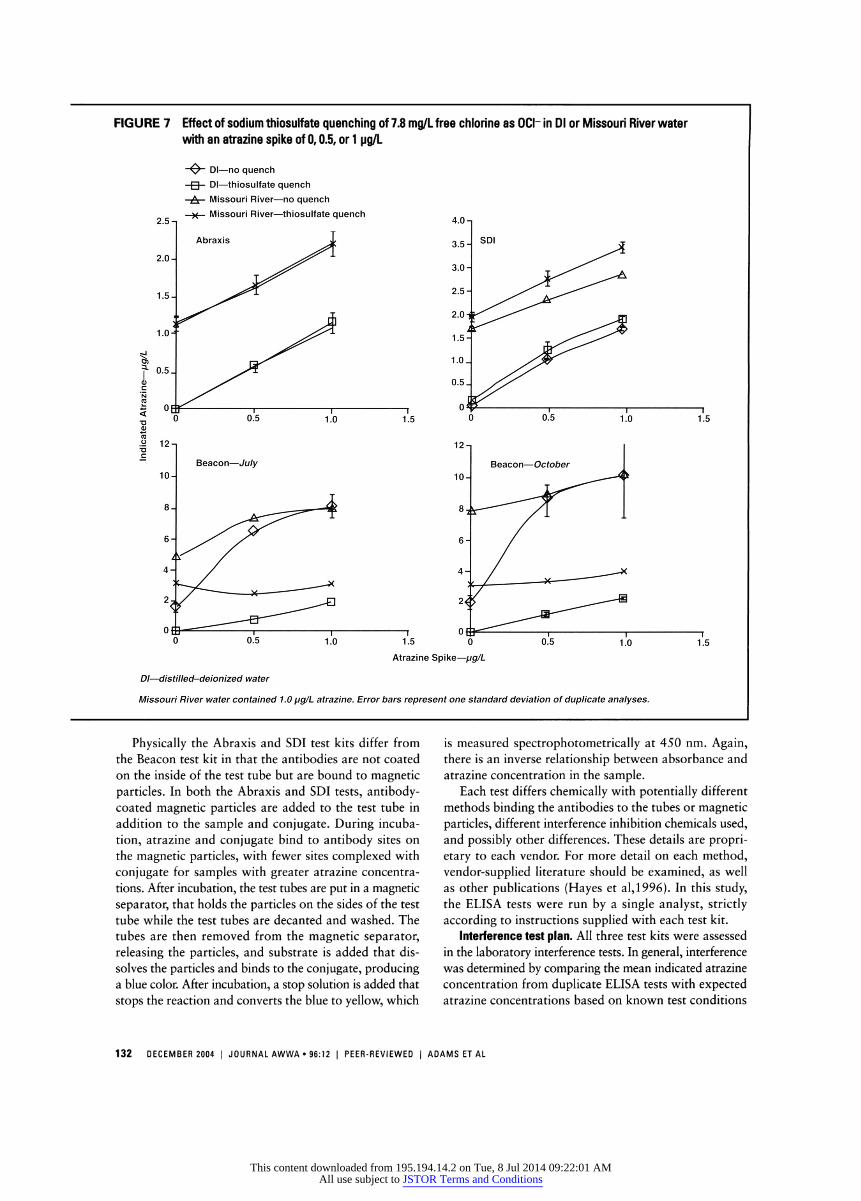
FIGURE 7 Effect of sodium thiosulfate quenching of 7.8 mg/L free chlorine as OCh in Dl or Missouri River water with an atrazine spike of 0r 0.5, or 1 pg/L
Physically the Abraxis and SDI test kits differ from the Beacon test kit in that the antibodies are not coated on the inside of the test tube but are bound to magnetic particles. In both the Abraxis and SDI tests, antibody- coated magnetic particles are added to the test tube in addition to the sample and conjugate. During incuba- tion, atrazine and conjugate bind to antibody sites on the magnetic particles, with fewer sites complexed with conjugate for samples with greater atrazine concentra- tions. After incubation, the test tubes are put in a magnetic separator, that holds the particles on the sides of the test tube while the test tubes are decanted and washed. The tubes are then removed from the magnetic separator, releasing the particles, and substrate is added that dis- solves the particles and binds to the conjugate, producing a blue color. After incubation, a stop solution is added that stops the reaction and converts the blue to yellow, which
is measured spectrophotometrically at 450 nm. Again, there is an inverse relationship between absorbance and atrazine concentration in the sample.
Each test differs chemically with potentially different methods binding the antibodies to the tubes or magnetic particles, different interference inhibition chemicals used, and possibly other differences. These details are propri- etary to each vendor. For more detail on each method, vendor-supplied literature should be examined, as well as other publications (Hayes et al,l 996). In this study, the ELISA tests were run by a single analyst, strictly according to instructions supplied with each test kit.
Interference test plan. All three test kits were assessed in the laboratory interference tests. In general, interference was determined by comparing the mean indicated atrazine concentration from duplicate ELISA tests with expected atrazine concentrations based on known test conditions
132 DECEMBER 2004 | JOURNAL AWWA • 96:12 | PEER-REVIEWED | ADAMS ET AL
This content downloaded from 195.194.14.2 on Tue, 8 Jul 2014 09:22:01 AMAll use subject to JSTOR Terms and Conditions
and/or to measured atrazine concentrations based on GC/MS analysis. In these tests, all analyses were con- ducted in duplicate or triplicate.
In the laboratory interference tests, each test kit was calibrated with the vendor-supplied standards concur- rent with sample analysis. Each vendor also provided a sufficient quantity of its 5-pg/L standard to analyze one standard via SPE-GC/MS after dilution to 1 pg/L.
Interference tests were conducted in DI water to assess the interference associated with pH, chloroform (a tri- halomethane), chlorite and chlorate (chlorine dioxide disinfection by-products), ferrous (Fe2+) and ferric iron (Fe3+), divalent (Mn2+) and tetravalent manganese (Mn4+), and sodium thiosulfate (Na2S203). Tests were conducted in DI and filtered Missouri River water on the effects of the disinfectants' hypochlorous acid (HOC1) and hypochlorite ion (OCl~) with and without quenching with sodium thiosulfate and monochloramine (MCA). The Missouri River water was filtered through a 0.45-pm filter before use.
CR was assessed for DDA alone in DI water. In these experiments, DDA was spiked at a range of concentrations from which the CR relative to atrazine was calculated. CR for DEA, DIA, and DDA in combination was also assessed in both DI and Schuman Pond (Rolla, Mo.) surface water. In these experiments, atrazine was spiked at 1 pg/L alone or in addition to 0.5 pg/L each of DEA, DIA, and DDA before ELISA analysis.
In a separate set of experiments, raw and finished water samples from 16 full-scale water utilities were ana- lyzed as received and spiked with 1 pg/L atrazine. Each sample was also analyzed using SPE-GC/MS for deter- mination of actual atrazine (and related s-triazine) com- pound concentrations. Water samples were shipped cold and in the dark by overnight courier and immediately stored in the dark at 5° C until analysis. Samples were generally analyzed within two weeks by ELISA tests.
RESULTS AND DISCUSSION Analysis precision. The precision for each of the ELISA
tests was relatively good, with the mean relative stan- dard deviation for the Abraxis, Beacon, and SDI analyses being 8, 7, and 7%, respectively, including DI, surface water, and raw and finished utility-supplied waters. Because of this high precision, confidence intervals tend to be obscured by symbols in figures and thus were not included in most figures accompanying this article.
Analysis of vendor-supplied standards. Each test kit was provided with calibration standards (ranging from 0 to 5 pg/L) and one 3.0-pg/L check standard. Each kit pro- vided linear standard curves with regression coefficient (R2) values of at least 0.98. The vendor-supplied 3.0-pg/L check standard was usually within 10% of the predicted concentration when compared with a standard curve developed using the same vendor's standards, indicating strong internal consistency.
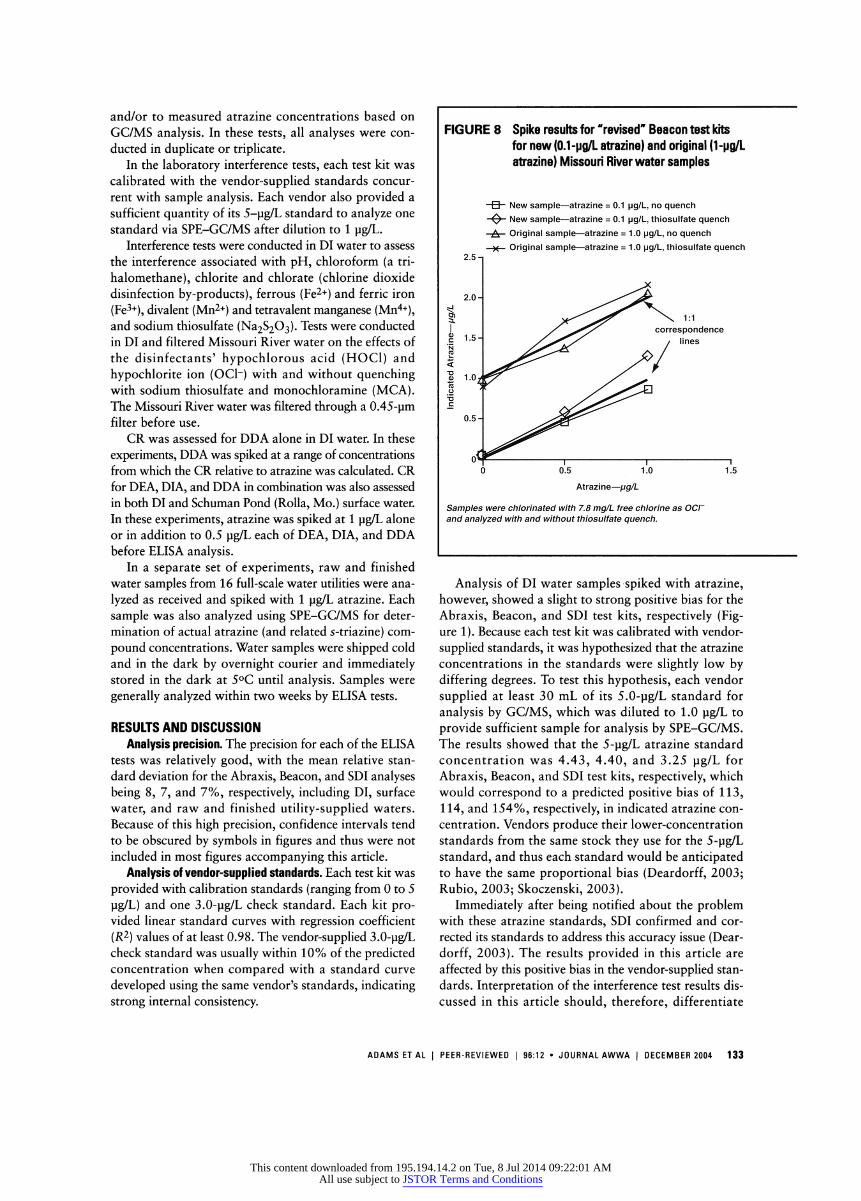
FIGURE 8 Spike results for "revised" Beacon test kits for new (0.1 -pg/L atrazine) and original (1-pg/L atrazine) Missouri River water samples
Analysis of DI water samples spiked with atrazine, however, showed a slight to strong positive bias for the Abraxis, Beacon, and SDI test kits, respectively (Fig- ure 1). Because each test kit was calibrated with vendor- supplied standards, it was hypothesized that the atrazine concentrations in the standards were slightly low by differing degrees. To test this hypothesis, each vendor supplied at least 30 mL of its 5.0-pg/L standard for analysis by GC/MS, which was diluted to 1.0 pg/L to provide sufficient sample for analysis by SPE-GC/MS. The results showed that the 5-pg/L atrazine standard concentration was 4.43, 4.40, and 3.25 pg/L for Abraxis, Beacon, and SDI test kits, respectively, which would correspond to a predicted positive bias of 113, 114, and 154%, respectively, in indicated atrazine con- centration. Vendors produce their lower-concentration standards from the same stock they use for the 5-pg/L standard, and thus each standard would be anticipated to have the same proportional bias (Deardorff, 2003; Rubio, 2003; Skoczenski, 2003).
Immediately after being notified about the problem with these atrazine standards, SDI confirmed and cor- rected its standards to address this accuracy issue (Dear- dorff, 2003). The results provided in this article are affected by this positive bias in the vendor-supplied stan- dards. Interpretation of the interference test results dis- cussed in this article should, therefore, differentiate
ADAMS ETAL | PEER-REVIEWED | 96:12 • JOURNAL AWWA | DECEMBER 2004 133
This content downloaded from 195.194.14.2 on Tue, 8 Jul 2014 09:22:01 AMAll use subject to JSTOR Terms and Conditions

FIGURE 9 Indicated atrazine concentrations with "approved" and "revised" Beacon kits for 1.5-mg/L Cl2 spike, with and without thiosulfate quench, for unspiked and 1-pg/L atrazine-spiked samples
between the absolute accuracy of spiked samples (which is easily addressed though correcting the vendor-sup- plied standard) versus the effects of interferences on accu- racy (which may be inherent within each test as now manufactured).
CR of atrazine metabolites. CR by DDA versus atrazine (CRatr) was not supplied by Abraxis or SDI and there-
fore was determined experimentally by comparative response to varied con- centrations of DDA standards of the test kits. The calculated CRatr for DDA in DI water for the Abraxis, Bea- con, and SDI tests was 0.07, 0.04, and 0.08%, respectively. CRatr values for other related triazines supplied by the respective vendors are shown in Table 2. CR may vary with concentration when cross-reactivity data are inter- preted or applied for ELISA.
CR effects of DEA, DIA, and DDA in combination were examined by spik- ing both DI water and Schuman Pond water (ambient atrazine < 0.05 pg/L) with 1.0 pg/L atrazine only, or 1.0 pg/L atrazine plus 0.5 pg/L of each DEA, DIA, and DDA (Figure 1). The ELISA results showed no statistical difference (a = 0.05) between the atrazine-spiked water and the atrazine-plus-metabo- lite-spiked water.
Inorganic constituents in DI water. In DI water, the effect of pH on indicated atrazine for all three test kits was gen- erally insignificant, as shown in Figure 2. The effect of pH in surface waters was not examined but could be more significant because of speciation of nat- ural organic matter or other factors.
The interference of chloroform - a model trihalomethane disinfection by- product of chlorine - was determined in DI water at chloroform concentra- tions of 0, 40, 80, 200, and 500 pg/L. Even at the highest concentration, the indicated atrazine concentration was only 0.07, 0.02, and 0.12 pg/L for Abraxis, Beacon, and SDI, respectively (Figure 3).
Interference tests were conducted in DI water for chlorite (C102") and chlo- rate (CIO3") at concentrations ranging from 0 to 4 mg/L as ion-added sodium salts. The resulting indicated atrazine concentration for both C102" and CIO3" was always <0.04 pg/L for each test kit (data not shown).
Interference tests were conducted in DI water for Fe2+ and Fe3+ - common groundwater constituents and coag- ulants - at concentrations up to 4 mg/L as iron added as chlorides. The resulting indicated atrazine concentration was always <0.012 pg/L for each test kit (data not shown).
Interference tests were conducted in DI water for Mn2+ and Mn4+ - common groundwater constituents -
134 DECEMBER 2004 | JOURNAL AWWA • 96:12 | PEER-REVIEWED | ADAMS ET AL
This content downloaded from 195.194.14.2 on Tue, 8 Jul 2014 09:22:01 AMAll use subject to JSTOR Terms and Conditions

at concentrations up to 2 mg/L as ion added as manganese (II) chlo- ride or manganese (IV) oxide. The resulting indicated atrazine concen- tration was always <0.02 pg/L for each test kit for C102" and CIO3- (data not shown).
Disinfectants and quenchants in Dl and surface water. Combined and free chlorine in Dl water with no quenching.The effect of MCA - or combined chlorine - on indicated atrazine concentration in Dl water was examined by spiking 0-7 mg/L of MCA into Dl water containing 0 or 1.0 pg/L atrazine. For compari- son, a typical MCA concentration in water treatment may be on the order of 2-3 mg/L. These samples were analyzed in the presence of the MCA, i.e., the MCA was not quenched before analysis.
For the nonatrazine-spiked sam- ples, the indicated atrazine concen- trations were 0.05 pg/L or less for all test kits at all MCA concentrations. For the 1.0-pg/L atrazine-spiked sam- ples, the indicated atrazine concen- tration for all MCA concentrations for the Abraxis and SDI test kits exhibited a bias of -2 to 10 and -12 to 9%, respectively, compared with the no-MCA sample (Figure 4). For the Beacon test kit, the indicated atrazine concentration increased significantly with increas- ing MCA dose (Figure 4). At the highest MCA concen- tration of 7 mg/L, the indicated atrazine for the Beacon test was more than twice the initial value with no MCA spike (2.7 versus 1.3 pg/L), and 2.7 times the actual con- centration of 1 pg/L atrazine (Figure 4).
To further examine the effect of MCA on the Beacon kit, MCA spiking experiments were repeated with both the "approved" and "revised" Beacon tubes in Dl water, both with and without a 1-pg/L atrazine spike. The results again showed no indicated atrazine concentration, even at the highest MCA dosages when atrazine was not pre- sent in the Dl water (Figure 5). The results also showed again a positive bias caused by MCA in the "approved" tubes but little bias with the "revised" tubes (Figure 5).
The effect of HOC1 and OCh in Dl water on indi- cated atrazine concentration was determined by analyz- ing Dl water containing no atrazine but with free chlorine concentrations of 0, 1, 2, 3, 5, and 7 mg/L as free chlo- rine (CI2) at two pH levels. No quenching of the oxidant was used. For comparison, a typical free chlorine con- centration in water treatment may be on the order of 1
TABLE 3 Spike percent recovery results for a 1-pg/L atrazine spike into raw and finished waters from 16 utilities*
Raw Water- % Finished Water- %
Utility or Statistic Abraxis): Beacon SDI Abraxis Beacon SDI
A 132 135 169 102 290 170 B 94 126 148 101 142 164 C 115 121 126 106 116 159 D 94 130 173 100 255 148 E 120 173 177 109 182 137 F 99 216 179 110 238 161 G 141 202 173 106 198 101 H 104 140 128 108 224 148 I 77 108 80 114 96 121 J 153 126 124 111 113 131 K 142 151 82 109 114 151 L 100 159 92 113 88 125 M 107 219 147 108 113 129 N 94 203 122 110 112 138 O 84 195 132 121 117 139 P 199 127 76 133 65 114
Mean 116 158 133 110 154 140 Standard 31 37 36 8 68 19 deviation Median 106 146 130 109 117 138 Maximum 199 219 179 133 290 170 Minimum 77 108 76 100 65 101 *Beacon results are for the "approved" kits. t Abraxis LLC, Warminster, Pa.; Beacon Analytical Systems Inc., Portland, Maine; Strategic Diagnostics Inc., Newark, Del.
mg/L. At pH 7.6, HOC1 and OCl~ are in approximately equal concentrations, whereas at a pH of 9.1 a majority of the oxidant exists as the less-reactive OCh. For both Abraxis and SDI, there was no observable effect of free chlorination at either pH (Figure 6). For the Beacon test kit, however, the chlorine dosages above 2 mg/L caused significant interference as manifested in the indicated atrazine concentration and that increased with increasing chlorine concentration, reaching more than 4 pg/L atrazine for a chlorine concentration of 7 mg/L at pH 7.6 (Figure 7). There was a significant pH effect observed for this interference with the Beacon test kit, with lower pH caus- ing a greater interference. Whatever the mechanism of interference, it is hypothesized that a shift of OCh at the higher pH to the much stronger HOC1 at the lower pH enhanced the mechanism of interference. Thus it is also hypothesized (though not tested) that great interference may occur at even lower pH levels where a majority of the oxidant shifts to the HOC1 form.
The reason for the significant positive interference observed with the Beacon test kit with both free (HOC1 and OC1") and combined (MCA) chlorine is not known.
ADAMS ETAL | PEER-REVIEWED | 96:12 • JOURNAL AWWA | DECEMBER 2004 135
This content downloaded from 195.194.14.2 on Tue, 8 Jul 2014 09:22:01 AMAll use subject to JSTOR Terms and Conditions
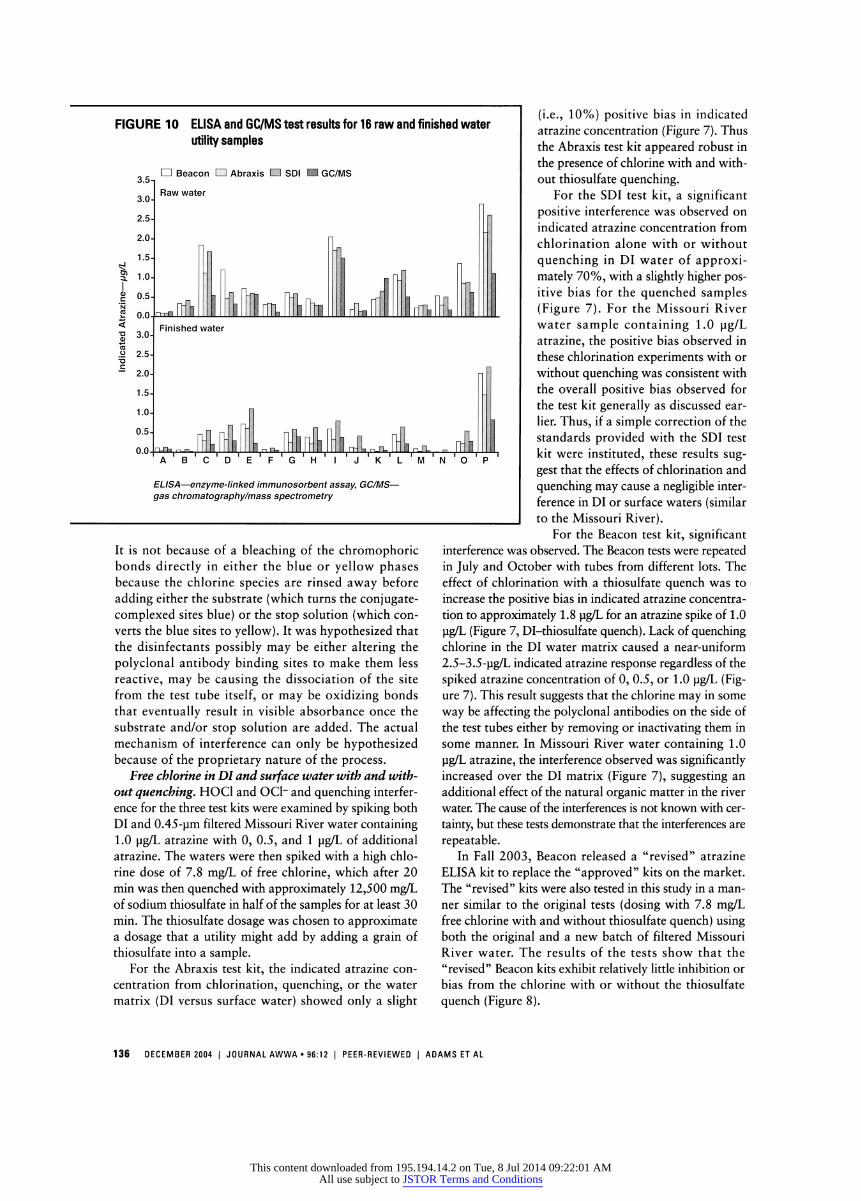
FIGURE 10 ELISA and GC/MS test results for 16 raw and finished water utility samples
It is not because of a bleaching of the chromophoric bonds directly in either the blue or yellow phases because the chlorine species are rinsed away before adding either the substrate (which turns the conjugate- complexed sites blue) or the stop solution (which con- verts the blue sites to yellow). It was hypothesized that the disinfectants possibly may be either altering the polyclonal antibody binding sites to make them less reactive, may be causing the dissociation of the site from the test tube itself, or may be oxidizing bonds that eventually result in visible absorbance once the substrate and/or stop solution are added. The actual mechanism of interference can only be hypothesized because of the proprietary nature of the process.
Free chlorine in DI and surface water with and with- out quenching . HOC1 and OCl~ and quenching interfer- ence for the three test kits were examined by spiking both DI and 0.45-pm filtered Missouri River water containing 1.0 pg/L atrazine with 0, 0.5, and 1 pg/L of additional atrazine. The waters were then spiked with a high chlo- rine dose of 7.8 mg/L of free chlorine, which after 20 min was then quenched with approximately 12,500 mg/L of sodium thiosulfate in half of the samples for at least 30 min. The thiosulfate dosage was chosen to approximate a dosage that a utility might add by adding a grain of thiosulfate into a sample.
For the Abraxis test kit, the indicated atrazine con- centration from chlorination, quenching, or the water matrix (DI versus surface water) showed only a slight
(i.e., 10%) positive bias in indicated atrazine concentration (Figure 7). Thus the Abraxis test kit appeared robust in the presence of chlorine with and with- out thiosulfate quenching.
For the SDI test kit, a significant positive interference was observed on indicated atrazine concentration from chlorination alone with or without quenching in DI water of approxi- mately 70%, with a slightly higher pos- itive bias for the quenched samples (Figure 7). For the Missouri River water sample containing 1.0 pg/L atrazine, the positive bias observed in these chlorination experiments with or without quenching was consistent with the overall positive bias observed for the test kit generally as discussed ear- lier. Thus, if a simple correction of the standards provided with the SDI test kit were instituted, these results sug- gest that the effects of chlorination and quenching may cause a negligible inter- ference in DI or surface waters (similar to the Missouri River).
For the Beacon test kit, significant interference was observed. The Beacon tests were repeated in July and October with tubes from different lots. The effect of chlorination with a thiosulfate quench was to increase the positive bias in indicated atrazine concentra- tion to approximately 1.8 pg/L for an atrazine spike of 1.0 pg/L (Figure 7, Dl-thiosulfate quench). Lack of quenching chlorine in the DI water matrix caused a near-uniform 2.5-3.5-pg/L indicated atrazine response regardless of the spiked atrazine concentration of 0, 0.5, or 1.0 pg/L (Fig- ure 7). This result suggests that the chlorine may in some way be affecting the polyclonal antibodies on the side of the test tubes either by removing or inactivating them in some manner. In Missouri River water containing 1.0 pg/L atrazine, the interference observed was significantly increased over the DI matrix (Figure 7), suggesting an additional effect of the natural organic matter in the river water. The cause of the interferences is not known with cer- tainty, but these tests demonstrate that the interferences are repeatable.
In Fall 2003, Beacon released a "revised" atrazine ELISA kit to replace the "approved" kits on the market. The "revised" kits were also tested in this study in a man- ner similar to the original tests (dosing with 7.8 mg/L free chlorine with and without thiosulfate quench) using both the original and a new batch of filtered Missouri River water. The results of the tests show that the "revised" Beacon kits exhibit relatively little inhibition or bias from the chlorine with or without the thiosulfate quench (Figure 8).
136 DECEMBER 2004 | JOURNAL AWWA • 96:12 | PEER-REVIEWED | ADAMS ET AL
This content downloaded from 195.194.14.2 on Tue, 8 Jul 2014 09:22:01 AMAll use subject to JSTOR Terms and Conditions
Additional testing of both the "approved" and "revised" Beacon ELISA kits were conducted on lower, more typical free chlorine concentra- tions of 1.5 mg/L as CI2. Experiments were conducted with and without a 12,500-mg/L thiosulfate quench, and with and without a 1-pg/L atrazine spike. Four waters were examined including DI, and surface water from the Missouri River (Mo.), Gascanade River (Mo.), and Schuman Pond. The results of these experiments show that for the nonatrazine-spiked samples, the "revised" kits performed well and better than the "approved" kits (Fig- ure 9). Similarly, for the 1-pg/L atrazine-spiked samples, the "revised" kits performed well when no thiosul- fate spike was used (whereas the "approved" kits showed a positive bias). For samples quenched with 12,500 mg/L thiosulfate, a positive bias was observed for all water (Figure 9). The reason for this is not known.
Comparison of 16 water utilities. To provide comparative results for the three test kits in a variety of drinking waters, raw and finished water samples were analyzed from 16 water utilities in the United States representing surface water and groundwater, six major watersheds, and a variety of water qualities. DOC concentrations ranged from 2.2 to 11.8 mg/L with a mean DOC of 5.7 mg/L. The specific UV absorbance (SUVA) was calculated for each water as:
SUVA (L x mgr1 x m-i) + DOC(mgxL-i) ^
(cm"') DOC(mgxL-i) ^ x 100 (cm x rrr1)
(USEPA, 2003d) in which A2$4 is the absorbance of the 0.45-pm water sample at 254 nm with a path length of 1 cm. For the waters tested, the SUVA reached as high as 1.3 L/mg-m with a mean value of 0.70 L/mg-m suggest- ing a relatively low humic acid fraction of the DOC pool (method 415.2, USEPA, 2003).
For both raw and finished waters, ELISA tests were conducted on waters with no spike and spiked with 1.0 pg/L atrazine (from stock solution) for recovery analysis. For the nonspiked raw water samples, the indicated atrazine averaged 0.18, 0.41, and 0.31 pg/L greater than the GC/MS-determined atrazine values (Figure 10) for the Abraxis, Beacon, and SDI test kits, respectively. For the finished water samples, the indicated atrazine con-
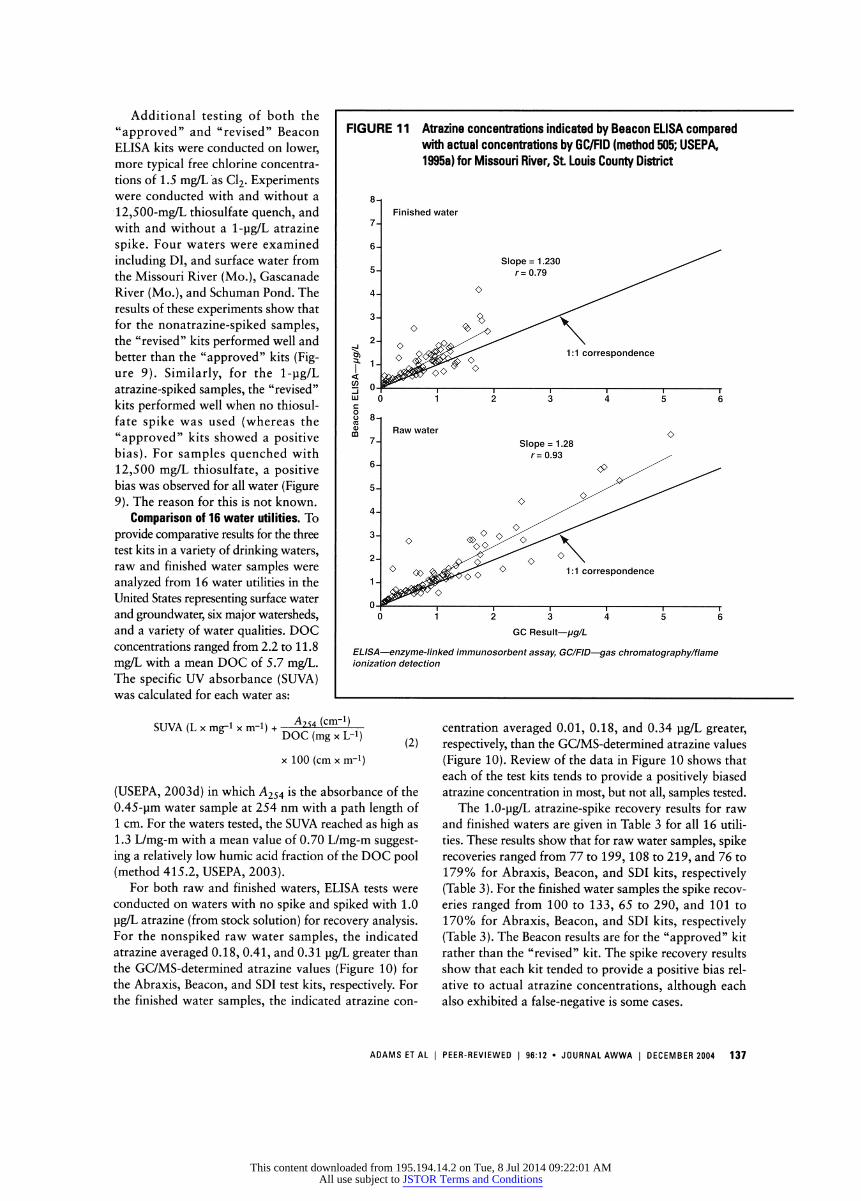
FIGURE 1 1 Atrazine concentrations indicated by Beacon ELISA compared with actual concentrations by GC/FID (method 505; USEPA, 1995a) for Missouri River, St Louis County District
centration averaged 0.01, 0.18, and 0.34 pg/L greater, respectively, than the GC/MS-determined atrazine values (Figure 10). Review of the data in Figure 10 shows that each of the test kits tends to provide a positively biased atrazine concentration in most, but not all, samples tested.
The 1.0-pg/L atrazine-spike recovery results for raw and finished waters are given in Table 3 for all 16 utili- ties. These results show that for raw water samples, spike recoveries ranged from 77 to 199, 108 to 219, and 76 to 179% for Abraxis, Beacon, and SDI kits, respectively (Table 3). For the finished water samples the spike recov- eries ranged from 100 to 133, 65 to 290, and 101 to 170% for Abraxis, Beacon, and SDI kits, respectively (Table 3). The Beacon results are for the "approved" kit rather than the "revised" kit. The spike recovery results show that each kit tended to provide a positive bias rel- ative to actual atrazine concentrations, although each also exhibited a false-negative is some cases.
ADAMS ETAL | PEER-REVIEWED | 96:12 • JOURNAL AWWA | DECEMBER 2004 137
This content downloaded from 195.194.14.2 on Tue, 8 Jul 2014 09:22:01 AMAll use subject to JSTOR Terms and Conditions

Part of this positive bias is related to CR associated with related chloro-s-triazines in solution. Chloro-s-tri- azines observed via SPE-GC/MS in the drinking waters were atrazine, SIM, DEA, DIA, and DDA. (PROP and CYAN were not observed.) Using the vendor-supplied CR values, an estimated indicated atrazine concentration including CR (excluding DDA) was determined for each test kit. For the finished (treated) waters, the estimated indicated atrazine concentration including CR estimates that ranged from 0 to 22, 0 to 9, and 0 to 29% greater than expected for atrazine alone for the Abraxis, Bea- con, and SDI test kits, respectively. Thus in some cases up to 30% of the positive bias can be attributed to CR with metabolites (mostly DEA-based).
Additional water utility comparison of Beacon ELISA. Atrazine monitoring data for a conventional lime-soft- ening water treatment plant was provided to the research team for analysis from the Missouri American Water Co. (Keck, 2004). Paired data for the "approved" Beacon atrazine ELISA results and GC analysis using method AG-625 (USEPA, 2002c) were provided for atrazine con- centrations in raw and finished waters from 2003. The analyses were conducted in the Missouri America Water Laboratory that is certified by the Missouri Department of Natural Resources.
The analysis showed that for the raw waters, the GC- and ELISA-based concentrations were correlated (a = 0.05) with a slope of 1.28 and an r of 0.93 (Figure 11). For the finished waters, the GC and ELISA concentra-
tions were correlated (a = 0.05) with a slope of 1.30 and a correlation coefficient of 0.79 (Figure 11). Ratios of atrazine by GC to atrazine by ELISA ranged from 0.6 to 6.0 for raw waters and 0.5 to 4.7 for finished waters. These results again show that the ELISA results were typ- ically positively biased (often highly), although numerous negatively biased samples were also observed (Figure 11).
SUMMARY AND CONCLUSION In a majority of instances, each of the ELISA test kits
examined provided a positive bias; i.e., the indicated ELISA concentration was usually higher than actual con- centrations. It is equally important that each kit in some cases provided a negative bias. These biases (especially the negative bias) may limit the effectiveness for ELISA for atrazine regulatory compliance monitoring. There are many other applications of ELISA, however, including frequent monitoring for early detection of atrazine con- centration changes that might trigger conventional analy- sis by GC/MS or be used for activated carbon dosing or other treatment operating controls. More research and dis- cussion among stakeholders is needed to assess the best utilization of ELISA for atrazine analysis in the water industry.
ACKNOWLEDGMENT Funding for this project was provided by the Water
Industry Technical Action Fund (WITAF). WITAF is administered by AWWA and is funded through member
REFERENCES Brady, J.F. et al, 2001 . Interlaboratory Valida-
tion of an Atrazine Immunoassay. Jour. AWWA, 93:9:107.
Comber, S.D.W.; Watts, C.D.; & Young, B., 1996. Analytical Performance Testing of an Atrazine Immunoassay System. Analyst, 121:1485.
Deardorff, D., 2003. Personal communication. Del Valle, P.L. et al, 1996. Development of
Improved Immunoassay and HPLC Meth- ods for the Analysis of Chlorodiamino-s- triazine in Environmental Samples. Jour. Agricultural & Food Chem., 44:945.
Hayes, M.C.; Jourdon, S.W.; & Herzog, D.P., 1996. Determination of Atrazine in Water by Particle Immunoassay: Collaborative Study. Jour. AOAC Intl., 79:2:529.
Hottenstein, C.S. et al, 1996. Determination of Trace Atrazine Levels in Water by a Sen- sitive Magnetic Particle-Based Enzyme Immunoassay. Jour. Agricultural & Food Chem., 44:3576.
Jiang, H.; Adams, C.; & Koffskey, W., 2004. Determination of Chloro-s-triazines including Didealkylatrazine Using Solid
Phase Extraction Coupled With Gas Chro- matography/Mass Spectrometry. Jour. Chromatog. A, in review.
Keck, P., 2004. Personal communication. Missouri American Water Co., Chesterfield, Mo.
Lydy, M.J.; Carter, D.S.; & Crawford, C.G., 199Chromatography/Mass Spectrometry and Immunoassay Techniques on Con- centrations of Atrazine in Storm Runoff. Archives Environ. Contamination & Toxi- col., ZYm.
Muldoon, M.T., & Nelson, J.O., 1994a. Evalua- tion of the Effects of Selected Agricultural Materials on an ELISA for s-Triazines. Food & Agricultural Immunol., 6:357.
Muldoon, M.T. & Nelson, J.O., 1994b. Pesticide Waste Treatment Monitoring of s-Tri- azines Using Immunoassay. Jour. Agricul- tural & Food Chem., 42:1686.
Muldoon, M.T. et al, 1994. Hapten Synthesis and Immunoassay Development for the Analysis of Chlorodiamino-s-triazine in Treated Pesticide Waste and Rinsate. Jour. Agricultural & Food Chem., 42:747.
Muldoon, M.T.; Fries, G.F.; & Nelson, J.O., 1993. Evaluation of ELISA for the Multianalyte
Analysis of s-Triazines in Pesticide Waste and Rinsate. Jour. Agricultural & Food Chem., 41 :322.
Rubio, F.M., 2003, Personal communication. Abraxis LLC, Warminster, Pa.
Rubio, F.M. et al, 1991. Performance Charac- teristics of a Novel Magnetic-particle- based Enzyme-linked Immunosorbent Assay for the Quantitative Analysis of Atrazine and Related Triazines in Water Samples. Food & Agricultural Immunol., 3:113.
Skoczenski, B., 2003. Personal communication. Beacon Analytical Systems Inc., Portland, Maine.
Stearman, G.K., & Wells, M.J.M., 1993. Enzyme Immunoassay Microtiter Plate Response to Atrazine and Metolachior in Potentially Interfering Matrices. Bulletin Envir. Cont- amination & Toxicol., 51:588.
USEPA (US Environmental Protection Agency), 2004. http .//www. e p a . g o v/etv/ve rifica- tions/vcenter1-28.html
USEPA, 2003a. Availability of Atrazine Interim Risk Management Decision Document. Fed. Reg., 68:40:9652.
138 DECEMBER 2004 | JOURNAL AWWA • 96:12 | PEER-REVIEWED | ADAMS ET AL
This content downloaded from 195.194.14.2 on Tue, 8 Jul 2014 09:22:01 AMAll use subject to JSTOR Terms and Conditions
dues. WITAF funds information collection and analysis and other activities in support of sound and effective leg- islation, regulation, and drinking water policies and pro- grams. The authors wish to thank Fernando Rubio (Abraxis), Brian Skoczenski (Beacon Analytical), and David Deardorff (Strategic Diagnostics) for supplying the test kits used in the laboratory interference testing and for helpful discussions throughout the study. The authors would also like to thank all of the water utilities for their participation in this work and especially the valuable input on their observations and analytical concerns pro- vided by individuals such as Kim Brokering of Veolia Water in Indianapolis and Paul Keck of Missouri Amer- ican Water Co.
ABOUT THE AUTHORS: Craig Adams16 is the John and Susan Mathes Professor of Environmental Engineering and director of the Envi-
ronmental Research Center at the University of Missouri-Rolla, 220 Civil Engineering Building, Rolla, MO 65409; (573) 341-4041; e-mail [email protected] . Adams has 16 years of research experience in academia and industry, and his primary research focus is the analysis, occur- rence, and control of endocrine- dis-
rupting chemicals and antibiotics in drinking water and wastewater systems . Hua Jiang is a doctoral student at
the University of Missouri-Rolla. Michael McGuire is president of McGuire Environmental Consultants, Santa Monica, Calif., and Nicole Graziano is a staff engineer with McGuire Environmental Consultants in Denver, Colo. Alan Roberson is director of regulatory affairs for AWWA in Washington. At the time of this research, Michelle Frey was vice-president at McGuire Environmental Consultants, Denver, Colo.
FOOTNOTES ^upelco, Bellefonte, Pa. 2EQ Laboratories, Atlanta. 3Milli-Q Simplicity 185, Millipore, Billerica, Mass. 4Shimadzu TOC-5000A, Shimadzu Scientific Instruments, Columbia, Md. 5Cary 50 Cone UV-Vis specrophotometer, Varian Inc., Palo Alto, Calif. 6 Corning Model 340, Corning, N.Y. 'Envi-Carb, Supelco, Bellefonte, Pa. 8Oasis MCX, Waters, Milford, Mass. 9Agilent 6893, Agilent Technologies, Palo Alto, Calif. 10HP-MS5, Hewlett Packard, Avondale, Pa. n5973, Agilent Technologies, Palo Alto, Calif. 127673, Hewlett Packard, Avondale, Pa. 13Abraxis Atrazine Kit 100T (PN 500001), Abraxis LLC, Warminster, Pa.
14Beacon Atrazine Tube Kit (#CPT-004), Beacon Analytical Systems Inc., Portland, Maine
15SDI RaPID Assay® Atrazine Test Kit (A00002/A00071), Strategic Diagnostics Inc., Newark, Del.
USEPA, 2003b. Atrazine; Notice of Availability of Revised Atrazine Interim Reregistration Eligibility Decision (IRED). Fed. Reg., 68:216:63085.
USEPA, 2003c. National Primary Drinking Water Regulations; Announcement of Completion of EPA's Review of Existing Drinking Water Standards; Notice. Fed. Fleg., 68:138:42908.
USEPA, 2003d. Method 415.3. Determination of Total Organic Carbon and Specific UV Absorbance at 254 nm in Source Water and Drinking Water, Rev. 1.0. Office of Research and Development, Washington.
USEPA, 2002a. The Grouping of a Series of Triazine Pesticides Based on a Common Mechanism of Toxicity. USEPA Office of Pesticide Programs, Health Effects Division.
USEPA, 2002b. Atrazine; Availability of Revised Risk Assessments. Fed. Reg., 67:87:30379.
USEPA, 2002c. Unregulated Contaminant Monitoring Regulation: Approval of Ana- lytical Method for Aeromonas ; National Primary and Secondary Drinking Water Regulations: Approval of Analytical
Methods for Chemical and Microbiologi- cal Contaminants, Final Rule. Fed. Reg., 67:209:65888.
USEPA, 1996. Safe Drinking Water Act Amendments.
USEPA, 1995a. Method 505 - Analysis of Organohalide Pesticides and Commercial Polychlorinated Biphenyl (PCB) Products in Water by Microextraction and Gas Chromatography. Methods for the Deter- mination of Organic Compounds in Drink- ing Water, Supplement III. E PA- 600/R- 95/ 131.
USEPA, 1995b. Method 507 - Determination of Nitrogen- and Phosphorus-Containing Pesticides in Water by Gas Chromatogra- phy With a Nitrogen-Phosphorus Detec- tor. Methods for the Determination of Organic Compounds in Drinking Water, Supplement III. EPA-600/R-95/131.
USEPA, 1995c. Method 525.2 - Determination of Organic Compounds in Drinking Water by Liquid-Solid Extraction and Capillary Column Gas Chromatography/Mass Spec- trometry. Methods for the Determination of Organic Compounds in Drinking Water, Supplement III. EPA-600/R-95/131.
USEPA, 1991. SOCs and lOCs, Final Rule. Fed. Reg., 56:30:3526.
USEPA, 1976. Safe Drinking Water Act. 42 U.S.C. 300f-300j. Washington.
USEPA, 1947. Federal Insecticide, Fungicide, and Rodenticide Act. 7 U.S.C. 136- 136y. Washington.
White, P. et al, 2004a. Environmental Technol- ogy Verification Report-Abraxis LLC-Atrazine ELISA Kit (2/04), http://www.epa.gov/etv/verifications/vcen ter1-28.html.
White, P. et al, 2004b. Environmental Technol- ogy Verification Report-Beacon Analyti- cal Systems Inc.-Atrazine Tube Kit (2/04), http://www.epa.gov/etv/verifications/vcen ter1-28.html.
White, P. et al, 2004c. Environmental Technol- ogy Verification Report-Strategic Diag- nostics Inc.- RaPID Assay Kit (2/04), http://www.epa.gov/etv/verifications/vcen ter1-28.html.
Watts, D.W. & Novak, J.M., 1997. Evaluation of Atrazine-positive and False-positive Immunoassay Detections in Ground Water. Jour. Envir. Sci. & Health, B32:5:659.
ADAMS ETAL | PEER-REVIEWED | 96:12 • JOURNAL AWWA | DECEMBER 2004 139
If you have a commentafeout this article, please contact us [email protected].
This content downloaded from 195.194.14.2 on Tue, 8 Jul 2014 09:22:01 AMAll use subject to JSTOR Terms and Conditions