abc news/washington post poll: obama and 2014 politics
TRANSCRIPT
ABC NEWS/WASHINGTON POST POLL: Obama and 2014 Politics
EMBARGOED FOR RELEASE AFTER 12:01 a.m. Sunday, Jan. 26, 2014
Politics 2014: Low Confidence in Leaders
And a Dead Heat in Midterm Preferences
Barack Obama starts his sixth year in office with the public divided about his overall leadership,
dissatisfied with his economic stewardship and still steaming about his rollout of the health care
law – all factors threatening not only the president but his party in the midterm elections ahead.
Obama is off the floor, advancing from a career-worst 42-55 percent job approval rating in
November, as the HealthCare.gov website was crashing, to 46-50 percent now. Still, he’s
exceeded 50 percent approval in only two of 10 ABC News/Washington Post polls in the past
year, and none since last May.
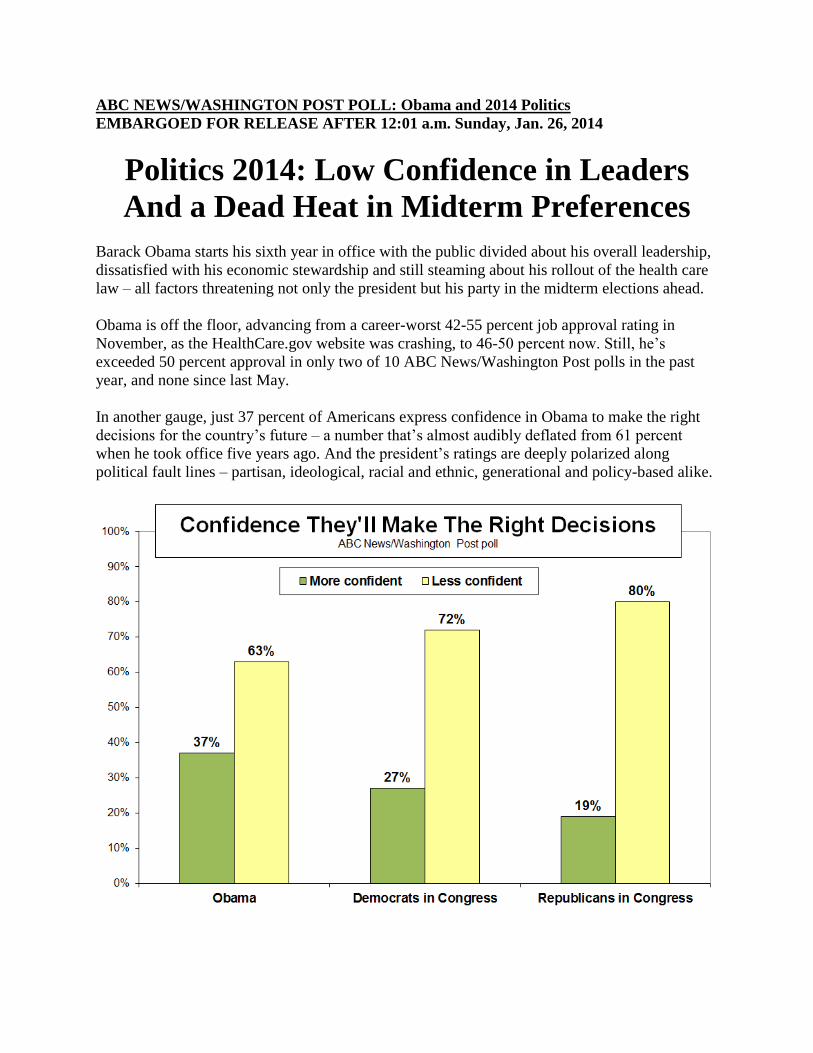
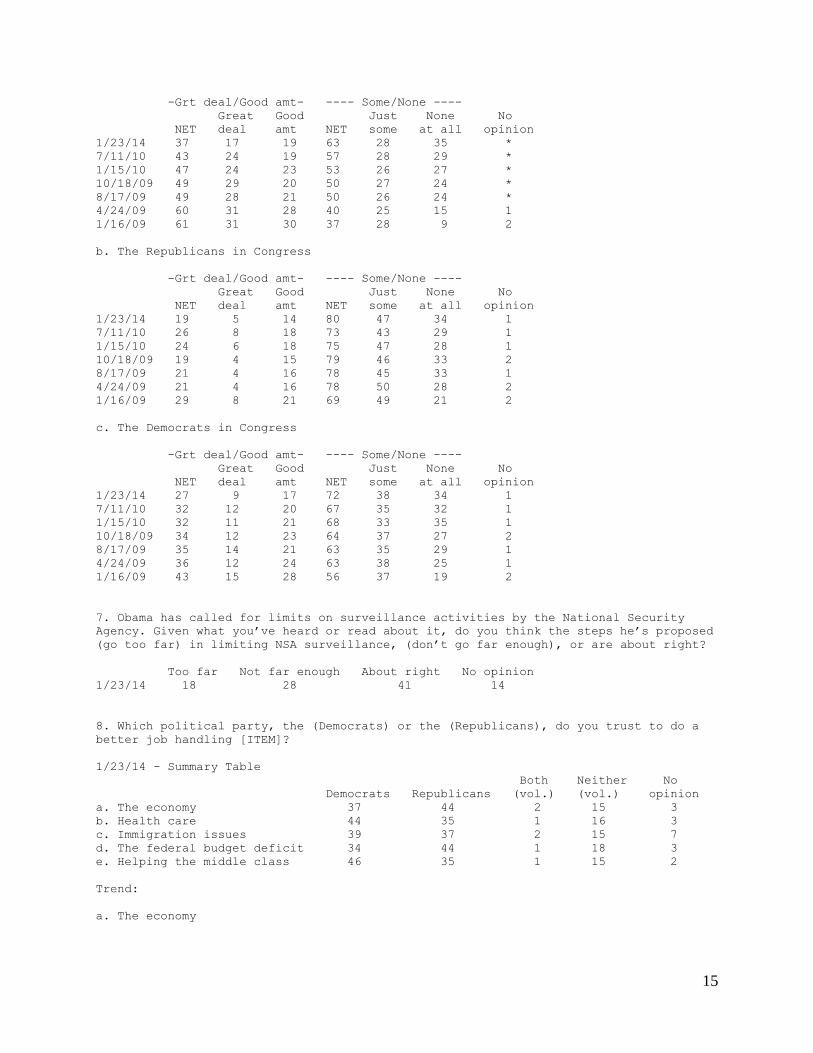
In another gauge, just 37 percent of Americans express confidence in Obama to make the right
decisions for the country’s future – a number that’s almost audibly deflated from 61 percent
when he took office five years ago. And the president’s ratings are deeply polarized along
political fault lines – partisan, ideological, racial and ethnic, generational and policy-based alike.
2
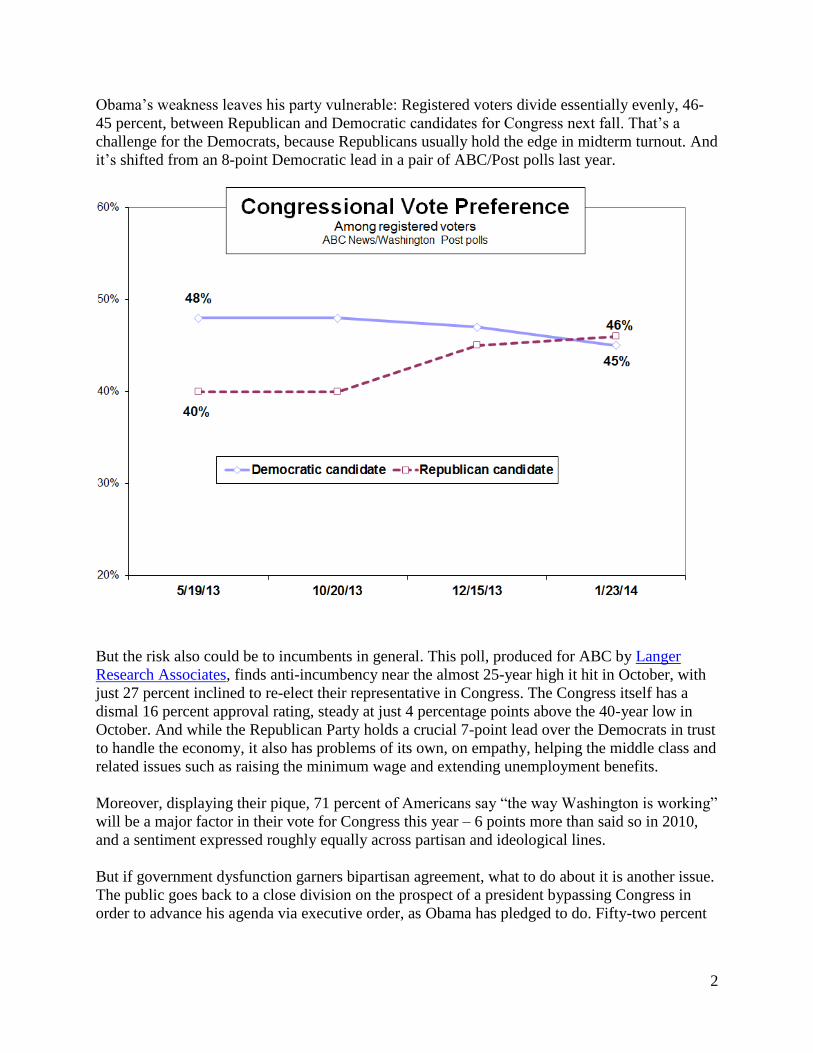
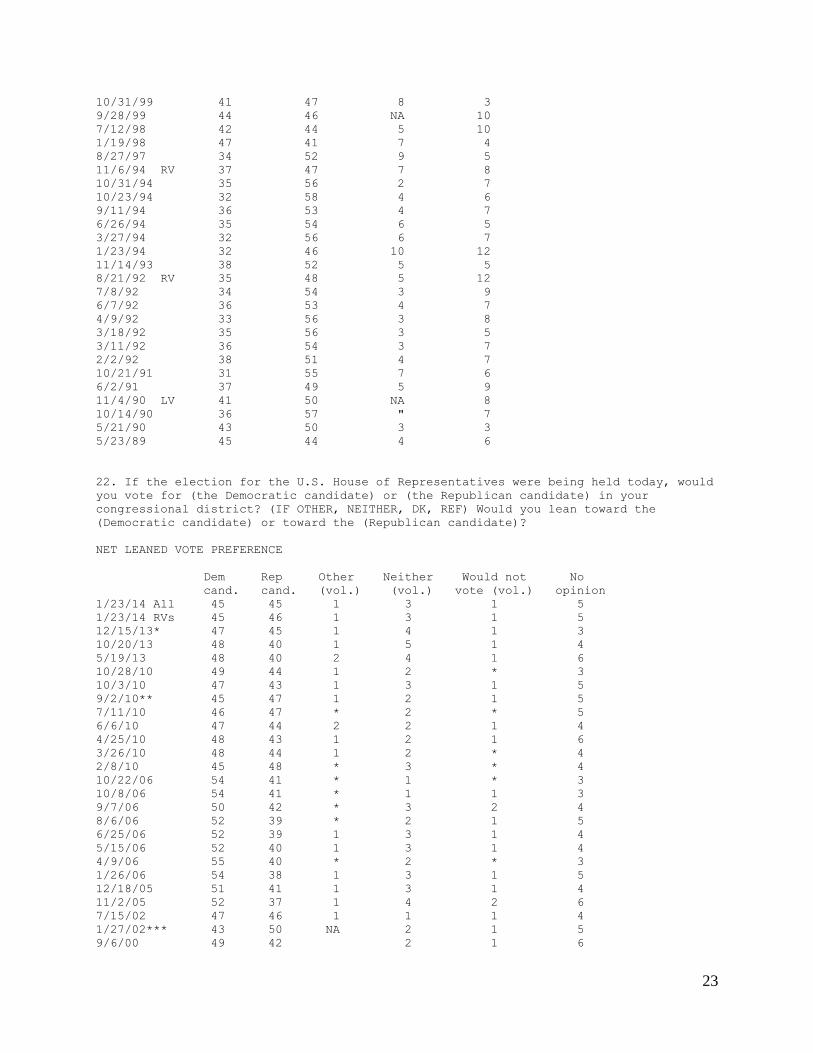
Obama’s weakness leaves his party vulnerable: Registered voters divide essentially evenly, 46-
45 percent, between Republican and Democratic candidates for Congress next fall. That’s a
challenge for the Democrats, because Republicans usually hold the edge in midterm turnout. And
it’s shifted from an 8-point Democratic lead in a pair of ABC/Post polls last year.
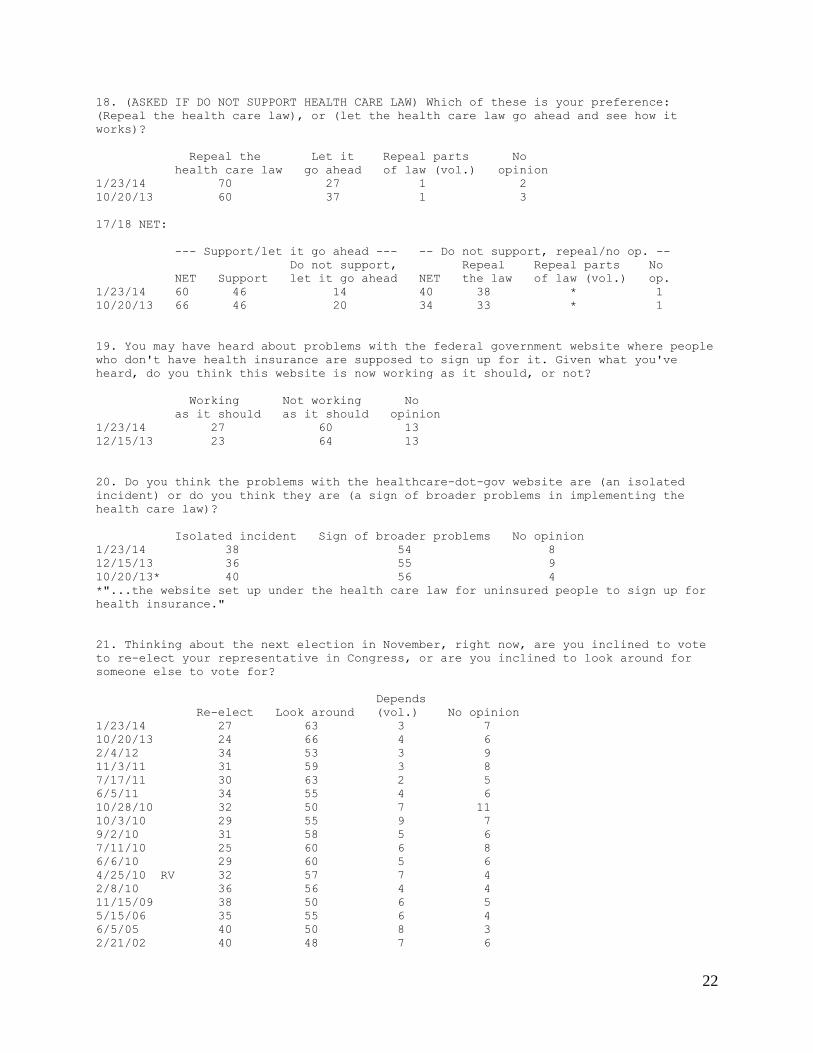
But the risk also could be to incumbents in general. This poll, produced for ABC by Langer
Research Associates, finds anti-incumbency near the almost 25-year high it hit in October, with
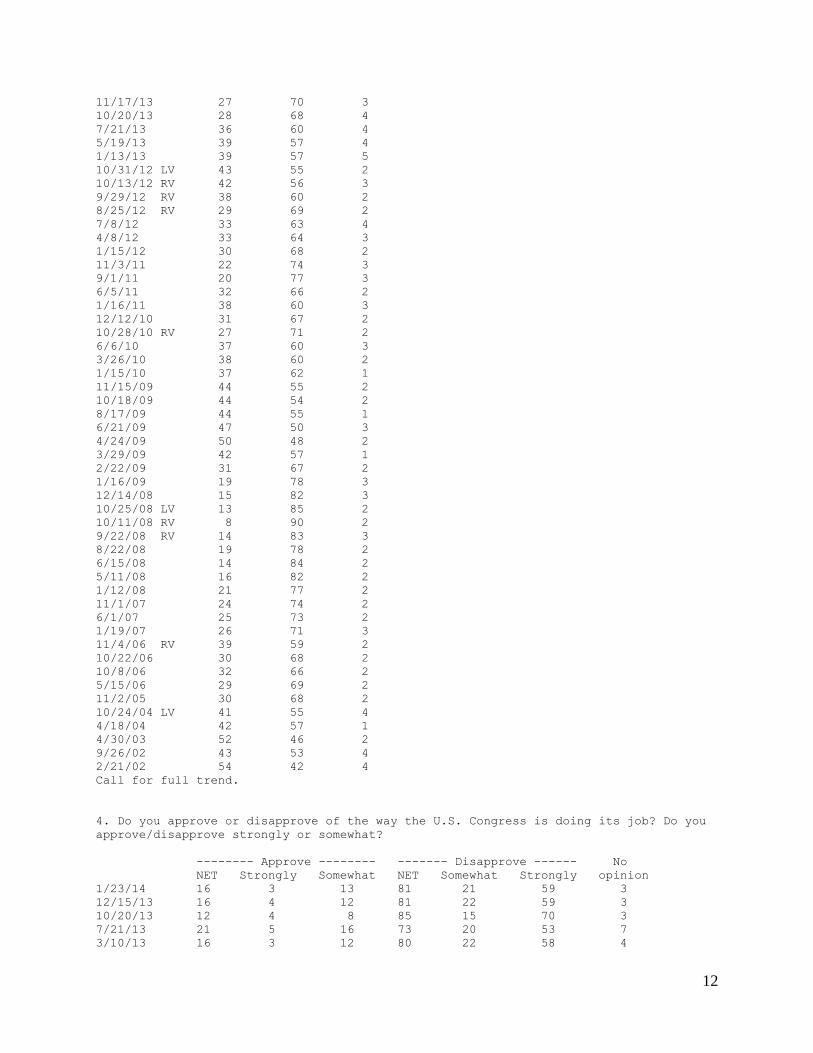
just 27 percent inclined to re-elect their representative in Congress. The Congress itself has a
dismal 16 percent approval rating, steady at just 4 percentage points above the 40-year low in
October. And while the Republican Party holds a crucial 7-point lead over the Democrats in trust
to handle the economy, it also has problems of its own, on empathy, helping the middle class and
related issues such as raising the minimum wage and extending unemployment benefits.
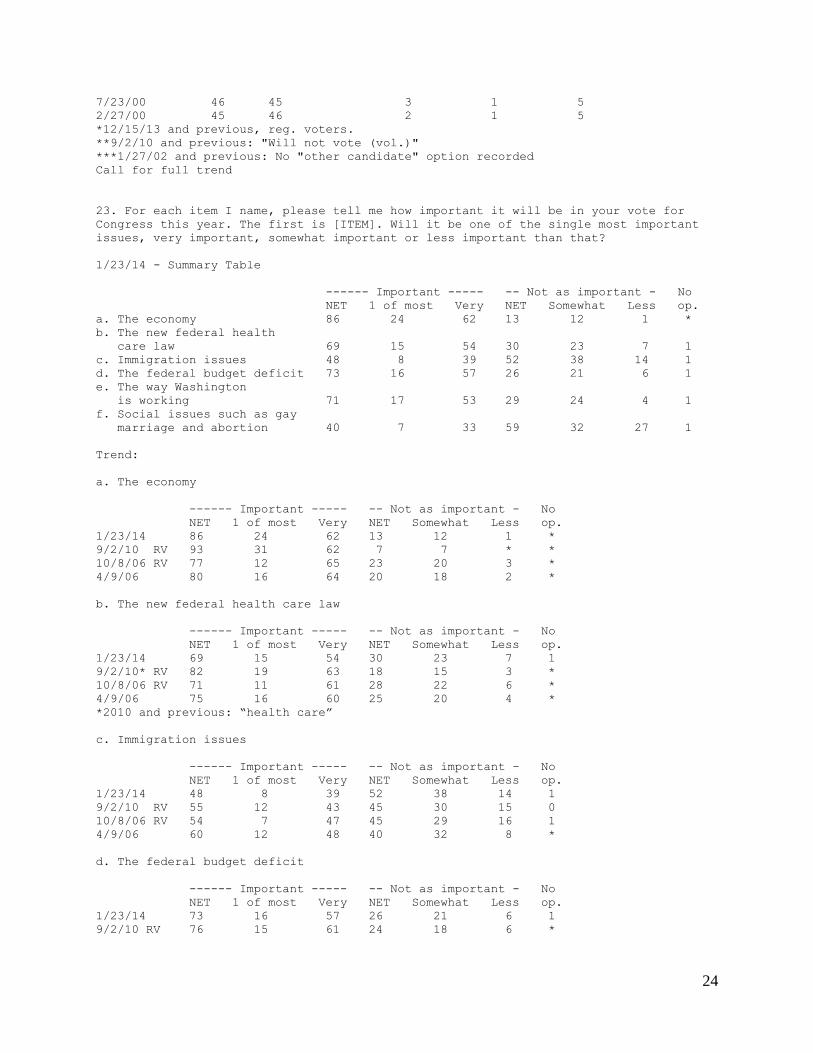
Moreover, displaying their pique, 71 percent of Americans say “the way Washington is working”
will be a major factor in their vote for Congress this year – 6 points more than said so in 2010,
and a sentiment expressed roughly equally across partisan and ideological lines.
But if government dysfunction garners bipartisan agreement, what to do about it is another issue.
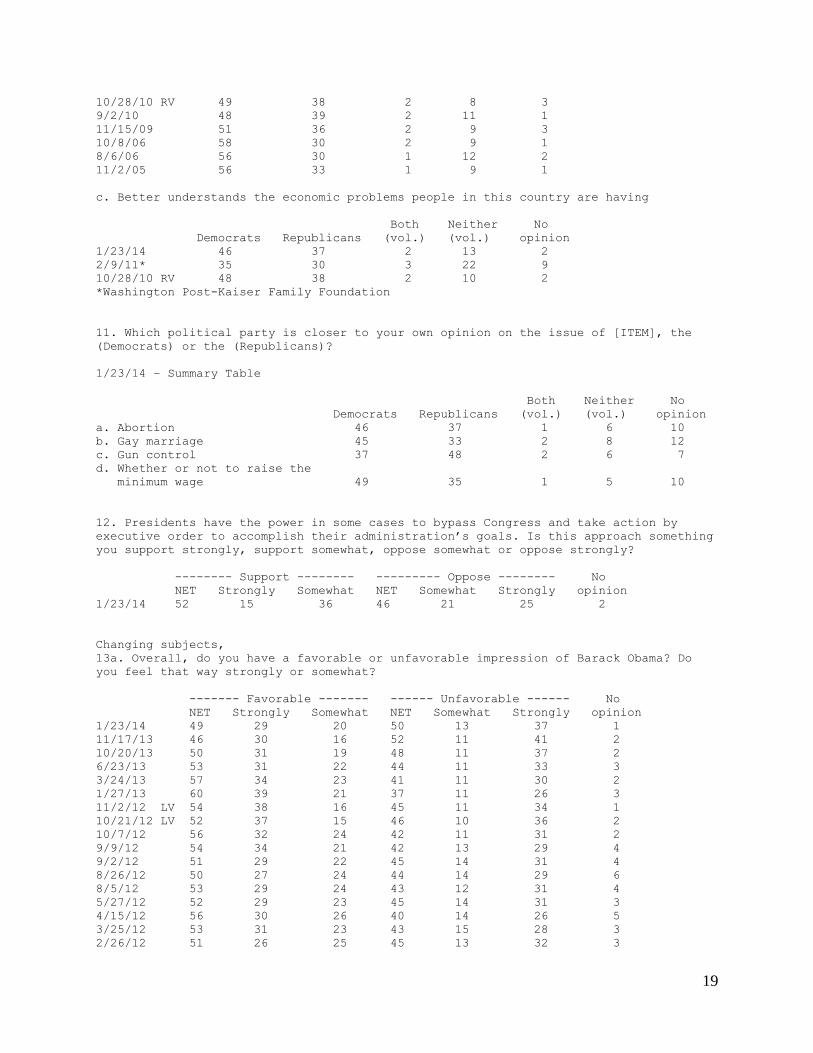
The public goes back to a close division on the prospect of a president bypassing Congress in
order to advance his agenda via executive order, as Obama has pledged to do. Fifty-two percent
3
like the idea, but 46 percent oppose it – and strongly held views on the issue are negative by a
10-point margin.
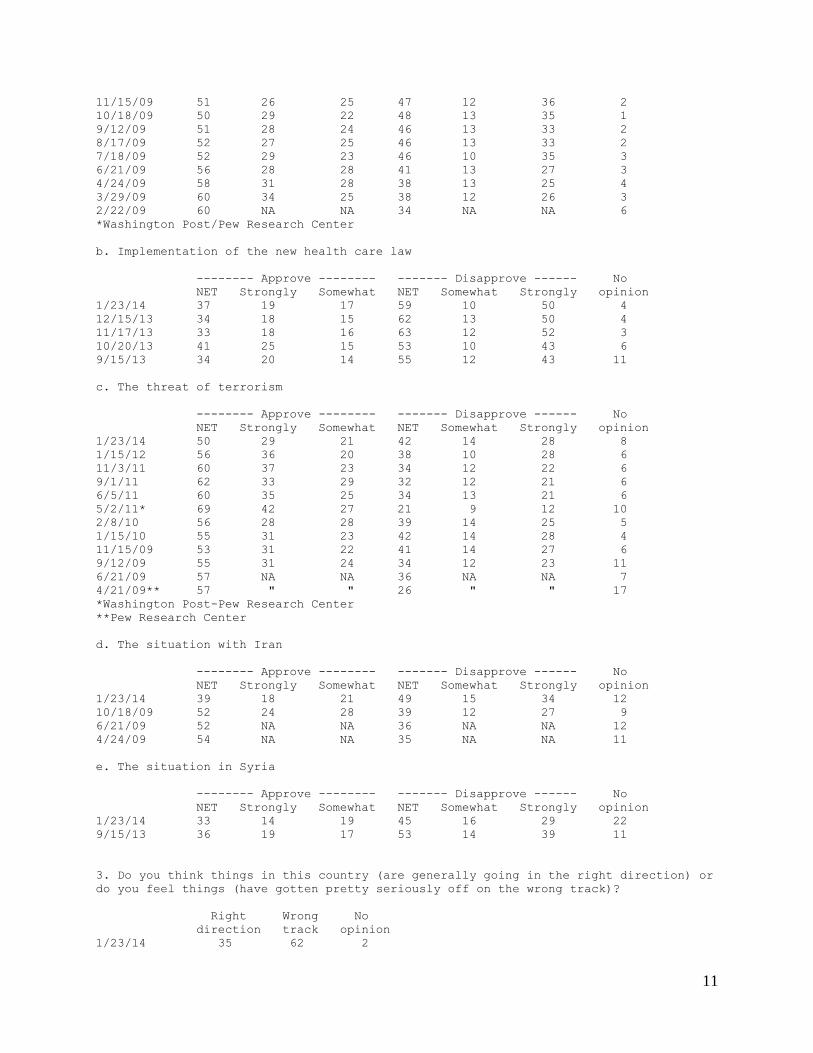
For all this, there is one slight break in the clouds: The number of Americans who say the
country is headed “pretty seriously off on the wrong track” has eased to 62 percent, from 70
percent in November. Still, that’s 14 points higher than it was in a short-lived burst of
comparative optimism not long after the president took office in 2009.
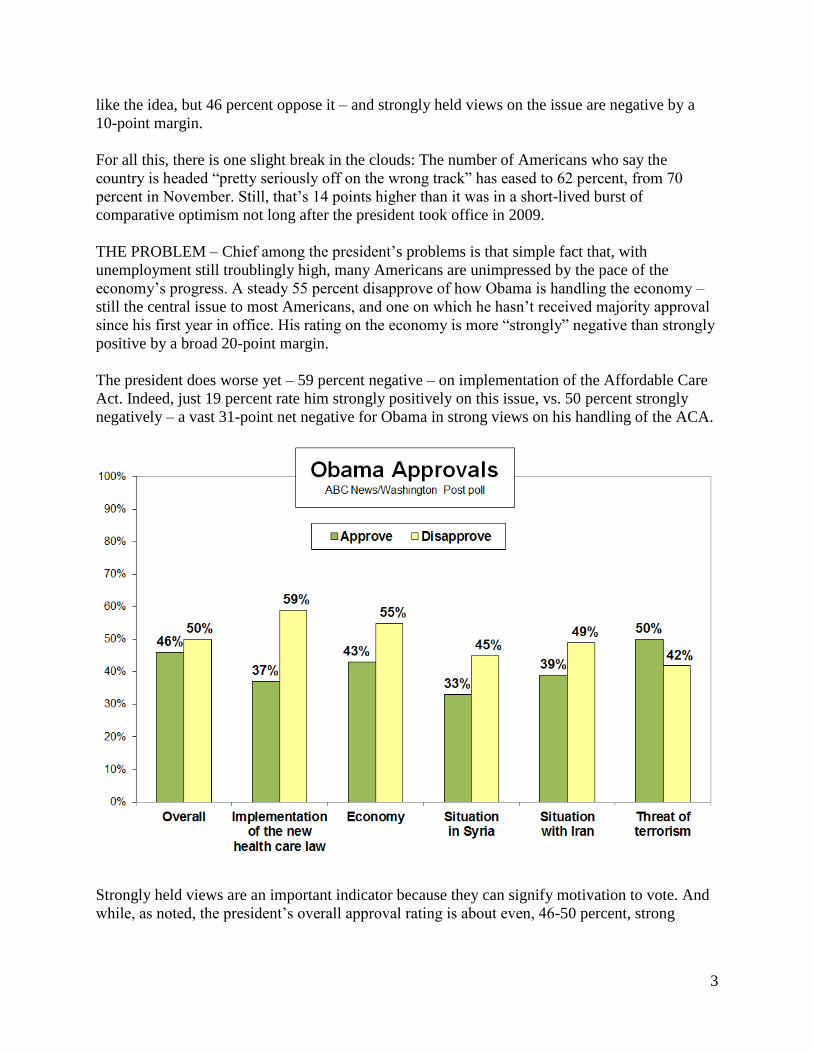
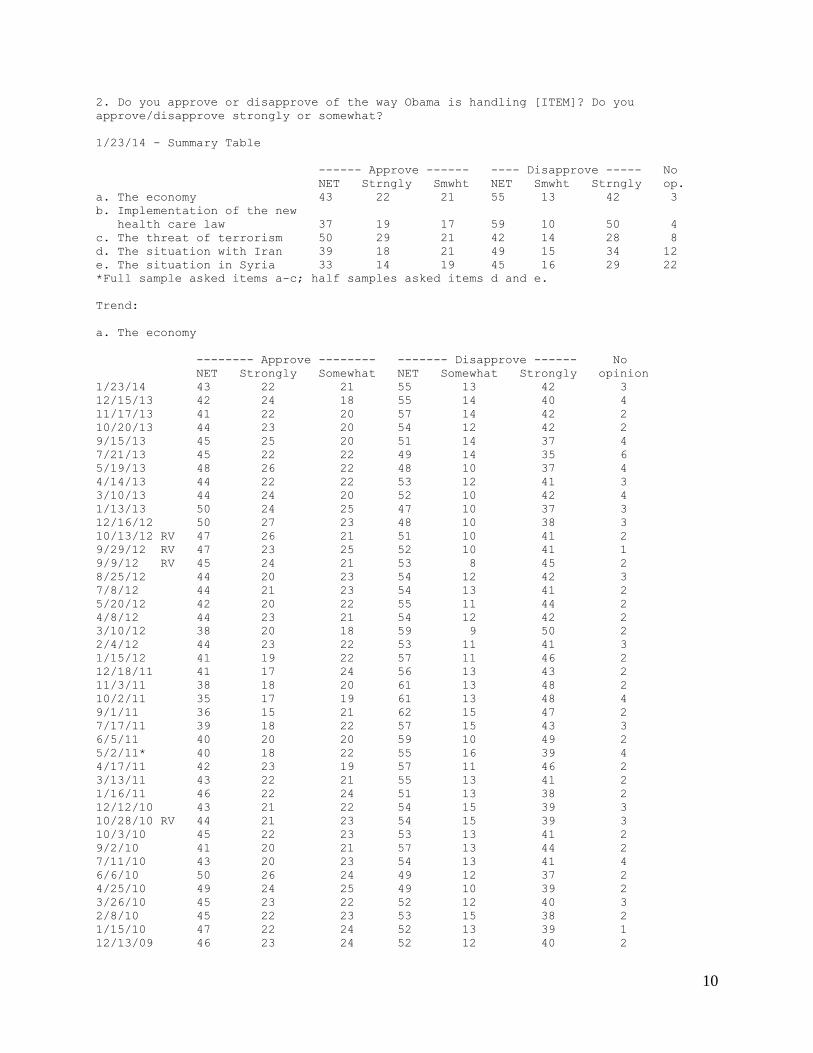
THE PROBLEM – Chief among the president’s problems is that simple fact that, with
unemployment still troublingly high, many Americans are unimpressed by the pace of the
economy’s progress. A steady 55 percent disapprove of how Obama is handling the economy –
still the central issue to most Americans, and one on which he hasn’t received majority approval
since his first year in office. His rating on the economy is more “strongly” negative than strongly
positive by a broad 20-point margin.
The president does worse yet – 59 percent negative – on implementation of the Affordable Care
Act. Indeed, just 19 percent rate him strongly positively on this issue, vs. 50 percent strongly
negatively – a vast 31-point net negative for Obama in strong views on his handling of the ACA.
Strongly held views are an important indicator because they can signify motivation to vote. And
while, as noted, the president’s overall approval rating is about even, 46-50 percent, strong
4
disapproval of his job performance exceeds strong approval by 18 points. With little for his
backers to rally around, there’s simply more mojo among his critics.
Other gauges back up his challenges. The president’s 50-42 percent rating for handling the threat
of terrorism has slipped under majority approval for the first time in his presidency. On overseas
challenges, his ratings on handling Iran and Syria are more negative than positive by 10 and 12
points, respectively. And on the controversy over surveillance activities by the National Security
Agency, well fewer than half, 41 percent, see the new limitations announced by Obama as “about
right.” Rather, in the can’t-buy-a-break department, 28 percent say his new limits don’t go far
enough, and 18 percent say they go too far – net criticism from 46 percent.
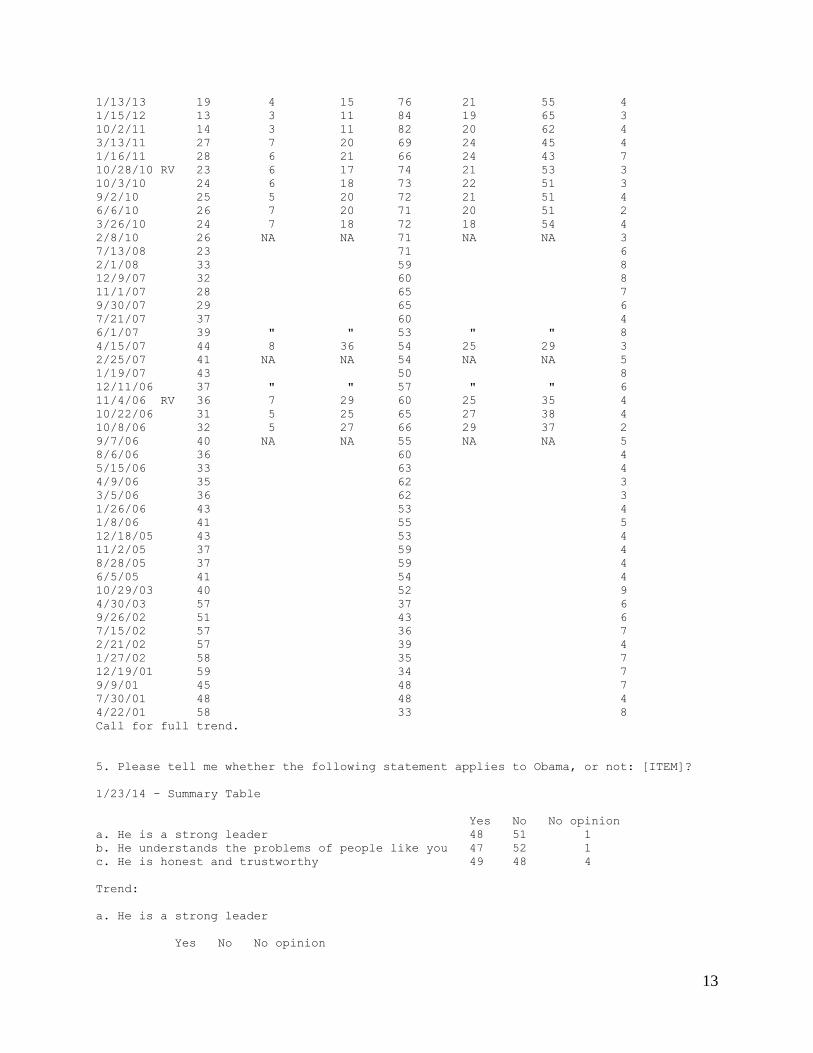
More personally, too, Americans divide on whether Obama’s a strong leader (48-51 percent) or
honest and trustworthy (49-48 percent) – ratings on which he got dinged by the Obamacare
meltdown and hasn’t recovered. His personal favorability rating, likewise, is another essentially
even split, 49-50 percent.
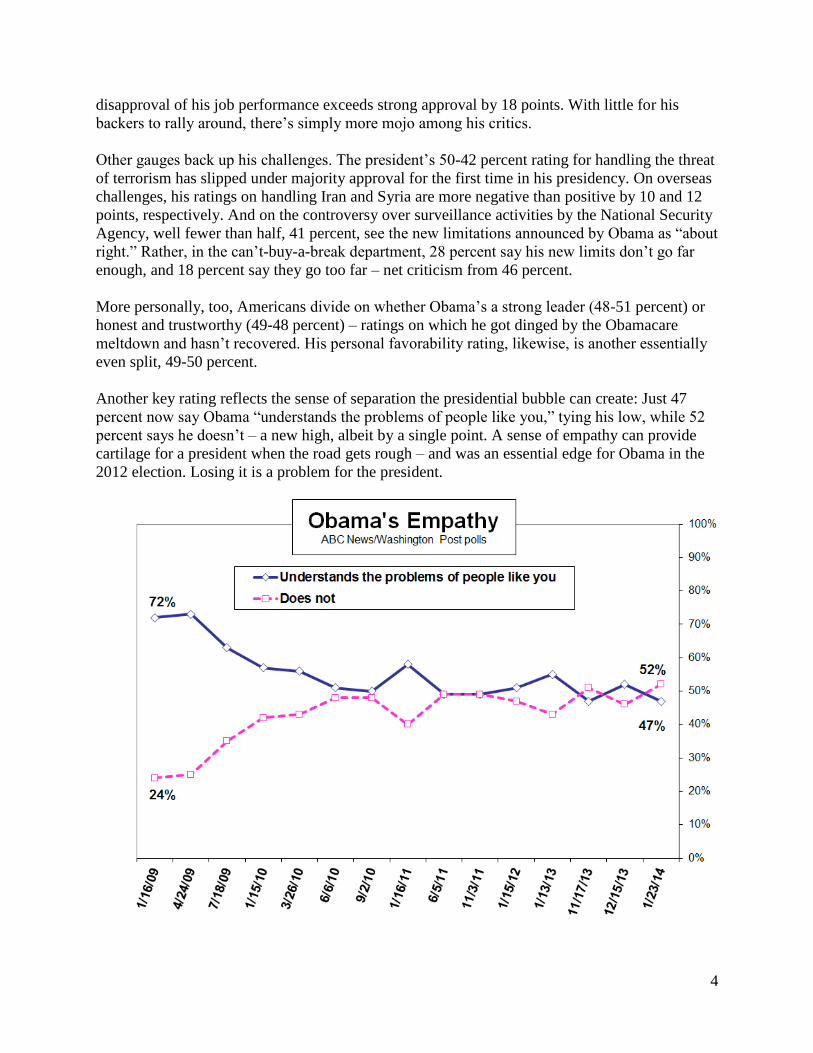
Another key rating reflects the sense of separation the presidential bubble can create: Just 47
percent now say Obama “understands the problems of people like you,” tying his low, while 52
percent says he doesn’t – a new high, albeit by a single point. A sense of empathy can provide
cartilage for a president when the road gets rough – and was an essential edge for Obama in the
2012 election. Losing it is a problem for the president.
5
As noted in last month’s ABC/Post poll, Obama’s five-year average rating is lower than his two-
term predecessors’ in available data back to Harry S. Truman, although, to be fair, Obama’s had
a singularly bad economy. He’s also experienced more political polarization than any president
in available ABC/Post data back to Ronald Reagan.
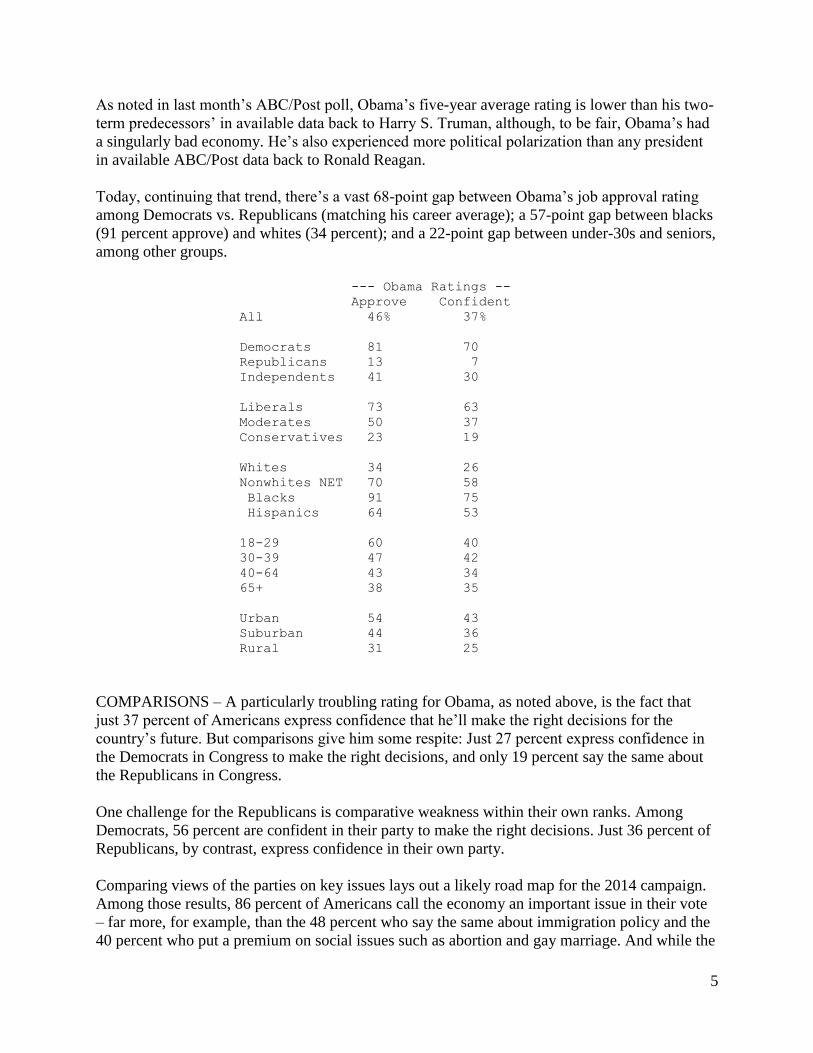
Today, continuing that trend, there’s a vast 68-point gap between Obama’s job approval rating
among Democrats vs. Republicans (matching his career average); a 57-point gap between blacks
(91 percent approve) and whites (34 percent); and a 22-point gap between under-30s and seniors,
among other groups.
--- Obama Ratings --
Approve Confident
All 46% 37%
Democrats 81 70
Republicans 13 7
Independents 41 30
Liberals 73 63
Moderates 50 37
Conservatives 23 19
Whites 34 26
Nonwhites NET 70 58
Blacks 91 75
Hispanics 64 53
18-29 60 40
30-39 47 42
40-64 43 34
65+ 38 35
Urban 54 43
Suburban 44 36
Rural 31 25
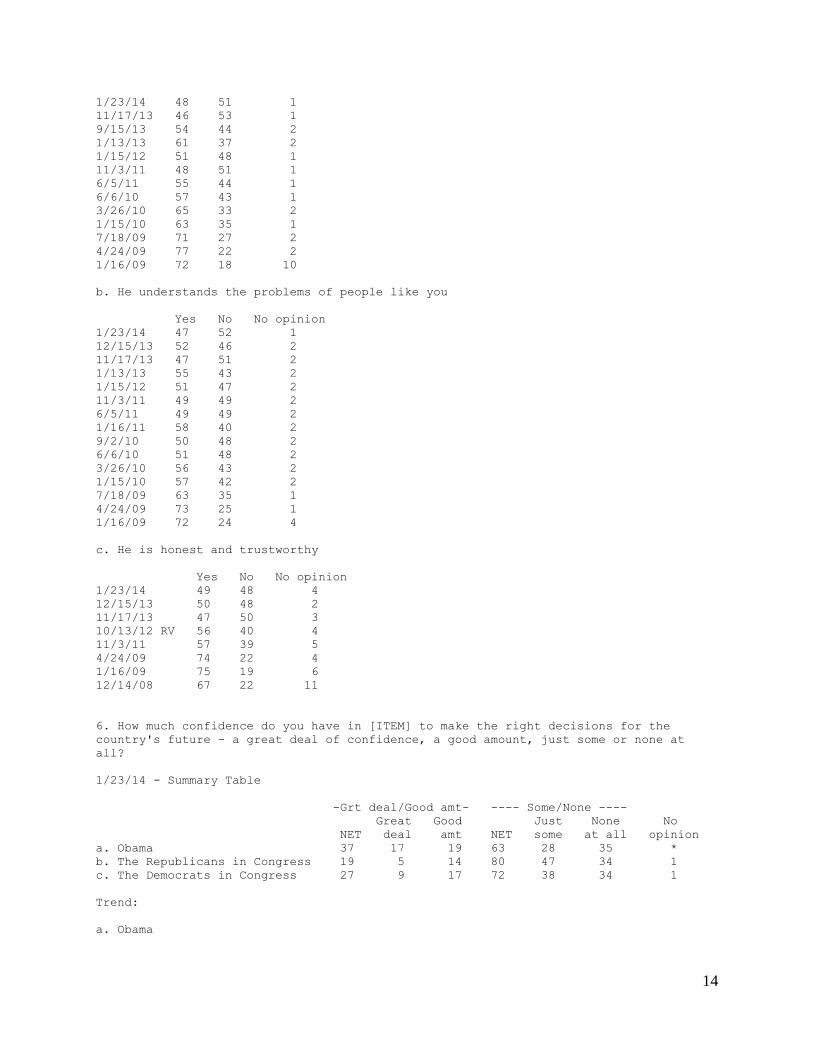
COMPARISONS – A particularly troubling rating for Obama, as noted above, is the fact that
just 37 percent of Americans express confidence that he’ll make the right decisions for the
country’s future. But comparisons give him some respite: Just 27 percent express confidence in
the Democrats in Congress to make the right decisions, and only 19 percent say the same about
the Republicans in Congress.
One challenge for the Republicans is comparative weakness within their own ranks. Among
Democrats, 56 percent are confident in their party to make the right decisions. Just 36 percent of
Republicans, by contrast, express confidence in their own party.
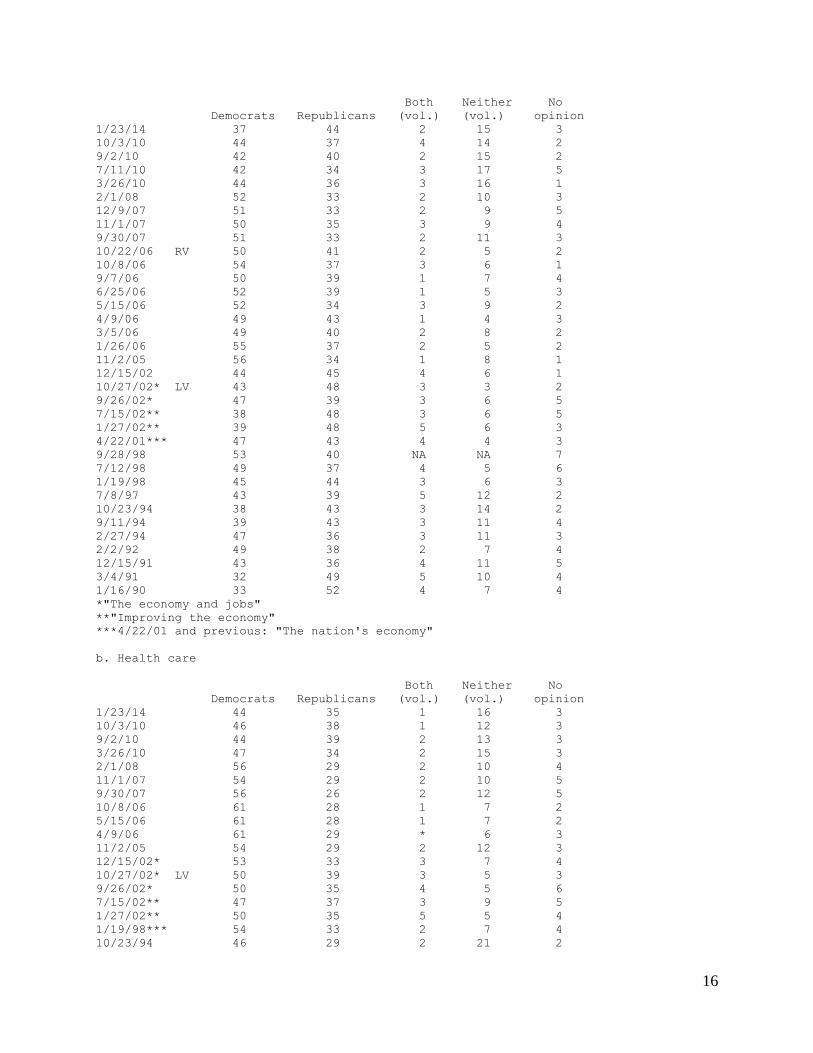
Comparing views of the parties on key issues lays out a likely road map for the 2014 campaign.
Among those results, 86 percent of Americans call the economy an important issue in their vote
– far more, for example, than the 48 percent who say the same about immigration policy and the
40 percent who put a premium on social issues such as abortion and gay marriage. And while the
6
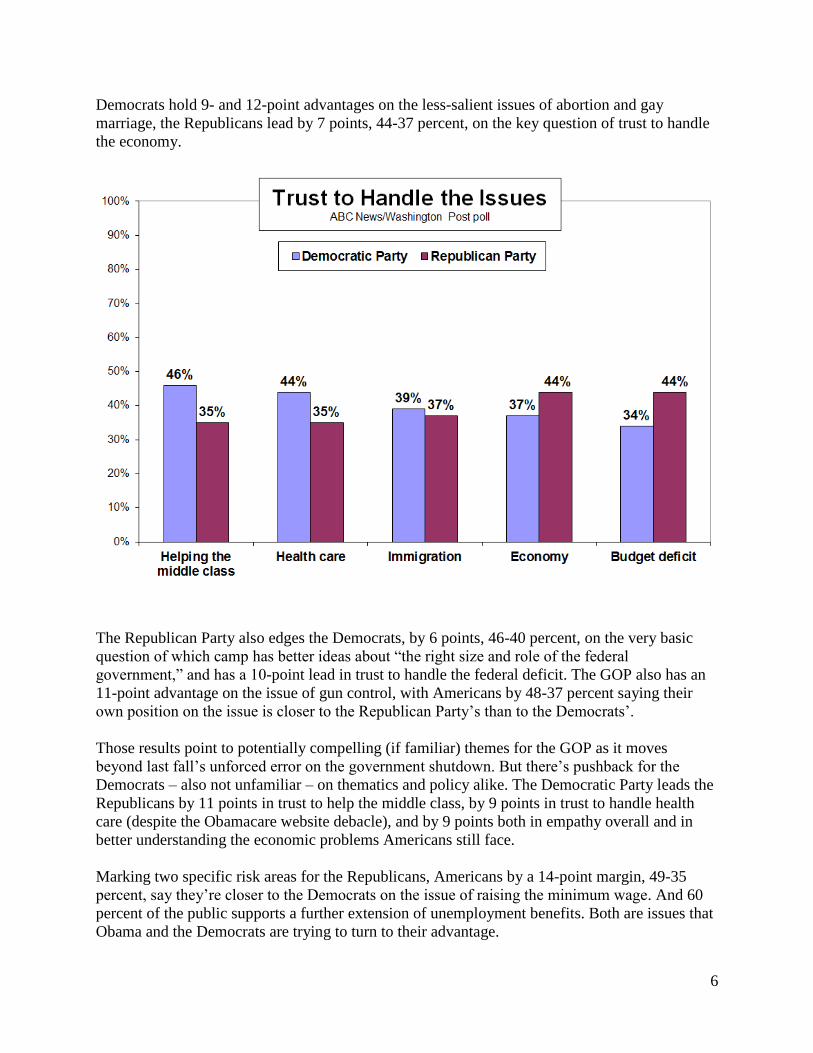
Democrats hold 9- and 12-point advantages on the less-salient issues of abortion and gay
marriage, the Republicans lead by 7 points, 44-37 percent, on the key question of trust to handle
the economy.
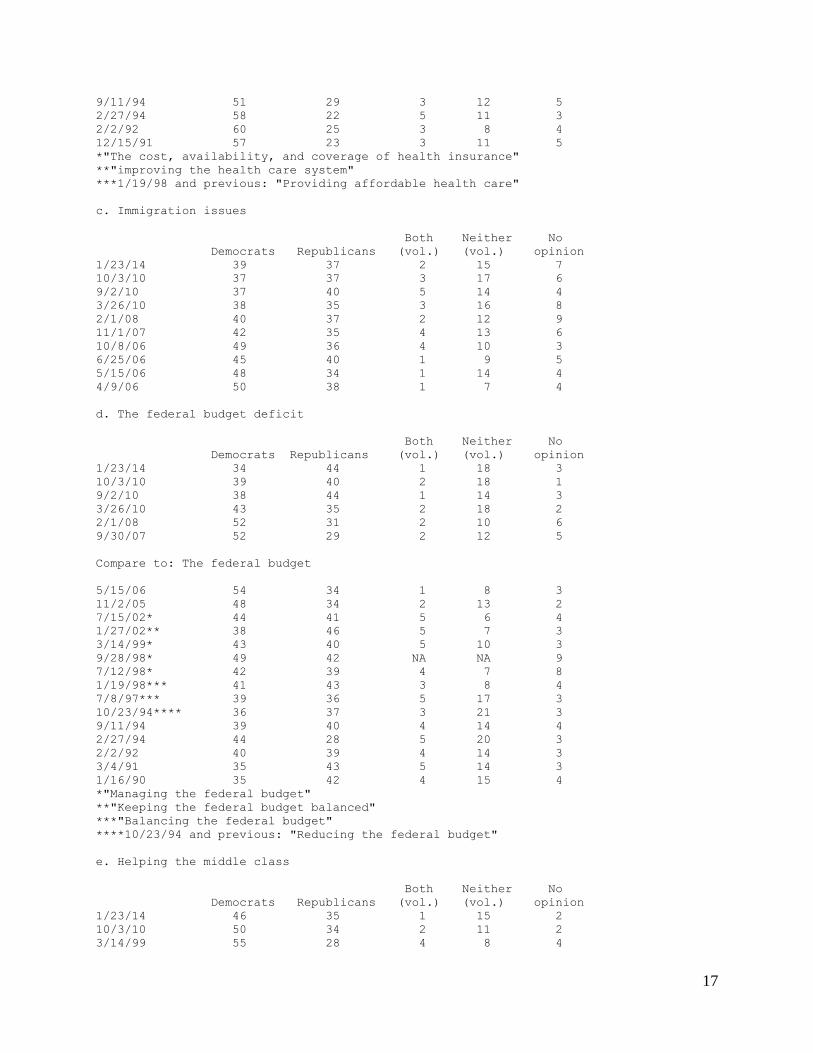
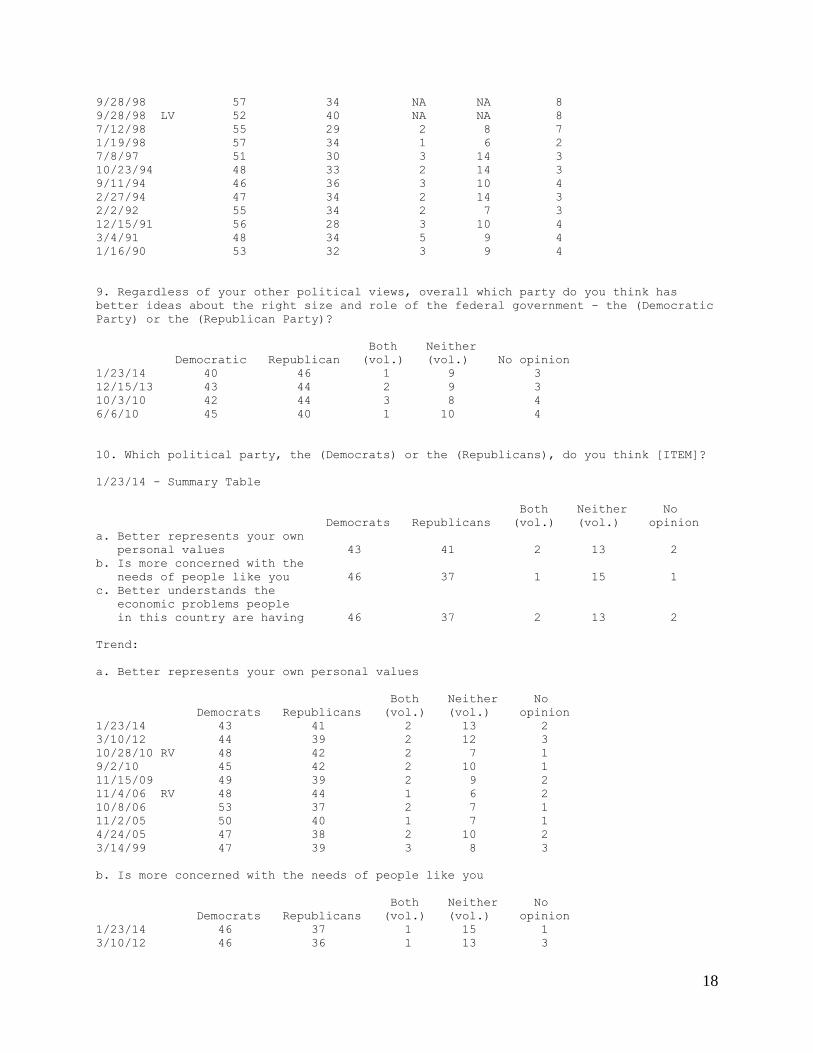
The Republican Party also edges the Democrats, by 6 points, 46-40 percent, on the very basic
question of which camp has better ideas about “the right size and role of the federal
government,” and has a 10-point lead in trust to handle the federal deficit. The GOP also has an
11-point advantage on the issue of gun control, with Americans by 48-37 percent saying their
own position on the issue is closer to the Republican Party’s than to the Democrats’.
Those results point to potentially compelling (if familiar) themes for the GOP as it moves
beyond last fall’s unforced error on the government shutdown. But there’s pushback for the
Democrats – also not unfamiliar – on thematics and policy alike. The Democratic Party leads the
Republicans by 11 points in trust to help the middle class, by 9 points in trust to handle health
care (despite the Obamacare website debacle), and by 9 points both in empathy overall and in
better understanding the economic problems Americans still face.
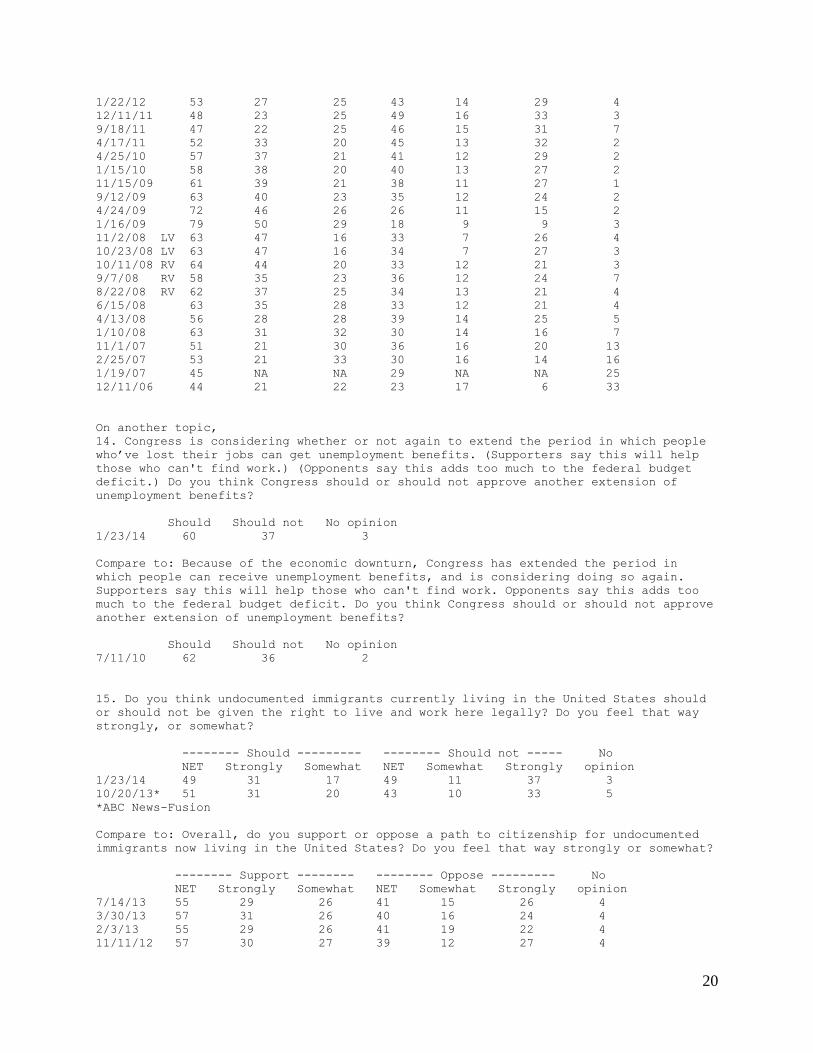
Marking two specific risk areas for the Republicans, Americans by a 14-point margin, 49-35
percent, say they’re closer to the Democrats on the issue of raising the minimum wage. And 60
percent of the public supports a further extension of unemployment benefits. Both are issues that
Obama and the Democrats are trying to turn to their advantage.
7
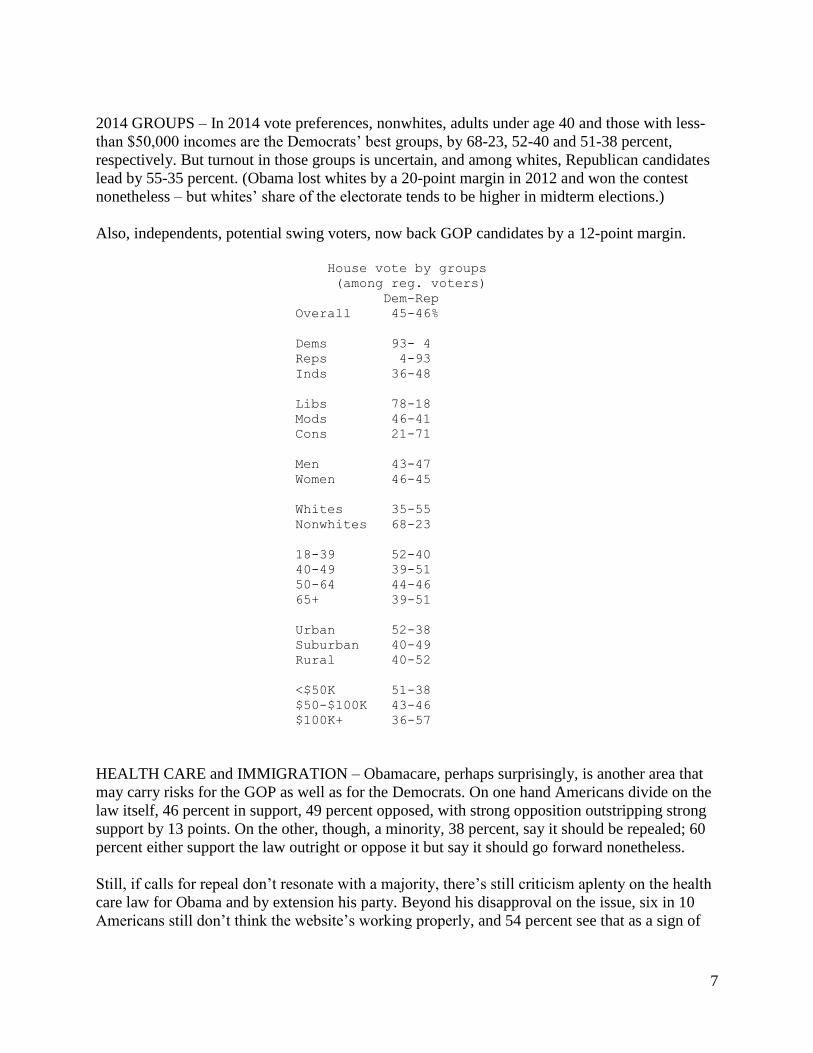
2014 GROUPS – In 2014 vote preferences, nonwhites, adults under age 40 and those with less-
than $50,000 incomes are the Democrats’ best groups, by 68-23, 52-40 and 51-38 percent,
respectively. But turnout in those groups is uncertain, and among whites, Republican candidates
lead by 55-35 percent. (Obama lost whites by a 20-point margin in 2012 and won the contest
nonetheless – but whites’ share of the electorate tends to be higher in midterm elections.)
Also, independents, potential swing voters, now back GOP candidates by a 12-point margin.
House vote by groups
(among reg. voters)
Dem-Rep
Overall 45-46%
Dems 93- 4
Reps 4-93
Inds 36-48
Libs 78-18
Mods 46-41
Cons 21-71
Men 43-47
Women 46-45
Whites 35-55
Nonwhites 68-23
18-39 52-40
40-49 39-51
50-64 44-46
65+ 39-51
Urban 52-38
Suburban 40-49
Rural 40-52
<$50K 51-38
$50-$100K 43-46
$100K+ 36-57
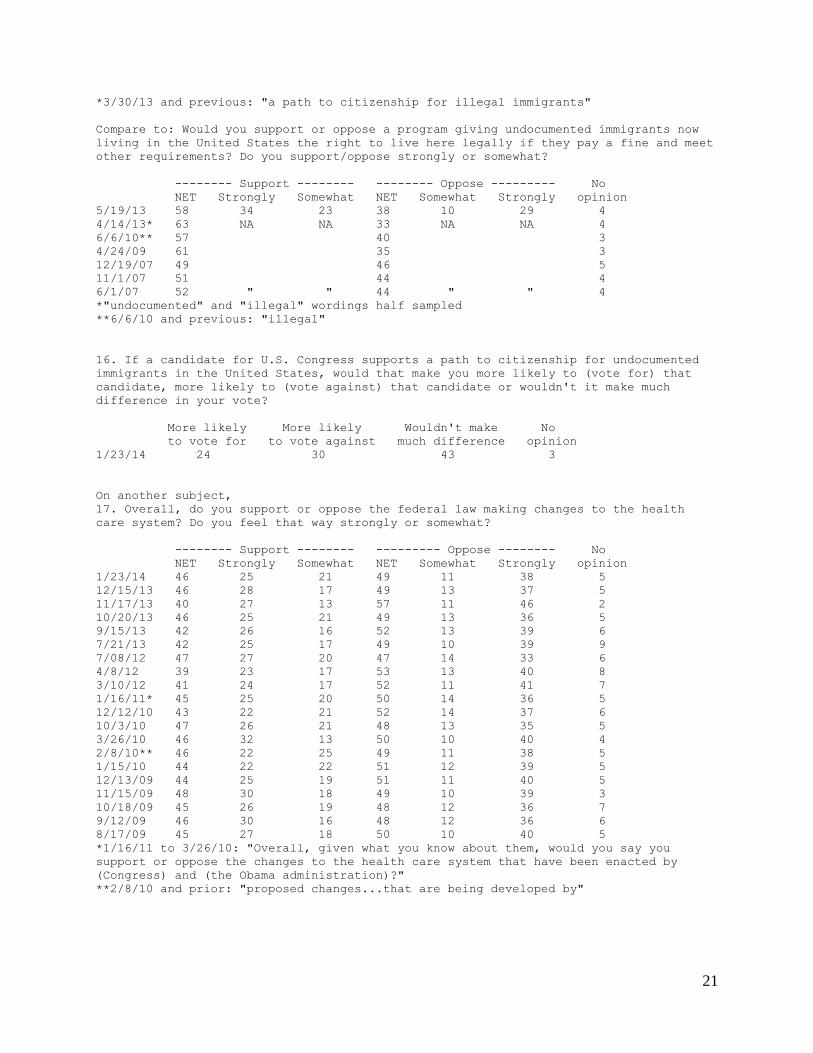
HEALTH CARE and IMMIGRATION – Obamacare, perhaps surprisingly, is another area that
may carry risks for the GOP as well as for the Democrats. On one hand Americans divide on the
law itself, 46 percent in support, 49 percent opposed, with strong opposition outstripping strong
support by 13 points. On the other, though, a minority, 38 percent, say it should be repealed; 60
percent either support the law outright or oppose it but say it should go forward nonetheless.
Still, if calls for repeal don’t resonate with a majority, there’s still criticism aplenty on the health
care law for Obama and by extension his party. Beyond his disapproval on the issue, six in 10
Americans still don’t think the website’s working properly, and 54 percent see that as a sign of
8
broader problems in implementing the law.
Immigration policy is another issue with risks for both sides. Americans in this poll divide
evenly on giving undocumented immigrants the right to live and work in the United States
legally (support’s been higher in polls that specify they may be required to pay a fine and meet
other requirements). They also divide evenly on which party they trust to handle it. And if a
candidate for Congress backs such a step, 30 percent say they’d be less likely to support him or
her, vs. 24 percent more likely. (The rest say it’s not a factor.)
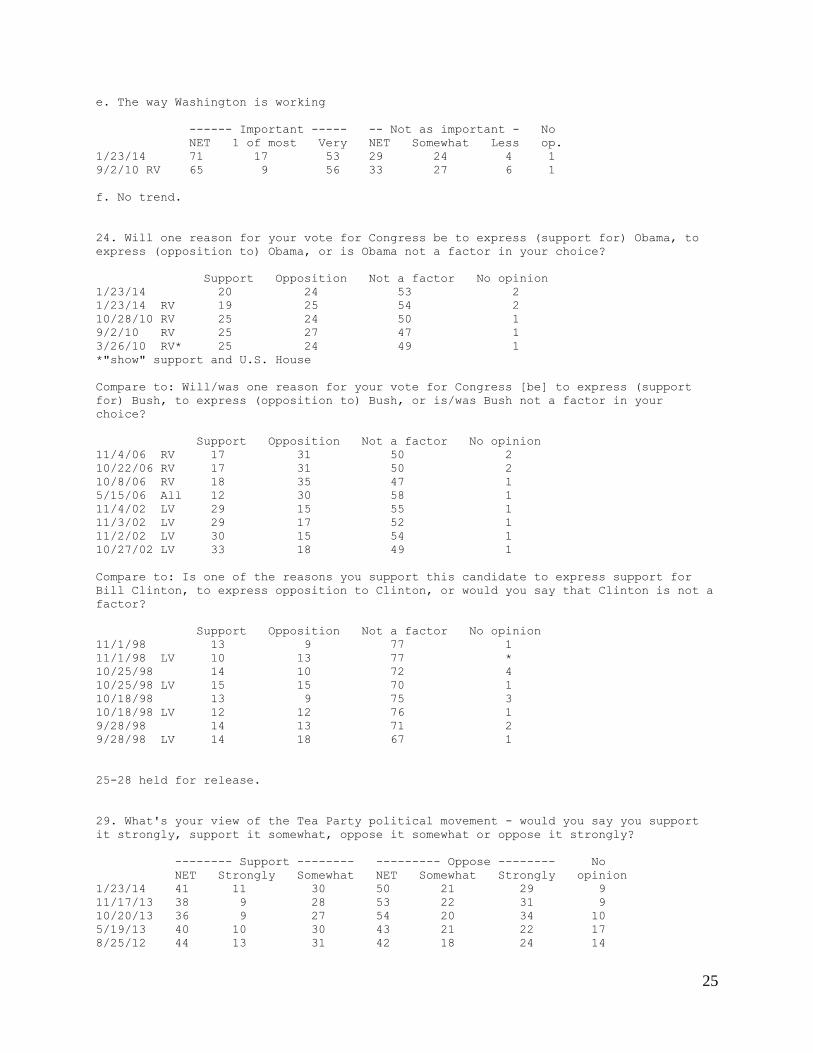
Finally, there’s the role of Obama himself in the midterms. In direct measurement it looks like
nearly a wash: Twenty percent say they’ll be voting to show support for the president, 24 percent
to oppose him. Just before the 2006 midterms, by contrast, Americans by a broader 14-point
margin said they’d vote to show opposition to George W. Bush, and the Democrats took control.
But if Obama’s not a direct influence, he’s an indirect one. And with his 46 percent approval
rating, continued economic discontent and the public’s deep frustration with Washington, the
president starts the year ill-positioned to offer his party much help in the fall spectacular.
METHODOLOGY – This ABC News/Washington Post poll was conducted by telephone Jan.
20-23, 2014, in English and Spanish, among a random national sample of 1,003 adults, including
landline and cell-phone-only respondents. Results have a margin of sampling error of 3.5 points,
including design effect. Partisan divisions are 32-25-37 percent, Democrats-Republicans-
independents.
The survey was produced for ABC News by Langer Research Associates of New York, N.Y.,
with sampling, data collection and tabulation by Abt-SRBI of New York, N.Y.
Analysis by Gary Langer.
ABC News polls can be found at ABCNEWS.com at http://abcnews.com/pollingunit.
Media contact: Julie Townsend, (212) 456-4934.
Full results follow.
* in data columns = less than 0.5 percent
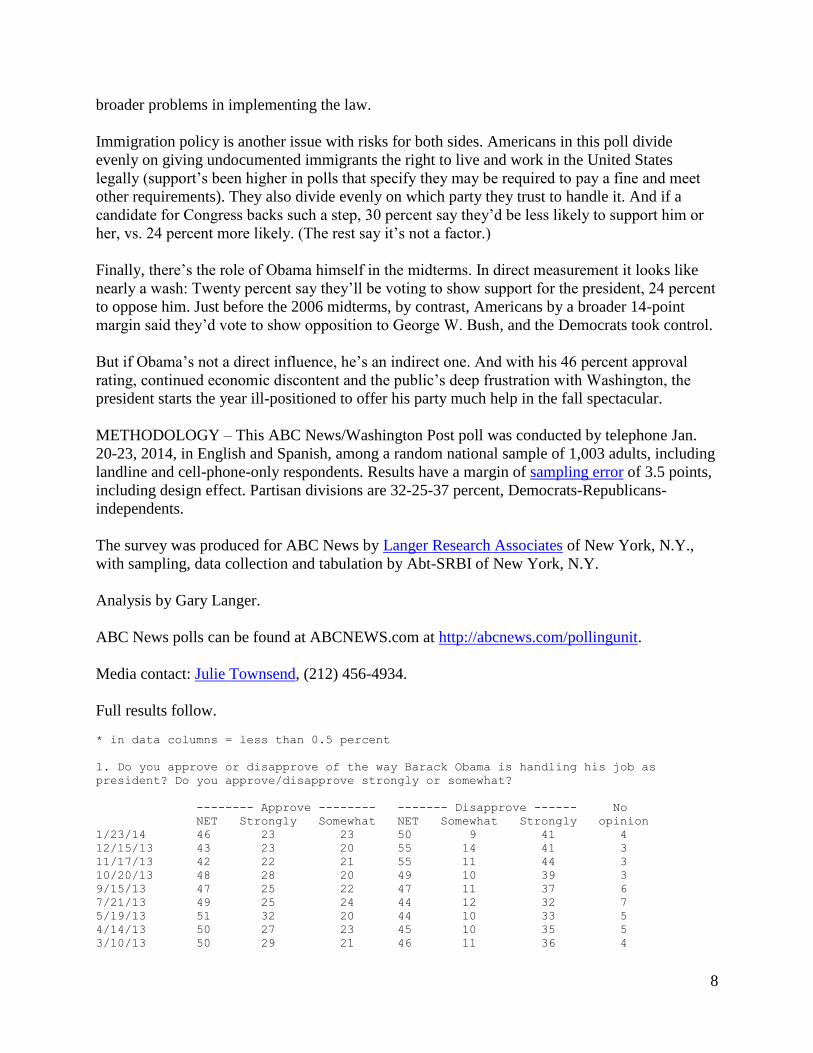
1. Do you approve or disapprove of the way Barack Obama is handling his job as
president? Do you approve/disapprove strongly or somewhat?
-------- Approve -------- ------- Disapprove ------ No
NET Strongly Somewhat NET Somewhat Strongly opinion
1/23/14 46 23 23 50 9 41 4
12/15/13 43 23 20 55 14 41 3
11/17/13 42 22 21 55 11 44 3
10/20/13 48 28 20 49 10 39 3
9/15/13 47 25 22 47 11 37 6
7/21/13 49 25 24 44 12 32 7
5/19/13 51 32 20 44 10 33 5
4/14/13 50 27 23 45 10 35 5
3/10/13 50 29 21 46 11 36 4

9
1/13/13 55 32 23 41 8 33 4
12/16/12 54 33 21 42 9 32 5
11/4/12 RV 52 33 10 46 10 36 2
11/3/12 RV 51 33 10 47 10 37 2
11/2/12 RV 51 32 11 47 11 36 2
11/1/12 RV 50 31 11 48 11 37 2
10/31/12 RV 50 30 11 48 11 37 2
10/30/12 RV 50 28 12 48 12 37 2
10/29/12 RV 50 28 11 48 11 36 2
10/28/12 RV 51 28 11 46 11 36 3
10/27/12 RV 50 28 11 46 11 36 3
10/26/12 RV 51 29 10 46 10 36 3
10/25/12 RV 50 29 9 47 9 37 3
10/24/12 RV 50 29 10 48 10 38 3
10/23/12 RV 50 29 21 47 9 37 3
10/22/12 RV 50 30 20 47 10 38 3
10/21/12 RV 51 31 20 47 10 37 2
10/13/12 50 30 21 44 10 34 6
9/29/12 50 26 24 46 12 34 4
9/9/12 49 29 20 45 11 35 6
8/25/12 50 27 23 46 13 33 4
7/8/12 47 24 24 49 15 34 4
5/20/12 47 26 21 49 13 36 3
4/8/12 50 30 20 45 10 35 6
3/10/12 46 28 18 50 11 39 4
2/4/12 50 29 22 46 11 36 3
1/15/12 48 25 23 48 11 37 4
12/18/11 49 25 24 47 13 34 4
11/3/11 44 22 22 53 15 37 3
10/2/11 42 21 21 54 14 40 4
9/1/11 43 21 22 53 16 38 3
8/9/11* 44 18 26 46 9 37 10
7/17/11 47 25 22 48 14 35 5
6/5/11 47 27 20 49 13 37 4
5/2/11** 56 29 27 38 14 24 6
4/17/11 47 27 21 50 12 37 3
3/13/11 51 27 24 45 12 33 4
1/16/11 54 30 23 43 15 28 3
12/12/10 49 24 25 47 15 32 4
10/28/10 50 27 23 45 11 34 5
10/3/10 50 26 24 47 13 34 3
9/2/10 46 24 22 52 14 38 3
7/11/10 50 28 22 47 12 35 3
6/6/10 52 30 22 45 12 33 4
4/25/10 54 31 23 44 11 33 3
3/26/10 53 34 20 43 8 35 3
2/8/10 51 29 22 46 12 33 3
1/15/10 53 30 24 44 13 32 2
12/13/09 50 31 18 46 13 33 4
11/15/09 56 32 23 42 13 29 2
10/18/09 57 33 23 40 11 29 3
9/12/09 54 35 19 43 12 31 3
8/17/09 57 35 21 40 11 29 3
7/18/09 59 38 22 37 9 28 4
6/21/09 65 36 29 31 10 22 4
4/24/09 69 42 27 26 8 18 4
3/29/09 66 40 26 29 9 20 5
2/22/09 68 43 25 25 8 17 7
*Washington Post
**Washington Post/Pew Research Center
10
2. Do you approve or disapprove of the way Obama is handling [ITEM]? Do you
approve/disapprove strongly or somewhat?
1/23/14 - Summary Table
------ Approve ------ ---- Disapprove ----- No
NET Strngly Smwht NET Smwht Strngly op.
a. The economy 43 22 21 55 13 42 3
b. Implementation of the new
health care law 37 19 17 59 10 50 4
c. The threat of terrorism 50 29 21 42 14 28 8
d. The situation with Iran 39 18 21 49 15 34 12
e. The situation in Syria 33 14 19 45 16 29 22
*Full sample asked items a-c; half samples asked items d and e.
Trend:
a. The economy
-------- Approve -------- ------- Disapprove ------ No
NET Strongly Somewhat NET Somewhat Strongly opinion
1/23/14 43 22 21 55 13 42 3
12/15/13 42 24 18 55 14 40 4
11/17/13 41 22 20 57 14 42 2
10/20/13 44 23 20 54 12 42 2
9/15/13 45 25 20 51 14 37 4
7/21/13 45 22 22 49 14 35 6
5/19/13 48 26 22 48 10 37 4
4/14/13 44 22 22 53 12 41 3
3/10/13 44 24 20 52 10 42 4
1/13/13 50 24 25 47 10 37 3
12/16/12 50 27 23 48 10 38 3
10/13/12 RV 47 26 21 51 10 41 2
9/29/12 RV 47 23 25 52 10 41 1
9/9/12 RV 45 24 21 53 8 45 2
8/25/12 44 20 23 54 12 42 3
7/8/12 44 21 23 54 13 41 2
5/20/12 42 20 22 55 11 44 2
4/8/12 44 23 21 54 12 42 2
3/10/12 38 20 18 59 9 50 2
2/4/12 44 23 22 53 11 41 3
1/15/12 41 19 22 57 11 46 2
12/18/11 41 17 24 56 13 43 2
11/3/11 38 18 20 61 13 48 2
10/2/11 35 17 19 61 13 48 4
9/1/11 36 15 21 62 15 47 2
7/17/11 39 18 22 57 15 43 3
6/5/11 40 20 20 59 10 49 2
5/2/11* 40 18 22 55 16 39 4
4/17/11 42 23 19 57 11 46 2
3/13/11 43 22 21 55 13 41 2
1/16/11 46 22 24 51 13 38 2
12/12/10 43 21 22 54 15 39 3
10/28/10 RV 44 21 23 54 15 39 3
10/3/10 45 22 23 53 13 41 2
9/2/10 41 20 21 57 13 44 2
7/11/10 43 20 23 54 13 41 4
6/6/10 50 26 24 49 12 37 2
4/25/10 49 24 25 49 10 39 2
3/26/10 45 23 22 52 12 40 3
2/8/10 45 22 23 53 15 38 2
1/15/10 47 22 24 52 13 39 1
12/13/09 46 23 24 52 12 40 2
11
11/15/09 51 26 25 47 12 36 2
10/18/09 50 29 22 48 13 35 1
9/12/09 51 28 24 46 13 33 2
8/17/09 52 27 25 46 13 33 2
7/18/09 52 29 23 46 10 35 3
6/21/09 56 28 28 41 13 27 3
4/24/09 58 31 28 38 13 25 4
3/29/09 60 34 25 38 12 26 3
2/22/09 60 NA NA 34 NA NA 6
*Washington Post/Pew Research Center
b. Implementation of the new health care law
-------- Approve -------- ------- Disapprove ------ No
NET Strongly Somewhat NET Somewhat Strongly opinion
1/23/14 37 19 17 59 10 50 4
12/15/13 34 18 15 62 13 50 4
11/17/13 33 18 16 63 12 52 3
10/20/13 41 25 15 53 10 43 6
9/15/13 34 20 14 55 12 43 11
c. The threat of terrorism
-------- Approve -------- ------- Disapprove ------ No
NET Strongly Somewhat NET Somewhat Strongly opinion
1/23/14 50 29 21 42 14 28 8
1/15/12 56 36 20 38 10 28 6
11/3/11 60 37 23 34 12 22 6
9/1/11 62 33 29 32 12 21 6
6/5/11 60 35 25 34 13 21 6
5/2/11* 69 42 27 21 9 12 10
2/8/10 56 28 28 39 14 25 5
1/15/10 55 31 23 42 14 28 4
11/15/09 53 31 22 41 14 27 6
9/12/09 55 31 24 34 12 23 11
6/21/09 57 NA NA 36 NA NA 7
4/21/09** 57 " " 26 " " 17
*Washington Post-Pew Research Center
**Pew Research Center
d. The situation with Iran
-------- Approve -------- ------- Disapprove ------ No
NET Strongly Somewhat NET Somewhat Strongly opinion
1/23/14 39 18 21 49 15 34 12
10/18/09 52 24 28 39 12 27 9
6/21/09 52 NA NA 36 NA NA 12
4/24/09 54 NA NA 35 NA NA 11
e. The situation in Syria
-------- Approve -------- ------- Disapprove ------ No
NET Strongly Somewhat NET Somewhat Strongly opinion
1/23/14 33 14 19 45 16 29 22
9/15/13 36 19 17 53 14 39 11
3. Do you think things in this country (are generally going in the right direction) or
do you feel things (have gotten pretty seriously off on the wrong track)?
Right Wrong No
direction track opinion
1/23/14 35 62 2
12
11/17/13 27 70 3
10/20/13 28 68 4
7/21/13 36 60 4
5/19/13 39 57 4
1/13/13 39 57 5
10/31/12 LV 43 55 2
10/13/12 RV 42 56 3
9/29/12 RV 38 60 2
8/25/12 RV 29 69 2
7/8/12 33 63 4
4/8/12 33 64 3
1/15/12 30 68 2
11/3/11 22 74 3
9/1/11 20 77 3
6/5/11 32 66 2
1/16/11 38 60 3
12/12/10 31 67 2
10/28/10 RV 27 71 2
6/6/10 37 60 3
3/26/10 38 60 2
1/15/10 37 62 1
11/15/09 44 55 2
10/18/09 44 54 2
8/17/09 44 55 1
6/21/09 47 50 3
4/24/09 50 48 2
3/29/09 42 57 1
2/22/09 31 67 2
1/16/09 19 78 3
12/14/08 15 82 3
10/25/08 LV 13 85 2
10/11/08 RV 8 90 2
9/22/08 RV 14 83 3
8/22/08 19 78 2
6/15/08 14 84 2
5/11/08 16 82 2
1/12/08 21 77 2
11/1/07 24 74 2
6/1/07 25 73 2
1/19/07 26 71 3
11/4/06 RV 39 59 2
10/22/06 30 68 2
10/8/06 32 66 2
5/15/06 29 69 2
11/2/05 30 68 2
10/24/04 LV 41 55 4
4/18/04 42 57 1
4/30/03 52 46 2
9/26/02 43 53 4
2/21/02 54 42 4
Call for full trend.
4. Do you approve or disapprove of the way the U.S. Congress is doing its job? Do you
approve/disapprove strongly or somewhat?
-------- Approve -------- ------- Disapprove ------ No
NET Strongly Somewhat NET Somewhat Strongly opinion
1/23/14 16 3 13 81 21 59 3
12/15/13 16 4 12 81 22 59 3
10/20/13 12 4 8 85 15 70 3
7/21/13 21 5 16 73 20 53 7
3/10/13 16 3 12 80 22 58 4
13
1/13/13 19 4 15 76 21 55 4
1/15/12 13 3 11 84 19 65 3
10/2/11 14 3 11 82 20 62 4
3/13/11 27 7 20 69 24 45 4
1/16/11 28 6 21 66 24 43 7
10/28/10 RV 23 6 17 74 21 53 3
10/3/10 24 6 18 73 22 51 3
9/2/10 25 5 20 72 21 51 4
6/6/10 26 7 20 71 20 51 2
3/26/10 24 7 18 72 18 54 4
2/8/10 26 NA NA 71 NA NA 3
7/13/08 23 71 6
2/1/08 33 59 8
12/9/07 32 60 8
11/1/07 28 65 7
9/30/07 29 65 6
7/21/07 37 60 4
6/1/07 39 " " 53 " " 8
4/15/07 44 8 36 54 25 29 3
2/25/07 41 NA NA 54 NA NA 5
1/19/07 43 50 8
12/11/06 37 " " 57 " " 6
11/4/06 RV 36 7 29 60 25 35 4
10/22/06 31 5 25 65 27 38 4
10/8/06 32 5 27 66 29 37 2
9/7/06 40 NA NA 55 NA NA 5
8/6/06 36 60 4
5/15/06 33 63 4
4/9/06 35 62 3
3/5/06 36 62 3
1/26/06 43 53 4
1/8/06 41 55 5
12/18/05 43 53 4
11/2/05 37 59 4
8/28/05 37 59 4
6/5/05 41 54 4
10/29/03 40 52 9
4/30/03 57 37 6
9/26/02 51 43 6
7/15/02 57 36 7
2/21/02 57 39 4
1/27/02 58 35 7
12/19/01 59 34 7
9/9/01 45 48 7
7/30/01 48 48 4
4/22/01 58 33 8
Call for full trend.
5. Please tell me whether the following statement applies to Obama, or not: [ITEM]?
1/23/14 - Summary Table
Yes No No opinion
a. He is a strong leader 48 51 1
b. He understands the problems of people like you 47 52 1
c. He is honest and trustworthy 49 48 4
Trend:
a. He is a strong leader
Yes No No opinion
14
1/23/14 48 51 1
11/17/13 46 53 1
9/15/13 54 44 2
1/13/13 61 37 2
1/15/12 51 48 1
11/3/11 48 51 1
6/5/11 55 44 1
6/6/10 57 43 1
3/26/10 65 33 2
1/15/10 63 35 1
7/18/09 71 27 2
4/24/09 77 22 2
1/16/09 72 18 10
b. He understands the problems of people like you
Yes No No opinion
1/23/14 47 52 1
12/15/13 52 46 2
11/17/13 47 51 2
1/13/13 55 43 2
1/15/12 51 47 2
11/3/11 49 49 2
6/5/11 49 49 2
1/16/11 58 40 2
9/2/10 50 48 2
6/6/10 51 48 2
3/26/10 56 43 2
1/15/10 57 42 2
7/18/09 63 35 1
4/24/09 73 25 1
1/16/09 72 24 4
c. He is honest and trustworthy
Yes No No opinion
1/23/14 49 48 4
12/15/13 50 48 2
11/17/13 47 50 3
10/13/12 RV 56 40 4
11/3/11 57 39 5
4/24/09 74 22 4
1/16/09 75 19 6
12/14/08 67 22 11
6. How much confidence do you have in [ITEM] to make the right decisions for the
country's future - a great deal of confidence, a good amount, just some or none at
all?
1/23/14 - Summary Table
-Grt deal/Good amt- ---- Some/None ----
Great Good Just None No
NET deal amt NET some at all opinion
a. Obama 37 17 19 63 28 35 *
b. The Republicans in Congress 19 5 14 80 47 34 1
c. The Democrats in Congress 27 9 17 72 38 34 1
Trend:
a. Obama
15
-Grt deal/Good amt- ---- Some/None ----
Great Good Just None No
NET deal amt NET some at all opinion
1/23/14 37 17 19 63 28 35 *
7/11/10 43 24 19 57 28 29 *
1/15/10 47 24 23 53 26 27 *
10/18/09 49 29 20 50 27 24 *
8/17/09 49 28 21 50 26 24 *
4/24/09 60 31 28 40 25 15 1
1/16/09 61 31 30 37 28 9 2
b. The Republicans in Congress
-Grt deal/Good amt- ---- Some/None ----
Great Good Just None No
NET deal amt NET some at all opinion
1/23/14 19 5 14 80 47 34 1
7/11/10 26 8 18 73 43 29 1
1/15/10 24 6 18 75 47 28 1
10/18/09 19 4 15 79 46 33 2
8/17/09 21 4 16 78 45 33 1
4/24/09 21 4 16 78 50 28 2
1/16/09 29 8 21 69 49 21 2
c. The Democrats in Congress
-Grt deal/Good amt- ---- Some/None ----
Great Good Just None No
NET deal amt NET some at all opinion
1/23/14 27 9 17 72 38 34 1
7/11/10 32 12 20 67 35 32 1
1/15/10 32 11 21 68 33 35 1
10/18/09 34 12 23 64 37 27 2
8/17/09 35 14 21 63 35 29 1
4/24/09 36 12 24 63 38 25 1
1/16/09 43 15 28 56 37 19 2
7. Obama has called for limits on surveillance activities by the National Security
Agency. Given what you’ve heard or read about it, do you think the steps he’s proposed
(go too far) in limiting NSA surveillance, (don’t go far enough), or are about right?
Too far Not far enough About right No opinion
1/23/14 18 28 41 14
8. Which political party, the (Democrats) or the (Republicans), do you trust to do a
better job handling [ITEM]?
1/23/14 - Summary Table
Both Neither No
Democrats Republicans (vol.) (vol.) opinion
a. The economy 37 44 2 15 3
b. Health care 44 35 1 16 3
c. Immigration issues 39 37 2 15 7
d. The federal budget deficit 34 44 1 18 3
e. Helping the middle class 46 35 1 15 2
Trend:
a. The economy
16
Both Neither No
Democrats Republicans (vol.) (vol.) opinion
1/23/14 37 44 2 15 3
10/3/10 44 37 4 14 2
9/2/10 42 40 2 15 2
7/11/10 42 34 3 17 5
3/26/10 44 36 3 16 1
2/1/08 52 33 2 10 3
12/9/07 51 33 2 9 5
11/1/07 50 35 3 9 4
9/30/07 51 33 2 11 3
10/22/06 RV 50 41 2 5 2
10/8/06 54 37 3 6 1
9/7/06 50 39 1 7 4
6/25/06 52 39 1 5 3
5/15/06 52 34 3 9 2
4/9/06 49 43 1 4 3
3/5/06 49 40 2 8 2
1/26/06 55 37 2 5 2
11/2/05 56 34 1 8 1
12/15/02 44 45 4 6 1
10/27/02* LV 43 48 3 3 2
9/26/02* 47 39 3 6 5
7/15/02** 38 48 3 6 5
1/27/02** 39 48 5 6 3
4/22/01*** 47 43 4 4 3
9/28/98 53 40 NA NA 7
7/12/98 49 37 4 5 6
1/19/98 45 44 3 6 3
7/8/97 43 39 5 12 2
10/23/94 38 43 3 14 2
9/11/94 39 43 3 11 4
2/27/94 47 36 3 11 3
2/2/92 49 38 2 7 4
12/15/91 43 36 4 11 5
3/4/91 32 49 5 10 4
1/16/90 33 52 4 7 4
*"The economy and jobs"
**"Improving the economy"
***4/22/01 and previous: "The nation's economy"
b. Health care
Both Neither No
Democrats Republicans (vol.) (vol.) opinion
1/23/14 44 35 1 16 3
10/3/10 46 38 1 12 3
9/2/10 44 39 2 13 3
3/26/10 47 34 2 15 3
2/1/08 56 29 2 10 4
11/1/07 54 29 2 10 5
9/30/07 56 26 2 12 5
10/8/06 61 28 1 7 2
5/15/06 61 28 1 7 2
4/9/06 61 29 * 6 3
11/2/05 54 29 2 12 3
12/15/02* 53 33 3 7 4
10/27/02* LV 50 39 3 5 3
9/26/02* 50 35 4 5 6
7/15/02** 47 37 3 9 5
1/27/02** 50 35 5 5 4
1/19/98*** 54 33 2 7 4
10/23/94 46 29 2 21 2
17
9/11/94 51 29 3 12 5
2/27/94 58 22 5 11 3
2/2/92 60 25 3 8 4
12/15/91 57 23 3 11 5
*"The cost, availability, and coverage of health insurance"
**"improving the health care system"
***1/19/98 and previous: "Providing affordable health care"
c. Immigration issues
Both Neither No
Democrats Republicans (vol.) (vol.) opinion
1/23/14 39 37 2 15 7
10/3/10 37 37 3 17 6
9/2/10 37 40 5 14 4
3/26/10 38 35 3 16 8
2/1/08 40 37 2 12 9
11/1/07 42 35 4 13 6
10/8/06 49 36 4 10 3
6/25/06 45 40 1 9 5
5/15/06 48 34 1 14 4
4/9/06 50 38 1 7 4
d. The federal budget deficit
Both Neither No
Democrats Republicans (vol.) (vol.) opinion
1/23/14 34 44 1 18 3
10/3/10 39 40 2 18 1
9/2/10 38 44 1 14 3
3/26/10 43 35 2 18 2
2/1/08 52 31 2 10 6
9/30/07 52 29 2 12 5
Compare to: The federal budget
5/15/06 54 34 1 8 3
11/2/05 48 34 2 13 2
7/15/02* 44 41 5 6 4
1/27/02** 38 46 5 7 3
3/14/99* 43 40 5 10 3
9/28/98* 49 42 NA NA 9
7/12/98* 42 39 4 7 8
1/19/98*** 41 43 3 8 4
7/8/97*** 39 36 5 17 3
10/23/94**** 36 37 3 21 3
9/11/94 39 40 4 14 4
2/27/94 44 28 5 20 3
2/2/92 40 39 4 14 3
3/4/91 35 43 5 14 3
1/16/90 35 42 4 15 4
*"Managing the federal budget"
**"Keeping the federal budget balanced"
***"Balancing the federal budget"
****10/23/94 and previous: "Reducing the federal budget"
e. Helping the middle class
Both Neither No
Democrats Republicans (vol.) (vol.) opinion
1/23/14 46 35 1 15 2
10/3/10 50 34 2 11 2
3/14/99 55 28 4 8 4
18
9/28/98 57 34 NA NA 8
9/28/98 LV 52 40 NA NA 8
7/12/98 55 29 2 8 7
1/19/98 57 34 1 6 2
7/8/97 51 30 3 14 3
10/23/94 48 33 2 14 3
9/11/94 46 36 3 10 4
2/27/94 47 34 2 14 3
2/2/92 55 34 2 7 3
12/15/91 56 28 3 10 4
3/4/91 48 34 5 9 4
1/16/90 53 32 3 9 4
9. Regardless of your other political views, overall which party do you think has
better ideas about the right size and role of the federal government - the (Democratic
Party) or the (Republican Party)?
Both Neither
Democratic Republican (vol.) (vol.) No opinion
1/23/14 40 46 1 9 3
12/15/13 43 44 2 9 3
10/3/10 42 44 3 8 4
6/6/10 45 40 1 10 4
10. Which political party, the (Democrats) or the (Republicans), do you think [ITEM]?
1/23/14 - Summary Table
Both Neither No
Democrats Republicans (vol.) (vol.) opinion
a. Better represents your own
personal values 43 41 2 13 2
b. Is more concerned with the
needs of people like you 46 37 1 15 1
c. Better understands the
economic problems people
in this country are having 46 37 2 13 2
Trend:
a. Better represents your own personal values
Both Neither No
Democrats Republicans (vol.) (vol.) opinion
1/23/14 43 41 2 13 2
3/10/12 44 39 2 12 3
10/28/10 RV 48 42 2 7 1
9/2/10 45 42 2 10 1
11/15/09 49 39 2 9 2
11/4/06 RV 48 44 1 6 2
10/8/06 53 37 2 7 1
11/2/05 50 40 1 7 1
4/24/05 47 38 2 10 2
3/14/99 47 39 3 8 3
b. Is more concerned with the needs of people like you
Both Neither No
Democrats Republicans (vol.) (vol.) opinion
1/23/14 46 37 1 15 1
3/10/12 46 36 1 13 3
19
10/28/10 RV 49 38 2 8 3
9/2/10 48 39 2 11 1
11/15/09 51 36 2 9 3
10/8/06 58 30 2 9 1
8/6/06 56 30 1 12 2
11/2/05 56 33 1 9 1
c. Better understands the economic problems people in this country are having
Both Neither No
Democrats Republicans (vol.) (vol.) opinion
1/23/14 46 37 2 13 2
2/9/11* 35 30 3 22 9
10/28/10 RV 48 38 2 10 2
*Washington Post-Kaiser Family Foundation
11. Which political party is closer to your own opinion on the issue of [ITEM], the
(Democrats) or the (Republicans)?
1/23/14 – Summary Table
Both Neither No
Democrats Republicans (vol.) (vol.) opinion
a. Abortion 46 37 1 6 10
b. Gay marriage 45 33 2 8 12
c. Gun control 37 48 2 6 7
d. Whether or not to raise the
minimum wage 49 35 1 5 10
12. Presidents have the power in some cases to bypass Congress and take action by
executive order to accomplish their administration’s goals. Is this approach something
you support strongly, support somewhat, oppose somewhat or oppose strongly?
-------- Support -------- --------- Oppose -------- No
NET Strongly Somewhat NET Somewhat Strongly opinion
1/23/14 52 15 36 46 21 25 2
Changing subjects,
13a. Overall, do you have a favorable or unfavorable impression of Barack Obama? Do
you feel that way strongly or somewhat?
------- Favorable ------- ------ Unfavorable ------ No
NET Strongly Somewhat NET Somewhat Strongly opinion
1/23/14 49 29 20 50 13 37 1
11/17/13 46 30 16 52 11 41 2
10/20/13 50 31 19 48 11 37 2
6/23/13 53 31 22 44 11 33 3
3/24/13 57 34 23 41 11 30 2
1/27/13 60 39 21 37 11 26 3
11/2/12 LV 54 38 16 45 11 34 1
10/21/12 LV 52 37 15 46 10 36 2
10/7/12 56 32 24 42 11 31 2
9/9/12 54 34 21 42 13 29 4
9/2/12 51 29 22 45 14 31 4
8/26/12 50 27 24 44 14 29 6
8/5/12 53 29 24 43 12 31 4
5/27/12 52 29 23 45 14 31 3
4/15/12 56 30 26 40 14 26 5
3/25/12 53 31 23 43 15 28 3
2/26/12 51 26 25 45 13 32 3
20
1/22/12 53 27 25 43 14 29 4
12/11/11 48 23 25 49 16 33 3
9/18/11 47 22 25 46 15 31 7
4/17/11 52 33 20 45 13 32 2
4/25/10 57 37 21 41 12 29 2
1/15/10 58 38 20 40 13 27 2
11/15/09 61 39 21 38 11 27 1
9/12/09 63 40 23 35 12 24 2
4/24/09 72 46 26 26 11 15 2
1/16/09 79 50 29 18 9 9 3
11/2/08 LV 63 47 16 33 7 26 4
10/23/08 LV 63 47 16 34 7 27 3
10/11/08 RV 64 44 20 33 12 21 3
9/7/08 RV 58 35 23 36 12 24 7
8/22/08 RV 62 37 25 34 13 21 4
6/15/08 63 35 28 33 12 21 4
4/13/08 56 28 28 39 14 25 5
1/10/08 63 31 32 30 14 16 7
11/1/07 51 21 30 36 16 20 13
2/25/07 53 21 33 30 16 14 16
1/19/07 45 NA NA 29 NA NA 25
12/11/06 44 21 22 23 17 6 33
On another topic,
14. Congress is considering whether or not again to extend the period in which people
who’ve lost their jobs can get unemployment benefits. (Supporters say this will help
those who can't find work.) (Opponents say this adds too much to the federal budget
deficit.) Do you think Congress should or should not approve another extension of
unemployment benefits?
Should Should not No opinion
1/23/14 60 37 3
Compare to: Because of the economic downturn, Congress has extended the period in
which people can receive unemployment benefits, and is considering doing so again.
Supporters say this will help those who can't find work. Opponents say this adds too
much to the federal budget deficit. Do you think Congress should or should not approve
another extension of unemployment benefits?
Should Should not No opinion
7/11/10 62 36 2
15. Do you think undocumented immigrants currently living in the United States should
or should not be given the right to live and work here legally? Do you feel that way
strongly, or somewhat?
-------- Should --------- -------- Should not ----- No
NET Strongly Somewhat NET Somewhat Strongly opinion
1/23/14 49 31 17 49 11 37 3
10/20/13* 51 31 20 43 10 33 5
*ABC News-Fusion
Compare to: Overall, do you support or oppose a path to citizenship for undocumented
immigrants now living in the United States? Do you feel that way strongly or somewhat?
-------- Support -------- -------- Oppose --------- No
NET Strongly Somewhat NET Somewhat Strongly opinion
7/14/13 55 29 26 41 15 26 4
3/30/13 57 31 26 40 16 24 4
2/3/13 55 29 26 41 19 22 4
11/11/12 57 30 27 39 12 27 4
21
*3/30/13 and previous: "a path to citizenship for illegal immigrants"
Compare to: Would you support or oppose a program giving undocumented immigrants now
living in the United States the right to live here legally if they pay a fine and meet
other requirements? Do you support/oppose strongly or somewhat?
-------- Support -------- -------- Oppose --------- No
NET Strongly Somewhat NET Somewhat Strongly opinion
5/19/13 58 34 23 38 10 29 4
4/14/13* 63 NA NA 33 NA NA 4
6/6/10** 57 40 3
4/24/09 61 35 3
12/19/07 49 46 5
11/1/07 51 44 4
6/1/07 52 " " 44 " " 4
*"undocumented" and "illegal" wordings half sampled
**6/6/10 and previous: "illegal"
16. If a candidate for U.S. Congress supports a path to citizenship for undocumented
immigrants in the United States, would that make you more likely to (vote for) that
candidate, more likely to (vote against) that candidate or wouldn't it make much
difference in your vote?
More likely More likely Wouldn't make No
to vote for to vote against much difference opinion
1/23/14 24 30 43 3
On another subject,
17. Overall, do you support or oppose the federal law making changes to the health
care system? Do you feel that way strongly or somewhat?
-------- Support -------- --------- Oppose -------- No
NET Strongly Somewhat NET Somewhat Strongly opinion
1/23/14 46 25 21 49 11 38 5
12/15/13 46 28 17 49 13 37 5
11/17/13 40 27 13 57 11 46 2
10/20/13 46 25 21 49 13 36 5
9/15/13 42 26 16 52 13 39 6
7/21/13 42 25 17 49 10 39 9
7/08/12 47 27 20 47 14 33 6
4/8/12 39 23 17 53 13 40 8
3/10/12 41 24 17 52 11 41 7
1/16/11* 45 25 20 50 14 36 5
12/12/10 43 22 21 52 14 37 6
10/3/10 47 26 21 48 13 35 5
3/26/10 46 32 13 50 10 40 4
2/8/10** 46 22 25 49 11 38 5
1/15/10 44 22 22 51 12 39 5
12/13/09 44 25 19 51 11 40 5
11/15/09 48 30 18 49 10 39 3
10/18/09 45 26 19 48 12 36 7
9/12/09 46 30 16 48 12 36 6
8/17/09 45 27 18 50 10 40 5
*1/16/11 to 3/26/10: "Overall, given what you know about them, would you say you
support or oppose the changes to the health care system that have been enacted by
(Congress) and (the Obama administration)?"
**2/8/10 and prior: "proposed changes...that are being developed by"
22
18. (ASKED IF DO NOT SUPPORT HEALTH CARE LAW) Which of these is your preference:
(Repeal the health care law), or (let the health care law go ahead and see how it
works)?
Repeal the Let it Repeal parts No
health care law go ahead of law (vol.) opinion
1/23/14 70 27 1 2
10/20/13 60 37 1 3
17/18 NET:
--- Support/let it go ahead --- -- Do not support, repeal/no op. --
Do not support, Repeal Repeal parts No
NET Support let it go ahead NET the law of law (vol.) op.
1/23/14 60 46 14 40 38 * 1
10/20/13 66 46 20 34 33 * 1
19. You may have heard about problems with the federal government website where people
who don't have health insurance are supposed to sign up for it. Given what you've
heard, do you think this website is now working as it should, or not?
Working Not working No
as it should as it should opinion
1/23/14 27 60 13
12/15/13 23 64 13
20. Do you think the problems with the healthcare-dot-gov website are (an isolated
incident) or do you think they are (a sign of broader problems in implementing the
health care law)?
Isolated incident Sign of broader problems No opinion
1/23/14 38 54 8
12/15/13 36 55 9
10/20/13* 40 56 4
*"...the website set up under the health care law for uninsured people to sign up for
health insurance."
21. Thinking about the next election in November, right now, are you inclined to vote
to re-elect your representative in Congress, or are you inclined to look around for
someone else to vote for?
Depends
Re-elect Look around (vol.) No opinion
1/23/14 27 63 3 7
10/20/13 24 66 4 6
2/4/12 34 53 3 9
11/3/11 31 59 3 8
7/17/11 30 63 2 5
6/5/11 34 55 4 6
10/28/10 32 50 7 11
10/3/10 29 55 9 7
9/2/10 31 58 5 6
7/11/10 25 60 6 8
6/6/10 29 60 5 6
4/25/10 RV 32 57 7 4
2/8/10 36 56 4 4
11/15/09 38 50 6 5
5/15/06 35 55 6 4
6/5/05 40 50 8 3
2/21/02 40 48 7 6
23
10/31/99 41 47 8 3
9/28/99 44 46 NA 10
7/12/98 42 44 5 10
1/19/98 47 41 7 4
8/27/97 34 52 9 5
11/6/94 RV 37 47 7 8
10/31/94 35 56 2 7
10/23/94 32 58 4 6
9/11/94 36 53 4 7
6/26/94 35 54 6 5
3/27/94 32 56 6 7
1/23/94 32 46 10 12
11/14/93 38 52 5 5
8/21/92 RV 35 48 5 12
7/8/92 34 54 3 9
6/7/92 36 53 4 7
4/9/92 33 56 3 8
3/18/92 35 56 3 5
3/11/92 36 54 3 7
2/2/92 38 51 4 7
10/21/91 31 55 7 6
6/2/91 37 49 5 9
11/4/90 LV 41 50 NA 8
10/14/90 36 57 " 7
5/21/90 43 50 3 3
5/23/89 45 44 4 6
22. If the election for the U.S. House of Representatives were being held today, would
you vote for (the Democratic candidate) or (the Republican candidate) in your
congressional district? (IF OTHER, NEITHER, DK, REF) Would you lean toward the
(Democratic candidate) or toward the (Republican candidate)?
NET LEANED VOTE PREFERENCE
Dem Rep Other Neither Would not No
cand. cand. (vol.) (vol.) vote (vol.) opinion
1/23/14 All 45 45 1 3 1 5
1/23/14 RVs 45 46 1 3 1 5
12/15/13* 47 45 1 4 1 3
10/20/13 48 40 1 5 1 4
5/19/13 48 40 2 4 1 6
10/28/10 49 44 1 2 * 3
10/3/10 47 43 1 3 1 5
9/2/10** 45 47 1 2 1 5
7/11/10 46 47 * 2 * 5
6/6/10 47 44 2 2 1 4
4/25/10 48 43 1 2 1 6
3/26/10 48 44 1 2 * 4
2/8/10 45 48 * 3 * 4
10/22/06 54 41 * 1 * 3
10/8/06 54 41 * 1 1 3
9/7/06 50 42 * 3 2 4
8/6/06 52 39 * 2 1 5
6/25/06 52 39 1 3 1 4
5/15/06 52 40 1 3 1 4
4/9/06 55 40 * 2 * 3
1/26/06 54 38 1 3 1 5
12/18/05 51 41 1 3 1 4
11/2/05 52 37 1 4 2 6
7/15/02 47 46 1 1 1 4
1/27/02*** 43 50 NA 2 1 5
9/6/00 49 42 2 1 6
24
7/23/00 46 45 3 1 5
2/27/00 45 46 2 1 5
*12/15/13 and previous, reg. voters.
**9/2/10 and previous: "Will not vote (vol.)"
***1/27/02 and previous: No "other candidate" option recorded
Call for full trend
23. For each item I name, please tell me how important it will be in your vote for
Congress this year. The first is [ITEM]. Will it be one of the single most important
issues, very important, somewhat important or less important than that?
1/23/14 - Summary Table
------ Important ----- -- Not as important - No
NET 1 of most Very NET Somewhat Less op.
a. The economy 86 24 62 13 12 1 *
b. The new federal health
care law 69 15 54 30 23 7 1
c. Immigration issues 48 8 39 52 38 14 1
d. The federal budget deficit 73 16 57 26 21 6 1
e. The way Washington
is working 71 17 53 29 24 4 1
f. Social issues such as gay
marriage and abortion 40 7 33 59 32 27 1
Trend:
a. The economy
------ Important ----- -- Not as important - No
NET 1 of most Very NET Somewhat Less op.
1/23/14 86 24 62 13 12 1 *
9/2/10 RV 93 31 62 7 7 * *
10/8/06 RV 77 12 65 23 20 3 *
4/9/06 80 16 64 20 18 2 *
b. The new federal health care law
------ Important ----- -- Not as important - No
NET 1 of most Very NET Somewhat Less op.
1/23/14 69 15 54 30 23 7 1
9/2/10* RV 82 19 63 18 15 3 *
10/8/06 RV 71 11 61 28 22 6 *
4/9/06 75 16 60 25 20 4 *
*2010 and previous: “health care”
c. Immigration issues
------ Important ----- -- Not as important - No
NET 1 of most Very NET Somewhat Less op.
1/23/14 48 8 39 52 38 14 1
9/2/10 RV 55 12 43 45 30 15 0
10/8/06 RV 54 7 47 45 29 16 1
4/9/06 60 12 48 40 32 8 *
d. The federal budget deficit
------ Important ----- -- Not as important - No
NET 1 of most Very NET Somewhat Less op.
1/23/14 73 16 57 26 21 6 1
9/2/10 RV 76 15 61 24 18 6 *
25
e. The way Washington is working
------ Important ----- -- Not as important - No
NET 1 of most Very NET Somewhat Less op.
1/23/14 71 17 53 29 24 4 1
9/2/10 RV 65 9 56 33 27 6 1
f. No trend.
24. Will one reason for your vote for Congress be to express (support for) Obama, to
express (opposition to) Obama, or is Obama not a factor in your choice?
Support Opposition Not a factor No opinion
1/23/14 20 24 53 2
1/23/14 RV 19 25 54 2
10/28/10 RV 25 24 50 1
9/2/10 RV 25 27 47 1
3/26/10 RV* 25 24 49 1
*"show" support and U.S. House
Compare to: Will/was one reason for your vote for Congress [be] to express (support
for) Bush, to express (opposition to) Bush, or is/was Bush not a factor in your
choice?
Support Opposition Not a factor No opinion
11/4/06 RV 17 31 50 2
10/22/06 RV 17 31 50 2
10/8/06 RV 18 35 47 1
5/15/06 All 12 30 58 1
11/4/02 LV 29 15 55 1
11/3/02 LV 29 17 52 1
11/2/02 LV 30 15 54 1
10/27/02 LV 33 18 49 1
Compare to: Is one of the reasons you support this candidate to express support for
Bill Clinton, to express opposition to Clinton, or would you say that Clinton is not a
factor?
Support Opposition Not a factor No opinion
11/1/98 13 9 77 1
11/1/98 LV 10 13 77 *
10/25/98 14 10 72 4
10/25/98 LV 15 15 70 1
10/18/98 13 9 75 3
10/18/98 LV 12 12 76 1
9/28/98 14 13 71 2
9/28/98 LV 14 18 67 1
25-28 held for release.
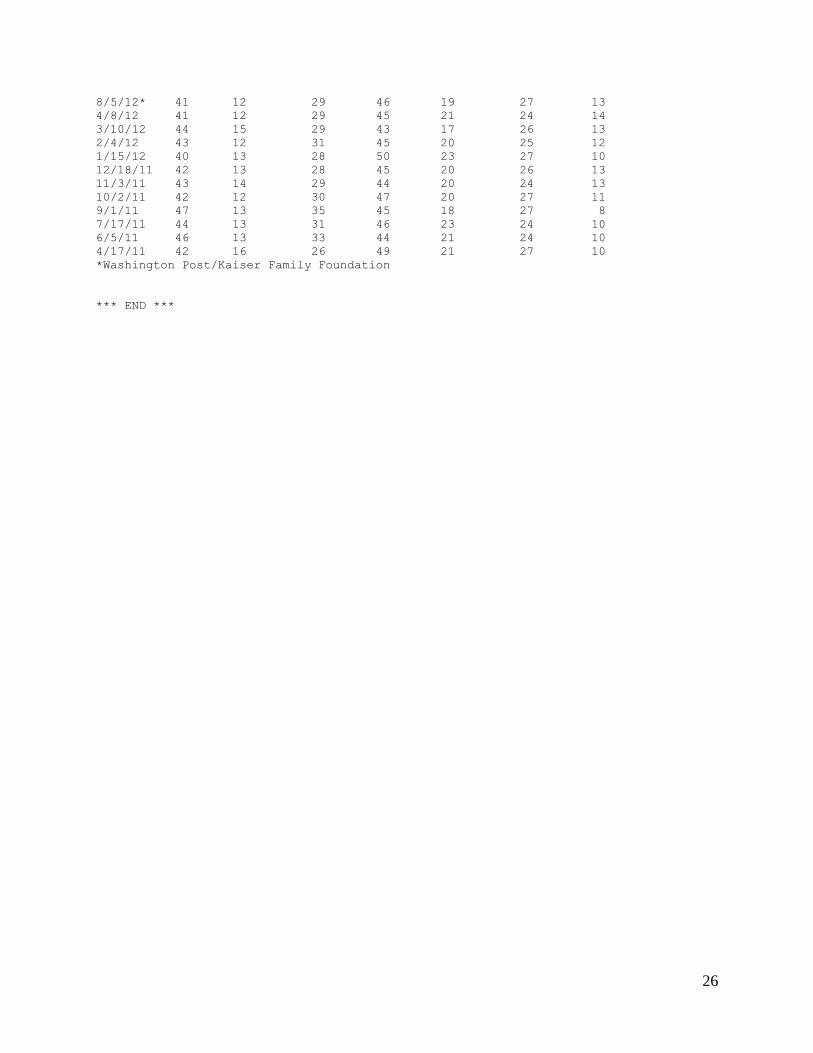
29. What's your view of the Tea Party political movement - would you say you support
it strongly, support it somewhat, oppose it somewhat or oppose it strongly?
-------- Support -------- --------- Oppose -------- No
NET Strongly Somewhat NET Somewhat Strongly opinion
1/23/14 41 11 30 50 21 29 9
11/17/13 38 9 28 53 22 31 9
10/20/13 36 9 27 54 20 34 10
5/19/13 40 10 30 43 21 22 17
8/25/12 44 13 31 42 18 24 14
26
8/5/12* 41 12 29 46 19 27 13
4/8/12 41 12 29 45 21 24 14
3/10/12 44 15 29 43 17 26 13
2/4/12 43 12 31 45 20 25 12
1/15/12 40 13 28 50 23 27 10
12/18/11 42 13 28 45 20 26 13
11/3/11 43 14 29 44 20 24 13
10/2/11 42 12 30 47 20 27 11
9/1/11 47 13 35 45 18 27 8
7/17/11 44 13 31 46 23 24 10
6/5/11 46 13 33 44 21 24 10
4/17/11 42 16 26 49 21 27 10
*Washington Post/Kaiser Family Foundation
*** END ***