aallaawwii eeccoonnoommiicc ggrroowwtthh …
TRANSCRIPT

MMM AAA LLL AAAWWW III EEE CCC OOO NNN OOOMMM III CCC GGG RRR OOOWWW TTT HHH SSS TTT RRR AAA TTT EEE GGG YYY
VVV OOO LLL UUU MMM EEE III III :::
July 2004 Ministry of Economic Planning and Development P.O Box 30136, Lilongwe 3 Malawi Tel. (265) 01 788 888 Fax: (265) 01 788 247 E-mail: [email protected]

Malawi Economic Growth Strategy
Volume II i
FOREWORD This Malawi Economic Growth Strategy reflects a joint realisation by Government and the private sector that the economy has been registering low or negative growth and that something has to be done in order to reverse the trend. The rationale for growth and diversification for Malawi is compelling because rapid broad-based growth is necessary to reduce poverty. Rapid broad-based growth will expand the sectoral sources of growth, deepen and sustain the gains to be made from smallholder agriculture in leading growth and poverty reduction, and make the economy less susceptible to external shocks like weather, changes in terms of trade, political developments in the region, and fluctuations in external aid flows. However, existence of low per capita income and high inequality implies that high future economic growth should be complemented by equity policies. In April 2002, Malawi launched the Malawi Poverty Reduction Strategy Paper (MPRSP) that aims at meaningfully reducing poverty by empowering the poor. The MPRSP is built around four strategic pillars, the first of which emphasises the promotion of sustainable pro-poor growth. However, many stakeholders, including the private sector, have observed that policies to fulfil this strategic objective are insufficient to achieve the sustained annual economic growth of at least 6 per cent per annum required to reduce poverty by half by the year 2015. In view of the foregoing, the Ministry of Economic Planning and Development (MEPD) set up a Task Force to formulate a Malawi Economic Growth Strategy in close cooperation with the private sector. Political will and leadership are critical to the success of this Strategy because it will ensure that the right macroeconomic conditions and legal and regulatory environment exist within which economic growth, investment and trade can take place. Government has a central role in setting policies and channelling resources to ensure a conducive macro-environment. The Malawi Economic Growth Strategy has been based on a realistic assessment of the resources available. It focuses on strategies and actions that do not require substantial additional spending by Government, but can be achieved through refocusing existing resources and by developing a more conducive set of policies that will stimulate the private sector investment and trade in the immediate future. However, in the medium term, donor organisations will have a key role to play in creating the conducive environment for economic growth by supporting policy reforms and providing resources to support government during the transitional period.
David Faiti., M.P
MINISTER OF ECONOMIC PLANNING AND DEVELOPMENT

Malawi Economic Growth Strategy
Volume II ii
ACKNOWLEDGEMENTS The Malawi Economic Growth Strategy was developed by a Task Force led by the Ministry of Economic Planning and Development (MEPD). The Task Force comprised experts from key institutions within Government, the University and the National Action Group (NAG) Secretariat, which represented the private sector. The Task Force members were:
Mr. Alex Gomani Ministry of Economic Planning and Development (Chair of the Task Force)
Ms. Fanny M'bawa Ministry of Economic Planning and Development Mr. Thomas Munthali Ministry of Economic Planning and Development Professor Ben Kalua University of Malawi Mr. Steven Banda Ministry of Finance Mr. Nebert Nyirenda Ministry of Finance Ms. Tressa Namathanga Ministry of Tourism, Parks and Wildlife Mr. Grain Malunga Department of Mines Mr. Mufwa Munthali Ministry of Commerce and Industry Mr Chris Kachiza Ministry of Commerce and Industry Mr. Patrick Kanyimbo Ministry of Commerce and Industry Mr. Timothy Shawa Malawi Investment Promotion Agency Mr. Alick Nyasulu National Statistical Office Dr. Wilson Banda Reserve Bank of Malawi Dr. Charles Mataya Ministry of Agriculture, Irrigation and Food Security Mr. Jason Agar Kadale Consultants Ltd. Mr. John McGrath Imani Development (Malawi) Ltd
I acknowledge the considerable work of Task Force members in providing information and drafting key sections of this document. On its part, the Task Force would like to acknowledge the considerable inputs received from stakeholders from the public and the private sectors in preparing this Malawi Economic Growth Strategy. There were many consultations with individuals and organisations to ensure that the different issues constraining economic growth in the country are reflected in the Malawi Economic Growth Strategy and that appropriate strategies were formulated to address them. I also acknowledge the role of Dr Zaki Chalira, who, as the Director General of the National Economic Council and Department of Economic Planning and Development, provided his guidance for the large part of the process and also thank Mr Francis M’buka from the World Bank and Mr R. M. Jiah from Ministry of Tourism, Parks and Wildlife for their contributions. We are also indebted to the financial support provided by the United Nations Development Programme (UNDP) in the development of the Economic Growth Strategy. Finally, we thank all those who commented on and contributed to the various drafts of this Strategy.
Patrick C. Kamwendo
SECRETARY FOR ECONOMIC PLANNING AND DEVELOPMENT

Malawi Economic Growth Strategy
Volume II iii
ACRONYMS ADMARC Agricultural Development and Marketing Corporation AGOA Africa Growth Opportunities Act BRP Business Residence Permit CEM Country Economic Memorandum COMESA Common Market for Eastern and Southern Africa DANIDA Danish International Development Agency DEMATT Development of Malawian Entrepreneurs Trust DFID Department for International Development (UK) DTI Diagnostic Trade Integration (Study) DWS David Whitehead and Sons EBA Everything But Arms EC European Commission ECAMA Economics Association of Malawi EIB European Investment Bank EPZ Export Processing Zone ESCOM Electricity Supply Company of Malawi EU European Union FAO Food and Agriculture Organisation FOB Free on Board FTA Free Trade Area GDP Gross Domestic Product GoM Government of Malawi GRAMIL Grain and Milling Co. GTMA Garments and Textile Association of Malawi IMF International Monetary Fund ITC Information, Technology and Communication JICA Japan International Co-operation Agency LDC Least Developed Country MASAF Malawi Social Action Fund MASIP Malawi Social Investment Programme MBCAH Malawi Business Coalition against HIV/AIDS MBS Malawi Bureau of Standards MCCCI Malawi Confederation of Chambers of Commerce and Industry MDC Malawi Development Corporation MEDI Malawi Entrepreneurship Development Institution MEPC Malawi Export Promotion Council MEPD Ministry of Economic Planning and Development MFI Micro-finance Institutions MIPA Malawi Investment Promotion Agency MIRTDC Malawi Industrial Research Technology Development Centre MMTZ Malawi Mozambique Tanzania Zambia MoAI Ministry of Agriculture, Irrigation and Food Security MoCI Ministry of Commerce and Industry MoF Ministry of Finance MPRSP Malawi Poverty Reduction Strategy Paper MRA Malawi Revenue Authority MRFC Malawi Rural Finance Company MSE Micro and Small Enterprises

Malawi Economic Growth Strategy
Volume II iv
MTL Malawi Telecommunications Ltd MTPW Ministry of Tourism, Parks and Wildlife NAC National Aids Commission NAG National Action Group NASFAM National Smallholder Farmers Association of Malawi NGO Non-Governmental Organisations NRA National Roads Authority NSO National Statistical Office ODA Overseas Development Assistance PAYE Pay As You Earn PSIP Public Sector Investment Programme RBM Reserve Bank of Malawi SACU Southern African Customs Union SADC Southern African Development Community SEDOM Small-scale Enterprise Development Organisation of Malawi SFFRFM Smallholder Farmer Fertilizer Revolving Fund of Malawi SHIMPA Shire Highlands Milk Producers Association STA Smallholder Tea Authority STABEX Stabilisation System for Export Earnings STC Smallholder Tea Company SUCOMA Sugar Corporation of Malawi TAM Tea Association of Malawi TAMA Tobacco Association of Malawi TCC Tobacco Control Commission TEP Temporary Employment Permit TEVETA Technical Entrepreneurial and Vocational Education Training Authority UNDP United Nation Development Programme UNIDO United Nations Industrial Development Organisation USAID United States Agency for International Development WTO World Trade Organisation
DEFINITIONS Transitional Period Refers to the period from the time this Economic Growth Strategy will be implemented until sufficient economic growth is realised Macro-environment Refers to crosscutting issues like infrastructure, macroeconomic and social situation including HIV/AIDS pandemic, and general policy framework.

Malawi Economic Growth Strategy
Volume II v
TABLE OF CONTENTS
Foreword ...................................................................................................................................i
Acknowledgements...................................................................................................................ii
Acronyms................................................................................................................................ iii
Definitions ............................................................................................................................... iv
About This Report .................................................................................................................viii
Chapter One: Overview of the Economy.................................................................................1
1.1 Introduction.............................................................................................................1
1.2 Structure of the Economy ......................................................................................1
1.3 Recent Economic Developments............................................................................2
1.4 Prospects for Growth..............................................................................................5
Chapter Two: Cross-Cutting Constraints................................................................................9
2.1 Introduction.............................................................................................................9
2.2 Poor Macroeconomic Conditions ........................................................................10
2.3 Inefficient Tax and Incentive System..................................................................10
2.4 Poor Infrastructure...............................................................................................10
2.5 Poor Private and Public Co-operation and Dialogue ........................................10
2.6 Weaknesses in the Human Resource Base..........................................................11
2.7 Strategies................................................................................................................11
Chapter Three: Framework...................................................................................................14
3.1 Introduction...........................................................................................................14
3.2 Need for Political Will ..........................................................................................15
3.3 Stable Macroeconomic Policies............................................................................15
3.4 Trade ......................................................................................................................16
3.5 Domestic Supply of Internationally Competitive Goods and Services ............16
3.6 External Environment ..........................................................................................17
3.7 Clearly Defined Role of Government..................................................................18
3.8 Favourable Climate for Private Enterprises ......................................................18
3.9 Quality of Public Institutions...............................................................................18
3.10 Skilled Human Resources.....................................................................................19
3.11 Economic Empowerment Programme................................................................19
3.12 Resource Considerations ......................................................................................19
Chapter Four: Trade Strategy ...............................................................................................20
4.1 Overview ................................................................................................................20

Malawi Economic Growth Strategy
Volume II vi
4.2 Major Constraints Affecting Growth of Trade..................................................20
4.3 Proposed Strategy to Stimulate Trade................................................................21
Chapter Five: The Agriculture Sector...................................................................................23
5.1 Overview ................................................................................................................23
5.2 Agriculture and Irrigation Strategy....................................................................23
5.3 Priority Agricultural Sub-sectors and Strategy .................................................25
Chapter Six: The Tobacco Sector..........................................................................................27
6.1 Introduction...........................................................................................................27
6.2 Performance ..........................................................................................................27
6.3 Threats ...................................................................................................................28
6.4 Strategies................................................................................................................30
6.5 Implementation .....................................................................................................31
Chapter Seven: The Tea Sector .............................................................................................32
7.1 Introduction...........................................................................................................32
7.2 Current Performance ...........................................................................................32
7.3 Marketing ..............................................................................................................33
7.4 Investment in Replanting, Factories and Irrigation ..........................................34
7.5 Smallholder Tea Growers ....................................................................................36
7.6 Smallholder Growing Costs .................................................................................37
7.7 Constraints.............................................................................................................38
7.8 Strategies and Actions ..........................................................................................39
7.9 Implementation Process .......................................................................................42
Chapter Eight: The Sugar Sector..........................................................................................43
8.1 Introduction...........................................................................................................43
8.2 Future Prospects ...................................................................................................44
8.3 Global Competitiveness ........................................................................................44
8.4 Constraints.............................................................................................................45
8.5 Strategies................................................................................................................45
8.6 Implementation .....................................................................................................46
Chapter Nine: The Cotton Sector ..........................................................................................47
9.1 Introduction...........................................................................................................47
9.2 Cotton Production in Malawi ..............................................................................47
9.3 Pre-treated Seeds ..................................................................................................49
9.4 Marketing ..............................................................................................................50
9.5 Cottonseed .............................................................................................................51

Malawi Economic Growth Strategy
Volume II vii
9.6 Biotechnology in Cotton .......................................................................................52
9.7 The World Cotton Market ...................................................................................52
9.8 Linkages between Textiles and Garment Industry............................................55
9.9 Cotton Council ......................................................................................................55
9.10 Constraints.............................................................................................................56
9.11 Strategies................................................................................................................56
9.12 Implementation .....................................................................................................58
Chapter Ten: The Mining Sector ..........................................................................................59
10.1 Introduction...........................................................................................................59
10.2 Potential Demand for Mineral Products.............................................................60
10.3 Production of Minerals.........................................................................................61
10.4 Constraints.............................................................................................................64
10.5 Strategies................................................................................................................64
10.6 Implementation .....................................................................................................66
Chapter Eleven: The Manufacturing Sector ........................................................................68
11.1 Introduction...........................................................................................................68
11.2 Policy Background................................................................................................68
11.3 Structure of the Sector and Implications............................................................69
11.4 Opportunities and Constraints ............................................................................71
Chapter Twelve: Textiles and Garments ...............................................................................73
12.1 Introduction...........................................................................................................73
12.2 Textiles Analysis....................................................................................................73
12.3 Garments/Apparel Analysis.................................................................................74
12.4 Trade Agreements.................................................................................................74
12.5 Transportation ......................................................................................................76
12.6 Constraints.............................................................................................................76
12.7 Strategies................................................................................................................78
12.8 Implementation .....................................................................................................79
Chapter Thirteen: The Agro-processing Sub-sector.............................................................80
13.1 Introduction...........................................................................................................80
13.2 Canning And Preserving Fruit and Vegetables .................................................80
13.3 Rice Processing......................................................................................................81
13.4 Cassava...................................................................................................................82
13.5 Macadamia and Other Tree Nut Processing......................................................83
13.6 Other Potential Food Processing Investment Areas..........................................83

Malawi Economic Growth Strategy
Volume II viii
13.7 Constraints.............................................................................................................83
13.8 Strategies................................................................................................................84
13.9 Implementation .....................................................................................................85
ChapterFourteen: The Tourism Sub-sector..........................................................................86
14.1 Introduction...........................................................................................................86
14.2 Performance ..........................................................................................................86
14.3 Constraints.............................................................................................................88
14.4 Strategies................................................................................................................89
14.5 Implementation .....................................................................................................92
Chapter Fifteen: Refocusing of Public Sector Institutions..................................................94
15.1 Introduction...........................................................................................................94
15.2 Support Organisations..........................................................................................94
15.3 Regulatory/Enforcement Agencies ......................................................................95
15.4 Development Finance Institutions .......................................................................95
15.5 The Public Sector Investment Programme.........................................................96
Chapter Sixteen: The Private Sector Investment Strategy ...................................................97
16.1 Current Situation ..................................................................................................97
16.2 Private Sector Investment Constraints ...............................................................97
16.3 Investment Promotion Strategy...........................................................................98
Chapter Seventeen: Implementation ...................................................................................100
Appendix 1: Draft Investment Incentives ...........................................................................103
REFERENCES ....................................................................................................................108
About This Report
The Malawi Economic Growth Strategy report is published in three volumes: Volume I: Summary Report Volume II: Main Report Volume III: Action Plans The Economic Growth Strategy aims for a 6 per cent per annum increase in GDP. The Report documents constraints, strategies and action plans to achieve this. It looks at broad conditions such as the macroeconomic environment, public sector support institutions, and public-private sector dialogue. It also identifies specific sectors and sub-sectors for increased attention. These are
Sector Sub-sector Agriculture Tobacco Sugar Tea Cotton Distribution Tourism Manufacturing Agro-processing Textiles/Garments Mining & Quarrying
The shaded words are core sectors/sub-sectors, so classified because of their long-standing prominence in Malawi’s economy. The others are classified as “high growth potential” sectors and sub-sectors. To avoid cumbersome phrasing, all will be referred to as “sector” instead of sub-sector or sector as technically appropriate.

Malawi Economic Growth Strategy
Volume II 1/106
CHAPTER ONE: OVERVIEW OF THE ECONOMY
1.1 INTRODUCTION
In April 2002, Malawi launched the Malawi Poverty Reduction Strategy Paper (MPRSP) that aims at meaningfully reducing poverty by empowering the poor. The MPRSP is built around four strategic pillars, the first of which is the promotion of sustainable pro-poor growth. However, many stakeholders including the private sector have observed that policies to fulfil this strategic objective are insufficient to achieve a sustained annual economic growth of at least 6 per cent required to reduce poverty by half by the year 2015. In view of the foregoing, the Ministry of Economic Planning and Development (MEPD) set up a Task Force to formulate a Malawi Economic Growth Strategy in close co-operation with the private sector. Political will and leadership are critical to the success of this Strategy because Government has a central role in setting policies and channelling resources to ensure that conducive macro, legal and regulatory environments exist within which economic growth, investment and trade can take place. This Malawi Economic Growth Strategy is published in three volumes. Volume I of this document is a summary of the seventeen chapters featured in Volume II, which outlines the detailed analysis of the economic growth framework including the macroeconomic situation, trade strategy, proposed investment incentives, and the constraints facing and strategies recommended for the core and high growth potential -sectors. Volume III provides in table format the details on the action plans.
1.2 STRUCTURE OF THE ECONOMY
The Malawi economy remains agro-based with the agriculture sector accounting for over 38.6 per cent of GDP, employing about 84.5 per cent of the labour force and accounting for 82.5 per cent of foreign exchange earnings. Agriculture is characterised by a dual structure consisting of commercial estates that grows cash crops and a large smallholder sub-sector that is mainly engaged in mixed subsistence farming. Maize, the staple food, accounts for 80 per cent of cultivated land in the smallholder sub-sector. The main agricultural export crop is tobacco, followed by tea, sugar and coffee. The manufacturing sector is small at 11.0 per cent of GDP and declining. Manufacturing comprises mainly agro-processing activities, including of tobacco, tea and sugar. Distribution and services represent about 22.0 per cent each over 1998-2002 period.

Malawi Economic Growth Strategy
Volume II 2/106
1.3 RECENT ECONOMIC DEVELOPMENTS
Since December 2000, Malawi has been implementing an economic programme with support from the IMF under the Poverty Reduction Growth Facility (PRGF) aimed at restoring macroeconomic stability, which is a prerequisite for sustainable poverty reduction. However, the programme went off track in November 2001 due to fiscal slippages that prompted donors to withhold budgetary support. This led Government to rely on domestic financing to finance the budget deficit. The economic performance in 2001 was weak. Real GDP growth contracted by 4.1 per cent in 2001 mainly due to the drop in maize production following the drought. Inflation and interest rates remained high at 27.2 per cent and over 40 per cent, respectively, and the fiscal deficit including grants widened to 7.7 per cent of GDP in the 2001/02 fiscal year in contrast to 2.0 per cent in 2000/01. In the external sector, while the current account deficit excluding official transfers remained stable at 10.4 per cent of GDP, gross official reserves declined to the equivalent of 3.7 months of imports of goods and nonfactor services, reflecting the impact of suspension of balance of payments support by donors. Against this background, Government formulated the economic programme for the 2002/03 fiscal year focused on the need to continue pursuing the country’s medium-term development strategy which seeks to reduce poverty through increased access to basic social services, accelerating growth, improving productivity in agriculture and the manufacturing sectors, enhanced internal security and ensuring existence of a stable macroeconomic environment. Consistent with these objectives, the programme aimed at achieving real GDP growth of around 2.0 per cent in 2002 and 4.5 per cent in 2003; and an average inflation of 9.4 per cent in 2002 and 5.0 per cent in 2003. To meet these ends, Government planned to reduce the overall deficit to 1.4 per cent of GDP from 7.4 per cent of GDP in 2001/02 fiscal year. At the same time, the Reserve Bank of Malawi would maintain a tight monetary policy stance in order to achieve the inflation target. In pursuit of this policy stance, the Reserve Bank targeted the year-end reserve money growth to reach 8 per cent by December 2002. In addition, Government planned to implement parastatal reforms to reduce their fiscal impact on the budget. However, the implementation of the economic programme for the 2002/03 fiscal year proved difficult mainly because of the narrow revenue base and lack of budget support resulting from the withholding of budget support by donors. In addition, the expenditure overruns and maize imports also significantly contributed to the growth of the overall budget deficit. Fiscal policy became more expansionary with adverse consequences on the economy. The fiscal deficit including grants rose to 12.8 per cent of GDP in the 2002/03 fiscal year, money supply increased by 25.2 per cent in 2002 largely because of excessive Government domestic borrowing (resulting in high and unsustainable domestic debt stock of about K50 billion). Domestic interest payments were expected to go up to K6.4 billion by the end of the 2002/03 fiscal

Malawi Economic Growth Strategy
Volume II 3/106
year, accounting for 14.4 per cent of the revised total Government expenditure. (see Table 1.1) As a result of reliance on domestic borrowing by Government following the suspension of donor inflows for budgetary support, domestic debt doubled to K42 billion from K21 billion at the end of 2001. The domestic debt service has risen sharply to 24.7 per cent of Government revenue and 4.5 per cent of GDP compared to 13.2 per cent and 2.1 per cent in 1998, respectively.
Table 1.1: Domestic Debt Stock and Service, 1998- 2003
1998 1999 2000 2001 2002 2003
(In million of Kwacha)
Treasury Bills 9,173 5,216 28,933 28,674
Other Forms 3,193 16,539 13,470 16,496
Total 12,366 21,755 42,403 45,170 (Debt service as percentage share of)
Government Revenue 13.2 10.7 16.0 21.5 24.7 24.7
GDP 2.1 1.9 2.7 3.9 4.5 4.5 Source: Reserve Bank of Malawi
* Figure for 2003 is as at 19th Feb. 2003 while those for 2000-2002 are as at 31st December each year.
Urgent action is required to resolve the domestic debt problem. In order to achieve this, Government needs to, among others, undertake the following measures: reduce the fiscal deficit to sustainable levels by cutting down expenditures; ensure that the economic programme with the IMF gets back on track this year; negotiate with donors to restore their budgetary support; explore ways to resolve the current domestic debt problem through either restructuring it from short-term to medium- and long-term debt or negotiate with donors to refinance the debt; and restructure parastatals to reduce their fiscal impact on the budget. In addition to the domestic debt problem, interest rates remained high at above 40 per cent while gross investment fell substantially to 10.9 per cent of GDP from 13.9 per cent in 2001 (Table 1.2). Real GDP growth recovered slightly by 1.8 per cent while inflation decelerated substantially to 14.8 per cent from 27.5 per cent in 2001. The slowdown in inflation reflected the timely importation of maize that dampened food prices. In the external sector, the current account deficit excluding official transfers widened by 4.6 percentage points to 15.0 per cent of GDP because of high maize imports and associated shipments costs. This, combined with the 13.5 per cent drop in the capital account balance, led to the deterioration of the overall balance of payments after debt relief from a surplus of 4.4 per cent of GDP in 2001 to a deficit of 5.5 per cent of GDP in 2002. Gross official foreign reserves, therefore, declined from the equivalent of 3.2 months of imports in 2001 to 2.6 months of imports in

Malawi Economic Growth Strategy
Volume II 4/106
2002. This prompted the Kwacha to depreciate by 6.2 per cent from K72.2 to US$1 in 2001 to K76.7 to US$1 in 2002. Overall, the economic performance in 2002 was characterized by weak recovery of 1.8 per cent, worsening fiscal deficit to 12.8 per cent of GDP, high domestic debt stock and interest payment that account for a substantial share of total Government expenditure, low investment expenditure and weak balance of payments position with 2.6 months of import cover by end-2002. On a good note, inflation fell to 14.8 per cent from 27.2 per cent in 2001 mainly due to better management of the food shortages through timely distribution of relief/imported maize.
Table 1.2: Selected Economic and Financial Indicators, 1998-2002 1998 1999 2000 2001 2002
(Annual percentage changes, unless otherwise indicated) GDP and Prices Real GDP 2.2 3.6 2.0 -4.1 1.8 Per capita GDP (in US dollars) 193.8 195.2 187.3 183.8 207.5 Consumer prices (period average) 29.7 44.8 29.6 27.2 14.8 GDP deflator 25.4 41.2 27.8 19.0 17.0 Monetary Aggregates 1/ Broad money 55.5 33.6 42.4 32.1 25.2 Net foreign assets 105.1 14.1 46.8 -8.4 -37.5 Net domestic assets -49.6 19.5 -4.4 40.5 62.7 Credit to the Government -29.9 -2.9 6.9 34.7 45.5 Credit to the rest of the economy 18.5 20.6 12.4 1.5 3.7 Commercial banks’ prime lending rate 43.0 47.0 53.0 46.0 43.25
(As a percentage share of GDP, unless otherwise indicated.) Central Government Revenue 16.1 15.9 18.7 14.9 16.0 Expenditure 24.3 25.2 32.8 28.5 32.4 Current 16.4 15.2 22.6 21.3 26.4 Development 7.9 10.1 10.3 7.2 6.0 Overall deficit excluding grants -8.2 -9.3 -14.1 -13.5 -16.3 Overall deficit including grants -2.2 -1.8 -2.0 -7.4 -12.8 Net domestic financing -4.8 -1.5 -1.3 6.8 9.8 Net foreign financing 6.4 3.3 3.3 0.9 0.2 Savings and Investment Domestic savings 7.9 -0.6 3.4 4.8 -3.5 National savings 11.1 4.7 9.7 10.9 2.8 Foreign savings 2.2 9.6 3.9 3.0 7.7 Gross investment 13.4 14.4 13.6 13.9 10.5 External Sector Exports f.o.b. 30.5 24.7 23.1 25.0 21.9 Imports c.i.f. 37.8 42.5 35.4 36.8 38.5 Current account deficit -8.5 -16.0 -10.9 -10.4 -15.0 External debt 129.4 129.4 197.6 191.4 92.3 Debt-service ratio to exports 18.2 17.7 20.8 20.1 16.7 Terms of trade index (1994=100) 140.3 126.6 130.1 107.5 107.5 Kwacha per U.S. dollar (period average) 31.1 44.1 59.5 72.2 76.7 Gross Official Reserves End-period stock (in millions of U.S. dollars) 259.8 246.0 278.3 203.1 162.0 In months of imports of goods and nonfactor services 5.4 5.0 4.7 3.5 2.6

Malawi Economic Growth Strategy
Volume II 5/106
1/ Change as percentage share of broad money at the beginning of the period Source: National Accounts and Balance of Payments Technical Committee meeting
1.4 PROSPECTS FOR GROWTH
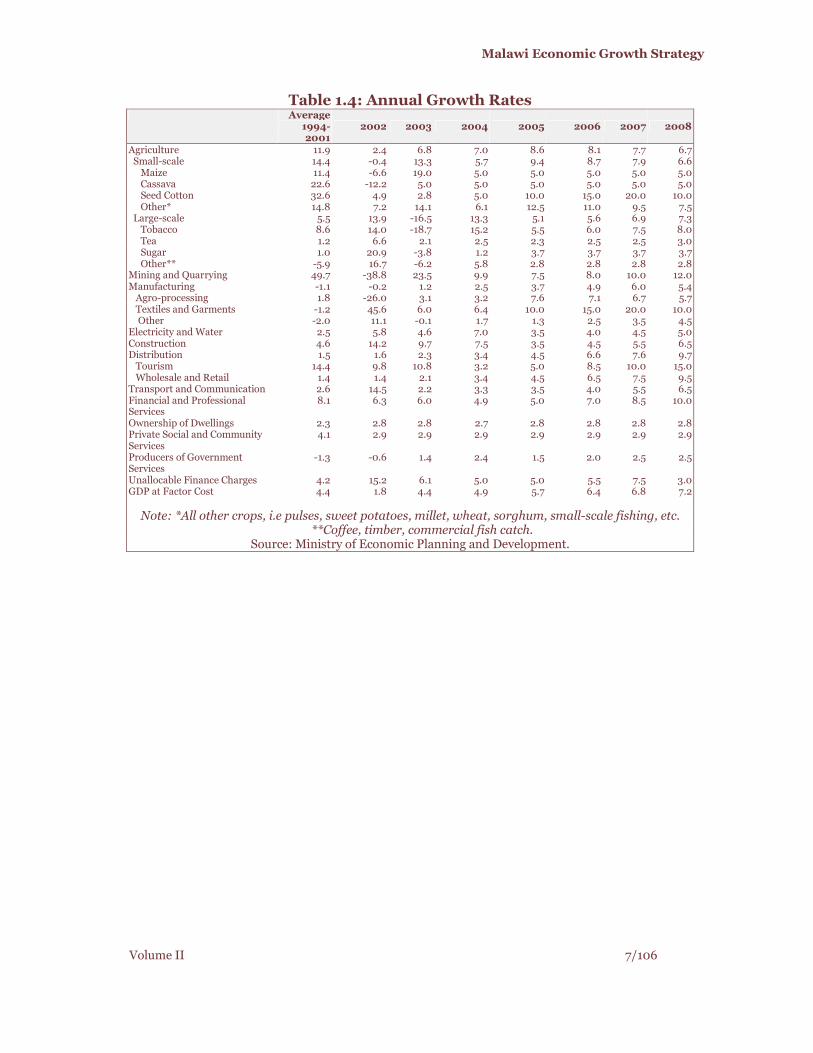
Prospects for economic growth in the medium-term (2004–2008) will continue to be driven by the agriculture sector. With increased investment in infrastructure, improved credit, and marketing, agricultural production is expected to increase substantially. This, in turn, is expected to stimulate activity in manufacturing, transport and distribution sectors. Therefore, the structure of the economy in terms of sectoral shares to GDP is projected to remain the same in the medium term. On average, overall growth for the agriculture sector is estimated at 7.8 per cent per annum over the entire period. Crops are projected to increase annually as follows: seed cotton by 13.8 per cent; tobacco by 6.8 per cent; tea by 2.6 per cent; and sugar by 3.7 per cent. The manufacturing sectors are expected to increase by 5.0 per cent per annum, agro-processing by 6.8 per cent, and textiles and garments by 13.8 per cent. The mining sector is expected to increase by an average growth rate of 9.4 per cent. This is because it is estimated that more activity in the sector will depend on the formulation of the Minerals Policy and Act, which should take two years at a minimum from 2003. The tourism sector is expected to increase by an average growth rate of 9.6 per cent. There will be need to put in place the required infrastructure and develop unique tourism products to attract both domestic and international tourism. Other assumptions are that the wholesale and retail sector will grow at 7.0 per cent in line with the manufacturing and agriculture sectors. The electricity and water sectors are expected to increase by an average growth rate of 4.3 per cent. However, the interconnection to Cabora Bassa will be required to stabilise electricity supply. This should increase power availability for mining and manufacturing activities. The transport sector is expected to grow by an average 4.9 per cent due to increased agriculture and manufacturing output, and construction at 5.0 per cent because of high demand for buildings and infrastructure. Government will provide the initial investment for infrastructure, building, and services such as education and health, which will increase production of Government services by 2.1 per cent (Table 1.3). 1.4.1 Projected Economic Growth
Based on these assumptions, real GDP growth is projected to increase from 4.9 per cent in 2004 to 7.2 per cent in 2008 (Tables 1.4). The source of growth remains the agriculture sector whose share of GDP rises to 42.1 per cent by 2008, especially the smallholder sub-sector, which increases from 32.6 per cent of GDP in 2003 to 34.9 per cent in 2008. As regards the high economic growth potential sub-sectors of mining and quarrying, tourism and agro-processing, their respective shares of GDP will remain small despite growing at between 7.0-10 per cent per year over the 2003-08 period. The major reason is that these sectors are currently low at 1.5 per

Malawi Economic Growth Strategy
Volume II 6/106
cent of GDP such that it will take a long time at high growth to reach significant levels of GDP. In order to achieve the projected growth rates:
1. Gross fixed capital formation should increase by an average annual rate of 7.2 per cent from K19.0 billion in 2005 to K41.5 billion in 2008. This means an almost double increase in the share of GDP from 7.8 per cent to 13.1 per cent.
2. Domestic savings will have to rise from K-4.1 billion to K28.8 billion over the same period. As a share of GDP, it will reach only 9.1 per cent by 2008.
3. National savings must rise from K2.5 billion to K37.0 billion. This is an increase from 1.1 per cent to 11.7 per cent of GDP; and
4. While foreign savings will slow down, they will remain high during the period.
In summary, in terms of economic prospects, economic growth is projected to rise over 5 per cent by 2005 and beyond. However, to achieve this growth, Government must restore macroeconomic stability and improve the environment for the private sector to do business. This will involve addressing the cross-cutting constraints highlighted in the next chapter.
Table 1.3: Gross Domestic Product at 1994 Factor Cost, 1994 - 2008 (in millions of Kwacha)
Average 1994-2001
2002
2003
2004
2005
2006
2007
2008
Agriculture 4,132.8 4,926.3 5,260.9 5,627.2 6,111.6 6,607.4 7,115.7 7,593.9 Smal-scale 3,177.4 3,846.2 4,358.7 4,605.3 5,037.6 5,473.7 5,904.3 6,293.6 Maize 1,047.5 862.0 1,025.7 1,077.0 1,130.8 1,187.4 1,246.7 1,309.1 Cassava 602.6 746.1 783.4 822.6 863.7 906.9 952.2 999.8 Seed Cotton 36.2 34.0 34.9 36.6 40.3 46.4 55.6 61.2 Other* 1,491.0 2204.1 2514.7 2669.2 3,002.8 3,333.1 3,649.8 3,923.5 Large-scale 955.5 1,080.1 902.2 1,021.9 1,074.0 1,133.7 1,211.4 1,300.3 Tobacco 772.3 931.8 757.2 872.1 920.1 975.3 1,048.4 1,132.3 Tea 60.2 61.2 62.5 64.1 65.5 67.2 68.8 70.9 Sugar 28.2 35.3 34.0 34.4 35.7 37.0 38.4 39.8 Other** 94.7 51.7 48.5 51.3 52.8 54.2 55.8 57.3 Mining and Quarrying 147.1 123.7 152.8 168.0 180.6 195.0 214.6 240.3 Manufacturing 1,658.3 1,453.5 1,470.5 1,507.1 1,562.7 1,638.6 1,736.3 1,830.7 Agro-processing 473.5 378.1 389.7 402.2 432.8 463.6 494.6 522.9 Textiles and Garments 82.2 108.5 115.0 122.4 134.6 154.8 185.8 204.4 Other 1,102.7 966.9 965.8 982.5 995.3 1,020.2 1,055.9 1,103.4 Electricity and Water 165.2 185.9 194.5 208.1 215.4 224.0 234.1 245.8 Construction 249.6 311.2 341.4 366.9 379.7 396.8 418.7 445.9 Distribution 2,727.5 2,826.0 2,892.0 2,989.2 3,124.2 3,329.1 3,581.4 3,927.8 Tourism 52.8 78.6 87.1 89.9 94.4 102.4 112.7 129.6 Wholesale and Retail 2,674.7 2,747.4 2,804.9 2,899.3 3,029.8 3,226.7 3,468.7 3,798.2 Transport and Communication
534.9 624.7 638.7 659.5 682.6 709.9 748.9 797.6
Financial and Professional Services
927.0 1,082.4 1,147.1 1,203.5 1,263.7 1,352.1 1,467.1 1,613.8
Ownership of Dwellings 174.8 195.0 200.4 205.9 211.7 217.6 223.7 229.9 Private Social and Community Services
249.9 287.1 295.4 304.0 312.8 321.9 331.2 340.8
Producers of Government Services
1,341.9 1,208.4 1,225.6 1,255.1 1,273.9 1,299.4 1,331.9 1,365.2
Unallocable Finance Charges
-341.6 -420.5 -446.0 -468.3 -491.7 -518.8 -557.7 -574.4
GDP at Factor Cost 11,967.3 12,803.7 13,373.3 14,026.2 14,827.2 15,773.1 16,845.8 18,057.2
Malawi Economic Growth Strategy
Volume II 7/106
Table 1.4: Annual Growth Rates Average
1994-2001
2002 2003 2004 2005 2006 2007 2008
Agriculture 11.9 2.4 6.8 7.0 8.6 8.1 7.7 6.7 Small-scale 14.4 -0.4 13.3 5.7 9.4 8.7 7.9 6.6 Maize 11.4 -6.6 19.0 5.0 5.0 5.0 5.0 5.0 Cassava 22.6 -12.2 5.0 5.0 5.0 5.0 5.0 5.0 Seed Cotton 32.6 4.9 2.8 5.0 10.0 15.0 20.0 10.0 Other* 14.8 7.2 14.1 6.1 12.5 11.0 9.5 7.5 Large-scale 5.5 13.9 -16.5 13.3 5.1 5.6 6.9 7.3 Tobacco 8.6 14.0 -18.7 15.2 5.5 6.0 7.5 8.0 Tea 1.2 6.6 2.1 2.5 2.3 2.5 2.5 3.0 Sugar 1.0 20.9 -3.8 1.2 3.7 3.7 3.7 3.7 Other** -5.9 16.7 -6.2 5.8 2.8 2.8 2.8 2.8 Mining and Quarrying 49.7 -38.8 23.5 9.9 7.5 8.0 10.0 12.0 Manufacturing -1.1 -0.2 1.2 2.5 3.7 4.9 6.0 5.4 Agro-processing 1.8 -26.0 3.1 3.2 7.6 7.1 6.7 5.7 Textiles and Garments -1.2 45.6 6.0 6.4 10.0 15.0 20.0 10.0 Other -2.0 11.1 -0.1 1.7 1.3 2.5 3.5 4.5 Electricity and Water 2.5 5.8 4.6 7.0 3.5 4.0 4.5 5.0 Construction 4.6 14.2 9.7 7.5 3.5 4.5 5.5 6.5 Distribution 1.5 1.6 2.3 3.4 4.5 6.6 7.6 9.7 Tourism 14.4 9.8 10.8 3.2 5.0 8.5 10.0 15.0 Wholesale and Retail 1.4 1.4 2.1 3.4 4.5 6.5 7.5 9.5 Transport and Communication 2.6 14.5 2.2 3.3 3.5 4.0 5.5 6.5 Financial and Professional Services
8.1 6.3 6.0 4.9 5.0 7.0 8.5 10.0
Ownership of Dwellings 2.3 2.8 2.8 2.7 2.8 2.8 2.8 2.8 Private Social and Community Services
4.1 2.9 2.9 2.9 2.9 2.9 2.9 2.9
Producers of Government Services
-1.3 -0.6 1.4 2.4 1.5 2.0 2.5 2.5
Unallocable Finance Charges 4.2 15.2 6.1 5.0 5.0 5.5 7.5 3.0 GDP at Factor Cost 4.4 1.8 4.4 4.9 5.7 6.4 6.8 7.2
Note: *All other crops, i.e pulses, sweet potatoes, millet, wheat, sorghum, small-scale fishing, etc. **Coffee, timber, commercial fish catch.
Source: Ministry of Economic Planning and Development.

Malawi Economic Growth Strategy
Volume II 8/106
Table 1.5: Sectoral Share of Total GDP, 1994-2008 (in percent)
Average
1994-2001
2002
2003
2004
2005
2006
2007
2008
Agriculture 34.6 39.0 39.8 40.6 41.2 41.9 42.2 42.1 Small-scale 26.1 30.0 32.6 32.8 34.0 34.7 35.0 34.9 Maize 8.7 6.7 7.7 7.7 7.6 7.5 7.4 7.2 Cassava 4.9 5.8 5.9 5.9 5.8 5.7 5.7 5.5 Seed Cotton 0.3 0.3 0.3 0.3 0.3 0.3 0.3 0.3 Other 12.2 17.2 18.8 19.0 20.3 21.1 21.7 21.7 Large-scale 8.5 8.9 7.2 7.8 7.2 7.2 7.2 7.2 Tobacco 6.4 7.3 5.7 6.2 6.2 6.2 6.2 6.3 Tea 0.5 0.5 0.5 0.5 0.4 0.4 0.4 0.4 Sugar 0.2 0.3 0.3 0.2 0.2 0.2 0.2 0.2 Other 1.3 0.9 0.9 0.9 0.4 0.3 0.3 0.3 Mining and Quarrying 1.2 1.0 1.1 1.2 1.2 1.2 1.3 1.3 Manufacturing 14.0 11.4 11.0 10.7 10.5 10.4 10.3 10.1 Agro-processing 4.0 3.0 2.9 2.9 2.9 2.9 2.9 2.9 Textiles and Garments 0.7 0.8 0.9 0.9 0.9 1.0 1.1 1.1 Other 9.3 7.6 7.2 7.0 6.7 6.5 6.3 6.1 Electricity and Water 1.4 1.5 1.5 1.5 1.5 1.4 1.4 1.4 Construction 2.1 2.4 2.6 2.6 2.6 2.5 2.5 2.5 Distribution 23.0 22.1 21.6 21.3 21.1 21.1 21.3 21.8 Tourism 0.4 0.6 0.7 0.6 0.6 0.6 0.7 0.7 Wholesale and Retail 22.5 21.5 21.0 20.7 20.4 20.5 20.6 21.0 Transport and Communication
4.5 4.9 4.8 4.7 4.6 4.5 4.4 4.4
Financial and Professional Services
7.7 8.5 8.6 8.6 8.5 8.6 8.7 8.9
Ownership of Dwellings 1.5 1.5 1.5 1.5 1.4 1.4 1.3 1.3 Private Social and Community Services
2.1 2.2 2.2 2.2 2.1 2.0 2.0 1.9
Producers of Government Services
11.4 9.4 9.2 8.9 8.6 8.2 7.9 7.6
Unallocable Finance Charges
-3.4 -3.8 -3.8 -3.8 -3.3 -3.3 -3.3 -3.2
GDP at Factor Cost 100.0 100.0 100.0 100.0 100.0 100.0 100.0 100.0
Source: Ministry of Economic Planning and Development.
Table 1.5: Projected Selected Macroeconomic Indicators, 1995- 2008
(Annual percentage changes, unless otherwise stated) Average
1995-2001
2002
2003
2004
2005
2006
2007
2008
GDP at 1994 factor cost 4.4 1.8 4.4 4.9 5.7 6.4 6.8 7.2 Real Exports of Goods and Non-factor Services 5.5 -0.9 1.4 9.2 5.5 6.5 7.5 8.0 Real Imports of Goods and Non-factor Services 3.5 28.3 -0.6 -0.9 0.5 1.5 2.0 2.0 Real Gross Fixed Capital Formation -3.2 -19.7 0.7 4.1 14.4 19.1 23.8 24.0 Gross Savings as Share of GDP* 13.7 10.1 9.1 8.6 9.3 10.4 12.1 14.0 of which: Domestic Savings as Share of GDP 2.9 -7.1 -6.6 -4.7 -1.8 1.3 5.0 9.1 National Savings as Share of GDP** 7.6 -2.6 -2.6 -1.6 1.1 4.1 7.7 11.7 Foreign Savings as Share of GDP 6.1 12.7 11.6 10.3 8.2 6.3 4.3 2.3 Gross Investment as Share of GDP 13.7 10.1 9.1 8.6 9.3 10.4 12.1 14.0 Inflation 37.4 14.8 10.0 8.0 6.0 6.0 6.0 6.0
Note: *Gross Savings is sum of national savings and foreign savings. **National Savings is domestic savings plus net factor income plus net private transfers plus net
government transfers. Source: Ministry Economic Planning and Development.

Malawi Economic Growth Strategy
Volume II 9/106
CHAPTER TWO: CROSS-CUTTING CONSTRAINTS
2.1 INTRODUCTION
There are many cross-cutting constraints on private sector growth, identified through a consultative process involving private sector and other key stakeholders, that need to be addressed urgently. These are the macro-environmental issues that constrain firms from achieving higher sales and profits through investment and trading activities. There are some positive enabling factors that can support growth as follows:
1. A good climatic condition for the growing of many crops. 2. Potential for irrigation. 3. Relatively low labour costs. 4. Existence of rule of law and political will. 5. Contract farming arrangement between smallholder farmers and buyers 6. Processors exist for a number of crops, including tobacco, tea, sugar, and
cotton. 7. Membership in regional and international trade bodies including SADC
and COMESA gives Malawi potential to increase market access for exports and deal with unfair trade activities and disputes with other countries.
The constraints fall into several broad areas:
1. Poor macroeconomic conditions. 2. Inefficient tax and incentive system. 3. Poor infrastructure. 4. Poor private and public sectors dialogue and co-operation. 5. Low human resource base and skills. 6. Costly regulatory environment. 7. Unfavourable trade agreements and weak negotiating capacity. 8. High insecurity, which adds significant costs, including increased
insurance costs and unrecoverable losses that deter investment. 9. Delays in allocation and administration of land for establishment of new
industries. 10. High cost and unreliable supply of utilities (water, electricity,
communications). The five priority constraints are described in the next chapters, followed by strategies to address them.

Malawi Economic Growth Strategy
Volume II 10/106
2.2 POOR MACROECONOMIC CONDITIONS
Over the past five years, the country has experienced macroeconomic instability manifested through high inflation, high interest rates and wide fluctuations in the exchange rates. The fundamental problem behind the poor macroeconomic situation has been high and unsustainable fiscal deficits. High inflation and unstable exchange rates have made business decision-making and planning difficult. At the same time, the currently high interest rate of over 45 per cent and real interest rates in excess of 30 per cent have reduced private sector investment, thus jeopardising future economic growth.
2.3 INEFFICIENT TAX AND INCENTIVE SYSTEM
Although tax and incentives systems are broadly competitive in the region, the tax system is geared towards revenue collection rather than towards supporting economic growth. The incentive system is complex, non-transparent, non-automatic and discretionary. It favours new international investments and does not consider existing domestic investors. This puts existing businesses at a disadvantage if they want to re-invest to modernise. The approval of incentives and allocation of land is slow and uncertain. Incentives once granted are not guaranteed, and the incentive regime is unpredictable because of policy reversals. In addition, there are delays in processing tax refunds (tax returns, surtax refunds and other rebates), due to manual processing by MRA. These delays impose an additional cost on businesses, given the high interest rates.
2.4 POOR INFRASTRUCTURE
Malawi’s landlocked status is a major disadvantage to businesses as it increases the costs to importers and exporters relative to regional competitors. The weakness of the transport infrastructure includes poor access to ports, limited air links and freight capacity, limited rail capacity and poor condition of roads serving manufacturing, mining, tourism and rural producing areas. In addition, the problems with utilities (water, electricity and communication) affect production in Malawi because they are not only unreliable but also inefficient and expensive. The capacity of information technology is weak in both the private sector and the public sector.
2.5 POOR PRIVATE AND PUBLIC CO-OPERATION AND DIALOGUE
There has been weak co-operation and consultation between the private and public sectors due to a lack of a recognised, representative and legal institution that would serve as a liaison between the two sides, such as a Business Council. The Chamber of Commerce has generally failed to win the trust and confidence of the private sector and to act as an effective mouthpiece for the private sector.

Malawi Economic Growth Strategy
Volume II 11/106
2.6 WEAKNESSES IN THE HUMAN RESOURCE BASE
The current resource base is relatively weak, characterised by low skill, limited vocational and technical skills, and low productivity. This partly reflects weaknesses in the education system, inadequate capacity for vocational, entrepreneurial and business management skills development and the devastating impact of HIV/AIDS pandemic. The curricula for primary and secondary school education levels do not include vocational, entrepreneurial and business management skills or address other needs of business community and economy as a whole.
2.7 STRATEGIES
Several strategies have been recommended for improving prospects for growth. These are listed below. Strategy 1: Restore and sustain macroeconomic stability by:
1. Reducing the fiscal deficit to sustainable levels of about 20-25 per cent of GDP. 2. Having GoM reach an agreement with the IMF to restore the economic
programme, which is an important factor in the resumption of budgetary support by donors.
3. Rationalising and/or privatising loss-making parastatals. 4. Deepening financial sector reforms. 5. Exploring ways to resolve the current domestic debt problem with donors or to
restructure the debt to medium- to long-term and/or refinance domestic debt through agreement with multilateral donors.
6. Having GoM implement further actions to reduce its expenditures.
Strategy 2: Increase availability of long-term capital through:
1. Restoring the original mandate of Malawi Development Corporation (MDC) and INDEBANK of providing long-term and venture capital for investment. It should be noted both of these bodies are on the list to be privatised.
2. Recapitalising INDEBANK and MDC to increase investment funds. 3. Finding equity partners for MDC and INDEBANK. 4. Reviewing the progress of MRFC, MSB, SEDOM and DEMATT financial
operations to cease loss-making operations and re-orient their roles. At present, MRFC and MSB are in the early stages of privatisation and are being reviewed by consultants.
Strategy 3: Improve the tax and incentive system and administration by:
1. Undertaking tax reforms to ensure that the structure and administration of the tax system encourages economic growth through promotion of economic efficiency, equity, fairness and investment.
2. Simplifying the incentives system and formulate guidelines to enable companies to automatically qualify for the benefits. The incentives should also be transparent and less discretionary.

Malawi Economic Growth Strategy
Volume II 12/106
3. Automating the processing system for tax refunds by MRA. 4. Creating a Tax Ombudsman and supporting office for easy dispute resolution
between businesses and MRA. 5. Undertaking a review of the current general incentives with appropriate
international comparisons linked to current UNIDO/ECAMA activity. 6. Improving the process for granting business residence permits and temporary
employment permits, and reviewing EPZ rules to make them more attractive to investors.
7. Introducing a mechanism (i.e. an investor certificate) for guaranteeing incentives that is recognised by all GoM agencies and departments.
8. Implementing the MIPA/MEPC merger. 9. Stimulating investment by businesses through improved investment allowances,
initial capital and improved depreciation rules. Strategy 4: Improve the cost efficiency of regulatory environment by:
1. Reforming the public sector to improve public service delivery. 2. Reviewing the operation of pre-shipment inspection with businesses to improve
its operation and reduce its costs on those businesses shown to have been generally compliant.
3. Liberalizing and strengthening the commercial legal system. 4. Deregulating legal fees. 5. Establishing a commercial court system and small claims court with more
appropriate procedures and dedicated judges/magistrates. Strategy 5: Increase budgetary resources to public institutions and agencies that
support the private sector, reduce the bureaucracy and stop policy reversals.
Strategy 6: Improve GoM trade negotiating capacity through training and full consultation and involvement of the private sector (see also Trade Strategy).
Strategy 7: Improve the security situation in the country by:
1. Increasing budgetary resources for the police. 2. Strengthening the legal and judicial system. 3. Making the penalties tough and removing the bail system.
Strategy 8: Improve the infrastructure by:
1. Providing more resources to National Roads Authority (NRA) 2. Continuing the privatisation of Air Malawi, and implementing the
Yamoussoukro Decision 3. Negotiating funding for strengthening both the Nacala and Beira Corridors
transport infrastructure and improving port and airport infrastructure 4. Developing a mechanism for identifying transhipment issues with neighbouring
countries.
Malawi Economic Growth Strategy
Volume II 13/106
5. Undertaking a thorough review of the high costs of the transport sector, including the fuel levy and licensing rules.
Strategy 9: Improve the cost effectiveness and reliability of supply of utilities
through the following strategies:
1. Develop an agreed power strategy with ESCOM, GoM, and donors for reducing power failures.
2. Implement the interconnection of the power lines to Cabora Bassa hydroelectric power station and Kapichira Phase 2.
3. Revise and reduce the maximum demand tariff in line with recommendations from the private sector.
4. Remove the charges/generation fees for the installation of back-up generators. 5. Complete the privatization of MTL. 6. Rationalize the water supply companies. 7. Review the pricing structures and regulatory process of all utilities in order to
improve services and establish a regime that balances customer demands and providers’ need for profitability.
Strategy 10: Improve the dialogue between Government and the private sector by:
1. Establishing a legal forum, such as the Business Council. 2. Strengthen the wide representation of MCCCI as a focal point for lobbying and
dialogue for the private sector. Strategy 11: Improve the human resource base by:
1. Providing more funding for increasing training in vocational and technical skills by TEVETA.
2. Rehabilitating and increasing the number of technical colleges in the country. 3. Strengthening the response to HIV/AIDS pandemic by the private sector through
the launch of the Malawi Business Coalition Against HIV/AIDS (MBCAH) and formation of a stronger partnership with National Aids Commission (NAC) and MBCAH to educate the sectors on the dangers and ways of avoiding contracting the disease.
4. Main-streamlining HIV/AIDS in the workplace, and how to care for those infected and affected; and use available funding for relevant initiatives and learning from the initiatives of other businesses in Malawi and beyond.
Strategy 12: Improve corporate governance.
Strategy 13: Increase business management training opportunities in the country.
Strategy 14: Introduce vocational and technical and business management courses at primary and secondary schools.
Strategy 15: Improve the process for allocating and administering land for establishment of new industries.

Malawi Economic Growth Strategy
Volume II 14/106
CHAPTER THREE: FRAMEWORK
3.1 INTRODUCTION
The Malawi Economic Growth Strategy has been built upon lessons from the economic development experiences of other countries. While the processes driving economic development are by no means fully understood, history shows above all that economic policies and institutions are crucial. A central development issue is the interaction between Government and markets. Competitive markets are the best way found to effectively organise production and distribution of goods and services. But markets cannot operate in a vacuum. They sometimes fail altogether or prove to be inadequate. They require a legal and regulatory framework that only Governments can provide. This is why the Government provides infrastructure, essential services to the poor, and cautious intervention to remedy market failures. In addition, high economic stability has been associated with:
• Stable political system and political will to support economic growth; • Macroeconomic policies that promote sustainable economic stability; • Policies promoting outward orientation and competition; • A domestic supply of internationally competitive goods and services for
domestic consumption and exports; • A favourable external environment; • A clearly defined role of Government; • A favourable climate for private enterprise; • Quality and supportive institutions; and • Skilled human resources.
The Malawi Economic Growth Strategy is, therefore, built upon all the above principles. It aims at achieving high economic growth through the stimulation of trade and investment, and the restoration of macroeconomic stability. It also recognises the need to stimulate domestic supply in the three core and five high growth potential sectors for the country to meaningfully benefit from domestic and international trade. Figure 3.1 below depicts the framework underpinning the Malawi Economic Growth Strategy, which encompass all the principles above.

Malawi Economic Growth Strategy
Volume II 15/106
Figure 3.1: The Framework for the Malawi Economic Growth Strategy
D o m e st ic /In te r n a t io n a l T r a d e
S erv ices
T o u ris m
M a n u fa c tu rin g
T ex t/G arm en t, A g ro-p roces s ing
N atu ra l R eso u rces
M in in g
A gr icu l tu reT o b a c co , T e a , S u g a r , C o tto n ,
M a ize & c a ssa va
T rad e B o d ies / A g re e m e n ts
U til i ties /C o m m u n ica t io ns / In fra s tru c tu re/F ina n ce /Ir r iga t io n
S u p p o rtin g
S up p o rt iv e L eg al/ R eg . F ra m ew o rk
M a c ro -e co n o m ic co nd it io ns fo r g ro w thO ppo rtu ni ties & In c e n tiv es fo r :
P o lit ic a l W ill
R e so u rc e s P o l ic iesP
rivat
e S
ecto
r
Inve
stm
ent
Deve lopm
ent Part ners
P u b lic S e c to r In v e s tm e n t P r o g r am m e
D is trib u tio n/ Im p o r t/E xpo r t /W h o lesa le /R e ta i l/T ra n sp o rt
G ro w t h o f at le as t 6% p er an n u m
Source: MEPD/Task Force
3.2 NEED FOR POLITICAL WILL
The Strategy recognises that the existence of political will is essential to formulate and implement appropriate Government policies and reforms that lead to the legal and regulatory framework which in turn creates a stable accountable, transparent, and democratic political system and conducive environment for stimulating private sector investment, trade, and growth. A stable and conducive political, economic and social environment is paramount to economic development in any country. In order for the private sector to make long-term investment, it needs to be sure that any investment and property will be secure.
3.3 STABLE MACROECONOMIC POLICIES
A stable macroeconomic foundation is one of the most important public goods that Government can provide. Experience indicates that macroeconomic stability is necessary for sustainable growth. Sound fiscal and monetary policies create a hospitable climate for private investment. Although macroeconomic stability certainly does not by itself lead to development, without it all other efforts are likely to be in vain. In view of this, the current poor macroeconomic situation, as manifested by high fiscal deficit, high interest rates and high domestic debt, poses a big constraint on economic growth in the country. High interest rates and Government domestic

Malawi Economic Growth Strategy
Volume II 16/106
borrowing are crowding out private sector borrowing and reducing investment and economic growth. To stimulate high economic growth, Government needs to reduce the fiscal deficit to 20-25 per cent of GDP mainly through a reduction in Government expenditure, parastatal reform, and restoring its Economic Programme with the IMF. By implementing these measures, Government will reduce the fiscal deficit and its domestic borrowing which will bring down inflation and interest rates while releasing more financial resources to the private sector at lower cost. Macroeconomic stability will also restore the private sector’s confidence in government.
3.4 TRADE
Where international flows of goods, services, capital, labour, and technology have expanded quickly, the pace of economic advance has been rapid. Openness to trade, investment and ideas are critical in encouraging domestic producers to introduce new technologies and to develop new and better products. A high level of protection for domestic industry, conversely, has held development back by decades in many places. International flow of technology takes many forms: foreign investment; foreign education; technical assistance; the licensing of patented processes; the transmission of knowledge through labour flows and exposure to foreign goods markets; and technology embodied in imports of capital, equipment and intermediate inputs. Policies to promote these flows include greater openness to investment and to trade in goods and services. However, to get most from the technological transfer, Government needs to provide appropriate education and on-the-job training. In addition, Government needs to ensure the existence of a favourable international trading system and adequate domestic capacity to supply internationally high-quality products for export. To achieve the former, Government and the private sector are engaged in regional and multilateral trade talks. Under the WTO trade negotiations, the focus of trade talks is to enable developed countries to reduce trade barriers to imports from developing countries (including Malawi) while those regional talks emphasise the creation of a regional integrated trading bloc in SADC, COMESA and the African Union. If Malawi is to fully benefit from international trade liberalisation, it must be able to supply the high quality goods demanded in the export markets of our trading partners. It is in recognition of this fact that the Strategy would like to develop the production capacity of core sub-sectors and several sub-sectors deemed high economic growth potential sub-sectors in the economy as detailed below.
3.5 DOMESTIC SUPPLY OF INTERNATIONALLY COMPETITIVE GOODS
AND SERVICES
In the short- to medium-term, high economic growth will still be driven by the three core agricultural sectors of tobacco, tea and sugar. These three currently contribute significantly to the economy in terms of income, job creation, foreign exchange earnings and GDP growth. These sectors will not grow at the same rates as the high

Malawi Economic Growth Strategy
Volume II 17/106
potential growth sectors identified in this strategy, but because of their scale and current importance to the economy, it is necessary to ensure that their overall performance is maximised in the short- to medium- term, whilst the growth sub-sectors and core sectors of the future are developed. In view of this, the Strategy proposes to implement strategies and policies that increase the growth of these sectors to their optimum levels. In the long run, high economic growth will come from the selected high growth potential sectors of agro-processing, mining, tourism, cotton, and textiles/garments. This does not mean that other sectors or industries will be neglected. However, it does mean that the selected sub-sectors will benefit from increased attention, focus and priority by the private sector, Government and development partners. These high growth potential sectors are based on the analysis1 by MEPD on which economic sectors can generate enough growth to impact on the overall growth rate of the economy. Other criteria included: Which sub-sectors can quickly generate wider economic impacts if they grow? Which sub-sectors/industries are the core sub-sectors of the economy now and in the medium-term? Which sub-sectors/industries have potential to contribute high growth and have serious investors already investing or ready to invest? Over time, the choice of sub-sectors will be regularly reviewed and reprioritised as new information on performance and constraints/opportunities becomes available. There should also be a phasing mechanism.
3.6 EXTERNAL ENVIRONMENT
International trading and financial systems have a big influence on the pace of economic development. Industrial countries have a responsibility to grant exporters in developing countries access to their markets. Without such access, economic reforms in the developing countries will not be fruitful. In addition, the industrial countries and multilateral agencies including the World Bank can strengthen development prospects by enhancing the quantity and quality of external finance. They need to: 1. Increase financial support. More financing, both concessional and
nonconcessional, would greatly strengthen the development effort. Further efforts are needed to provide debt relief. In this regard, Government needs to fulfill all the requirements for the resumption of donor assistance.
2. Support policy reform. Donors can initiate policy reforms and also provide
additional financing will be far more effective when it supports sound domestic policy reforms.
1 This is based on the Additional Engines for Growth Study.

Malawi Economic Growth Strategy
Volume II 18/106
3.7 CLEARLY DEFINED ROLE OF GOVERNMENT
Government plays the central role in economic development. It formulates macroeconomic policies to promote the stability that creates a conducive environment for the private sector to conduct business, to invest, and to trade. It also creates an enabling legal and regulatory framework that gives businesses sufficient incentives and confidence to invest, and corrects markets failures and unequal distribution of income. In addition, Government provides economic and social infrastructure and services that improve the environment for doing business. These infrastructure and services include roads, railways, airports, education, health services, and social services. It also includes security and incentives for trade and investment and protects the private sector from unfair foreign competition. Public spending should reflect the priorities of this Malawi Economic Growth Strategy and focus on investment rather than consumption. As pointed out earlier, Government has an important role to play in promoting economic development in any country to complement what markets do. What is crucial is that both government and markets should work in harness because this combination has given spectacular results.
3.8 FAVOURABLE CLIMATE FOR PRIVATE ENTERPRISES
The role of private sector in the economy is to invest, create value, innovate and trade domestically and internationally. Businesses need to make profits to survive, re-invest and grow. Stimulating investment, trade and profitability of businesses is, therefore, key to stimulating high economic growth. Domestic and external competition has often spurred innovation, the diffusion of technology and an efficient use of resources. Conversely, rigorous systems of industrial licensing, restrictions on entry and exit, inappropriate legal codes concerning bankruptcy and employment, inadequate property rights and price controls, all weaken the forces of competition and hold back technological change and productivity. An efficient domestic economy also requires public goods of correspondingly high quality. These include, most fundamentally, a regulatory framework to ensure competition, and legal and property rights that are both clearly defined and conscientiously protected. Domestic policy should confront entrepreneurs with information that is embodied in prices and it should then equip them (by means of investments in infrastructure and institutions) to respond. There is also need for good corporate governance within the private sector to enhance its performance.
3.9 QUALITY OF PUBLIC INSTITUTIONS
Public sector investment also plays an important role in providing the supporting infrastructure for doing business, such as roads, rail, ports, and air facilities. If Government institutions are not working properly such that there are delays in public service delivery, if the legal and regulatory system is not working properly, and if the general economic and social situation is not good, this will add unnecessary costs to the private sector. For example, poor utilities have prompted

Malawi Economic Growth Strategy
Volume II 19/106
businesses to buy generators and drill their own boreholes. Likewise, Poor roads have led to high vehicle maintenance costs. While there have been improvements in public service delivery following public sector and parastatal reforms, there is still need to improve the functioning of our public sector institutions to support economic growth. This involves the resuscitation of the Public Sector Investment Programme (PSIP), reorientation of Government Ministries and agencies towards this Strategy and strengthening public expenditure management and privatisation of public service delivery institutions.
3.10 SKILLED HUMAN RESOURCES
The economic returns for public and private investment in people are often extremely high. Markets in developing countries cannot generally be relied upon to provide people, especially the poor, with adequate education (especially primary education, health care and nutrition). In addition to increasing the quality of human investment, Governments must improve its quality.
3.11 ECONOMIC EMPOWERMENT PROGRAMME
According to the analysis in the poverty profile, 65.3 per cent of the Malawians live below the poverty line and about 30 per cent of which are extremely poor. In terms of income distribution, other sources have indicated gini-coefficient of 0.62 but the recent analysis by MEPD, using the expenditure-based techniques, established gini-coefficient of 0.45. It is against this background that government plans to pursue growth and equity objectives. The Ministry of Economic Planning and Development will develop an Economic Empowerment Programme to complement the Malawi Economic Growth Strategy.
3.12 RESOURCE CONSIDERATIONS
This Economic Growth Strategy recognises that GoM resources are limited. It, therefore, seeks to deliver higher growth rates by stimulating investment in high growth potential sectors. Generally, improved business climate would result in increased revenue base for government with which it can meet the additional expenditure requirement. Due to current fiscal gaps, Malawi requires budgetary support by development cooperating partners to finance a larger portion of the development programmes. The Economic Growth Strategy also relies on mobilising the resources within the private sector at micro-, small-, medium- and large-scale levels. The Economic Growth Strategy will seek, as a central theme, to improve the business climate in Malawi so as to unlock and attract new investment and trade.

Malawi Economic Growth Strategy
Volume II 20/106
CHAPTER FOUR: TRADE STRATEGY
4.1 OVERVIEW
Trade is a fundamental and powerful catalyst for economic growth. Although the exact correlation between trade and economic growth is not definitively understood, many countries have developed successfully with increasing trade and long-term capital inflows. The Economic Growth Strategy can only be successful if the focus is on trade and investment and when the crosscutting constraints are addressed. Malawi is a member of: o ACP/EU Cotonou o COMESA (Common Market for Eastern and Southern Africa) o SADC (Southern African Development Community) o WTO (World Trade Organisation) as well as a beneficiary of the Africa Growth Opportunities Act (AGOA) and Everything But Arms (EBA) agreement. Bilateral agreements exist with South Africa, Zimbabwe and Botswana, with further agreements currently under consideration with Zambia, Tanzania and Mozambique. These, alongside other initiatives like the Growth Triangle and spatial development initiatives, offer considerable opportunities for increasing trade and investment in the region and stimulating growth in Malawi.
4.2 MAJOR CONSTRAINTS AFFECTING GROWTH OF TRADE
According to the needs assessment undertaken in 1998, the main trade related constraints were identified as follows: o long lead times and high transport costs, attributed to landlocked status; o small domestic market; o inappropriate technology; o limited access to trade and investment finance; o inadequate trade missions2; o poor economic infrastructure including roads, rail, airports, ports, utilities and
telecommunications, which undermines domestic and international trade; o lack of a clear trade strategy and supporting policies; o high customs tariffs on manufactured imports3; and o high level of informal cross-border trade.
2 Malawi has trade attachés only in South Africa and Zimbabwe, though there are proposals for including other countries. 3 This may be solved in part through the SADC FTA in the final years of its phase in (possibly in 2008).

Malawi Economic Growth Strategy
Volume II 21/106
4.3 PROPOSED STRATEGY TO STIMULATE TRADE
The Strategy to stimulate growth in the trade includes the following six points: 4.3.1 Review and Improve Trade Policy
Ministry of Commerce and Industry (MoCI) developed an Integrated Trade and Industry Policy in 1997. However, this has not been fully implemented nor does it reflect more recent developments including this Malawi Economic Growth Strategy. This policy will, therefore, be reviewed accordingly. 4.3.2 Provision of Supportive Trade Infrastructure
The major activities will include developing transport and telecommunications to link domestic markets and access international trade infrastructure; urgently identifying resources to repair the Nacala rail link to the coast; and creating functioning export credit financing mechanisms with the commercial banks. 4.3.3 Expand Export Markets and Diversify Product Base
Export promotion will focus largely on product and market diversification. A national export development and marketing plan will be developed to complement the Malawi Economic Growth Strategy. In view of globalisation and shrinking demand in traditional markets, Malawi has to expand the range of export markets. This will involve at least these three actions:
• Malawi Export Promotion Council re-orienting its activities to ensure greater co-ordination of export promotion activities;
• Increasing trade promotion missions; and • Implementing sub-sector strategies for export products.
4.3.4 Maintain and Strengthen Preferential Non-reciprocal
Agreements
The AGOA and EBA initiatives provide Malawi with a window of opportunity to increase exports. However, the extent to which Malawi will expand its exports and capture a larger share of United States and European Union markets depends on several factors, including:
• the extent to which AGOA and EBA represent a genuine improvement on current terms of access for Malawi’s exports to those markets;
• the ability to satisfy rules of origin; • the supply capacity of Malawi’s export sector and its ability to meet increasing
demand; • availability of export financing; and • the competitiveness of Malawi’s products in terms of both price and quality.

Malawi Economic Growth Strategy
Volume II 22/106
4.3.5 Negotiate New Preferential Arrangements
Malawi is a member of COMESA and SADC and has only a peripheral role in WTO. In addition, Malawi has concluded a number of trade agreements with countries in SADC and COMESA. These agreements create significant trade opportunities. However, dual membership is a big challenge because it distorts and complicates Malawi’s trade regime. There is need to analyse the benefits of dual membership of COMESA and SADC, analyse the country’s comparative advantages; link trade agreements to the vision, MPRSP and the Growth Strategy; and to promote formal cross-border trade and investment. 4.3.6 Creation of Competitive Domestic Markets
GoM recognizes the challenges of globalisation and liberalization including anti-competitive behaviours by those businesses that exploit dominant or monopolistic positions in the domestic market. Thus Government should develop and implement a Competition Policy, a Consumer Protection Policy, and a Trade Remedies Policy – each with supporting legislation and regulation. MoCI has identified a series of activities and projects in relation to domestic trade that require review and to be made consistent with the Growth Strategy. The further development and eventual implementation of the Trade Strategy will need to involve the key stakeholders, particularly MoCI, MEPC, the Trade Policy National Working Group and the Integrated Framework National Steering Committee. This group of stakeholders will develop a detailed implementation plan focusing on immediate actions, both short- and medium-term.

Malawi Economic Growth Strategy
Volume II 23/106
CHAPTER FIVE: THE AGRICULTURE SECTOR
5.1 OVERVIEW
Agriculture is the largest sector of the economy. It contributes about 40 per cent of GDP and more than 80 per cent to total export earnings and employs over 80 per cent of total rural population. Agriculture is subdivided into the smallholder and large-scale/estate sub-sectors. The smallholder sub-sector grows mainly food crops of which maize is the staple food. The large-scale sub-sector cultivates mostly cash crops, including tobacco, tea and sugar. Tobacco is the main export crop accounting for 60 per cent of total export earnings, followed by tea and sugar that contribute nearly 10 per cent each. Agriculture also provides raw materials for the manufacturing sector, which is mainly based on agro-processing activities. The rest of this chapter will analyse the agricultural policy to develop the sector.
5.2 AGRICULTURE AND IRRIGATION STRATEGY
The Ministry of Agriculture, Irrigation and Food Security (MoAI) recently developed its sectoral strategy from which this Growth Strategy draws some key issues. The anticipated rapid growth in the other priority sub-sectors, particularly the increasing importance of the agro-processing industries, will require complementary growth in agricultural output for reliable and sufficient supply of inputs and raw materials. The overall goals of the strategy are to: 1. Forge more economic linkages in commodity value-chains, vertically and
horizontally. 2. Diversify agriculture production over time through increased production of key
crops and related agro-processing. 3. Increase smallholder productivity and resulting incomes. The growth of the agricultural sector will be driven by a more commercial approach that emphasises efficient utilization of resources through more private initiatives and greater commercialisation of smallholder agriculture through linkages. While the public sector will continue to provide some facilities, the contribution of the private sector will have to be enhanced, given limited resources available to Government. Priority will be given to the re-orientation of the smallholder sub-sector towards greater commercialisation and international competitiveness. The commercial approach to agriculture will require better integration with larger businesses, particularly those that are export oriented. There are already many examples of smallholders benefiting from such linkages with access to critical inputs and technical support directly from the private sector. Tobacco, sugar, tea and cotton all

Malawi Economic Growth Strategy
Volume II 24/106
provide good illustrations of how this integration can benefit smallholders, though the linkages are still very limited. The realisation of growth in agriculture will also depend on the availability of supporting infrastructure. The inadequacy of essential farm infrastructure, such as access roads to rural areas, power supply, drainage and irrigation, storage, and grading facilities, discourages farmers from producing marketable surpluses of crops and livestock. The MoAI strategy will support these aims and be integrated with this Strategy. In addition to individual crop strategies, irrigation is seen as a key component of the development of most crops. Given limited resources, there is a need to be realistic about irrigation’s potential in Malawi and to recognise that irrigation development is not a panacea. Irrigation will probably only be viable for high value export crops or for horticultural development close to an urban market. It is also critical that irrigation development should be driven by the private sector as businesses are best placed to determine whether the benefits from irrigation development justify the high cost of investment to be made. The broad policy objectives for irrigation development include the following: 1. Create an enabling environment for irrigated agriculture by facilitating and
encouraging the private sector to invest in irrigation through appropriate investment incentives.
2. Optimise Government investment in irrigation development by applying the principles of cost recovery and sharing with targeted beneficiary sub-sectors.
3. Enhance human capacity to facilitate effective research in irrigation technology and the marketing of irrigated produce.
4. Improve access to finance for small-scale irrigation equipment such as treadle pumps and use private sector distribution to make them available.
The MoAI plans to create a conducive environment for irrigation development where the private sector plays the leading role. MoAI’s active role would be limited to providing education, advice on irrigation development aspects, and information on the suitability of different land for irrigation development. The donor community comprising the African Development Bank (ADB), International Fund for Agricultural Development (IFAD), Food and Agriculture Organisation (FAO) and European Union (EU) have renewed their support for irrigation development and are supporting irrigation development activities in various parts of the country. The private sector has to some extent expanded investment in irrigation in response to the removal of duties on imported irrigation equipment. However, duty remains on imported spare parts and the process of importing equipment is time-consuming and the maximum demand tariff costly. Malawi made considerable progress towards deregulation and liberalization of agricultural input markets. Currently there are no restrictions on pricing and marketing of inputs and the private sector accounts for a large proportion of the input market. However, the seed and fertilizer markets are served by a limited number of enterprises and prices are high. Input suppliers are also concentrated in

Malawi Economic Growth Strategy
Volume II 25/106
the urban and peri-urban areas, thereby forcing many farmers to travel long distances to purchase inputs. This is due to limited competition, limited domestic production capacity, lack of market information, and high transport costs, all of which restrict the supply of products in the market place. Another cause is inadequate Government manpower to implement the existing regulations on seed and fertilizer. In addition, macroeconomic instability and insecurity in rural areas constrain the development of input markets. Donor-financed and Government-supported programmes such as Agricultural Productivity Investment Programme, Starter Pack Schemes, Kennedy Round II and SFFRFM can create uncertainty in the market and discourage investment in agricultural input businesses. There is a need to rationalise the overall approach to promote private sector input businesses as the main method of farmers’ accessing inputs.
5.3 PRIORITY AGRICULTURAL SUB-SECTORS AND STRATEGY
In view of the opening up of the economy to trade, there is an urgent need for agriculture to implement programmes and policies that are outward-looking and export-oriented rather than import-substituting. Agriculture will therefore need to concentrate more on the production of commodities in which Malawi has competitiveness and export growth potential. Malawi's major exports have been tobacco, sugar and tea and these are still the dominant export crops.4 Despite current problems, Malawi will continue producing and exporting them into the foreseeable future. There is, however, need for Malawi to develop the production of other export commodities that which have potential for rapid growth. These include cotton, cassava, pigeon peas, groundnuts, beans, rice, dairy products, and soya. Cotton has immediate potential impact on growth for several reasons: 1. Cotton has been a major crop and export earner, with over 65,000 tonnes of seed
cotton produced in the mid-1980s, falling to 16,000 tonnes in 2002. 2. Two private ginning companies have invested in the last three years and have
plans for further investment to revitalise cotton growing by smallholder growers through providing access to inputs and technical support.
3. AGOA has created more opportunities for exports of garments to the USA and stimulated demand for textiles and cotton lint in the region, particularly in South Africa.
4. The privatisation of DWS should stimulate demand for cotton. Cassava has been prioritised for commercial processing into ethanol and starch for industrial use. However, further work is needed to qualify and quantify the opportunities, which the Ministry is currently working on. A detailed analysis of the cassava sub-sector using the value-chain approach is recommended. Chapters 6-9 analyse the performance, constraints and strategies of sectors of tobacco, tea, sugar
4 Groundnuts and Cotton also used to be significant exports but are much smaller now.

Malawi Economic Growth Strategy
Volume II 26/106
and cotton. Chapter 11 looks at the agro-processing potential for other agricultural crops including cassava.

Malawi Economic Growth Strategy
Volume II 27/106
CHAPTER SIX: THE TOBACCO SECTOR
6.1 INTRODUCTION
Tobacco is the largest export crop in the country, accounting for about 60 per cent of total exports and about 10 per cent of GDP. Tobacco is cultivated by nearly 18.9 per cent of the smallholder households (around 375,000 farmers). The tobacco sector grew rapidly in the early 1990s but has since levelled off. Although supported by Government policies, there were also major structural changes in the industry during the same period. There has been a shift away from estate-based flue-cured tobacco to smallholder burley. The estate's contribution has declined due to reduced prices and profitability of tobacco and lack of wood for curing. Additionally, the liberalisation of burley production reduced the profitability of estate burley production due to increased incidents of theft.
6.2 PERFORMANCE
Malawi is a market leader and the largest exporter of burley tobacco in the world. It has the requisite grower base, knowledge, infrastructure, marketing system, customer base, and auction system. The tobacco industry would like to maintain this position and increase production in terms of quality and quantity. This would involve improving the farmer base and performance through extension/farmer training, improving returns/margins, increasing access to resources, motivating farmers, and ensuring health and food security. Average yields for burley tobacco production fell from 1,150 kilograms per hectare in 1990 to 973 kilograms per hectare in 2001. According to the World Bank Country Economic Memorandum, these yields are extremely low by international standards and approximately 50 per cent or less than the yield obtained in each of the major tobacco-producing countries with whom Malawi competes. This presents a major challenge for Malawi, but also indicates that significant value could be added to the industry if productivity can be improved. The decline in yields has been accompanied by a decline in mean average prices at the auction floors, which together determine the returns to farmers. For both burley and flue-cured tobacco, prices peaked in 1996, but declined steadily since then. For burley, despite some recovery in 2001, the auction prices in the past two seasons are nearly one-third lower than those that prevailed in 1996/97. The decline in prices at the auction floors followed a general decline in the world prices, exacerbated by a decline in quality of the Malawi crop. Factors identified for low yield and profitability of tobacco are: 1. Poor delivery of services to smallholders. 2. Low use of fertilisers due to inadequate credit and widespread use of low quality
own- saved seeds as opposed to buying certified seed.

Malawi Economic Growth Strategy
Volume II 28/106
3. Increased incidence of disease and pests and failure to manage. 4. Significant post-harvest losses through poor handling and storage. 5. Inefficiencies in the marketing system. 6. Low and widely fluctuating auction prices. 7. High and numerous tobacco levies deducted by Auction Holdings Limited that
discourage producers. 8. Withholding tax imposed by MRA (at 7 per cent) that discourages producers. 9. Poor performance of the satellite depots, theft of tobacco by transporters, delays
in sales of tobacco, and high transport and storage charges.
The tobacco industry has identified its strengths as follows: 1. Strong existing institutional structures and capacity comprising Tobacco Control
Commission, Tobacco Association of Malawi, Agricultural Research and Extension Trust, Auction Holdings Limited, and Tobacco Exporters Association of Malawi.
2. A strong policy framework and regulations for tobacco (production, marketing and exports, technology development and dissemination).
3. Tobacco is the major cash crop in Malawi 4. Conducive weather patterns to support full crop production. 5. The industry enjoys Government support. 6. A large farmer base of almost 400,000. 7. Relatively large pool of trained and skilled human resources for the industry. 8. Good communication, linkages and networking systems within Malawi and
between Malawi and other countries. 9. Reputation of Malawi burley tobacco as a good filler
6.3 THREATS
The existence and expansion of the tobacco industry is threatened by several extrinsic and intrinsic factors. These include: 6.3.1 Anti-smoking Lobby
The anti-smoking lobby includes litigation and lawsuits against cigarette manufacturing companies. Other secondary lobbying activities include restriction and/or abolition of advertisements related to tobacco, restriction of public smoking, increased taxation on tobacco products and increasing information on the negative aspects of tobacco consumption. Of more recent significance is the World Health Organization's Framework Convention on Tobacco Control to reduce demand for tobacco products. In the long term reduced demand will result in poor prices and eventually extinction. 6.3.2 Regional Competition
Events in the regional tobacco industry have ramifications on the future of the local industry (include the problems of Zimbabwe in the short- to medium-term and in the longer term). Many countries in Central and Eastern Africa that were not

Malawi Economic Growth Strategy
Volume II 29/106
traditional tobacco producers are rapidly increasing landholding under tobacco. Of all the countries in the region, Malawi has the smallest surface area and cannot compete simply by expanding area against Mozambique, Zambia and Tanzania. To compound the problem, almost all the regional competitors are well endowed with inherent natural resources such as wood fuel, timber and water. Though the merchants have given assurances that they will not abandon Malawi, it will make economic sense for them to develop the neighbourhood in order to achieve the desired economies of scale. 6.3.3 Cross-Border Trade
Because of continued relatively low auction prices compared to those in neighbouring countries, the problem of cross-border trade in tobacco to Mozambique and Zambia has worsened. It was estimated in 2001 marketing season that Malawi lost 2,000 tonnes of burley tobacco to Zambia and 4,000 tonnes to Mozambique. If the cross-border trade goes on unchecked, Malawi’s tobacco industry will experience reduced throughput on the auction floors, low credit discipline and loss of revenue for support institutions, such as TCC, AHL and TAMA. 6.3.4 Genetically Modified Tobacco
Since 2000 there has been an influx of genetically modified tobacco into the region. The regional industry in general and the Malawi industry in particular are not sure about the new development. This is compounded by the fact that the traditional markets of regional and Malawi tobaccos are not in favour of the genetically modified tobaccos. Until such a time it is acceptable to consumers, traditional buyers will not favour it. 6.3.5 Withdrawal of Financial Institutions
Due to poor credit discipline, which may be due to poor design and implementation of credit schemes and political interference, most financial institutions have stopped extending input and marketing loans to tobacco farmers. There are private sector examples of agricultural credit for smallholders working well in Malawi when the linkages between private firms and smallholders are strengthened for mutual benefit. 6.3.6 Child Labour
There is a potential threat from poor/misleading publicity over children working as part of the extended family system to support the growing and harvesting of tobacco. However, it should be clearly understood that by far the majority of children helped family farming operations without infringing on their rights/freedoms. There is, therefore, a need to clearly define and differentiate between child work (done to prepare children for adulthood) and child labour (which disturbs the ability of children to have a productive adulthood). The industry needs to ensure, and be seen to ensure, that the work done by children is not damaging to their futures.

Malawi Economic Growth Strategy
Volume II 30/106
6.3.7 HIV/AIDS Pandemic
The major impacts of HIV/AIDS on smallholder and estate tobacco production include a serious depletion of human resources (either through death or time spent caring for the sick or attending funerals), loss of farm and non-farm income, disturbance of credit systems, and other psycho-social impacts that reduce agricultural productivity, all of which contribute to a decline in quality. 6.3.8 Gender Issues
Both men and women are involved in tobacco production, but in most cases women are disadvantaged in access to productive resources such as land, credit, technical training and information. As a result, women have failed to benefit as much as men from formal and organised marketing systems and have tended to use other less beneficial systems.
6.4 STRATEGIES
Specific recommended interventions for the tobacco industry are as follows:
1. Implement reforms and/or strategies that reduce the cost of transport and fertiliser.
2. Provide additional support towards extension of NASFAM system and restructuring of TAMA to merge with other associations into a commercial farmer producer organisation.
3. Revamp the grower registration system and put in place an annual auditing and performance review system for the tobacco supply chain including farmer clubs, satellite depots, the auction system, and exporters.
4. Review the positioning of TCC and make it more autonomous so that it can fulfil the role of independent policy analyst for the industry.
5. Improve farmers’ income by implementing recommendations on the rationalisation of fees and levies charged on farmers’ income by Auction Holdings Limited.
6. Government should remove the withholding tax on farmers below a certain threshold (that threshold to be worked out in consultation with stakeholders) and Government should not apply tax on clubs as if they were the entity that earned the income. This may now have been resolved.
7. Review rules and regulations for direct export of tobacco by growers. 8. Review the contract farming arrangement and the auctions floors to create
a more efficient and fair system. 9. Strengthen contract farming to increase production of NDF and Flue
Cured tobaccos to meet current market demand including the additional demand created by production gaps in the region.
There are some immediate priorities to be addressed by the tobacco industry and the Government through the Ministry of Agriculture, Irrigation and Food Security (MoAI). These include:

Malawi Economic Growth Strategy
Volume II 31/106
1. MoAI should develop a clear policy and operating guidelines on contract farming in conjunction with the industry and communicate them to all stakeholders.
2. Government should review the imposition of duties and surtax on Auction Holdings Limited (AHL) to prevent a further deterioration in farmers’ prices.
3. Remove withholding tax of 7 per cent imposed on farmers’ tobacco income below the threshold of K36,000 per year. Instead, withholding tax should be charged on growers with more than K100,000 gross earnings from tobacco in any season.
4. Government needs to consult with the industry on taxation and other related issues.
5. Commercial banks should publicise the effective exchange rate for buying growers’ tobacco proceeds from the auction floors on a daily basis and the accepted conversion periods to reduce the delay in payment of farmers.
6. Government needs to amend the Tobacco Act in accordance with the recommendation made by the End of Season Tobacco Seminars.
7. Improve communication and consultation between Government and the industry on policy issues and modalities of control and implementation.
8. Government should spearhead regional meetings on issues of cross-border trade with neighbouring countries.
9. Improve auction prices by reducing monopsony amongst buyers at the auction floors and reducing illegal exportation to improve auction prices.
10. Explore alternatives to extending credit to farmers for inputs, operating costs on farm, processing the tobacco and transporting it to the auction floors.
6.5 IMPLEMENTATION
The tobacco industry is already well organised and would be able to manage implementation of issues in co-operation with Government bodies and MoAI. There is clearly a need for better dialogue between industry and Government to avoid some of the misunderstandings that have occurred. There could be considerable benefit in using the value-chain approach to bring together all the public and private sector stakeholders around a shared understanding of the industry, its constraints, and way forward. A group of industry stakeholders has developed an implementation plan for the above strategy (see Volume III).

Malawi Economic Growth Strategy
Volume II 32/106
CHAPTER SEVEN: THE TEA SECTOR
7.1 INTRODUCTION
Tea has been grown commercially in Malawi since the 1880s. Malawi is the second largest producer in Africa after Kenya, accounting for around 4 per cent of annual world exports (c.40,000 tonnes) compared to Kenya [18 per cent (c.180,000 tonnes)]. Tea has been the second highest export earner for Malawi after tobacco despite poor average export prices realised over the last three years. Tea accounts for nearly 10 per cent of total export earnings in the country and employs approximately 42,000 employees in the estate sector and almost 7,000 smallholders. In addition, about 300,000 people rely on tea for their income.
7.2 CURRENT PERFORMANCE
Malawi has suitable ecologies for tea production, including higher altitude areas around 1,000m to 2,200m that get winter rain. Tea also requires soils with a pH of 4 to 5.5 and deep soil profiles with a high water holding capacity. Tea is mainly grown by estates in Thyolo, Mulanje and Nkhata Bay. The estate sector accounts for 83.8 per cent of land under tea and 92.8 per cent of the production. Table 7.1 gives figure on total hectarage, production and export volume of tea from 1995-2002.
Table 7.1: Hectares, Production and Export of Tea, 1995-2002
Year Hectares (‘000 ha)
Production (‘000 tonnes)
Exports (‘000 tonnes)
1995 18.9 34.5 32.6 1996 18.8 37.2 36.7 1997 18.8 44.1 49.4 1998 18.8 40.4 41.0 1999 18.8 37.9 42.7 2000 18.8 42.1 38.5 2001 18.8 36.8 38.3 2002* 18.8 39.2 32.7
Source: Tea Association of Malawi and National Statistical Office * Up to 30 September 2002
As the table shows, total area and production of tea has remained static at 18,800 hectares and about 40,000 tonnes over the period. This implies that tea does not offer any growth prospects. This is despite a slow underlying improvement in yield and production levels because of: 1. Adoption of better technologies and practices over time. 2. A programme of replanting old seedling varieties with high-yielding new clonal
tea varieties at a slow pace of between 1-4 per cent per annum, supported by STABEX and including infilling by smallholders.

Malawi Economic Growth Strategy
Volume II 33/106
3. Some recent investment in irrigation that generates significant increases in yields, especially of clonal and new clonal teas.
4. An increase in smallholder tea cultivation over the last ten years and improvement of smallholder yields under the contract farming arrangement with tea estates.
Average yields for contract farming are considerably higher at 2,129 kilograms per hectare compared to 810 kilograms per hectare for smallholder growers (see Table 7.2). The higher average yields for Nkhata Bay reflect the more productive clonal varieties from the one estate that has undertaken considerable replanting.
Table 7.2: Hectarage, Production and Mean Yields by District and Type of Producer, June 2002
District Hectarage Average Yield
Production
Ha Per cent
(kg/ha) (‘000 tonnes)
Per cent
Mulanje 6,302 33.5 2,332 14.7 40.6 Thyolo 8,816 46.9 1,845 16.3 45.0 Nkhata Bay 648 3.4 4,035 2.6 7.2 Sub-total, estates 15,766 83.8 2,129 33.6 92.8 Smallholders, all districts
2,902 15.5 810 2.3 6.4
Tea Research Foundation
132 0.7 2,015 0.3 0.8
Total 18,800 100.0 1,925 36.2 100 Source: Tea Association of Malawi.
7.3 MARKETING
Tea is sold through two major ways, the Limbe Auction (nearly 40%) and direct and forward contracts between estates and buyers (over 60%). There were 28 registered tea buyers in 2002, but only five to eight of these were regularly active, representing the major international tea buying firms, such as Unilever and Lyons Tetley. These also buy directly from the estates. The Auction and direct sales both tend to attract primary and secondary tea grades, with the former having a disproportionate amount of clonal tea. Direct contract sales are based on negotiated prices and payment terms. Limbe Auction prices vary, having declined considerably in the last four years to below $1.00 per kilogram because of overproduction by large producing nations. Average prices have ranged between US$0.80-$0.85 per kilogram (Table 7.3).

Malawi Economic Growth Strategy
Volume II 34/106
Table 7.3: Average Prices for Malawi Tea Sold at the Limbe Auction and Direct and Forward contract, 1997-2001
Direct Sales Limbe Auction Total Sales
Year (‘000 mt)
Percent (‘000 mt)
Percent Average Price (c/kg)
(‘000 mt)
1997 26.9 61.0 17.2 39.0 124.1 124.1 1998 23.0 56.9 17.4 43.1 119.3 119.3 1999 24.3 64.5 13.4 35.5 93.7 93.7 2000 28.4 67.5 13.7 32.5 102.0 102.0 2001 24.0 65.2 12.8 34.8 87.3 87.3
Source: National Statistical Office and Tea Brokers Central Africa Ltd.
In recent years, a few estates have sold tea at the Mombassa Auction in Kenya. The Mombassa Auction is one of the largest in the world attracting teas from Uganda, Burundi, Rwanda, Tanzania and Zambia, in addition to the bulk of Kenyan tea. Due to the volume and greater diversity of teas on offer, Mombassa attracts more buyers than Limbe Auction and has the advantage that tea can be shipped immediately from the port once bought. According to TAM, a total of 2,726 tonnes of tea was ‘exported’ to Kenya in 2001, representing 7.1 per cent of all tea exports, most of which was likely destined for the Mombassa Auction. It is difficult to establish whether producers can achieve better rates at Mombassa than Limbe Auction Floor as much depends on the availability of comparable teas for auction on a particular day, and quality. But anecdotal sources suggest price premiums ranging between US5-20 cents per kilogram. However, a big disadvantage is that producers have to wait much longer for payment, up to eight weeks, if the tea has to be repacked. Transport costs too have to be paid up front and these can be higher than any price premium gained, increasing cashflow pressure. Selling through Mombassa auction is also more risky, as the decision has to be made several weeks in advance. If timing is bad, prices can be lower and foreign teas can get discounted quickly in Mombassa.
7.4 INVESTMENT IN REPLANTING, FACTORIES AND IRRIGATION
The price premium for clonal teas over seedling teas is considerable, running at 23-26 per cent since July 2001.5 The Limbe Auction prices indicate persistently high relative prices of seedling grades over clonal grades, which account for 51.5 per cent of auction sales compared to 19.9 per cent for clonal.6 In view of this, there is a consensus in the tea industry to rapidly shift to new clonal varieties, which are of even higher quality and more productive than the bulk of the clonal teas being grown now. Although prices will continue to depend on market
5 According to Tea Brokers Central Africa Ltd. 6 Other grades would represent a mix of seedling and clonal in rough proportion to the main grades.

Malawi Economic Growth Strategy
Volume II 35/106
forces, shifting to a greater proportion of clonal teas will increase the average auction prices of tea and generate gross revenue and foreign exchange.
Table 7.4: Volumes and Prices of Clonal and Seedling Grades, 2002
Volume Average Price
Grade Tonnes
Per cent
US cents/kg
Clonal main grades 3,427 19.9 123 Seedling main grades 8,883 51.5 98 Other grades 4,932 28.6 57 Average for all grades 17,241 100.0 91
Source: Tea Brokers Central Africa Ltd.
The replanting of tea with clonal material has been supported over the last few years by the European Union STABEX programme. The EU base their assistance for replanting under the STABEX programme on a replanting cost of $2,500/hectare, which was calculated at the outset of the programme and does not appear to have been linked to inflation or exchange rates. One estate indicated that direct replanting costs were nearer $2,900 to $3,000/hectare in 2002. In addition, there is the lost output of green leaf from taking land out of production for replanting and then the lower yields achieved in the early years. For irrigated land, which is where most estates would intend to plant new clonal material, it is estimated to take six to seven years before the green leaf output is back to the original levels. 7 This is eventually offset by the better prices obtained for new clonal teas, which enables the value of production to reach the original level within five years. After ten years the value of the output is approximately double the original level for seedling teas, providing significant added value. However, more immediate benefits for the industry would be gained through investment in irrigation. The big advantage of irrigation is the speed with which it can improve yields, particularly where there is clonal tea already planted. The infrastructure can be installed quickly and the yields show almost immediately. There are secondary benefits, in that the irrigation can improve production in the trough months (June to November) when rain is absent, therefore, utilising existing factory capacity more fully, without requiring more investment. If water is available, the investment in irrigation is in the order of $1,500 per hectare on sites where the total manometric head for the scheme is less then 75 meters. Above this, current ESCOM charges render irrigation not viable. If there is a need to build a small dam, the costs increase depending on the particular area. However, the industry believes in the viability of this type of investment if it could borrow at more realistic rates. The cost of electricity is a constraining factor to further investment in irrigation, particularly the maximum demand tariff, despite recent changes. The economics of irrigation could be improved if the maximum demand tariff was abolished and a more equitable charging system introduced.
7 It is worth noting that estates are replanting the high-yielding seedling to get greater overall yield. Unfortunately, this increases the cost of production and loss of revenue in the medium-term.

Malawi Economic Growth Strategy
Volume II 36/106
In relation to factory investment, one severe restriction of operation is that a ‘peak’ day in Malawi can be as high as 1.4 per cent of annual production, whereas a peak day in Kenya is a maximum of 0.6 per cent of annual production. This means a factory to handle one million kilograms of leaf per annum in Kenya would be half the size of a similar capacity factory in Malawi. It is not viable to design factories to cope with the peak, which lasts for about 14 days per annum. As a result most estates do not have sufficient processing capacity to handle all of the peak production. This results in leaf being wasted or, where possible, sent to other factories for processing at reduced profit to the particular grower. The factory costs may account for between 15-25 per cent of total production costs including energy. Much of the machinery in tea factories is relatively old8 and the productivity and output potential is limited. A number of the estates and STA/MATECO have prepared proposals for refurbishment with new, more efficient plant that also improves the quality of the tea produced and prices. The indicative returns for investing in new machinery are at least 10 per cent price premium through enhanced quality as well as reduced operating costs. It is difficult to give accurate returns on investment as these are commercially confidential and estate specific, but an indicative payback based on discounted cash flow rates suggests a return on factory investment within five years. Further work would be required to determine the actual viability of specific investments, but the current problem is access to cheap capital at low interest rates. Based on anecdotal sources, production costs including overheads but excluding investment costs are currently in the range of $0.75-0.90 per kilogram, suggesting that businesses in the industry are barely profitable at current average prices. This, combined with high interest rates and the premium charged for foreign currency loans (risk premium for Malawi), there are few estates that can borrow for investment purposes and reinvestment in factories, irrigation, tea replanting and social infrastructure for the workforce and surrounding communities. There is need to provide funds for on-lending to the private sector at reasonable interest rates. One of the sources for these funds is the European Investment Bank which has a fund for such proposals. Currently, all arrangements have been completed to make the fund operational.
7.5 SMALLHOLDER TEA GROWERS
The merger of the Smallholder Tea Authority (STA) and the Malawi Tea Company (MATECO), into the Smallholder Tea Company (STC) is the most critical current event affecting the health of smallholder tea. There have been persistent problems with STA and MATECO over the recent past with considerable accumulation of payment arrears and delays to smallholders, reportedly up to eight months. According to the STC, the payments were currently running at three months overdue in 2002 and are now down to one month. However, the history of late payment has
8 Very little is stainless steel,which will increasingly become an issue complying with Developed Country standards.
Malawi Economic Growth Strategy
Volume II 37/106
been a major factor in deterring smallholders from managing and picking their existing tea, infilling with new clonal varieties, or increasing their hectarage under tea. The poor performance of STA/MATECO has also deterred new entrants with suitable land from planting tea. According to the industry there are many potential smallholders around the estates with land that is more suitable to tea than it is to the current main crop of maize.9 There would need to be a bridging period if farmers were persuaded to grow tea, given the relatively long gestation period from planting to reasonable yields, but this has the potential to increase rural incomes considerably as well as providing regular income, which is often more important to smallholders. These new producers could easily be integrated into the current production system and may in time provide the justification for a new smallholder factory. For the existing growers, a diversity of arrangements for smallholder green leaf sales has emerged over the last three to four seasons. Because of the limited processing capacity at the former STA/MATECO and limited availability of transport to collect the leaf, smallholders around three estates initially were allowed to supply leaf to be processed in the estate factories, thereby also taking advantage of spare non-peak capacity. Estates collected the green leaf and the smallholders received fertiliser loans and technical support direct from the estates. The estates paid the STA monthly for the leaf and the STA were also meant to pay the smallholders monthly, though in practice there were still long delays in payments. Since April 2002, all the smallholder tea in Thyolo has been sold to the local estates under this arrangement10 with payment via STA. In Mulanje, several ‘blocks’ of smallholders are now supplying one of the major estates directly and being paid directly at the insistence of the smallholder farmers.
7.6 SMALLHOLDER GROWING COSTS
Smallholders currently get 60 tambala per kilogram of collected plucked green leaf,11 which is the standard price set by STC for all grades. Most of the smallholder tea is polyclonal material, an improved seedling variety and better quality than most of the estate tea. It therefore brings up the average quality of tea being processed and so is valued by the estates. There is currently no premium being paid for smallholder clonal tea mainly due to the logistical problems associated with separating this leaf in the field and at weighing points, even though MATECO and the estates would be able to gain a selling premium if this were possible. The average smallholder has 0.4 hectares of tea, typically alongside 1-1.5 hectares of maize and other subsistence crops. This might yield 1,600 to 2,200 kilos of green leaf, equivalent to revenue around US $150/year minus the costs of fertiliser, giving
9 Areas of high rainfall of 650 mm up to 3,000 mm p.a. are more suited to tea than maize. 10 The MATECO factory is in Mulanje and the distances from Thyolo to the factory are up to 90 kms making it less economic to collect the green leaf. 11 In 2002.

Malawi Economic Growth Strategy
Volume II 38/106
a net $100 annual income.12 One big advantage of growing tea for smallholders is that it yields cash income for most months of the year, rather than the one harvest for other crops like cotton. The disadvantage is that it takes around five years to reach maturity and peak production, but thereafter the bush can continue yielding a crop for several decades if managed appropriately. STC is looking for an investment of $1-2 million to upgrade its Mulanje factory, which is still using the original equipment installed in 1974. It is also looking to establish a factory in Thyolo using the old equipment from Mulanje, at around $1-1.5 million. The difficulty with the STC situation is the history of political interference in the organisation, particularly in the appointment of management. Industry commentators indicate that the following (planned) changes are steps in the right direction: 1. The merger of the two organisations, which was realised in 2002. 2. The establishment of a trust that owns the joint entity, also realised in 2002. 3. Reducing operating costs significantly through retrenchment, which has begun. 4. Refinancing the organisation and improving financial performance through
better management. 5. Privatising through a sale to smallholders and other interested stakeholders.
7.7 CONSTRAINTS
Based on the above analysis and in-depth consultations with all the main stakeholders in the private and public sector, the major constraints for the tea sub-sector are as follows: 1. Prolonged weakness in world prices impacting on estate and smallholder
profitability and reinvestment. 2. The relatively high proportion of seedling tea on the estates, with lower yield and
quality than clonal tea, impacts on productivity and current and future profitability.
3. Inadequate future funding for the replanting programme for new clonal varieties due to removal of STABEX scheme.
4. Tea production is highly seasonal and overly dependent on rainfall patterns. 5. High interest rates have reduced investment and short-term cashflow; foreign
borrowing is risky. 6. High cost of electricity, caused by the maximum demand tariff system, increases
the cost of production and deters irrigation farming. 7. High levels of taxation and poor administration of the tax system raise the costs
of production and lead to low profitability and investment/re-investment. There are delays in the administration process of the tax system and also a lot of discretion of tax incentives, which are not transparent. This creates a cashflow burden on the industry due to the lengthy reclaim procedure and exchange losses.
12 Based on 1,000 kilos of made tea per hectare. With fertiliser and technical assistance from the estates, reported yields are much higher.

Malawi Economic Growth Strategy
Volume II 39/106
8. The tax system does not provide for incentives or allowances for investment and expenditure on social welfare programmes and infrastructure like housing, water, education and health for estate workers incurred by the estates.
9. Unstable exchange rates make planning difficult by causing unstable cost of raw materials and substantial exchange losses.
10. Limited demand and competition for Malawi’s tea at the Limbe Auction 11. The new land policy is not conducive to tea industry. The new land policy
proposes a leasehold period of 50 years compared to 99 years in many countries and does not clarify several issues, such as the setting of rent, arrangements for renewal of leasehold period, and procedure for renewal of leasehold title for businesses that have freehold title to land but cannot qualify for Malawian citizenship.
12. Low smallholder productivity and under-utilisation of smallholder land due to poor payments and delays of farmers’ income that have discouraged many smallholders from investing in and managing their tea plots. This is due to ineffective extension services and inadequate access to inputs caused by limited credit.
13. Inadequate funding of STC by Government to invest, provide inputs and technical support and buy more smallholder tea.
14. Lack of partnership between Government and the industry to address issues that impact on the industry’s performance, such as the lands issue, encroachment, and taxation. (Eastern Produce,13 for example, has lost around 400 hectares of land due to encroachment.)
15. Uncertainty over the institutional arrangements for the tea industry, even in face of the draft Tea Bill. The major concern for investors is how independent and private sector-led the proposed new Tea Board will be, given the track record of political appointments in the past. There also appears to be a reversal of the decision not to include all the detailed regulation for the industry in the Act. Government’s particular concern is to ensure that smallholders have an effective voice and that their interests are promoted.
16. Ethical trade initiatives in developed country markets will increase compliance costs and may threaten established trading relationships. Estates need to respond by demonstrating compliance in all aspects, but resources for investment to meet the standards are not available at present.
17. The HIV/AIDS pandemic is a creating huge cost on the industry in terms of skills gaps and reduction in output.
7.8 STRATEGIES AND ACTIONS
Recent years have been very difficult for the tea industry and have contributed to its relatively slow growth in underlying productivity, output and earnings. Profitability has been severely hit by the low world prices experienced over the last four years and this has constrained investment. The relatively high costs of operating in Malawi have also impacted on profitability at a time when all the stakeholders recognise the need to invest in replanting, irrigation and factory refurbishment. If significant investment can be made in these three areas, then there is potential to realise much
13 The largest group operating estates in Malawi.

Malawi Economic Growth Strategy
Volume II 40/106
higher growth rates for the tea industry in the short, medium and long term. This can be encouraged by Government with highly focused investment incentives and other measures to strengthen the industry, but in return it requires the commitment of the key private sector players in the industry to make the investments. There are other important measures that can be taken to reduce industry costs, encourage investment and review the negative effects of certain taxes on the industry. The industry also needs to look at strengthening the demand for Malawian teas. A key focus has to be to revitalise and grow the smallholder sector from its low base. This has the potential to deliver sustainable increases in rural incomes, improve the utilisation of factories, improve the overall quality of tea and increase the overall output and export earnings in a way that is pro—poor. Overall a more collaborative partnership is required involving the key stakeholders from public and private sectors. The detailed strategies are as follows: Strategy 1: Increase investment in factory refurbishment, replanting and
irrigation by:
1. Developing a proposal for a STABEX successor scheme with support from the key stakeholders potential donors.
2. Government should ensure that the tax relief for this type of investment is sufficient to stimulate re-investment (see appendix 1 for specific proposed incentives).
3. Ensuring that there is access to the EIB and other such funds in Malawi. Strategy 2: Improve access to credit at realistic rates for investment by reducing
interest rates by implementing macroeconomic measures and stakeholders need to work together to make the EIB tea facility available to the industry in the near future.
Strategy 3: Review and rationalise the maximum demand tariff system for electricity to reduce electricity costs to the industry.
Strategy 4: Rationalise the tax system and its administration to make more focused towards promoting economic growth, efficiency and equity by:
1. Including tax allowances for investment in factory refurbishment, replanting and irrigation and social expenditure and infrastructure.
2. Reviewing surtax, particularly the speed of rebates on input tax with consideration for a block exemption for the tea industry or parts of it

Malawi Economic Growth Strategy
Volume II 41/106
Strategy 5: Stabilize the exchange rate by implementing macroeconomic measures and review the 40 per cent foreign exchange retention rule.
Strategy 6: Revitalise the market for Malawian tea by reviewing the performance of Limbe Auction and the reasons why sellers are moving tea to Mombassa; then formulate ways to improve prices.
Strategy 7: Regarding the new Land Policy, Government should restore the 99 years leasehold period, set leasehold rents at realistic rates, and clarify the mechanism and timing for renewals of leasehold title.
Strategy 8: Improve smallholder productivity and institutional arrangements through:
1. Increasing funding for STC to enable it to provide extension, inputs and marketing services to smallholder farmers.
2. Exploring other models of smallholder development, such as, that used for the revitalised smallholder coffee growers.
3. Development and building of the linkages between estates and smallholders to provide access to inputs and technical support as well as a secure outlet for leaf. These activities need to work alongside a revitalised STC in ways that encourage cooperation and mutual support.
Strategy 9: Strengthen partnership and institutional arrangements for the tea
industry through the following measures:
1. The proposed Tea Board needs to be private sector-driven to become an effective voice for all parts of the industry, including estate and smallholder producers and those involved in buying and selling.
2. Government, particularly through MoAI, needs to be fully engaged in the Tea Board as a key stakeholder as this will also ensure that the industry voice is heard within Government on issues like land encroachment.
3. Government must take a firmer line on land encroachment. 4. The new institutional arrangements should become the forum for a more
constructive and responsive dialogue between all the stakeholders in the industry, to the benefit of all stakeholders in the sector.
5. The new Tea Bill should be progressed as soon as consultations with all stakeholders have been satisfactorily completed – the Tea Board should take the responsibility for setting regulations rather than define these by statute to allow them to evolve and respond to the changing environment.

Malawi Economic Growth Strategy
Volume II 42/106
Strategy 10: Seek external support in the form of technical expertise and grants to enable the industry to conform to ethical standards.
Strategy 11: On the HIV/AIDS pandemic, the industry needs work together with existing initiatives and organisations, such as, the Malawi Business Coalition Against HIV/AIDS and National AIDS Commission to intensify education of staff to prevent the spread of the pandemic and respond effectively to other issues raised by the pandemic.
7.9 IMPLEMENTATION PROCESS
The development of a more detailed action plan and implementation framework is required. This will be achieved through the key stakeholders from Government and the private sector working together to define a plan. This can build on the work already undertaken through the value-chains to bring the stakeholders together once the overall strategy and key action areas above are agreed. The tea industry is already relatively well organised and this provides potential for coordination. This tea sector section has been extensively circulated to and commented on by the main stakeholders and would form the basis of a broad consensus on how to take the industry forward. Once the Malawi Economic Growth Strategy is agreed, it can be implemented by the stakeholders.

Malawi Economic Growth Strategy
Volume II 43/106
CHAPTER EIGHT: THE SUGAR SECTOR
8.1 INTRODUCTION
Sugar is an important crop in the country. It accounts for nearly 10 per cent of total export earnings and employs about 11,100 permanent employees and 5,700 casual employees. About 90 per cent of sugar cane is grown by estates at Nchalo in Chikwawa district and Dwangwa in Nkhotakota. Sugar cane is processed into sugar by Illovo Sugar Company at its two mills at the two production sites. Since buying Lonhro’s stake in SUCOMA in 1998, Illovo has made considerable new investment in the estates and factories of around $70 million. SUCOMA contributed over K600 million in tax revenues to Government in 2002. Production of sugar reached a record output of 260,440 tonnes in 2002 from 213,000 tonnes in 2000/01. This represents an approximate value of K6.8 billion in annual sales of which approximately 50 per cent is exported under special or ‘preferential’ trading agreements and through competing in regional markets at world market prices. Table 8.1 shows sales of raw and processed sugar from 2000-02 by type of market. Table 8.1: Sales Volumes of Processed Sugar, 2000-2002 (‘000 tonnes)
2000 2001 2002 Domestic market 126 98 95 Preferential (EU, USA) 50 56 24 Regional (Kenya, other) 37 62 39 Total 213 216 158
Source: SUCOMA
Growing and processing sugar cane requires considerable amounts of capital, whilst marketing into international markets requires considerable knowledge, expertise, and commercial power to get the best returns. The value of SUCOMA’s investment is estimated at around $140 million in at the end of 2002. However, further investment that was earmarked for Malawi to double the processing capacity went to Zambia, due to instability of the Kwacha, a sharp rise in local interest rates, and declining growth in the domestic economy. Virtually all countries aggressively protect their domestic markets through tariff and non-tariff barriers, although some offer relaxation through preferential quota agreements for market access, particularly for ACP and Least Developed Countries, particularly into Europe and the USA. These are complex arrangements and getting the right agreements is crucial to the long-term health of the industry. For Malawi to compete successfully as an international player in the sugar market, it needs to ensure that its sugar industry is profitable and able to reinvest in growing and processing sugar. Malawi continues to be a relatively low cost producer of sugar, ranked 6th in the world. However, the structure and subsidies for the sugar industry across the world

Malawi Economic Growth Strategy
Volume II 44/106
mean that even Malawi could not survive if it had to supply all its markets at world market prices. Therefore, the health of the domestic market is critical to the success of SUCOMA, as this makes a considerable contribution to its overall survival and profitability.
8.2 FUTURE PROSPECTS
Without any further changes in existing EU farm policy, total sugar production is forecast to increase by 11 per cent by 2007. Given correct economic fundamentals, considerable scope exists to expand the Malawian sugar industry. Re-organisation of the EU and its controversial Common Agricultural Policy, which subsidies European farmers is likely to result in increased quotas for the least developed countries, including Malawi although prices overall are expected to decline. Additional sugar cane to take advantage of these opportunities will primarily come from smallholders, creating employment and sustainable poverty alleviation in rural areas. Major milling capacity expansions will be required to process the cane. The economy in general will be stimulated by significant levels of capital re-investment if the climate for investment and the appropriate incentives are available. One of the by-products of sugar processing is molasses, which is being utilised to produce ethanol. This in turn is used in various applications including an additive for petrol and now ethanol gel stoves (as a replacement for charcoal burning). The additional molasses produced will provide a further opportunity for expansion of the ETHCO and PressCane distilleries. The Illovo Sugar Group is a major producer of value-added downstream chemical and food products that contribute approximately 15 per cent of total Group operating profits. Diversification of production activity has also been identified as an opportunity for SUCOMA, because the penetration of European markets by Malawi’s “special” direct consumption sugars (e.g. Demerara, Golden Granulated, etc.) has led to the possibility of developing a specialized packaging operation for finished product ready for direct sale in Europe. A new facility would need to be constructed for this venture, which would enable Malawi to add value and differentiate its export sugars from the main competitors.
8.3 GLOBAL COMPETITIVENESS
For Malawi to improve its competitiveness, control of cost of production is a fundamental issue. Without low cost products, new export markets cannot be accessed and existing markets come under pressure. The balancing effect of higher revenues and higher input costs does not hold true if markets are lost or cannot be penetrated because of high initial production cost. Certainly, domestic markets cannot sustain the price increases necessary to keep pace with devaluation, leading to declining local volumes and eventual closure of supplying businesses. Unfortunately present strategies seem to place more emphasis on maximising revenues through currency depreciation than maintaining competitiveness through lower input costs. This strategy should be carefully reviewed in light of recent business closures, particularly manufacturing operations within the country. Market

Malawi Economic Growth Strategy
Volume II 45/106
reforms in the EU and USA will require that Malawi’s products be competitive in terms of cost in order to maximise the opportunities that undoubtedly will develop for LDCs.
8.4 CONSTRAINTS
The main constraints on the sugar industry and potential opportunities are as follows: 1. Access to preferential markets is still limited, though there are important
changes underway that will liberalise access, but probably push prices down. 2. The Nchalo and Dwangwa factories are reaching the point where they would
require considerable investment to increase capacity further. 3. Instability in the exchange rate and high interest rates which severely restricts
investment and offshore borrowing. 4. Unsustainable debt burden for the Kasinthula smallholder scheme. 5. Recent cheap imports of Zimbabwean sugar at below market prices, which are
eroding market share and threatening viability of domestic industry. This threat has receded with Government help, but is still ongoing at lower levels and may return.
6. Surtax and duty rebate scams that undermine the legitimate traders of sugar. Such cases must be vigorously pursued and corrupt practices eliminated, otherwise they threaten the viability of the industry.
7. Unnecessary delays in importing spare parts for irrigation and processing equipment lead to penalty interest payments to South African suppliers and increase stockholding. It is estimated that this cost SUCOMA K40-60 million in avoidable costs in 2002.
8. The 40 per cent retention rule of foreign exchange earnings. 9. Theft of irrigation pipes at Nchalo, which resulted in considerable crop losses
and extra security costs. 10. Electricity, in the forms of intermittent supply and high cost, because of the
maximum demand tariff system and unnecessary back-up costs for generation capacity and generating licences.
11. High cost of distributing sugar to ports for shipping and throughout Malawi. 12. Limited domestic demand for sugar erodes margins as the market cannot sustain
the price increases necessary to compensate for depreciation-linked cost increases of imported materials.
8.5 STRATEGIES
The main strategies that would resolve the above problems include: Strategy 1: Closer liaison between MoCI and SUCOMA in the negotiation of trade
agreements and protocols that directly or indirectly affect sugar. Strategy 2: Regarding interest rates and instability of exchange rate, see
macroeconomic policies on cross-cutting constraints on economic growth (Chapter 3).

Malawi Economic Growth Strategy
Volume II 46/106
Strategy 3: Explore alternative ways to resolve the unsustainable debt problem of Kasinthula smallholder scheme.
Strategy 4: Government should take appropriate measures to protect the domestic market against unfair competition arising from exploiting of currency variations.
Strategy 5: Streamlining the process for importation, especially relating to Exchange Control Approval and improving the performance of those dealing with pre-shipment inspection. The Reserve Bank of Malawi has already taken measures to address this problem. Improve service provision by pre-shipment inspection agency and MRA agents to achieve rapid turnaround at border posts.
Strategy 6: Increase foreign exchange earnings retention rate to over 80 per cent and allow the industry to buy imports directly from their foreign exchange denominated accounts rather than using banks.
Strategy 7: Government should improve security through cooperation between the police and communities and by strengthening the legal system.
Strategy 8: Review and rationalise the maximum demand tariff pricing system to reduce electricity costs and remove in-house generation penalty tariffs. In addition, improve the stability of electricity supply through the interconnection to Cabora Bassa in Mozambique.
Strategy 9: Intensify a more efficient irrigation system at Nchalo.
Strategy 10: Government, with assistance from donors, should improve the Nacala Corridor through the rehabilitation of the 77 kilometres of the rail line to facilitate more cost effective bulk transport.
Strategy 11: Government should improve the road maintenance and rehabilitation in the country.
8.6 IMPLEMENTATION
The sugar sector is relatively straightforward to plan and to organise implementation, given the central role of SUCOMA. The value-chain work has already assisted in getting more cooperation between the stakeholders and has led to considerable action. As a result, it would be possible to get the stakeholders to develop a more detailed action plan from this strategy, with key input from MoAI.

Malawi Economic Growth Strategy
Volume II 47/106
CHAPTER NINE: THE COTTON SECTOR
9.1 INTRODUCTION
Cotton has traditionally been an important cash crop in Malawi. It is mainly grown in low lying areas in Balaka, Salima and the Lower Shire Valley. The crop is grown on approximately 30,000 hectares and supports up to 80,000 - 90,000 farm families, especially smallholders. There were attempts by large commercial farms to cultivate cotton but most of them have stopped growing because of low profitability in the face of poor international prices over the past five years. Similarly, smallholders have also tended to substitute other cash crops for cotton over the last 15 years. According to Cotton Growers Association (CGA), many small farmers grow cotton out of tradition and lack of an alternative cash crop. Cotton ranks as the fourth foreign exchange earner for the country, amounting to K420 million in 2000 (or 1.8 per cent of total exports). But exports declined because of decreasing production and low cotton prices since 2000.
9.2 COTTON PRODUCTION IN MALAWI
Different sources give different figures with respect to area under cultivation, yield and production. The most reliable source is data from the two ginners, given that little cotton is being exported in its raw state. The most reliable estimate gives 2001/2 raw cotton production at 16,000 tonnes against 70,000 metric tonnes in 1986, which is 20 per cent of peak production. This is based on adding the amount of seed cotton processed by the two ginners. Table 9.1: Volume of Purchases of Seed Cotton and Amount of Lint and
Cotton Seed (Tonnes) 1997/98 1998/99 1999/00 2000/01 2001/02 Seed cotton 28,455 18,470 13,818 24,633 15,999 Cotton lint* 9,390 6,095 4,559 8,129 5,280 Cotton seed 18,780 12,375 9,258 16,504 10,719
Source: GLC and ADMARC Note: Seed cotton is the ‘cotton’ that is not ginned; cottonseed is the seed for planting/crushing.
* Cotton lint estimated production at 33 per cent of raw cotton purchases
This decline in the number of cotton growers and, therefore production, is due to a combination of factors, including the following: 1. Low world market prices and low prices paid by ginners, reducing returns to the
farmer. 2. High input requirements for cotton growing, including herbicides, pesticides and
spraying equipment. 3. High labour input required for weeding, spraying and picking – can require
hiring labour. 4. Low productivity and resulting low returns when combined with low prices.
Malawi Economic Growth Strategy
Volume II 48/106
5. Delayed payment of farmers by some traders and in recent seasons by ADMARC. 6. Pest problems that have limited yield and profitability. This is compounded by
poor organisation of farmers, making it difficult to receive technical assistance and inputs.
7. Poor credit discipline, which resulted in withdrawal of credit facilities. 8. Reduction in the number of buying points close to farmers and the increased role
of traders who have generally taken advantage of smallholder farmers. 9. Problems with quality and availability of seed. Malawi used to have the reputation for producing a well-graded middle-level quality of seed cotton. However, there has been a recent problem with polypropylene contamination due to the way the cotton is being picked - it is put into old polypropylene bags, which fray and leave strips of polypropylene in the cotton.14 The crop has also become one of mixed varieties of cotton. In Malawi, the ginning-outturn, which is the percentage of lint that is extracted from the seed cotton, is relatively low, reported between 33 and 35 per cent in comparison of 40 per cent in the neighbouring countries, If the ginning outturn could rise to 40 per cent, this would represent an additional 20-25 per cent more lint. There are seed varieties that are being tested in Malawi for approval that could deliver such an increase. This would increase the returns for ginners and allow higher prices to be paid to the farmers. Malawi’s cotton growing season lasts from December until May, whilst ginning commences around June through till all the crop is processed, currently August/September. It is essential that cotton crop is free from weeds during the first eight weeks of growth. This requires good management practices. Unfortunately, the demand for labour to weed cotton often coincides with the need to weed food crops. As many families favour the latter, they delay the weeding of cotton and this has detrimental effects on production. Herbicides can be used as an alternative for weeding before, during and shortly after planting. Although the product is available, the take off of this alternative has been slow due to cashflow problems and poor extension. Poor pest control is considered as one of the main reasons for low cotton yields in Malawi. The problem is often twofold: the growers do not have the cash flow to buy chemicals to prevent/treat pests and they have limited access to spraying equipment to apply the chemicals. Moreover, the smallholder is often not familiar with pest control and only a few of the MoAI extension staff can advise them. Yet the application of the right chemicals at the right time saves money for the growers and results in higher quality and production of cotton. The availability of loans is uneven, and previous poor repayment to Government and non-Government Micro-Finance Institutions (MFIs) have resulted in further restrictions of credit. Limited access to credit further reduces access to inputs, which therefore affects yields, quality, and ultimately the profitability of the crop. As
14 This creates problem when the contaminants get into the cloth and will not take up dye, leaving white streaks in the cloth.

Malawi Economic Growth Strategy
Volume II 49/106
mentioned above, cotton growing is very complicated. Therefore, extension work is of paramount importance. Growers need to be advised about husbandry, herbicides, pesticides, etc. by experienced extension workers. At the moment, the Government extension service is not functioning well and many cotton farmers are not visited at all. There are some NGOs providing technical support and the two ginning companies also provide support through their staff and demonstration plots, but coverage is limited. Both ginning companies and farmer groups are trying to tackle the difficulties of farmers regarding cash flow problems and extension work. For example, Balaka Smallholder Farmers’ Association (BASFA) 15 has started yield improvement programmes and has conducted trainings with respect to issues such as quality control, price mechanisms and scale reading. The two ginning companies support the farmers by providing technical support and credit facilities. However, there is clearly a limit to how much commercial companies can assist the growers and this is undermined if the company that provided the inputs cannot be sure that they can buy the seed cotton grown with those inputs. If someone else buys the cotton then they get the benefit of the ginner having subsidised the cost of the seed and having provided free technical support and pesticides on credit. The party that is ‘free-riding’ may be able to offer a small amount more on the price because they have not incurred the costs. If there is to be an expansion of the services provided to the farmers by the private sector then there needs to be mechanisms by which the companies that provide inputs can be assured of recovering their outlays and not benefiting competitors. This implies some restriction on the freedom to sell, probably through contracts with the farmers, but also responsible action by all those who buy. The shrinking of the domestic textile industries since the late 1990s has resulted in further reduced domestic demand for cotton lint. The vast majority of cotton lint is exported to South Africa. The revitalisation of David Whitehead and Sons (DWS) could reopen the opportunity for more domestic sales of cotton lint for spinning, but this is uncertain and unlikely to take a large proportion of the future available crop in the medium-term.
9.3 PRE-TREATED SEEDS
A few years ago, pre-treated seeds, coated with insecticides before planting, were introduced in Malawi. As a result of the coating the cotton plant is more resistant to pests in the first 12 weeks resulting in lower losses. Spraying frequency can be reduced from 8 to 4 times and the quantity of seed planted per hectare can be reduced from 25 to 20 kg. As the insecticides used for the treatment are very expensive, the pre-treated seed costs more then untreated seed. Therefore the adoption within Malawi is very low, as farmers do not have the money to invest in better quality seeds. The chemical companies and ginneries are trying to persuade cotton growers to use pre-treated seed by trials and demonstration plots. Currently, the comparative costs of cotton production per hectare is depicted in Table 9.2.
15 Affiliated to and supported by NASFAM
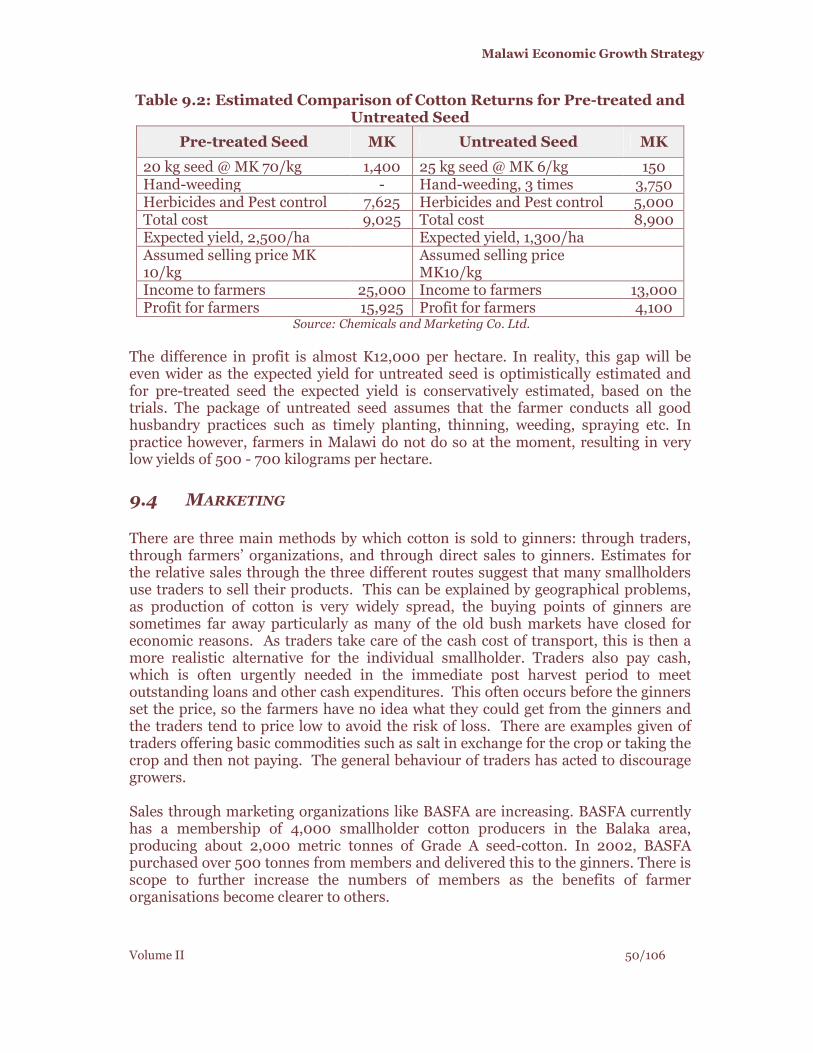
Malawi Economic Growth Strategy
Volume II 50/106
Table 9.2: Estimated Comparison of Cotton Returns for Pre-treated and Untreated Seed
Pre-treated Seed MK Untreated Seed MK
20 kg seed @ MK 70/kg 1,400 25 kg seed @ MK 6/kg 150 Hand-weeding - Hand-weeding, 3 times 3,750 Herbicides and Pest control 7,625 Herbicides and Pest control 5,000 Total cost 9,025 Total cost 8,900 Expected yield, 2,500/ha Expected yield, 1,300/ha Assumed selling price MK 10/kg
Assumed selling price MK10/kg
Income to farmers 25,000 Income to farmers 13,000 Profit for farmers 15,925 Profit for farmers 4,100
Source: Chemicals and Marketing Co. Ltd.
The difference in profit is almost K12,000 per hectare. In reality, this gap will be even wider as the expected yield for untreated seed is optimistically estimated and for pre-treated seed the expected yield is conservatively estimated, based on the trials. The package of untreated seed assumes that the farmer conducts all good husbandry practices such as timely planting, thinning, weeding, spraying etc. In practice however, farmers in Malawi do not do so at the moment, resulting in very low yields of 500 - 700 kilograms per hectare.
9.4 MARKETING
There are three main methods by which cotton is sold to ginners: through traders, through farmers’ organizations, and through direct sales to ginners. Estimates for the relative sales through the three different routes suggest that many smallholders use traders to sell their products. This can be explained by geographical problems, as production of cotton is very widely spread, the buying points of ginners are sometimes far away particularly as many of the old bush markets have closed for economic reasons. As traders take care of the cash cost of transport, this is then a more realistic alternative for the individual smallholder. Traders also pay cash, which is often urgently needed in the immediate post harvest period to meet outstanding loans and other cash expenditures. This often occurs before the ginners set the price, so the farmers have no idea what they could get from the ginners and the traders tend to price low to avoid the risk of loss. There are examples given of traders offering basic commodities such as salt in exchange for the crop or taking the crop and then not paying. The general behaviour of traders has acted to discourage growers. Sales through marketing organizations like BASFA are increasing. BASFA currently has a membership of 4,000 smallholder cotton producers in the Balaka area, producing about 2,000 metric tonnes of Grade A seed-cotton. In 2002, BASFA purchased over 500 tonnes from members and delivered this to the ginners. There is scope to further increase the numbers of members as the benefits of farmer organisations become clearer to others.

Malawi Economic Growth Strategy
Volume II 51/106
Selling cotton directly to ginners is possible for smallholders who are near to the four ginneries in Salima, Balaka and Shire Valley or to the ginners’ buying points. In the last season, Great Lakes Cotton Company (GLC) operated two additional buying points, whilst Clark Cotton Malawi (CCM) utilised the ADMARC depots in cotton growing areas (over 60). By selling directly, margins of traders are avoided, but the smallholders still have to get the cotton to the ginners or buying points. Operating buying points is also expensive for ginners. 9.4.1 Ginners
CCM and GLC are the only ginners in Malawi. Both companies are internationally owned and have invested in Malawi in the last four years. CCM is a joint venture between Clark Cotton (51 per cent) and the Agricultural Development and Marketing Corporation (ADMARC) (49 per cent). CCM controls approximately half of the national ginning capacity, with two ginneries, one in Salima and the other in the Shire Valley. It has only just commenced operations and is planning to offer a very intensive system of support to smallholders. This would include formation of clubs and access to an inputs package with close monitoring of the progress of the clubs at critical times to ensure that inputs are applied at the right time and that pests are identified early. There will also be a limited amount of credit available to farmers that will be closely monitored and those that repay will be able to access credit again. GLC, the other major player in ginning, also owns two ginneries, one in Balaka and one in the Lower Shire Valley. It has introduced a pilot credit scheme for the farmers in the last growing season. This scheme is conducted in cooperation with selected localized farmer unions, which can assist and advise the participating farmers. This has worked better in some areas than others and GLC will be modifying its approach and building steadily. GLC has also introduced around 60 pilot growing plots, from which smallholders can see the benefits of appropriate seeds and the application of modern growing practices, including the use of chemicals and pesticides. All four ginneries are in good technological condition. However, the current concern is that they are seriously under-utilized, probably with only about 20-25 per cent of total ginning capacity being used. The under capacity of the ginneries means there is still an enormous capacity to be utilised without the ginners having to make significant capital expenditures.
9.5 COTTONSEED
Once the cotton has been ginned and the lint extracted, the ginner is left with the cottonseed. This can be crushed to extract oil for a range of commercial food applications, with the seed cake used for animal feed. The viability of cotton processing depends on the use of the cottonseed, which represents approximately two thirds of the crop by weight. Some of the best seed is kept back for the ginners to supply farmers with seed for the following year. This is sold at a highly subsidised price of K2.5/kg ($30/tonne) against its realisable commercial value for oil pressing at $120-130/tonne. The ginners provide subsidised seed to encourage farmers and in recognition that farmers will be short of cash at the time when they need to

Malawi Economic Growth Strategy
Volume II 52/106
purchase. From experience elsewhere, schemes that have given out cottonseed free usually results in high wastage compared to those where the farmer has to make a contribution. The seed that is returned to farmers is tested, but tends to have high germination failure rates as it is not possible to fully select due to the extra cost. Farmers tend to use 10-15 seeds per hole of which ten germinate and seven are thinned out. This is wasteful of seed, but it is not possible to transplant cotton and the farmer wants to maximise the number of plants per field. The recommendation for farmers using this type of seed is 10 per hole, which would reduce the cost to the farmer of seed, even at the subsidised price, but farmers like to be safe. For certified seed the failure rate would be much lower and only 4-5 per hole would be needed (halving the amount of seed that was needed) though it is more expensive. There are three main companies in Malawi that are able to crush cottonseed. At present they are using other seed, mainly groundnut seed, for extracting oil or are buying cottonseed from Mozambique. At the same time, cottonseed from Malawi is being exported to South Africa. This is explained by the more attractive price in the export market and contract obligations of the two companies. Some cottonseed is being sold to the local market, but this is minimal. In 2001/2 around 7-8,000 tonnes of seed was exported with a further 22,500 tonnes being distributed directly to farmers.
9.6 BIOTECHNOLOGY IN COTTON
In 1996-97, biotechnology (‘bt’ or genetically modified cotton) was cultivated for the first time on a commercial scale in the USA and Australia to find less expensive and environmentally safe methods to control insects. Genetically modified cotton has been adopted faster than expected. In 2001, it is estimated that 4.3 million hectares of the total cotton area in the world was planted to transgenic varieties, most of this in China. Commercial production of genetically modified tobacco and herbicide tolerant varieties is conditional on a fee to be paid to owners of these genes. As the technology could be leaked to other farmers and countries without payment by growers, American companies have developed a technology called “technology protection system”, which produces infertile seeds and, therefore, cannot be used twice. This makes genetically modified cotton seeds much more expensive, but growers claim that these expenses have been more than offset in lower insecticide cost and higher yields. The increased world cotton production is partly the result of an increasing area of bt cotton. Malawi needs to determine its response to bt cotton, before events simply overtake the industry.
9.7 THE WORLD COTTON MARKET
Most of Malawi’s cotton lint is exported, and the demand is influenced by demand and supply in the world market. The supply of cotton can fluctuate dramatically from season to season and is influenced by climatic factors (e.g. drought or excessive

Malawi Economic Growth Strategy
Volume II 53/106
rain), subsidies in some countries, current prices, the incidence of pests and the variety or type of cotton grown. Different qualities of yarn and cloth require different grades and staple lengths of cotton. Poor weather may affect production and some types of cotton tend to be in short supply in different seasons. Many yarns and end products can be made from man-made or synthetic fibres instead of cotton, so the demand for cotton will depend on the price of the synthetic fibres in comparison to that of cotton.16 Fashion and new technical developments can also influence the demand for cotton as opposed to other fibres. The Liverpool A-index is the most commonly followed international price index based on a Cost Insurance Freight Europe basis and is probably the most useful indicator of global trends. The Liverpool index shows the general decline in world prices over the last 8 years, though they have picked up slightly in the latest selling season. The world price is obviously beyond the control of the Malawi cotton industry, as it is only a minor producer in the global market. However, the Ginning-Out-Turn (GOT) is a very important determinant of price. The lower the GOT, the lower the price to the farmers, as the crop is less valuable to the ginners. In Malawi the GOT is approximately 33-35 per cent, which is low by international standards. In comparison, the GOT for Zimbabwe is over 40 per cent as a result of using better quality seed-cotton varieties. Since 1995-96, cotton prices have fallen every year, the longest downturn since 1950. Yearly averages for the Liverpool A-index were $0.9108 in 1994 falling to $0.4183 in 2001 recovering to $0.5199 in the current season. This price decrease could have provided the spur to the Malawian cotton sector to be competitive and cost effective. In reality it has tended to lead to farmers dropping out of growing cotton or reducing their hectarage.
Table 9:3: Main African Producers, Users and Exporters of Cotton 2001/2002
Production ‘000 bales*
Usage ‘000 bales*
Export ‘000 bales*
Kenya 20 55 15 Malawi 30 5-10 20-25 Mozambique 110 10 100 South Africa 90 315 30 Tanzania 285 55 200 Zambia 170 65 115 Zimbabwe 550 130 375
Source: Various *Each bale is 480 lbs equivalent.
The top three producers of cotton worldwide are the United States, China and India, respectively. These countries jointly produced 57.2 per cent of total world production, which amounted to 87,414 tonnes in 2001/2002. In the region, fierce competition comes from Zimbabwe, Zambia, Mozambique, South Africa and
16 Often linked to the oil price from which man-made fibres are derived.

Malawi Economic Growth Strategy
Volume II 54/106
Tanzania. In all these countries production is higher than in Malawi, which gives economies of scale in growing, processing and marketing. 9.7.1 Mozambique
Following the end of the civil war, Mozambique’s cotton sector performed very well with peak production in 1999, but thereafter production has decreased. National average farm-level yields have stagnated between 300-400 kg/ha, mainly as a result of low seed quality and little technical assistance. 9.7.2 South Africa
Total area under cultivation declined to 56,692 hectares in the 2001 marketing year compared 90,000 hectares between 1995 and 1999 and this reduced cotton production in South Africa. Total production was estimated at 86,529 tonnes in 2001. This is partly a function of the liberalisation of the market whereby textile firms no longer have to buy from South African ginners and this has opened up the market for Malawi lint. The yield per hectare for irrigated cotton is 3,455 kilogram per hectare. 9.7.3 Zambia
Zambia's cotton sector was liberalized in late 1994 when the state monopoly was sold to two private companies, including Clark Cotton. Following liberalization, production rose from 20,000 tonnes to surpass 100,000 tonnes in the 1998 harvest year, and has averaged about 80,000 tonnes per annum since, nearly all by smallholders. In Zambia the growth can be explained mainly by an increase of cotton growing areas of 65 per cent in the period 1989-99. The level of concentration among ginners in Zambia appears to be an important factor underlying the sector's relatively good performance under liberalization. The two large companies (Dunavant and Clark Cotton) have between them maintained an 80-90 per cent market share. The GOT ratio is reported at 38 per cent. CCM intends to use the same methodology to grow the number of smallholders as it used successfully in Zambia. 9.7.4 Zimbabwe
Zimbabwe is now the largest producer of cotton in sub-Saharan Africa. More than 75 per cent of the lint produced in the country is exported and in 2000 the gross foreign currency earnings were US$120 million. Seed cotton production in Zimbabwe grew to 353,000 tonnes in 2000 with the bulk of this (>80 per cent) now being grown by smallholders. The GOT is more than 40 per cent. Smallholder farmers’ yields on lighter soils and with reduced input application, average 800 kilograms per hectare in reasonable rainfall conditions. These yields compare favourably with those of other countries and are due to several major advances by the Cotton Research Institute.

Malawi Economic Growth Strategy
Volume II 55/106
9.8 LINKAGES BETWEEN TEXTILES AND GARMENT INDUSTRY
Until the 1990s, there was an integrated “cotton/textiles/garment chain” in Malawi with strong intra-sector linkages between the cotton sub-sector (production of lint cotton) and textile and garment production (manufacturing). As a result of changing trading circumstances during the 1990s and the collapse of the only remaining textile company, DWS, the chain has effectively been broken. The revival of the local textile industry could increase the flow of Malawi cotton from growers and ginners, thereby having a positive impact on the cotton sector. Much depends on how the purchaser of DWS utilises the spinning capacity and how that is integrated into weaving and other textile production. But even without a recovery in Malawi’s textile industry, there are ample market opportunities for the sale of increased volumes of cotton lint within the region, especially in South Africa and neighbouring countries, which are seeking to take advantage of the opportunities presented by AGOA by expanding their exports of textiles and garments. Malawi’s cotton lint can be used by these suppliers as a raw material. This opportunity for regional exports has been the primary stimulus for the recently formed joint venture between ADMARC and Clark Cotton. South Africa has the biggest textile and garment industry in the region. Most of cotton lint for this industry is imported from Zimbabwe, but also from other countries such as Mozambique, Malawi and Zambia. Currently, the industry is uncertain about the impact on cotton supply from the political and farming disruption in Zimbabwe. However, Malawi has the disadvantage of high transport costs into South Africa, whilst competitor countries Mozambique and Zimbabwe are closer to South Africa. On the other hand, Malawi has a competitive labour force and once productivity and volumes are increased, the cotton industry could be competitive in the region.
9.9 COTTON COUNCIL
There is now draft legislation to establish a Cotton Council in which all the cotton stakeholders are represented. This Council will undertake a variety of activities to promote and grow the industry. These activities will include cotton research and extension, seed multiplication and distribution, inputs marketing, and quality management. Assistance would also be beneficial in the formation or strengthening of farmer groups and associations in the main cotton growing areas. The focus of the Cotton Council will extend well beyond the cotton sector and include the more extended supply chain, which involves weaving, spinning, garment and manufacturing. The main concern by the private sector is to ensure that the Council Is led by the private sector and focuses on promoting the industry, rather than on controlling the industry. Government will be well represented and will need to respond to the various issues raised by the Council and its membership.

Malawi Economic Growth Strategy
Volume II 56/106
9.10 CONSTRAINTS
The main constraints identified by the cotton stakeholders are: 1. Low yielding seed varieties, in terms of low GOT, that result in lower prices from
ginners and lower returns to growers, making the crop relatively unattractive at the current world prices.
2. Mixing of different seed varieties not suited to each area. 3. Problems in seed distribution. 4. Low usage of inputs due to high cost and inadequate availability of credit results
in lower productivity due to pest and weed losses. 5. Lack of farmer organisation for buying inputs and marketing cotton. This also
makes it harder for farmers to receive technical support and training. 6. Poor husbandry by farmers with limited knowledge of basic issues like spacing,
number of seeds to plant, pest identification, etc. 7. Shortage of labour for weeding caused by smallholders’ concentration on food
crops. 8. Limited effectiveness of Government extension service to reach the vast majority
of cotton farmers. Even when it does, the officers are not cotton specialists. 9. Low and declining world prices for cotton which impact on the relative
attractiveness of growing cotton. 10. Failure of ADMARC to pay smallholders for crops purchased in 2002 (prior to
the establishment of a joint company with Clark) damaged the confidence of smallholder farmers.
11. Activities of traders and the reduction in the number of buying points resulted in smallholders getting worse terms and being exploited. This is also a function of the late announcement of the season’s price by ginners.
12. Polypropylene contamination has reduced the attractiveness of Malawi’s cotton lint.
13. Closure of DWS has reduced the outlet for lint in its natural market further undermining the price.
14. Inadequate availability of seed for planting. 15. The increase in genetically modified cotton being grown has put downward
pressure on world prices. Malawi needs to clarify its position on GMO cotton material as it affects both supply and demand for the crop.
16. A relatively weak cotton lobby, including poor coordination and dialogue between Government and stakeholders to actively co-ordinate and promote the cotton sub-sector.
17. Introducing surtax on purchases from farmers will depress prices offered to farmers.
9.11 STRATEGIES
The projected long-term decline in world cotton prices indicates the need to focus on how to achieve continuous reductions in the cost of production and higher productivity over time. This focuses attention on agricultural research and extension systems plus coordinating the supply channel for credit and inputs in a way that makes cotton profitable for both farmers and commercial firms over the medium to

Malawi Economic Growth Strategy
Volume II 57/106
long run. It is unlikely that a low-input, high-yield approach to cotton production will allow the industry to flourish. Below are listed a number of areas where intervention could improve the prospects for the industry. 1. Better organisation of the smallholders for receiving inputs and marketing raw
cotton with an expansion of the work of NASFAM and by the ginning companies. 2. Introduction of better seed varieties based on varieties already being tested and
available – this requires an agreed approach by the industry and organisation of multiplication of the seed. This could increase overall lint production by 20-25 per cent in one season.
3. Introduction of pre-treated seed for planting by smallholder farmers to ensure higher yields in the short term. This could increase production by 200 per cent or more in the short term. A consortium of chemical companies, ginners and Government with donor support could design and implement a scheme for the 2003/4 growing season with immediate benefits for the industry.
4. Establish and coordinate an industry agreement on the distribution of seed to ensure that more farmers can access cottonseed. Coordination is necessary to avoid the ‘free-rider problem’ where one company/organisation benefits from the seed and distribution costs subsidised by the other. Without agreement, neither company has a strong incentive to put more or better seed into the system.
5. Improve smallholder husbandry through effective extension work, with MoAI and private sector coordinating their efforts. This could double the mean yield without additional inputs. There needs to be a re-appraisal of how support can best be delivered.
6. Ensure availability of critical inputs such as herbicides and pesticides on credit through Micro Finance Institutions and the private sector. Funds could be made available by donors and Government with criteria for operation set within the constraints of sound credit management.
7. Better controls on the movement of seed to keep the right varieties in the most suitable areas and give consistency to the cotton grown in each area that is beneficial to the ginners’ ability to process and sell it for better prices.
8. Improve overall food security in the cotton areas through effective distribution of maize, so that farmers can concentrate on cotton.
9. Improve the access of smallholders to buying points – this is already being planned by ADMARC and to a lesser extent GLC, if the crop volumes increase and make it more economic to do so.
10. Encourage the organisation of farmers into clubs and associations that can receive inputs and consolidate economic loads for transport. This will also give smallholders the chance to make better returns by organising transport or negotiating better prices for bigger volumes.
11. Announcement of season prices as early as possible to reduce the scope for traders to offer lower prices in the period of uncertainty.
12. Establish measures to remove polyfibre contamination through more traditional picking sacks, education, and better controls at ginneries.
13. Revitalisation of DWS as a major spinner and consumer of lint, linked to the implementation of a textiles and garment strategy.

Malawi Economic Growth Strategy
Volume II 58/106
14. Investigate how cottonseed sales to oil processors can be improved and sustained.
The proposed Cotton Council needs to be private-sector driven if it wants to be an effective voice for all parts of the industry, including smallholder producers, farmers’ organisations and ginneries. Government, particularly through the Ministry of Agriculture, needs to be fully engaged in the Cotton Council as a key stakeholder to ensure that the industry voice is heard within Government on issues that affect it and that Government shares its own concerns and interests with the industry on the development of a vibrant sector. It is hoped that the new institutional arrangements would ensure a more constructive and responsive dialogue between all the stakeholders in the industry, to the benefit of all stakeholders in the sector. The Government should finalise the legislation in consultation with the industry and then progress quickly. In particular, Government should, therefore: 1. Finalise consultations with the private sector and other stakeholders on the role
and remit of the Cotton Council with a strong emphasis on promotion, not the control, of the industry.
2. Progress the necessary legislation quickly and make funds available for the establishment of the Council.
3. Ensure officers and employees are appointed for technical competence and not based on political reasons.
4. Possibly operate a shadow council in the interim as a consultative body for discussion and coordination, but without statutory power.
5. Address the issue of genetically modified cotton and establish Malawi’s position on it.
9.12 IMPLEMENTATION
A group of stakeholders representing the cotton industry have worked on a detailed action plan to implement the above Strategy. This has been included in Volume III of the Malawi Economic Growth Strategy. The proposed Cotton Council will in due course become the implementation body for the cotton industry strategy.

Malawi Economic Growth Strategy
Volume II 59/106
CHAPTER TEN: THE MINING SECTOR
10.1 INTRODUCTION
Mining is one of the prioritised high growth potential sectors. It accounts for 1.4 per cent of GDP and, while employment figures are not well known, it was projected to employ 13,783 people in 2001. The contribution to export earnings is currently low. Mining is subdivided into small-scale, medium-scale and large-scale. Small-scale accounted for 43 per cent of total mining output in 2001 and large-scale the remainder. The small-scale sub-sector produces gemstones, stone aggregates, sand, lime and salt while the large-scale sub-sector mines coal at Mchenga and near Bangula, dimension stone at Ilomba in Chitipa and Kabumba in Mzimba, and limestone at Chamama in Kasungu, Kasinje/Bwanje in Ntcheu, Chenkumbi in Balaka, and Lirangwe and Zalewa in Blantyre. Table 10.1: Malawi’s Known Mineral Reserves Proven and Probable as at
January 2003
Category Name Tonnage/Grade per cent
Proven Reserves
Kayerekera (Uranium) Mulanje bauxite Chimwadzulu corundum Malowa Hill limestone Kangankunde Rare earth minerals (REM) Katengeza graphite Chipoka Heavy mineral sands (APA) Feremu vermiculite
2.4 Mt/0.26 U3O8 28.8 Mt/43.9 Al2O3 8 tonnes/75.6 g per m3 15 Mt/48 CaO, 1.2 Mg 11 Mt/8 per cent Srt, 2.6 per cent Mzt 2.7 Mt/ 5.8 per cent C 210 Mt/5.6 HMS 1.5 Mt/4.9 (med+fine)
Probable Reserves
Mwabvi coalfield Tundulu phosphate Ngana coal field Chenkumbi limestone Chisepo pyrite -Nkhanyu Hill Linthipe kaolinitic clay Mchinji glass sand Salima heavy mineral sands (Millennium)
4 Mt/30.0 per cent ash 2.0 Mt/17 P2O5 15 Mt/21.2 ash 10 Mt/46.1 CaO, 6.3 MgO 34 Mt/8 per cent S 14.1 Mt/ 33.8 Al2O3 1.6 Mt/ 97 per cent SiO2 250 Mt/5.6 HMS
Source: Department of Mines
The above table shows most of the mineral deposits for which there is enough information for local utilisation for import substitution through small-scale and medium-scale mining. There is potential to use a range of these minerals for the manufacture of key commodities, particularly cement, chalk, construction, fertiliser, and pesticides as well as for food processing (see Table 10.2).

Malawi Economic Growth Strategy
Volume II 60/106
10.2 POTENTIAL DEMAND FOR MINERAL PRODUCTS
The potential demand for mineral products arises from opportunities for import substitution. Malawi imports a wide variety of mineral products for industrial and other various uses. Malawi imported 439,291 tonnes of cement and 80 per cent of the total fertilizer consumed, including phosphate fertiliser (Table 10.3). In addition, there are other minerals comprising kaolinitic clays for ceramics, pottery, firebricks and bobbin insulators (which represents a large proportion of mineral imports); limestone for cement; gypsum for plaster of Paris and chalk manufacturing; vermiculite for ceiling boards, fillers, and soil conditioning; and rock phosphate for fertilisers. The total value of mineral imports is approximately K600.3 million.
Table 10.2: Potential Uses of Key Minerals
Mineral Potential Use Scale of Mining
Gypsum Chalk, cement Small-scale
Vermiculite Pesticide, construction Medium-scale
Phosphate Fertilizer, food processing Medium-scale
Limestone Soil conditioner, cement/aggregates, sugar processing
Medium-scale
Graphite Lead pencils, steel industry Medium-scale
Gemstones Jewellery Small-scale
Source: Department of Mines
Industrial minerals are often bulky, of low value and good for import substitution due to high transport costs. The mining sub-sector has focused primarily on industrial minerals. These minerals are easy to find and explore, making it possible to be worked within a limited budget.
Table 10.3: Fertiliser Imports for Malawi, 1994-1999 Type of Fertilizer
Phosphoric Other Total 1994 48,000 65,000 113,000 1995 48,100 199,700 247,800 1996 29,000 120,833 149,833 1997 35,000 115,000 150,000 1998 172,300 1999 191,650
Source: National Statistical Office, SFFRFM and other sources
The phosphorous fertiliser was produced by Optichem (2000) Limited and the Malawi Fertilizer Company. The table above shows fertiliser imports for Malawi.

Malawi Economic Growth Strategy
Volume II 61/106
10.3 PRODUCTION OF MINERALS
There are two private companies, Portland Cement and Shayona Cement, that are currently processing limestone into cement. Cane Products Limited have been granted a mineral right to look into possibilities of processing the Makoko limestone deposit into cement. In addition Optichem (2000) Limited, a subsidiary of Malawi Development Corporation, is investigating the Tundulu phosphate deposit and is looking for joint venture partners to start fertilizer manufacturing. Unfortunately, the closure of the Portland Cement Company limestone mining and processing facility at Changalume is a setback for the mining industry and cement production in Malawi. This represents a substantial loss of locally manufactured cement. Potential investors still need to be identified and feasibility studies undertaken on the potential for commercial mining and processing at a range of locations. Other higher value industrial minerals such as heavy minerals sands (HMS) and rare earth minerals such as strontianite/monazite have the potential to be exploited for export. The potential for import substitution is set out in the table below which shows recent mineral imports.
Table 10.4: Selected Mineral Imports 2000 to 2001 2000 2001
MINERAL Tonnes
Value (K’
millions) Tonnes
Value (K’ millions)
Kaolinitic clay 119 2.8 1,434 336.1
Chalk 71 4.7 66 6.5
Gypsum 10 0.3 365 43.0
Lime 2,575 42.1 3,873 37.4
Clinker 106 3.6 28 3.2
Portland cement 10,349 120.4 11,531 137.6
Coal 3,480 37.8 4,135 35.9
Vermiculite 0 0 1 0.6
TOTAL 211.7 600.3 Source: National Statistical Office
From the above table, kaolinitic clay was the main imported mineral by value, for use by the foundry and firebrick making industries. Yet Malawi has deposits of kaolinitic clays at Linthipe in Dedza and Senzani in Balaka that could be exploited commercially if seed money was identified to support small-scale miners. The same clays are suitable for production of ceramic products. In contrast, only a relatively small amount of minerals were exported over a similar period, the bulk of which was coal. The table below indicates the minerals and their values.

Malawi Economic Growth Strategy
Volume II 62/106
Table 10.5: Mineral Exports 2000-2001
2000 2001
Tonne
s
Value (K
millions)
Tonnes
Value (K
millions) Coal 12,618 25.45 8,596 15.64 Gemstones 148 13.58 16 2.84 Limestone flux N/a N/a 8 0.01 Quick lime N/a N/a 7 0.01 White Cement N/a N/a 31 0.10 Portland Cement 15 0.13 818 2.41 Hydraulic Cement N/a N/a 17 0.06 Dimension stones 78 0.53 329 0.96 Total 39.69 22.03
Source: National Statistics Office and Department of Mines
The increased exports of Portland Cement are likely to have been reversed in 2002, given the current shortage of cement in Malawi and the sanctioning of imported cement for large scale construction. In contrast, coal exports have fluctuated due to variability of production due to technically difficult mining conditions. Based on mining licences issued, this is likely to increase. The increase in exports for dimension stone has been due to opening of amazono-granite mining at Kabumba in Mzimba.
Table 10.6: Potential Export Minerals Production and Earnings
Production Capacity
(tonnes/year)
Capital Expenditure (K million)17
Export Earnings (K million)
Potential Royalty
(K million)
Mulanje Bauxite 100,000 25,800 8,600 4.3
Uranium 2 3,526 2,890 144.5
Makanjira HMS 392,000 6,880 15,910 168.6
Strontianite 20,000 808 826 43.3
Chipoka HMS 150,000 396 2,038 64.5
Vermiculite 12,000 310 284 5.2
Graphite 5,000 370 292 8.6
Malowa Limestone 34,000 1,015 310 15.5
TOTAL 39,204 31,149 454.4
Source: Department of Mines
The above table makes certain assumptions:
17 This would be undertaken by the private sector.

Malawi Economic Growth Strategy
Volume II 63/106
1. Royalty has been charged at 10 per cent of gross value of mineral product. 2. An exchange rate of MK86:US$118 3. Selling price of mineral product remains constant. 4. Production cost is constant.
Of the above potential locations, private companies have all been granted exploration licences that will automatically lead to mining licences if the deposits are proven commercially viable. In the case of Chipoka HMS, Allied Procurement Limited Company has now ordered the necessary equipment for mining and processing, to begin work in March 2003. If all the above mineral deposits were to be commercially mined, it is projected that mining GDP will increase at an average annual rate of 10 per cent from K.1.97 billion in 2001 to K.3.5 billion in 2007. Mining is a relatively capital-intensive industry that requires good support infrastructure. Many deposits to be mined are located in remote areas poorly served with infrastructure. There will need to be agreements with new investors as to what infrastructure is needed and who will pay what share of it. This will avoid the problems that exist with access to Shayona Cement, where the company builds stock in a warehouse in the trading centre as it cannot generally move cement during the rainy season. As part of any deal with investors, Government will need to determine what infrastructure it will put in, including roads. This may be wider than just the local area to access the main road networks, as the large-scale movement of heavy vehicles will put a strain on the wider road infrastructure. These additional costs need to be taken into account to attract investors. There is also the question of the cost of building houses and other social infrastructure for workers. This may partly be offset in the negotiation on the royalties or the expenditure will need to be undertaken by Government. Therefore, whilst the royalty earnings look attractive, there are other costs that Government may need to account for. There is also great potential for small-scale mining, especially gemstones, to increase production and export value as can be seen from the table below recording the growth in volumes over a period of five years.
Table 10.7: Gemstone Production Trend, 1998-2001 1998 1999 2000 2001 Production (tonnes)
14.7 8.4 148.0 152.4
Value (K’ million) N/a 2.8 13.5 N/a Source: Department of Mines
According to Department of Mines data, small-scale mining has grown tenfold since 1998, excluding illegal gemstone cross-border sales, which produce some foreign currency but not revenue for Government. Illegal cross-border sale of gemstones is a big problem arising from inadequate legal enforcement and lack of capacity in the Department of Mines to undertake inspection activities due to inadequate funding. Roadblock personnel need to be made aware of illegal transportation of gemstones by both local and international transporters as these stones need export permits
18 Actual royalties are therefore likely to be higher in kwacha terms.

Malawi Economic Growth Strategy
Volume II 64/106
from the Department of Mines. There also needs to be more emphasis on detection and intelligence gathering to limit the trade.
10.4 CONSTRAINTS
The constraints facing the mining sector can be divided into those affecting small-scale mining and those affecting medium-scale/large-scale mining. The overall issues for small-scale mining relate to low productivity, low value-added, safety, environmental damage, limited access to legitimate market outlets and smuggling of gemstones. Other small-scale sector constraints are listed here.
1. Use of inappropriate equipment by small-scale miners, as they rely on traditional tools such as hoes, picks and shovels, thereby limiting their production output.
2. Lack of initial capital for appropriate mining equipment and working capital. 3. Limited value-adding services such as faceting, as the necessary equipment is
specialised and not generally available. 4. Inadequate technical support on sustainable mining. 5. Dangerous conditions of work due to ignorance, poor practices, and lack of
supervision, monitoring and enforcement. 6. Lack of a local organised marketing organisation and easily accessible export
markets for gemstones. 7. Potential for illegal behaviour through smuggling and avoiding regulations
and duties.
Medium-scale to large-scale mining has its own unique problems. These include:
1. Lack of a Mining Policy and new Minerals and Mining Act to give investors the necessary protection and certainty required when making large investments.
2. Lack of enacted fiscal and investment incentives that can be granted automatically and are sufficient to attract large-scale investment.
3. Failure to include mining in international protocols, agreements, or National Development Indicative Programme so that cooperating partners could assist the sector both financially and technically.
4. Abolition of MIDCOR has slowed the development of the mineral sector. 5. Poor infrastructure and potential damage and strain to the rest of the
infrastructure network from movement of large tonnages of materials. 6. Risk of irreversible environmental damage.
10.5 STRATEGIES
In order to attract investment in both in the small-scale mining and the medium- to large- scale mining categories, there is need to undertake the following:
1. Formulate a Mining Policy that covers the minerals legislative framework, land tenure security, infrastructure and environmental issues.

Malawi Economic Growth Strategy
Volume II 65/106
2. Government should establish credit facilities through local Micro Financial (Development) Institutions to support small-scale miners.
3. Increase the funding to Department of Mines for providing technical support and training for small-scale miners.
4. Government should create another body like MIDCOR that should:
• Provide an organised local mineral commodity markets,
• Attract both local and international potential investors to invest in Malawi,
• Facilitate joint venture partnerships, • Open mines and processing plants in joint venture partnership or
ultimately in areas where investors are reluctant to come in; and • Train small-scale miners how to polish and add value to their minerals,
such as gemstones, lime and gypsum before offering them to the market. 5. Making linkages with miners of industrial minerals to the market through
local private companies, thereby facilitating import substitution. 6. Marketing/exporting semi-precious stones to Middle East and Asia through
local and international buyers to be licensed by an independent mining licensing committee.
Foreign investment in large-scale mining can be attracted through an effective legislative framework aimed at:
1. Clearly defining mining investment incentives that are internationally competitive, such as import duty exemptions and reduced corporate taxation.
2. Clarifying policies towards infrastructure upgrading and responsibilities, including willingness to invest in or offset the cost of infrastructure
3. Skills development support for both trainers and trainees in conjunction with investors, aimed at increasing and maintaining an effective skilled work force for the private sector.
4. GoM’s providing necessary support services (conducting feasibility studies, etc.) that promote new investment opportunities.
5. Better promotion of opportunities is required through bulletins, websites and investor events/conferences.
These aims should be supported by updating the Government Mining Policy. Such an update will be a key step for guiding the drafting of a new Mining Act. The Mining Act will, among other things, include:
1. Specifying ownership of mineral resources. 2. Enacting competitive guaranteed fiscal incentives, possibly under a general
Investment Act. 3. Establishing and defining the role of an independent Mining Licensing
Committee. 4. Guaranteeing security of land tenure for investing companies. 5. Establishing and enforcing environmental, health and safety standards in
mining.

Malawi Economic Growth Strategy
Volume II 66/106
There is also a need to review taxation applicable to mining as Malawi is not generally competitive compared to other countries in the region. Commercial mining firms pay taxes and royalties. Royalties are currently calculated at between 5-10 per cent of gross value of the mineral value while in most SADC countries, they are between 1-5 per cent. The implications of any change need to be considered and whether it applies to all types of mining or not. Proposed incentives are set out in Appendix 1. These will require further and wider consultation before finalising. The proposed priority actions are set out below:
Table 10.8: Priority Actions for Mining Sub-sector
Activity Objective Cost
(K millions) Timing
Mining Policy To guide mining investment
12.9 Immediately: by end of 2003
Minerals and Mining Act
To regulate mining and investment
25.8 Soon after Mining Policy: by mid 2005
Design Investment Incentives
Attract local and foreign investment
N/A In place by end 2003
Mining Bulletin targeting investors
Update on mining activities and mining
projects
6.9/p.a. Quarterly
Conference and Exhibitions targeting
investors
Mining promotion 8.6/p.a. At least three participations p.a.
Annual reports Financial and economic reporting
1.7/p.a. Every financial year
The cost of technical support to the mining industry can be handled within improved budgetary allocation to the Department of Mines. It is also recommended that micro-finance is made available out of direct control of Government through microfinance development institutions in order to attract donor funding and avoid political interference. Finally it should be noted that the incremental revenues projected from royalties alone are anticipated to more than cover the costs of the investment by Government in mining within 12 months. Investing in the industry now to establish the right frameworks for development of the sector will reap rewards very quickly for Government and for the private sector in terms of export earnings, import substitution, jobs, and Government revenues.
10.6 IMPLEMENTATION
A more detailed implementation plan and framework is needed. It is suggested that there is a need to bring together the key stakeholders in the mining sector from the public and private sectors to discuss the development of a detailed action plan that is owned and then implemented by the stakeholders. The adoption of the value-chain process is recommended as this will highlight further constraints and opportunities

Malawi Economic Growth Strategy
Volume II 67/106
for mining, as well as build commitment to the implementation by both the public and private sectors.

Malawi Economic Growth Strategy
Volume II 68/106
CHAPTER ELEVEN: THE MANUFACTURING SECTOR
11.1 INTRODUCTION
The manufacturing sector is facing a steady but relentless decline, having fallen from 17 per cent of GDP in 1994 to 11.4 per cent of GDP in 2002, with further decline predicted. It is facing a major crisis, with further disinvestments on the horizon unless policies and practices towards manufacturing are dramatically turned around in the very near future. If Malawi is to break its dependence on the volatility of agricultural production and markets, it has to develop a vibrant manufacturing sector.
11.2 POLICY BACKGROUND
Malawian value-added manufacturing achieved post-independence average growth rates of 6.3 per cent between 1970 and 1979. Because the incentive bias was heavily inward looking, nearly 95 per cent of output growth was oriented towards domestic demand,19 leaving only 5 per cent to export demand. This made the manufacturing sector vulnerable and post-1979 a combination of factors contributed to undermining the sustainability of its performance. Beginning in the early 1980s Government began to put in place or strengthen existing measures to develop a more liberalised and competitive business environment. For manufacturing, the measures instituted included entry and price deregulation, fiscal incentives and institutional arrangements to improve operational competitiveness e.g. reduced duty on imported raw material inputs and more competitive and efficient upstream markets such as those for foreign exchange, finance capital and utilities. As far as trade policy and manufacturing are concerned, Government’s response to the Mozambique-related external shocks of the mid-1980s amounted to increased protectionism in the economy through raised tariff rates and quantitative restrictions on imports and foreign exchange rationing. This created a new set of problems, which Government started addressing from 1988:
1. A systematic reduction in average tariffs occurred between 1991 and 1996 when the average came down from 26 per cent to 13 per cent.
2. Establishing a more effective duty drawback system operating through bonded warehouses and Export Processing Zones to stimulate manufactured exports.20
3. Restructuring public utilities, especially the power and telecommunications sectors, to increase competition and improve efficiency.
Because some of these important changes and measures are fairly recent, the desired effects have yet to be fully realized while others are being affected by domestic
19 75% towards domestic demand expansion and 20% import-substitution. 20 1995.

Malawi Economic Growth Strategy
Volume II 69/106
economic management and the accumulation of domestic debt as well as sub-regional trade shocks. These and other issues linked to raw materials inputs, competitive real exchange rates, skill levels, capital markets, regionally competitive incentives, corruption and security have become outstanding areas of concern to the manufacturing sector.
11.3 STRUCTURE OF THE SECTOR AND IMPLICATIONS
Based on 1998 data, manufacturing is dominated by beverages (29 per cent), food/agro-processing (23 per cent) and pharmaceuticals/soap (11 per cent). This dominance is likely to have increased as the main closures have been in other sub-sectors. Manufacturing is also highly concentrated with 77 per cent of 52 industries analysed considered to be monopolistic (concentration indices of between 0.5 and 1.0). Also, manufacturing is generally highly import-dependent.
The table below suggests that traditional activities that are agro- or supply-based are the least import-dependent irrespective of market-orientation i.e. domestic/export or final/ intermediate. These are the activities with heaviest domestic backward linkages. The rest, which comprise mainly import-substituting consumer durable and intermediate products have high import-content and limited domestic backward linkages although some of the activities generate forward linkages, providing inputs for other activities.
Table 11:1: Manufacturing Market Orientation and Import Content
Sub-Sectors/Products Import Content Per Cent*
Value Added Per
Cent** DOMESTIC ORIENTED Meat products, sugar, fish, fruit, dairy products, grain milling, beverages, saw milling.
15-26 24
Baking 85 Other (the rest) 52-98 51 EXPORT ORIENTED Tea, tobacco, sugar 11-17 25
Notes: *These figures relate to the 1970s but are consistent with recent estimates that the whole
manufacturing sector relies on imports for 65 per cent of its inputs in value terms. **These relate to 1998.
Source: Kalua (1992) and NSO.
The input/output orientation of manufacturing implies that domestic economic integration is weak. There are also poor inter-industry (activity) linkages within manufacturing and between manufacturing and other sectors. The linkages between manufacturing and the primary sector are limited by the narrow product range and underdevelopment of agriculture and mining. The whole manufacturing sector therefore faces vulnerability in the short-term as agro-based food processing and exports depend heavily on the performance of domestic agriculture for its inputs. Over 90 per cent of firms rely on domestic demand making performance heavily

Malawi Economic Growth Strategy
Volume II 70/106
sensitive and closely tied to the domestic business cycle. The latter is weather-bound on the supply side and sensitive to macroeconomic management on the demand side. Long-run efficiency is associated with a number of related features of domestic manufacturing and its environment including: excess capacity problems, the quality of utilities (electricity and water), agricultural productivity/demand problems; obsolete technologies; low skills/ productivity levels; weak finance capital market; increased import competition and an uncertain economic environment.
Table 11:2: Short/Long-run Manufacturing Cost Efficiency and Domestic
Resource Costs Short-run
DRC TFP Long-run DRC
1988 1994 1988-96
1988-1 1988-2
1988-3 1994
Food Processing 0.73 0.21 2 1.86 1.59 0.91 2.35 Grain 0.02 4.37 Veg. Oils 0.39 3.36 Sugar 0.16 0.82 Beverages 0.15 0.17 -0.2 0.63 0.56 0.34 1.28 Tea 0.2 Soaps 0.16 2.17 Tobacco 0.14 0.3 1.13 Textiles 0.67 0.02 0.2 3.66 3.44 2.11 0.62 Clothing 0.11 0.4 1.28 Leather & Footwear 0.53 1.36 1.16 0.37 Wood & Paper 0.8 0.5 1.64 1.37 0.74 Plastics 0.33 0.22 1.22 1.09 0.71 3.37 Pharmaceuticals -0.1 Paints 0.02 1.15 Chemicals & Fertilizers
0.95 1.98 1.64 0.84
Tyre re-treading 0.09 -0.2 1.29 Non-metallic 1.47 0.19 2 3.22 2.7 2.18 7.37 Metal products 0.93 0.08 0.2 1.94 1.6 0.35 0.37 Miscellaneous 1.13 0.26 0.1 2.25 1.86 0.35 1.16
Notes: DRC measures how many dollars it costs to earn or save one dollar in terms of the short-run, when
capital costs are sunk costs and long-run when decisions can be made to enter or quit.
The decline in manufacturing has continued throughout the 1990s despite its prioritisation and incentives available. Output growth in manufacturing has averaged 3.7 per cent per annum in real terms between 1980 and 1993 and generally poor performance thereafter. The table below gives an impression of entry patterns into manufacturing over time and highlights the underlying problem. Entry rates in the 1990s declined significantly with a virtual collapse after 1995. This of course is only new entrants and does not reflect closures or disinvestments, resulting in a net decline in the number of manufacturing firms.

Malawi Economic Growth Strategy
Volume II 71/106
Table 11.3: Manufacturing Firms by City and Date of Establishment
City Period
Blantyre Lilongwe Mzuzu Total Pre-1980 59 6 3 68 1980-1984 11 6 - 17 1985-1989 256 80 8 344 1990-1994 14 16 - 30 1995-1997 1 - - 1
Total 341 108 11 460 Source: Ministry of Finance/World Bank (1999), compiled from NSO files
From the mid-1990s, inflationary tendencies and import-competition have contributed to the worsening of the situation.21 Some activities already associated with large-scale production have been adversely affected and have undergone restructuring of production or closures, e.g. tobacco processing, edible oils, soaps, and cement. The environment has not just adversely affected the rate of entry, but industrial orientation has also been tilting towards easy-entry, traditional industries with low barriers to entry and mainly domestic market-oriented, e.g. food processing, clothing, sawmill, and packaging. In the existing business climate, these are less risky than those requiring high capital and technology intensity. They can also accommodate more flexible smaller-scale operations in the very small and medium-sized categories.
11.4 OPPORTUNITIES AND CONSTRAINTS
The investment and operating environment in Malawi needs significant improvement to achieve a comparative advantage in manufacturing. Most immediately is the need for sound fiscal management and industrial support infrastructure to ensure lower real interest rates, competitive foreign exchange rates, and reasonably priced reliable utilities. The non-market operational environment such as rule-of-law and security as well as issues of corruption and transparency are also crucial for an internationally competitive incentive environment. The longer-term requires development and strategic orientation of key upstream markets such as a diversified and more developed raw materials base, a more developed and competitive finance capital market and skills development of employees. These areas have been highlighted in International Labour Organisation and World Bank studies, which have all advocated rapid growth of manufacturing as a growth catalyst22. One of the most important issues to be addressed is the formulation of a more attractive set of incentives for manufacturing investment. Past prioritisation of 21 Following the accelerated reduction in tariffs and distortions from bilateral agreements e.g. with Zimbabwe, import-competition has worsened. 22 See UNDP/International Labour Organisation,1999. The Challenge of Promoting Productive Job in Malawi, and World Bank, 1997, Accelerating Malawi’s Growth , and World Bank,2000,

Malawi Economic Growth Strategy
Volume II 72/106
manufacturing and current incentives have failed to stem the decline of manufacturing in Malawi, let alone stimulate its growth. The main aims of strengthening manufacturing industry incentives are:
1. To reward manufacturing investment and compensate for upfront costs of investment and cashflow strain through better investment allowances.
2. To encourage exporting and, just as importantly. to encourage declaration of foreign exchange earnings in Malawi, through tax credits for foreign exchange earnings.23
3. To reward those businesses that increase employment through employment incentives.
Malawi needs to stimulate both export-oriented and import-substituting domestic manufacturing as well as to improve the general climate for manufacturing. Therefore, the Task Force identified agro-processing and textiles/garments as the two main growth sub-sectors within manufacturing. These will be considered in the next chapters.
23 This is partly to compensate for the extra cost of local inputs due to the extension of Surtax.

Malawi Economic Growth Strategy
Volume II 73/106
CHAPTER TWELVE: TEXTILES AND GARMENTS
12.1 INTRODUCTION
Textiles and Garments have been identified as a high growth potential sector for Malawi. In addition to the two industries, this sector has backward linkages to the cotton sector (though these are virtually non-existent at present). The textiles industry has been in long-term decline, with only two firms operating: David Whitehead and Sons (DWS), an integrated spinner and weaver, previously owned by Government and recently privatised, and Knitwear Industries with unused knitting capacity. Knitwear Industries found that it was not profitable to buy local yarn and subsequently that it was uneconomical to import yarn compared to importing cloth. For the garments end of the value-chain, there was rapid growth in the 1990s followed by major disinvestments after January 2000 due to the effective collapse of the agreement with South Africa through application of non-tariff barriers. The sector is now beginning to increase its exports and recover some of the ground lost. Garment firms have been the main users of the Export Processing Zone (EPZ) status, but this has failed to attract any new garment or textile investors into the country.
12.2 TEXTILES ANALYSIS
DWS comprised a large vertically organized production complex for spinning, weaving, dyeing, and several other specialized finishing processes. Lonhro managed it until the mid 1990s when it sold its 51 per cent equity to Government to combine with the 49 per cent owned by ADMARC. Until the early 1900s, DWS utilized Malawi cotton and with high tariff protection enjoyed continuous financial success. However, its fortunes waned when severe dumping and smuggling of finished textile goods and garments drastically disrupted its domestic market. DWS as a public enterprise has accumulated substantial losses in excess of K1 billion, which is a major drain on Government finances. The Garments and Textile Association of Malawi (GTMA) believes that with the right management and private ownership, DWS could be successful in the international markets. This assumes that the privatisation processes will deliver DWS to new ownership without the accumulated debt and the costs of the necessary labour retrenchment and with investment to resume spinning, weaving, and dyeing. An anomaly exists in Malawi where no locally produced textiles are used by the garment industry. All the fabric for the Cut, Make, Trim (CMT) operators is imported, as DWS was unable to provide the necessary variety and quality at the right price. However, with the changing requirements of the trade regimes that require the use of local fabric, Malawi must develop the textile industry or face the potential loss of markets. All the trade agreements have increasing future requirements to use either national and/or regional textiles. Therefore, there may be

Malawi Economic Growth Strategy
Volume II 74/106
difficulties in satisfying this requirement if Malawi is not able to produce at least 25 per cent of the textiles to be used by the garment industry.
12.3 GARMENTS/APPAREL ANALYSIS
The garment industry moved from a predominantly domestic market industry in the 1970s and 1980s to an export orientated industry in the 1990s through to 2003. In the early-1990s there were over thirty garment factories in Malawi. However, dumping, smuggling and imports of second-hand clothing into Malawi caused considerable market disruption. To compound these problems many customs regulations and procedures were open to abuse, leading to a failure to collect the agreed revenue.
12.4 TRADE AGREEMENTS
Fortuitously for Malawi, the South African/Malawi Asymmetrical trade agreement was signed in June 1990. This allowed:
“All goods grown, produced or manufactured in Malawi to be imported into South Africa free of customs duty” though, to “be
regarded as having been produced or manufactured … in Malawi, … at least 25 per cent … of the production cost of those goods … [must] be represented by materials produced and labour performed in Malawi and the last process in the production or manufacture of such goods … [must] have taken place in Malawi”.24
This attracted many South African companies to invest in Malawi doing CMT operations for the South African market, effectively exporting a part of South Africa’s garment industry to Malawi. Malawi’s exports of apparel under codes HS 61 and 62 grew rapidly from $1.8 million in 1990 to $63 million in 1999 once the new firms began to take advantage of the Malawi/South Africa bilateral trade agreement.25 However, in 1998 the agreement came under attack. By January 2000, trade with South Africa under the agreement had virtually ceased with 9 firms closing.26 The surviving firms battled to survive while the terms of trade with South Africa were renegotiated under the SADC Trade Protocol. South Africa delayed implementation of the SADC Free Trade Agreement (FTA), further decreasing the attractiveness of Malawi as an investment destination for CMT operators. In September 2001, agreement on quotas for apparel was finally agreed, but by this time the critical mass built up during the 1990s had been destroyed and Malawi was
24 Articles 2 and 6 of the 1990 Malawi/South Africa Trade Agreement 25 The different data sources about cotton, textile and garment exports and imports appear to be contradictory. Inside Malawi, all the data are discordant. 26 Fashion Fabric, Fashion Clothing, Rainbow Clothing, Nuline Fashions, Imperial Clothing Co., Lilongwe Textiles, Mfumu Clothing, Bentax, Malaya Clothing — Source: Garment and Textile Manufacturers’ Association of Malawi.

Malawi Economic Growth Strategy
Volume II 75/106
no longer an attractive destination for investors to take advantage of either the SADC FTA or AGOA. In the new agreement, quotas remove the problem of value-added percentages (except for printed greige fabric). The new accord is generous to the textile industry, but the small fixed quota severely restrains growth potential. The agreement is the wrong way round for Malawi, which currently has no functioning textile industry. In July 2000, the South African Customs Union (SACU) offered a quota of 8,565,000 units to Malawi under the special MMTZ/SACU Agreement for export to SACU. The quota system will revert to the double transformation requirement in December 2005, a condition that the MMTZ countries will not be able to meet without buying nearly all their cloth from SACU. This provides a threat on the horizon for the garment industry, but an opportunity for textiles. There is a critical need for Government to renegotiate the level of the quotas. The capacity of existing firms in Malawi to manufacture for the South African market is far in excess of the available quotas. This means that there is no available quota to attract any other investment for the South African market and that the existing firms are operating below their installed capacity. Where Malawi should have had the advantage of a growing and mature CMT industry, it has been reduced to a small group of manufacturers that are just surviving. Garment companies report that there has been no real growth from the industry that can be directly attributed to the AGOA. Their exports have simply been diverted from SADC to AGOA. If Malawi argued for the true spirit of the SADC FTA to be implemented, then there should be unlimited duty-free access for all garments manufactured from SACU origin textiles. One of the potential threats of the AGOA agreement is the “snapback clause” whereby the President of the United States can suspend any category of goods without notice or warning if American jobs seem to be threatened. The US market has recently suffered a strong drop in retail sales, which has put some strain on US based clothing producers. Should this situation worsen, the snapback clause could be used. This would, in effect, export unemployment to developing countries such as Malawi, making the garment industry vulnerable. Further to this, there will be a shortage of textiles in AGOA-approved countries. South Africa cannot produce sufficient textiles to supply its own industry let alone the rest of the region and there are few new textiles manufacturers investing in the region. Because AGOA only allows Malawi to use fabric from non-AGOA approved countries until December 2004, there is a major problem on the horizon that needs resolving. This will probably require effective negotiation and the revitalisation of DWS as a supplier of textiles to the industry. As a member of COMESA, Malawi has duty-free trading relations with eight African nations.27 Since the COMESA free trade area and the region covered by the SADC
27 Djibouti, Egypt, Kenya, Mauritius, Madagascar, Sudan, Zambia, and Zimbabwe.

Malawi Economic Growth Strategy
Volume II 76/106
Trade Protocol overlap, Malawi may ship goods between itself and Zambia, Zimbabwe and Mauritius under either agreement. Outside of SACU, the largest volume of trade in textiles and apparel has been with those three SADC countries, which are also members of COMESA. Under COMESA, the tariffs are zero and the rules of origin are less restrictive than under SADC’s rules, making the COMESA agreement a more attractive one for the industry. Under ACP/EU Cotonou, Malawi also gets duty-free and quota-free access for exports of yarn, fabric and clothing to the European Union market. This has further potential to develop the industry. However, the Multi Fibre Agreement (MFA) will fall away in December 2005. This will allow East Asia, Pakistan and India free access to the USA market at Most Favoured Nation rates. Thus Malawi would only have a 25-30 per cent advantage with which to compete with the rest of the world. The estimated cost of shipment and operating in Malawi is approximately 25 per cent of the final price, thus the removal of the MFA in 2005 is a huge threat to the Malawian textile and garment sector.
12.5 TRANSPORTATION
Transportation is a major cost for the industry as material is brought in, turned into garments and then exported minus the trimmings. The cost per km between Durban and Blantyre is one of the highest in the world at over $3,000 per 40-foot container. The cost of transport is compounded by the long lead times to import and export of around 7-10 days. At present, all garment exports go through Durban for international destinations owing to the certainty of booking space, compared to Beira and Nacala, which are unreliable. There is no leeway for late deliveries into the USA as shipments have to arrive on time or will be rejected.
12.6 CONSTRAINTS
Though partial, SACU’s concessions for imports of garments do stimulate production in the MMTZ countries. However, these temporary concessions provide a risky basis for building an industry. The planned re-imposition of the double transformation rule is a threat to the sector’s existence if implemented before garment industries become efficient enough to sell much of their output in the American and European markets and before they have a sufficiently robust local textile industry able to supply much of the fabric. The best option for Malawi would be if SACU could be persuaded to reduce the investors’ risks by guaranteeing the concessions until the main SADC protocol abolishes all tariffs on yarn, fabric and clothing within the region. By offering South Africa a large export market, AGOA may also change the balance in the negotiations with SACU. To benefit fully from AGOA and grow quickly, garment producers in SACU must import yarn and fabric from within the region, products that due to labour and transport cost differentials are often cheaper to

Malawi Economic Growth Strategy
Volume II 77/106
produce at the source than within SACU. If AGOA revitalises the South African textile and garment industries, the South African labour unions’ resistance against imports from within SADC will diminish. This should motivate South African exporters targeting Europe and America to advocate for liberalized regional trade for textile and garment products. This would favour regional integration and the elimination of all barriers within the textile and garment industries. The cost savings from developing a local textiles industry are high when one considers that about 10 per cent of the fibre used to make yarn, 10 per cent of the yarn woven into cloth and 10 per cent of the cloth cut into garments is wasted. Similarly, Malawi’s medium and long-term advantage will be in the production of garments made from locally woven cotton cloth as opposed to imported synthetic fabrics. This would allow Malawi to maintain and use the advantages of AGOA, SADC, COMESA and EBA. Some of the identified constraints facing the industry are:
1. Underdevelopment of the textile industry, limiting the range and quality of locally produced fabrics available for garment producers.
2. Production inefficiencies, delays and product defects (especially in textiles) have limited the use of locally produced cloth.
3. Inadequate availability of long-term capital for investment. 4. Relatively high cost of bank financing and charges in Malawi compared to
other countries. Letters of credit cost 0.5 per cent of invoice value in Malawi compared to only 0.25 per cent in South Africa. This makes many exporters contract services internationally.
5. Unavailability of pre-shipment finance even when supported by irrevocable Letters of Credit banks.
6. High nominal interest rates and instability of exchange rates. 7. Costly and inefficient communication services. 8. Delays in clearing imports by MRA leading to higher costs arising from excess
inventories, production inefficiencies and shipment delays. 9. High costs of electricity caused by the maximum demand tariff systems. 10. Low levels of labour productivity. 11. High insecurity. 12. Delays in issuing temporary employment permits to investors and expatriate
workers. 13. Weak capacity of the Garment and Textile Manufacturers Association. 14. Insufficient capacity of MRA to enforce adequately the various rules of origin
and also to give better service to EPZ manufacturers to clear goods for export within agreed times.
15. Overly restrictive rules on EPZs and the extension of surtax to apply to EPZ companies.
16. Poor administration and allocation of land for establishment of new factories and inadequate factory shells.

Malawi Economic Growth Strategy
Volume II 78/106
12.7 STRATEGIES
The textile and garment industry in Malawi has considerable potential for growth, much of it through simple procedural changes. The future for garments and textiles depends on the development of a vibrant cotton growing and processing industry. This will allow the development of an integrated chain, reducing the cost of importation and transportation considerably. The textiles and garments strategy should be read in the light of the cotton strategy and be integrated with it. This also requires the revitalisation of DWS as a spinner, weaver and finisher of cloth and encouraging other spinners, weavers, knitters and dyers to invest in Malawi. To achieve these objectives, there is need to implement these specific strategies:
1. Implement the cotton strategy. 2. Provide very attractive incentives for spinners, weavers, knitters and further
textile processors. 3. Privatise DWS to improve its productive capacity as a spinner/weaver. 4. Mobilise funds from donors to establish credit lines and refocus development
finance institutions to their original mandate in order to provide investment funds.
5. Reduce costs of bank financing and charges by liberalising the financial sector and increasing the availability of a fund for pre-shipment finance.
6. Restore macroeconomic stability in order to reduce interest rates and stabilise the exchange rate through macroeconomic measures.
7. Complete the privatisation process of Malawi Telecommunication Limited (MTL) to improve competition and efficiency in telecommunication service provision.
8. Improve the speed for clearing imports. 9. Review and rationalise the maximum demand tariff pricing system for
electricity to reduce cost of electricity and reduce or remove charges for installing own generation capacity.
10. Improve labour/staff productivity by increasing training incentives and allowances and improving managerial, vocational and technical training opportunities in the country.
11. Improve the security situation in the country by strengthening the Police Service, community participation, and the legal and judicial system.
12. Improve land administration for establishment of new companies. 13. Construct serviced factory shells. 14. Speed up the process of issuing temporary employment permits. 15. Provide technical and financial support to ensure GTMA can fully represent
the industry and develop mechanisms to function more effectively. 16. Improve the capacity of the MRA to support EPZs. 17. Improve the rules on EPZs to allow them to sell a small part of their products
(preferably 10 per cent) on the domestic market. 18. Review the rules on EPZs with the garment industry so that they can become
more attractive to potential investors.

Malawi Economic Growth Strategy
Volume II 79/106
19. Improve the scope of EPZs to cover items that are necessary for the operation of EPZ businesses, such as office furniture and equipment, and to exempt these items from surtax.
12.8 IMPLEMENTATION
The above strategy is based on consultations with the industry stakeholders from the public and the private sectors through the value-chain work. The detailed implementation plan for the strategy and actions should be developed by the stakeholders and then implemented by them. Monitoring and feedback can be undertaken via the National Action Group or the Public-Private Consultative Forum.

Malawi Economic Growth Strategy
Volume II 80/106
CHAPTER THIRTEEN: THE AGRO-PROCESSING SECTOR28
13.1 INTRODUCTION
Agro-processing (which includes food processing) has been identified as a high growth potential sector in the country. The Malawi economy is predominantly agro-based on the processing tobacco, tea, sugar and cotton into the intermediate or finished products that represent over 10 per cent of the value added by the manufacturing sector. In addition, there are other agro-processing sub-sectors with potential for growth, but each of these is relatively small. The most immediate focal areas for growth in agro-processing are fruit and vegetables, cassava, rice and macadamia/tree nuts. There are also longer-term potential products such as pigeon peas (kobwe) and beans and other pulses. The breakdown of the different categories is given below.
Table 13.1: Contribution to Manufacturing GDP by Agro-processing category, at Constant 1994 prices, 1998-2002
1998
1999
2000
2001
2002*
K’ m Per cent
K’ m Per cent
K’ m Per cent
K’ m Per cent
K’ m Per cent
Agro-Processing
Tobacco 54.8 0.4 46.6 0.4 46.6 0.4 46.9 0.4 47.7 0.4 Sugar* 73.7 0.5 70.5 0.5 84.0 0.6 84.0 0.7 90.0 0.7 Tea 68.2 0.5 49.0 0.4 43.0 0.4 44.3 0.4 46.2 0.4 Beverages 239.6 1.9 227.3 1.7 226.6 1.7 242.0 1.9 262.5 2.1 All other food processing
244.1 1.9 189.9 1.5 198.5 1.5 215.0 1.7 168.7 1.3
Meat/Meat products
4.1 - 1.9 - 2.2 - 2.0 - 8.6 -
Dairy/Dairy products
3.7 - 3.0 - 3.2 - 6.4 - 6.6 -
Manufacturing GDP
1,691.4 13.7 1,717.3 13.4 1,748.7 12.8 1,696.1 11.6 1,455.7 11.5
Source: NSO, Economic Planning and Development, Ministry of Finance and RBM. * Estimate
13.2 CANNING AND PRESERVING FRUIT AND VEGETABLES
Malawi has a favourable climate for production of a wide range of fruits and vegetables that include citrus fruits, pineapples, guavas, bananas, apples, mangoes, tomatoes, onions, cabbages and Irish potatoes. As with most other countries, Malawi
28 “Agro-processing” includes food processing.

Malawi Economic Growth Strategy
Volume II 81/106
produces these products in large volumes on small-scale but highly seasonal basis. Most of this produce is eaten fresh or cooked in the home. Because seasonal supply often outstrips demand, a considerable amount of this output ends up wasted. This provides the basis for the interest of stakeholders in seeing how this surplus can be processed. The setting up of processing plants would appear to be a ready solution to this problem of surplus. There have been attempts to can fruit in the past, for example Mulanje pineapples, but these have not succeeded. This may be due to a combination of reasons that were situational, such as poor management or problems with supply, or a function of the time or structural inadequacy, such as poor infrastructure or the economics of canning. It is important to understand which of these applied, as it affects the viability of the idea. Malawi is not the first country to consider how to dispose of large quantities of wasted seasonal produce. Many other countries have considered this as they also have an abundance of fruit and vegetables and there would need to be some clear competitive advantage that Malawi has over these other countries to overcome its landlocked status and consequently higher transport costs. It has also been noted that Malawi is a high cost structure economy and this presents further problems with competitiveness against established producers. However, given the level of interest in Government about the possibilities for canning of fruits and even vegetables, it is important to examine the reasons for past failure and to determine if these can now be overcome. This same approach is required in other forms of food preservation or processing, such as drying or making fruit concentrates and jams. There is an important distinction between being technically able to use the large surpluses to make these products and the availability of a market that a Malawian product can supply at a competitive advantage and in a manner that is commercially viable. The domestic market has some potential for canned, dried or processed foods, but the levels of consumer demand for processed foods as opposed to consuming seasonal produce in its fresh state would appear to be limited to the urban middle classes. There are a limited number of relatively small-scale producers of food products, virtually all targeting local consumption or niche exports29, including ground and tree nuts, juices, preserves, honey and tomato/chilli products. For any new areas, proper viability studies are required, preferably in conjunction with potential investors and after further investigations with existing producers. Understanding the market potential and competitiveness of Malawi’s potential products will be the key to determining viability.
13.3 RICE PROCESSING
Malawi is able to grow rice in increasing quantities and has current capacity to mill and pack for consumer sale. Current production trends show fluctuations in
29 Like Alternative Trading Organisations

Malawi Economic Growth Strategy
Volume II 82/106
production ranging from 50,000 tonnes to 100,000 tonnes annually. Immediate prospects for the crop are good and the projected productions are for over 100,000 tonnes for the next five years. In light of this, Government is seeking business ventures to buy rice from farmers to process for onward exportation into regional markets. In this regard, Government would like to take advantage of this by exporting more rice into the regional/international market through the Nacala Corridor. While most grain crops do not present inherent investment opportunities in Malawi as the cost of production and transportation, in particular, reduce their comparative advantage and offer only high-risk returns, rice production has possibilities for increased investment in the districts of Zomba, Machinga, Mangochi and the Lower Shire Valley. The cost of growing rice in Malawi is estimated to be lower than the cost of other immediate competitors, though this needs to be verified. Specific opportunities exist in the Southern Region along the Shire River as well as on the shores along Lakes Malawi, Malombe and Chirwa. Further, Malawian rice has a good reputation for quality and aroma that has benefited from extensive inputs from the Taiwanese.
13.4 CASSAVA
Malawi grows an increasing amount of cassava, which is mostly consumed by subsistence farmers or sold as a supplementary cash crop. Production of cassava has increased tremendously in Malawi over the last ten years. Rising from 168,000 metric tones in 1991, cassava production appeared to have reached a remarkable level of 3.4 million tonnes in 2001, but has subsequently been revised down to a more realistic 1.6 million tonnes based on recording dry weight.30 Projections are that the commodity will continue to experience rising production levels for the foreseeable future. Cassava can be processed into a wide variety of products, such as animal feed, starches for industrial use, and also for inclusion in food products. Raiply is currently processing cassava into wood glue for making plyboard and other composite wood products, mainly for their own use as import substitution. Raiply is looking to invest in further cassava processing plant and increasing output of glue. Cassava is one of several crops being considered for generating ethanol because of an inadequate supply of molasses. Cassava pellets are used for animal feed in Europe, but this would be a long-term aim, as it requires high levels of investment. Other applications of cassava should be considered, given the crop’s relative abundance. The economics of production need to be considered as most of the cassava currently finds a ready market for local consumption, especially by poor households. There may be problems in relying on smallholder production to feed a commercial plant as the crop may be diverted for consumption if there are general problems with other food crops. Also, supply might not be stable as farmers could switch to other crops.
30 The confusion in the data for root crops was over whether they were recording dry or fresh weight.

Malawi Economic Growth Strategy
Volume II 83/106
Therefore, there are suggestions that it may need large-scale estate growing to increase productivity, produce it in sufficient and regular quantities and make it commercially viable if it is to be commercially processed. This needs to be analysed carefully.
13.5 MACADAMIA AND OTHER TREE NUT PROCESSING
Malawi can grow a range of tree nuts, particularly Macadamia and Cashew nuts. The markets are growing and the prices are relatively attractive. Currently the commodity is exported primarily to South Africa and Europe. In addition, Malawi has a favourable climate for production of Macadamia nuts, currently producing about 10,000 metric tonnes on two main estates. Since there is potential for expansion of production to take advantage of the available market opportunities, Malawi is seeking investors in production and exportation of this commodity. The development of these initial agro-processing and food processing products could open up other opportunities, particularly if the domestic market grows as real per capita incomes increase.
13.6 OTHER POTENTIAL FOOD PROCESSING INVESTMENT AREAS
Malawi produces a limited number of processed food products for direct consumption. The industry is centred on a relatively small number of companies, such as Universal Industries (biscuits, snacks), Tambala Food Products (condiments, dried products, etc.), Rab Processors (teas, nuts, maize) and Nali (chilli/other sauces). In addition, there are several businesses that focus on milling, particularly maize which is in high demand domestically (Grain and Milling) and oil extraction and processing (Blantyre Milling). Over time, it would be possible to envisage growth potential in the food-processing sub-sector in such segments as breakfast cereals, margarine, fruit concentrates/jams/honey, spices processing and packaging, and food condiments.
13.7 CONSTRAINTS
Listed here are the major constraints to the development of the agro-processing sector.
1. High interest rates, inadequate availability of capital for investment, and inadequate agricultural credit to buy agricultural inputs.
2. Weaknesses in the marketing and distribution systems to purchase raw crops from farmers and supply them to agro-processing companies.
3. Low productivity of smallholders due to poorly organised farmer groups, poor prices, limited use of input by farmers, and weak provision of extension support to farmers.
4. Low and unstable supply of agricultural crops as raw materials to agro-processing industries.
5. Intermittent supply and high cost of utilities.

Malawi Economic Growth Strategy
Volume II 84/106
6. Low mechanization and technology adoption and use. Although few farmers are able to use and maintain farm machinery or even animal traction units, they need intensive support and training.
7. Weak incentives for agro-processing and food processing companies. 8. Low trained human resources in management, vocational, and technical skills.
13.8 STRATEGIES
The main strategies and actions for the agro-processing sector are:
1. Reduce interest rates and improve availability of capital for investment and raw materials to processors.
2. Improve macroeconomic situation through measures highlighted in cross-cutting constraints on economic growth.
3. Establish specific agricultural credit schemes run by private sector firms or specialist MFIs/NGOs funded by Govt./Donors for smallholders.
4. Improve the marketing and distribution system through:
• Better information to be made available to buyers and sellers. • Better rural infrastructure to allow access to sources of supply. • A framework for contract farming between buyers and farmers.
• Training of traders in marketing and the importance and aspects of marketing system.
5. Improve the productivity of smallholders farmers by:
• Increasing producer price incentives and strengthen contract farming between farmers and processors.
• Encouraging organisation of smallholders into clubs and associations.
• Providing incentives for promoting small-scale irrigation.
• Reviewing the viability of recent private sector arrangements for delivering technical extension to farmers and adopt them if acceptable.
6. Better organisation of farmer groups by adopting arrangements like those used by NASFAM as well as establishment of co-operatives.
7. Improve mechanization, technical support and technology adoption by farmers through:
• Stimulating private sector involvement in provision of mechanisation and new technologies.
• Developing intermediate technologies that can be made widely available at low costs, such as treadle irrigation.
• Reviewing the options for enhancing research and technical support in closer partnership with the private sector.
8. Improve incentives for agro-processing companies and new investors. 9. Improve infrastructure. 10. Increase number of trained human resources in management, vocational and
technical skills by, amongst others,
• Rehabilitating and increasing the number of technical and vocational training and colleges and facilities and business management studies; and

Malawi Economic Growth Strategy
Volume II 85/106
• Introduce vocational and technical training and business management studies courses at primary and secondary school curriculum.
11. Promote and intensify commercial large-scale agricultural farming to provide an adequate and stable supply of agricultural raw materials to agro-processing companies.
On the cassava cluster of products specifically, there is need to develop and disseminate improved technologies for farmers and attract private investment in the manufacture of industrial starch from cassava. To achieve this, there is need to:
1. Develop high-yielding mosaic-resistant and mealy bug-resistant cassava varieties, ecologically sustainable methods of controlling pests and diseases, and improved crop management practices that are affordable to resource-poor farmers.
2. Develop improved production practices and methods of storing, processing, and utilizing cassava roots so as to improve the commercial value of the crop.
3. Accelerate the transfer of improved cassava production and utilisation of cassava through closer linkage and training of extension staff and farmers.
4. Attract a private investor to manufacture industrial cassava starch.
13.9 IMPLEMENTATION
There is a need for the agro- and food-processing stakeholders in each sub-category to develop an implementation plan. Whilst there are some synergies in different types of processors getting together to discuss the broad issues for processors, in general there is a need for the specific categories of processors to discuss their particular sub-sector within agro-processing and develop their own implementable plan. This will ensure relevance and ownership. As with other sectors there needs to be a mechanism for ongoing implementation that allows a flexible response to new opportunities and threats in a dynamic environment.

Malawi Economic Growth Strategy
Volume II 86/106
CHAPTER FOURTEEN: THE TOURISM SECTOR
14.1 INTRODUCTION
Tourism has been identified as one of the high growth potential sectors for Malawi because it is one of the high growth sectors in countries worldwide. Malawi has a range of attractions that can contribute significantly to growth in the country but they are generally underdeveloped.
14.2 PERFORMANCE
According to immigration data, the number of tourists rose from 57,702 in 1975 to 266,000 in 2001, representing an average growth rate of 6.3 per cent per annum. Most of these tourists (65 per cent) come from neighbouring countries to visit their friends and relatives, engage in cross-border trade, or work for donor/NGOs. The remainder are estimated to come for leisure and sightseeing at such as attractions as Lake Malawi, Mulanje Mountain, national parks and game reserves, and others. The estimated contribution to foreign exchange by tourism was K2.6 billion in 2001 (1.8 per cent of GDP). Tourism has a potential to grow at an average 8.0 per cent for the next five years to 2008. This growth is based on promoting high-spending tourism from North America, Europe, Asia, Australia and New Zealand and South Africa and the need to develop the product in the country. It is projected that high-yielding tourists will grow at 14 per cent over the next five years from 38,000 in 2003 to 76,000 in 2006 (per table 13.1 below).
Table 14.1: Projected Tourist Arrivals for Eco-Lodge Investment, by Source Country, 2002- 2006
2002 2003 2004 2005
2006
South Africa 12,400 14,200 18,400 24,200 30,000
United Kingdom 12,050 13,650 16,650 20,900 26,000
Australia/ NZ 2,500 2,700 3,100 3,700 4,500
Germany 2,550 2,850 3,450 4,700 6,000
Other European 5,500 5,500 6,300 7,900 9, 500
Total 35,000 38,900 47,900 61,400 76,000
Source: MTPW Five-year strategy
Tourist accommodation includes large hotels, lodges and guesthouses in urban areas and a limited number of forest lodges, game park lodges, and campsites in rural areas. Currently, Malawi has 160 registered tourist accommodation units offering

Malawi Economic Growth Strategy
Volume II 87/106
3,572 rooms plus 14 campsites. Three of the formal accommodation units have more than 100 rooms, 24 per cent have 10 or fewer rooms, and only three lake resorts offer accommodation suitable for international tourists. There is a lack of critical mass of accommodation for leisure or recreational visitors. To develop this segment of the tourism, there will be need to upgrade and increase existing accommodation facilities in appropriate locations. These efforts need to be supported by comprehensive marketing strategies to increase tourism.
Table 14.2: Visitors to Malawi by Type of Accommodation 1995 1996 1997 1998 1999
‘000 Per cent
‘000 Per cent
‘000 per cent
‘000 Per cent
‘000 Per cent
Hotel 35.2 20 46.0 25 44.1 21 53.2 24 57.3 23 Rest House 38.7 14 60.5 18 65.2 21 44.2 20 465 18 Private House 35.1 31 24.8 33 23.9 32 62.6 29 75.1 30 Other 64.0 35 52.5 24 74.1 27 59.7 30 75.4 30 Total 173.1 100 183.8 100 207.3 100 219.7 100 254.3 100
Source: Department of Tourism
Government has been a significant investor in the accommodation sector, providing initial investment capital for most of the major city centre and tourism hotels. Through the Malawi Development Corporation (MDC), it is one of the investors in the new Namiwawa Hotel in Blantyre, in a joint venture partnership with the private sector (Legacy Hotels & Resorts). MDC has also expressed an interest to invest in the development of a new lakeshore hotel at Cape Maclear. Private sector investment in tourism accommodation was low in the past and focused on smaller developments. The key issue is therefore how to stimulate more substantial investment by private sector. On product development, the central thrust of the MTPW strategy for the tourism sub-sector is to establish Malawi as a principal and leading eco-tourism destination through a strategic and phased development of upmarket eco-lodges to be located throughout the country in identified sites. The target is to establish an additional 210 rooms in the first three years and another additional 320 rooms over a longer period of time. Pre-feasibility studies have already been undertaken on the initial five sites with conceptual designs for the lodges. Development of the initial projects is estimated to generate additional foreign exchange earnings of $19 million annually by the end of year 2007 for an initial capital investment of around $10 million. This would require a more aggressive set of incentives for new investment and refurbishment of existing facilities. The climate for investment and other tourism infrastructure and business operations in the tourism sector needs to be dramatically improved if Malawi is to attract investment in eco-tourism. Government is already a major investor in tourism, particularly hotel accommodation through MDC and Sunbird. The mandate of MDC is to invest in areas that private sector is not willing or able to invest and after developing the investments and opportunities to sell them off. Private sector tourism investment
Malawi Economic Growth Strategy
Volume II 88/106
has been low. It is, however, expected that by introduction of more attractive incentives to be offered for the sector, it will improve. Government could consider making available investment funds to open up new opportunities through a special fund that will then be concessioned to private management. The fund is meant to stimulate investment and dispose of the investments once they are profitable/mature, thus providing resources for future investment. The envisaged fund would be managed by a statutory body like MDC. Potential sources of finances for the fund could be any one or combination of the following:
1. Funds from the privatisation programme. 2. Direct substitution of the drought levy with a tourism levy on fuel. 3. MDC funds from disposal of existing tourism investments. 4. Receipts from sale of licences and concessions to operate in National Parks.
Rehabilitation of selected national parks and game reserves in terms of restocking, improving all weather access, and improving security to reduce poaching (and minimize human-animal conflict) are also key to making the tourism product more attractive. Systems for ensuring the long-term protection of wildlife and habitat are as important as the restocking and need to be in place first. Another key consideration is human resources development and training. A hospitality college to ensure that training is properly undertaken will be implemented as an expansion programme to the existing Malawi Institute of Tourism (MIT). Other related regional training institutions in hospitality business are also proposed for Lilongwe and Mzuzu using existing facilities. There is need to ensure that Malawi Institute of Tourism can attract the best candidates for the industry in terms of qualifications and attitudes. This may require a review of how to fund candidates that have high potential but limited resources. There is also a pressing need to provide a programme for training of trainers. Without a high standard of trainers, it will be difficult to ensure high standards amongst trainees and the industry at large. In order to ensure proper planning and monitoring of the tourism sector, there is need to set up a tourism information base to assist both public and private sectors. Studies have already been undertaken and costing done for implementation of this strategy. Initial equipment has already been put in place. Information can also play a role in responding quickly and accurately to negative publicity like the maize shortages, flooding and sporadic attacks on tourists.
14.3 CONSTRAINTS
The tourism sector is constrained by many factors. These can be segmented into two categories: constraints that affect the numbers of tourists coming to Malawi and those that limit further development of the sub-sector.

Malawi Economic Growth Strategy
Volume II 89/106
14.3.1 Constraints to Visitation
1. Poor international access and high cost of getting to Malawi. 2. Poor transport infrastructure to tourist attractions. 3. Low attractiveness of national parks because of low numbers of wild animals. 4. Perception of health risks of outbreaks of diseases such as bilharzia and
malaria along the beaches of Lake Malawi, as well as perceived high rates of HIV/AIDS.
5. High cost of hotel accommodation and services due to high operating costs, high import dependency, and taxation.
6. Poor development and standard of lakeshore sites and accommodation units. 7. Insufficient and ineffective destination marketing efforts and strategy. 8. Poor quality of service due to inadequately trained personnel and poor
management. 9. Negative publicity about tourists’ security and incidence of famine and
diseases. 10. Uncoordinated approach to tourism promotion by the industry.
14.3.2 Constraints to Development of the Sector
1. Lack of legal framework and weak incentives. 2. Poor infrastructure to access tourist attractions; poor supply of potable water,
electricity, telecommunications and Internet connectivity; and poor waste treatment.
3. Poor macro-economic situation manifested in high interest rates, high inflation, and unstable exchange rates.
4. Poor marketing of investment opportunities. 5. Inadequate statistical base for decision-making.
14.4 STRATEGIES
There is a need to dramatically improve the tourism product and its attractiveness as well as find ways to make the cost and pricing structure more competitive. The MTPW has developed a five-year strategy that seeks to reposition Malawi as an eco-tourism destination, as well as to improve the tourism product and to enhance the attractiveness of the country to investors.31 The sub-sector strategy needs to be read in the light of this document. Strategy 1: Improve international access and reduce the cost of airfares by:
1. Completing the privatisation of Air Malawi to improve efficiency. 2. Reviewing and reducing the factors contributing to high cost of international
flights, including the relevant taxes (landing fees, aviation fuel, etc.). 3. Exploring ways to attract more international carriers to fly directly into
Malawi from Europe and South Africa. 4. Implementing the Yamoussoukro decision in 2003.
31 Strategic Tourism Development Plan, Final Report 2002

Malawi Economic Growth Strategy
Volume II 90/106
Strategy 2: Improve the state of internal infrastructure by:
1. Prioritising the roads maintenance programme for roads leading to key tourist attractions to ensure they are passable all year round.
2. Constructing and improving domestic landing facilities key national parks, specifically Nyika and Liwonde National Parks.
3. Developing an international airport in Mangochi district. 4. Reviewing existing port infrastructure on Lake Malawi to improve services. 5. Developing telecommunications, Internet access, and solar power as back up
to erratic power supply in eco-lodges. Strategy 3: Improve the attractiveness of national parks by increasing the
numbers of wild animals through restocking plans for prioritised national parks with highest tourism potential once protection is effective.
Strategy 4: Strengthen protection of wild animals against poaching by:
1. Improving legal enforcement. 2. Continuing co-management practice with local communities surrounding the
national parks. 3. Providing adequate resources to the Department of Parks and Wildlife.
Strategy 5: Reduce the perception of health risks by:
1. Regularly testing main affected tourism destinations and publishing the test results, in co-operation with private sector operators.
2. Undertaking concerted action between Government through the Ministry of Health and Population and the private sector to eradicate diseases like bilharzia and malaria.
3. Providing better information for visitors on arrival, at destinations, and on departure through the websites, posters, leaflets and in-room information.
4. Ensuring easy availability of medical treatments for tourists. Strategy 6: Rationalise the pricing system for hotel accommodation and services
to be competitive within the region by:
1. Undertaking a study into the costs, prices and tax structure of the industry in comparisons with regional competitors.
2. Reviewing the structure of the tourism levy, taxes, and managerial efficiency.
Strategy 7: Improve the development of eco-lodges along the Lakeshore by:
1. Undertaking a study to re-zone the lakeshore and other high tourist potential areas.
2. Strictly enforcing the re-zoning set up by Regional Development Control Committees to oversee approval for developments at district level.

Malawi Economic Growth Strategy
Volume II 91/106
Strategy 8: Increase destination marketing by:
1. Creating a statutory authority with effective private sector representation as per the Tourism Development Plan.
2. Increasing Government funding for marketing and creating additional mechanisms to enhance co-operation on marketing between private sector businesses and between private and public sectors.
Strategy 9: Improve the quality of service through:
1. Consultation on MTPW’s proposed Human Resource Development Plan. 2. Implementation of the Department of Tourism’s Human Resources
Development Plan. 3. Enhancement of a service culture in the industry, including a review of the
structure of the service charge.
Strategy 10: Reduce negative publicity through:
1. Effective use of a public relations agency . 2. Provision of proper information from DoT/MTA. 3. Raising awareness within Government of the negative effects of certain
policies and statements. Strategy 11: Strengthen co-ordination in the industry through:
1. Effective public/private co-ordination over major conferences, including improved reception arrangements at points of entry.
2. Encouraging membership in the Malawi Tourism Association. 3. Ensuring financial stability of the MTA through long-term agreement to
collect the levy. Strategy 12: Review and improve legal framework and investment incentives for
tourism promotion through:
1. Enactment and implementation of a new Tourism Promotion Act. 2. Development of specific investment incentives for tourism businesses
investment that are comparable with those for other countries in the region. 3. Guaranteeing of the incentives in a new Investment Act. 4. Improving the process for investment incentive approvals, particularly in
relation to allocating land. Strategy 13: Creation of a Malawi Tourism Investment Fund.
Strategy 14: Improve domestic infrastructure by:
1. Providing investment incentives for local water treatment and for power supplies such as solar energy.
2. Cooperating with utilities to prioritise investment for tourism areas (e.g. digital exchanges).

Malawi Economic Growth Strategy
Volume II 92/106
3. Increasing training of investors in environmental management and waste disposal.
Strategy 15: Improve the macroeconomic situation by undertaking the macroeconomic measures highlighted in Cross-cutting Constraints to Economic Growth (Chapter 2).
Strategy 16: Improve marketing of investment opportunities by running an investment conference to promote specific opportunities and regular investment events to promote specific and general investments; and by making more effective use of websites and diplomatic missions abroad.
Strategy 17: Improve the statistical base for decision-making through the acquisition of appropriate hardware and software and through developing a human resource base with skills in data analysis and database management.
14.5 IMPLEMENTATION
Due to the cross-sectoral nature of tourism, there is a need for cooperation and coordination of various ministries, public sector institutions, and private sector firms and representatives to facilitate growth in this sector. Several advisory committees and task forces have been proposed to facilitate growth. These are:
• Policy Committee • Tourism Planning Committee
• Tourism Marketing Committee • Licensing and Standards Committee
• Malawi Eco-tourism Unit To ensure high-level commitment and facilitation of crucial decisionmaking in the process of growth stimulation in the tourism sector, it is proposed that a Tourism Council should be formed. Its members would include Ministers of key ministries and it would be headed by the Vice President. This would be similar to that operating in Mozambique, which has stimulated tourism development in that country. There is also a pressing need to more actively engage the private sector in all policy decisions affecting the industry and in the implementation of policies and practices. Many of the issues affecting tourism are given low priority in Government thinking. The resources available to the MTPW are a reflection of that lack of priority, yet tourism has the potential to significantly contribute to GDP, employment and foreign exchange earnings. Inclusion in this Malawi Economic Growth Strategy is part of that process to raise the priority accorded to tourism. The tourism stakeholders in the private and public sectors are key to the implementation plan. If the climate for investment and business operations does not

Malawi Economic Growth Strategy
Volume II 93/106
improve, then the industry will continue to see only modest growth rates and not realise its full potential. Tourism stakeholders have already begun to work together more constructively through the initiatives of MTPW, MTA and the recent value-chain work, which is looking at training and incentives. It is proposed that once the tourism sector strategy has been agreed, the key stakeholders should agree on a detailed implementation plan and process to make it a reality. The strategy for the tourism sector has already been widely circulated for direct input by the stakeholders and this provides a high degree of commitment to implementation.

Malawi Economic Growth Strategy
Volume II 94/106
CHAPTER FIFTEEN: REFOCUSING OF PUBLIC SECTOR INSTITUTIONS
15.1 INTRODUCTION
The public sector has an important role to play in the economy through providing a legal and regulatory environment, correcting market failures, stabilising the economy and ensuring equal distribution of income. These roles require active cooperation between the private sector and the public sector and a much more constructive relation. This requires more direct engagement between the two main sectors to better understand the issues from both perspectives before formulating joint approaches that are acceptable to all. The roles of public sector institutions will need to be focused on the Malawi Economic Growth Strategy, and adequate resources will need to be allocated for the effective implementation of these roles. The main categories and institutions involved in the Strategy and the proposed institutional changes are discussed below. These are classified as support organisations, regulatory/enforcement agencies, and development finance institutions.
15.2 SUPPORT ORGANISATIONS
Among the important support organisations are:
• Development of Malawian Entrepreneurs Trust (DEMATT)
• Malawi Investment Promotional Agency (MIPA) • Malawi Export Promotional Council (MEPC)
• Malawi Entrepreneur Development Institute (MEDI) • Malawi Industrial Research and Technology Development Centre
(MIRTDC) • Small and Medium Enterprise Development Organisation of Malawi
(SEDOM) On MIPA and MEPC, there is need for Government to implement the merger of the two institutions as indicated in budget statement 2001/02 fiscal year. This will greatly promote investment and export activities in the country. As one way to strengthen business and entrepreneurial skills and management, Government set up a number of business training institutions, including MEDI, SEDOM, and DEMATT. The capacity of these institutions to discharge their duties needs to be strengthened. In the case of SEDOM, GoM needs to provide more financial resources for small- and medium-scale business promotion. The original mandate of DEMATT as a training institution for the development of small- and medium-scale entrepreneurship has to be reinstated.
Malawi Economic Growth Strategy
Volume II 95/106
MIRTDC focuses on technology research and transfers. This focus needs to be aligned with the Strategy.
15.3 REGULATORY/ENFORCEMENT AGENCIES
This section focuses on the Malawi Revenue Authority (MRA) and the Malawi Bureau of Standards (MBS). The MRA is responsible for tax administration. While tax collection has improved, there is still a lot of scope to increase tax revenue collection. MRA needs to identify and track all eligible taxpayers and ensure that they are paying taxes. They can subcontract this duty to other institutions like city and town assemblies to collect taxes from the informal traders at city markets and properties including residential houses because the city assemblies have information on approved city and town development plans. MRA should also improve the processing procedures for duty drawback schemes. There is a need for more focus on businesses that are evading tax and to deal effectively with corruption. There is also a need to consider how to enforce the rules for those businesses that persist in evading tax (see section on the macro-environment) and for dealing with corruption by businesses of MRA officials (and vice versa). MBS provides an important role for ensuring that the manufactured products in the country are of high quality and meet international standards. However, its capacity should be strengthened to ensure that it is able to efficiently and effectively carry out this role.
15.4 DEVELOPMENT FINANCE INSTITUTIONS
The role of development financing is to provide long-term capital for investment in viable sectors/sub-sectors in the economy. Malawi set up the Malawi Development Corporation (MDC) and INDEbank to fulfil this role. However, the capacity of these institutions to discharge this task has weakened and they have also diverged away from their original mandate. There is, therefore, to reinstate the original mandates of these two institutions and either recapitalise them or find equity partners for them. On micro-finance for small and medium scale enterprise promotion, there is need is establish private sector managed or specialist micro-finance institutions to provide microfinance to small-scale enterprises efficiently. There are now a range of specialist micro-finance providers in Malawi who are better able to manage credit funds targeted at micro and small businesses than Government-owned ones.

Malawi Economic Growth Strategy
Volume II 96/106
15.5 THE PUBLIC SECTOR INVESTMENT PROGRAMME
As part of efforts to promote high economic growth, there will be need for public investment in roads, utilities, and other public infrastructure. To achieve this, Government resuscitated the Public Sector Investment Framework (PSIP). The PSIP framework should prioritise investment by the public sector in the high economic growth potential sectors that are prioritised by this Malawi Economic Growth Strategy to ensure that Government priorities are harmonised. The PSIP is a five-year rolling plan for guiding and prioritising public sector investment in the country. It comprehensively lists all new and ongoing high priority social and economic development programmes and projects in the country. 15.5.1 Ministry of Finance
Tax policy affects the economic growth through changes in resource allocation, investment and income distribution. High taxes may lead to inefficient resource allocation and discourage investment that leads to low economic growth. Income distribution might also worsen. It is, therefore, necessary for Government to reform the tax system so that it promotes high economic growth in the country. The Ministry needs to ensure that tax policy is formulated based on sound economic analysis shared by all stakeholders. 15.5.2 Ministry of Commerce and Industry
Given that the Ministry of Commerce and Industry (MoCI) is the core government ministry in terms of private sector development, sound implementation of this Malawi Economic Growth Strategy will demand revamping MoCI so that it can steer the implementation of this strategy. The proposed way forward is to create trade desk officers in MoCI for each of the prioritised sectors to ensure greater specialisation and that the Ministry should create adequate capacity to support discussions in the technicalities of each area. These individuals can also act as a focal point for enquiries from the industries. The Ministry also needs to have the capacity to negotiate trade issues professionally and to achieve this, there would be need for direct access to lawyers specialised in trade issues. 15.5.3 Ministry of Agriculture, Irrigation and Food Security
To support the implementation of the Strategy, there is need for the Ministry to set up individuals/sections that should specialise in the main crops that have high potential economic growth in the country. These officers should intimately understand the issues for tobacco, tea, sugar, cotton, maize and cassava (and possibly others). These persons/people could ensure that relevant issues are raised in Ministry and in other parts of Government to ensure that they are easily addressed. These officers could also act as a focal point for enquiries from within and outside the industry, such as from potential joint venture partners.

Malawi Economic Growth Strategy
Volume II 97/106
CHAPTER SIXTEEN: THE PRIVATE SECTOR INVESTMENT
STRATEGY
16.1 CURRENT SITUATION
The private sector investment strategy focuses on addressing general weaknesses in the investment climate that would stimulate investment in the prioritised sectors. Increased private sector investment creates the capacity to undertake more trade in goods and services both domestically and internationally that will lead to sustainable economic growth. The Malawi Investment Promotion Agency (MIPA) was established in 1991 under the Investment Promotion Act 1991 to stimulate inward investment and became fully operational in April 1993. Through MIPA, investors can access general incentives and export incentives, including Export Processing Zones (EPZs). Between 1993 and 2001, MIPA facilitated a total of $163.9 million of foreign direct investment (about $20 million per year), much of it from South Africa. This is a tiny proportion not only of world investment flows, but of Africa’s as well32 and not sufficient to generate the targeted growth rate of 6 per cent per annum. UNIDO33 calculates that an average growth rate of 7 per cent per year would require an investment rate of 33 per cent of GDP including domestic savings and Overseas Development Assistance. However, average investment for Malawi was only 15-15.5 per cent between 1980-97 and recent investment levels are below this average. There is a general decline in investment in the manufacturing sector attributed to the poor macroeconomic environment, which will be addressed through the macro-environment strategy, which covers:
• Stable macroeconomic environment; • Investment incentives;
• Appropriate and functioning economic and social infrastructure; • Financial sector reforms; • Capital market development; and
• Appropriate legal and regulatory framework for domestic and foreign investment.
In addition, the political climate is critical because investors will not invest if there is a significant risk of social and political instability34.
16.2 PRIVATE SECTOR INVESTMENT CONSTRAINTS
Despite the efforts made by MIPA, the legal and regulatory framework for investment in Malawi has serious weaknesses that have affected the level of inward
32 $400 billion/year for the World and $8.3 billion for Africa according to UNDP/UNIDO Project Document MLW/02/010/08/37. 33 Foreign Direct Investor Perceptions in Sub-Saharan Africa, 2002. 34 The forthcoming elections present a potential risk factor for investors.

Malawi Economic Growth Strategy
Volume II 98/106
and domestic investment. This section will focus only on the sectoral and micro levels. 16.2.1 Sectoral Constraints
The major sectoral level constraints include the following:
• Existing incentives are inadequate to offset the high cost structure of the economy;
• Domestic investors are not provided with adequate incentives;
• Corporate tax waivers favour new investors over existing firms in the same business and creates artificial competitive advantages for new entrants when granted;
• Current incentives are inappropriate for some of the priority sectors such as mining and tourism;
• Incentives have been ineffective in preventing the steep decline in manufacturing;
• Process for investment incentive approval is too slow, uncertain, not transparent and discretionary; and
• Domestic market is relatively small compared to other countries.35 16.2.2 Micro-Level Constraints
The major constraints at micro-level include the following:
• The EPZ regime is not properly supported by government particularly in the textile and garment industries; and
• Lack of skilled labour because of insufficient investment in training, research and development, design and quality control.
16.3 INVESTMENT PROMOTION STRATEGY
There are a lot of challenges for Malawi to revive the private sector but this can be achieved through the following Action Plan: Action 1: Ensure that the Cabinet Committee on the Economy (CCE) actively
discusses the issues of investment and exports. On investment and export promotion, the CCE will:
• Receive, approve and guide the investment and export strategy;
• Consult captains of industry, senior government officials; • Regularly review reports on investment and trade;
• Give direction for sustaining a ‘Big Bang’; and
• Ensure that incentives are properly structured and an ideal investment climate is created for private sector growth.
35 UNIDO’s 2002 survey suggests that the domestic market size is a major factor for inward investors.

Malawi Economic Growth Strategy
Volume II 99/106
Action 2: Review the concept of Export Processing Zones and integrate it into a more versatile Malawi Multi-facility Industrial Zone (MMIZ) that will provide facilities for all targeted industrial projects whether or not the products are 100 per cent export.
Action 3: Identified industries should be packaged for promotion. Government should ensure that appropriate linkages are established between the identified industries (textiles) and selected high potential crops (cotton, cassava, maize, tobacco, tea and sugar). In addition, government should ensure that skilled labour is available in order to improve productivity.
Action 4: Promote actions that create confidence among investors including the signing of investment guarantee agreements and double taxation agreements with capital- and technology-exporting countries.
Action 5: Maximise investment and export promotion efforts by engaging embassies and high commissions located in capital- and technology-exporting countries.
Action 6: Intensify investment promotion efforts through the establishment of a “Friends of Malawi” club among existing foreign investors in Malawi; roundtable meetings in their home countries should be encouraged.
Action 7 Announce a Malawi Investment and Export Vision Implementation Period (MIEVIP) in tandem with the launch of the MMIZ preferably for the period beginning 2004-06.
Malawi Economic Growth Strategy
Volume II 100/106
CHAPTER SEVENTEEN: IMPLEMENTATION The Malawi Economic Growth Strategy is multisectoral and covers a considerable range of detailed technical analyses of eight sub-sectors including the macro-economy, the legal and institutional framework, trade and investment issues, and the role of public sector institutions. However, a strategy is only as good as its implementation. The traditional method used by many governments and corporate businesses to implement strategies was to work out a detailed action plan centrally, delegate the tasks within the organisation/structure and then monitor the implementation. This approach has several disadvantages, which include:
• The technical complexity of a sector can be misunderstood, often leading to the design of inappropriate actions;
• Ownership of the strategy and its implementation is weak beyond those who drafted it; and
• There tends to be an unrealistic appraisal from the centre of what can be achieved given the constraints and operating conditions on the ground.
Modern management suggests that the full involvement of those who have to implement actions is critical to success. The Malawi Economic Growth Strategy has been developed by stakeholders in the public and private sectors. Participation has been in the drafting, the prioritising of high potential sectors and core sectors, and in the preparing of the Implementation Action Plans. Some of the Action Plans have already been developed and are awaiting operationalisation while the remaining are being developed by stakeholders in the selected high potential sub-sectors. Each of the strategy sections of the Malawi Economic Growth Strategy can be read as a freestanding strategy, for its specific stakeholders to address. However, it is also necessary for the linkages between the various sub-strategies and their contribution to the overall Growth Strategy be clear to all. The benefit of segmenting the Growth Strategy into these sub-strategies is in the implementation process described below. Political will to achieve growth is central to the implementation of the Malawi Economic Growth Strategy; without it the Growth Strategy simply cannot be successfully implemented. It is proposed that the most appropriate Champion would be the Presidency, supported by the Cabinet and the Cabinet Committee on the Economy. The Ministry of Economic Planning and Development would take the leading role in coordinating, monitoring and evaluating the implementation activities of the Growth Strategy. The Public Sector Investment Programme will be a key tool in directing resources in support of the Growth Strategy. MEPD will work alongside the National Action Group to sustain the momentum behind the design process of the Growth Strategy. The key mechanism for delivering the Strategy is through the establishment of 12 Working Groups, one for each of the

Malawi Economic Growth Strategy
Volume II 101/106
12 sub-strategies that together form the Growth Strategy. Of great importance is that these Working Groups represent a coalition of the three groups of stakeholders, i.e. public sector, private sector and international development partners. The Working Groups are therefore important forums for private/public dialogue and concerted action. Each Working Group has a ‘Champion’ as the focal point of contact and as the person accountable for progress. The immediate reporting of progress would be to MEPD and NAG jointly, as well as referring on issues that the stakeholders could not resolve themselves, such as policy decisions or cross-cutting issues. This process would be coordinated on a day-to-day level by a joint Secretariat of MEPD, NAG and other key organisations like MoCI and MoAI that are critical to the implementation of the Strategy. International development partners are collectively involved through their support for the PSIP and as members of the National Action Group/Malawi Economic Growth Consultative forum. Individual Development Partners are involved in the Working Groups that relate to areas of interest and expertise. For example UNDP and UNIDO have a particular interest and involvement in the Private Sector Investment Working Group, given their particular expertise and current project involvement. This is a fast moving process. It is still evolving and there is a need to retain flexibility in the implementation process to deal with new and unforeseeable issues that could arise. If a particular group or arrangement is not working, then there should be the willingness to make changes to ensure that the overall Strategy is delivered. The Growth Strategy itself will need to be regularly reviewed in the light of progress made and wider developments in the international and domestic macro-environment. The critical issue is to start a process of change that delivers benefits for the various stakeholders. Delivering early changes will build confidence in the process and lead to the full commitment and engagement of all stakeholders. All the stakeholders that have been involved in the development of the Growth Strategy believe that it can be implemented and, if it is implemented, that it will deliver the Growth and Empowerment that is needed for the benefit of this Nation and its people.

Malawi Economic Growth Strategy
Volume II 102/106
Figure 17.1: Framework for Implementing the Growth Strategy
Presidency ‘Champion’
Cabinet
Cabinet Committee on the Economy
Macro Strategy Working Group
Trade Strategy Working Group
Private Sector Investment
Working Group
Public Support Institutions
Working Group
8 Sub-sector Strategy Groups
Public Sector:
• Min of Fin.
• Line Ministries: MCI, MoAI etc
• Implement Agencies: MRA, RBM, MIPA/MEPC etc
• Public Enterprises: ESCOM, ADMARC, MTL etc.
Private Sector:
•Utilities/Finance/ Communications
•Natural Resources
•Agriculture
•Manufacturing
•Services
•Distribution/ Transport
MEPD National Action Group Public/Private/Development Partners
PS
IPP
SIP
ReportReport
ReportReport
International Development Partners
Joint MEPD/NAG SecretariatD
irect
Acc
ess
Mon
itor

Malawi Economic Growth Strategy
Volume II 103/106
APPENDIX 1: DRAFT INVESTMENT INCENTIVES
1. Tobacco Draft Investment Incentives To be proposed following discussion by the key stakeholders. 2. Tea Investment Incentives To be proposed following discussion by the key stakeholders. Main areas will emphasise investment incentives for irrigation, refurbishment and replanting as well as for investment in social infrastructure in substitution for Government spending. 3. Sugar Investment Incentives The following incentives are designed to stimulate additional investment in sugar growing and processing and to encourage a shift to higher value-added sugar products. 1. 100 per cent investment allowances on capital expenditure directed at factory
expansion and upgrades to improve product, packaging, quality and hygienic standards in the manufacturing process.
2. Exemption from Non-Residence Tax on foreign currency loans used to fund factory and agricultural expansion and to fund development of smallholder grower schemes.
3. Investment social infrastructure should be granted a 100 per cent allowance for corporation tax purposes. This will enable the sugar industry to further invest in social infrastructure and create a stronger incentive to retain manual operations and sustain employment. Such allowances would include employee “add on” costs such as medical/clinic costs, schooling, welfare costs, funeral expenditure, water purification and social investment projects. These are costs not borne by many global competitors.
4. Following the point above, exemption from fringe benefit tax on housing provided, school fees, utilities, and security.
5. In-house and external training costs and educational allowances to be granted a 100 per cent incentive allowance for corporation tax purposes. Currently, only academically certificated courses are deductible for tax purposes.
6. Promotion of smallholder expansion and quality improvement through incentives to large-scale cooperative schemes. Such incentives would include surtax exemption, grants for training and skills training for Kasinthula phase three and Dwangwa grower expansion.
7. Maintenance of the sugar import licence system for as long as Zimbabwe has a parallel exchange rate and thereafter, protection for the local industry through a World-Price Referenced, protection mechanism as operated by Mozambique and Tanzania.
8. Transport allowance on export FOB costs and removal of all tax discrimination that targets only the “Traditional Industries” as these represent the core of Malawi’s exports.

Malawi Economic Growth Strategy
Volume II 104/106
4. Cotton Draft Investment Incentives To be proposed following discussion by the key stakeholders. Main issues so far identified relate to clarity on the implementation of surtax on seed cotton purchased from smallholders. There needs to be a clear and legally enforceable statement that there will not be any implementation of surtax on seed cotton purchases. In addition, it would encourage further investment if the remaining duties and surtax on spare parts for ginneries were removed. If this were extended to consumables such as bale ties, woolpacks, and packaging for seed, then this would be of further assistance to revitalise the industry and make it more competitive internationally. 5. Mining Sub-sector Draft Incentives The potential package to attract investors would be:
1. Duty free importation of exploration and mining equipment for the initial establishment period.
2. Corporate tax holiday for new investments during loan servicing/payback period or for a maximum period of 10 years.
3. 40 per cent rebate on qualifying expenditures for training of Malawians. 4. Royalties of 1 per cent for processed industrial minerals and 3 per cent for
precious metals and minerals and for unprocessed industrial minerals. 5. Repatriation of initial capital investment and all dividends.
6. Textile and Garment Draft Investment Incentives For Garments, the main proposals by the industry are that:
1. Benefits of the EPZs are fully implemented by ensuring that MRA has the necessary staff and capacity to process the supporting paperwork quickly and efficiently.
2. EPZ status should allow for up to 10 per cent of manufactured goods to be sold locally, allowing the garment industry to sell items that do not meet the exacting specifications of the destination markets, rather than burn them.36
3. EPZ is extended to cover all items that are necessary to the operation of an EPZ company not just those involved in the direct manufacture.
4. EPZ companies are granted Surtax Exemption Certificates, as they cannot recover the cost of increased local purchases (this has the effect of making domestic suppliers less competitive, as the EPZ company can import same products duty and surtax free!).
7. Agro-Processing Draft Incentives To be proposed following discussion by the key stakeholders.
8. Tourism Draft Investment Incentives 1. Investment incentives should be granted and guaranteed for all tourism-related
projects and services that are compatible with the National Tourism
36 This will also save on imported garments.

Malawi Economic Growth Strategy
Volume II 105/106
Development Strategy37. They shall apply to any areas as may be approved by the Minister responsible for Tourism, Parks and Wildlife.
2. Minimum levels for new investments to qualify for incentives will be as follows:
o Hotel minimum of US$ 500,000 o Motel/Inn/Lodges minimum of US$ 100,000 o Tented Camps minimum of US$ 50,000 o Restaurants minimum of US$ 25,000
3. Minimum levels for existing registered tourism business for re-investment in
existing tourism facilities for refurbishment, re-modelling, extension, renovations and renewal would be $10,000 whatever the category. The Minister could consider smaller investments if there is an accompanying Business Plan that demonstrates the creation or improvement of a viable added-value tourism project.
4. The Ministry, through its licensing and registration, will provide distinction
among the above categories. 5. The period of the qualifying investment incentive status should vary in duration
according to the capital cost of the project:
o Up to $1 million: 5 Years o Over $1 million but less than $2 million: 7 years o Over $2 million: 10 years
6. Duty-free status should apply to:
o All capital items relating to refurbishment, re-modelling, extension, renovations and renewal of tourist establishments and facilities that are registered.
o All import and excise duties related to the following capital items and operational equipment:
o operational equipment and construction materials:
� air conditioning � security equipment � carpets � furniture � curtains � electric and electrical supplies � refrigeration equipment � roofing materials � decorative materials � swimming pool materials � toiletry materials (i.e. cisterns, bathtubs, wash basins)
37 The decision regarding compatibility should reside with the Department of Tourism.

Malawi Economic Growth Strategy
Volume II 106/106
� laundry equipment � radio and communication equipment � television and audio visual equipment � linens � computer and computer-related equipment � environmental/pollution related equipment (solar panels,
water treatment equipment etc.)
o camping equipment for approved tourism projects: � tents � lighting equipment � refrigeration � cooking equipment � beds � linens and towels � water storage units � irrigation equipment � insect repellent material/equipment.
o Equipment for transporting of tourists and safari vehicles:
� motor coaches � bicycles (hiking and mountain) � rafts � yachts � scooters/motor cycles � motor vehicles � aircraft � speed boats, boat houses and cruise ships
7. In addition to the normal annual capital allowances and the initial capital
allowance, there should be an investment allowance for all new capital equipment of 40 per cent for any registered tourism businesses.
8. There should be full remittance of profits, amortisation of debt, approved
fees and repatriation of investment capital.
9. Fiscal benefits shall be transferable throughout the period of their validity.
10. Operating losses may be carried forward for tax purposes commencing at the completion of the tax holiday.
11. Land outside the national parks should be made available to both foreign
and domestic investors, with long leaseholds of initially 50 years, with options to renew for two further periods of 25 years, up to a maximum of 100 years. Land within national parks and game reserves should be made available on a minimum lease of 10 years duration if no capital expenditure is made by the operator and 20 years where capital investment is required, with the option to extend for an additional period of equal length upon mutual agreement.

Malawi Economic Growth Strategy
Volume II 107/106
12. As tourism businesses pay a levy that supports the Malawi Institute of
Tourism, all registered Tourism businesses that are paying the Tourism Levy would be exempted from the TEVET Levy in full.
13. Allocation of land is a key part of tourism investment. Decisions need to
be made within a guaranteed maximum of one calendar month from date of application.
NOTES All existing tourism enterprises should channel their requests to the Ministry of Tourism, Parks and Wildlife (MTPW) through the Malawi Tourism Association (MTA). All new tourism project units should channel their requests directly to the MTPW. A committee comprising MTPW, MIPA, MTA and where relevant, the City Assemblies shall screen new projects and recommended these to the Honourable Minister of Tourism, Parks and Wildlife. All equipment shall carry a special logo or be embossed with a company stamp or mark. All items bought duty-free, if subsequently sold, should be subject to a pro-ration of duties. In special cases, in those areas in which there exists a high degree of risk as specified by the Minister of Tourism, Parks and Wildlife from time to time, the duration of the tax exemption should be doubled.

Malawi Economic Growth Strategy
Volume II 108/106
REFERENCES Malawi Government (1998), Vision 2020, Ministry of Economic Planning and Development, Lilongwe. Malawi Government (2002), Malawi Poverty Reduction Strategy (MPRS) Paper, Ministry of Finance, Lilongwe Malawi Government (2002), Additional Engines for Growth Study, Ministry of Economic Planning and Development, Lilongwe (unpublished). Malawi Government (2000), The Integrated Framework, Diagnostic Trade Integration Study, Ministry of Commerce and Industry, Lilongwe World Bank (2003), Malawi: Country Economic Memorandum, Policies for Accelerating Growth, World Bank, Washington D.C. The UNDP/UNIDO Investment and Technology Promotion Project Document Ministry strategies and policies for Ministry of Agriculture, Irrigation and Food Security (MoAI), MoCI, Department of Mines, Ministry of Tourism. Kadale Consultants and Imani Development (2002), The value chain analysis study, Blantyre Other work on the private sector development and key sub-sectors with supported by a range of donors including EU, World Bank, UNDP/UNIDO, USAID, NORAD, JICA and others. Malawi Government (2001), Agriculture and Livestock Development Strategy, Ministry of Agriculture, Irrigation and Food Security, Lilongwe. World Bank (1991), World Development Report, New York, Oxford University Press.